First Comparisons of Surface Temperature Estimations between ECOSTRESS, ASTER and Landsat 8 over Italian Volcanic and Geothermal Areas

 , , and
Abstract
:
1. Introduction
2. Satellite Data and Methods
2.1. Satellite Data: ASTER, Landsat 8 and ECOSTRESS
2.2. Methodology for LST Estimation
2.3. Methodology of Comparison
3. Results
4. Discussion
5. Conclusions
Author Contributions
Funding
Acknowledgments
Conflicts of Interest
References
- Gianelli, G.; Ueckermann, H.I. A comparative analysis of the geothermal fields of Larderello and Mt. Amiata, Italy. Geotherm. Energy Res. Trend 2008, 3, 59–85. [Google Scholar]
- Silvestri, M.; Rabuffi, F.; Pisciotta, A.; Musacchio, M.; Diliberto, I.S.; Spinetti, C.; Lombardo, V.; Colini, L.; Buongiorno, M.F. Analysis of Thermal Anomalies in Volcanic Areas Using Multiscale and Multitemporal Monitoring: Vulcano Island Test Case. Remote Sens. 2019, 11, 134. [Google Scholar] [CrossRef] [Green Version]
- Silvestri, M.; Cardellini, C.; Chiodini, G.; Buongiorno, M.F. Satellite-derived surface temperature and in situ measurement at Solfatara of Pozzuoli (Naples, Italy). Geochem. Geophys. Geosyst. 2016, 17, 2095–2109. [Google Scholar] [CrossRef] [Green Version]
- Chiodini, G.; Avino, R.; Caliro, S.; Minopoli, C. Temperature and pressure gas geoindicators at the Solfatara fumaroles (Campi Flegrei). Ann. Geophys. 2011, 54, 151–160. [Google Scholar] [CrossRef]
- Buongiorno, M.F.; Pieri, D.; Silvestri, M. Thermal Analysis of Volcanoes Based on 10 Years of ASTER Data on Mt. Etna. Therm. Infrared Remote Sens. Remote Sens. Digit. Image Process. 2013, 17, 409–428. [Google Scholar]
- Wright, R.; Flynn, L.P.; Garbeil, H.; Harris, A.J.; Pilger, E. MODVOLC: Near-real-time thermal monitoring of global volcanism. J. Volcanol. Geotherm. Res. 2004, 135, 29–49. [Google Scholar] [CrossRef]
- Fujisada, H.; Sakuma, F.; Ono, A.; Kudoh, M. Design and preflight performance of ASTER instrument protoflight model. IEEE Trans. Geosci. Remote Sens. 1998, 36, 1152–1160. [Google Scholar] [CrossRef]
- Yamaguchi, Y.; Kahle, A.; Tsu, H.; Kawakami, T.; Pniel, M. Overview of Advanced Spaceborne Thermal Emission and Reflection Radiometer (ASTER). IEEE Trans. Geosci. Remote Sens. 1998, 36, 1062–1071. [Google Scholar] [CrossRef] [Green Version]
- Landsat 8. Available online: https://landsat.gsfc.nasa.gov/landsat-8/ (accessed on 28 October 2019).
- Roy, D.P.; Wulder, M.A.; Loveland, T.R.; Woodcock, C.E.; Allen, R.G.; Anderson, M.C.; Zhu, Z. Landsat-8: Science and product vision for terrestrial global change research. Remote Sens. Environ. 2014, 145, 154–172. [Google Scholar] [CrossRef] [Green Version]
- Barsi, J.; Schott, J.; Hook, S.; Raqueno, N.; Markham, B.; Radocinski, R. Landsat-8 thermal infrared sensor (TIRS) vicarious radiometric calibration. Remote Sens. 2014, 6, 11607–11626. [Google Scholar] [CrossRef] [Green Version]
- Fisher, J.B.; Hook, S.; Allen, R.; Anderson, M.; French, A.; Hain, C.; Hulley, G.; Wood, E. The ECOsystem Spaceborne Thermal Radiometer Experiment on Space Station (ECOSTRESS): Science motivation. In Proceedings of the American Geophysical Union (AGU) Fall Meeting, San Francisco, CA, USA, 15–19 December 2014. [Google Scholar]
- Fisher, J.B.; Hook, S.; Allen, R.; Anderson, M.; French, A.; Hain, C.; Hulley, G.; Wood, E. ECOSTRESS: NASA’s next-generation mission to measure evapotranspiration from the International Space Station. In Proceedings of the American Geophysical Union (AGU) Fall Meeting, San Francisco, CA, USA, 14–18 December 2015. [Google Scholar]
- ECOSTRESS. Available online: https://ecostress.jpl.nasa.gov/ (accessed on 28 October 2019).
- ECOSTRESS Product Description. Available online: https://lpdaac.usgs.gov/products/eco1bmapradv001/ (accessed on 28 October 2019).
- Berk, A.; Bernsten, L.S.; Robertson, D.C. MODTRAN: A Moderate Resolution Model for LOWTRAN7; GL-TR-89-0122; Air Force Geophysics Laboratory: Hanscom AFB, MA, USA, 1989. [Google Scholar]
- Musacchio, M.; Amici, S.; Silvestri, M.; Teggi, S.; Buongiorno, M.F.; Silenzi, S.; Devoti, S. Application of CIRILLO: A new atmospheric correction tool on Castel Porziano Beach (CPB). Remote Sens. Environ. Monit. GIS Appl. Geol. VII 2007, 674935. [Google Scholar] [CrossRef]
- Sabol, D.E.; Gillespie, A.R.; Abbott, E.; Yamada, G. Field validation of the ASTER Temperature-Emissivity Separation algorithm. Remote Sens. Environ. 2009, 113, 2328–2344. [Google Scholar] [CrossRef]
- Jiménez-muñoz, J.C.; Sobrino, J.A.; Mattar, C.; Hulley, G.; Göttsche, F. Temperature and Emissivity Separation from MSG/SEVIRI Data. IEEE Trans. Geosci. Remote Sens. 2013, 52, 1–15. [Google Scholar] [CrossRef]
- Coll, C.; García-Santos, V.; Niclòs, R.; Caselles, V. Test of the MODIS Land Surface Temperature and Emissivity Separation Algorithm with ground measurements over a rice paddy. IEEE Trans. Geosci. Remote Sens. 2016, 54, 3061–3069. [Google Scholar] [CrossRef]
- Gillespie, A.; Rokugawa, S.; Matsunaga, T.; Cothern, J.S.; Hook, S.; Kahle, A.B. A temperature and emissivity separation algorithm for Advanced Spaceborne Thermal Emission and Reflection Radiometer (ASTER) images. IEEE Trans. Geosci. Remote Sens. 1998, 36, 1113–1126. [Google Scholar] [CrossRef]
- Hulley, G.C.; Hook, S.J. The North American ASTER Land Surface Emissivity Database (NAALSED) Version 2.0. Remote Sens. Environ. 2009, 113, 1967–1975. [Google Scholar] [CrossRef]
- Islam, T.; Hulley, G.; Malakar, N.; Radocinski, R.; Guillevic, P.; Hook, S. A physics-based algorithm for the simultaneous retrieval of land surface temperature and emissivity from VIIRS thermal infrared data. IEEE Trans. Geosci. Remote Sens. 2017, 55, 563–576. [Google Scholar] [CrossRef]
- Caputo, T.; Bellucci Sessa, E.; Silvestri, M.; Buongiorno, M.F.; Musacchio, M.; Sansivero, F.; Vilardo, G. Surface temperature multiscale monitoring by thermal infrared satellite and ground images at Campi Flegrei volcanic area (Italy). Remote Sens. 2019, 11, 1007. [Google Scholar] [CrossRef] [Green Version]
- Il Parossismo dello Stromboli del 3 Luglio 2019 e L’attività nei Giorni Successivi: Il Punto Della Situazione al 13 Luglio 2019. Available online: https://ingvvulcani.wordpress.com/2019/07/13/il-parossismo-dello-stromboli-del-3-luglio-2019-e-lattivita-nei-giorni-successivi-il-punto-della-situazione-al-13-luglio-2019/ (accessed on 28 October 2019).
- INGV Report. Available online: http://www.ct.ingv.it/it/rapporti/multidisciplinari.html (accessed on 28 October 2019).
- Ecostress Data Description. Available online: https://ecostress.jpl.nasa.gov/downloads/20181017_ECOSTRESS_data_description-Frequently_Asked_Questions.pdf (accessed on 16 December 2019).


| Description | ECOSTRESS | ASTER | TIRS-L8 | Unit |
|---|---|---|---|---|
| Number of thermal spectral bands | 5 | 5 | 2 | - |
| Measured band centers | 8.29 1; 8.78; 9.20 1; 10.49; 12.09 | 8.29; 8.63; 9.07; 10.66; 11.32 | 10.90; 12.00 | µm |
| Measured FWHM per band | 0.35; 0.31; 0.39; 0.41; 0.61 | 0.35; 0.35; 0.35; 0.70; 0.70 | 0.60; 1.00 | µm |
| Pixel size at nadir | 69 × 38 | 90 | 100 | m |
| Swath width | 384 | 60 | 185 | Km |
| Revisit time | ~4–5 | 16 | 16 | Days |
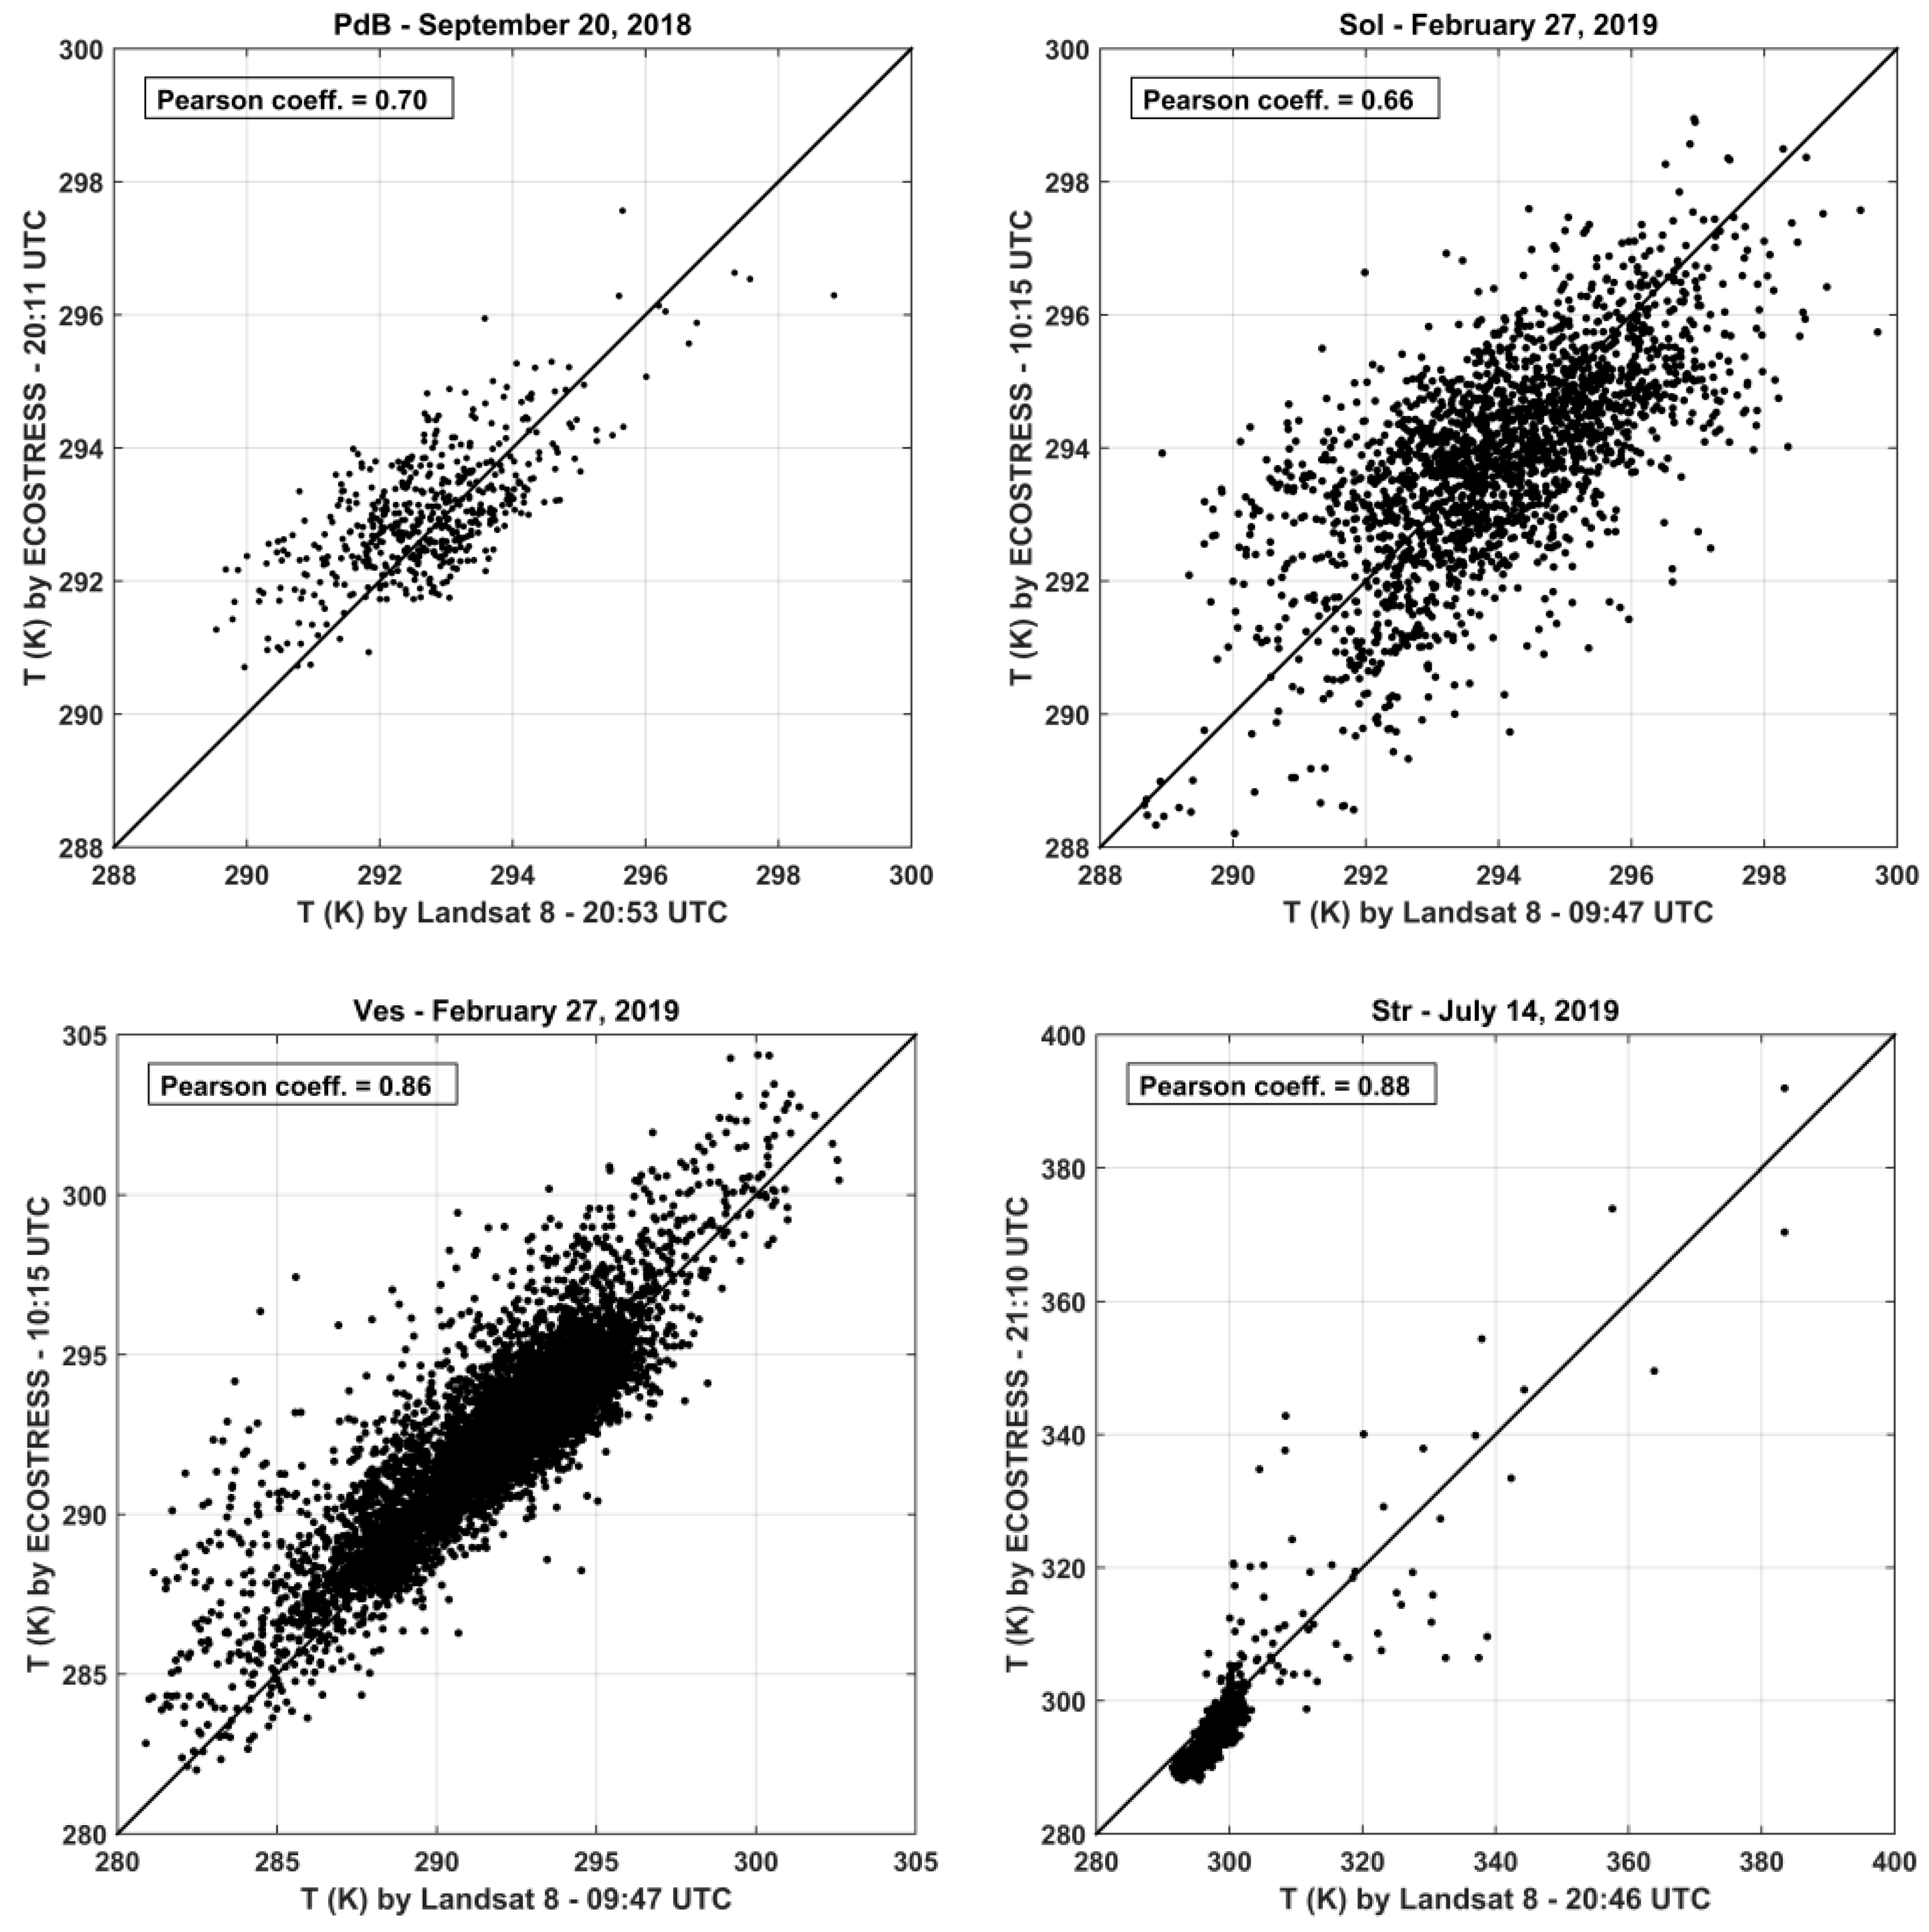
| Date | Area | ECOSTRESS Time (UTC) | TIRS-L8 Time (UTC) |
|---|---|---|---|
| 20 September 2018 | PdB | 20:11 | 20:53 |
| 27 February 2019 | Sol | 10:15 | 09:47 |
| 27 February 2019 | Ves | 10:15 | 09:47 |
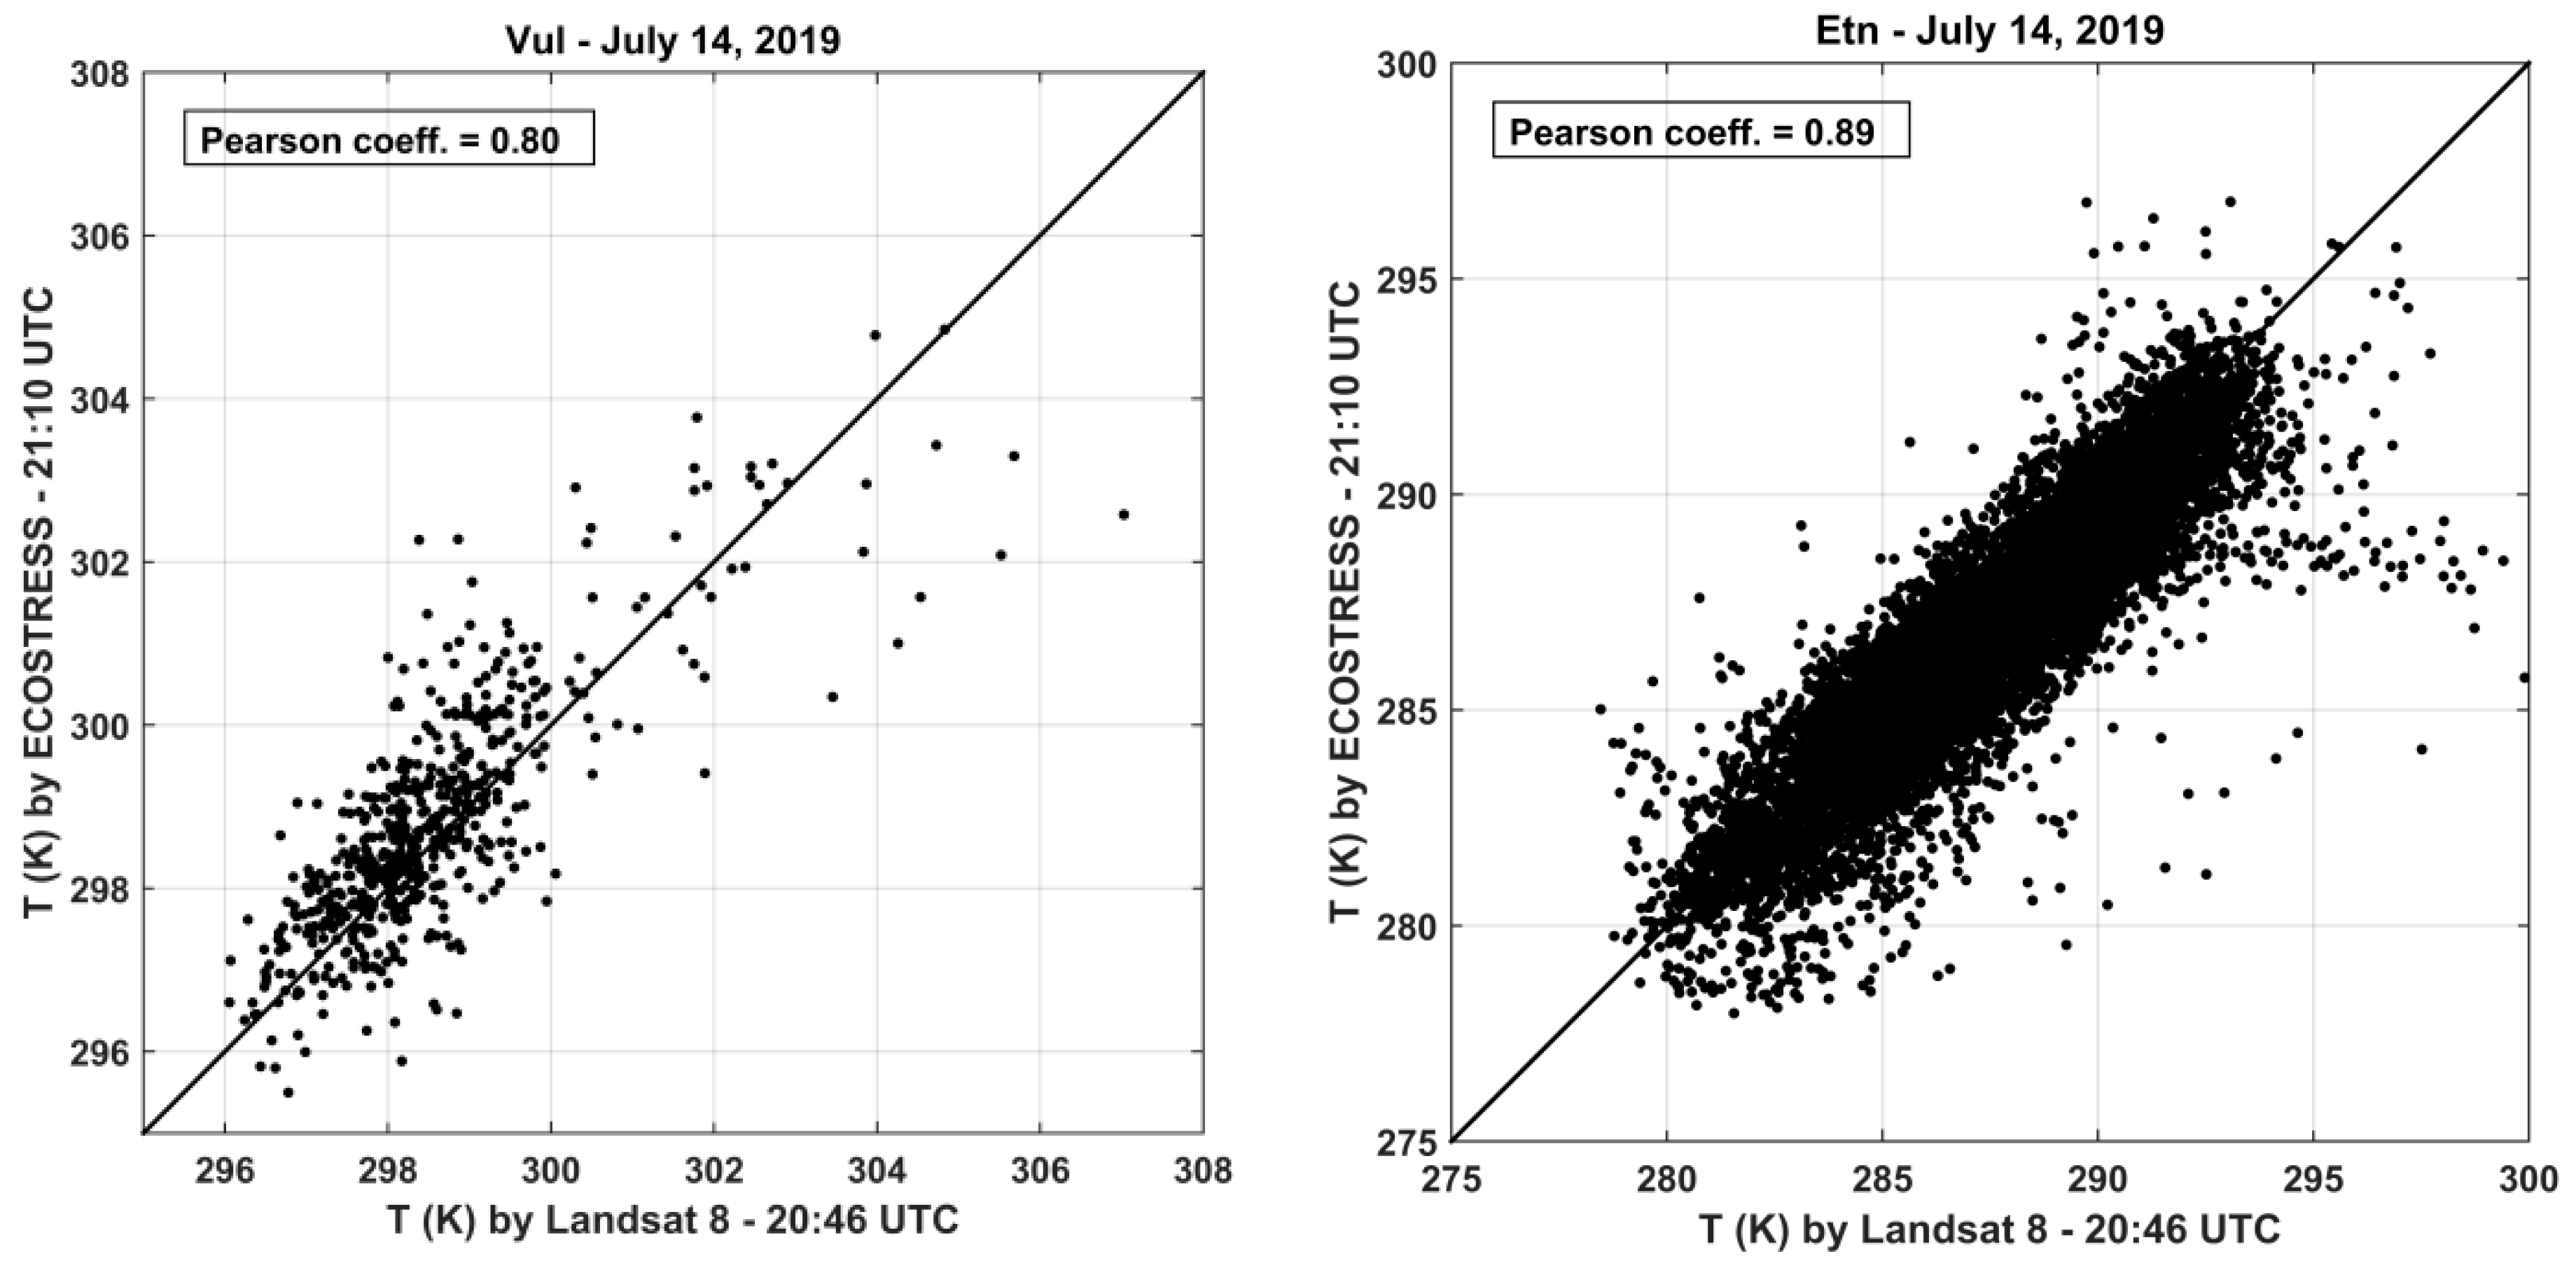
| 14 July 2019 | Etn | 21:10 | 20:46 |
| 14 July 2019 | Str | 21:10 | 20:46 |
| 14 July 2019 | Vul | 21:10 | 20:46 |
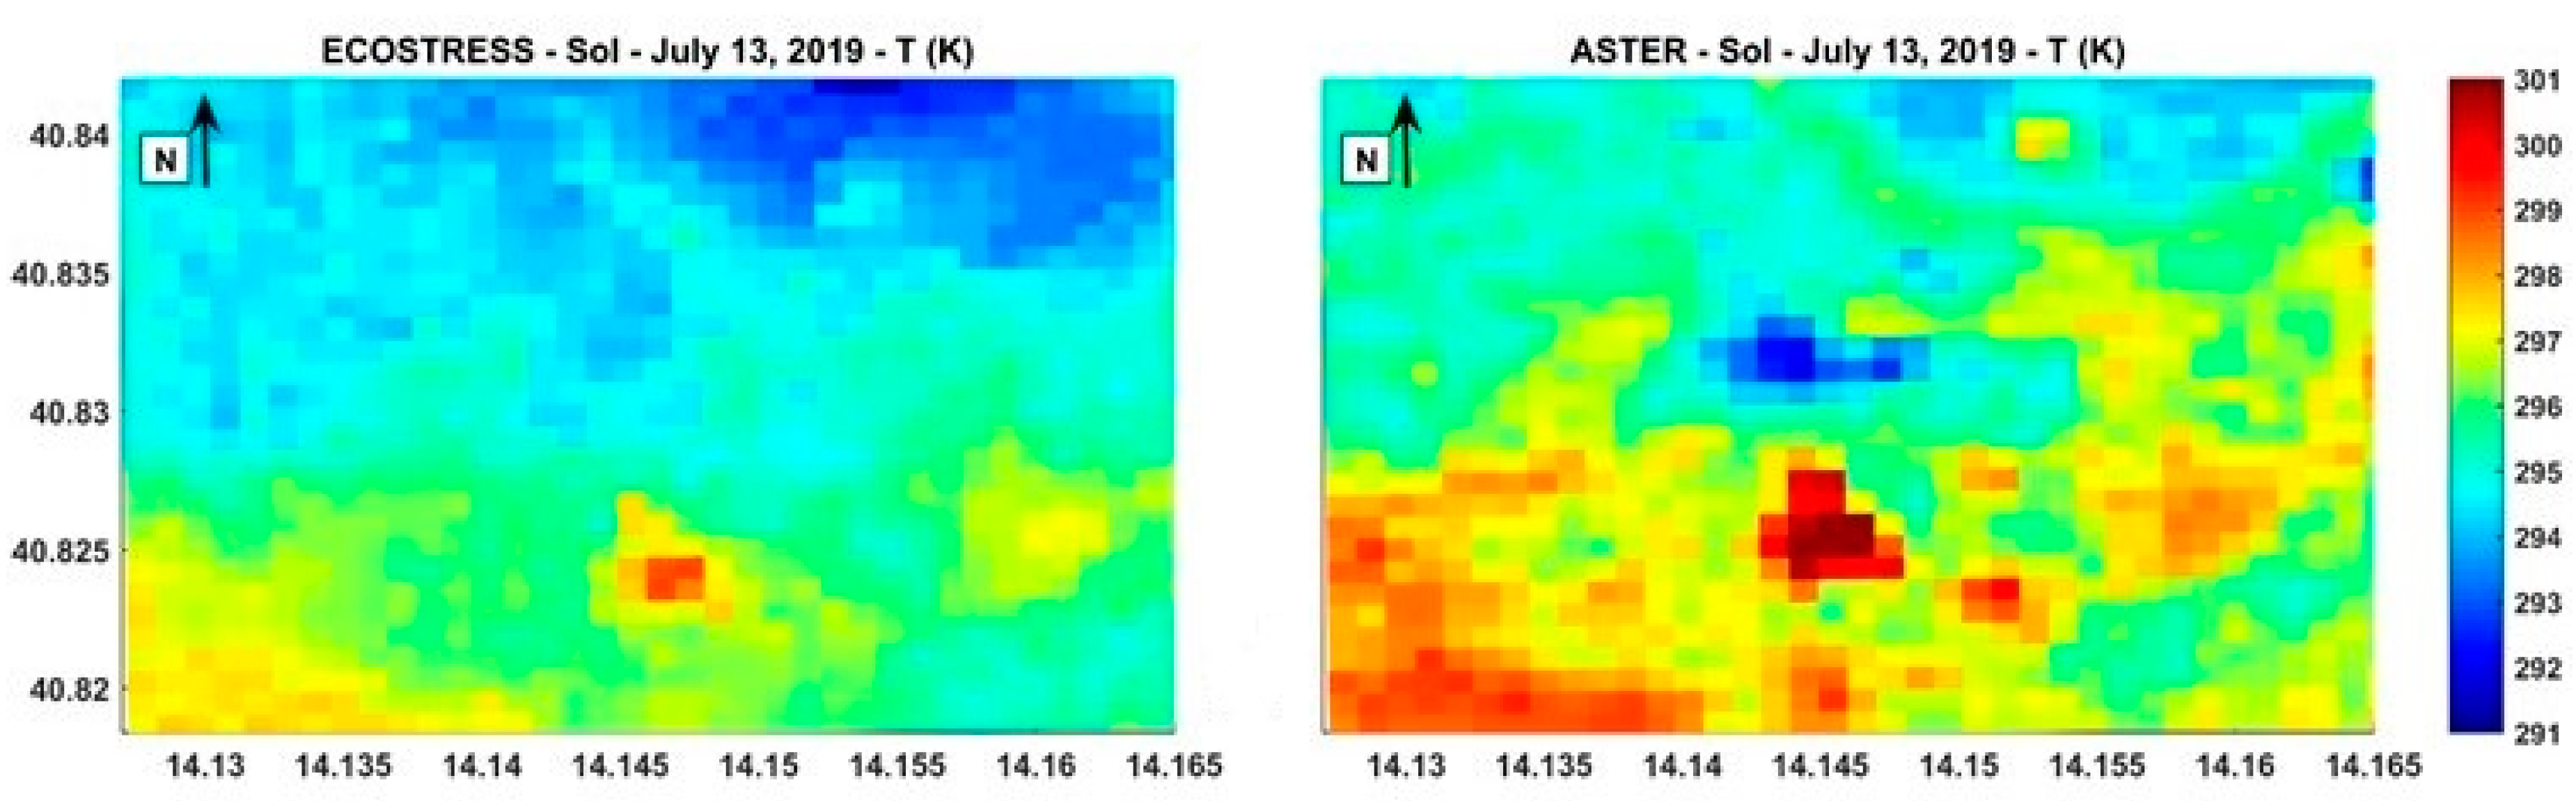
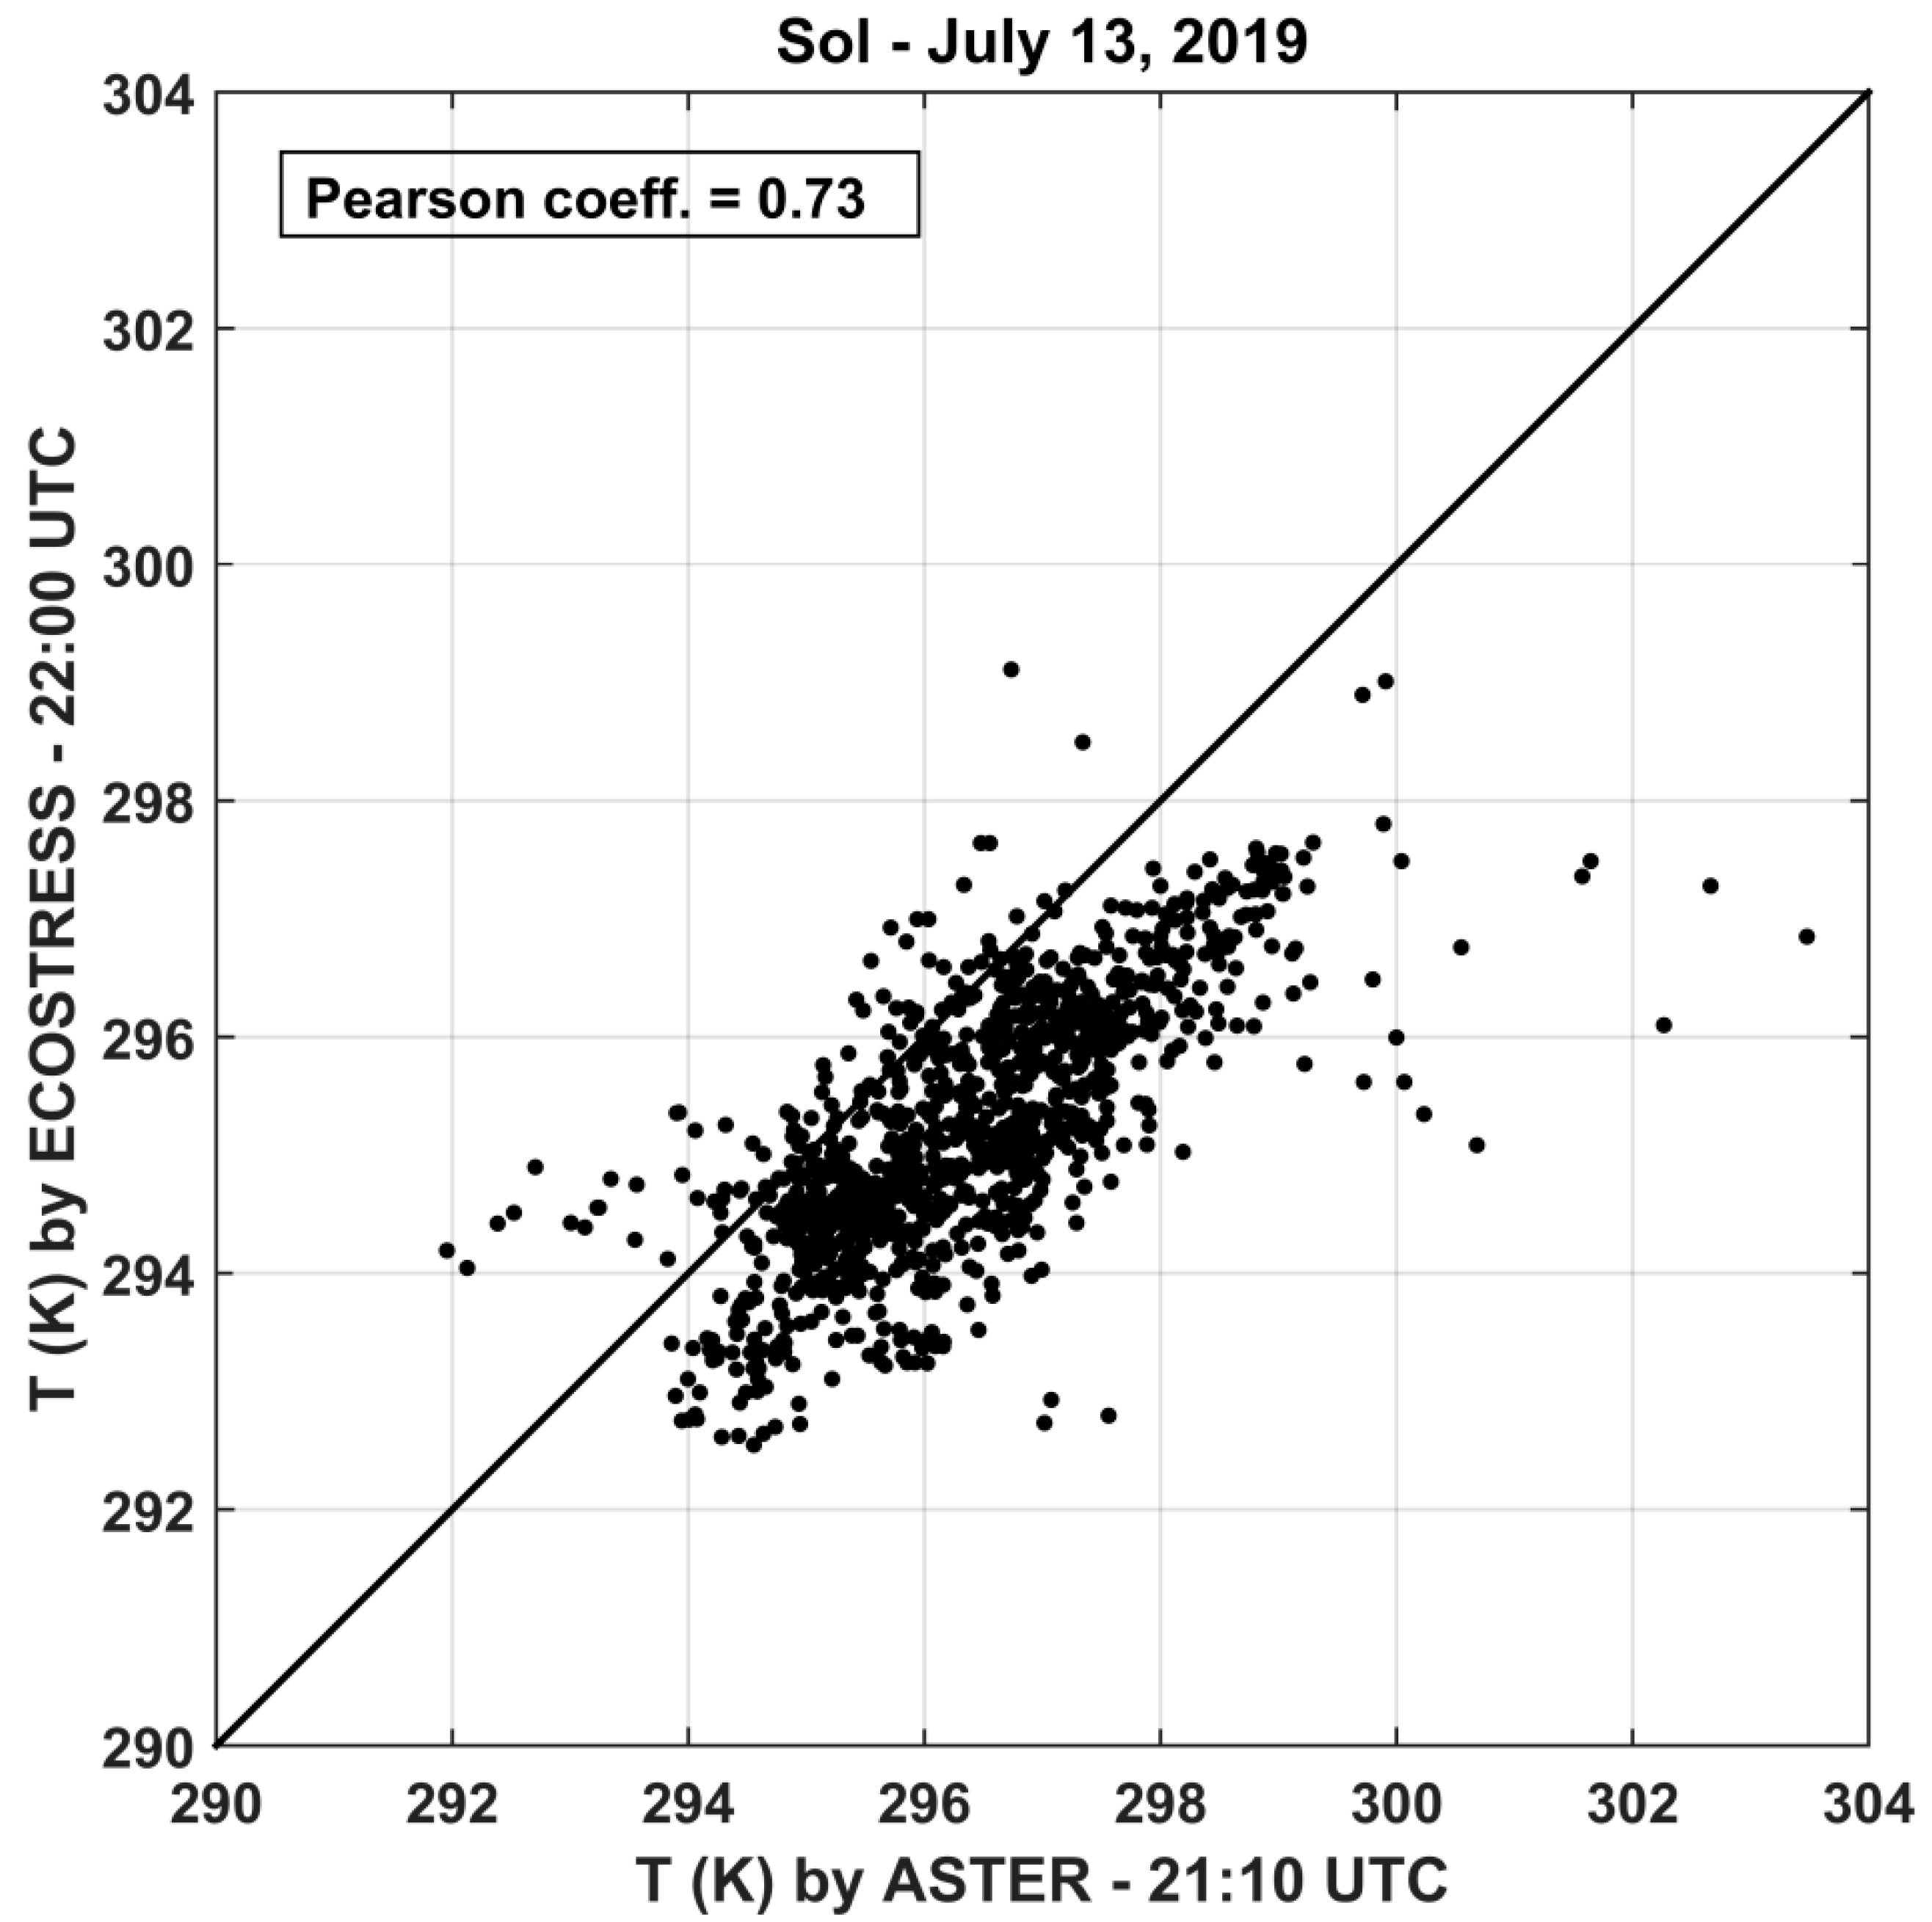
| Date | Area | ECOSTRESS Time (UTC) | ASTER Time (UTC) |
|---|---|---|---|
| 13 July 2019 | Sol | 22:00 | 21:10 |
| Area and Date | Pearson Coefficient | Bias (K) | RMSE (K) |
|---|---|---|---|
| PdB; 20 September 2018 | 0.70 | +0.31 | 0.93 |
| Sol; 27 February 2019 | 0.66 | −0.17 | 1.36 |
| Ves; 27 February 2019 | 0.86 | +0.63 | 1.75 |
| Etn; 14 July 2019 | 0.89 | −0.73 | 1.72 |
| Str; 14 July 2019 | 0.88 | −2.47 | 4.17 |
| Vul; 14 July 2019 | 0.80 | +0.26 | 0.93 |
| Sol; 13 July 2019 (ASTER) | 0.73 | −1.13 | 1.46 |
© 2020 by the authors. Licensee MDPI, Basel, Switzerland. This article is an open access article distributed under the terms and conditions of the Creative Commons Attribution (CC BY) license (http://creativecommons.org/licenses/by/4.0/).
Share and Cite
Silvestri, M.; Romaniello, V.; Hook, S.; Musacchio, M.; Teggi, S.; Buongiorno, M.F. First Comparisons of Surface Temperature Estimations between ECOSTRESS, ASTER and Landsat 8 over Italian Volcanic and Geothermal Areas. Remote Sens. 2020, 12, 184. https://0-doi-org.brum.beds.ac.uk/10.3390/rs12010184
Silvestri M, Romaniello V, Hook S, Musacchio M, Teggi S, Buongiorno MF. First Comparisons of Surface Temperature Estimations between ECOSTRESS, ASTER and Landsat 8 over Italian Volcanic and Geothermal Areas. Remote Sensing. 2020; 12(1):184. https://0-doi-org.brum.beds.ac.uk/10.3390/rs12010184
Chicago/Turabian StyleSilvestri, Malvina, Vito Romaniello, Simon Hook, Massimo Musacchio, Sergio Teggi, and Maria Fabrizia Buongiorno. 2020. "First Comparisons of Surface Temperature Estimations between ECOSTRESS, ASTER and Landsat 8 over Italian Volcanic and Geothermal Areas" Remote Sensing 12, no. 1: 184. https://0-doi-org.brum.beds.ac.uk/10.3390/rs12010184