Monitoring Mega-Crown Leaf Turnover from Space
by
 , , ,
, , ,
Emma R. Bush
1,* ,
,
Edward T. A. Mitchard
2,
Thiago S. F. Silva
1 ,
,
Edmond Dimoto
3,
Pacôme Dimbonda
3,
Loïc Makaga
3 and
Katharine Abernethy
1,4 1
Faculty of Natural Sciences, University of Stirling, Stirling FK9 4LA, UK
2
School of Geosciences, University of Edinburgh, Edinburgh EH8 9XP, UK
3
Agence Nationale des Parcs Nationaux (ANPN), ANPN Residence Royal B, Kalikak, Libreville, Estuaire 1, Gabon
4
Institute de Recherche Én Ecologie Tropicale, CENAREST, Gros Bouquet, Libreville 4, Gabon
*
Author to whom correspondence should be addressed.
Remote Sens. 2020, 12(3), 429; https://0-doi-org.brum.beds.ac.uk/10.3390/rs12030429
Submission received: 26 November 2019
/
Revised: 22 January 2020
/
Accepted: 23 January 2020
/
Published: 29 January 2020
(This article belongs to the Special Issue Remote Sensing of Tropical Phenology)
Abstract
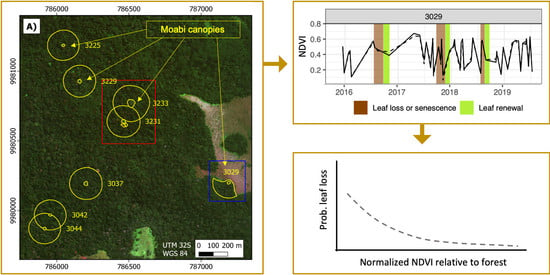
:Spatial and temporal patterns of tropical leaf renewal are poorly understood and poorly parameterized in modern Earth System Models due to lack of data. Remote sensing has great potential for sampling leaf phenology across tropical landscapes but until now has been impeded by lack of ground-truthing, cloudiness, poor spatial resolution, and the cryptic nature of incremental leaf turnover in many tropical plants. To our knowledge, satellite data have never been used to monitor individual crown leaf phenology in the tropics, an innovation that would be a major breakthrough for individual and species-level ecology and improve climate change predictions for the tropics. In this paper, we assessed whether satellite data can detect leaf turnover for individual trees using ground observations of a candidate tropical tree species, Moabi (Baillonella toxisperma), which has a mega-crown visible from space. We identified and delineated Moabi crowns at Lopé NP, Gabon from satellite imagery using ground coordinates and extracted high spatial and temporal resolution, optical, and synthetic-aperture radar (SAR) timeseries data for each tree. We normalized these data relative to the surrounding forest canopy and combined them with concurrent monthly crown observations of new, mature, and senescent leaves recorded from the ground. We analyzed the relationship between satellite and ground observations using generalized linear mixed models (GLMMs). Ground observations of leaf turnover were significantly correlated with optical indices derived from Sentinel-2 optical data (the normalized difference vegetation index and the green leaf index), but not with SAR data derived from Sentinel-1. We demonstrate, perhaps for the first time, how the leaf phenology of individual large-canopied tropical trees can directly influence the spectral signature of satellite pixels through time. Additionally, while the level of uncertainty in our model predictions is still very high, we believe this study shows that we are near the threshold for orbital monitoring of individual crowns within tropical forests, even in challenging locations, such as cloudy Gabon. Further technical advances in remote sensing instruments into the spatial and temporal scales relevant to organismal biological processes will unlock great potential to improve our understanding of the Earth system.
1. Introduction
Leaves are the primary mechanism of carbon and water exchange between the Earth’s surface and the atmosphere. Understanding the spatial and temporal patterns of leaf aging and renewal is critically important to predict our future climate [1]. However, despite the importance of tropical trees to the global carbon cycle, there are relatively few ground-based observations of tropical leaf phenology [2]. The biological mechanisms behind leaf emergence, leaf longevity, and photosynthetic activity in the tropics are poorly understood and thus poorly parameterized in current Earth System Models (ESMs). Sensitivity to climate change differs markedly between models [3] and most of the uncertainty over tropical land areas is due to disagreement on the modelled impacts of climate and CO2 on primary productivity, itself a function of the leaf area [4].
Remote sensing has great potential for sampling leaf phenology across tropical landscapes, and remote sensing-based products are used in data assimilation frameworks to inform carbon cycle modelling [5]. However, there have been controversies over the biological interpretation of canopy reflectance data at the plant level, and the impacts of non-leaf artefacts, such as the solar zenith angle and remnant cloud and haze [6,7,8]. Spatial resolution, incremental leaf turnover, and data gaps due to cloudiness are also serious limitations in the practical use of remotely sensed leaf area products in the tropics [9].
In hyperdiverse tropical forests, responses to climate are likely to differ greatly between species, and simultaneous forest-wide responses will occur only in the most extreme situations. The earliest detection of directional responses to incremental climate change will thus require analysis at the species level, yet individual-crown phenology for tropical trees has rarely been attempted using above-canopy monitoring [10,11,12] and, to our knowledge, never from space. In this paper, we present a rare opportunity to assess the ability of satellite data to detect leaf turnover for individual crowns using a candidate tropical tree species. Moabi (Baillonella toxisperma, Pierre. (Sapotaceae) is a large canopy tree reaching 60 m tall with a trunk bole measuring up to 500 cm in diameter [13]. Adult Moabi canopies are emergent, very large (one individual in Gabon has a crown extending to 57 m across [14]), and recognizable from aerial photography and high-resolution satellite data. They are fully deciduous, producing flowers only after the leaves have dropped, with new leaves flushing shortly afterwards [15]. Leafing and flowering are seasonally predictable but do not occur every year and there is regional variation with some evidence of local masting [16]. Additionally, while Gabon is one of the cloudiest places on Earth [17], Moabi leaf turnover occurs from October to December [16] when cloud is least prevalent during the day [18], increasing the likelihood of cloud-free satellite images. Monthly crown observations of leaves, flowers, and fruit have been recorded at Lopé National Park, Gabon, as part of a long-term phenology study established in 1986 to quantify food availability for chimpanzees and gorillas [19]. Over the following 34 years, the study has included >1000 individuals of 88 species of tropical trees and shrubs [20,21]. Moabi leaf turnover has been monitored at Lopé for more than 10 years, providing data to ground-truth satellite observations.
Measures of leaf phenology, particularly at a multi-crown scale measured by the leaf area index (LAI, one-sided green leaf area per unit ground area in units m2/m2), are routinely produced using medium resolution optical satellite data. The most widely used such product, we believe, is the MODIS 8-day and 4-day composite LAI products, provided at a 500-m resolution using data from the MODIS sensors on both the Aqua and Terra satellites [22,23]. These products rely on spectral information from the red (648 nm) and near-infrared (NIR, 858 nm) bands, as well as information on the vegetation type and sun and sensor angles, using a look-up table approach following a comprehensive radiative transfer modelling exercise. Other products (including the back-up algorithm for the MODIS products when too little good quality data are available) use the normalized difference vegetation index (NDVI), a differenced ratio of the red and infrared bands [24]. NDVI responds strongly to the amount of photosynthetic (green) vegetation in a pixel, and often responds nearly linearly to the amount of leaf area, with the degree of correlation and its slope varying markedly in time and space [24]. However, NDVI will saturate at some point, when adding further layers of leaves to a forest does not increase the signal.
Spectral indices based on the visible color space have also traditionally been used by close-range remote sensing of individual phenology (i.e., “phenocams” and unmanned aerial vehicles, UAVs, or “drones”) [10,11,25,26,27], which often lack the ability to record outside the visible spectrum. Digital cameras have been attached to towers and used to take time-lapse photographs from above the canopy at a number of sites. In the Brazilian cerrado, a normalized chromatic coordinate index extracted from digital camera imagery showed changes in greenness that mirrored ground observations of leafing strategy at the individual and species levels [11]. An analysis using a tower-mounted hyperspectral camera to monitor individual crowns in a Brazilian tropical forest during the dry season showed increases in reflectance, especially in the green and NIR regions, and significant changes in vegetation indices (such as NDVI) concurrent with leaf flushing [28]. In both cerrado and rainforest landscapes, tower-mounted camera studies have demonstrated that community-wide analyses of spectral indices fail to detect seasonal changes apparent when individual canopies and species are differentiated [11,12,28].
Among several proposed color indices, the green leaf index (GLI) [28,29], also known as the green leaf algorithm (GLA) [30] and similar to the visible band difference vegetation index (VDVI) [31] and the excess greenness index (ExG) [10], can be formulated as (2G – (B-R))/(2G + B + R), where G, R, and B are spectral reflectance values at the red, green, and blue spectral regions. GLI is sensitive to the leaf chlorophyll content and can be derived from Landsat 8, MODIS, Sentinel-2, and Sentinel-3 orbital sensors [32]. The GLI has been used previously to detect changes in the chlorophyll content in crops [33] and foliage cover in rangelands [30]. Visible-based indices have been successful in detecting canopy phenology from daily close-range imagery [10,25] but have seldom been assessed for satellite imagery, probably because the atmosphere is less transparent in these wavelengths, and the difference in reflectance from green leaves is much stronger between red and infra-red bands than between any of the visible spectrum bands. Still, as NIR bands are more sensitive to leaf mesophyll structure and water content, a more pigmented-oriented index in the visible range may still be of use when tracking single individuals.
A recent study using images from UAVs to predict individual-tree leaf phenology in a tropical forest in Panama found the best performing models (r2 = 0.84) to derive from a combination of color and texture metrics [10]. Visible-based indices for texture are currently precluded from satellite remote sensing of individual-tree canopies due to poor spatial resolution. However, other sensor types may be able to lend information on the canopy structure to complement greenness indices. Satellite measures of radar backscatter from synthetic aperture radar (SAR) sensors have some clear advantages over optical methods. The longer wavelengths penetrate cloud cover, which often cause gaps of months or more in optical-based satellite methods. SAR wavelengths also penetrate further through the canopy than optical wavelengths, potentially obtaining information on leaf area and leaf density beyond the saturation point for optical data. Calibrating an LAI relationship with SAR data can be difficult as other aspects of forest structure variation may have a large impact on the resulting signal, but there have been successes in monitoring seasonal leaf area changes using C-band SAR backscatter [34,35].
In the past, optical and SAR approaches have been hindered by either the cloud cover associated with long repeat pass intervals [36] or by the irregularity, inaccessibility and/or short operational span of SAR data. However, the Copernicus program of the European Space Agency has brought for the first time a constellation approach to non-commercial, open data operational Earth Observation missions. The Sentinel-2 constellation, equipped with the MSI sensor, offers 12 spectral bands covering the optical range, with spatial resolutions of 10 to 60 m, and a repeat observation frequency of ~5 days [37]. For SAR, the Sentinel-1 constellation of C-band satellites also offers unprecedented temporal regularity and density of observations, with its twin satellites covering the globe every 6 days with a spatial resolution of ~20 m [38].
In the present study, we made use of such unprecedented availability of high spatial and temporal resolution time series of optical and SAR data to evaluate their potential to monitor individual crown phenological changes. Our hypothesis is that as Moabi leaves senesce and fall, satellite data related to both greenness (NDVI and GLI) and backscatter (SAR data) will decline and show negative deviations relative to the leafed forest surrounding each focal tree. By contrast, as leaves renew, the greenness of the focal canopy will increase, and related satellite indices will show positive deviations relative to the surrounding forest. We tested these hypotheses using monthly observations of Moabi leaf demography and canopy coverage from the ground, a fairly common approach for monitoring focal crown leaf phenology in tropical forests. If successful, this method could be rapidly applied to track defoliation and leaf flushing events of individual trees across vast areas, allowing the testing of important ecological questions and enable the monitoring and understanding of climate change impacts on tree lifecycles.
2. Materials and Methods
2.1. Data
2.1.1. Ground Observations of Moabi Phenology at Lopé NP
The Lopé study area is a tropical forest-savanna matrix with an equatorial climate, characterized by two dry and two wet seasons [18]. Since 2013, 13 Moabi crowns have been monitored at Lopé. Four trees have been monitored for this entire time period; one tree died in 2013 and another three were removed from the sample in 2016 for logistical reasons. At the same time, five new trees were included in the sample and have been monitored through to the present. The trees chosen for phenology monitoring were close to access trails (0–30 m), had easily visible canopies, and were reproductively mature. In 2015–2016, the mean diameter at breast height (dbh; 130cm) for the Lopé Moabi sample was 125 cm (ranging from 75 to 251 cm). Maximum recorded dbh for this species is 500 cm [13]
At the beginning of every month (usually completed within the first seven working days), researchers examined the crowns of each tree from the ground with 10 x 42 binoculars. The proportion of the canopy covered by each phenophase (new, mature, or senescent leaves, flowers, and unripe or ripe fruits) was recorded as a 9-point scale in half integer units from 0 (no coverage) to 4 (full coverage). In a recent analysis of the observation uncertainties associated with this method, long-term researchers at Lopé scored Moabi new leaves as being highly visible (due to color changes following the empty canopy) but senescing leaves as having poor visibility [21]. New and senescent leaf events were also considered to generally last fewer than four weeks, meaning that it is possible that a tree could drop its leaves and flush new leaves in between monthly observations.
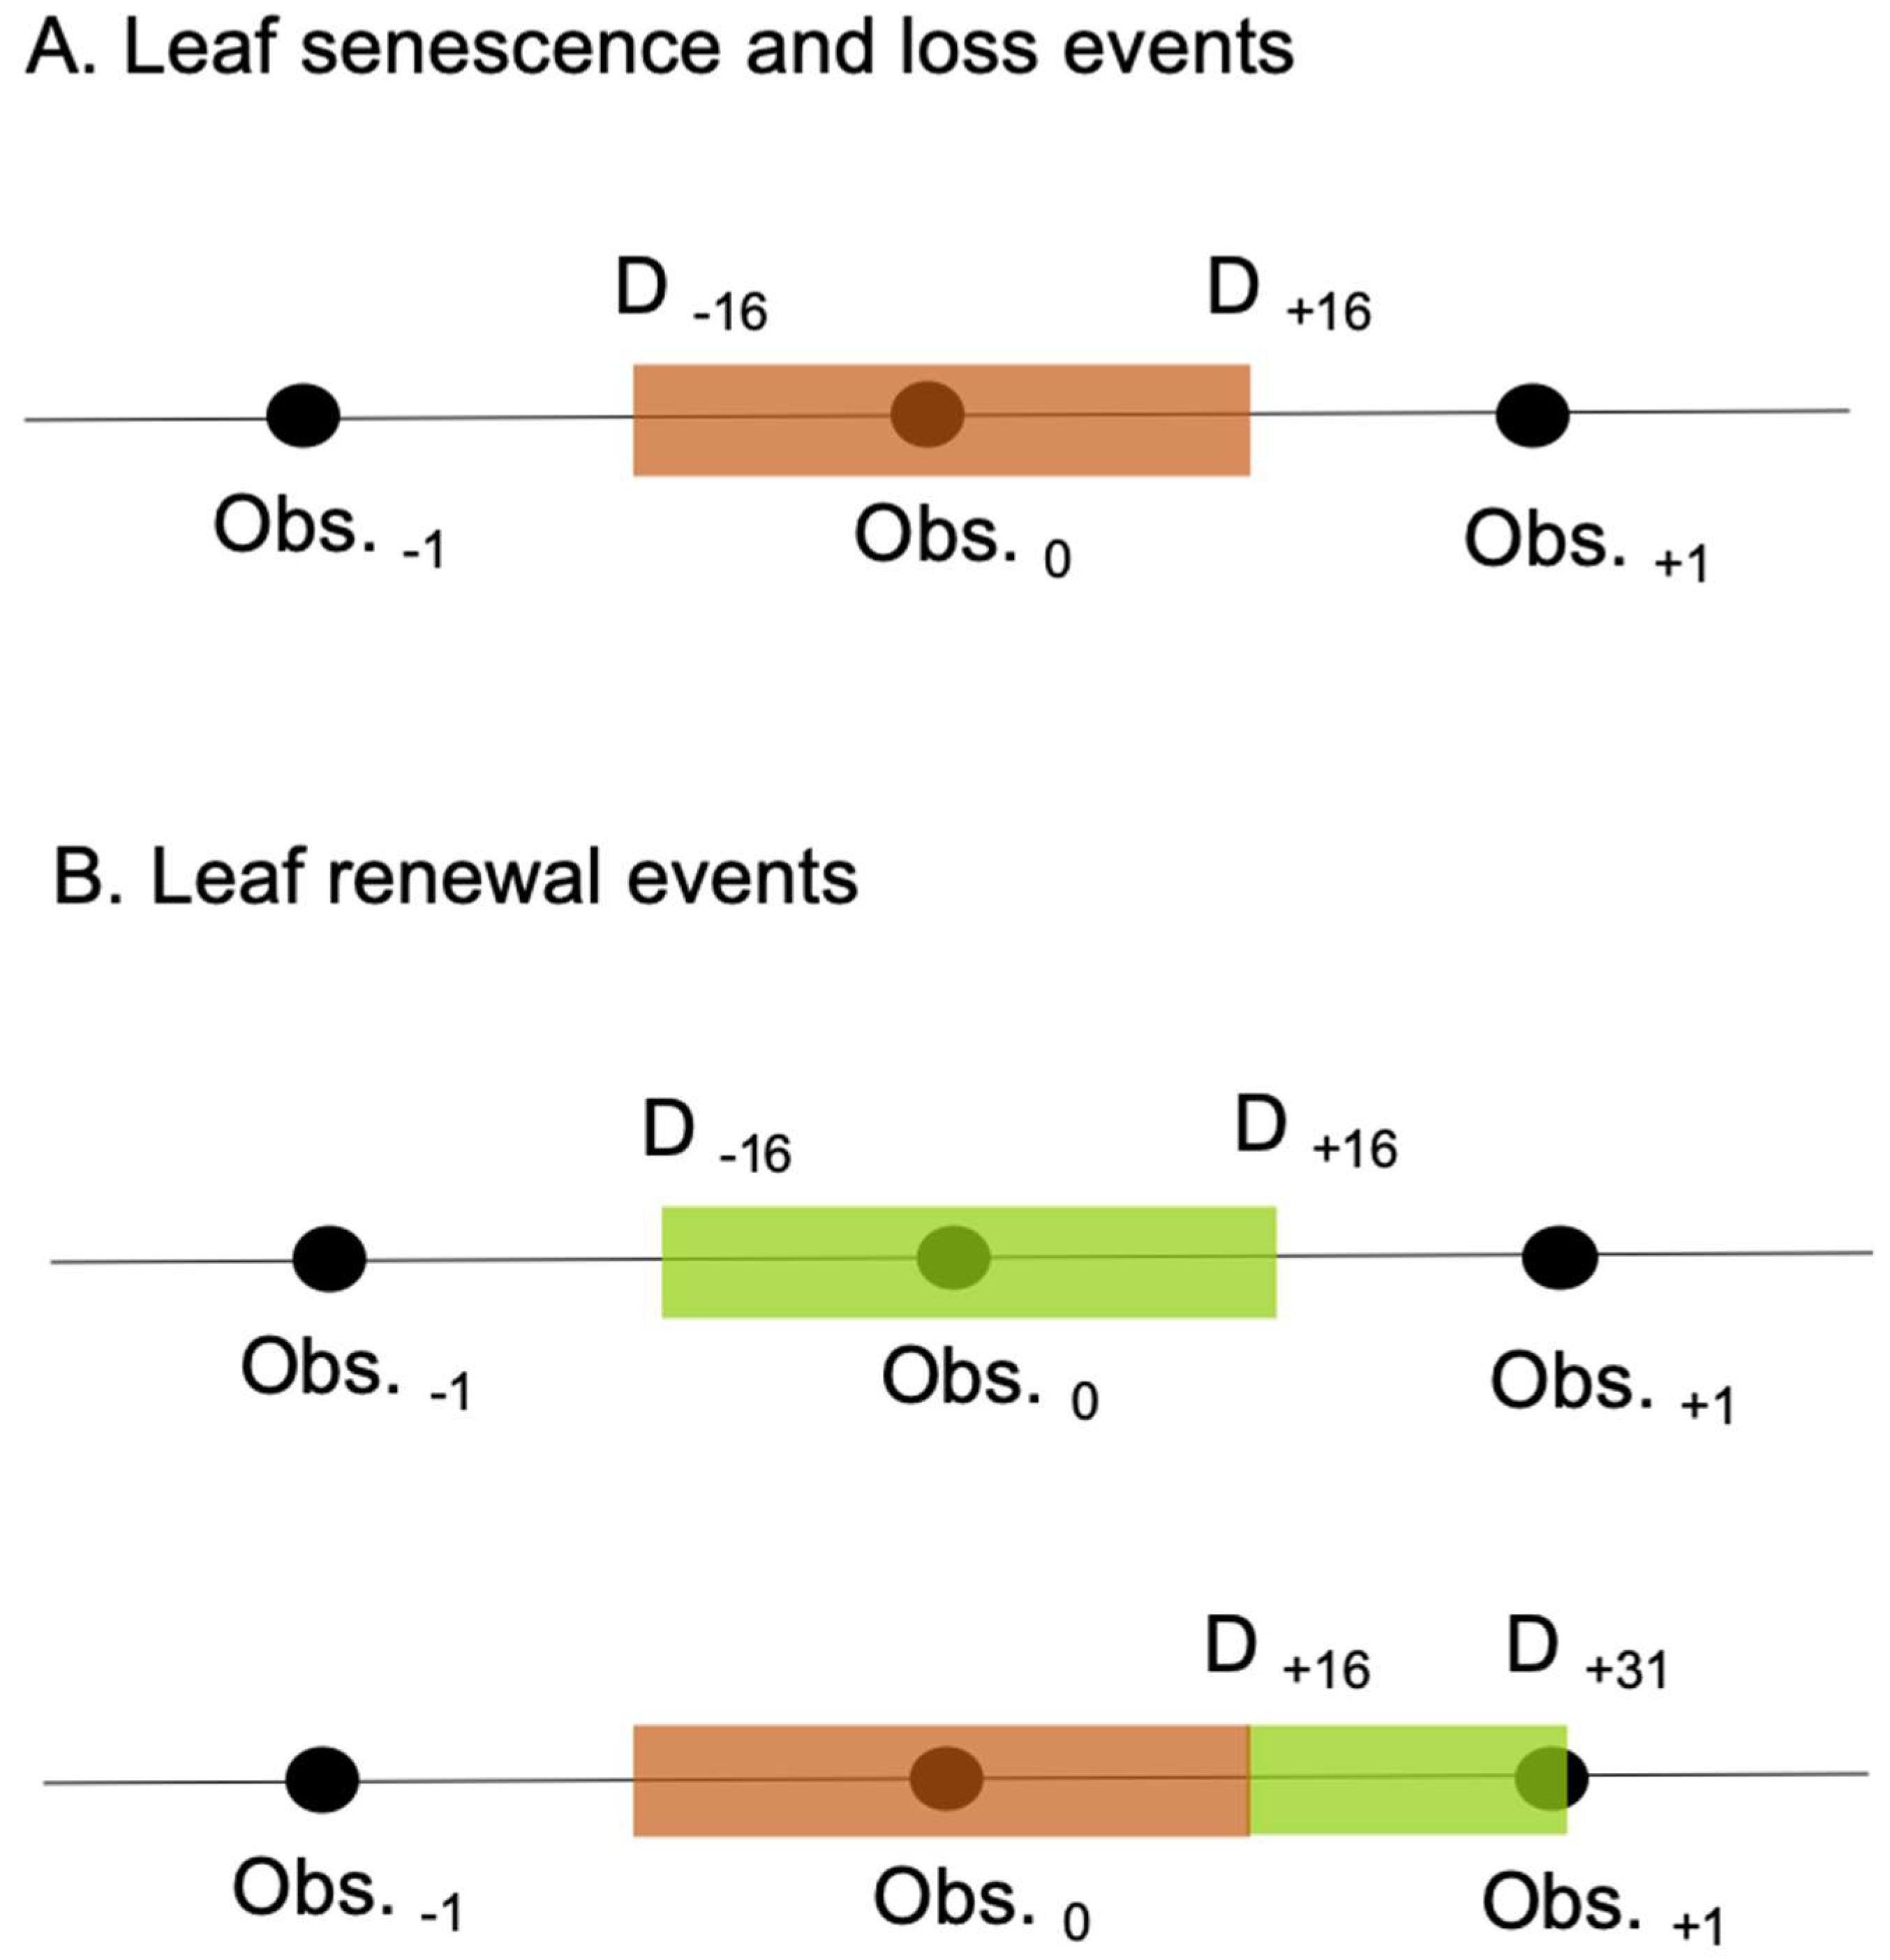
We used the monthly ground observations to produce a timeline of leaf turnover events for each focal Moabi crown. Taking into account the observation interval, we set the period of “leaf senescence and loss” in each year to last from 16 days before the first observation, to 16 days after the last observation, of leaf senescence or canopy reduction (senescent leaf canopy coverage > = 1/8th and/or mature leaf canopy coverage <= 7/8th; Figure 1). In the same way, we set the period of “leaf renewal” to last from 16 days before, to 16 days after, the first and last observations of new leaves (new leaf canopy coverage >=1/8th) and from 16 days to 31 days after the last observation of leaf senescence or canopy reduction (senescent leaf canopy coverage >= 1/8th and/or mature leaf canopy coverage <= 7/8th; Figure 1). The latter criterion is to account for incomplete observation of the leaf turnover sequence on occasions when new leaves have not be recorded due to the monthly observation interval. We created the timelines described above for eight focal Moabi crowns monitored since 2015, a period concurrent with the satellite data described below (Figure 2).
2.1.2. Satellite Observations of Moabi Phenology at Lopé NP
We investigated the ability of Sentinel-1 and Sentinel-2 satellite time series to detect leaf turnover at 10–20 m spatial resolution using SAR and optical data. As Moabi leaf turnover events were often completed in under four weeks, satellite observations able to return useable data needed to have a revisit time of 15 or fewer days to have a reasonable chance of detecting phenophase transitions. All satellite data was processed using Google Earth Engine [39]. Sentinel-1 SAR data are available from April 2015 until the present, in different imaging modes. We used images acquired in the Interferometric Wide Swath (IW) mode, which are recorded at approximately a 20-m resolution after multilooking and ground range conversion, with a nominal temporal resolution of 12 days for each of its two satellites, yielding a total revisit time of six days since the launch of Sentinel-1B in 2016. IW images have two bands, corresponding to its dual polarization mode (VV + VH). Sentinel-2 data are available from November 2015 until the present, and are recorded every ~5 days at a 10-m resolution for the visible and near-infrared bands (less frequently prior to the second satellite launching in March 2017). We filtered clouds from the Sentinel-2 surface reflectance data (level 2-A) data using the Quality Assessment (QA band), removing any pixels flagged as having cloud or cirrus-cloud cover. From the resulting masked Sentinel-2 time series, we computed the normalized difference vegetation index (NDVI) and the green leaf index as follows:
NDVI = (Band 8 – Band 4)/(Band 8 + Band 4),
GLI = (2 * Band 3 – Band 4 – Band 2)/(2 * Band 3 + Band 4 + Band 2).
The central wavelengths for the Sentinel-2 bands are as follows: Band 2 (blue): 0.490 nm; band 3 (green): 0.560 nm; band 4 (red): 0.705; band 8 (near infrared): 0.865. We then further masked any pixels in the series that resulted in NDVI values <0 to compensate for cloud detection errors in the cloud mask bands. For Sentinel-1 data, we simply used the VV and VH ground-range-detected radar backscatter, in linear scale (power), for further computation.
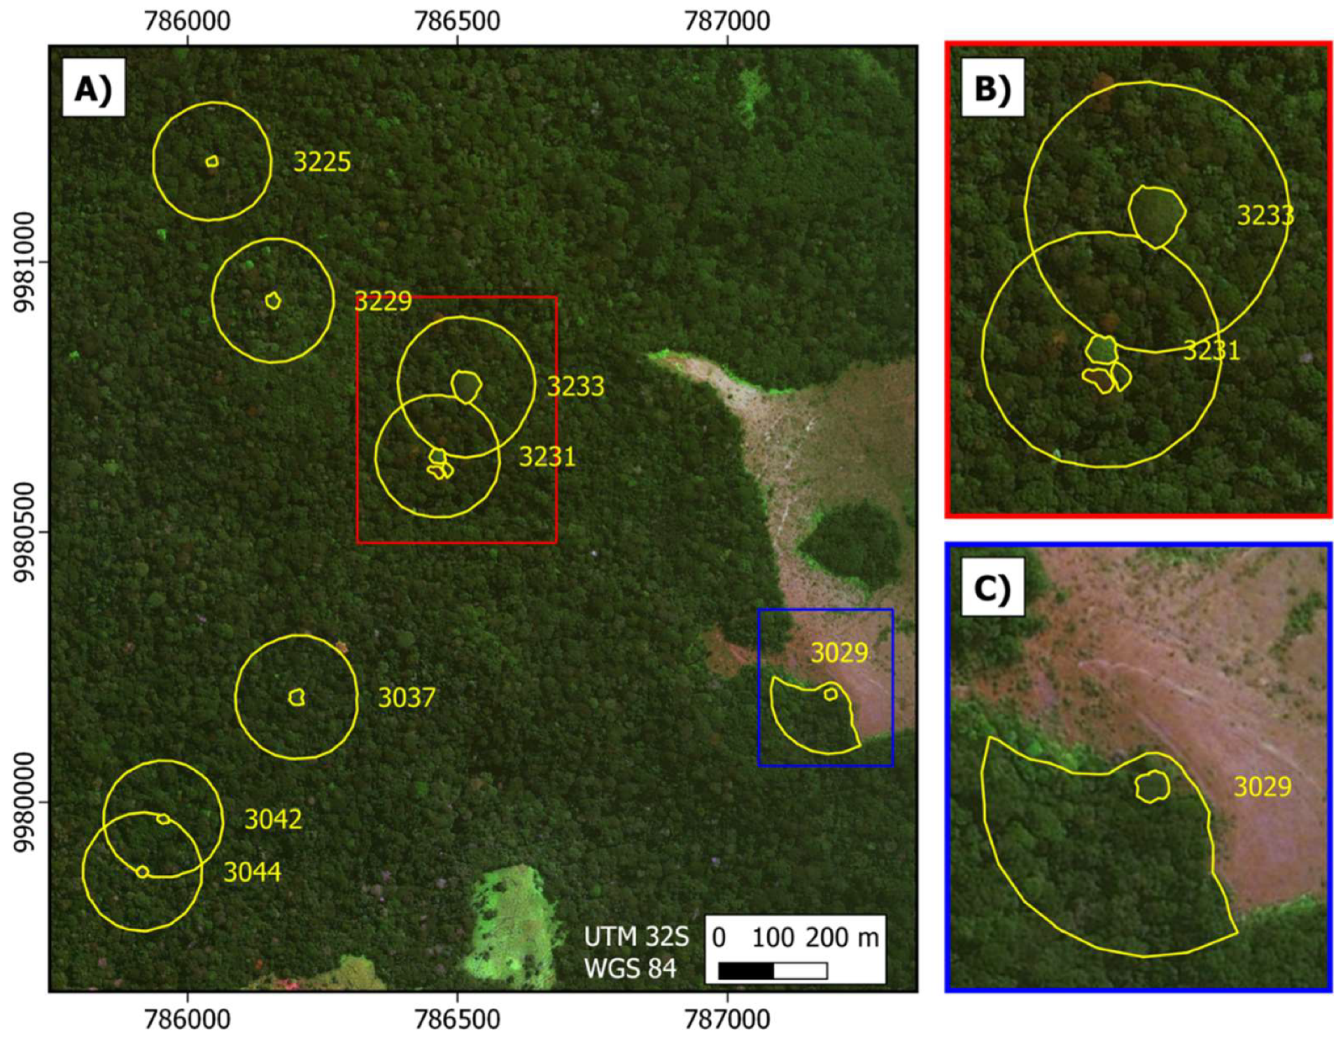
We took averaged locations for the north, south, east, and west extents of each focal Moabi crown in the study area using a handheld GPS unit on the ground and used these data to identify and draw crown polygons using the very high resolution (<2 m pixels) imagery available in the Google Earth™ and Microsoft Bing™ platforms. We also delineated the forest in a 100-m buffer around the crown boundary of each focal tree, erasing the crown of the reference tree and any other Moabi crowns contained within the buffer (forming a ring polygon; Figure 3). Trees 3231 and 3233 and trees 3042 and 3044 shared some of the surrounding buffer area due to canopy proximity. All other trees were surrounded by diverse Marantaceae forest (White & Abernethy, 1997), with no other Moabi crowns present within 100 m. Tree number 3029 is located on the forest-savanna edge and thus c.a. 58% of the buffer was excluded due to being within the savanna (Figure 3).
We extracted index and backscatter values for all pixels within each digitized crown and averaged all extracted pixels by crown and observation date (hereafter known as the canopy time series). To further normalize the effect of changes in illumination and atmospheric conditions on the canopy time series (expected to be especially important for the optical indices), we extracted the same data for the forest buffers drawn around each crown excluding the crown itself, non-forest areas (e.g., savanna), and other Moabi canopies (hereafter known as the buffer time series). We subtracted the buffer means from the canopy means at each time step to create an additional set of time series of Moabi canopy deviations relative to surrounding forest (hereafter known as the normalized canopy time series). The crowns used in the analysis sampled between 1 and 6 pixels for Sentinel-1, and between 3 and 23 pixels for Sentinel-2 data while ring buffers comprised between 40 and 121 pixels for Sentinel-1, and 158 to 486 pixels for Sentinel-2. We exported these data from Google Earth Engine in csv format and all subsequent analyses were done in R 3.6.1 [40]. The canopy, buffer, and normalized canopy time series for all data sources are shown in Figures S1–S4 and the overall mean values (and standard deviations) per crown are shown in Table 1.
2.2. Analyses
We then tested the ability of Sentinel data to detect leaf senescence and loss in Moabi crowns at Lopé NP. Firstly, we noted whether time series data points fell within the periods of leaf turnover for each crown (see Figures S1–S4 for complete canopy, buffer, and normalized canopy time series for each satellite data source superimposed on the periods of leaf turnover determined using the ground observations). We then constructed eight single variate generalized linear mixed models (GLMMs, family = binomial) with the presence/absence of leaf senescence and loss events at each time step as the response variable and a fixed effect predictor derived from the satellite data (canopy and normalized canopy time series of Sentinel-1 VV and VH and Sentinel-2 NDVI and GLI; Models 1–8). We used GLMMs due to the hierarchical nature of the dataset and the non-linear nature of the residuals. We rescaled all satellite data by subtracting the mean and dividing by one standard deviation to allow direct comparisons between standardized estimates and we included tree ID and year as random effects.
- Model 1: Leaf senescence and loss event ~ VV (canopy) + (1|TreeID) + (1|Year)
- Model 2: Leaf senescence and loss event ~ VV (normalised canopy) + (1|TreeID) + (1|Year)
- Model 3: Leaf senescence and loss event ~ VH (canopy) + (1|TreeID) + (1|Year)
- Model 4: Leaf senescence and loss event ~ VH (normalised canopy) + (1|TreeID) + (1|Year)
- Model 5: Leaf senescence and loss event ~ NDVI (canopy) + (1|TreeID) + (1|Year)
- Model 6: Leaf senescence and loss event ~ NDVI (normalised canopy) + (1|TreeID) + (1|Year)
- Model 7: Leaf senescence and loss event ~ GLI (canopy) + (1|TreeID) + (1|Year)
- Model 8: Leaf senescence and loss event ~ GLI (normalised canopy) + (1|TreeID) + (1|Year)
In a similar way we modelled the probability of detecting leaf renewal using optical satellite data from Sentinel-2 time series only (Models 9–12).
- Model 9: Leaf renewal event ~ NDVI (canopy) + (1|TreeID) + (1|Year)
- Model 10: Leaf renewal event ~ NDVI (normalised canopy) + (1|TreeID) + (1|Year)
- Model 11: Leaf renewal event ~ GLI (canopy) + (1|TreeID) + (1|Year)
- Model 12: Leaf renewal event ~ GLI (normalised canopy) + (1|TreeID) + (1|Year)
3. Results
3.1. Leaf Senescence and Loss
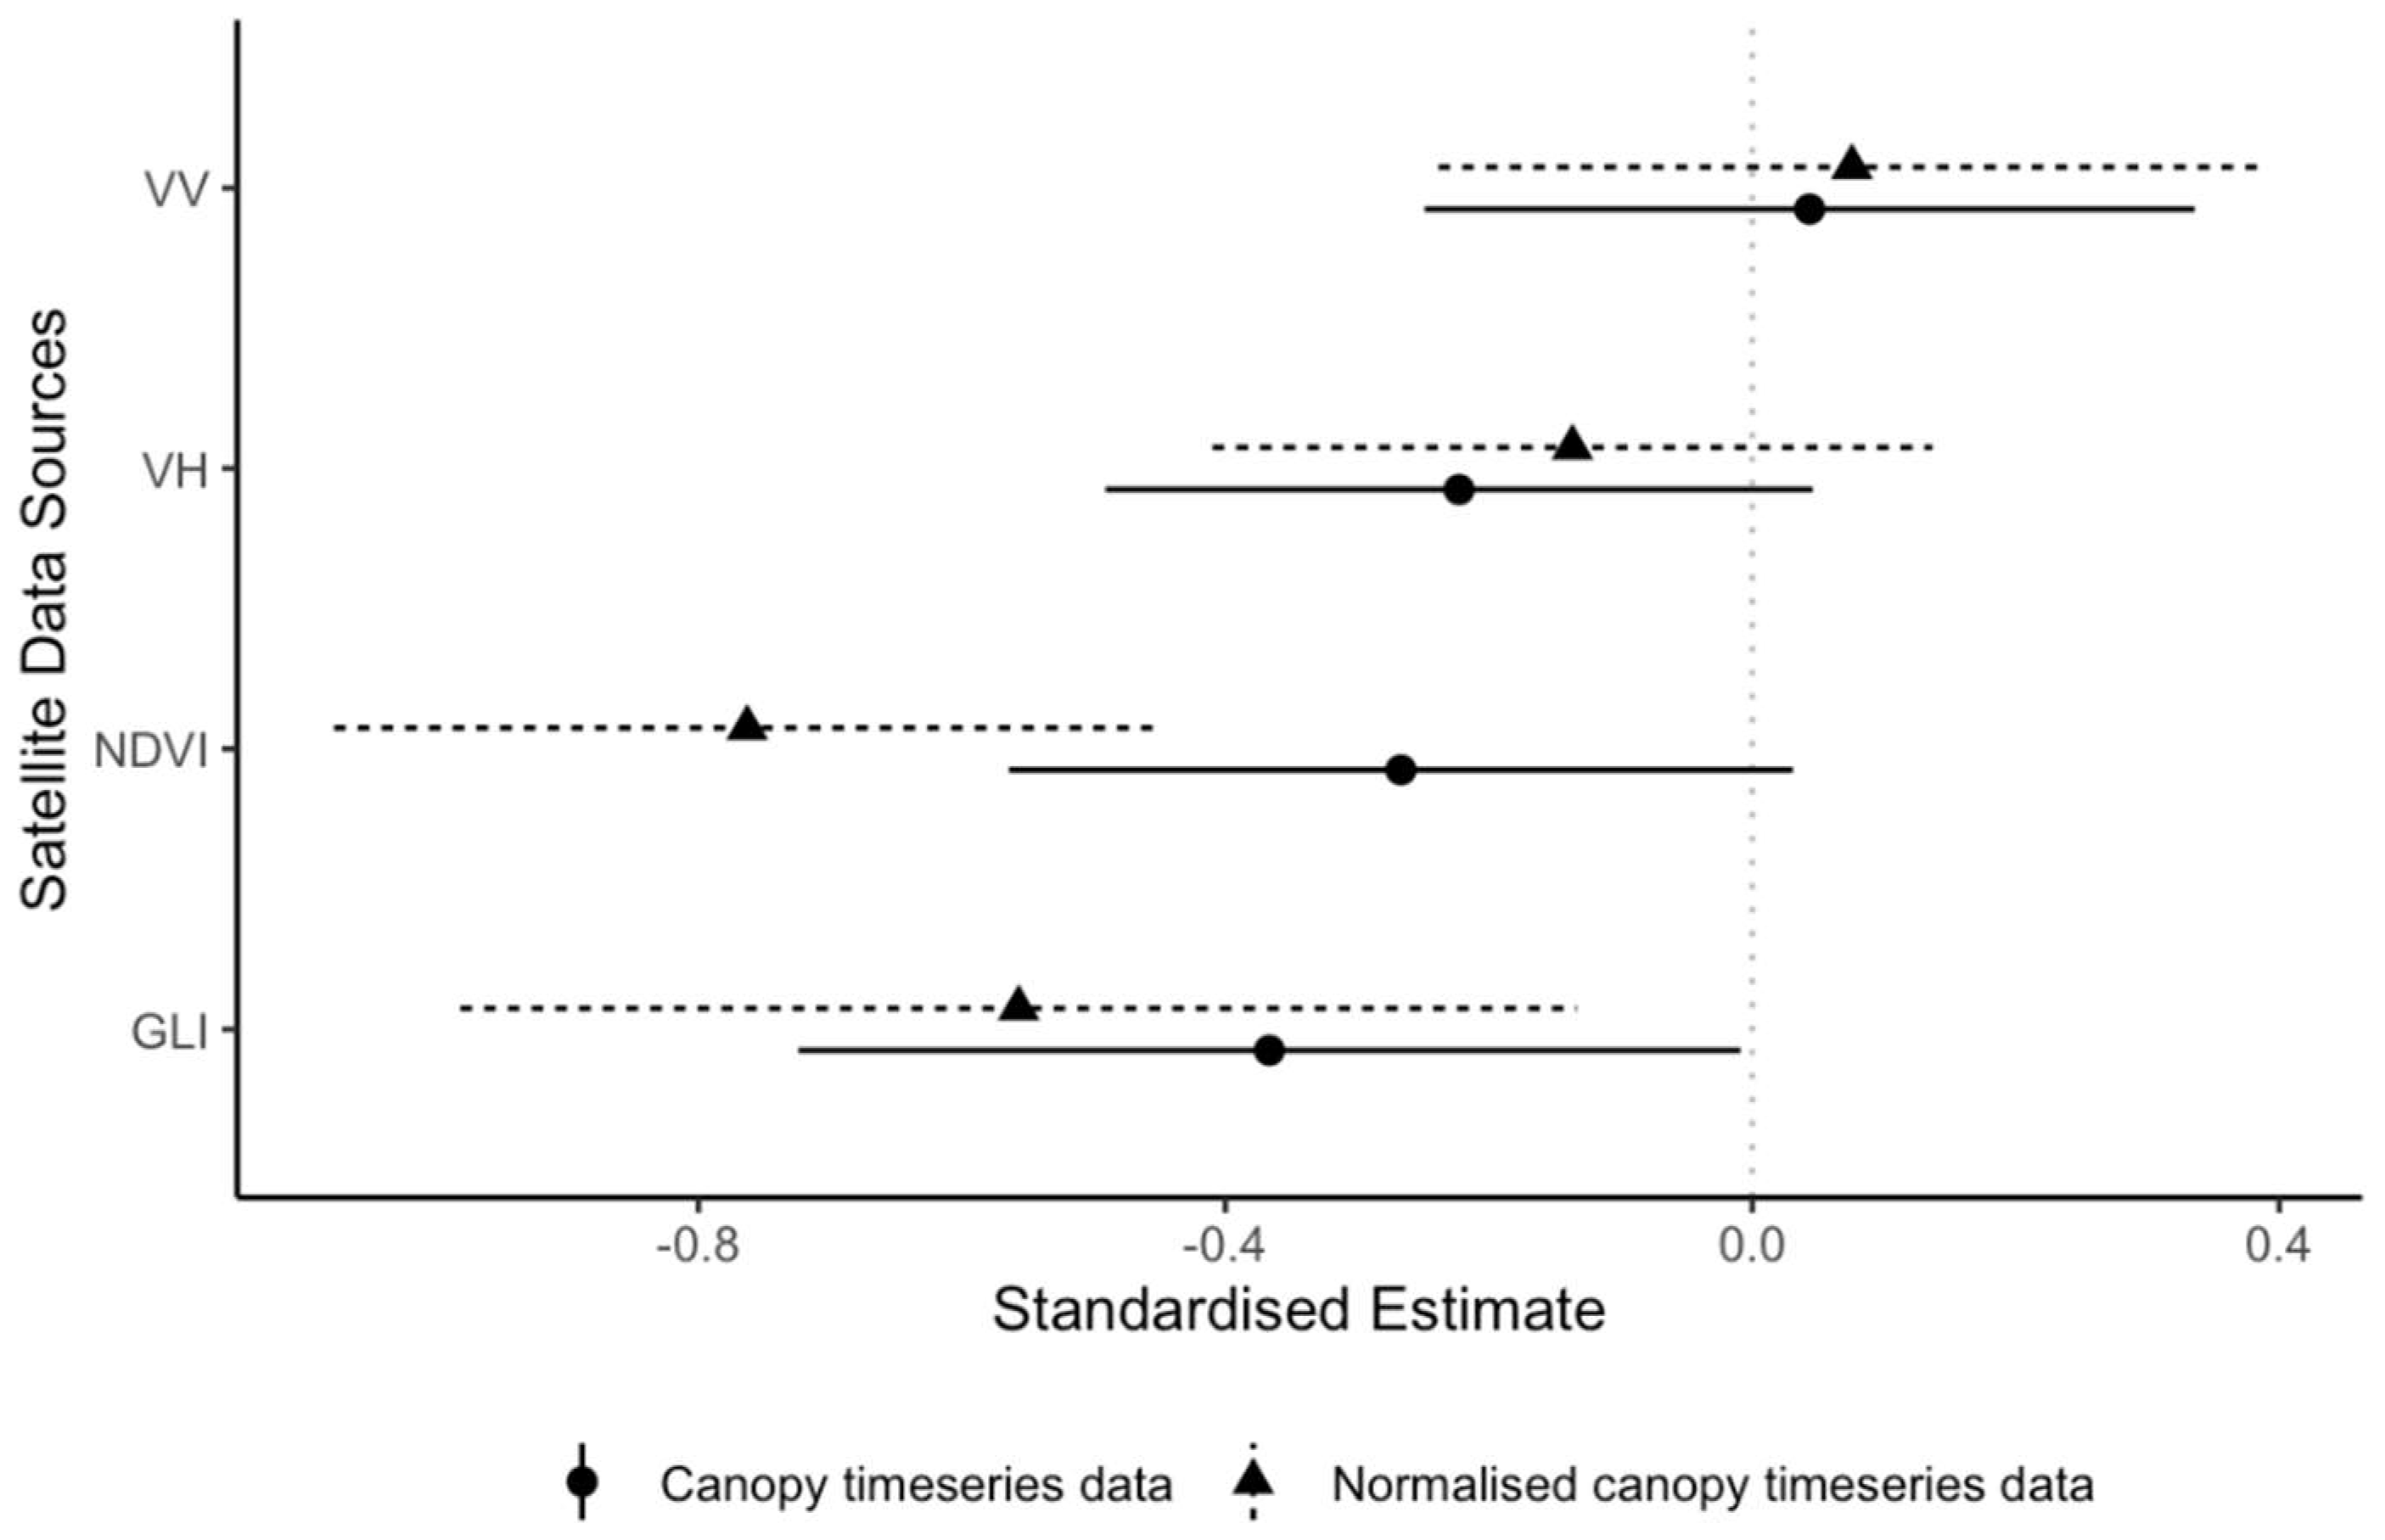
Canopy backscatter from Sentinel-1 was not a good predictor of leaf senescence and loss and normalizing the time series relative to the surrounding forest did not improve the estimates (Table 2). The 95% confidence intervals of the standardized estimates for original and normalized canopy time series for both bands all cross zero (Figure 4). The optical indices from Sentinel-2 were good predictors of leaf senescence and loss but only when normalized relative to the surrounding forest (Table 2). The 95% confidence intervals of the standardized estimates for normalized canopy time series for NDVI and GLI did not include zero (Figure 4). As expected, the direction of this sensitivity was negative, i.e., reductions in the vegetation indices were associated with leaf senescence and loss. NDVI appeared to outperform GLI for the detection of leaf senescence and loss.
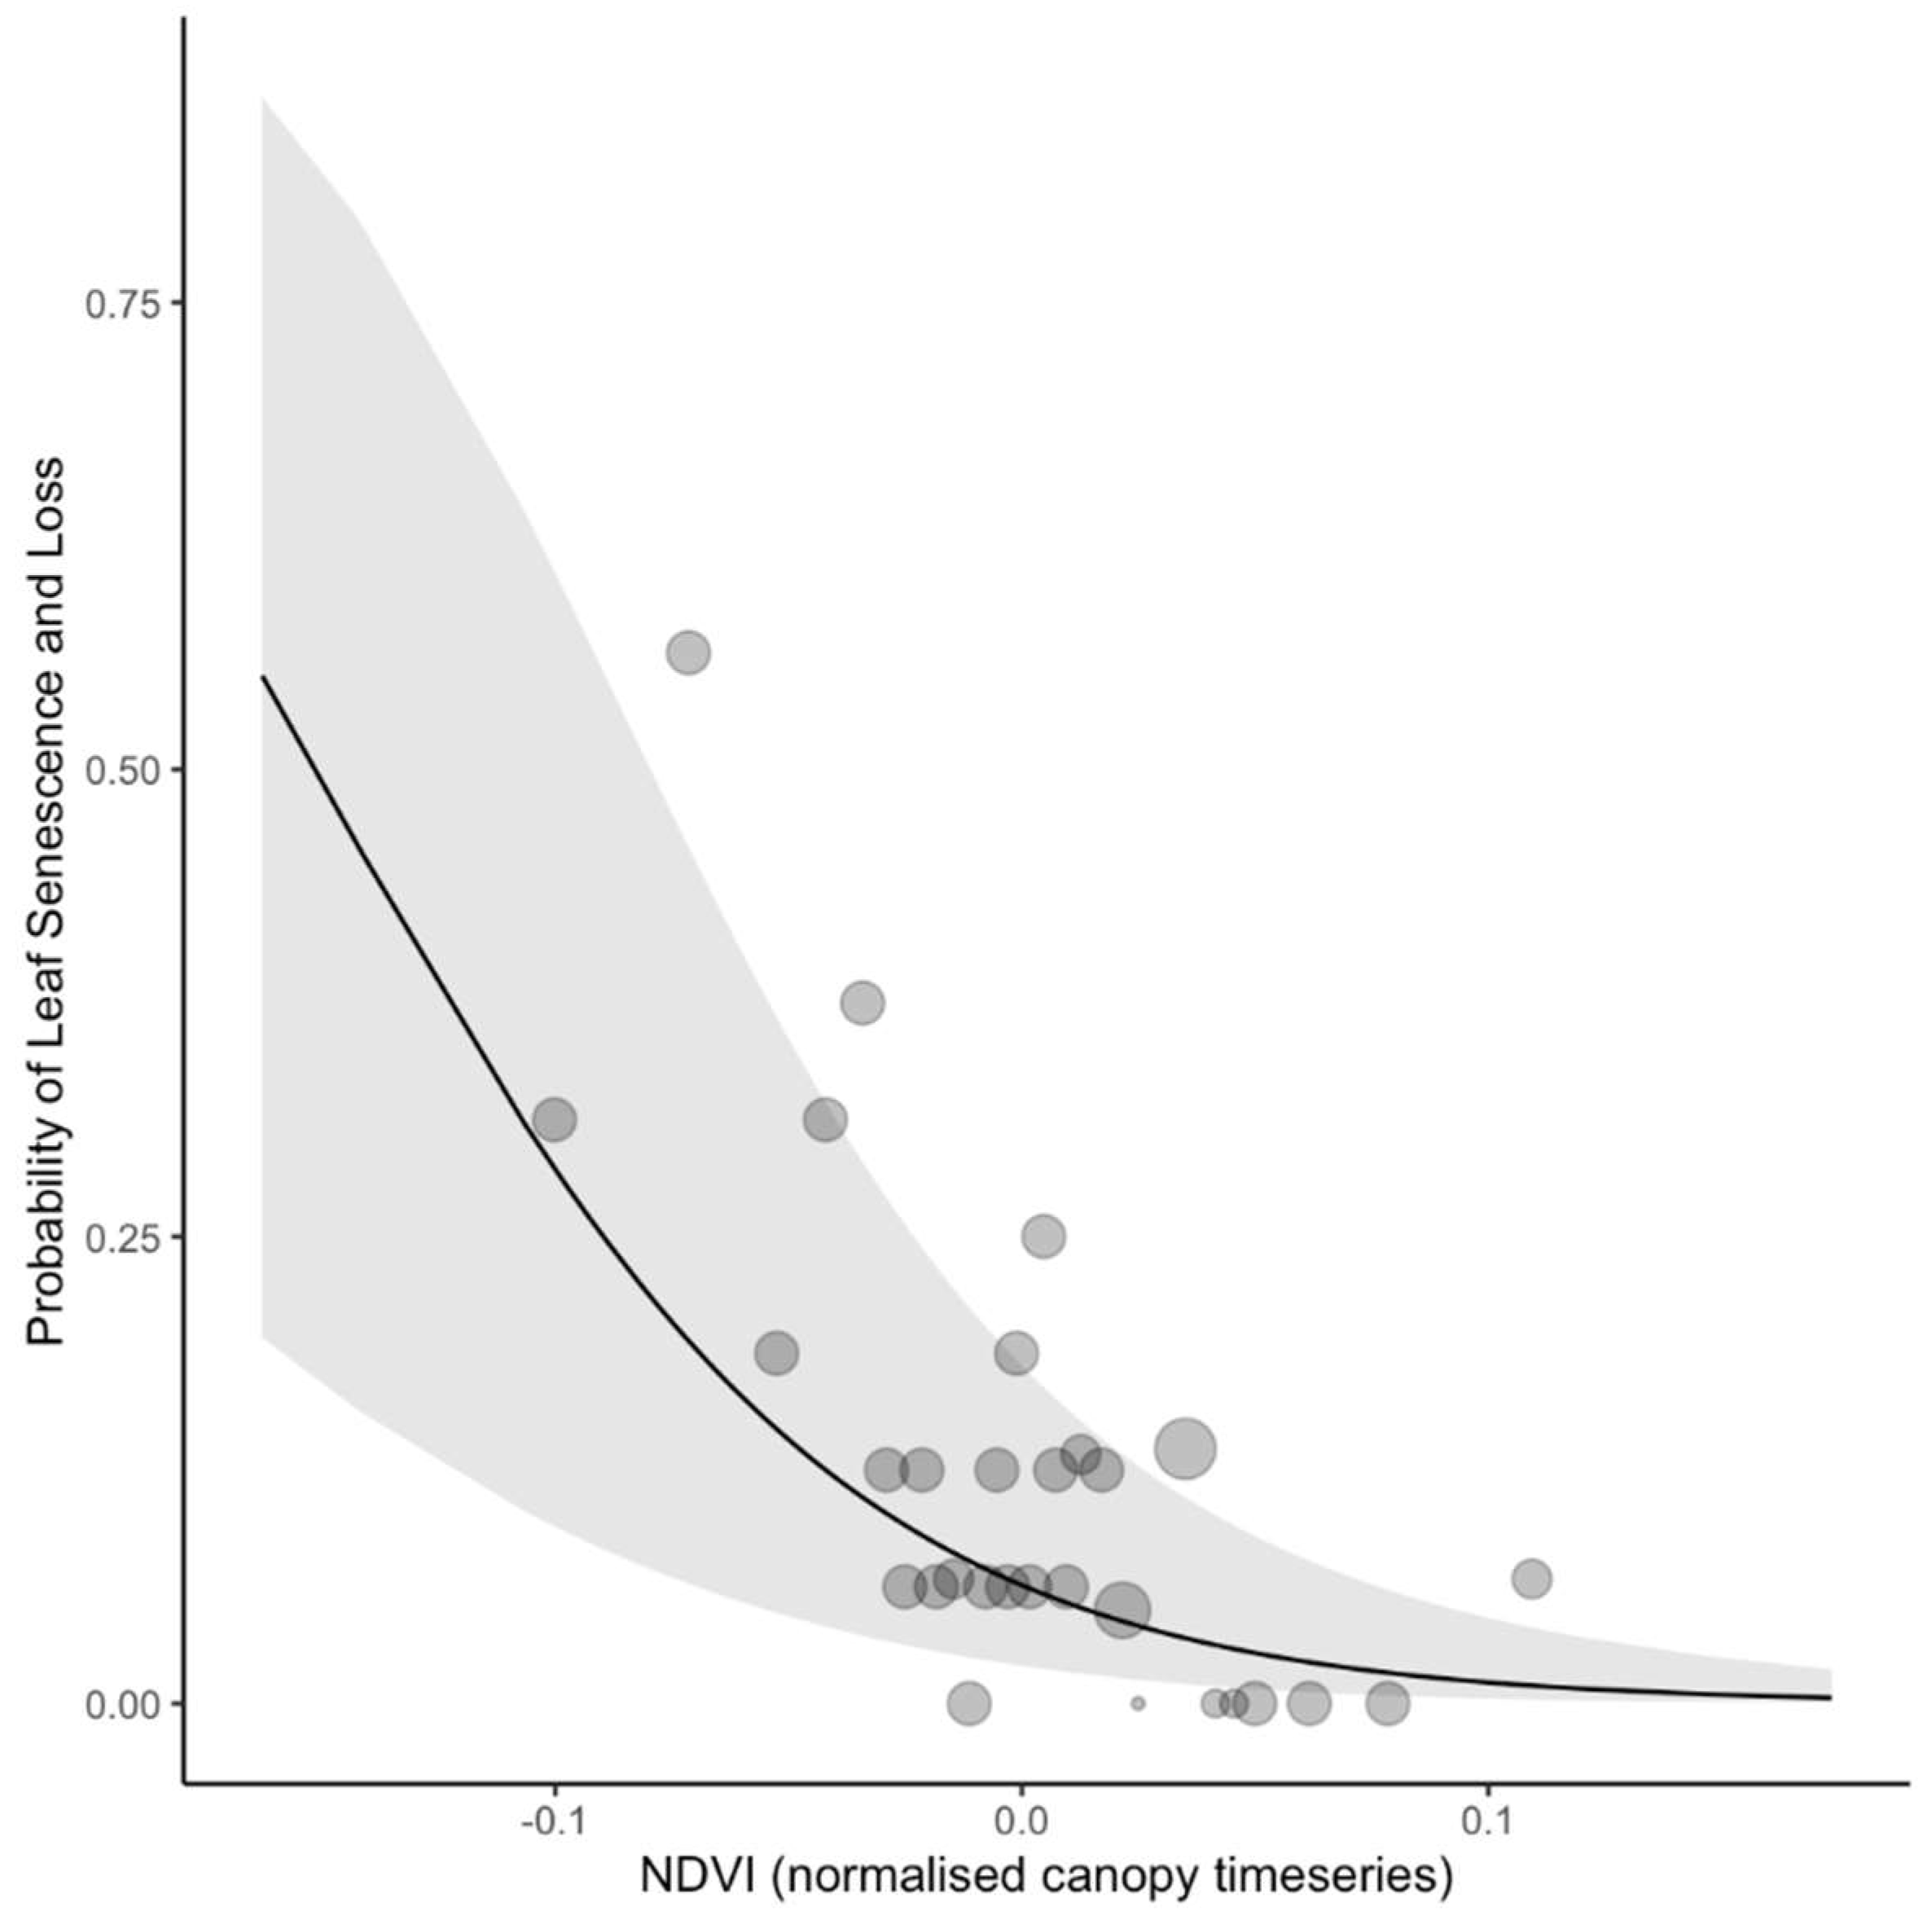
As an example of the power of NDVI detection, the model predicts that a drop in NDVI of 0.16 relative to the surrounding forest is associated with a leaf senescence or loss event just over half the time (Figure 5). However, the actual most extreme observations suggest our model may be too pessimistic at values lower than -0.1 (Figure 5).
3.2. Leaf Renewal
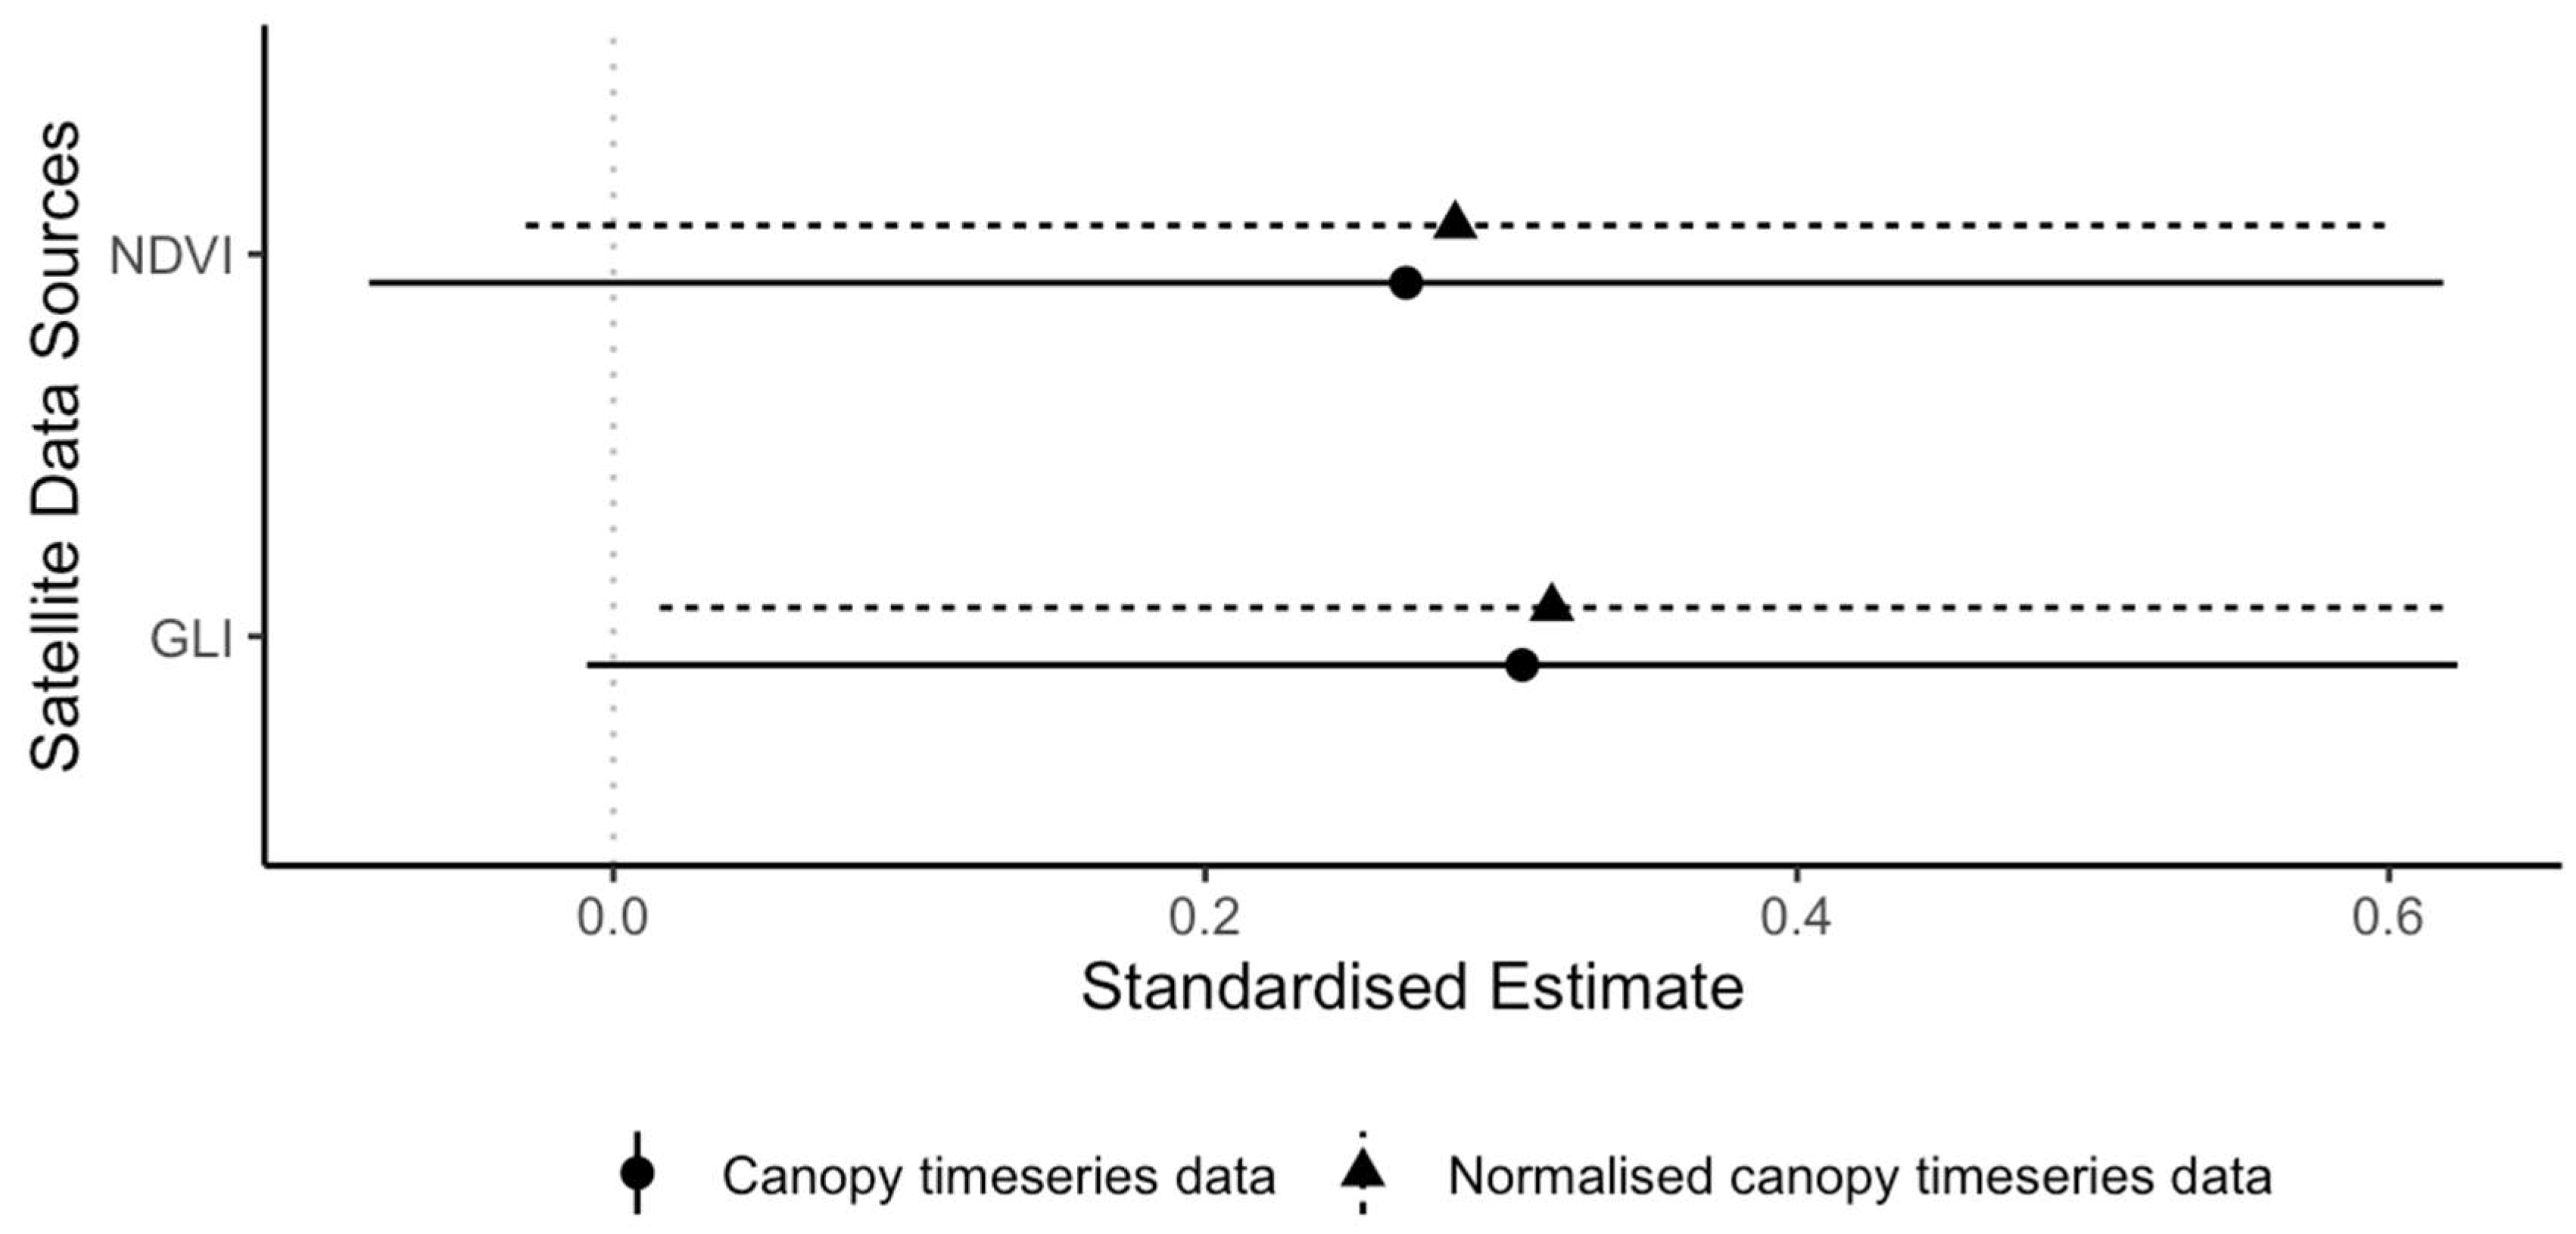
We also looked at the ability of remote sensing data to detect leaf renewal independently of leaf senescence. As expected, the optical indices were positive predictors of leaf renewal, but uncertainty was high and only the normalized canopy time series for GLI had 95% confidence intervals not crossing zero although they came very close (Table 3 and Figure 6). Normalizing the canopy time series relative to the surrounding forest had little effect in improving the strength of standardized estimates in this case for either index (Figure 6).
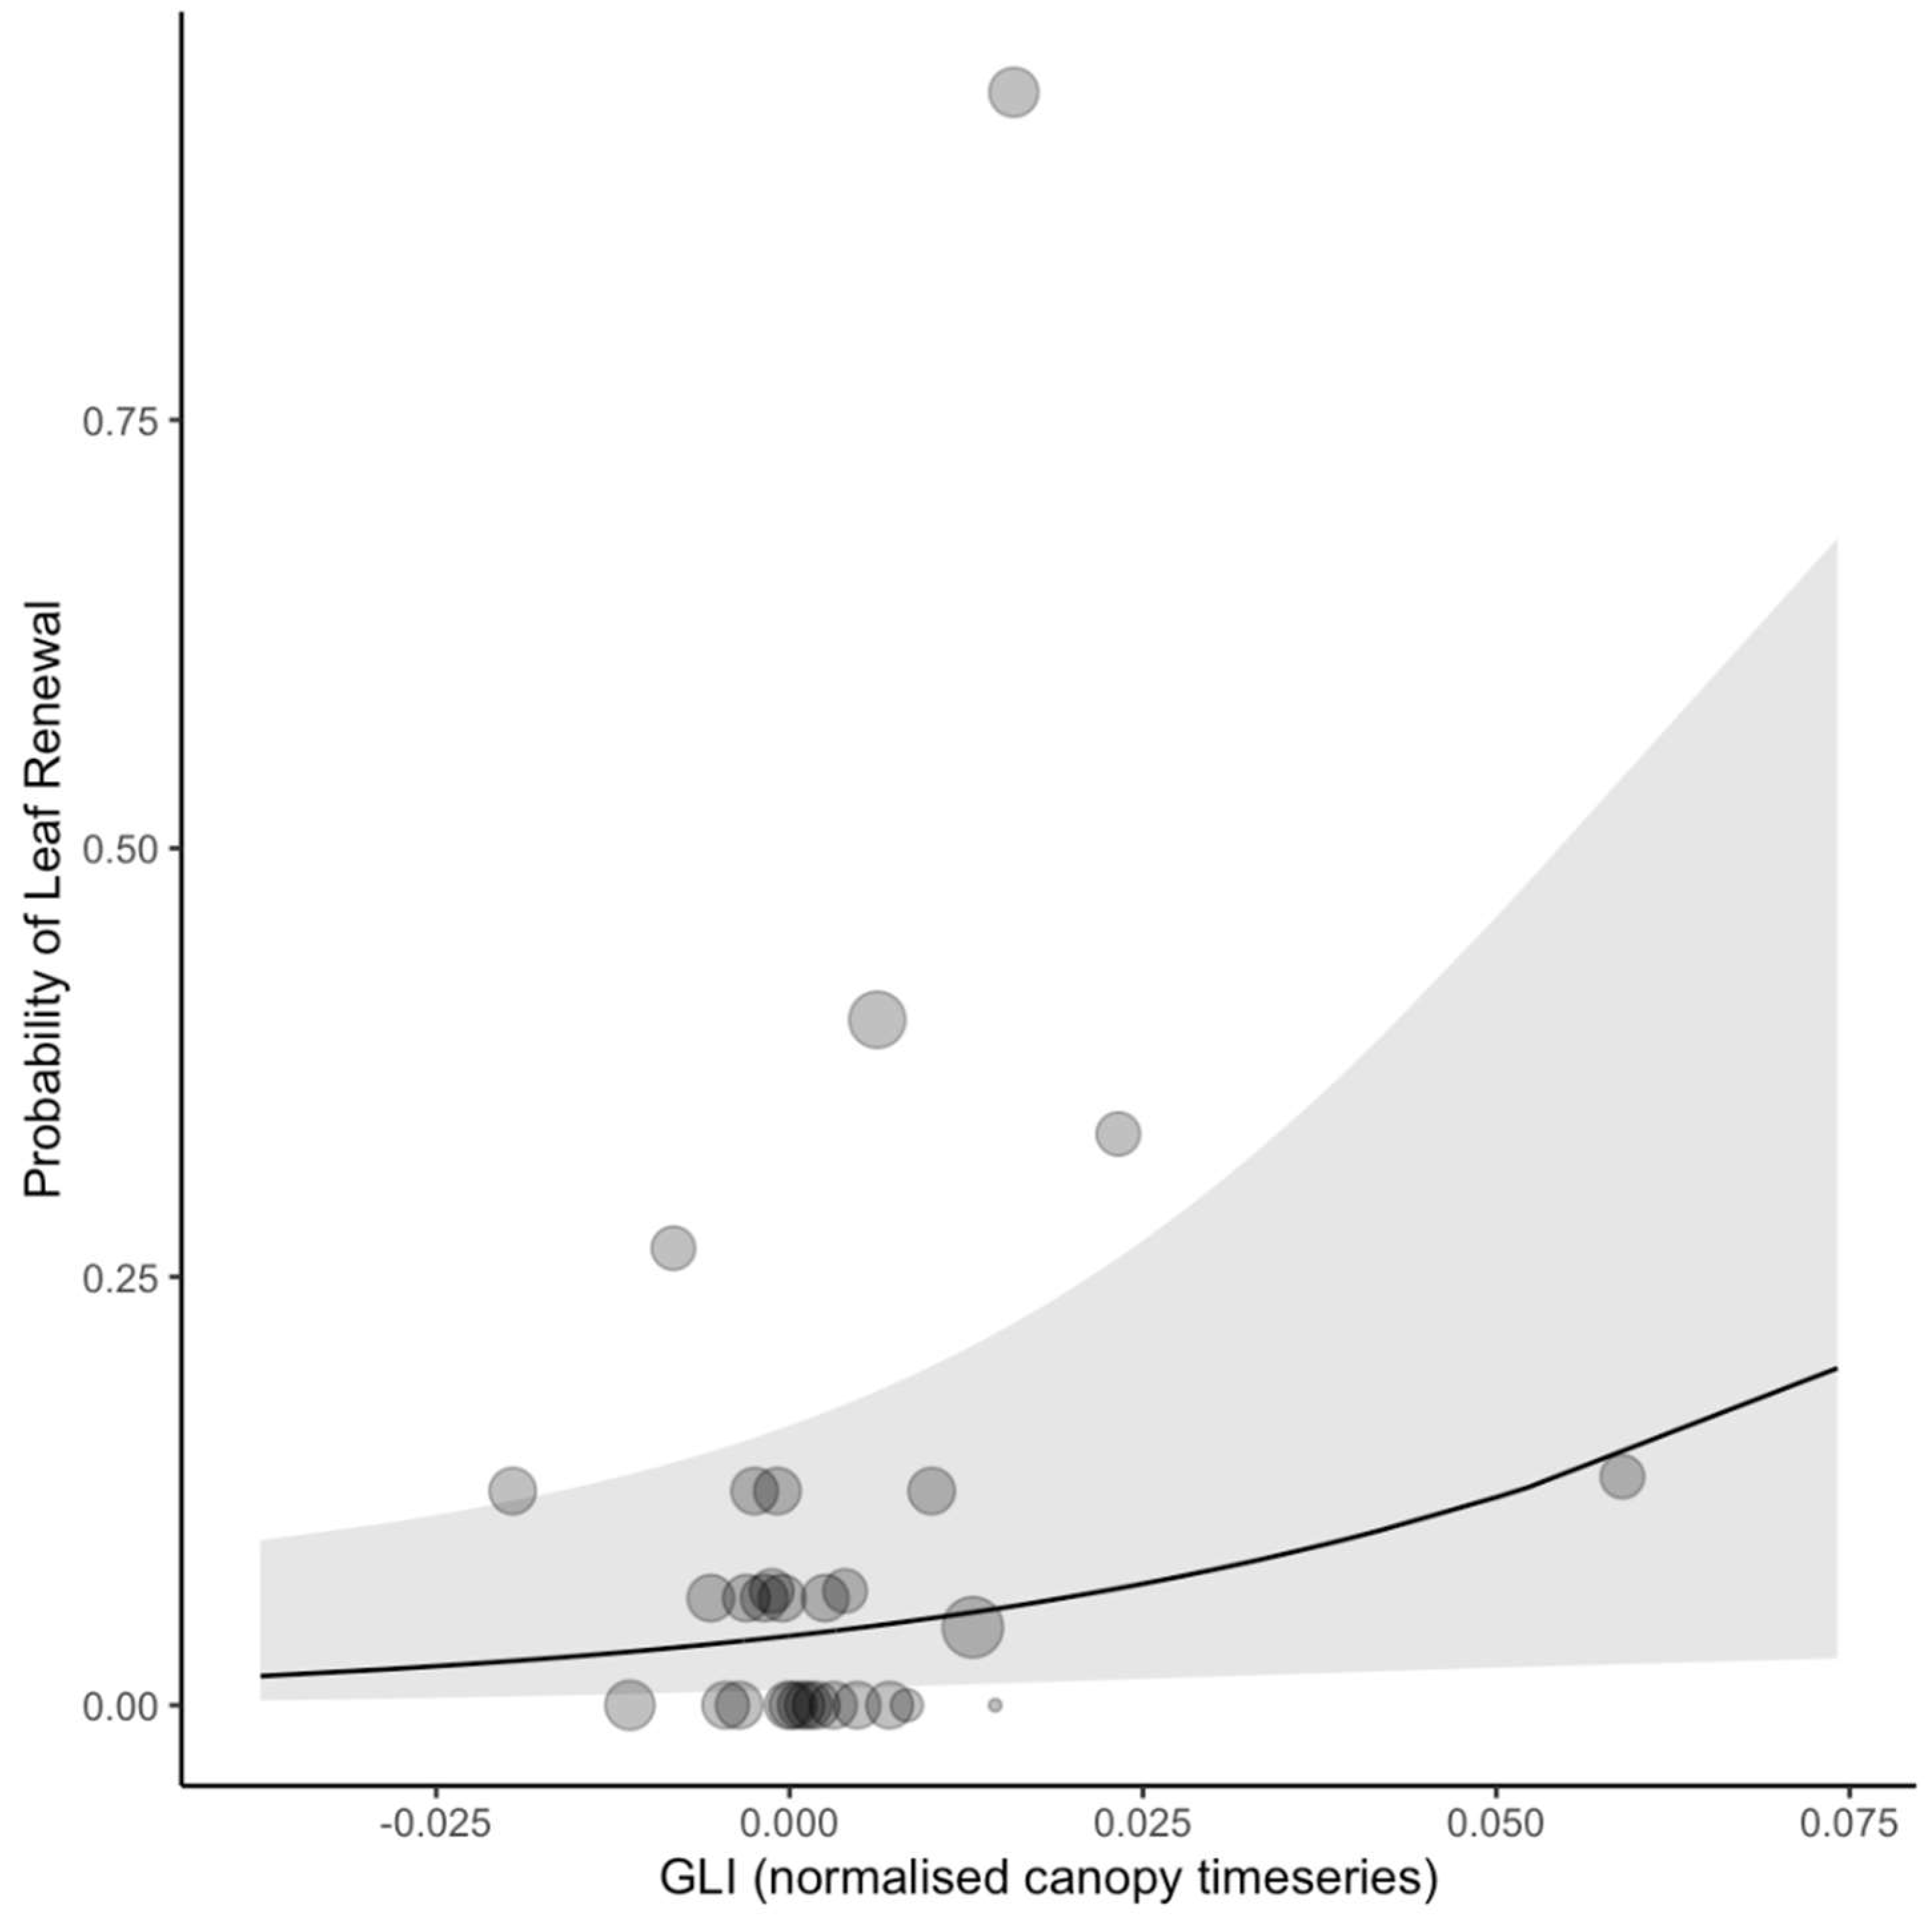
As an example of the power of the GLI detection, the model predicts that an increase in GLI of 0.07 relative to the surrounding forest is associated with a leaf renewal event 15% of the time (Figure 7).
In Figure S5, we show boxplots summarizing the raw data per satellite data source and focal crown to show the variability between individual trees and the impact of normalizing the canopy data relative to the surrounding forest.
4. Discussion
The greenness indices from Sentinel-2 show the most promise for detecting individual crown leaf turnover from space. As expected from previous work using UAVs and tower-mounted digital cameras [10,11,24,28], greenness declines during leaf senescence and loss and increases during leaf flush for individual crowns at our site. NDVI outperformed GLI when detecting leaf senescence and loss at our site (standardized estimates of normalized NDVI and GLI are −0.76 and −0.56, respectively). As NDVI correlates almost linearly with LAI [24], this result indicates that it is leaf loss, rather than the change in leaf chlorophyll content, that dominates the signal of this event in satellite data. Despite significant correlations in our results, uncertainty is still very high, with just over 50% leaf senescence and loss events correctly identified at the lowest observed NDVI values relative to the surrounding forest and just 15% of leaf renewal events correctly identified at the highest observed GLI values. A recent study using UAVs to monitor individual crown phenology at a tropical forest in Panama found that models based on the green chromatic coordinate alone (a visual-based index similar to the GLI used in this study) performed worse than models combining color and texture metrices (r2 = 0.52 versus 0.84) [10].
Normalizing the NDVI canopy time series relative to the surrounding forest at our study site very much improved the utility of this data source in detecting leaf loss and senescence (the standardized estimate of the normalized canopy data was 2.8 times the strength of the estimate from the original canopy data; Table 2 and Figure 4). This improvement serves to emphasize the importance of compensating for the likely influence of variable lighting and atmospheric conditions on the estimation and interpretation of NDVI [28]. Furthermore, although we did not quantify the amount of subcanopy cover under our focal Moabi trees, we expect that any amount of green leaves under the main crown would further reduce signal differences from leaf-on phases or from the surrounding green canopies. However, the impact of the normalization on the other data sources and for the detection of leaf renewal was minimal.
We were unable to find a relationship between the SAR time series and ground-observed leaf turnover for individual Moabi crowns at our site. The lack of an apparent signal in the Sentinel-1 SAR data is likely due to the lower spatial resolution, meaning sometimes only a single pixel was sampled per canopy. Combined with the inherent speckliness of SAR data, the sideways viewing geometry of all SAR sensors (which means other vegetation is more likely to be observed within a pixel), and the errors in geocoding SAR data, this prevented any consistent reduction in backscatter caused by individual defoliation from being visible. Higher resolution SAR data might be able to see such events, but for now these data (such as that from the TerraSAR-X or ICEYE constellations) are not collected systematically nor at sufficient temporal resolutions to be useful for monitoring leaf phenology. While other studies have found a benefit from combining the largely independent information from color and texture metrics [10], we were unable to combine the Sentinel-1 optical data with Sentinel-2 SAR data within the same predictive models because the satellites have differing flight schedules and record data on different days. In particular, due to cloud cover limitations for the Sentinel-2 data, we had far more Sentinel-1 observations than Sentinel-2, making a combined model very difficult.
Despite our hope that the commonly used monthly interval for focal crown ground observations might be sufficient to confirm the satellite signal for leaf turnover, it appears that there is too much uncertainty in both ground and satellite data sources to build a reliable model to scale-up the detection of Moabi leaf turnover outside our study area at the current time. The poor temporal resolution of both the ground observations (due to the monthly field work schedule) and satellite observations (due to flight schedules and cloudiness) are major contributors to this uncertainty. To improve detection rates in future analyses under the current suite of available satellite products, we could collect higher resolution ground data, for example, using daily or weekly measurements provided by field personnel, phenocams, or UAVs (see Figure 8). UAVs provide an ideal intermediary between ground and satellite observations, often providing, for example, optical data with 5-10cm spatial resolution, with the advantages of flying beneath the clouds and covering a much larger area than possible by ground observations and should yield more precise canopy delineations [10].
More frequent data collection should also help improve the assumptions we made when allocating the periods of likely leaf turnover. We designed the current leaf turnover protocols based on the monthly frequency of ground observations (Figure 1). A brief investigation of the remote sensing data suggests that the elevated greenness associated with leaf flush may persist beyond the window allocated in the present study and that finding a more optimal window of leaf turnover could improve the strength of the predictions from our models (Table S1). We will be able to carry out a formal window selection in the future when additional higher frequency ground data are available. We should also consider that human error may have lent some uncertainty to the ground observations. However, the observers at Lope are highly trained and have been consistent throughout the time period [21]. Human observation more generally brings a number of benefits, such as intelligent looking, searching for multiple cues and moving position to gain a better vantage point, and is fairly insensitive to variable lighting, compared to an automated system. A combination of human and automated observation methods and an increase in frequency would be advantageous to reduce uncertainty in phenophase detection in future analyses.
If we are to monitor individual phenology from space, there also needs to be changes to the temporal resolution of the freely available satellite datasets, which currently impede our ability to detect short-lived leaf events. However, new revolutionizing approaches, such as the Planet Dove constellation of nanosatellites, which offer daily observations at a 3.5-m spatial resolution, will make potentially very useful data available at much higher temporal and spatial resolutions in the future. However, these data are currently commercial, making scaling up algorithms based on them to large scales still prohibitively expensive for most research groups.
Despite the uncertainties described above, we feel that the significant results for detecting Moabi leaf turnover using satellite optical indices in our study suggest that there is potential in this method, especially by using narrowband sensors with high radiometric resolution, warranting further investigation. Using the current available data, we see the potential to replicate the approach demonstrated in this paper for smaller-crowned monodominant forest canopies (such as Aucoumea klaineana in Gabon), which appear to defoliate synchronously over large areas and may produce a greenness or NDVI-related signal.
5. Conclusions
We show, perhaps for the first time, that the leaf phenology of individual mega-crowns can directly influence the spectral signature of satellite pixels through time. Additionally, despite the seemingly poor detection rates found here, we believe this analysis shows that we are near to crossing the threshold for orbital monitoring of individual crowns in tropical forests, even in challenging locations, such as cloudy Gabon. Relatively simple improvements to the temporal frequency of ground and orbital measurements and moderate increases in the spatial resolution and radiometric accuracy of available satellite imagery could yield vastly improved detection rates. Once we are able to monitor individual plants using satellite data we will be able to bring remote sensing into the spatial and temporal scales relevant to organismal biological processes, with great potential to improve our understanding of the Earth system [41].
Supplementary Materials
The following are available online at https://0-www-mdpi-com.brum.beds.ac.uk/2072-4292/12/3/429/s1, Figure S1: Focal crown time series for Sentinel-1 VV band, Figure S2: Focal crown time series for Sentinel-1 VH band, Figure S3: Focal crown time series for Sentinel-2 NDVI, Figure S4: Focal crown time series for Sentinel-2 GLI, Figure S5: Boxplots of canopy and normalized canopy data for all satellite data, Table S1: Model estimates for extended leaf renewal period.
Author Contributions
Conceptualization, E.R.B., E.T.A.M. and K.A.; Data curation, E.R.B. and K.A.; Formal analysis, E.R.B., E.T.A.M. and T.S.F.S.; Funding acquisition, E.R.B. and K.A.; Investigation, E.R.B., T.S.F.S., E.D., P.D., L.M. and K.A.; Methodology, E.R.B., E.T.A.M., T.S.F.S., E.D., L.M. and K.A.; Project administration, E.R.B., L.M. and K.A.; Visualization, E.R.B.; Writing—original draft, E.R.B., E.T.A.M., T.S.F.S. and K.A.; Writing—review & editing, E.R.B., E.T.A.M., T.S.F.S. and K.A. All authors have read and agreed to the published version of the manuscript.
Funding
The research was funded by the Agence Nationale des Parcs Nationaux (ANPN Gabon) and the University of Stirling. E.T.A.M. is funded by the European Union through ERC grant FODEX (757526).
Acknowledgments
Permission to conduct this research in Gabon was granted by the CIRMF Scientific Council and by ANPN and the National Centre for Research in Science and Technology (CENAREST; 2010 - present).
Conflicts of Interest
The authors declare no conflict of interest. The funders had no role in the design of the study; in the collection, analyses, or interpretation of data; in the writing of the manuscript, or in the decision to publish the results.
References
- Richardson, A.D.; Keenan, T.F.; Migliavacca, M.; Ryu, Y.; Sonnentag, O.; Toomey, M. Climate change, phenology, and phenological control of vegetation feedbacks to the climate system. Agric. For. Meteorol. 2013, 169, 156–173. [Google Scholar] [CrossRef]
- Abernethy, K.; Bush, E.R.; Forget, P.M.; Mendoza, I.; Morellato, L.P.C. Current issues in tropical phenology: A synthesis. Biotropica 2018, 50, 477–482. [Google Scholar] [CrossRef] [Green Version]
- Bonan, G.B.; Doney, S.C. Climate, ecosystems, and planetary futures: The challenge to predict life in Earth system models. Science 2018, 359. [Google Scholar] [CrossRef] [PubMed] [Green Version]
- Mitchard, E.T.A. The tropical forest carbon cycle and climate change. Nature 2018, 559, 527–534. [Google Scholar] [CrossRef] [PubMed]
- Bloom, A.A.; Exbrayat, J.F.; Van Der Velde, I.R.; Feng, L.; Williams, M. The decadal state of the terrestrial carbon cycle: Global retrievals of terrestrial carbon allocation, pools, and residence times. Proc. Natl. Acad. Sci. USA 2016, 113, 1285–1290. [Google Scholar] [CrossRef] [PubMed] [Green Version]
- Wu, J.; Kobayashi, H.; Stark, S.C.; Meng, R.; Guan, K.; Tran, N.N.; Gao, S.; Yang, W.; Restrepo-Coupe, N.; Miura, T.; et al. Biological processes dominate seasonality of remotely sensed canopy greenness in an Amazon evergreen forest. New Phytol. 2018, 217, 1507–1520. [Google Scholar] [CrossRef] [Green Version]
- Morton, D.C.; Nagol, J.; Carabajal, C.C.; Rosette, J.; Palace, M.; Cook, B.D.; Vermote, E.F.; Harding, D.J.; North, P.R.J. Amazon forests maintain consistent canopy structure and greenness during the dry season. Nature 2014, 506, 221. [Google Scholar] [CrossRef]
- Huete, A.R.; Saleska, S.R. Remote sensing of tropical forest phenology: Issues and controversies. Int. Arch. Photogramm. Remote Sens. Spat. Inf. Sci. 2010, 38, 539–541. [Google Scholar]
- Albert, L.P.; Restrepo-Coupe, N.; Smith, M.N.; Wu, J.; Chavana-Bryant, C.; Prohaska, N.; Taylor, T.C.; Martins, G.A.; Ciais, P.; Mao, J.; et al. Cryptic phenology in plants: Case studies, implications, and recommendations. Glob. Chang. Biol. 2019, 25, 3591–3608. [Google Scholar] [CrossRef]
- Park, J.Y.; Muller-Landau, H.C.; Lichstein, J.W.; Rifai, S.W.; Dandois, J.P.; Bohlman, S.A. Quantifying leaf phenology of individual trees and species in a tropical forest using unmanned aerial vehicle (UAV) images. Remote Sens. 2019, 11, 1534. [Google Scholar] [CrossRef] [Green Version]
- Alberton, B.; Almeida, J.; Helm, R.; Torres, R.; da, S.; Menzel, A.; Morellato, L.P.C. Using phenological cameras to track the green up in a cerrado savanna and its on-the-ground validation. Ecol. Inform. 2014, 19, 62–70. [Google Scholar] [CrossRef]
- Nagai, S.; Ichie, T.; Yoneyama, A.; Kobayashi, H.; Inoue, T.; Ishii, R.; Suzuki, R.; Itioka, T. Usability of time-lapse digital camera images to detect characteristics of tree phenology in a tropical rainforest. Ecol. Inform. 2016, 32, 91–106. [Google Scholar] [CrossRef]
- Louppe, D. Baillonella toxisperma Pierre. [Internet] Record from PROTA4U. In PROTA (Plant Resources of Tropical Africa / Ressources végétales de l’Afrique tropicale). 2005. Available online: https://www.prota4u.org/database/protav8.asp?h=M10,M14,M15,M16,M18,M20,M23,M25,M26,M27,M36,M5,M6,M7,M8,M9&t=moabi,Moabi&p=Baillonella+toxisperma#AdulterationsAndSubstitutes (accessed on 28 January 2020).
- Malhi, Y.; Jackson, T.; Bentley, L.P.; Lau, A.; Shenkin, A.; Herold, M.; Calders, K.; Bartholomeus, H.; Disney, M.I. New perspectives on the ecology of tree structure and tree communities through terrestrial laser scanning. Interface Focus 2018, 8. [Google Scholar] [CrossRef] [PubMed] [Green Version]
- Plenderleith, K.; Brown, N. Moabi (Baillonella toxisperma). In The Key Non-Timber Forest Products of Central Africa: State of the Knowledge; Clark, L.E., Sunderland, T.C.H., Eds.; USAID, Bureau for Africa, Office of Sustainable Development: Washington, DC, USA, 2004; pp. 141–162. [Google Scholar]
- Bush, E.R. Tropical Phenology in a Time of Change. 2018. Available online: https://dspace.stir.ac.uk/handle/1893/29325#.XjpjvyMRVPZ (accessed on 27 January 2020).
- Philippon, N.; Cornu, G.; Monteil, L.; Gond, V.; Moron, V.; Pergaud, J.; Sèze, G.; Bigot, S.; Camberlin, P.; Doumenge, C.; et al. The light-deficient climates of western Central African evergreen forests. Environ. Res. Lett. 2019, 14, 034007. [Google Scholar] [CrossRef]
- Bush, E.R.; Jeffery, K.; Bunnefeld, N.; Tutin, C.; Musgrave, R.; Moussavou, G.; Mihindou, V.; Malhi, Y.; Lehmann, D.; Ndong, J.E.; et al. Ground data confirm warming and drying are at a critical level for forest survival in western equatorial Africa. PeerJ Prepr. 2019. [Google Scholar] [CrossRef]
- Tutin, C.E.G. Gorillas and their food plants in the Lope Reserve, Gabon. In Chorology, Taxonomy and Ecology of the Floras of Africa and Madagascar; Kew Publication: London, UK, 1998; pp. 227–243. [Google Scholar]
- Bush, E.R.; Abernethy, K.A.; Jeffery, K.; Tutin, C.; White, L.; Dimoto, E.; Dikangadissi, J.T.; Jump, A.S.; Bunnefeld, N. Fourier analysis to detect phenological cycles using tropical field data and simulations. Methods Ecol. Evol. 2017, 8, 530–540. [Google Scholar] [CrossRef]
- Bush, E.R.; Bunnefeld, N.; Dimoto, N.; Dikangadissi, J.T.; Jeffery, K.; Tutin, C.; White, L.; Abernethy, K.A. Towards effective monitoring of tropical phenology: Maximising returns and reducing uncertainty in long-term studies. Biotropica 2018, 50, 455–464. [Google Scholar] [CrossRef]
- Myneni, R.; Knyazikhin, Y.; Park, T. MCD15A2H MODIS/Terra+Aqua Leaf Area Index/FPAR 8-day L4 Global 500m SIN Grid V006. NASA EOSDIS L. Process. DAAC 2015. Available online: http://0-doi-org.brum.beds.ac.uk/10.5067/MODIS/MCD15A3H.006 (accessed on 28 January 2020).
- Knyazikhin, Y.; Glassy, J.; Privette, J.L.; Tian, Y.; Lotsch, A.; Zhang, Y.; Wang, Y.; Morisette, J.T.; Votava, P.; Myneni, R.B.; et al. MODIS Leaf Area Index (LAI) And Fraction Of Photosynthetically Active Radiation Absorbed By Vegetation (FPAR) Product (MOD15) Algorithm Theoretical Basis Document. 1999. Available online: https://modis.gsfc.nasa.gov/data/atbd/atbd_mod15.pdf (accessed on 28 January 2020).
- Wang, Q.; Adiku, S.; Tenhunen, J.; Granier, A. On the relationship of NDVI with leaf area index in a deciduous forest site. Remote Sens. Environ. 2005, 94, 244–255. [Google Scholar] [CrossRef]
- Richardson, A.D. Tracking seasonal rhythms of plants in diverse ecosystems with digital camera imagery. New Phytol. 2019, 222, 1742–1750. [Google Scholar] [CrossRef] [Green Version]
- Alberton, B.; Torres, S.; Cancian, L.F.; Borges, B.D.; Almeida, J.; Mariano, G.C.; Patricia, L.; Morellato, C. Introducing digital cameras to monitor plant phenology in the tropics: Applications for conservation. Perspect. Ecol. Conserv. 2017, 15, 82–90. [Google Scholar] [CrossRef]
- Hunt, E.R.; Doraiswamy, P.C.; McMurtrey, J.E.; Daughtry, C.S.T.; Perry, E.M.; Akhmedov, B. A visible band index for remote sensing leaf chlorophyll content at the Canopy scale. Int. J. Appl. Earth Obs. Geoinf. 2012, 21, 103–112. [Google Scholar] [CrossRef] [Green Version]
- De Moura, Y.M.; Galvão, L.S.; Hilker, T.; Wu, J.; Saleska, S.; do Amaral, C.H.; Nelson, B.W.; Lopes, A.P.; Wiedeman, K.K.; Prohaska, N.; et al. Spectral analysis of amazon canopy phenology during the dry season using a tower hyperspectral camera and modis observations. ISPRS J. Photogramm. Remote Sens. 2017, 131, 52–64. [Google Scholar] [CrossRef]
- Louhaichi, M.; Borman, M.M.; Johnson, D.E. Spatially located platform and aerial photography for documentation of grazing impacts on wheat. Geocarto Int. 2001, 16, 65–70. [Google Scholar] [CrossRef]
- Macfarlane, C.; Ogden, G.N. Automated estimation of foliage cover in forest understorey from digital nadir images. Methods Ecol. Evol. 2012, 3, 405–415. [Google Scholar] [CrossRef]
- Xue, J.; Su, B. Significant remote sensing vegetation indices: A review of developments and applications. J. Sensors 2017, 2017, 1353691. [Google Scholar] [CrossRef] [Green Version]
- Morcillo-Pallarés, P.; Rivera-Caicedo, J.P.; Belda, S.; De Grave, C.; Burriel, H.; Moreno, J.; Verrelst, J. Quantifying the Robustness of Vegetation Indices through Global Sensitivity Analysis of Homogeneous and Forest Leaf-Canopy Radiative Transfer Models. Remote Sens. 2019, 11, 2418. [Google Scholar] [CrossRef] [Green Version]
- Hunt, E.R.; Daughtry, C.S.T.; Eitel, J.U.H.; Long, D.S. Remote sensing leaf chlorophyll content using a visible band index. Agron. J. 2011, 103, 1090–1099. [Google Scholar] [CrossRef] [Green Version]
- Proisy, C.; Mougin, E.; Dufrêne, E.; Dantec, V. Le Monitoring seasonal changes of a mixed temperate forest using ERS SAR observations. IEEE Trans. Geosci. Remote Sens. 2000, 38, 540–552. [Google Scholar] [CrossRef]
- Tanase, M.A.; Villard, L.; Pitar, D.; Apostol, B.; Petrila, M.; Chivulescu, S.; Leca, S.; Borlaf-Mena, I.; Pascu, I.S.; Dobre, A.C.; et al. Synthetic aperture radar sensitivity to forest changes: A simulations-based study for the Romanian forests. Sci. Total Environ. 2019, 689, 1104–1114. [Google Scholar] [CrossRef]
- Ju, J.; Roy, D.P. The availability of cloud-free Landsat ETM+ data over the conterminous United States and globally. Remote Sens. Environ. 2008, 112, 1196–1211. [Google Scholar] [CrossRef]
- Drusch, M.; Del Bello, U.; Carlier, S.; Colin, O.; Fernandez, V.; Gascon, F.; Hoersch, B.; Isola, C.; Laberinti, P.; Martimort, P.; et al. Sentinel-2: ESA’s Optical High-Resolution Mission for GMES Operational Services. Remote Sens. Environ. 2012, 120, 25–36. [Google Scholar] [CrossRef]
- Torres, R.; Snoeij, P.; Geudtner, D.; Bibby, D.; Davidson, M.; Attema, E.; Potin, P.; Rommen, B.Ö.; Floury, N.; Brown, M.; et al. GMES Sentinel-1 mission. Remote Sens. Environ. 2012, 120, 9–24. [Google Scholar] [CrossRef]
- Gorelick, N.; Hancher, M.; Dixon, M.; Ilyushchenko, S.; Thau, D.; Moore, R. Google Earth Engine: Planetary-scale geospatial analysis for everyone. Remote Sens. Environ. 2017, 202, 18–27. [Google Scholar] [CrossRef]
- R Core Team. R: A Language and Environment for Statistical Computing; R Foundation for Statistical Computing: Vienna, Austria, 2019; Available online: https://www.R-project.org/ (accessed on 27 January 2020).
- Kellner, J.R.; Albert, L.P.; Burley, J.T.; Cushman, K.C. The case for remote sensing of individual plants. Am. J. Bot. 2019, 106, 1139–1142. [Google Scholar] [CrossRef] [Green Version]
Figure 1.
Converting point observations to periods of leaf turnover. (A) Leaf senescence and loss events are defined as starting 16 days prior (D-16) to the first observation of leaf senescence or loss and ending 16 days after (D+16) the last observation of the same (in this example, the first and last observations of leaf senescence or loss are the same: Obs.0). (B) Leaf renewal events are defined as starting 16 days prior (D-16) to the first observation of new leaves and ending 16 days after (D+16) the last observation of the same, or 16 to 31 days after (D+16:+31) the last observation of leaf senescence or loss on occasions when new leaves are not directly observed. The colored rectangles indicate the likely periods of either leaf senescence and loss (brown) or leaf renewal (green) calculated in this way.

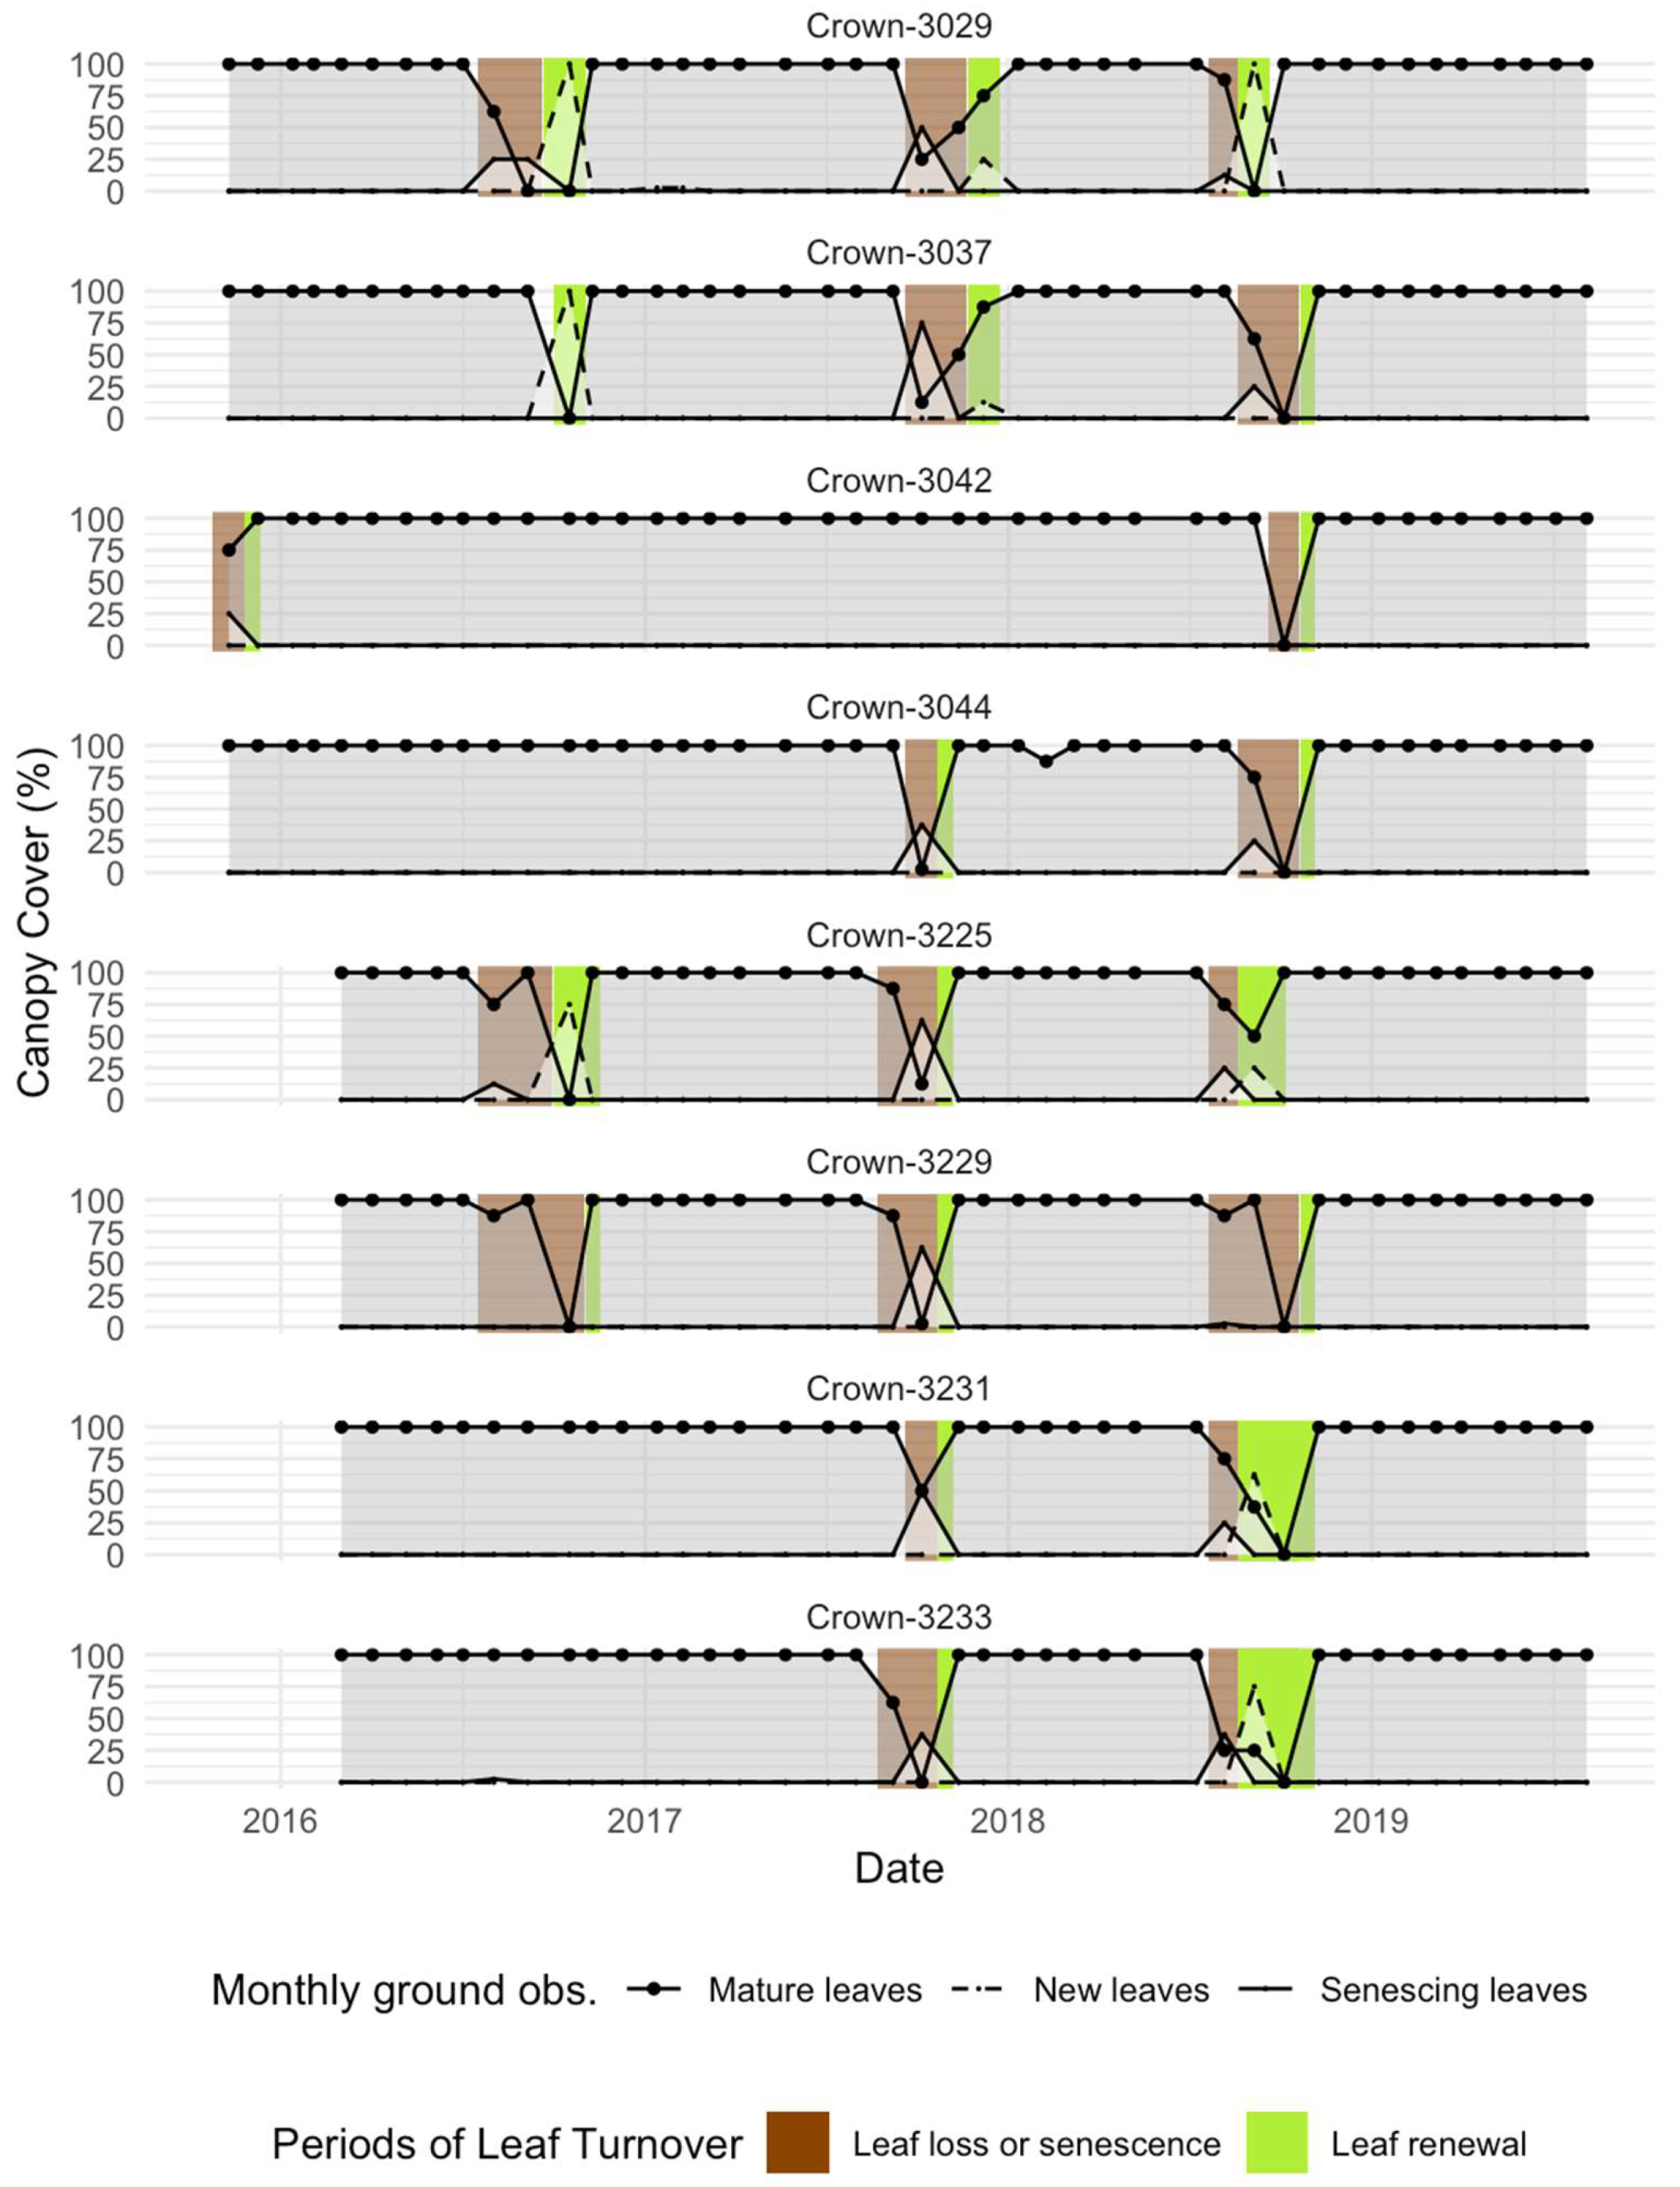
Figure 2.
Ground observations of Moabi leaf turnover at Lopé NP, Gabon (2015-2019). The solid and dashed lines show the scores given for canopy coverage of mature, senescing, and new leaves at each monthly observation. The brown and green rectangles show the likely periods of either leaf senescence and loss (brown rectangles) or leaf renewal (green rectangles) based on the monthly observations as defined in Figure 1.

Figure 3.
Aerial view of eight focal Moabi crowns at Lopé NP, Gabon (small yellow circles) and their 100-m buffers (surrounding yellow circles). (A). Focal Moabi crowns were identified and drawn by hand using GPS coordinates from the ground and high resolution (<2 m pixels) imagery available in the Google Earth™ and Microsoft Bing™ platforms. We delineated forest in a 100-m buffer around the crown boundary of each focal tree, erasing the focal crown and other Moabi crowns contained within the buffer. (B). Tree 3231 is adjacent to two Moabi crowns, which are not part of this study but were excluded from the 3231-forest buffer to avoid signal contamination. (C). Tree 3029 sits at the forest-savanna edge and thus c.a. 58% of the buffer was excluded due to being within the savanna. Background imagery is provided by ESRI World Imagery.

Figure 4.
Detecting leaf senescence and loss using satellite data. Standardized estimates (dots) and 95% confidence intervals (lines) from eight single variate generalized linear mixed models (binomial) for the probability of detecting leaf senescence and loss from focal canopy time series (mean value of all pixels within canopy) and normalized canopy time series (difference between the mean value of all pixels within the canopy and the mean value of all pixels in the surrounding forest buffer) of the VV and VH bands of the Sentinel-1 synthetic aperture radar (SAR) data and the normalized difference vegetation index (NDVI) and the green leaf index (GLI) derived from Sentinel-2 optical data. Mixed models included tree ID and year as random effects.

Figure 5.
Predicted relationship between Sentinel-2 normalized difference vegetation index (NDVI) canopy deviation and ground observations of Moabi leaf senescence and loss. The solid line shows the fixed effect prediction from the generalized linear mixed model (binomial), the grey ribbon shows the 95% confidence intervals of the prediction, and the translucent dots show the raw data, binned in intervals along the x-axis. The mixed model included tree ID and year as random effects.

Figure 6.
Detecting new leaves using satellite data. Standardized estimates (dots) and 95% confidence intervals (lines) from two separate generalized linear mixed models (binomial) of the probability of detecting new leaves using the Sentinel-2 data. The normalized difference vegetation index (NDVI) and the green leaf index (GLI) are derived indices from optical data from Sentinel-2. Mixed models included tree ID and year as random effects.

Figure 7.
Predicted relationship between Sentinel-2 green leaf index (GLI) canopy deviation and ground observations of Moabi leaf renewal. The solid line shows the fixed effect prediction from the generalized linear mixed model (binomial), the grey ribbon shows the 95% confidence intervals of the prediction, and the translucent dots show the raw data, binned in intervals along the x-axis. Mixed models included tree ID and year as random effects.

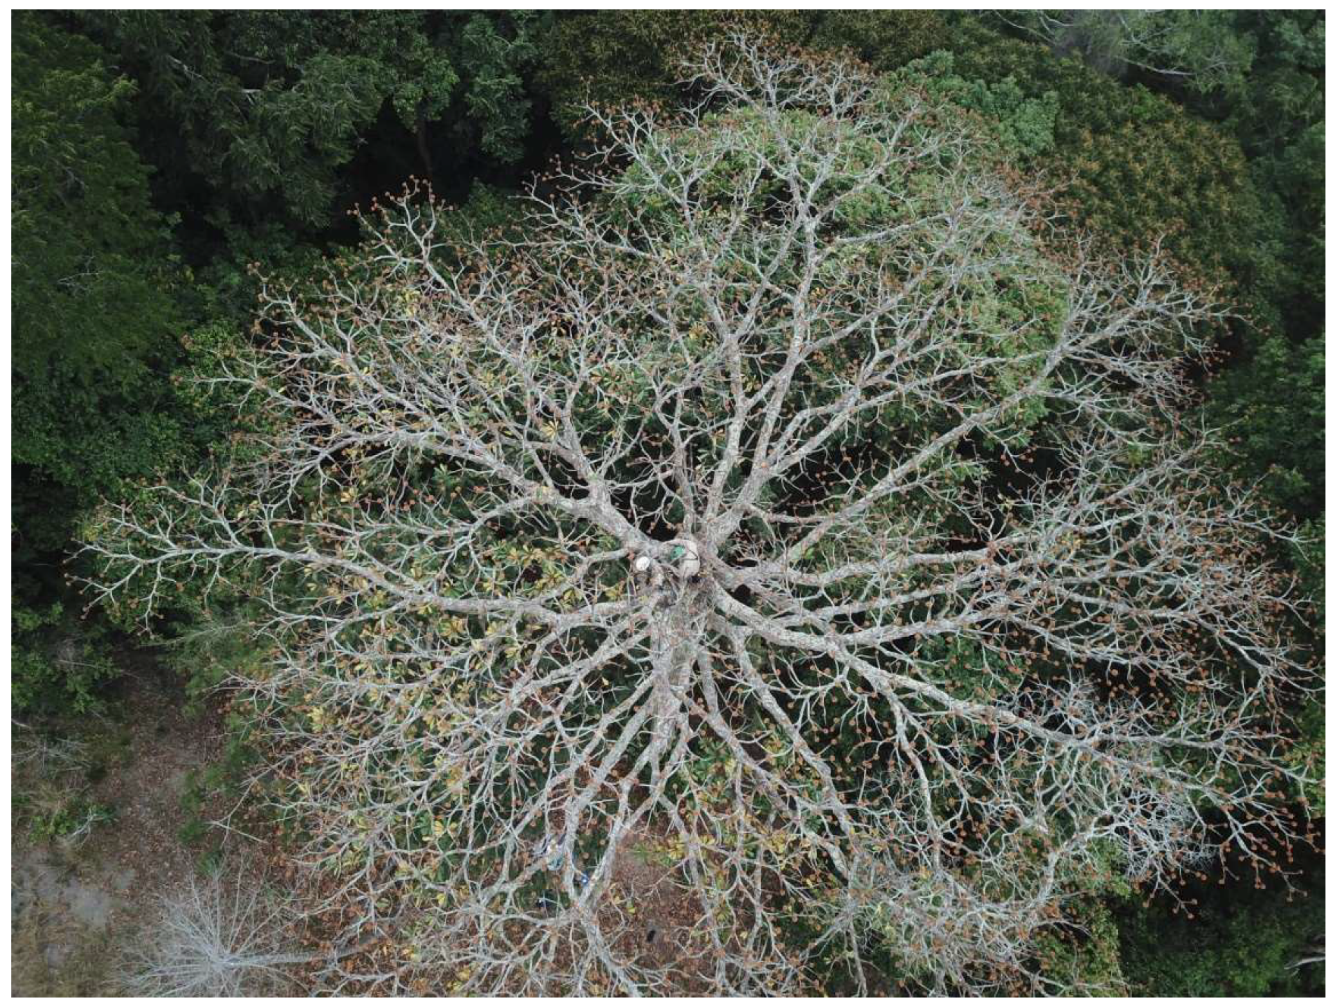
Figure 8.
A recent close-range aerial image of a defoliated Moabi crown at Lopé National Park. Photo by David Lehmann.
Figure 8.
A recent close-range aerial image of a defoliated Moabi crown at Lopé National Park. Photo by David Lehmann.


Table 1.
Summary satellite data for eight focal Moabi crowns at Lopé NP. This table shows the overall mean (and standard deviation) of all crown-level means per satellite data source. Satellite data were sourced from the VV and VH synthetic aperture radar (SAR) bands of Sentinel-1 and from the normalized difference vegetation index (NDVI) and the green leaf index (GLI) derived from Sentinel-2. ‘Canopy timeseries’ refers to the mean values extracted for each focal crown at each time step, ‘buffer time series’ refers to the mean values in the forest buffer surrounding each focal crown at each time step, and ‘normalized canopy time series’ refers to the difference between the canopy and buffer values.
| Data | Obs. | Canopy Time Series | Buffer Time Series | Normalized Canopy Time Series |
|---|---|---|---|---|
| Sentinel-1 VV | 837 | 0.18 (0.07) | 0.22 (0.04) | –0.04 (0.07) |
| Sentinel-1 VH | 837 | 0.04 (0.02) | 0.05 (0.01) | –0.01 (0.02) |
| Sentinel-2 NDVI | 477 | 0.44 (0.19) | 0.43 (0.18) | 0 (0.04) |
| Sentinel-2 GLI | 477 | 0.02 (0.03) | 0.01 (0.02) | 0 (0.01) |
Note: Obs. = number of observations.
Table 2.
Detecting leaf senescence and loss in Moabi crowns at Lopé NP, Gabon using satellite data. Model estimates are derived from eight single variate generalized linear mixed models (binomial) for the probability of detecting leaf senescence and loss events from focal canopy time series (mean value of all pixels within canopy) and normalized canopy time series (difference between the mean value of all pixels within the canopy and the mean value of all pixels in the surrounding forest buffer) of the VV and VH bands of the Sentinel-1 synthetic aperture radar (SAR) data and the normalized difference vegetation index (NDVI) and the green leaf index (GLI) derived from Sentinel-2 optical data. Mixed models included tree ID and year as random effects.
| Model | Predictor | Est. | SE | Z | P |
|---|---|---|---|---|---|
| 1 | VV (canopy) | 0.04 | 0.15 | 0.29 | 0.77 |
| 2 | VV (normalized canopy) | 0.08 | 0.16 | 0.47 | 0.64 |
| 3 | VH (canopy) | −0.22 | 0.14 | −1.62 | 0.10 |
| 4 | VH (normalized canopy) | −0.14 | 0.14 | −0.98 | 0.33 |
| 5 | NDVI (canopy) | −0.27 | 0.15 | −1.76 | 0.08 |
| 6 | NDVI (normalized canopy) | −0.76 | 0.16 | −4.77 | <0.01 |
| 7 | GLI (canopy) | −0.37 | 0.18 | −2.01 | 0.04 |
| 8 | GLI (normalized canopy) | −0.56 | 0.22 | −2.58 | 0.01 |
Note: Est. = estimate; SE = standard error; Z = Z statistic, P = p value.
Table 3.
Detecting leaf renewal in Moabi crowns at Lopé NP, Gabon using satellite data. Model estimates are derived from eight single variate generalized linear mixed models (binomial) for the probability of detecting leaf renewal from focal canopy time series (the mean value of all pixels within the canopy) and normalized canopy time series (the difference between the mean value of all pixels within the canopy and the mean value of all pixels in the surrounding forest buffer) of the normalized difference vegetation index (NDVI) and the green leaf index (GLI) derived from Sentinel-2 optical data. Mixed models included tree ID and year as random effects.
| Model | Predictor | Est. | SE | Z | P |
|---|---|---|---|---|---|
| 9 | NDVI (canopy) | 0.27 | 0.18 | 1.50 | 0.13 |
| 10 | NDVI (normalized canopy) | 0.28 | 0.16 | 1.78 | 0.08 |
| 11 | GLI (canopy) | 0.31 | 0.16 | 1.90 | 0.06 |
| 12 | GLI (normalized canopy) | 0.32 | 0.15 | 2.06 | 0.04 |
Note: Est. = estimate; SE = standard error; Z = Z statistic, P = p value.
© 2020 by the authors. Licensee MDPI, Basel, Switzerland. This article is an open access article distributed under the terms and conditions of the Creative Commons Attribution (CC BY) license (http://creativecommons.org/licenses/by/4.0/).
Share and Cite
MDPI and ACS Style
Bush, E.R.; Mitchard, E.T.A.; Silva, T.S.F.; Dimoto, E.; Dimbonda, P.; Makaga, L.; Abernethy, K. Monitoring Mega-Crown Leaf Turnover from Space. Remote Sens. 2020, 12, 429. https://0-doi-org.brum.beds.ac.uk/10.3390/rs12030429
AMA Style
Bush ER, Mitchard ETA, Silva TSF, Dimoto E, Dimbonda P, Makaga L, Abernethy K. Monitoring Mega-Crown Leaf Turnover from Space. Remote Sensing. 2020; 12(3):429. https://0-doi-org.brum.beds.ac.uk/10.3390/rs12030429
Chicago/Turabian StyleBush, Emma R., Edward T. A. Mitchard, Thiago S. F. Silva, Edmond Dimoto, Pacôme Dimbonda, Loïc Makaga, and Katharine Abernethy. 2020. "Monitoring Mega-Crown Leaf Turnover from Space" Remote Sensing 12, no. 3: 429. https://0-doi-org.brum.beds.ac.uk/10.3390/rs12030429
Note that from the first issue of 2016, this journal uses article numbers instead of page numbers. See further details here.