1. Introduction
The potential of thermal and near infrared (NIR) imagery to reveal otherwise invisible archaeological features has been well known to researchers for several decades [
1,
2,
3,
4,
5,
6]. However, the cost of collecting thermal and multi-spectral NIR data has generally been prohibitive while the spatial resolution of aircraft or satellite-acquired imagery is generally too coarse to reveal many archaeological features. Recent advances in thermal and multi-spectral sensor technology, dramatic improvements in the sophistication of commercial drones, and the development of powerful mission planning and photogrammetric image processing software have collectively revolutionized our ability to deploy thermal and multi-spectral imagery as an archaeological remote sensing tool [
7,
8,
9,
10,
11]. Enabling researchers to collect high-resolution imagery over vast areas at very low-cost, this suite of technologies offers a powerful complement to conventional terrestrial geophysics or aerial imagery analysis, and a potentially transformative approach to explore archaeological landscapes.
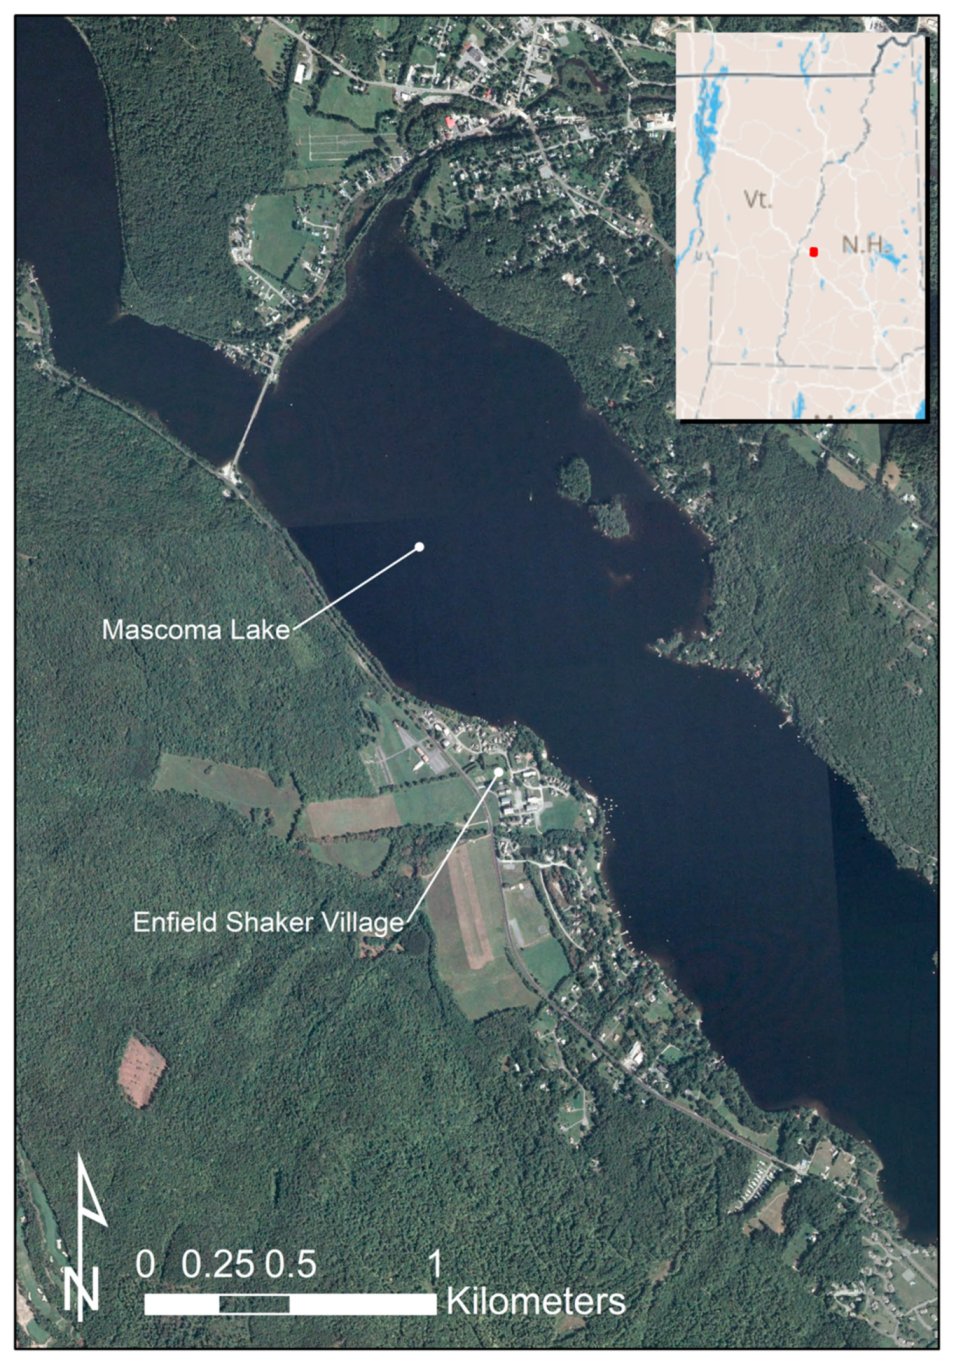
Over the past few years, a new generation of drone-optimized radiometric thermal cameras as well as visible and near infrared (NIR) multi-spectral sensors have become available, offering promising but still largely untested opportunities to further advance the emerging field of drone-based multi-spectral, multi-sensor aerial archaeological imaging. This paper presents results of a study undertaken at the Enfield Shaker Village (New Hampshire, USA;
Figure 1) that was designed to explore the possibilities, as well as the contextual and environmental limitations, of multi-spectral and thermal surveys using these relatively new sensor technologies. Because the Enfield Shaker Village site has significant extant documentation of potentially visible buried features (in this case, historic building foundations) and could be repeatedly surveyed under varying environmental and ground cover conditions, it offers a good test case to compare aerial thermal and multi-spectral imaging results with terrestrial ground-penetrating radar and magnetic gradiometry, as well as with results of ongoing excavations. This paper discusses methods for processing imagery acquired from new drone-optimized sensors, highlights novel approaches for quantitative, raster-based analysis of imagery, and investigates the effect of some environmental variables on feature detectability.
Study Site Background
The Enfield Shaker Village, in Enfield, New Hampshire, USA, is a historic village established by the Shaker religious community in 1793 [
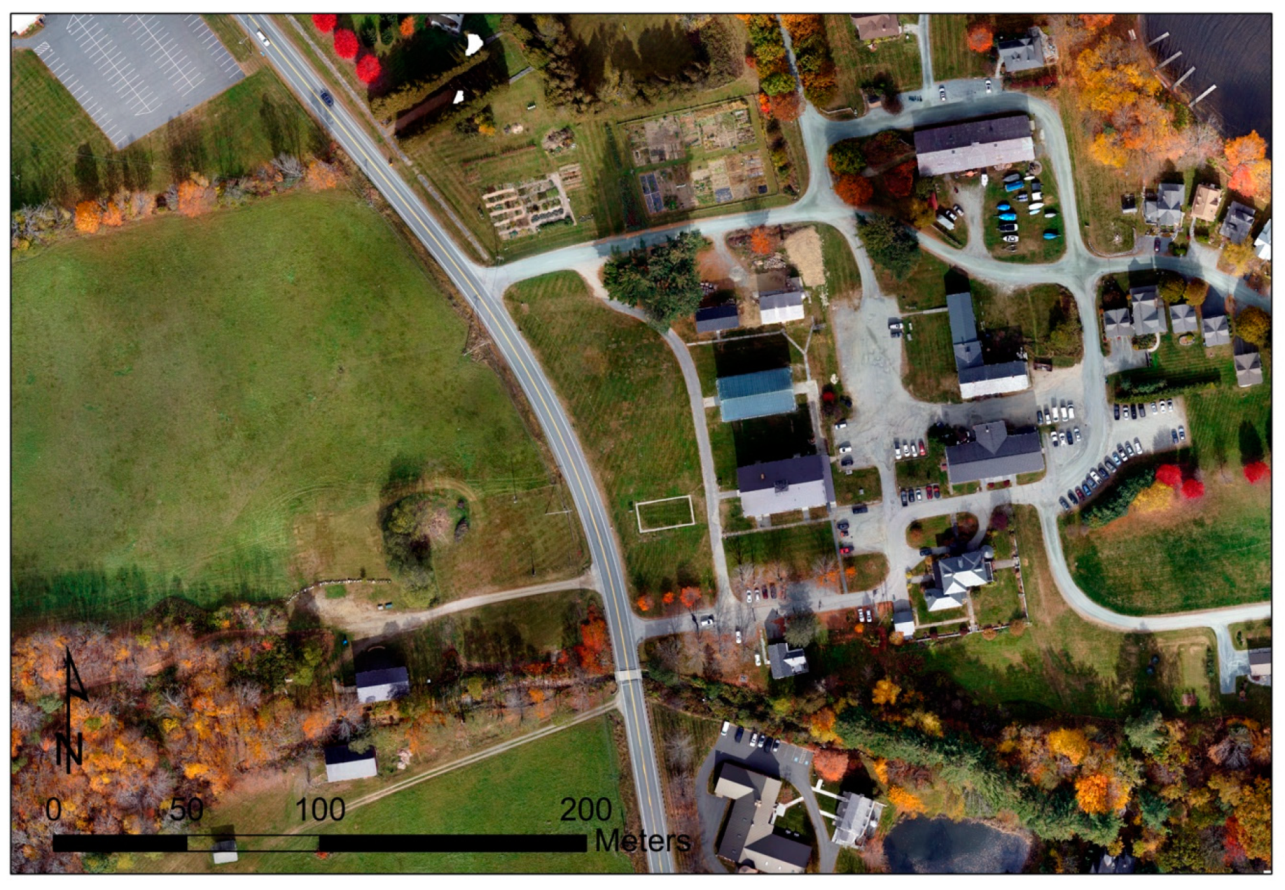
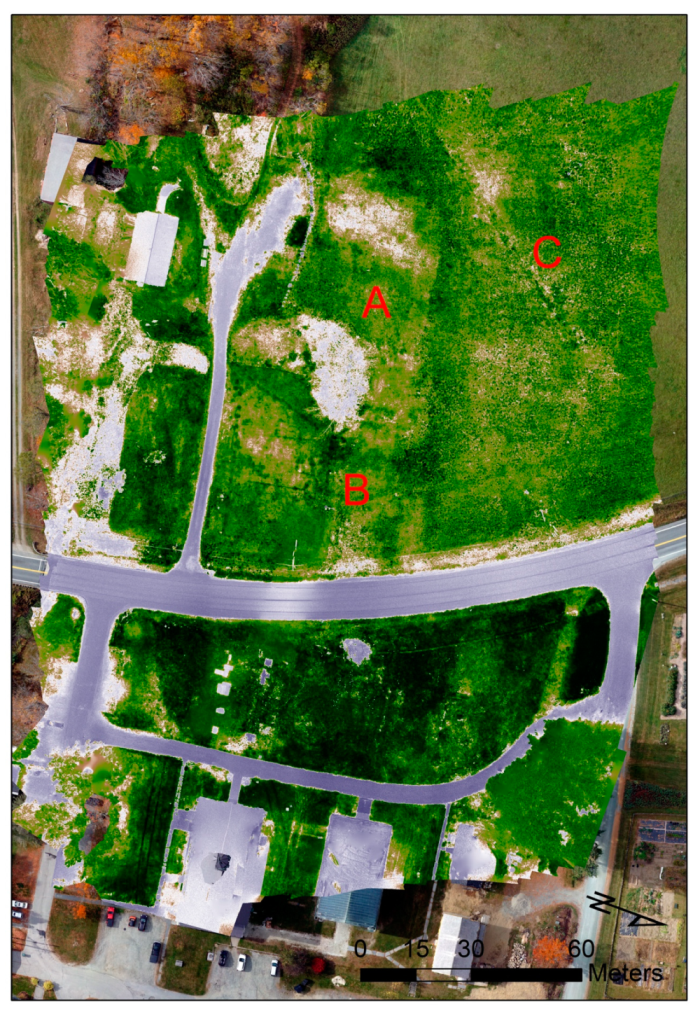
12]. At its peak in the mid-nineteenth century, it was one of the largest Shaker settlements in New England, with more than 300 residents and dozens of buildings spread across an area of approximately 10 hectares (
Figure 2). Like many Shaker communities in New England, the Enfield Shaker Village declined in size gradually through the late nineteenth and early twentieth centuries and was ultimately abandoned in 1923 when the last remaining members of the religious community moved to nearby Canterbury, NH. After that time, many of the historic buildings were sold, dismantled, or razed, but several significant buildings, including the “Great Stone Dwelling” erected in 1817 (the tallest building north of Boston for much of the nineteenth century), were left standing. Today, the Great Stone Dwelling serves as a museum and visitor center, and several of the other remaining buildings have been restored as part of a New Hampshire State Historic Park. Fortunately, a rich collection of historic maps, photographs, and written records reveals the location of many buildings that were once located on the site, and while some of them are in areas now covered by modern houses to the east of the Great Stone Dwelling, the lawn and grassy fields to the west are largely undisturbed. The lawn once contained several Shaker buildings, including a house, a barn, and an administrative building, while the fields on the west of the road were home to a blacksmith shop, stables, workshops, and other houses. An archaeological excavation project, undertaken as part of a Plymouth State University field school since 2015, has uncovered portions of several buildings and a host of Shaker period artifacts [
13]. Research presented herein was undertaken in collaboration with the Enfield Shaker Village Museum as part of a larger project funded by the Neukom Institute at Dartmouth College and the National Endowment for the Humanities Office of the Digital Humanities, with periodic surveys from October 2016 to October 2017.
2. Materials and Methods
2.1. Fieldwork Methods
A major goal of this research is to help understand temperature fluctuations across the diurnal cycle, a critical factor affecting archaeological visibility [
7,
8]. In order to investigate the effects of diurnal temperature change, long-term temperature flux, soil moisture, and other related environmental variables on archaeological visibility in aerial thermal imagery, we undertook repeated drone surveys at the Enfield Shaker Village across a range of seasonal and temperature conditions, visiting the site on 7 different occasions to complete 15 aerial surveys (see
Table 1). All mapping flights were programmed and run via a third-party application (Pix4d Capture) for autonomous survey grid missions, in order to collect image sets with pre-calculated overlap and crosslap for photogrammetric post-processing. Flights with the FLIR Vue Pro R mounted (see discussion below) mounted on either a 3DR Solo or DJI Phantom 4 pro, either covered just the small area in front of the “Great Stone Dwelling” (approximately 130 × 40 m) at 30 m elevation or both the lawn area and a portion of the field across the street (approximately 180 × 180 m) at 60 m. Since all flights were recorded at one of two altitudes, the ground sample distance of the thermal images remained fairly constant at either ~4 cm (30 m) or ~8 cm (60 m). Visible light images were also recorded using a DJI Phantom 3 and Tuffwing UAV fixed wing drone. The Phantom 3 flights covered only the area surveyed by the thermal and terrestrial survey, while the fixed wing drone was flown at a higher altitude (90 m) over a wide area in order to get a high resolution basemap of the entire village (approximately 700 × 300 m at 2 cm ground resolution). Multi-spectral flights were recorded with the Parrot Sequoia mounted to both the 3dr Solo and fixed wing drone. Flights with the Solo were at recorded at 50 m altitude for a ground resolution of 4.7 cm and on the fixed wing at 90 m for a ground resolution of 8 cm.
In order to accurately georeference the image sets recorded by the different sensors, Ground Control Points (GCPs) were placed across the site before every flight and recorded using either a Total Station or a Real-time Kinematic Global Navigation Satellite System (RTK GNSS) survey instrument, in this case a pair of Emlid Reach RS units [
14]. For visible and multi-spectral mapping these targets consisted of printed paper targets that could be easily identified in the resulting imagery. For thermal data, the GCPs consisted of aluminum sheeting cut in the shape of an “X” which show up clearly as much cooler objects in the thermal imagery, due to differences in emissivity with the surrounding ground [
8]. Additionally, some flights included post processed kinematic (PPK) image geotags for additional spatial accuracy checks [
15].
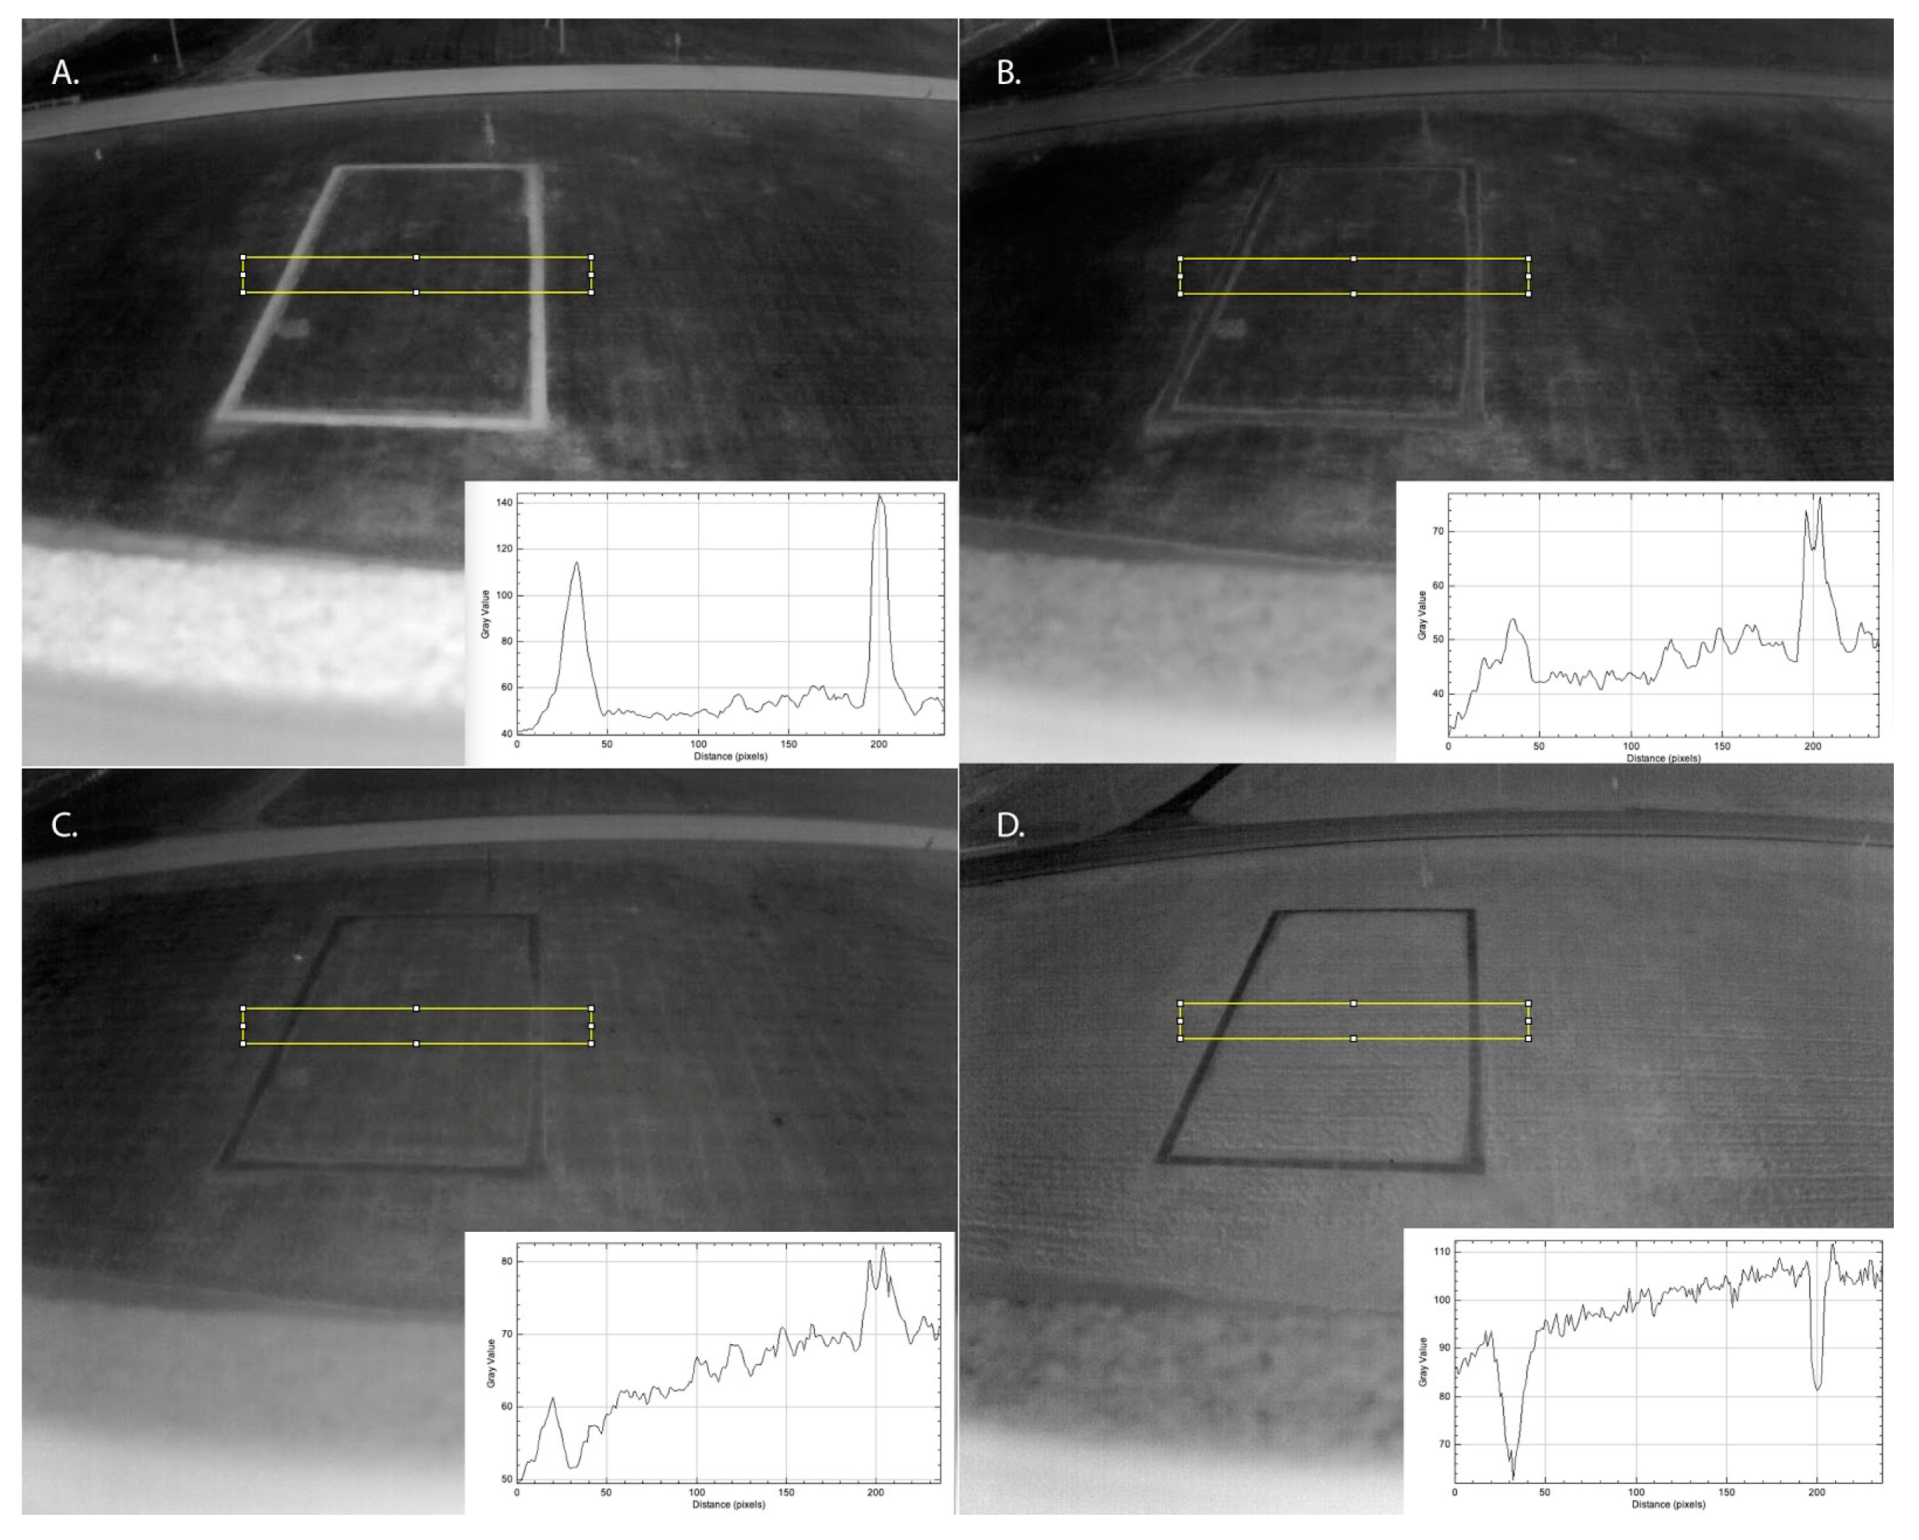
Although thermal data were recorded via drone across several nights and many temperature conditions, each flight only gives a brief window into the temperature fluctuations on the ground. To provide an additional perspective on changing surface temperatures, we mounted the FLIR Vue Pro R thermal camera on a small tripod on a 6th story window of the “Great Stone Dwelling” at the site. The camera was pointed toward one of the known features (the former administrative building foundation) and set on intervalometer mode to record an image every 20 s. The intervalometer was run during a late fall afternoon, 16 October 2018, from 4:31 p.m. to 9:40 a.m., collecting thermal data across an entire night. The temperature when the recording began was 53 °F, sunset was at 6:04 p.m., and sunrise the following day was at 7:05 a.m. Even though images from a single viewpoint could not be processed photogrammetrically, the resulting 3000+ images were converted into a time lapse video in order to visualize how the visibility of archaeological features changed with fluctuations in temperature and relative humidity. We analyzed the resulting dataset in FIJI/ImageJ software to document changing temperature profiles for particular areas of interest, such as the boundary between the buried foundation, surface features, and the surrounding soil.
2.2. Drones
The last decade has seen drones move from a relatively obscure and experimental device to a nearly ubiquitous tool that forms an essential part of many archaeological projects’ recording strategies [
16,
17,
18]. Archaeologists commonly use drones as cost-effective tools for producing oblique aerial photography, spatially accurate 3D models, and orthoimagery of excavations, sites, and landscapes. Although most archaeological implementations of drones utilize traditional visible-light cameras, many UAV systems are easily adapted to alternative sensor packages. For this project, we used both a 3DR Solo quadcopter and DJI Phantom 4 Pro for thermal and multi-spectral imaging. The Flir Vue Pro R was mounted to the 3dr Solo via a custom gimble, capable of passing GPS location data from the flight control computer on the 3dr Solo to the Vue Pro R to be written as Exif data. On the Phantom 4 pro, the Flir Vue pro was attached to a custom 3d printed fixed mount, received GPS geotag data from an external GPS Geotagger, and was powered directly from the drone. Missions were programmed via the Pix4Dcapture app, which allows simple rectangular survey grids to be captured easily. In addition to surveys using the Vue Pro R, several flights were also performed with the Parrot Sequoia multi-spectral camera mounted via a fixed nadir mount. Visible light missions were flown with a DJI Phantom 3 as well as a Tuffwing UAVmapper fixed wing drone carrying a Sony a6000 camera with a 16 mm lens [
15]. Survey flights were flown at 40 m, 60 m or 90 m depending on the size of the area to be covered by each flight.
2.3. Thermal Imaging
One of the main limitations on archaeological applications for aerial thermography in the past was the large size and high cost of thermal cameras, often requiring full-scale aircraft to take them aloft and producing low-resolution analogue imagery [
1,
2]. The development of small, lightweight, uncooled thermal cameras enabled them to be fitted to drones and flown closer to the ground and under a wide range of weather conditions [
7]. In the most recent generation of thermal cameras, companies like FLIR have begun producing thermal imaging systems specifically designed for incorporation into drone platforms. In this study, all thermal surveys were accomplished using the FLIR Vue Pro R, a drone-optimized camera system that records radiometric 14-bit still images. The Vue Pro R uses an uncooled microbolometer with a resolution of 640 × 512 pixels and a spectral band of 7.5–13.5 µm. The camera is powered directly by the drone, can be mounted on 3rd party gimbals to enable stabilization, can receive and record GPS position information from the drone as Exif info on each thermal image, and can record radiometric images in 14 bit tiff format or proprietary radiometric JPG format directly to an onboard SD card.
A second key improvement seen in the latest generation of drone-optimized thermal cameras is in their ability to record full spectrum radiometric imagery. Previous generations of thermal cameras had built-in automatic gain control (AGC), such that the camera would evaluate the total range of thermal values present in each image, and then process the image using a lookup table (LUT) to output an 8-bit (256 value) image. This presented problems for archaeological applications for a number of reasons. First, photogrammetry software, like Photoscan Pro and Pix4D, struggle to align images if adjacent images have wildly different exposure values due to AGC fluctuations. Second, the presence of features with high or low relative temperature will cause AGC processing to mask any subtle variation between warmer and cooler soil temperatures that might indicate buried archaeological features. For instance, the presence of a warm asphalt road surface will drive up the total range of temperature values in an image and might force all of the pixels that contain soil around the asphalt to be rendered as the same 8-bit value. New radiometric thermal cameras like the FLIR Vue Pro-R used in this study instead record a 14-bit image (16,384 values), in which the pixel value of any point in the image will be independent of all of the other temperature values in the same image, ostensibly recording the true thermal radiance value of that point on the ground.
Radiometric thermal cameras, however, can still suffer from problems with thermal drift. Most currently available thermal cameras for drones utilize uncooled bolometer cores. The radiometric data recorded from such sensors tend to drift over time due to several factors, including temperature fluctuations of the sensor [
19]. The effect of this drift is often not visible in non-radiometric camera data, as it is likely masked by the application of the automatic gain control to counteract this drift, the camera will automatically and periodically perform a “Flat-Field Correction (FFC)” in which a uniform temperature shutter is placed in front of the sensor, and new corrections are applied to the images. In practice, this means that the apparent temperature of the ground can drift slowly over the course of a flight and then change suddenly when the FFC events occur. It is possible to turn off the FFC events, to ensure that they do not create sudden changes in apparent temperature, but this will not eliminate the underlying problem of apparent temperature drift. One way to mitigate this problem is to let the camera adjust to prevailing temperatures for a significant length of time before recording data. Berni et al. [
19], for instance, found that their older FLIR thermal camera would drift less if it was allowed to adjust to ambient temperatures for up to an hour after it was switched on. Unfortunately, though, it is likely impossible to keep the camera temperature from fluctuating in real fieldwork conditions, due to the effect of flying the camera at altitudes and temperatures different from those on the ground and placing the camera in the downwash from the drone propellers.
However, since the goal of archaeological thermal survey is to identify buried archaeological features by the local difference in surface temperature relative to the immediately surrounding soil, slow drift of the apparent surface temperature is more annoying than prohibitive. The actual temperature of the ground is less important than our ability to resolve subtle local temperature differences. While it is true that sufficient temperature drifts can tend to mask portions of a survey area, this drift can be removed in post-processing to keep the apparent general temperature of the ground even throughout the survey area (see below). Similarly, the emissivity of the ground must be established (and entered into the camera) for the observed temperatures to match the real-world temperature. Emissivity is likely to change across time as soil moisture content changes. If we wanted to ensure true temperature measurements, we would need to establish the emissivity of the ground for each drone observation by establishing the temperature of the ground and adjusting the emissivity parameter in the camera until the correct temperature was displayed. However, since we were primarily interested in relative measurements, and wanted to be as efficient in the field as possible, we did not measure ground temperatures directly, and utilized a consistent emissivity parameter meant to approximate dry ground (.90) for all flights.
2.4. Multi-Spectral NIR Imaging
Although the value for archaeological survey of near infrared imagery and near infrared-derived vegetation indices such as NDVI (Normalized Difference Vegetation Index), has long been known and applied to satellite imagery [
20,
21,
22] a new generation of affordable, lightweight near infrared sensors designed for low elevation drone-based imaging have recently become available. While archaeologists wishing to record low-elevation, multi-spectral data had previously been limited to custom modified visible light cameras [
23,
24], recently developed specialized multi-spectral sensors like the MicaSense RedEdge series, the Parrot Sequoia, the Sentera Quad Sensor, the Mapir Kernel, and the Slantrange 3p can now record individual spectral bands as separate images and are specifically designed for integration with commercial drones. Cheaper commercial multi-spectral options exist as well, like the Mapir Survey 3 and Agrocam Geo NDVI, which are more similar to the older DIY options and record multiple spectral bands on a single RGB (red, green, blue) sensor that has been specially filtered to record narrower bands that include the near infrared.
In this study we use a Parrot Sequoia to record the survey area from 30, 60, and 90 m altitudes. The Sequoia cam records Green (530–570 nm), Red (640–680 nm), Red Edge (730–740 nm), and Near Infrared (770–810 nm) spectral bands as separate images, along with a traditional RGB sensor recording visible light images simultaneously with the individual spectral band images. We found the RGB sensor on the Parrot Sequoia is particularly unsuitable for photogrammetry, as it suffers from significant “rolling shutter” effects, but individual spectral band images can be used to create false color, NDVI or other image products effectively. The Sequoia also records information about the amount of light falling on the current scene via a sunshine sensor, written as Exif information on the images, and thus can be used to calibrate the resulting NDVI values.
2.5. Terrestrial Geophysics
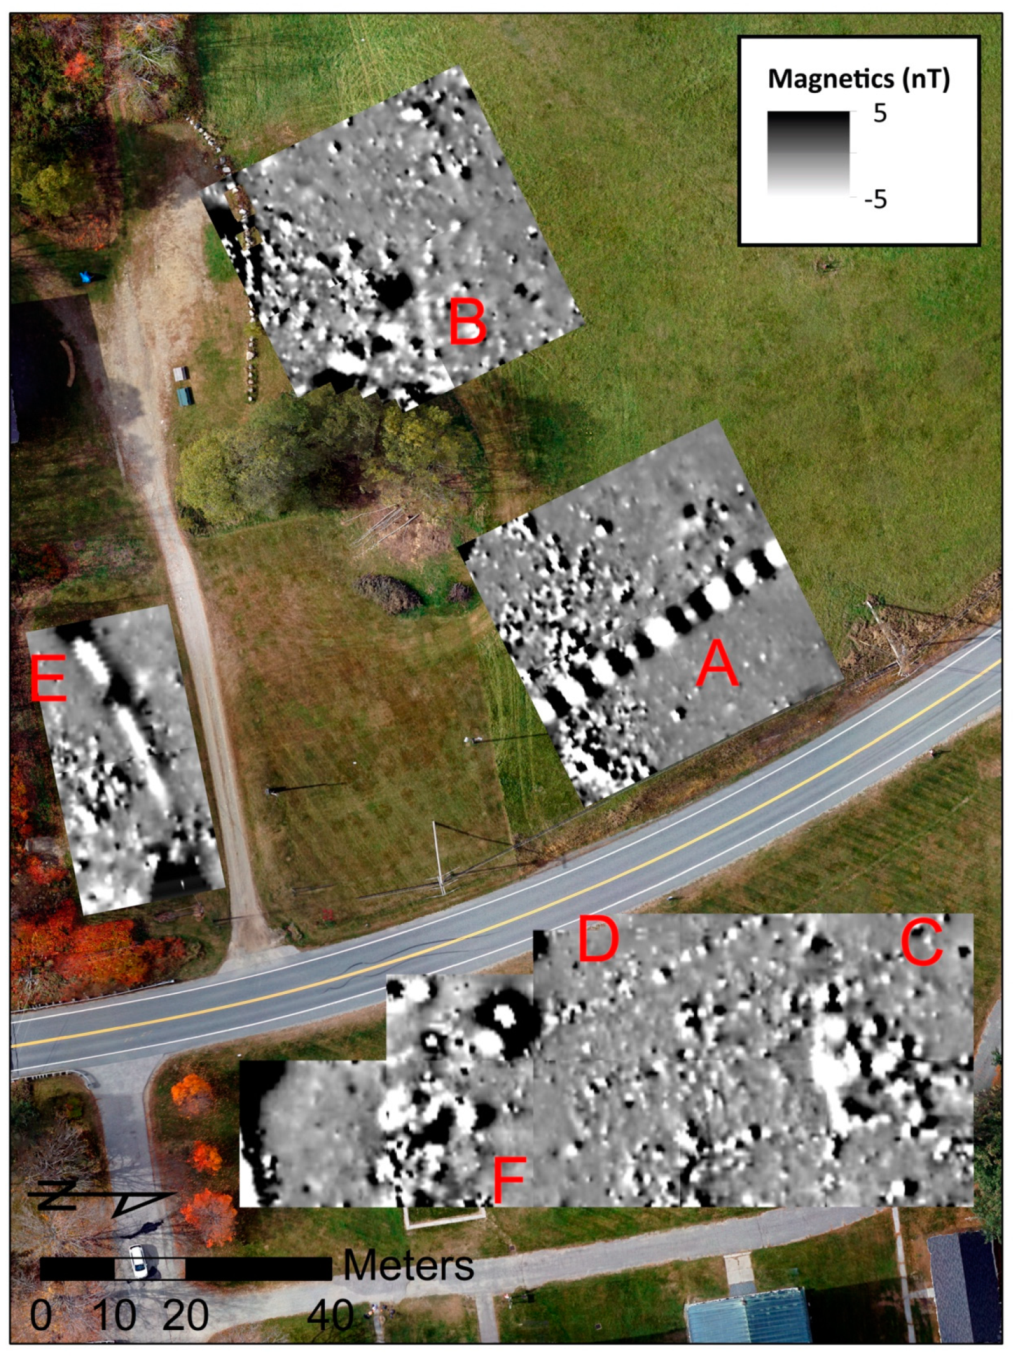
Remote sensing via drone, using thermal and multi-spectral data, can cover a much wider area, more rapidly, than traditional terrestrial geophysical methods. However, as discussed below, there are significant constraints on where and when these methods might identify buried features. For this survey we wanted to be able to compare the visibility of known buried features in thermal and multi-spectral data to the visibility of the same features using more traditional terrestrial geophysics. Magnetometry was collected using a Bartington Grad 601-2 magnetic gradiometer in 20 m2 grids with a 0.5 m zig-zag transect pattern at 8 samples per meter. These data were processed for display using the open source software ArchaeoFusion. Ground Penetrating Radar (GPR) data were collected using a GSSI UtilityScan system configured with a 350 MHz frequency digital antenna. Surveys were undertaken in the same 20 × 20 m grid system as magnetic data also using bi-directional survey at 0.5 m intervals, and data were processed using RADAN software from GSSI. Grids for the geophysical survey were laid out with the same tools used for GCP recording (a combination of total station and GNSS survey instruments) which ensured that the geophysical results could be accurately compared to the drone-derived data.
2.6. Post Processing
All drone flights produced sets of overlapping images of either thermal, multi-spectral, or visible light images. All image sets were combined with terrestrial GCP data, and processed using Photoscan Pro software to create orthophotos and digital elevation models (DEMs) that could be further manipulated in ESRI ArcGIS.
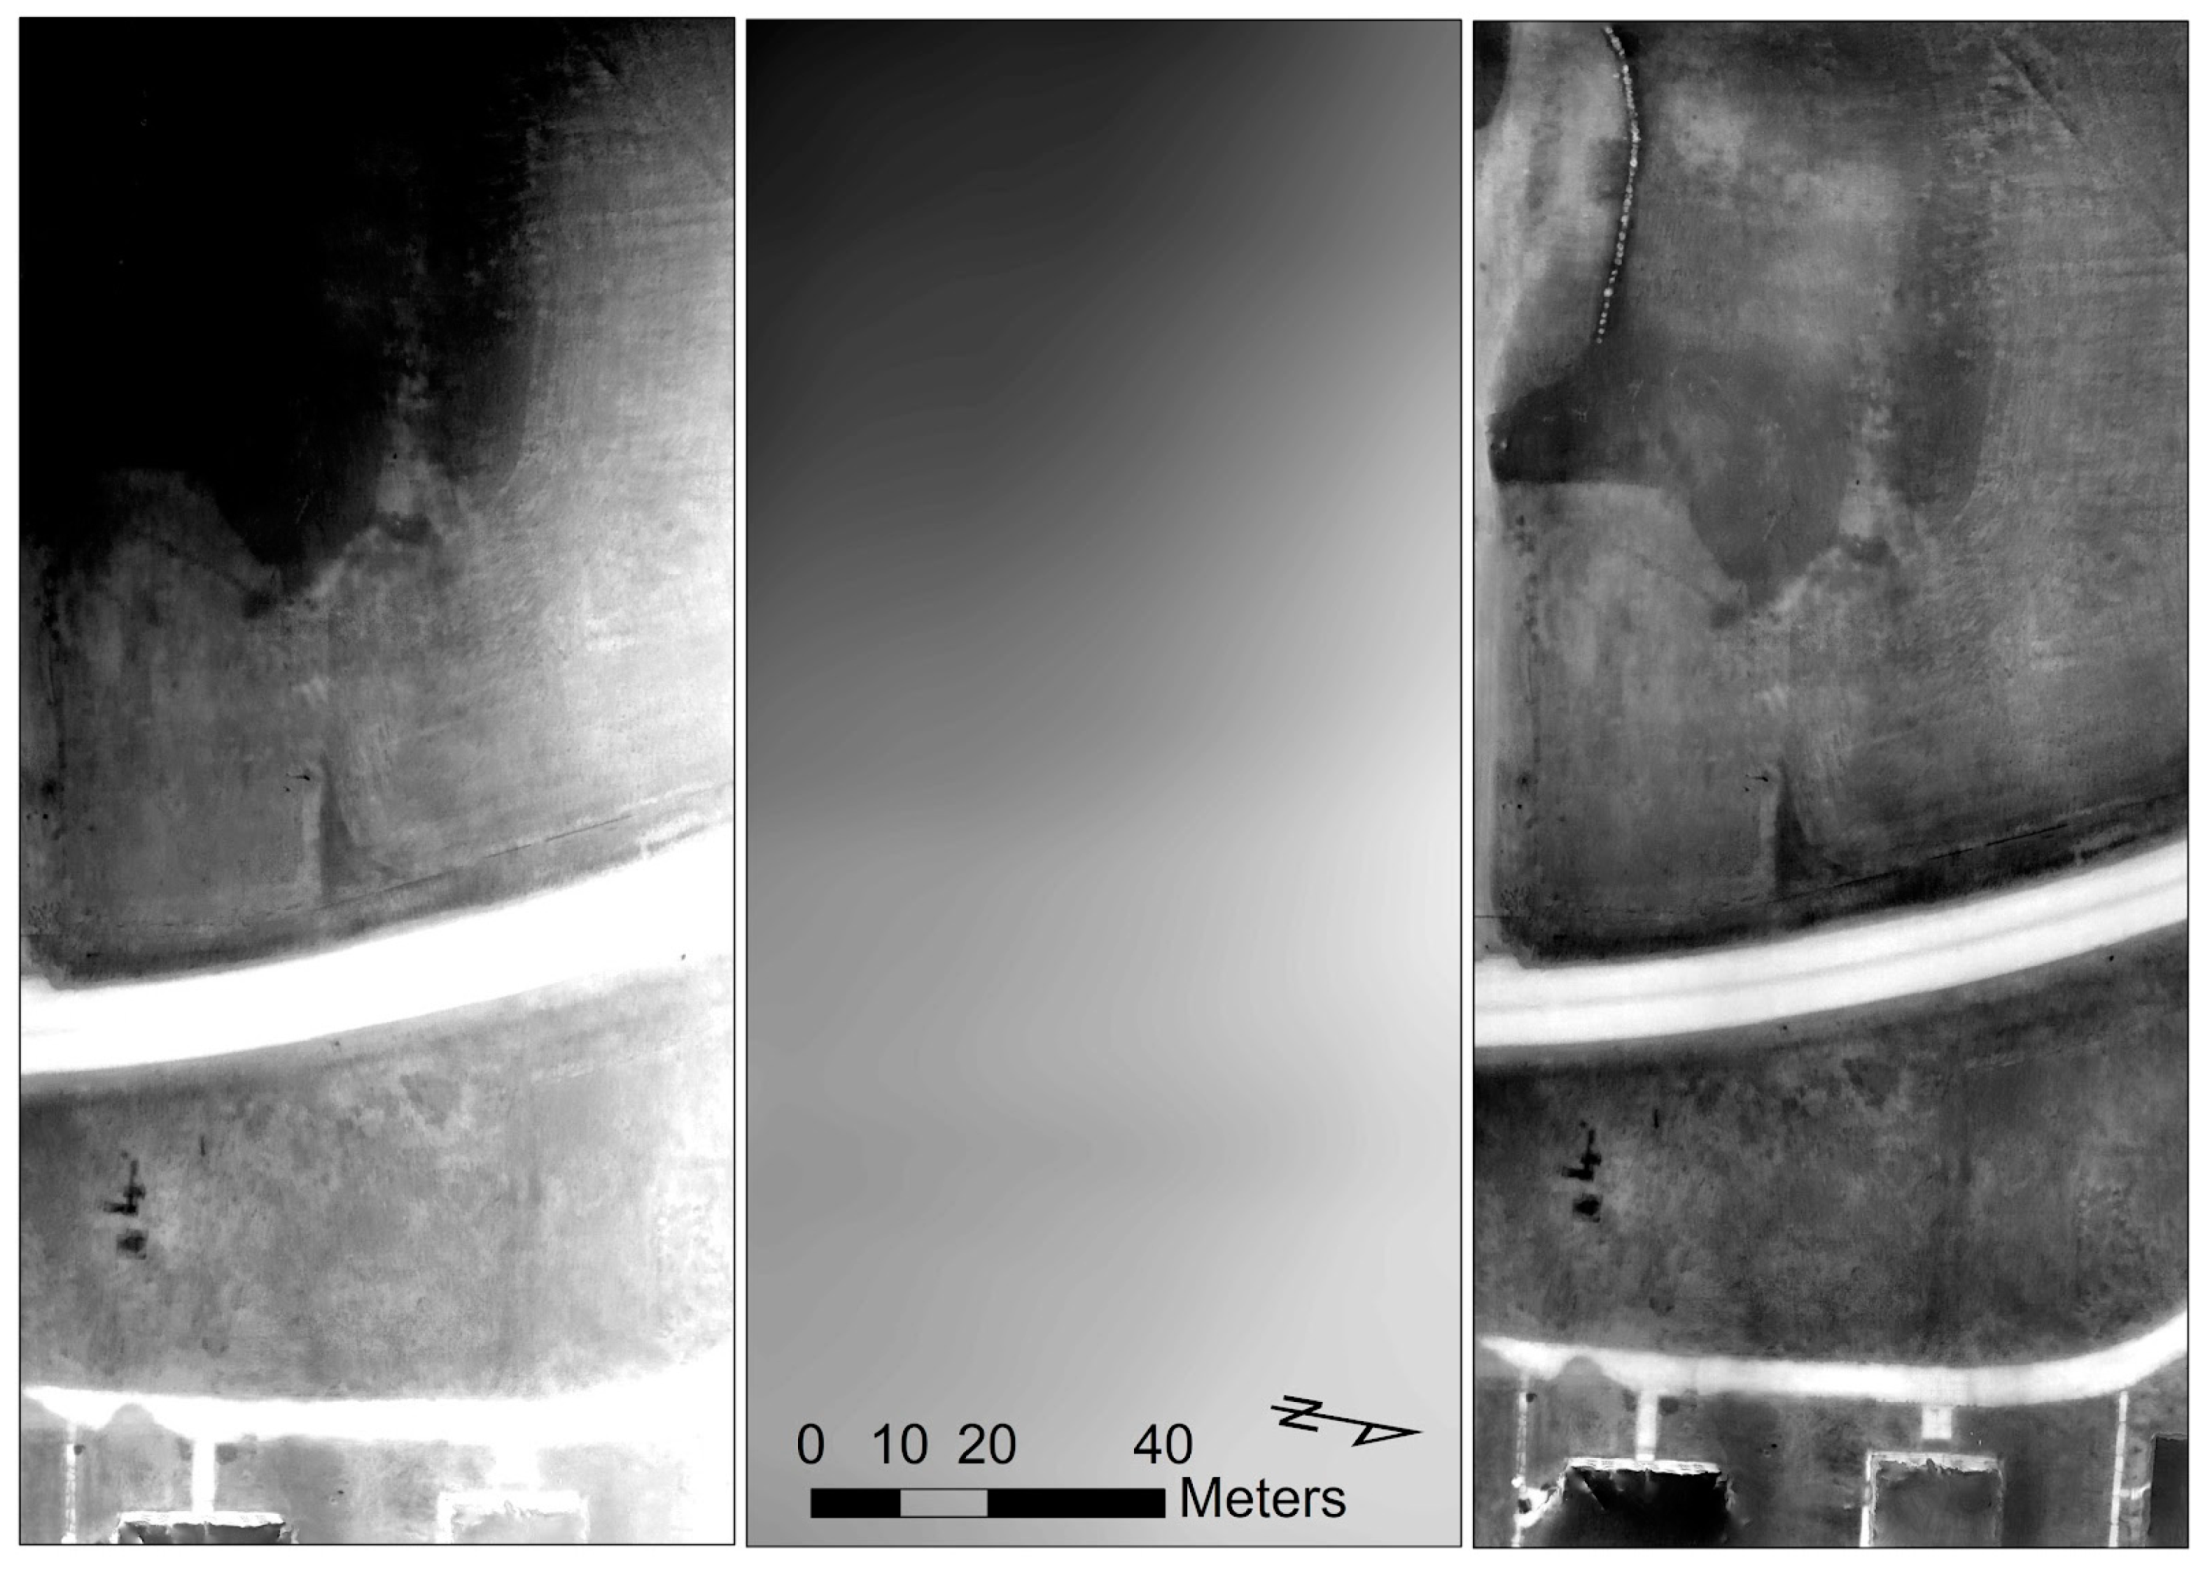
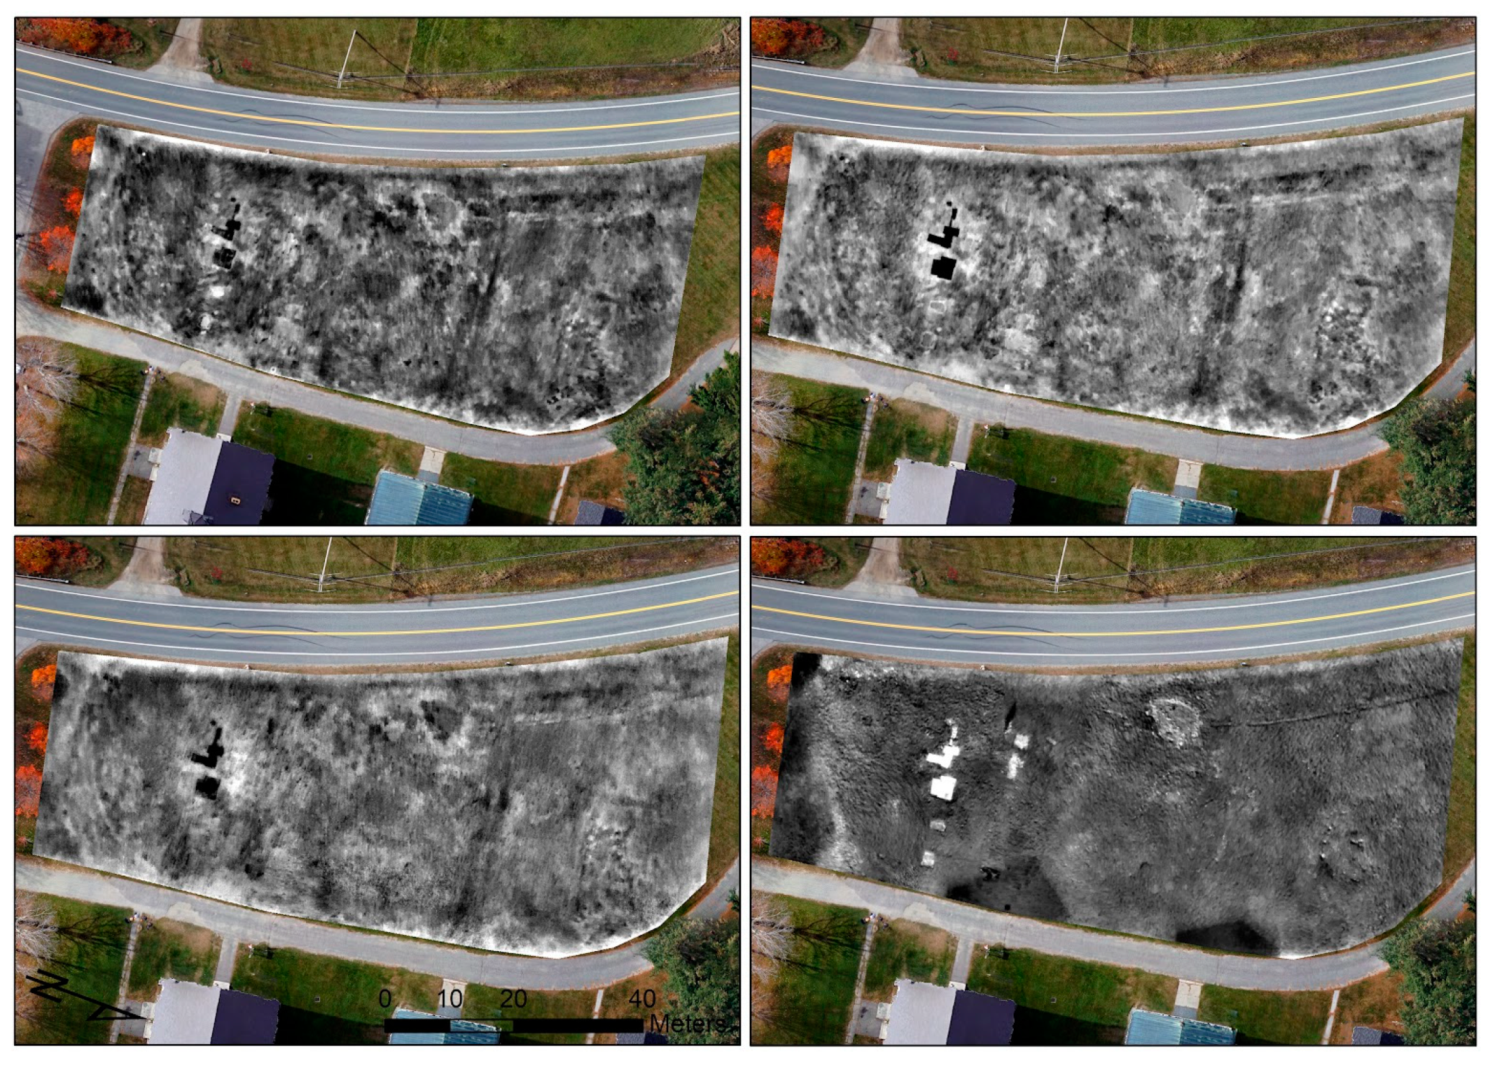
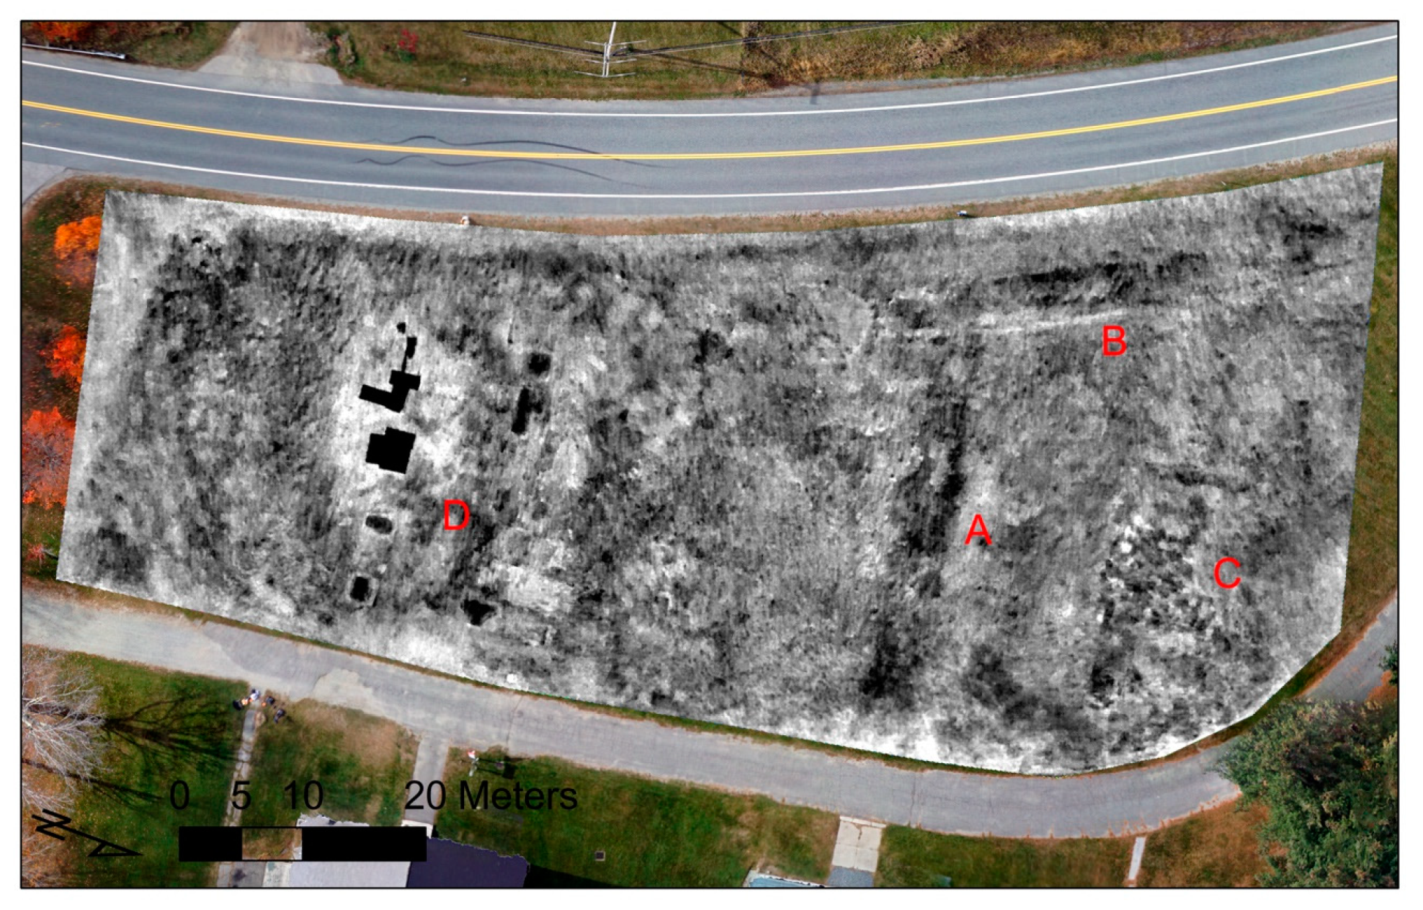
In an effort to eliminate the apparent temperature drift caused by the uncooled thermal sensor in the FLIR Vue Pro-R, we exported ortho-image mosaics from Photoscan Pro as geotiffs that preserved the raw radiometric data from the sensor (
Figure 3: left). We then de-trend the data by applying a low-pass filter to remove the macro-scale drift values. In ArcGIS, we accomplished this by running the Focal Statistics tool to calculate the mean thermal value for a large area around each cell in the raster of temperature values, producing a raster data set that shows the major temperature drift trend from one end of the survey to the other (
Figure 3: center). This trend raster is then subtracted from the original raster resulting in a visualization that preserves local contrast while removing the apparent temperature drift (
Figure 3: right). While some experimentation may be needed to identify the appropriate size of the “window” needed to capture mean temperature drift without capturing local temperature variation when applying the focal statistics tool, our approach created thermal ortho-image mosaics that could be more easily combined and analyzed quantitatively (see below).
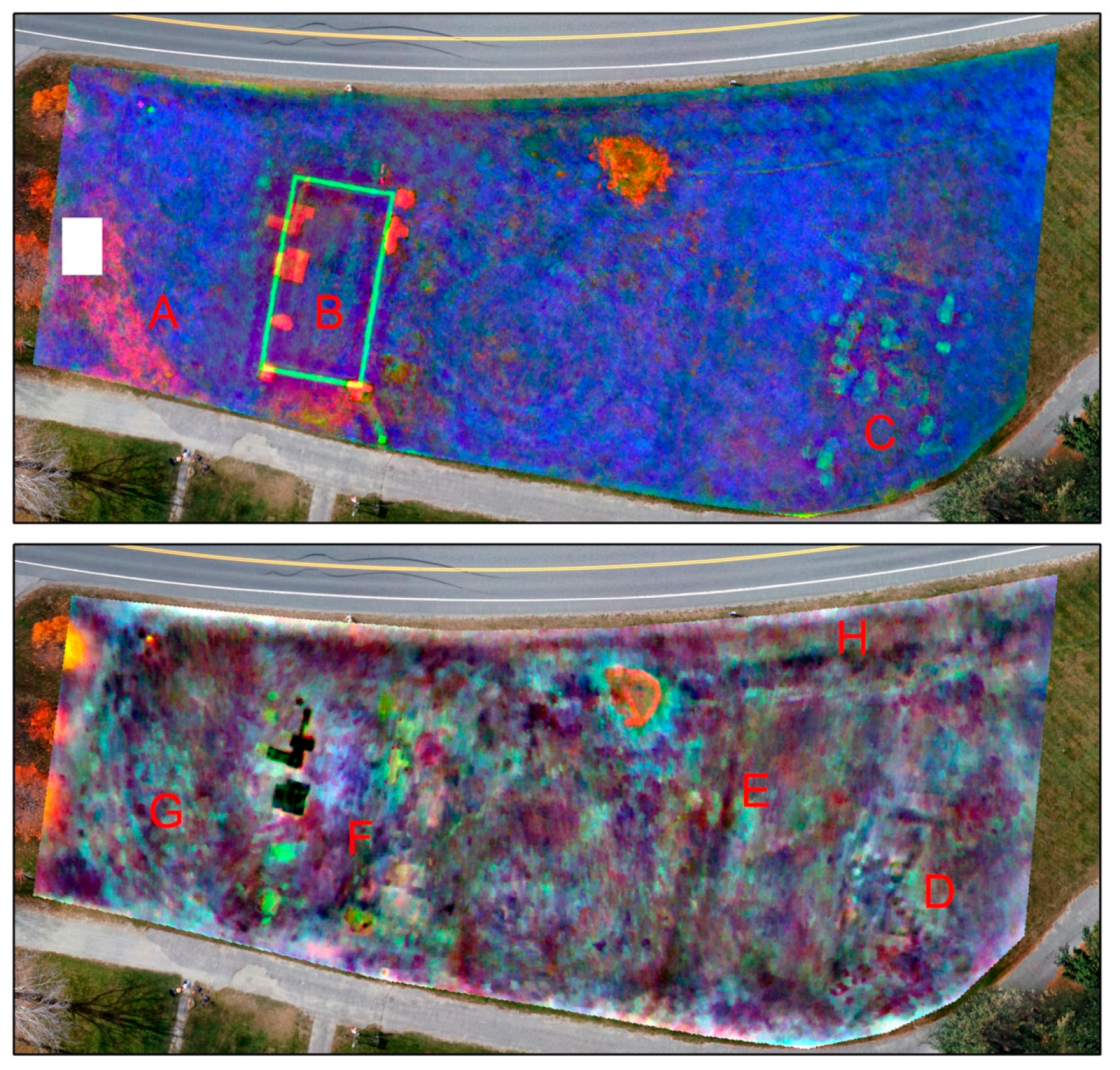
The multi-spectral data recorded by the Parrot Sequoia camera was post processed to produce NDVI data directly in Photoscan Pro. As of version 1.4, Photoscan Pro is capable of loading all four independent spectral bands as a single multi-band file, photogrammetrically processing all of the bands simultaneously, and then utilizing the sunshine sensor data to correct for the amount of light falling on the scene in order calculate accurate NDVI values. It is then possible to utilize the internal “raster calculator” in Photoscan Pro to generate and export rasters with NDVI values using the formula “NDVI = NIR-Red/NIR+Red”. The resulting raster can be further processed using a custom LUT (look-up table) to enhance local contrast within the NDVI image in order to increase archaeological feature visibility.
Since the thermal and multi-spectral temporal data is well georeferenced via accurate GCPs, it is possible to combine many discrete surveys into a single multi-band raster that can help draw out and identify features that are subtly visible across different times and sensors. This is accomplished in ArcGIS by clipping all overlapping thermal and multi-spectral raster files to the same extents and then using the “composite bands” tool.
4. Discussion
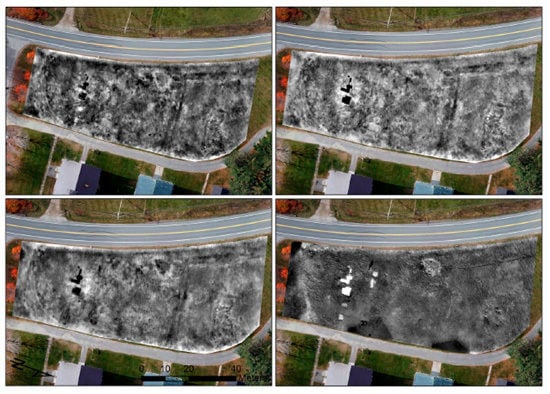
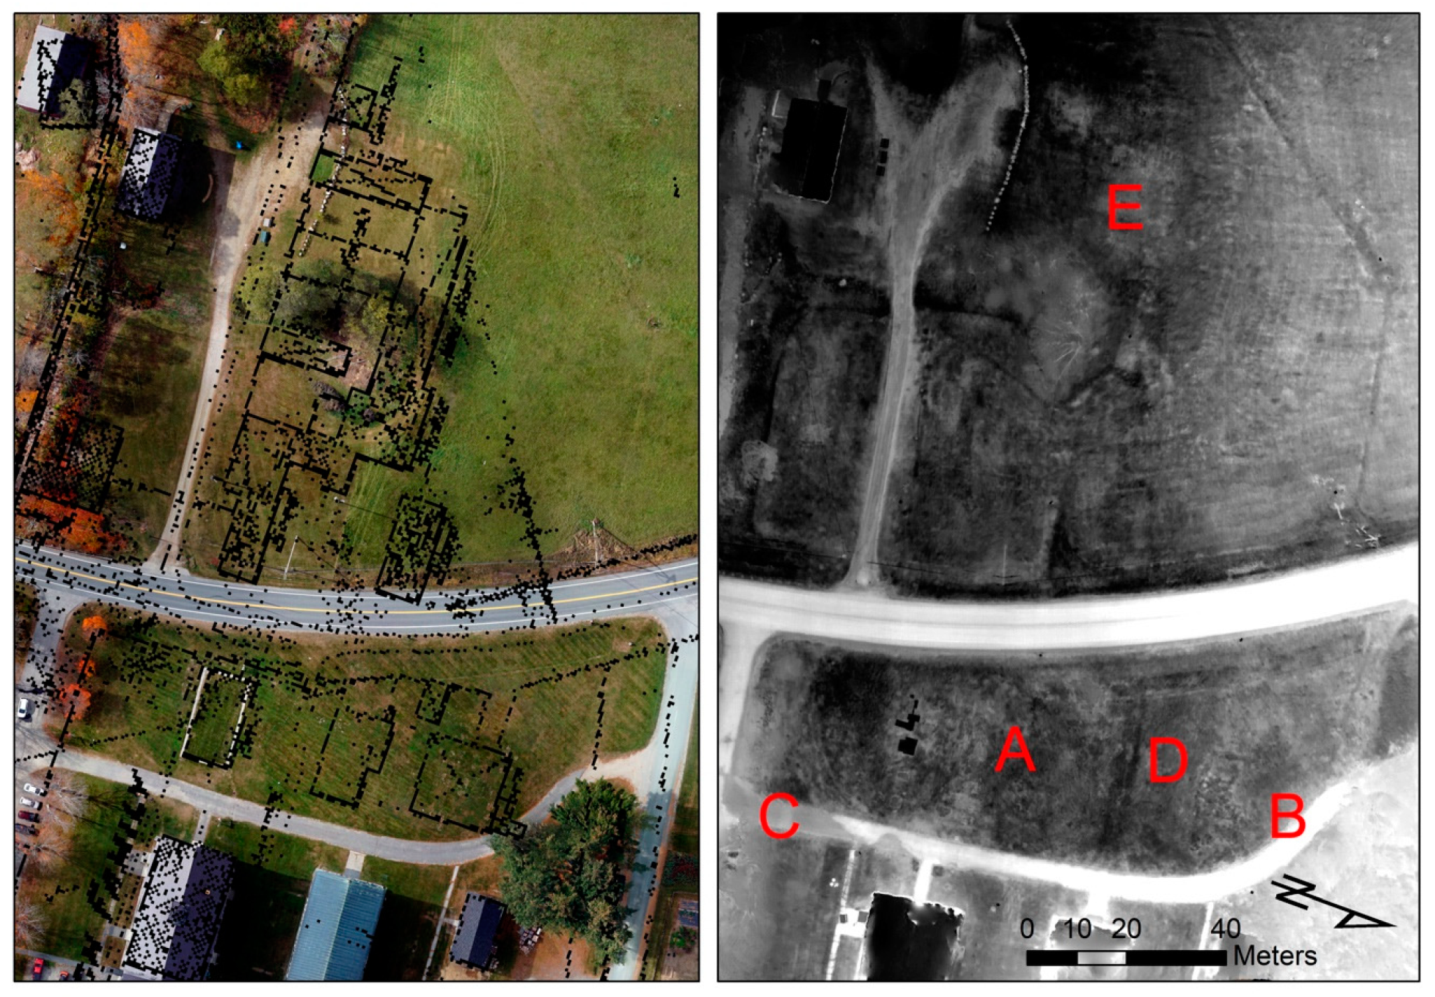
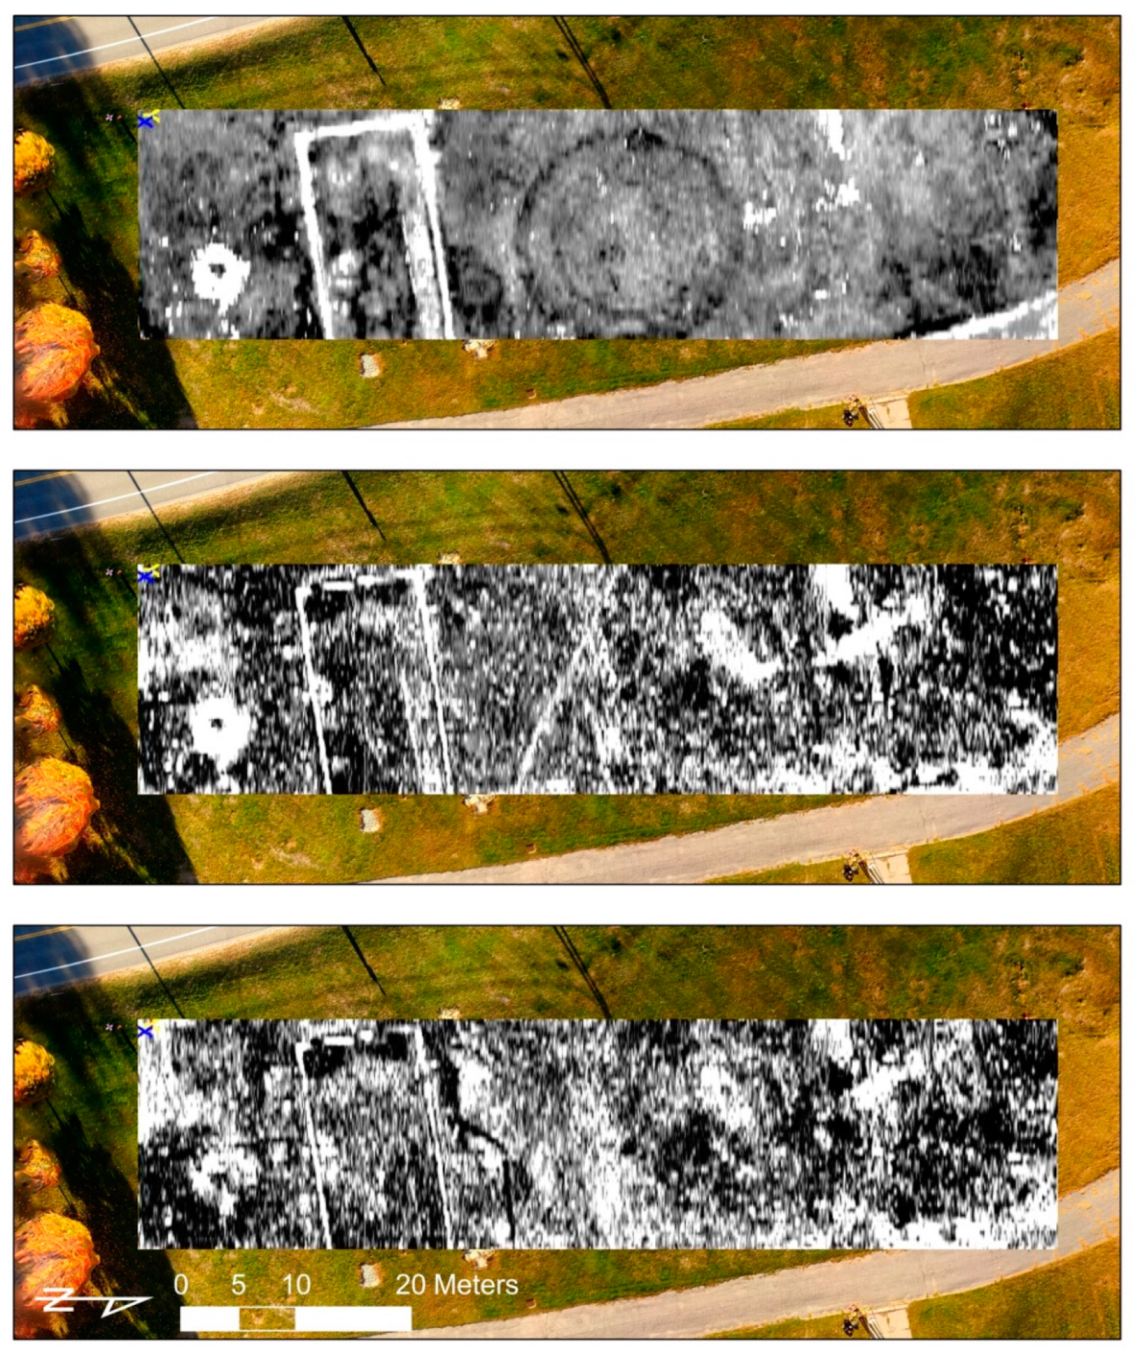
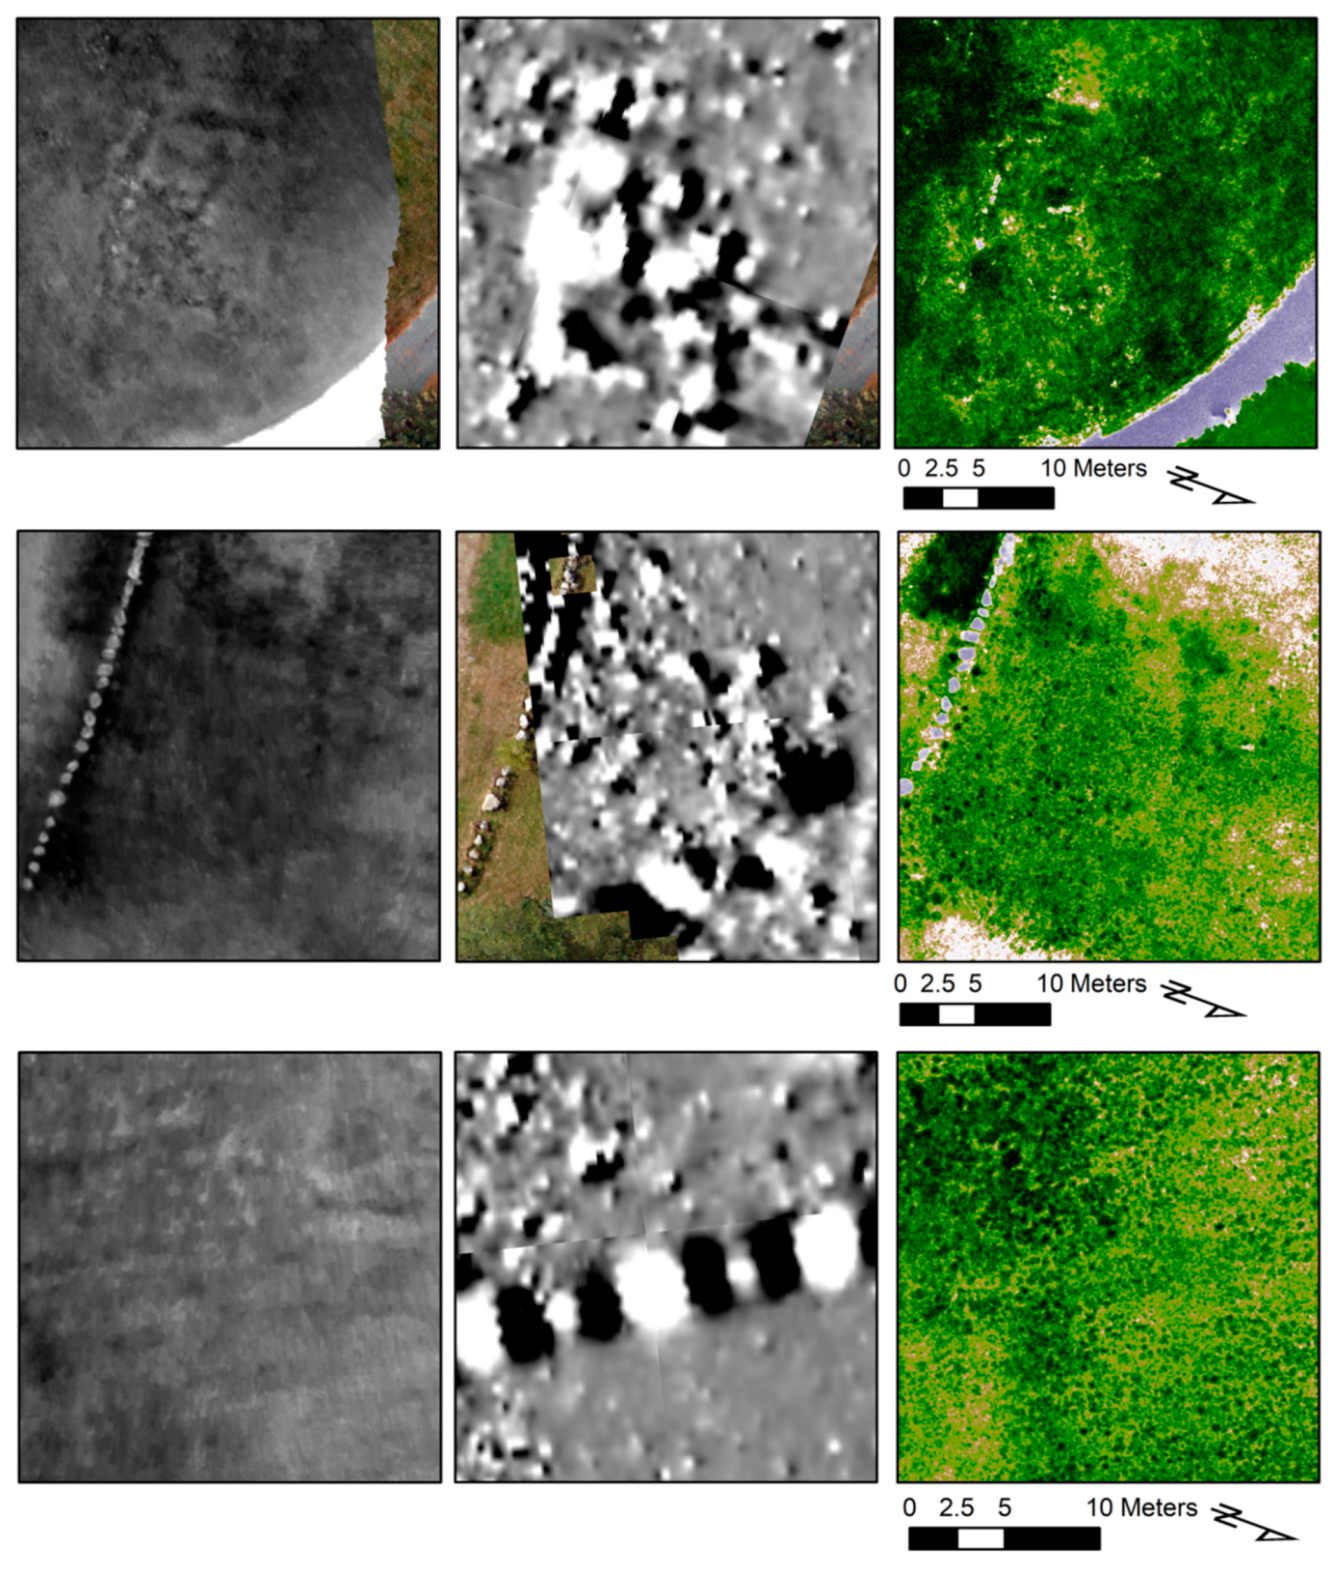
Our results demonstrate that under favorable environmental conditions, multi-temporal aerial thermal and multi-spectral imaging can reveal a wide range of archaeological features on and below the ground surface. Some of these features, including two building foundations in the main lawn and a pipe paralleling the road are visible in all of our datasets, including GPR, magnetic gradiometry, multi-spectral and thermal imagery. In some cases, such as the historic pathway and the building foundations west of the road, features appear more clearly in aerial imagery than in terrestrial geophysical data. In other instances, such as the buried water pipe and the remains of metal artifacts and installations, magnetic gradiometry and GPR reveal features that are not evident in aerial imagery. Because each of these methods are measuring distinct physical phenomena, and the thermal and multi-spectral imagery are surficial investigations versus subsurface investigation, it is to be expected that certain types of features will be readily apparent in one dataset but may not appear in another.
Figure 12 provides side-by-side comparison of a few features in the thermal, magnetic gradiometry, and NDVI data sets. The top row of
Figure 11 shows the buried foundation in the main lawn, labeled “B” in
Figure 4. The middle row shows the foundation on the west side of the road labeled “A” in
Figure 5. The bottom row of
Figure 11 shows the buried pipe labeled A in
Figure 9. These results reinforce the importance of understanding various remote sensing methods as complementary to one another. However, the time investment to record the site using these 4 technologies varies dramatically. In our study, a single, 20-min drone flight recorded 6 hectares, while GPR and gradiometer surveys require days of effort per hectare. Thus, with relatively little time investment, archaeologists conducting geophysical surveys can add a valuable dataset by using aerial thermal and multi-spectral imaging.
Results of our investigations at Enfield Shaker Village support previous studies’ [
7,
8] conclusions that diurnal heat flux is one of the most significant variables affecting the visibility of archaeological features in aerial thermal images. Building foundations and other features are most evident in thermal images collected after dark, while the same features are virtually invisible in imagery collected during the day. We also demonstrate the importance of the dew point, as features visible in thermal imagery collected after dusk disappear when surface temperatures reach the dew point. NDVI imagery reveals many of the same building foundations and other features that are visible in thermal imagery, including the two foundations in the main lawn, the old paved segments of driveway, modern pipe features, and possibly additional historic foundations to the west, because in each case subsurface archaeological features are impacting vegetation health.
One of the most important questions about the efficacy of thermography for identifying buried features is the depth to which it can be effective. Visibility on the surface, of thermal contrasts reflecting buried features, is affected by several key factors including the difference in thermal inertia between archaeological features and the soil in which they are buried [
3], the volumetric heat capacity and thermal conductivity of the features and the surrounding matrix, and thermal emissivity of the surface [
8]. There is significant literature, from researchers studying terrestrial heat flow and climate change, on temperature fluctuations of soil temperature, depending on depth, and the effect of these key factors e.g., [
28,
29,
30,
31,
32]. While much of this literature focuses on a scale that is too large for the fine-grained thermal variation that can reveal archaeological features, there is significant literature on the detection of shallowly buried mines via thermography [
33,
34,
35,
36,
37,
38]. While much of the recent work with aerial thermography for archaeology has focused on the importance of the short term, diurnal heating cycle for creating differences in surface temperatures due to differences in thermal inertia between buried archaeological features and surrounding soils [
7,
8,
9,
10], Scollar et al. [
5] argue that the diurnal heating cycle is too transient to show the effect of differing thermal inertias for more deeply buried features. Instead, significant warming or cooling of the ground over a period of several days is more likely to allow deep differences in thermal inertia to be reflected on the surface. They suggest, then, that only when there are consistent shifts in temperature over several days will more deeply buried features be visible, and that otherwise the variation of soil temperature on the surface will only reflect very near surface features.
Directly measuring buried soil temperatures is one critical way of understanding how deeply diurnal and longer-term temperature variation is affecting and reflecting soil temperature at the surface and thus the potential depth of features that might be visible. Unfortunately, we did not have access to local soil temperature data at the site during these surveys, and this is something that we hope to include in future work. Instead, in order to try to get some handle on the daily and longer-term soil temperature changes at different depths in the area, we looked at published soil temperature, soil moisture, wind speed, relative humidity, air temperature and dew point data collected on an hourly basis at the nearby Mascoma River Site (approximately 19 km away) by the Natural Resource Conservation Service Soil Climate Analysis Network (SCAN,
https://www.wcc.nrcs.usda.gov/scan/). This data is presented here as an imperfect proxy for directly observing soil temperatures on site. The air temperature and diurnal heating experienced by both sites is likely to be similar, given their proximity, though since the soils and moisture content at the two sites are likely different, this comparison should be taken with a grain of salt.
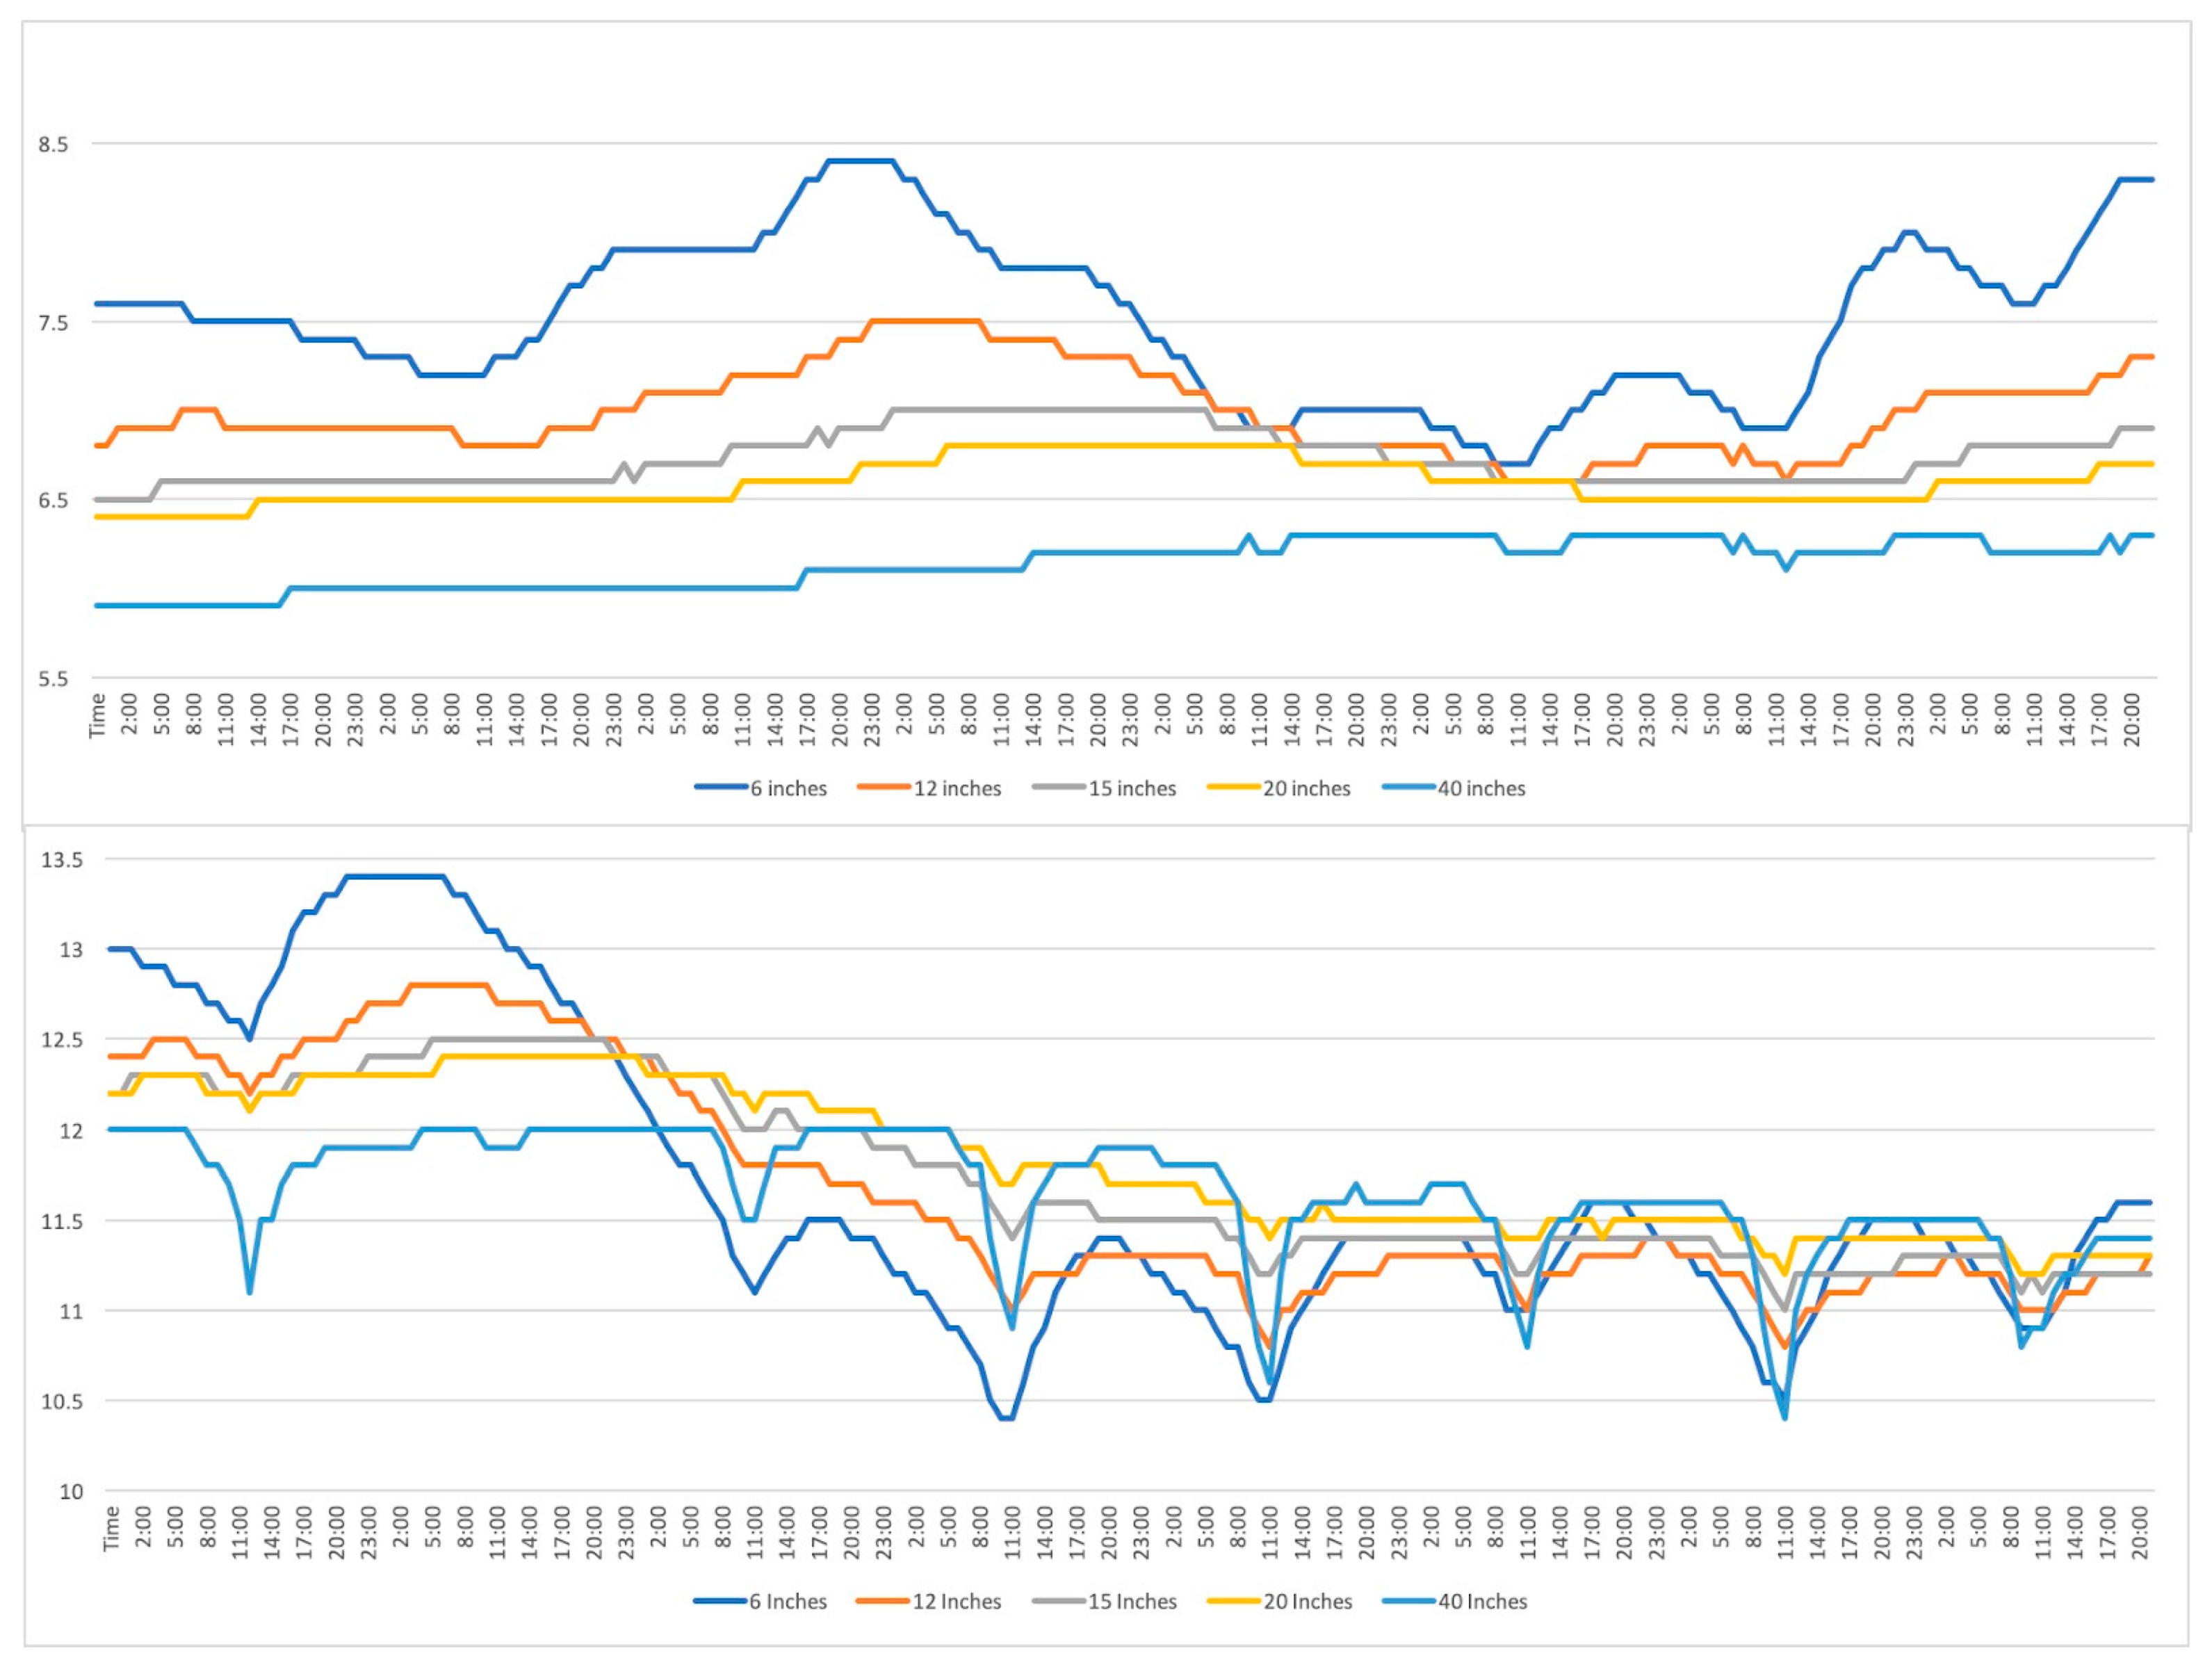
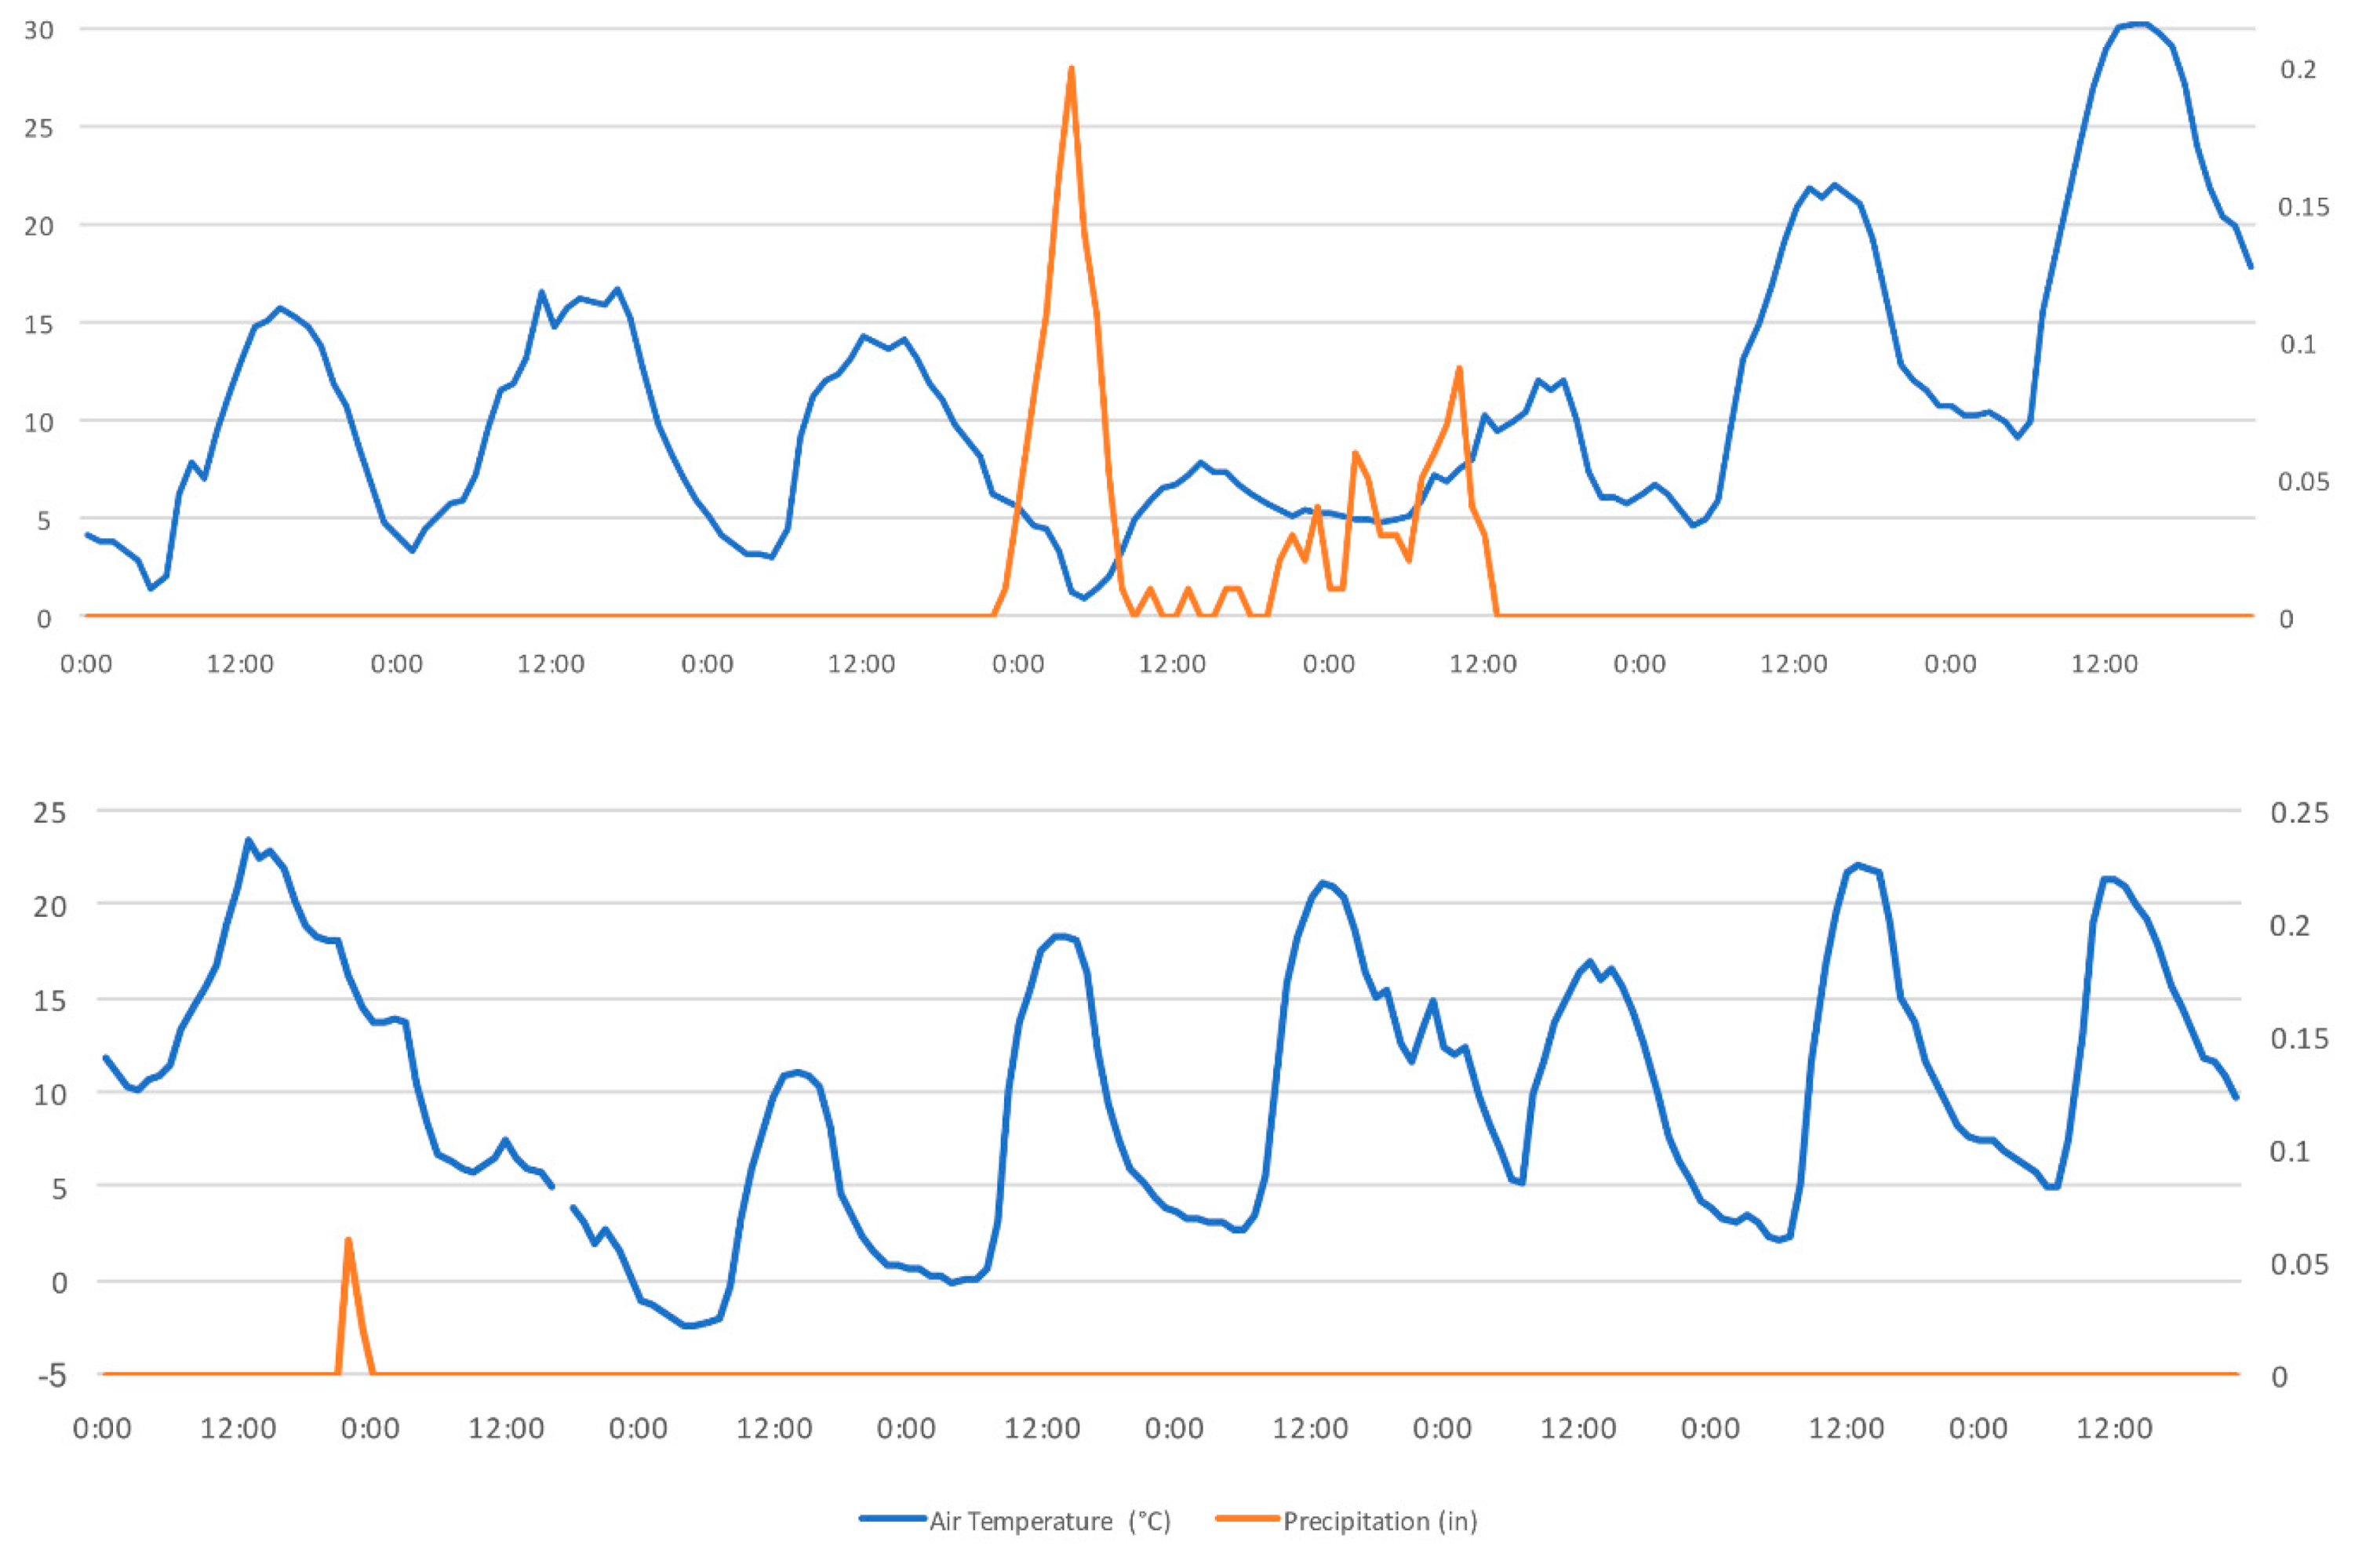
Figure 13 shows soil temperature data from 5 different depths at Mascoma River, for the two weeks prior to thermal surveys conducted at Enfield Shaker Museum on May 11th and October 22nd, 2017, while
Figure 14 shows air temperature and precipitation data from a local weather station for the same period. Although the data show that in May 2017 temperatures were relatively constant, in October 2017 temperatures cooled rapidly in the two weeks leading up to our survey. In the week leading up to 22 October, there was a sudden drop in daily air temperatures (
Figure 14), and this is shown in the soil temp data (
Figure 13) with the temperature at 6 inches below the surface dropping below the temperature at 40 inches for several days. This is exactly the kind of multi-day temperature transition that Scollar et al. [
5] were describing. However, these differences do not seem to produce a marked effect on the visibility of archaeological features in thermal imagery at the site, suggesting that daily temperature variations are in fact the more important variable to consider when planning archaeological thermal surveys. The Mascoma River soil temperature data also illustrate the depth to which soil in this environment is affected by diurnal temperature changes. In both May and October, soil temperature is only measurably changing during diurnal cycles in the top 12–15” (30–38 cm) of soil, suggesting that, in this particular environment, this is the maximum depth to which thermal imagery is likely to reveal subsurface features. However, because thermal conductivity of soils and sediments can vary by a factor of 20, the effective depth at which archaeological features will be visible in an aerial thermal image will vary considerably depending on soil moisture and composition.
Our results also highlight the critical importance of soil moisture in determining the visibility of buried archaeological features as well as for environmental data collection [
39]. The high thermal inertia of water means that surface moisture, from either dew or recent rainfall, will likely obscure archaeological features that might otherwise be visible. On the other hand, surveys undertaken in extremely dry environments may show little contrast between archaeological features and the soils in which they are buried [
8]. The Mascoma River data provides some useful proxy information about soil moisture, listed in
Table 1. The moisture percentage in the first 6” of soil at Mascoma River is significantly lower during the fall surveys in October 2016 and 2017, which may help explain some of the differences in feature visibility between datasets. Directly measuring the soil moisture content on site before each thermal mapping session is likely to be an important workflow addition for predicting and tracking successful outcomes.


