Research on Post-Earthquake Landslide Extraction Algorithm Based on Improved U-Net Model


1
Key Laboratory of Digital Earth, Aerospace Information Research Institute, Chinese Academy of Sciences (CAS), Beijing 100094, China
2
University of Chinese Academy of Sciences, Beijing 100049, China
3
National Engineering Center for Geoinformatics, Aerospace Information Research Institute, Chinese Academy of Sciences (CAS), Beijing 100101, China
4
Key Laboratory of the Earth Observation of Hainan Province, Aerospace Information Research Institute, CAS, Hainan Research Institute, Sanya 572029, China
*
Author to whom correspondence should be addressed.
Remote Sens. 2020, 12(5), 894; https://0-doi-org.brum.beds.ac.uk/10.3390/rs12050894
Submission received: 14 January 2020
/
Revised: 25 February 2020
/
Accepted: 25 February 2020
/
Published: 10 March 2020
(This article belongs to the Special Issue Landslide Monitoring, Susceptibility, Hazard Assessment and Prediction with Remotely Sensed Big Data)
Abstract
:Seismic landslides are the most common and highly destructive earthquake-triggered geological hazards. They are large in scale and occur simultaneously in many places. Therefore, obtaining landslide information quickly after an earthquake is the key to disaster mitigation and relief. The survey results show that most of the landslide-information extraction methods involve too much manual participation, resulting in a low degree of automation and the inability to provide effective information for earthquake rescue in time. In order to solve the abovementioned problems and improve the efficiency of landslide identification, this paper proposes an automatic landslide identification method named improved U-Net model. The intelligent extraction of post-earthquake landslide information is realized through the automatic extraction of hierarchical features. The main innovations of this paper include the following: (1) On the basis of the three RGB bands, three new bands, DSM, slope, and aspect, with spatial information are added, and the number of feature parameters of the training samples is increased. (2) The U-Net model structure is rebuilt by adding residual learning units during the up-sampling and down-sampling processes, to solve the problem that the traditional U-Net model cannot fully extract the characteristics of the six-channel landslide for its shallow structure. At the end of the paper, the new method is used in Jiuzhaigou County, Sichuan Province, China. The results show that the accuracy of the new method is 91.3%, which is 13.8% higher than the traditional U-Net model. It is proved that the new method is effective and feasible for the automatic extraction of post-earthquake landslides.

1. Introduction
In China, especially in mountainous areas, seismic landslides are the most common and highly destructive earthquake-triggered geological disasters [1]. Statistics show that landslides can be triggered when the earthquake magnitude (ML) is greater than 4.0 magnitude [2], and earthquake- triggered landslides are more prominent during strong earthquakes (ML ≥ 6.0), especially during large earthquakes (ML ≥ 7.0). Rough statistics show that, in some major earthquakes, the loss of life and property caused by earthquake landslides can account for more than 50% of the total earthquake losses [3].
Therefore, obtaining information about earthquake landslides is the key to quickly organize rescues to save people’s lives and property at the first time [4]. However, it is difficult to extract and analyze the landslides’ information in the traditional field surveys. There are problems such as heavy task, low efficiency, high cost, and unintuitive information. With the rapid development of space technology and electronic information technology, remote sensing has been increasingly used in disaster emergency responses and rescues, with its advantages of rapid, macro, all-weather, and nearly all-day monitoring [5], and has become one of the most economical and effective solutions for landslide extraction [6]. It is of great significance to get information on a landslide situation as soon as possible, make a reasonable rescue plan, determine the potential hazards for key investigation, reasonably arrange the affected residents, and avoid secondary disasters [7].
At present, there are mainly three kinds of landslide information extraction methods based on remote sensing.
(1) Visual interpretation:
Visual interpretation is a professional landslides extraction method according to the image’s hue, texture, shape, position, and other characteristics. It uses aerial and high-resolution multispectral imageries to establish corresponding landslide interpretation marks and then observes features through the eyes and combines other non-remote sensing data to analyze the feature information and geological knowledge of the target [8]. Visual interpretation is the earliest method to extract landslides using remote sensing and has achieved good results of geological disasters such as landslides, slides, and debris flows [9,10,11,12].
(2) Pixel-oriented landslides extraction methods:
The visual interpretation method is widely used in high-precision remote-sensing image information recognition. However, visual interpretation requires that the workers have rich knowledge and experience, and it also takes a lot of time for manual interpretation. There are problems of heavy task, long cycles, and low efficiency, making it difficult to meet the needs of emergency, earthquake relief, decision-making.
At present, pixel-oriented landslides extraction techniques have overcome the shortcomings of visual interpretation. There are many classification methods, such as maximum likelihood, support vector machine and K-means clustering, etc. They are mainly based on each pixel value of the remote-sensing imageries and the changed form (such as spectral derivative, reciprocal, logarithm of reflectance, etc.) to determine the category to which the target belongs [13,14,15].
(3) Object-oriented landslides identification methods:
The pixel-oriented landslides extraction methods are relatively simple, but they only consider the characteristics of a single pixel point and do not consider other attributes (such as shape, texture, spatial structure, context, etc.) of related features, which leads to the loss of correlation between pixels [13].
The essence of the object-oriented landslides identification methods is to use object main properties to classify remote sensing images from high-to-low scales, which can reduce the error of information extraction by pixel classification and make the results more reasonable [16,17].
(4) Deep-learning landslides identification methods:
With the rapid development of satellites, high-resolution remote-sensing imageries have increased significantly. Extracting targets from massive high-scoring data has become a key technology. The object-oriented identification methods are based on image segmentation, and the results depend on the selection of the segmentation scale, which is often determined by the spatial structure of the imageries [18]. The suitable segmentation scale needs to be determined through repeated experiments [19]. At the present time, the main segmentation algorithms cannot quickly process complex, large-sized remote sensing data, making the segmentation efficiency low [20].
In recent years, deep-learning methods have provided an effective framework for automatic landslides extraction [21]. Compared with the traditional methods, it has the advantage of performing feature learning in an unsupervised or semi-supervised manner, and using hierarchical feature extraction to replace manual recognition [22]. At the same time, the extraction speed has been greatly improved to meet the requirements of the emergency response to the earthquake hazards. In general, it takes about three hours or more for manual interpretation on a map with an area of 40 . In contrast, deep-learning methods can finish it within an hour. Among deep-learning methods, such as FCN (Fully Convolutional Networks), Mask R-CNN, U-Net, and DeepLab series, the U-Net model has a simple and effective structure to extract target features by using a small number of samples. As to the landslides extraction, due to its variable shape and complex colors, it is easy to lead to missed and misplaced extractions when the U-Net is used just on the RGB imageries. Therefore, it needs urgent improvement to increase the landslides extraction precision.
The main objective of this paper is to improve the automatic extraction of the earthquake-triggered landslides by improving the U-Net model. The main improvements include the following: (1) adding parameters closely related to landslides (such as DSM, slope, and aspect), to enhance the characteristic parameters of samples; and (2) adding the residual learning unit in the U-Net network structure to improve the accuracy of landslides extraction.
2. Method
2.1. U-Net Model
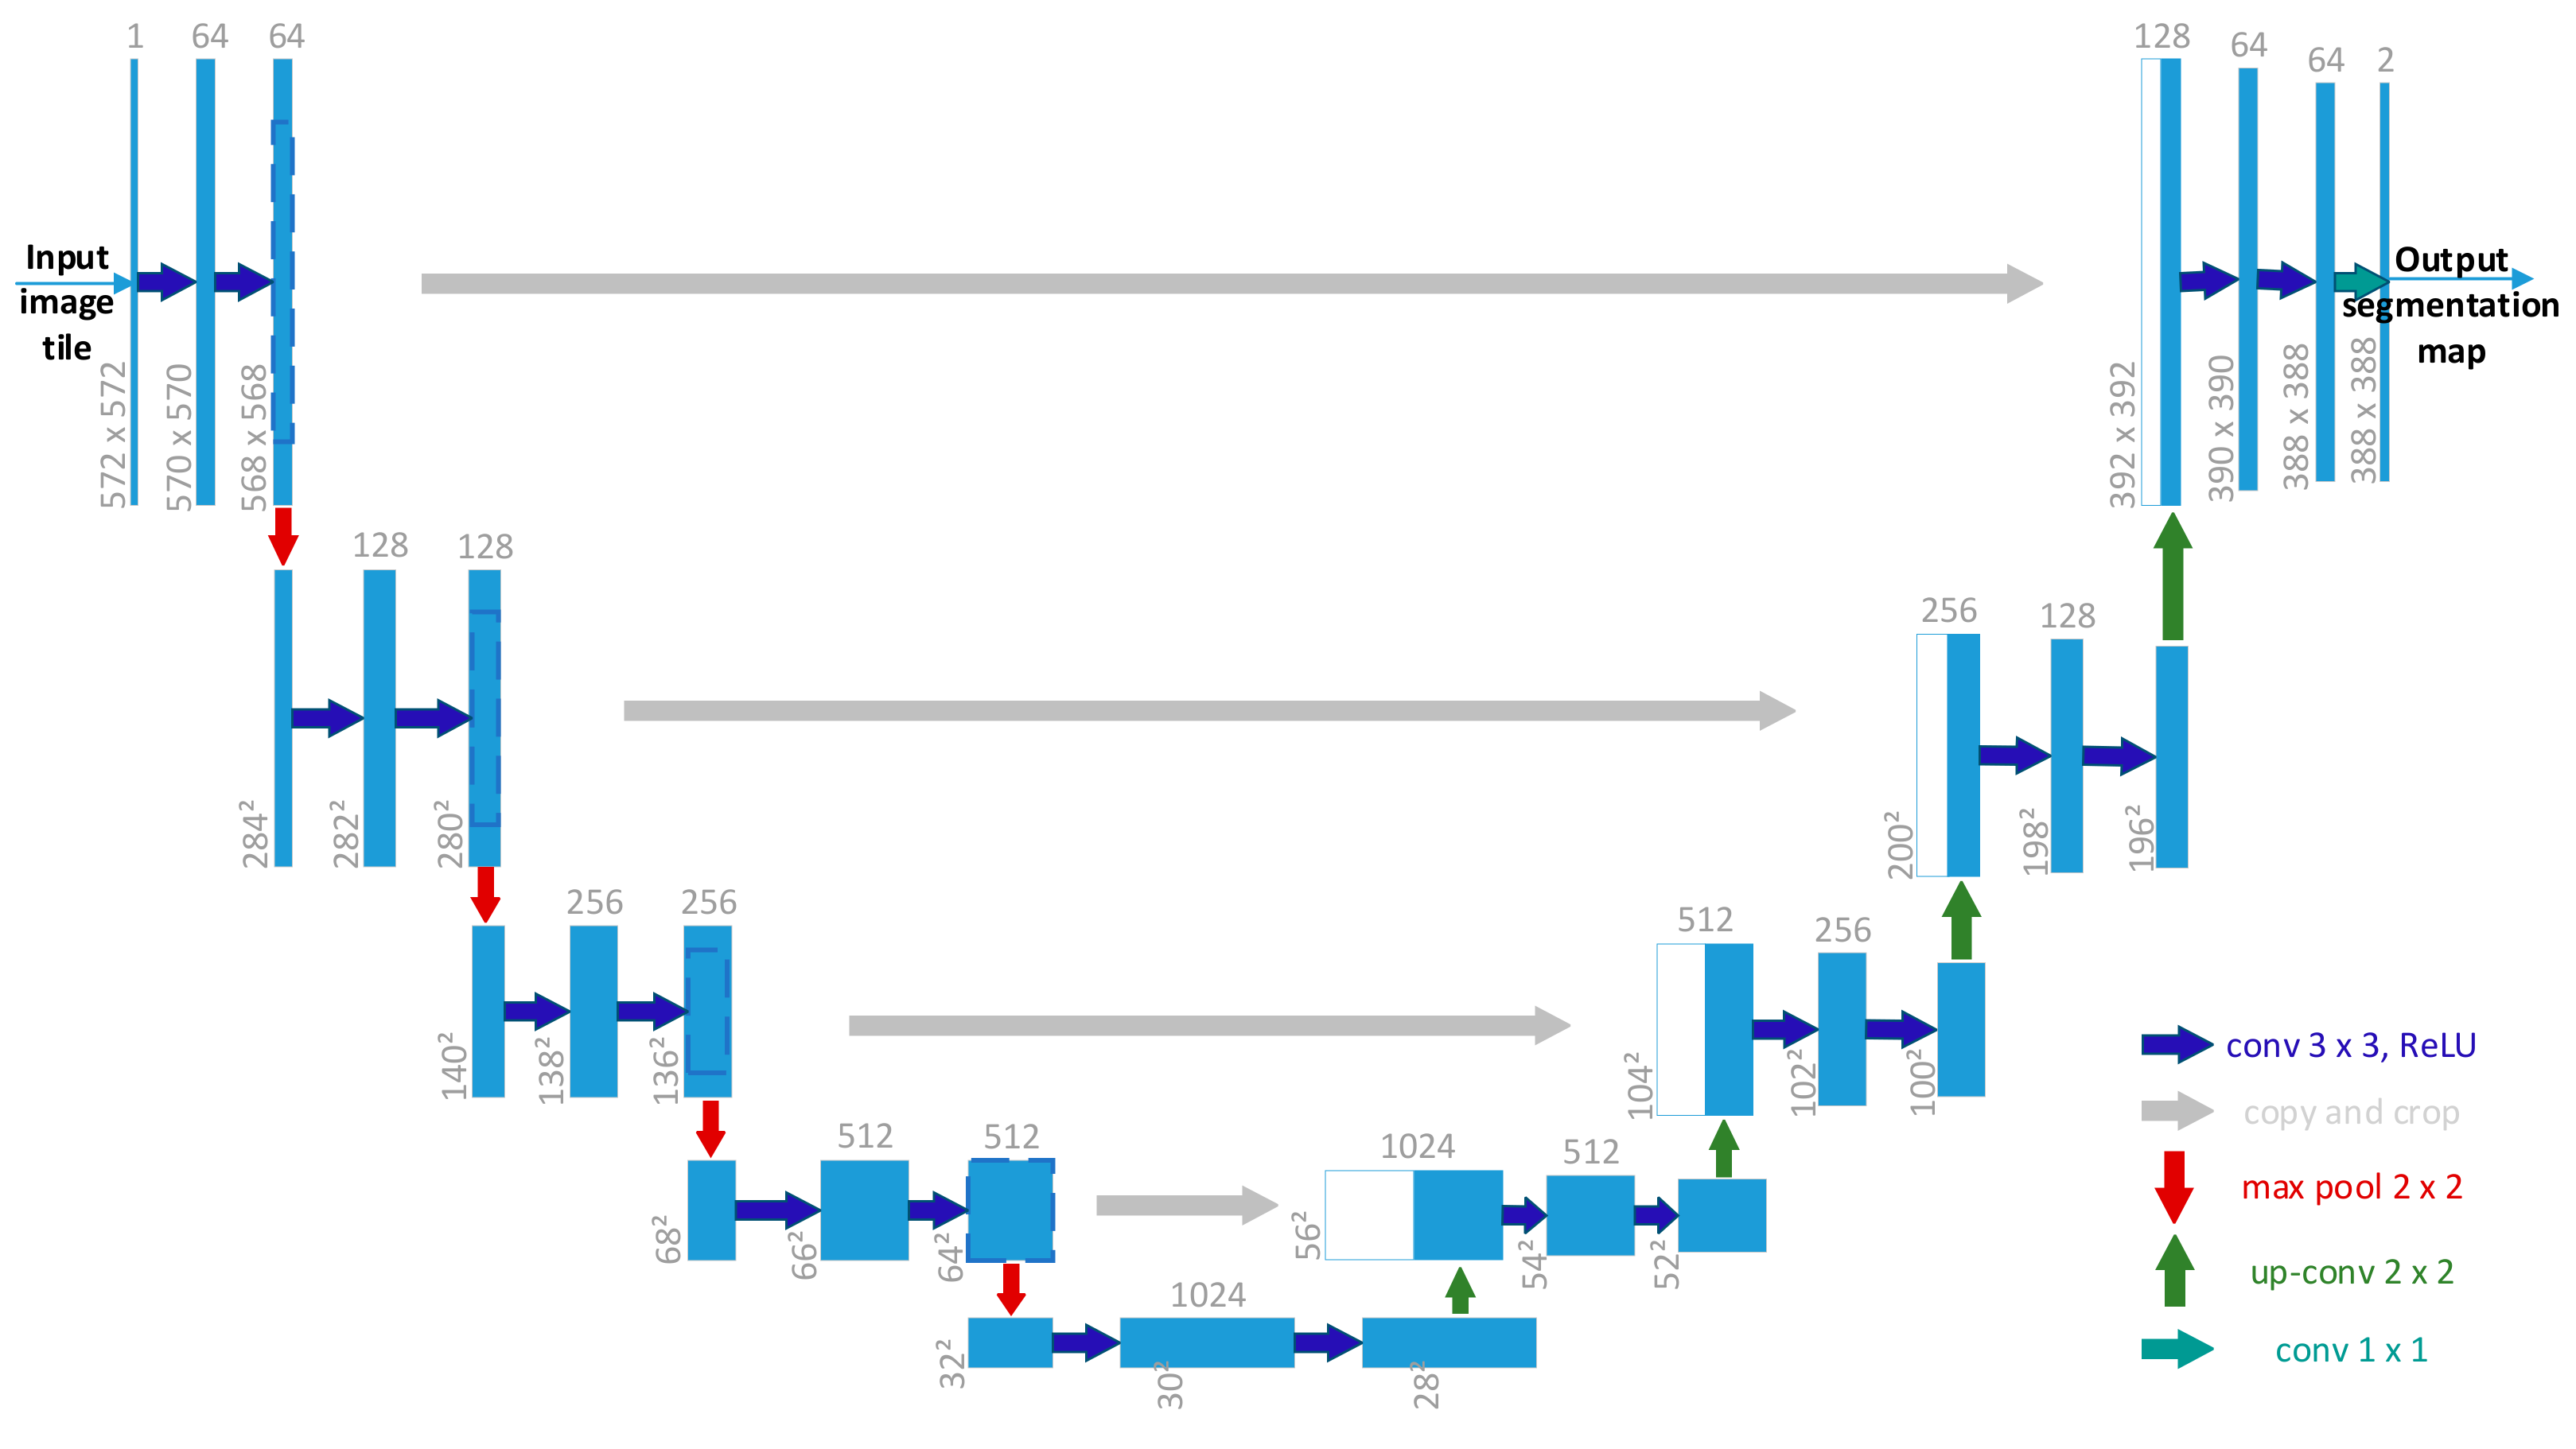
The U-Net model was proposed by Olaf Ronneberger et al, in 2015. It is based on the improved Fully Convolutional Neural Network (FCN) [23] and was originally applied to medical imageries. Its structure is shown in Figure 1 [24].
The structure is named after the letter U drawn by the authors. It consists of a compression channel on the left half and an expansion channel on the right. The compression channel is a typical convolutional neural network structure. It repeatedly uses the structure of two convolutional layers and one maximum pooling layer. After each pooling operation, the dimension of the feature map doubles, which is from 64 to 128, 256, 512, and 1024. In the expansion channel, it firstly performs a deconvolution operation to halve the dimension of the feature map, and it secondly stitches the feature maps corresponding to the compression channel, to reconstruct a feature map with double the size. Then, two convolutional layers are adopted to extract features. In the final output layer, two convolutional layers are used to map the 64-dimensional features into a two-dimensional output map.
The U-Net model is an improvement and extension of FCN. It follows the FCN idea of image semantic segmentation, using convolutional layers and pooling layers to extract features, and then using deconvolution layers to restore imageries. However, U-Net combines the characteristics of the encoding–decoding structure and the jumping network, which is more elegant in the following 2 points:
(1) The U-Net model has an encoding–decoding structure. The compression channel is an encoder used to extract the imagery features. The expansion channel is a decoder used to restore the imagery information. In addition, the U-Net hidden layers have more dimensions, which are conductive to model learning with more diverse and comprehensive features.
(2) The “U-shaped” structure of the U-Net model makes the cutting and stitching process more intuitive and reasonable. The stitching of high-level features with the underlying features and the repeated operations of convolutions enable the model to combine context and detailed information to obtain a more accurate feature map using less training samples.
2.2. Improved U-Net Model
(1) Basic Principles
Due to the landslides’ complexity, its extraction results using the traditional U-Net model have a problem of missing and misplaced landslides. To solve it, the following two aspects are needed:
(i) Increasing samples spatial information:
Landslides are gravitational landforms on sloping fields, and their formation is closely related to the topographical features, with certain slope requirements [25]. Using only RGB images cannot distinguish them effectively from other features. Therefore, the input imagery is expanded to six channels, in which DSM, slope, and aspect containing more landslides spatial information are added to the model, to construct input layers to improve the landslides extraction accuracy.
(ii) Adding the residual network:
For traditional deep-learning networks, we generally think that the deeper the network, the stronger the nonlinear expression ability is, and the more information the network can learn. However, later in the process of application, we found that, when the number of layers deepen to a certain degree, the deeper the network, the worse the effect becomes. To solve this problem, He et al. proposed a residual network in 2016 [26].
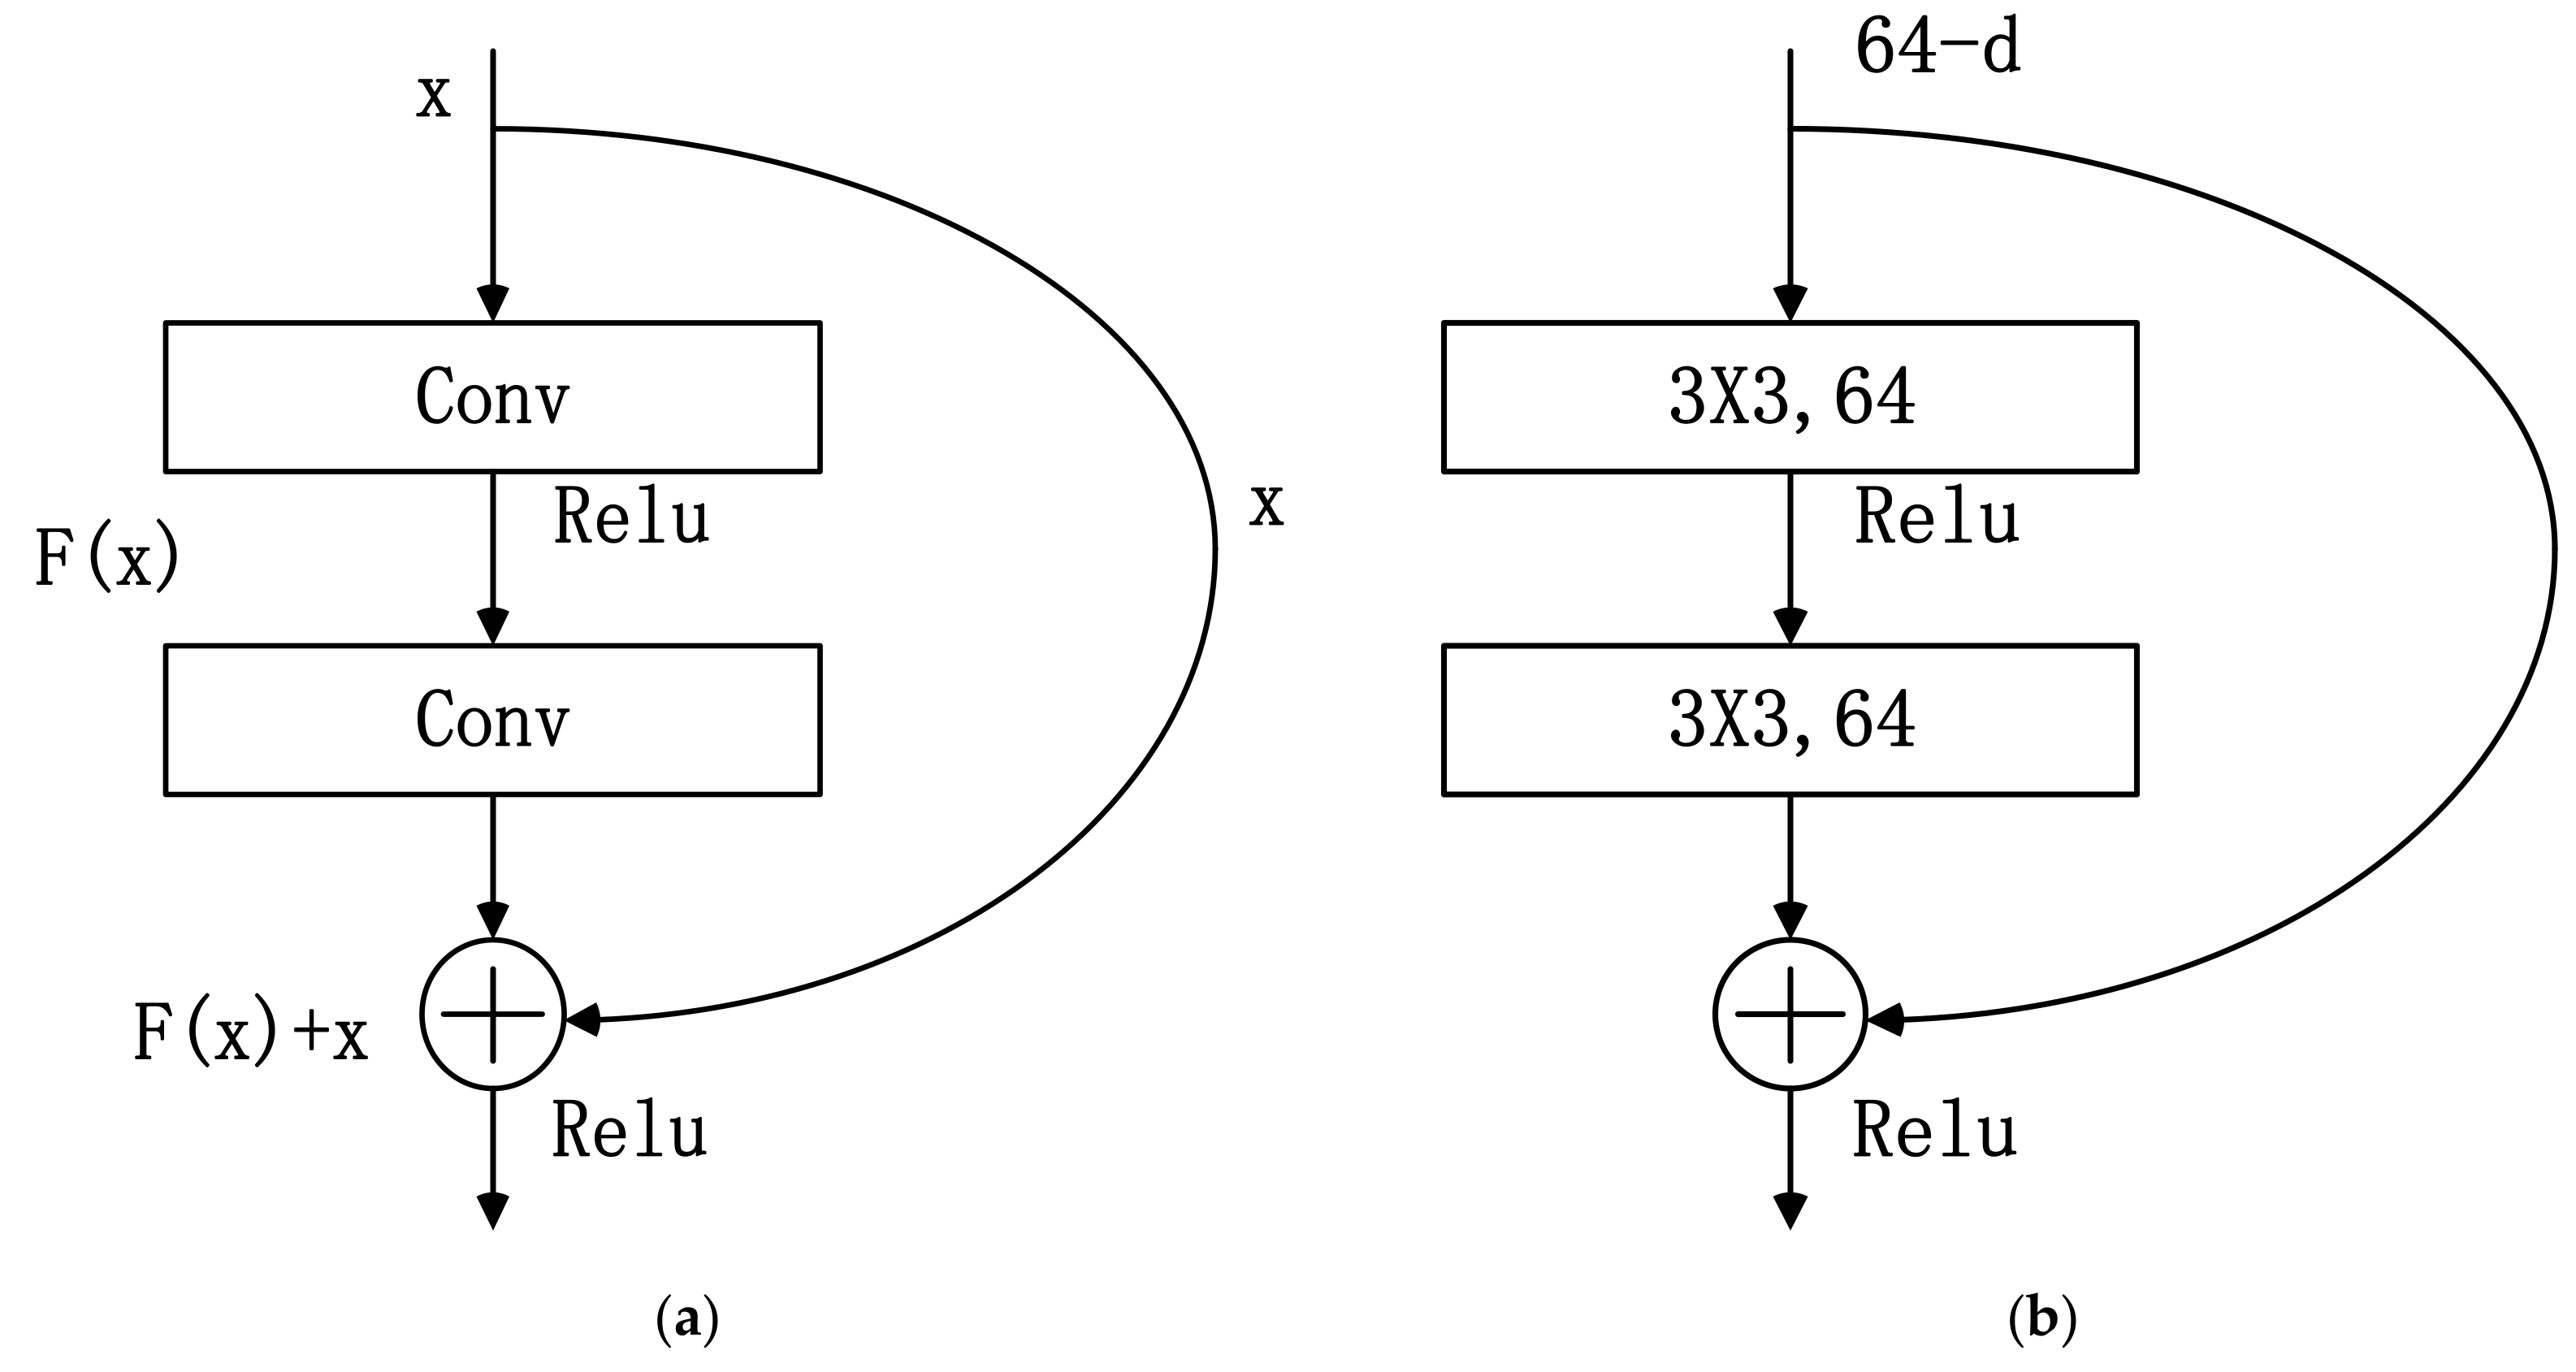
Following is its basic principle. Assuming that the input of a neural network unit is and the expected output is , if x is directly passed to the output, the objective of the neural network unit is the residual mapping . This neural network unit that learns residual mapping is called a residual learning unit, and the structure of the residual learning unit is shown in Figure 2a. Residual learning units usually include two forms: a two-layer residual learning unit and a three-layer residual learning unit [27]. This paper uses a two-layer residual learning unit that contains two convolutions with the same number of channels (as shown in Figure 2b).
In order to extract the landslide features contained in the six channels, a residual learning unit was added to the U-Net model, deepening the network layers, and then fully extracted the six-channel features of the samples. Compared with the traditional U-Net model, it has stronger feature extraction and classification capabilities. At the same time, it solves the problem of gradient disappearance or gradient explosion when the network deepens, better controls the propagation of gradients, and reduces the difficulty of training deeper U-Net model. The copied channel copies the low-level feature map from the down-sampling to the up-sampling process and fuses it with the high-level feature maps to complete the cross-layer connection of context information and enhance the learning ability of the network’s global features, which can effectively improve the accuracy of segmentation.
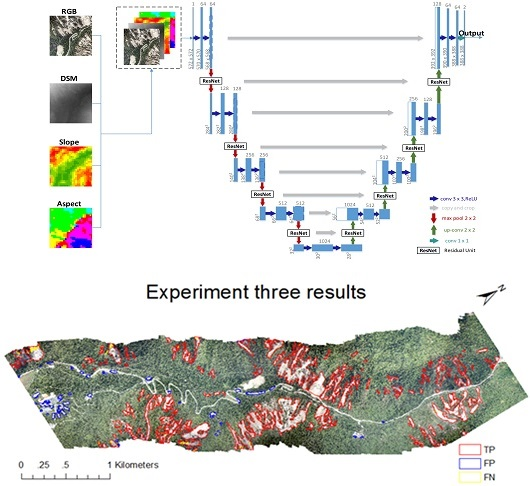
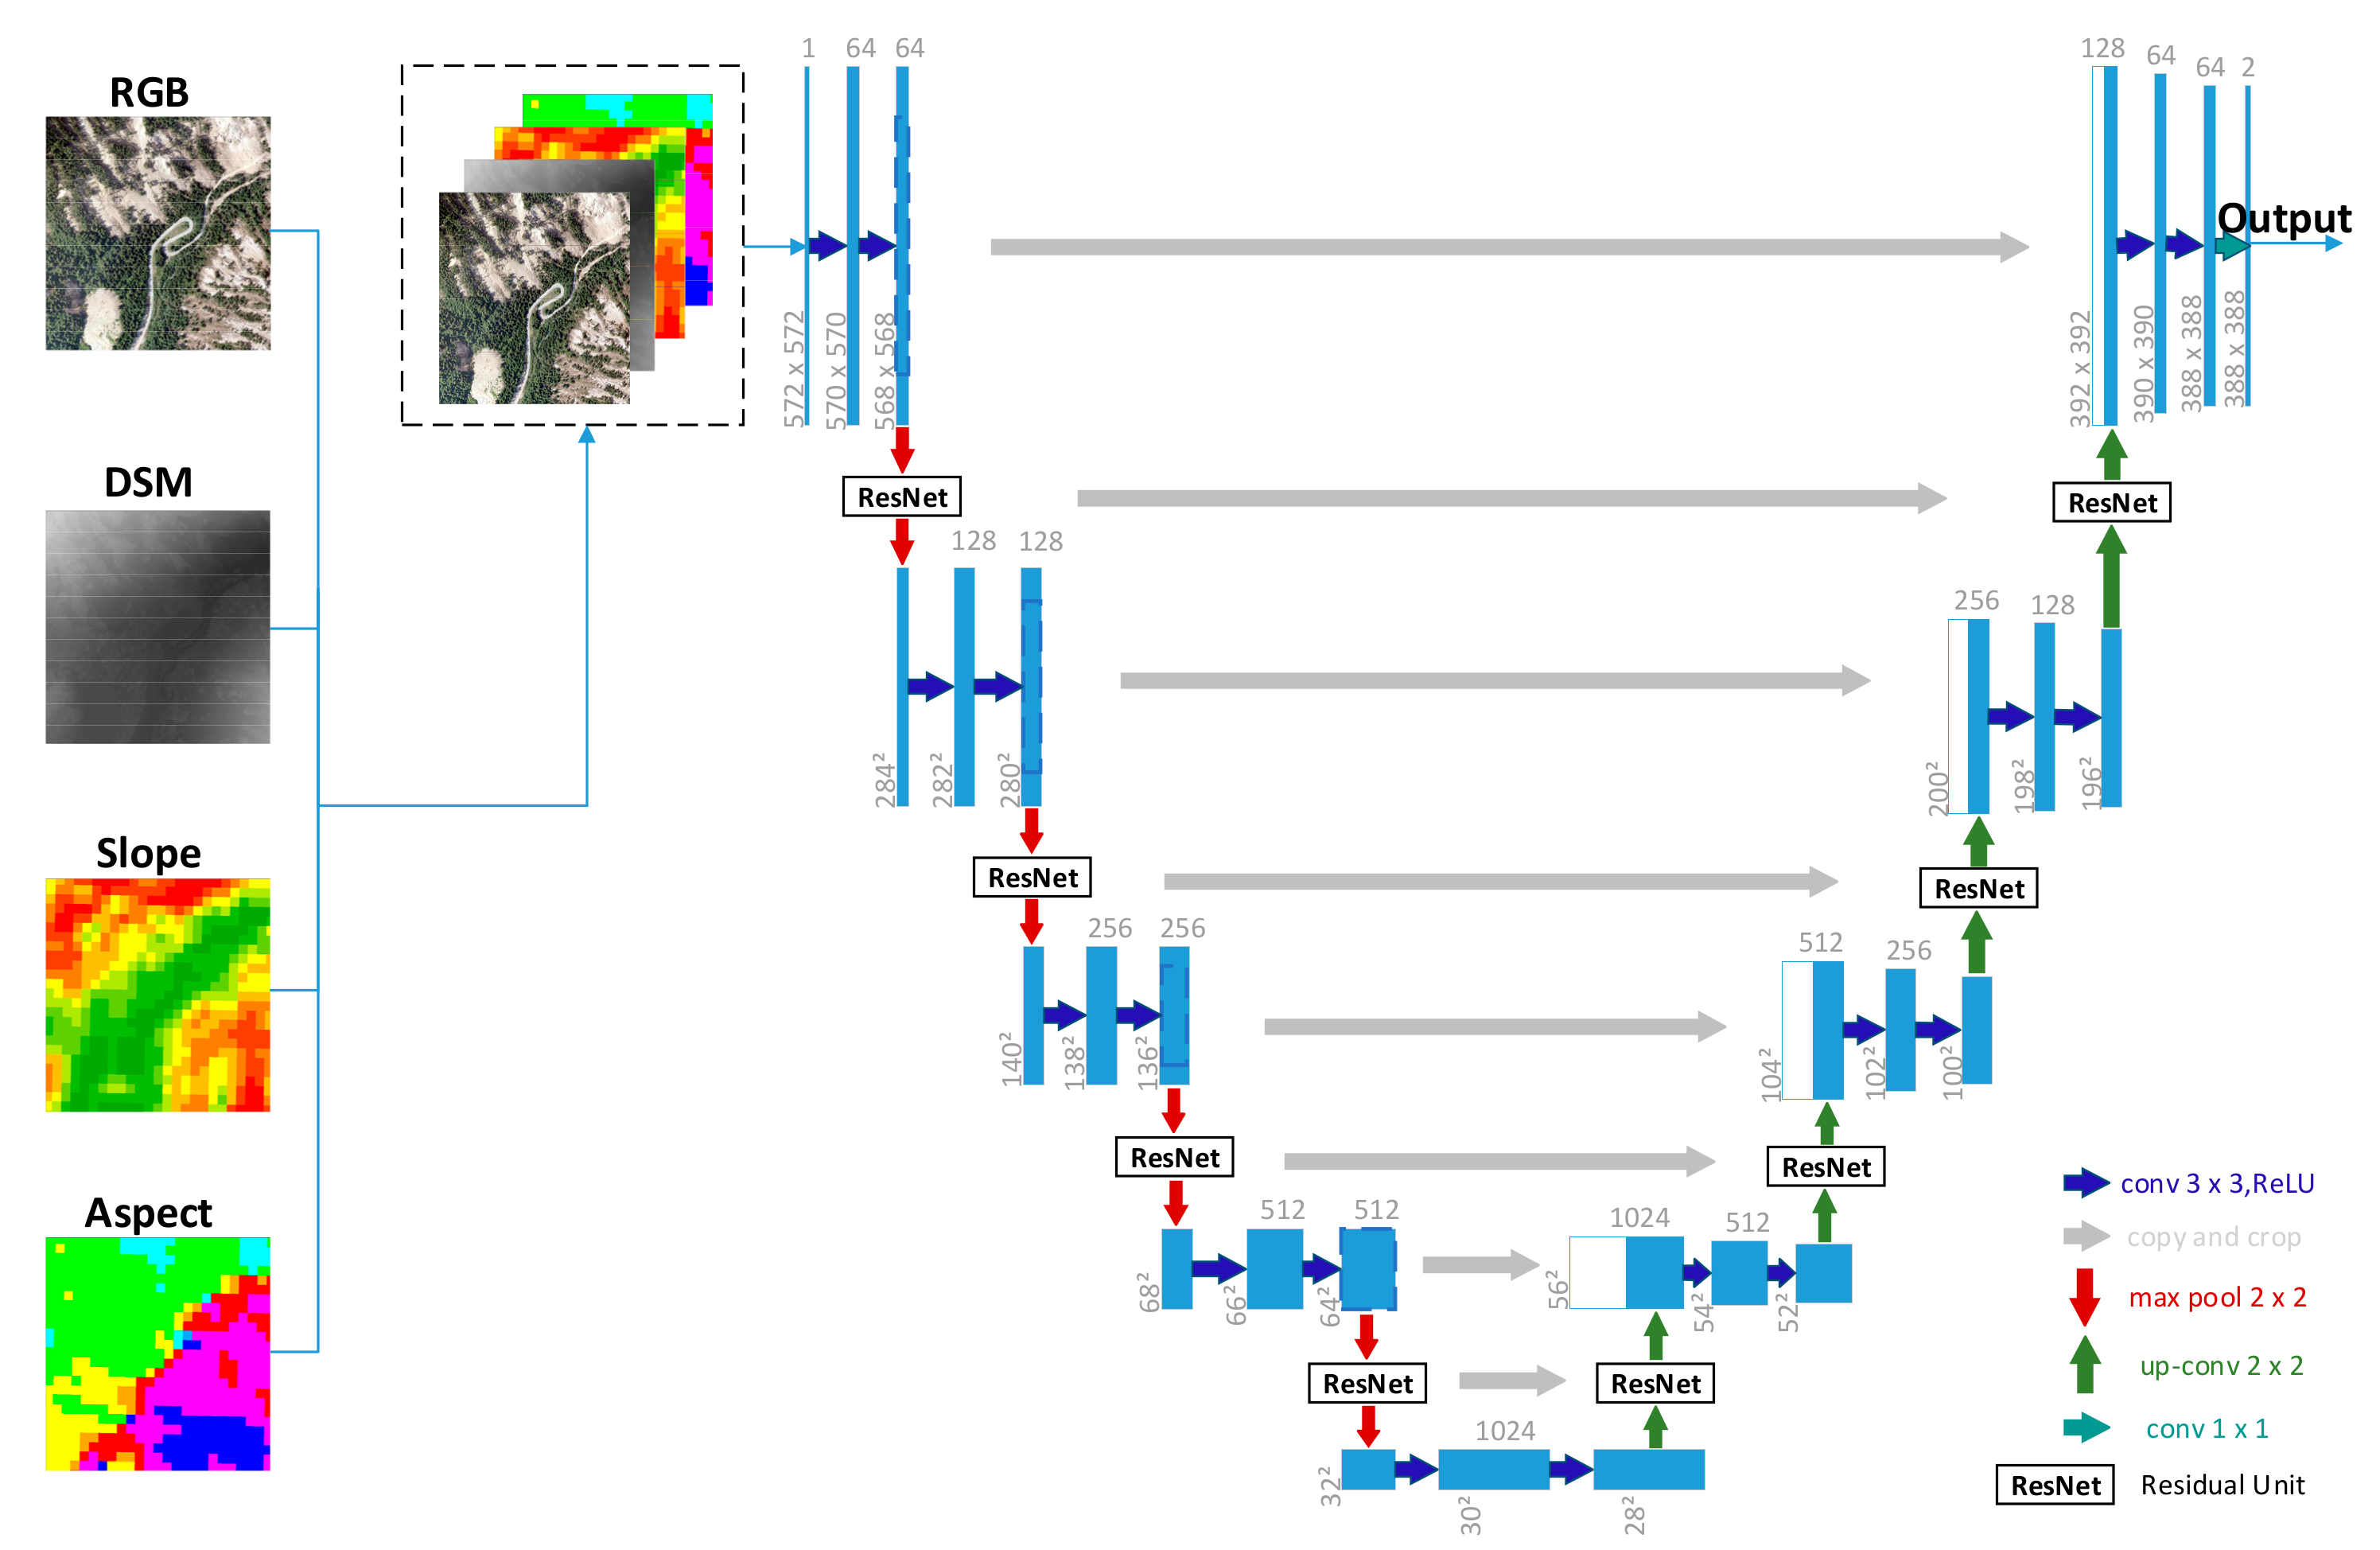
The structure of the improved U-Net network is shown in Figure 3.
(2) Flowchart of the Improved U-Net Model
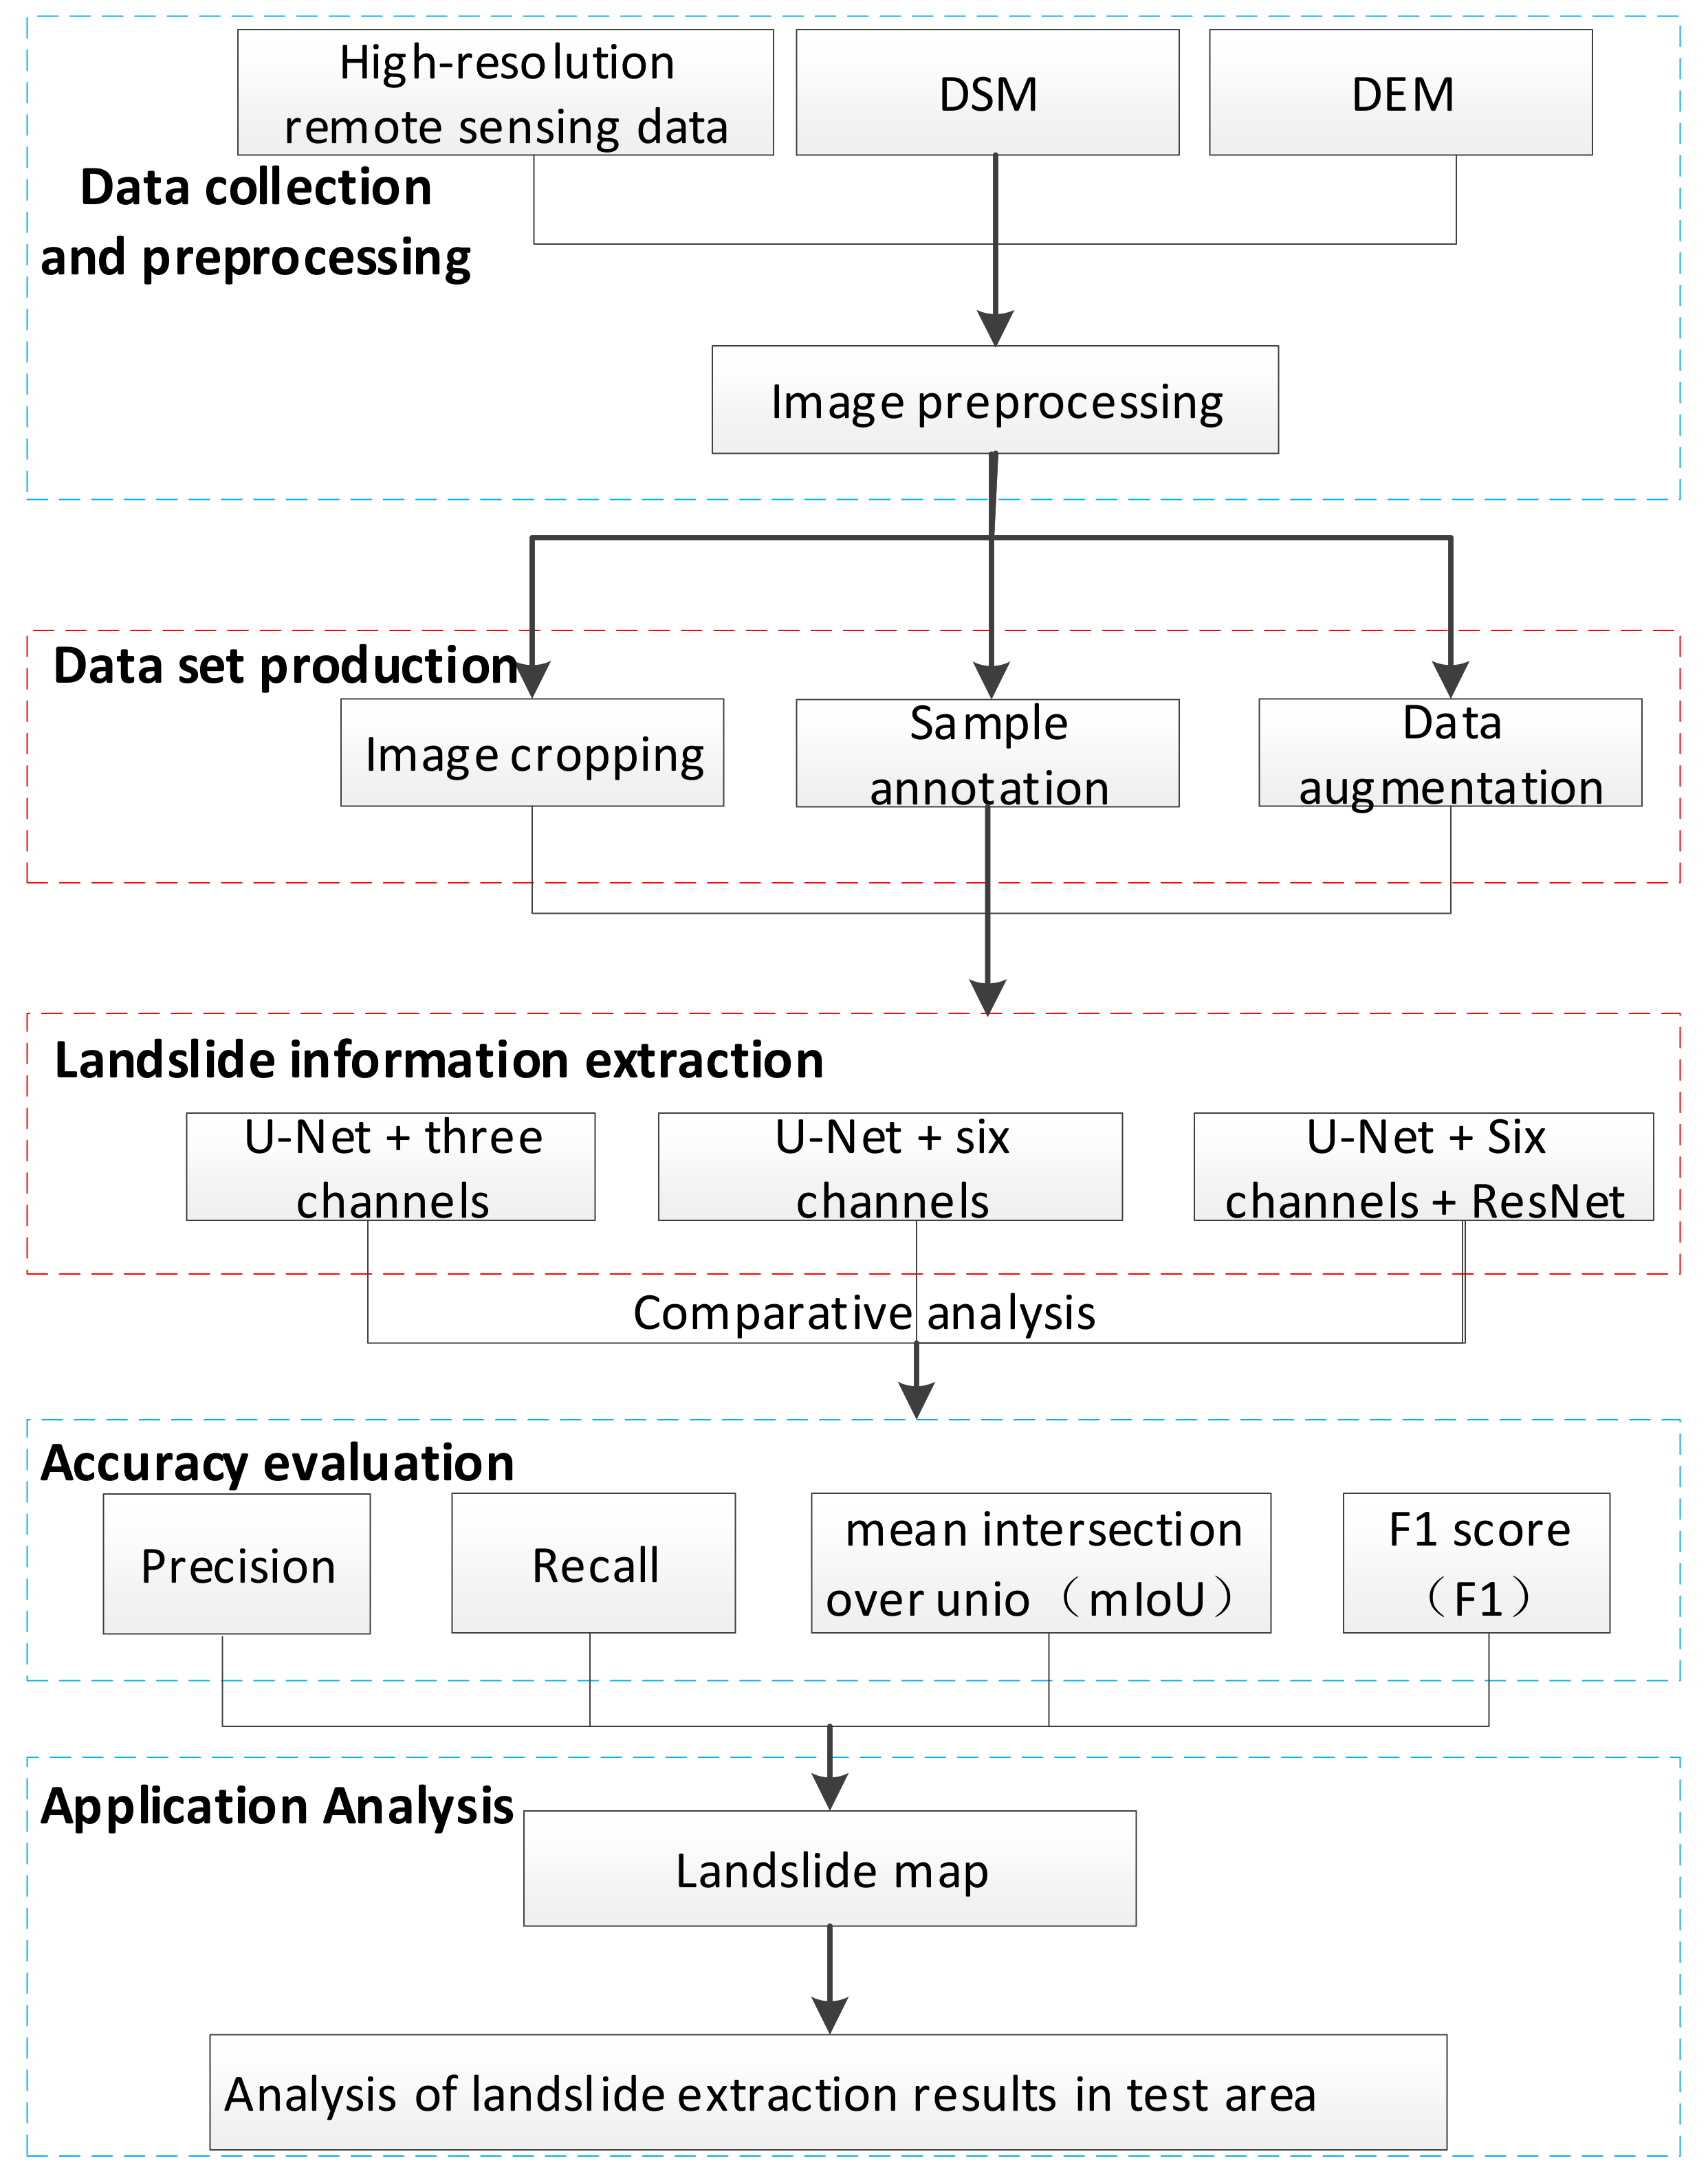
The main objective of this study was to use the U-Net model to automatically extract the earthquake-triggered landslides. Its flowchart is shown in Figure 4.
2.3. Accuracy Evaluation
In order to quantitatively evaluate the performance of the model, the precision, recall, F1 score [28], and mean intersection over union (mIoU) were used to quantitatively evaluate the model.
2.3.1. Precision and Recall
The precision refers to the proportion of the positive examples (landslides) in all the extracted results, and the recall refers to the proportion of the positive examples that are extracted among all the positive examples. Their formulas are as follows:
in which TP, FP, FN, and TN are shown in Table 1. TP is the number of positive examples that are correctly extracted. FP is the number of negative examples that are incorrectly extracted as positive examples. FN is the number of positive examples that have not been extracted, and TN is the number of negative cases that have not been extracted.
2.3.2. Mean Intersection over Union
Mean intersection over union is a standard metric for semantic segmentation [29]. It calculates the ratio of the intersection and union of two sets. In the problem of semantic segmentation, these two sets are the true value and the predicted value. In this paper, the two sets are the number of interpreted landslides and the number of predicted landslides. The larger the ratio, the higher the accuracy rate. Its equation is as follows:
in whichis the number of categories. In this paper, ; is the label of the ground truth value; is the label of the predicted value; is the number of pixels labeled and predicted as ; is the number of pixels labeled but predicted as ; and is the number of pixels labeled but predicted as .
2.3.3. F1 Score
The F1 score is defined as the harmonic average of Precision and Recall to evaluate the model. The higher the value of the F1 score, the better the performance of the model. Its equation is as follows:
3. Experiment
3.1. Study Area
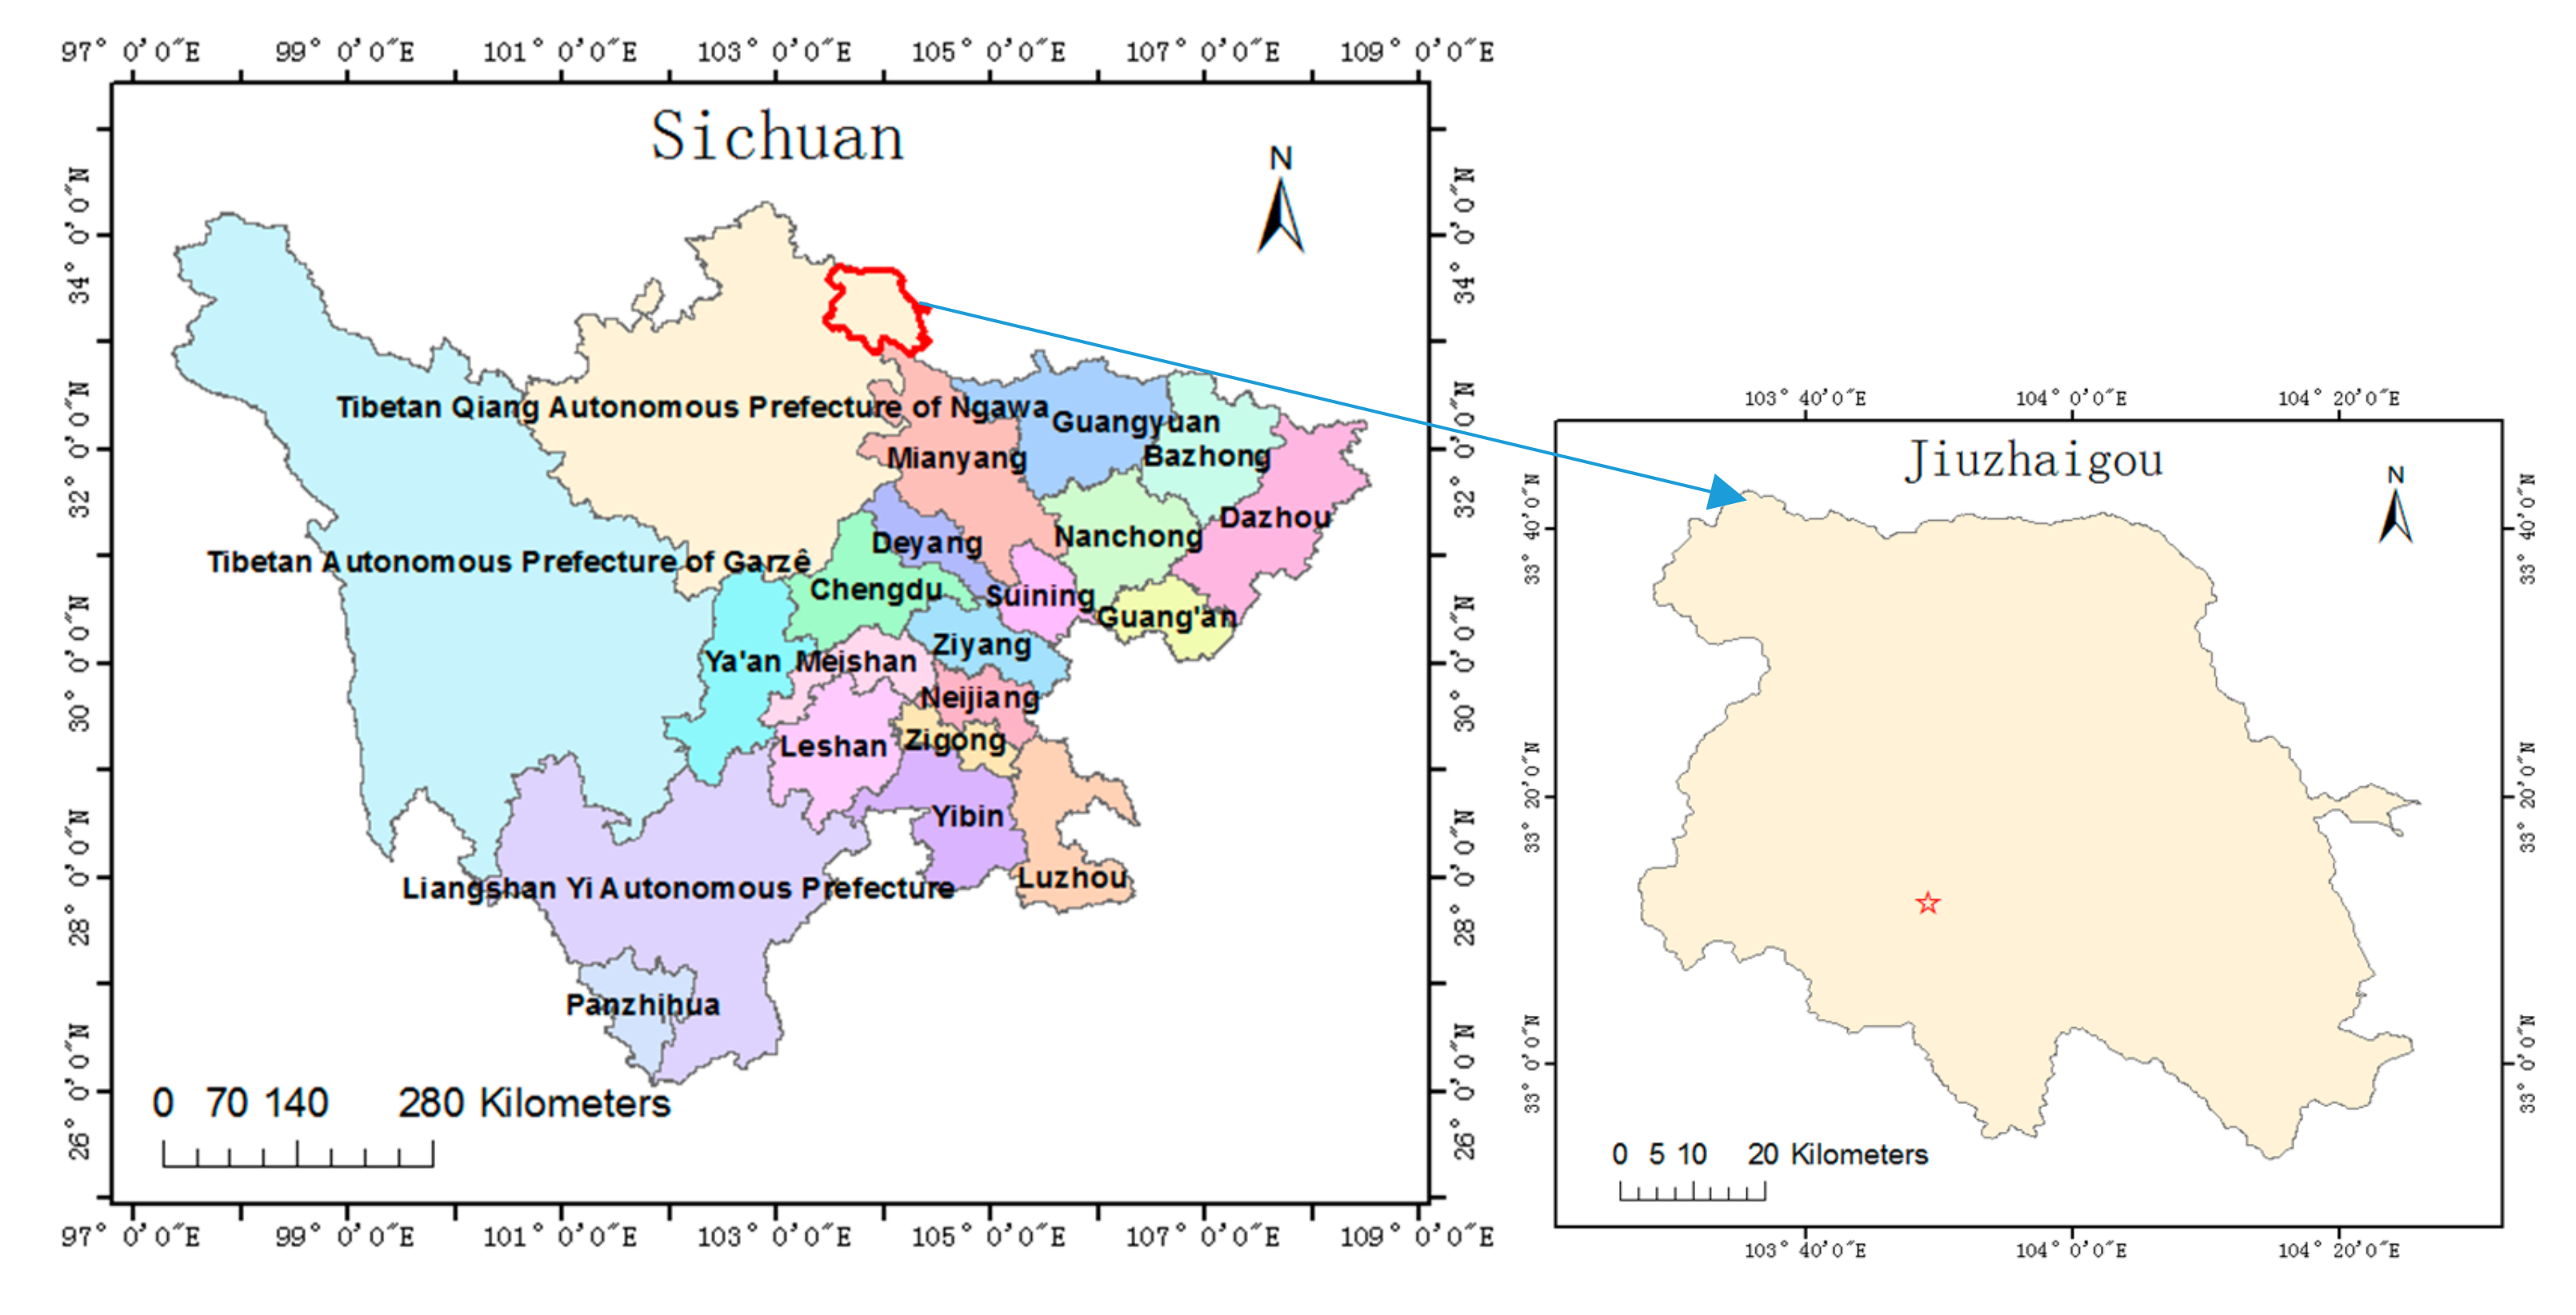
On the August 8th, 2017, a magnitude of 7.0 earthquake struck Jiuzhaigou County, Aba Prefecture, Northern Sichuan Province. As shown in Figure 5, the epicenter (33.2° N, 103.82° E) was located in the Jiuzhaigou County, Sichuan Province, and the focal depth was 20 km. Due to the steep terrain, a large number of landslides occurred, which lead to at least 29 roads to be blocked and damaged, and the total length of the damaged roads was about 4 kilometers. Investigating the spatial location of these landslides is essential for disaster reduction and relief, as well as the reconstruction of scenic areas [30].
3.2. Data
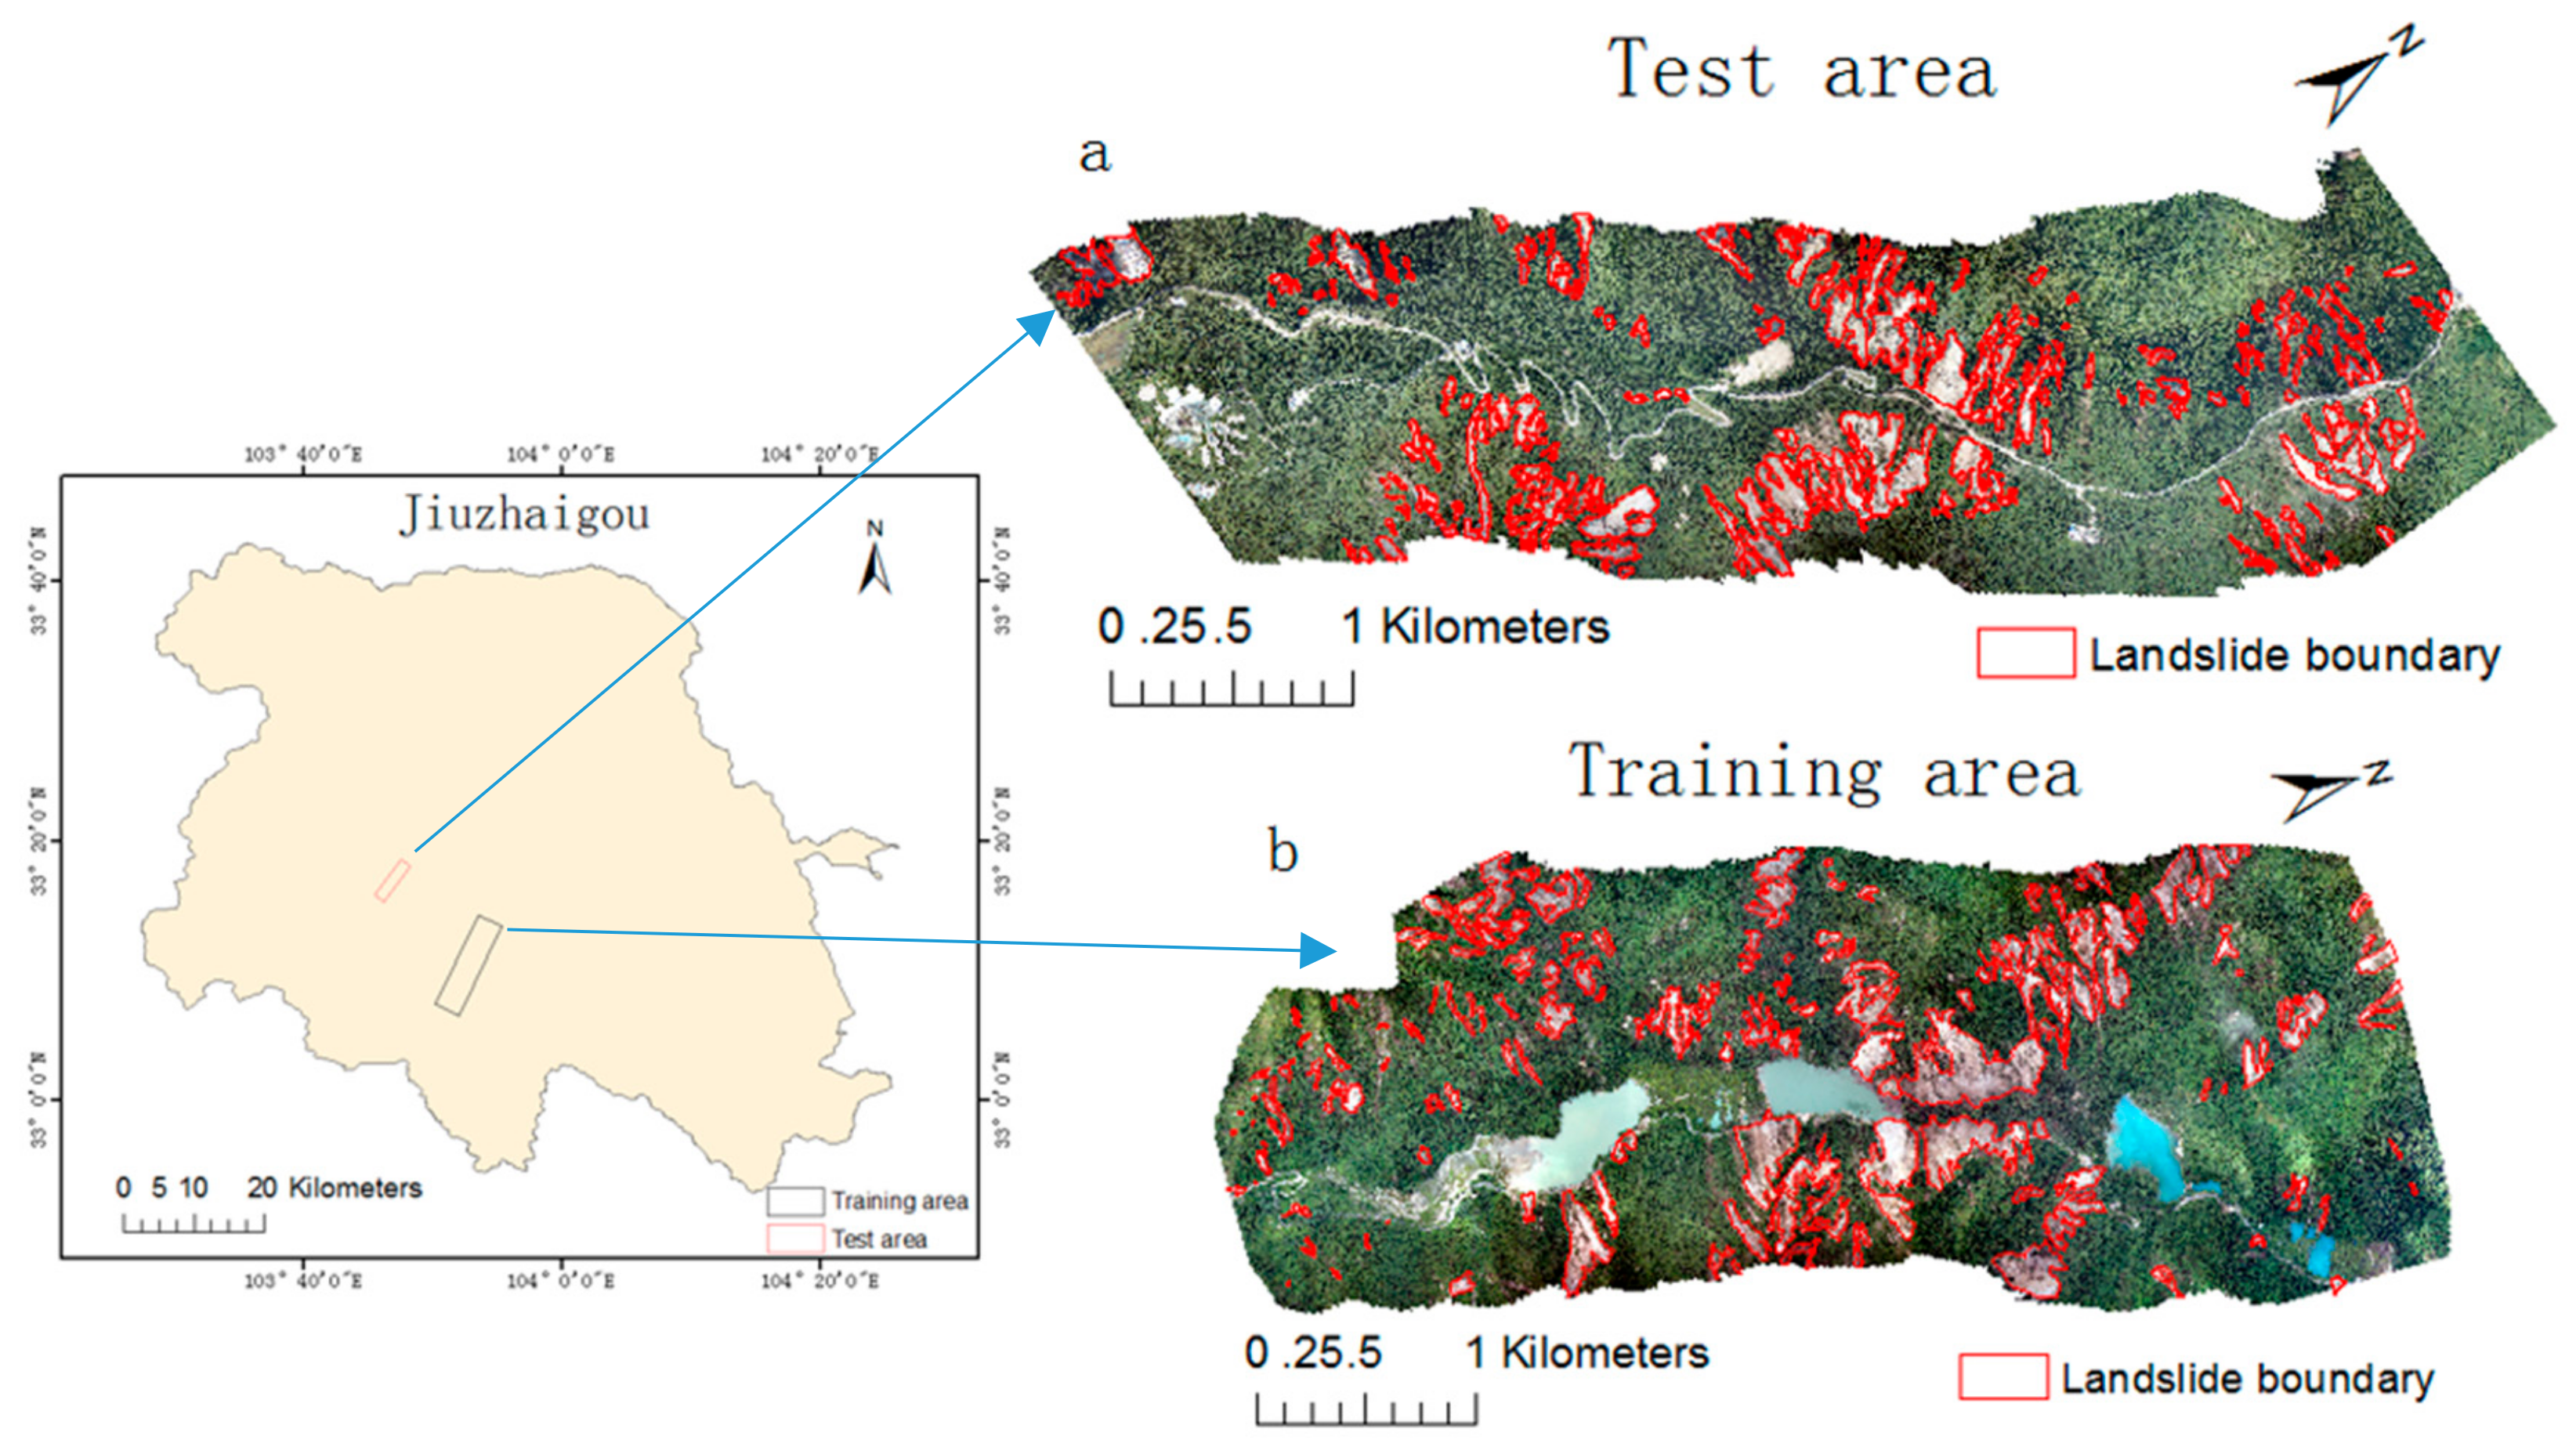
Shown in Figure 6a, 233 landslides in the area from Shangsizhai to Ganhaizi are used as the test set whose area is 12.6 km2 and the imagery spatial resolution is 0.47 m. Shown in Figure 6b, 366 landslides near the Panda Sea, Wuhuahai, and Jianzhuhai are used as the training set whose area is 34.6 km2 and the imagery spatial resolution is 0.14 m.
In this paper, DSM, slope, and aspect are used as the imagery spatial features. Firstly, normalize the pixel value of three layers to 0-255. Secondly, the three normalized layers are superimposed together to generate a three-channel image containing spatial information.
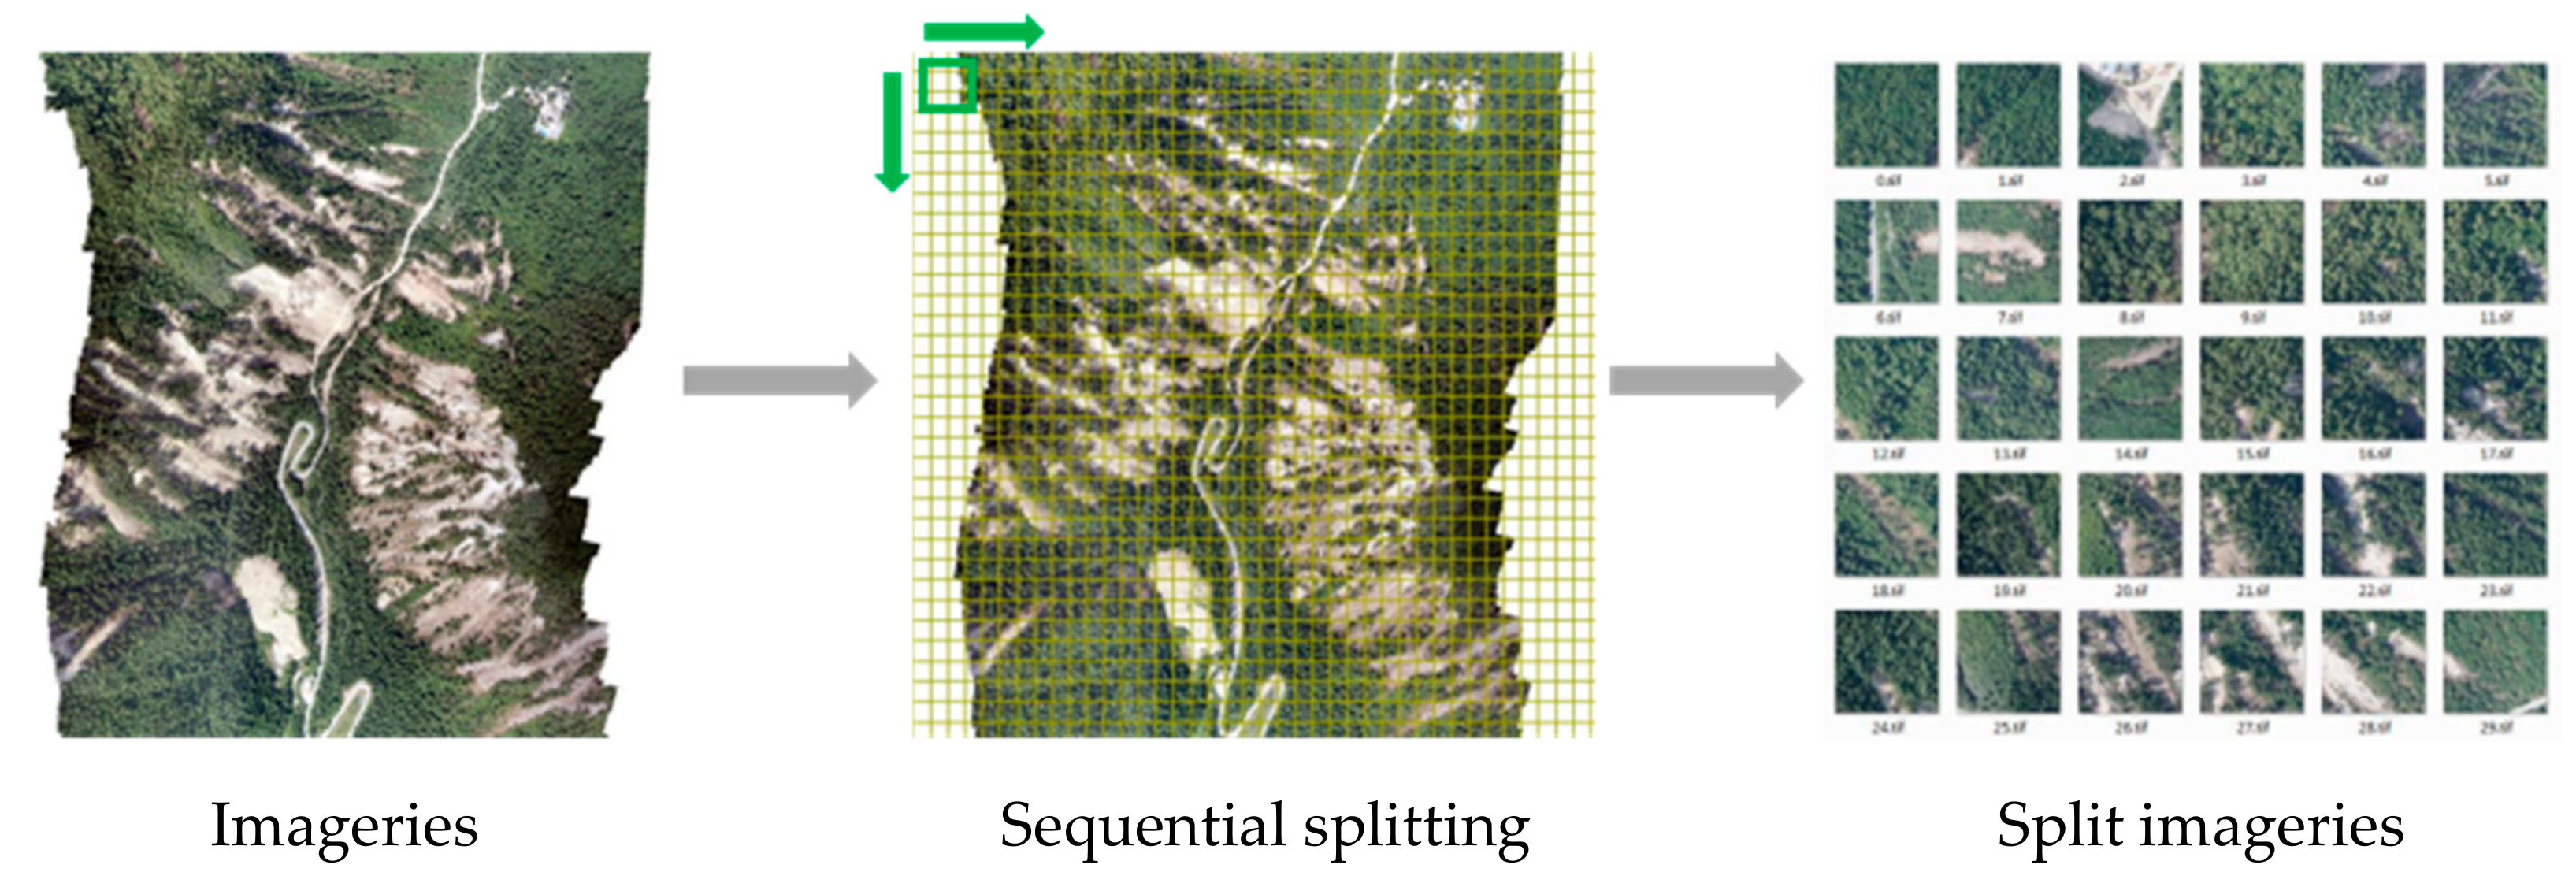
Due to the limited running memory of the computer, it is not possible to directly input large-sized imageries into the model for training. It is necessary to split remote-sensing imageries. Image blocks with a size of pixels were cut out from a large remote-sensing imagery. Small-sized imageries are put into the model for training in batches. This process speeds up the training and accelerates the landslides extraction during the image process, because convolution has a strong receptive field and can integrate contextual information. Therefore, the dimensions of split blocks have little effect on the landslide extraction. This paper uses the same method to split the original, labeled, and test imageries. The detailed splitting process of the test image is shown in Figure 7.
For deep-learning datasets, data enhancement, such as rotating and flipping, is usually applied on the original imageries. The main operations include 90°, 180°, and 270° rotating, horizontal flipping, and vertical flipping. Because landslides are in various directions, different structures and boundary shapes, rotating and flipping the training sets can increase the sample count on the one hand and improve the model’s accuracy on the other. However, during the later experiments, it was found that excessively rotating and flipping the imagery would easily cause overfitting of the model. The accuracy was only high on the training set, and it was difficult to improve the accuracy on the test set. After screening, the final enhancement method selected in this paper is 90° rotating, 270° rotating and horizontal flipping.
3.3. Experimental Environment
The hardware environment of this experiment: the graphics card is RTX2080Ti, the processor is Intel i7-8700K, and the memory is 32 G.
The software environment of this experiment: U-Net model and improved model are implemented by PyTorch. PyTorch is a lower-level API that focuses on processing array expressions directly, with greater flexibility and better control over it.
Based on the software and hardware environment and the datasets, three experiments were designed for comparison: the traditional U-Net model training and testing the three-channel RGB dataset; the traditional U-Net model training and testing the six-channel dataset, and the improved U-Net model to training and testing the six-channel dataset.
3.4. Results
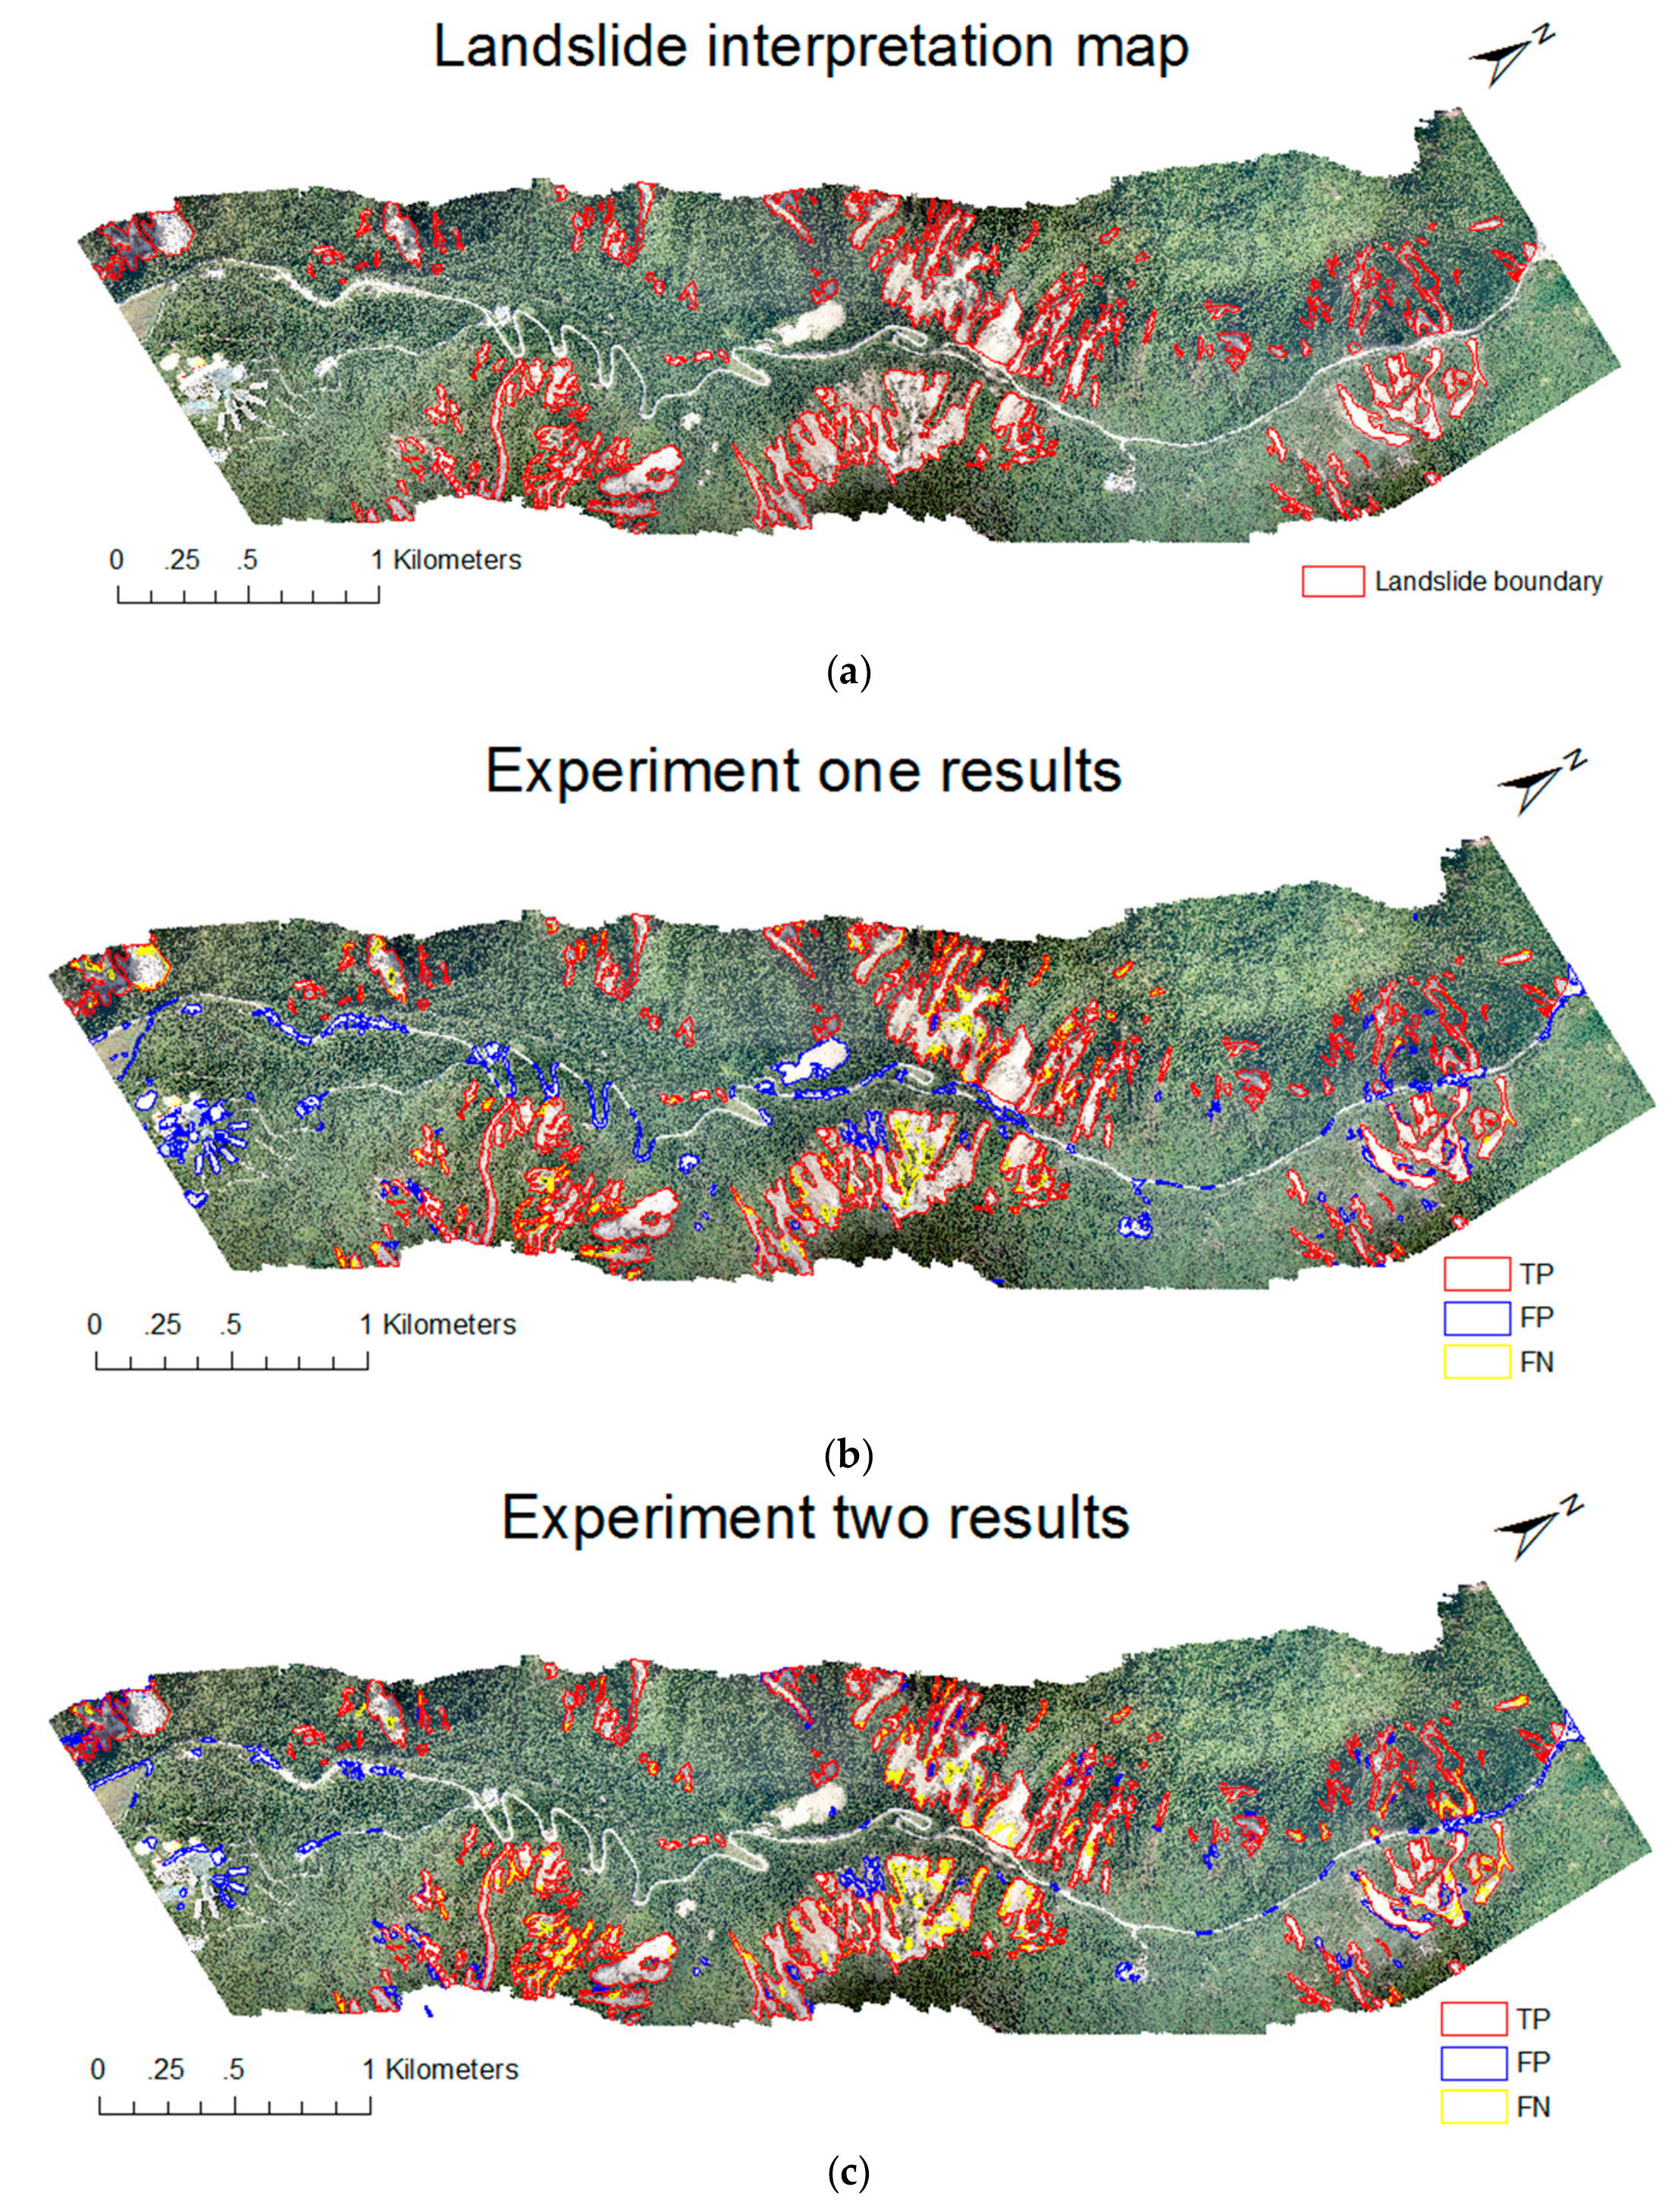
Landslides from Shangsizhai to Ganhaizi were extracted from the three experimentally trained models, and the results are shown as follows:
Figure 8a is a landslide distribution map obtained by manual visual interpretation, which provides a reference for the model extraction.
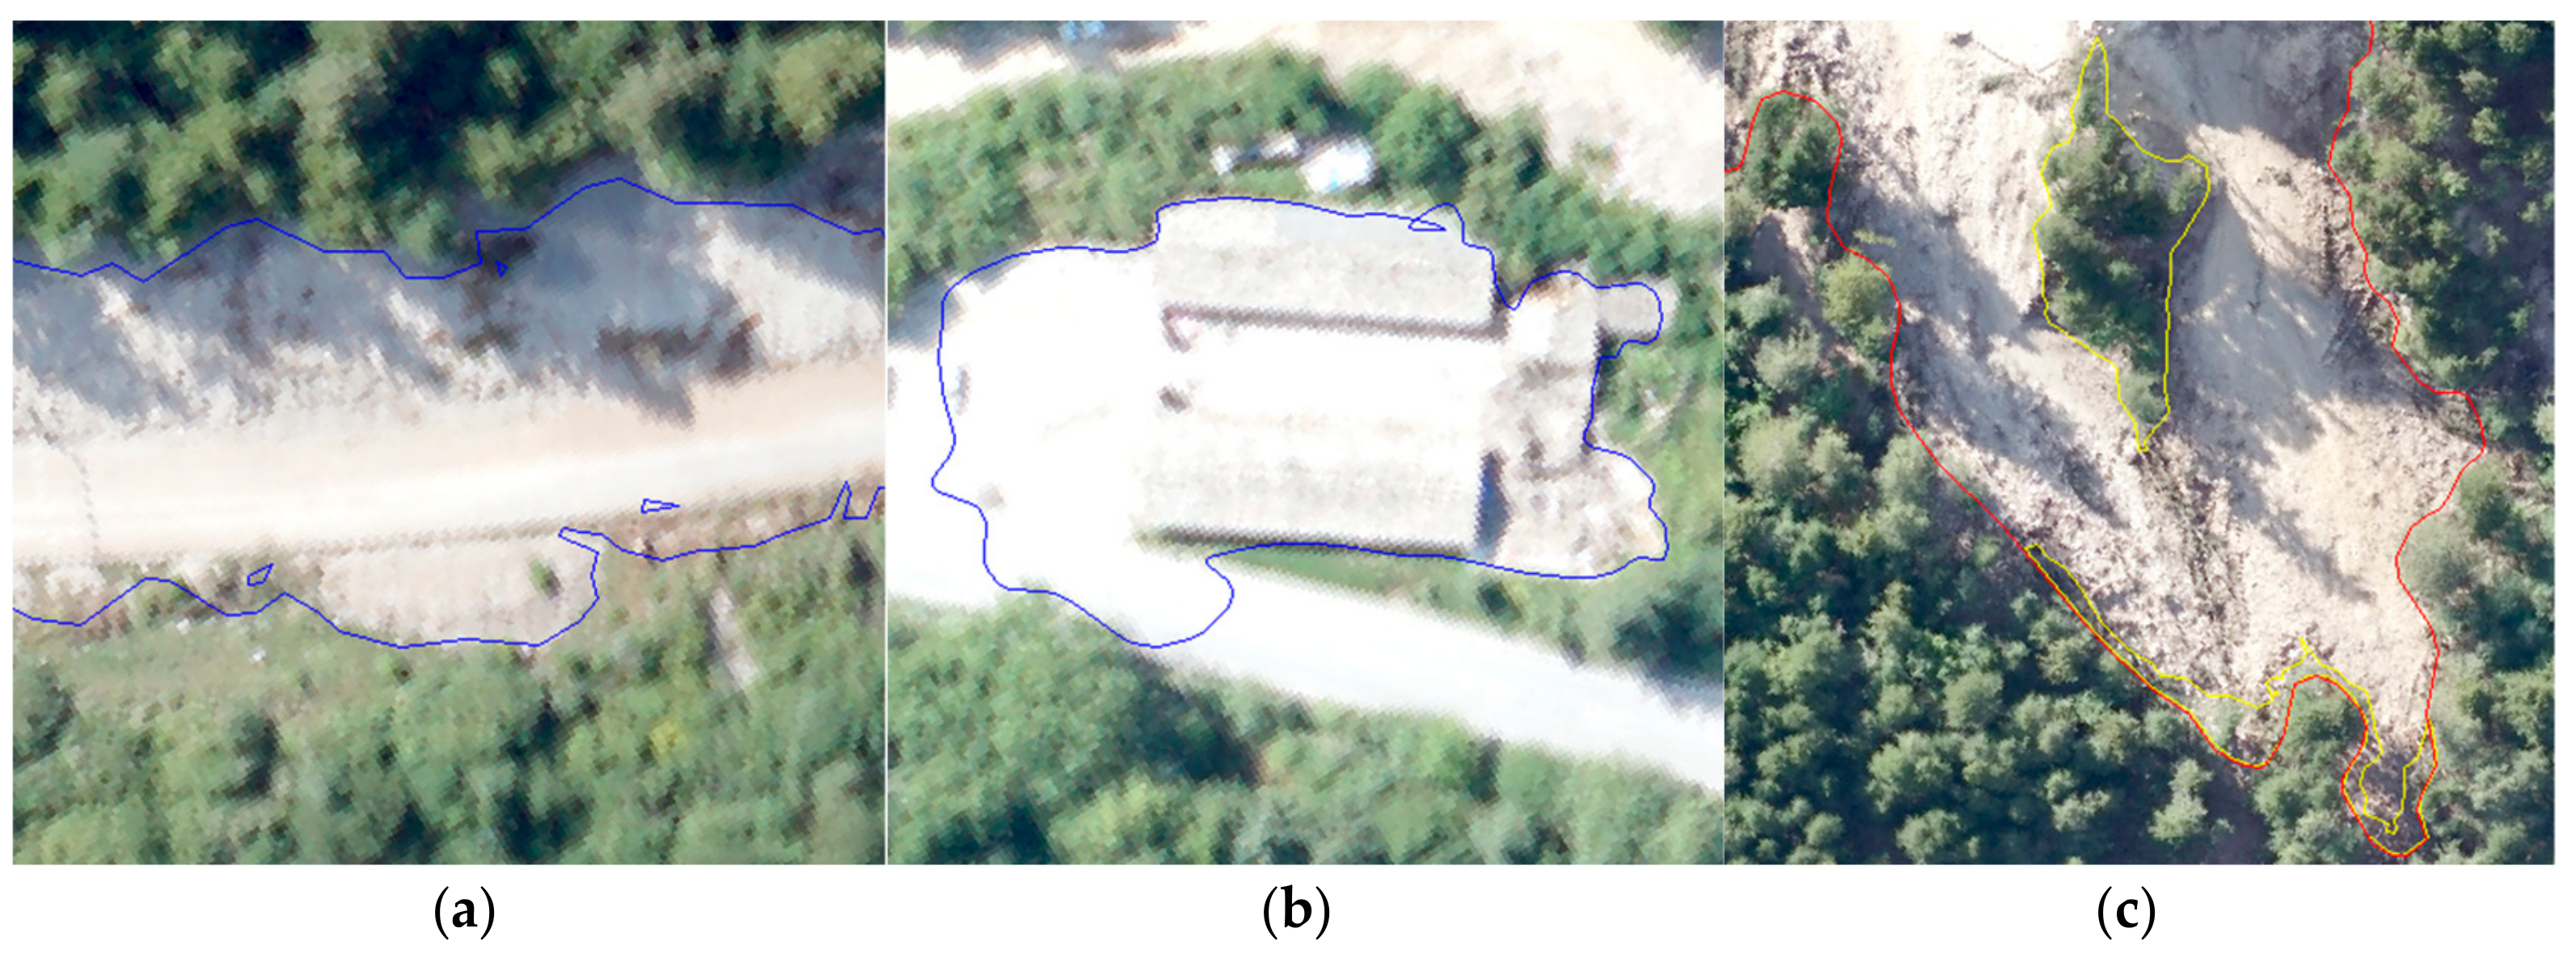
Figure 8b shows the results of the U-Net + three-channel extraction. It can be seen from the figure that the incorrect and missed cases are so obvious that the results are unsatisfactory. Main factors leading to false extraction are roads: Some roads in mountainous areas, or the slight accumulation of soil on the roads, is similar to landslides in color (see Figure 9a). At the same time, some houses that are similar in color are also incorrectly classified as parts of landslides (see Figure 9b); cases of misclassifications are mainly because the boundaries of the landslides cannot be identified well, and most of the missed extractions occur around the boundary. For some larger landslides, covering with a large amount of vegetation over part of the surface also causes missed extraction (see Figure 9c).
Figure 8c is the results of the U-Net + six-channel extraction. It can be seen that the incorrect landslides have been decreased due to the addition of spatial information. The ability to extract roads has been enhanced, and some roads that have been mistaken have been eliminated. However, the missed landslides still exist in the boundary of the landslides and the image blocks.
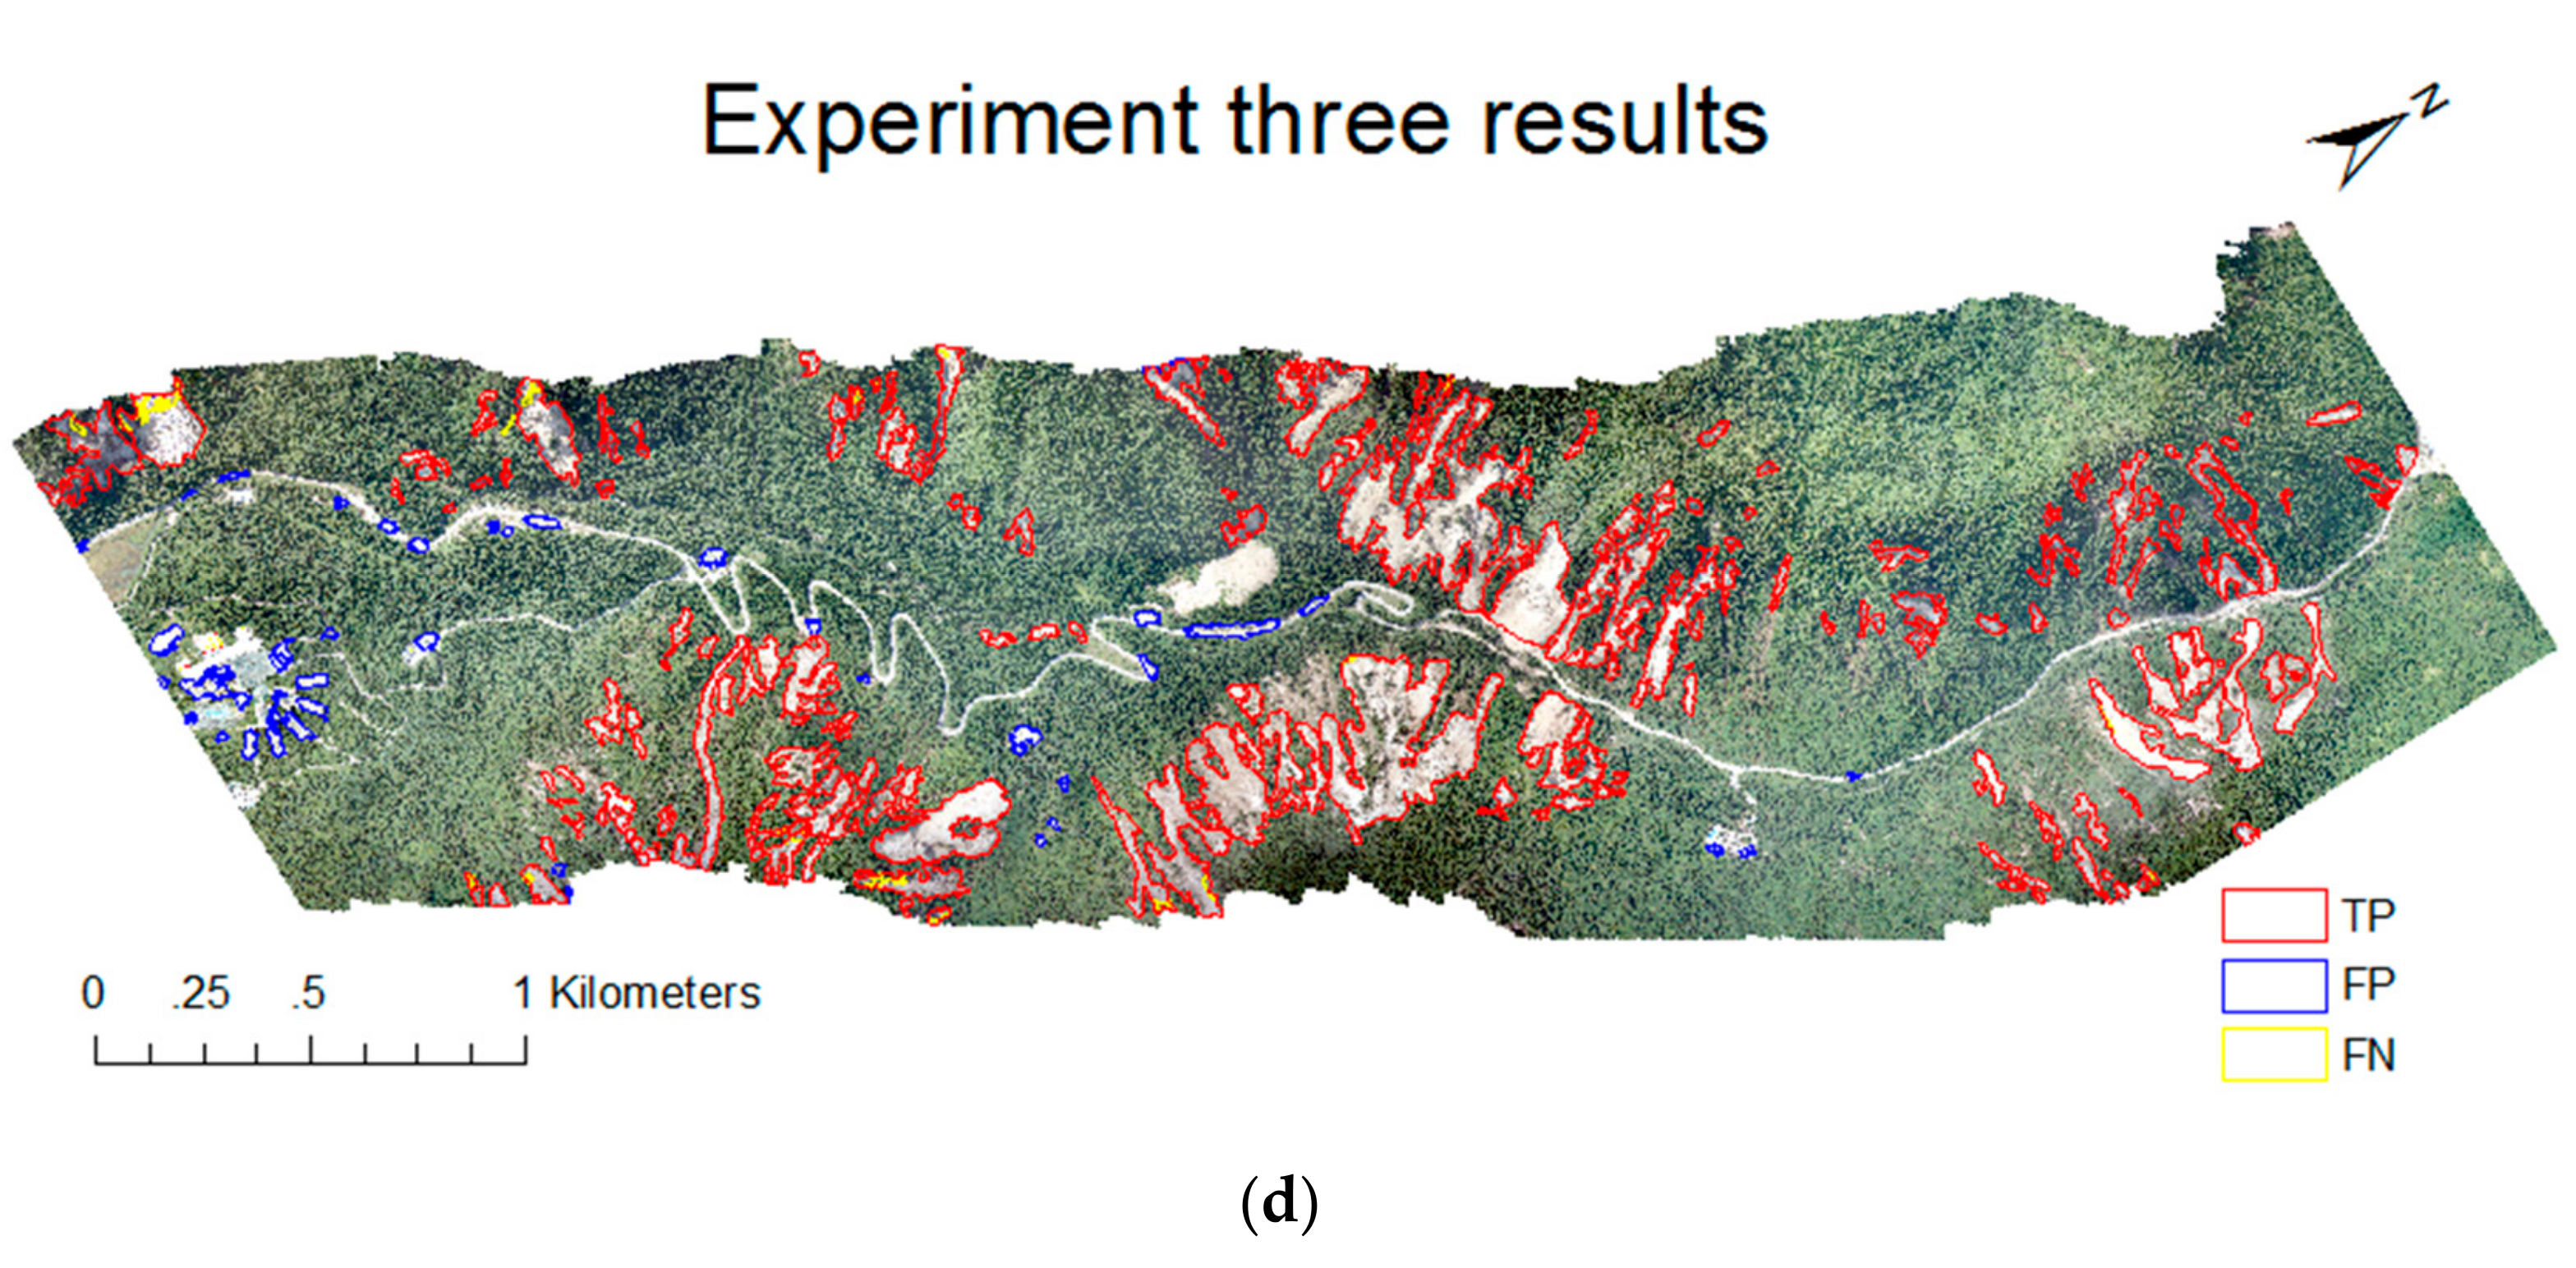
Figure 8d is the results of U-Net + six channels + ResNet. It can be seen that the overall extraction effect is satisfied; adding spatial information has corrected the misclassified roads and boundaries to a large scale.
In order to quantitatively evaluate the performance of the model and the extraction results of the test area, each accuracy index is calculated by calculating the confusion matrix of the extracted results. As shown in Table 2, Precision and Recall are obtained when the threshold is adjusted to maximize F1. The improved model U-Net + six channels + ResNet proposed in this paper has a precision of 91.3%, a Recall of 95.4%, and an mIoU of 87.5%. Each parameter is 13.8%, 13%, and 17.1% higher than that of the traditional U-Net + three-channel model, respectively.
4. Conclusions and Prospect
In this paper, a landslide dataset is labeled with post-earthquake aerial remote-sensing imageries, and an improved U-Net model is proposed for earthquake-triggered landslides extraction.
(1) In the U-Net model, with the adding of the samples spatial information, the number of incorrect and missed landslides extraction reduced.
In order to improve the accuracy of the extraction, the number of channels of the input imagery was extended from three channels to six channels. DSM, slope, and aspect, which contain spatial information, were added to the imagery to make a good distinction between roads, houses, and other features.
(2) In the U-Net model, a residual learning unit was added to improve the accuracy.
In order to fully extract the landslides by six channels, a residual learning unit was added to the traditional U-Net model to deepen the network layers. The results show that the improved U-Net model (U-Net + six channels + ResNet) got good results. The precision on the test set is 91.3%, the recall is 95.4%, and the mIoU is 87.5%. Compared with the traditional U-Net model, it has been improved by 13.8%, 13%, and 17.1%, respectively.
(3) The improved U-Net model is feasible for extracting earthquake-triggered landslides.
Taking Jiuzhaigou earthquake-triggered landslides as an example, the results show that the improved U-Net model (U-Net + six channels + ResNet) is feasible and effective for landslides extraction using high-resolution remote sensing imageries. Compared with other methods, the model only needs to obtain the unmanned aerial vehicle (UAV) remote-sensing data in the post-earthquake area, which can save the time of acquiring remote-sensing imageries before the earthquake or no suitable data after the earthquake. After a Jiuzhaigou earthquake happens, the following three steps will be taken for quick response. Firstly, emergency response. It takes about an hour to prepare the UAV and arrive at the area. The first batch of data, including high-resolution remote-sensing imageries and DEM will be stored and distributed within three hours. Secondly, mosaic and geometric correction will take place. It takes no more than 30 minutes to mosaic 500 imageries (covering about 7–8 ), and the geometric correction efficiency is 20 GB/h, as the error in the plain is less than 1 pixel, and the error in the mountains is less than 3 pixels. Thirdly, image processing and result extraction will take place. It takes 2–4 hours to make the landslide map in the severely afflicted area and 6–8 hours to complete the whole area using the proposed method.
This research mainly serves earthquake emergency departments, including the Sichuan Earthquake Administration, the Xinjiang Earthquake Administration, and the Gansu Earthquake Administration. They have used the high-resolution remote-sensing data and these results for quick response and have given improvement suggestions to the proposed method in this paper.
Due to the small amount of data on seismic landslides, there are still some errors in the extracted landslides. Expanding the training datasets, including remote sensing imageries with different types and resolutions, is a future work.
Author Contributions
All authors contributed in a substantial way to the manuscript. P.L. and Q.W. conceived of, designed, performed the research and wrote the manuscript. Y.W., Y.C. and J.X. made contributions to the design of the research, data analysis and manuscript modifications. All authors read and approved the submitted manuscript.
Funding
This research was funded in part by the National Key Research and Development Program of China (Grant No. 2017YFC1500902), in part by the Special Program for 100 people in Hainan Province, in part by the Key Science and Technology Program of Hainan province (Grant No. ZDKJ2019006) and in part by the Second Tibetan Plateau Scientific Expedition and Research (STEP) (Grant No. 2019QZKK0806).
Acknowledgments
The authors would like to thank the Sichuan Earthquake Administration for offering the unmanned aerial vehicle remote sensing data, the anonymous reviewers and editors for their very competent comments and helpful suggestions.
Conflicts of Interest
The authors declare no conflicts of interest.
References
- Yin, Y.; Wang, F.; Sun, P. Landslide hazards triggered by the 2008 Wenchuan earthquake, Sichuan, China. Landslides 2009, 6, 139–151. [Google Scholar] [CrossRef]
- Corominas, J.; van Westen, C.; Frattini, P.; Cascini, L.; Malet, J.P.; Fotopoulou, S.; Catani, F.; Van Den Eeckhaut, M.; Mavrouli, O.; Agliardi, F.; et al. Recommendations for the quantitative analysis of landslide risk. Bull. Eng. Geol. Environ. 2014, 73, 209–263. [Google Scholar] [CrossRef]
- Li, W.; Wu, Q.; Lv, B. Research on Landslide Triggered by Earthquake: Review and Prospect. J. Catastrophol. 2011, 26, 103–108. [Google Scholar]
- Dell’acqua, F.; Gamba, P. Remote Sensing and Earthquake Damage Assessment: Experiences, Limits, and Perspectives. Proc. IEEE 2012, 100, 2876–2890. [Google Scholar] [CrossRef]
- Zhao, Y. Principles and Methods in Remote Sensing Application and Analysis; Science Press: Beijing, China, 2003; pp. 188–190. [Google Scholar]
- Al-Zuhairi, M.; Pradhan, B. Landslide Detection Using Residual Networks and the Fusion of Spectral and Topographic Information. IEEE Access 2019, 7, 114363–114373. [Google Scholar]
- Zhao, B.; Wang, S.Y.; Luo, H.Y.; Li, J.; Zhang, X.; Shen, T. Landslides and dam damage resulting from the Jiuzhaigou earthquake (8 August 2017), Sichuan, China. R. Soc. Open Sci. 2018, 5, 171418. [Google Scholar] [CrossRef] [PubMed] [Green Version]
- Pu, J. Principles and Methods of Visual Interpretation of Remote Sensing Images; Science and technology of China Press: Beijing, China, 1992; pp. 169–183. [Google Scholar]
- Xu, C.; Xu, X.; Shyu, J.B.H.; Gao, M.; Tan, X.; Ran, Y.; Zheng, W. Landslides triggered by the 20 April 2013 Lushan, China, Mw 6.6 earthquake from field investigations and preliminary analyses. Landslides 2015, 12, 365–385. [Google Scholar] [CrossRef]
- Wang, Z. Digital landslide technology and its application in investigation of Tiantai Town landslide. Chin. J. Geotech. Eng. 2006, 4, 516–520. [Google Scholar]
- Huang, J.; Xie, M.; Hu, H. Quick-Bird Image Based Recognition of Remote Sensing Information of Geo-hazards. Land Resour. Informatiz. 2010, 2, 25–30. [Google Scholar]
- Xu, C.; Dai, F.; Chen, J. Detailed interpretation of remote sensing for secondary geological hazards in the worst-hit areas of wenchuan Ms8.0 earthquake. J. Remote Sens. 2009, 13, 754–762. [Google Scholar]
- Zhu, J. Research on Landslide Information Extraction in Baoxing Base on GF-1 Image; Chengdu University of Technology: Chengdu, China, 2015. [Google Scholar]
- Wang, Q.; Lin, Q.; Li, M.; Wang, L.M.; Tian, Q.J. A Target-Highlighting Method in Multispectral Remote Sensing. Spectrosc. Spectr. Anal. 2009, 29, 1018–1022. [Google Scholar]
- Li, S.; Wang, J.; Bi, Y.; Chen, Y.; Zhu, M.; Yang, S.; Zhu, J. Review of classification methods for remote sensing images. Remote Sens. Land Resour. 2005, 8, 1–6. [Google Scholar]
- Liu, J. Application of Fine Terrain Modeling Based on UAV Images in Landslide Identification; Southwest University of Science And Technology: Chengdu, China, 2019. [Google Scholar]
- Ding, H.; Zhang, M.; Li, L. Object-oriented regional landslide recognition based on multi-feature. Remote Sens. Technol. Appl. 2013, 28, 1107–1113. [Google Scholar]
- Yu, H.; Zhang, S.; Kong, B.; Li, X. Optimal Segmentation Scale Selection for Object-oriented Remote Sensing Image Classification. J. Image Graph. 2010, 15, 352–360. [Google Scholar]
- Wang, Q.; Chen, Y.; Lin, Q. Surface Collapse Identification and Its Boundary Extraction Using High Resolution Remote Sensing. Remote Sens. Land Resour. 2011, 23, 113–116. [Google Scholar]
- Ding, L.; Zhang, Y.; Zhang, X. Overview of image segmentation methods and performance evaluation. Comput. Eng. Softw. 2010, 31, 78–83. [Google Scholar]
- Vaduva, C.; Gavat, I.; Datcu, M. Deep learning in very high resolution remote sensing image information mining communication concept. In Proceedings of the 2012 20th European Signal Processing Conference (EUSIPCO), Barcelona, Spain, 15 May 2012. [Google Scholar]
- Yu, W. Application Research of Remote Sensing Image Classification Based on Deep Learning; Guizhou University: Guizhou, China, 2019. [Google Scholar]
- Ronneberger, O.; Fischer, P.; Brox, T. U-Net: Convolutional Networks for Biomedical Image Segmentation; Springer: Berlin/Heidelberg, Germany, 2015. [Google Scholar]
- Liu, W. Classification of High-Resolution Remote Sensing Images Based on Deep Learning of Multi-Class, Features; Beijing University of Civil Engineering and Architecture: Beijing, China, 2019. [Google Scholar]
- Zhang, M.; Xue, Y.; Li, J.; Shang, C. Research on Remote Sensing Extraction of Collapse and Landslide Disasters Based on DEM. Mine Surv. 2016, 44, 28–31. [Google Scholar]
- He, K.; Zhang, X.; Ren, S.; Sun, J. Deep Residual Learning for Image Recognition. In Proceedings of the 2016 IEEE Conference on Computer Vision and Pattern Recognition (CVPR), Seattle, WA, USA, 27–30 June 2016; pp. 770–778. [Google Scholar]
- Liang, S. Research on Breast Ultrasound Image Tumor Segmentation Based on Residual Learning U-shaped Convolutional Neural Network; South China University of Technology: Guangzhou, China, 2018. [Google Scholar]
- Tian, Y.; Yang, G.; Wang, Z.; Wang, H.; Li, E.; Liang, Z. Apple detection during different growth stages in orchards using the improved YOLO-V3 model. Comput. Electron. Agric. 2019, 157, 417–426. [Google Scholar] [CrossRef]
- Ghorbanzadeh, O.; Blaschke, T.; Gholamnia, K.; Meena, S.R.; Tiede, D.; Aryal, J. Evaluation of Different Machine Learning Methods and Deep-Learning Convolutional Neural Networks for Landslide Detection. Remote Sens. 2019, 6, 11–21. [Google Scholar] [CrossRef] [Green Version]
- Xu, Q.; Ouyang, C.; Jiang, T.; Fan, X.; Cheng, D. DFPENet-geology: A Deep Learning Framework for High Precision Recognition and Segmentation of Co-seismic Landslides. Remote Sens. Environ. 2019, 15, 16–43. [Google Scholar]
Figure 1.
U-Net model structure diagram.

Figure 2.
(a) Residual learning unit; (b) Two-layer residual learning unit.

Figure 3.
Structure of the improved U-Net network.

Figure 4.
Flowchart of U-Net model.

Figure 5.
Location of the study area.

Figure 6.
Test (a) and training (b) area locations.

Figure 7.
Dataset production.

Figure 8.
Extraction results. (a) Landslide distribution map obtained by manual visual interpretation; (b) Results of the U-Net + three-channel extraction; (c) Results of the U-Net + six-channel extraction; (d) Results of U-Net + six channels + ResNet.
Figure 8.
Extraction results. (a) Landslide distribution map obtained by manual visual interpretation; (b) Results of the U-Net + three-channel extraction; (c) Results of the U-Net + six-channel extraction; (d) Results of U-Net + six channels + ResNet.


Figure 9.
(a) Incorrect extraction; (b) incorrect extraction; and (c) missed mentions.


Table 1.
Confusion matrix between predicted value and true value.
| True Value Predicted Value | Landslides | Others |
|---|---|---|
| landslides | True Positive () | False Positive () |
| Others | False Negative () | True Negative () |
Table 2.
Comparison between traditional U-Net and improved models.
| Precision/% | Recall/% | mIoU/% | F1/% | |
|---|---|---|---|---|
| U-Net + three channels | 77.5 | 82.4 | 70.4 | 79.8 |
| U-Net + six channels | 83.2 | 85.1 | 76.1 | 83.1 |
| U-Net + six channels + ResNet | 91.3 | 95.4 | 87.5 | 93.3 |
© 2020 by the authors. Licensee MDPI, Basel, Switzerland. This article is an open access article distributed under the terms and conditions of the Creative Commons Attribution (CC BY) license (http://creativecommons.org/licenses/by/4.0/).
Share and Cite
MDPI and ACS Style
Liu, P.; Wei, Y.; Wang, Q.; Chen, Y.; Xie, J. Research on Post-Earthquake Landslide Extraction Algorithm Based on Improved U-Net Model. Remote Sens. 2020, 12, 894. https://0-doi-org.brum.beds.ac.uk/10.3390/rs12050894
AMA Style
Liu P, Wei Y, Wang Q, Chen Y, Xie J. Research on Post-Earthquake Landslide Extraction Algorithm Based on Improved U-Net Model. Remote Sensing. 2020; 12(5):894. https://0-doi-org.brum.beds.ac.uk/10.3390/rs12050894
Chicago/Turabian StyleLiu, Peng, Yongming Wei, Qinjun Wang, Yu Chen, and Jingjing Xie. 2020. "Research on Post-Earthquake Landslide Extraction Algorithm Based on Improved U-Net Model" Remote Sensing 12, no. 5: 894. https://0-doi-org.brum.beds.ac.uk/10.3390/rs12050894
Note that from the first issue of 2016, this journal uses article numbers instead of page numbers. See further details here.