Tracing Leaf Photosynthetic Parameters Using Hyperspectral Indices in an Alpine Deciduous Forest


1
Faculty of Agriculture, Shizuoka University, Shizuoka 422-8529, Japan
2
Research Institute of Green Science and Technology, Shizuoka University, Shizuoka 422-8529, Japan
*
Author to whom correspondence should be addressed.
Remote Sens. 2020, 12(7), 1124; https://0-doi-org.brum.beds.ac.uk/10.3390/rs12071124
Submission received: 7 March 2020
/
Revised: 25 March 2020
/
Accepted: 31 March 2020
/
Published: 1 April 2020
(This article belongs to the Section Biogeosciences Remote Sensing)
Abstract
:Leaf photosynthetic parameters are important in understanding the role of photosynthesis in the carbon cycle. Conventional approaches to obtain information on the parameters usually involve long-term field work, even for one leaf sample, and are, thus, only applicable to a small area. The utilization of hyperspectral remote sensing especially of various vegetation indices is a promising approach that has been attracting increasing attention recently. However, most hyperspectral indices are only applicable to a specific area and specific forest stands, depending heavily on the conditions from which the indices are developed. In this study, we tried to develop new hyperspectral indices for tracing the two critical photosynthetic parameters (the maximum rate of carboxylation, Vcmax and the maximum rate of electron transport, Jmax) that are at least generally applicable for alpine deciduous forests, based on original hyperspectral reflectance, first-order derivatives, and apparent absorption spectra. In total, ten types of hyperspectral indices were screened to identify the best indices, and their robustness was determined using the ratio of performance to deviation (RPD) and Akaike’s Information Criterion corrected (AICc). The result revealed that the double differences (DDn) type of indices using the short-wave infrared (SWIR) region based on the first-order derivatives spectra performed best among all indices. The specific DDn type of indices obtained the RPD values of 1.43 (R2 = 0.51) for Vcmax and 1.68 (R2 = 0.64) for Jmax, respectively. These indices have also been tested using the downscaled dataset to examine the possibilities of using hyperspectral data derived from satellite-based information. These findings highlight the possibilities of tracing photosynthetic capacity using hyperspectral indices.
1. Introduction
Global climate change has been projected to reduce global net primary production (NPP) and carbon stocks from soil [1], and has become a global threat to humans. To date, tremendous efforts have been made to reduce the impact of global climate change, for which the control of greenhouse gases (GHGs) emissions has become a popular solution [2]. Such an effort could be more effective if supported by increased reforestation, as tree species and all chlorophyll plants are important for mitigation purposes, since leaves capture CO2 from the atmosphere, and combine it with water and energy from the sun to produce carbohydrates, a well-known process called photosynthesis that is critical for the carbon cycle [3,4].
To understand the role of photosynthesis in the carbon cycle, a comprehensive study of the dynamics of photosynthesis parameters is necessary. The proposed model by Farquhar et al. [5] has become a basic tool for assessing the photosynthetic capacity of each species [6]. Its two critical parameters, the maximum rate of rubisco carboxylation (Vcmax), and the maximum rate of photosynthesis electron transport (Jmax), are essential to the model, and are, thus, important to understand the exchange of carbon between the atmosphere and the terrestrial ecosystem [7].
Conventional approaches to obtain information on these two parameters usually involve long-term field work, even for one leaf sample [8,9], and can only be done on a small scale due to the time-consuming and highly labor-intensive work required. Alternatively, the approach of utilizing remote sensing information has increasingly attracted attention, and may potentially be used for estimating plant physiological, biochemical, and biophysical properties [10,11].
The utilization of remote sensing information generally involves two common approaches: empirical ways based on multispectral or hyperspectral information obtained from satellites, such as Hyperion, TianGong-1, EnMAP (Environmental Mapping and Analysis Program) and HyspIRI (Hyperspectral Infrared Imager) [12], or a radiative-transfer-model-based inversion like using SCOPE (Soil Canopy Observation, Photochemistry and Energy fluxes) [13], 4-Scale [14], or ProSAIL (Prospect + Scattering by Arbitrarily Inclined Leaves) [15]. However, most of the currently available radiative transfer models (RTMs) have not included photosynthesis parameters, especially Vcmax and Jmax, as input variables, meaning that they are impossible to retrieve inversely. As an exception, the SCOPE model incorporated both radiative transfer and physiological processes, with Vcmax as one of the dozens (more than 30) inputting parameters [13,16]. Recent work by Camino et al. estimated Vcmax in wheat phenotyping trials using airborne hyperspectral-based solar-induced chlorophyll fluorescence (SIF) retrievals through SCOPE model inversions [17]. Their work involved the determination of numerous parameters, including the meteorological, leaf biophysical and structural parameters, leaf inclination angle distribution function (LIDF) parameters, and the broadband incoming shortwave radiation. As SCOPE is a very complex model, which has integrated different modules, the parameterization complexities can induce large errors in its application [16,18]. In addition, rather than obtained directly from reflectance, Vcmax used for the model was estimated from a previously established relationship with SIF. Therefore, directly remote sensing retrieval of physiological parameters to date has relied more on empirical approaches.
Since Rouse et al. proposed the popularly applied normalized difference vegetation index (NDVI) [19], the empirical approach has been widely followed and a number of indices have been developed for diverse purposes, including Gamon et al.’s photochemical reflectance index (PRI) [20] for physiological parameters [21,22,23,24,25]. To date, a large number of indices have been developed to fulfill the needs for monitoring and assessing plant structural and biochemical aspects [26,27,28], and most of the well-known indices reported were developed in multispectral information but with certain adjustments, such that these indices could potentially be used for hyperspectral reflectance. However, even though the use of vegetation indices for a quick assessment of photosynthesis or photosynthetic parameters has been attempted in several previous works [29,30,31,32,33], no consensus has yet been reached [34], and is dramatically behind the indices for structural or biochemical parameters. Furthermore, the few reported indices are generally only applicable to a specific area and specific forest stands depending on the condition for the index developed, or for specific leaf groups [35]. Our previous efforts to filter a universal index to trace photosynthetic parameters failed and no hyperspectral index has ever been applicable, especially for trees in alpine deciduous forests.
The aim of this study, therefore, is to develop a robust index for tracing photosynthetic parameters using hyperspectral information for alpine deciduous forests. We used a dataset composed of six species that dominate in the habitat of the alpine temperate forest in Japan. The dataset includes synchronous measurements of photosynthetic parameters (Vcmax and Jmax) and reflectance from two distinctive leaf groups, sunlit leaves, and shaded leaves of each species. A downscaled dataset is also attempted to investigate the possibilities of using satellite-borne hyperspectral data for future assessment.
2. Materials and Methods
2.1. Study Site
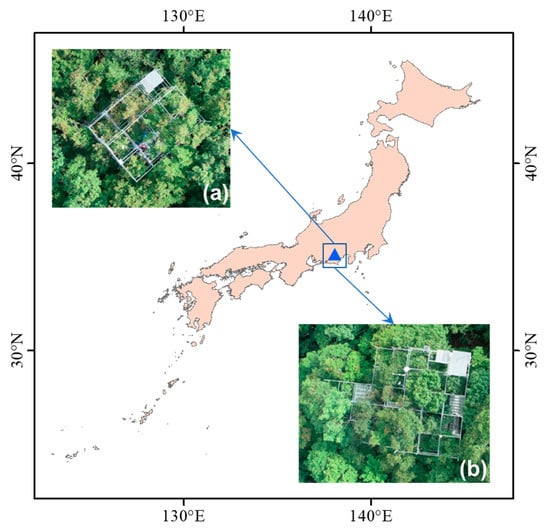
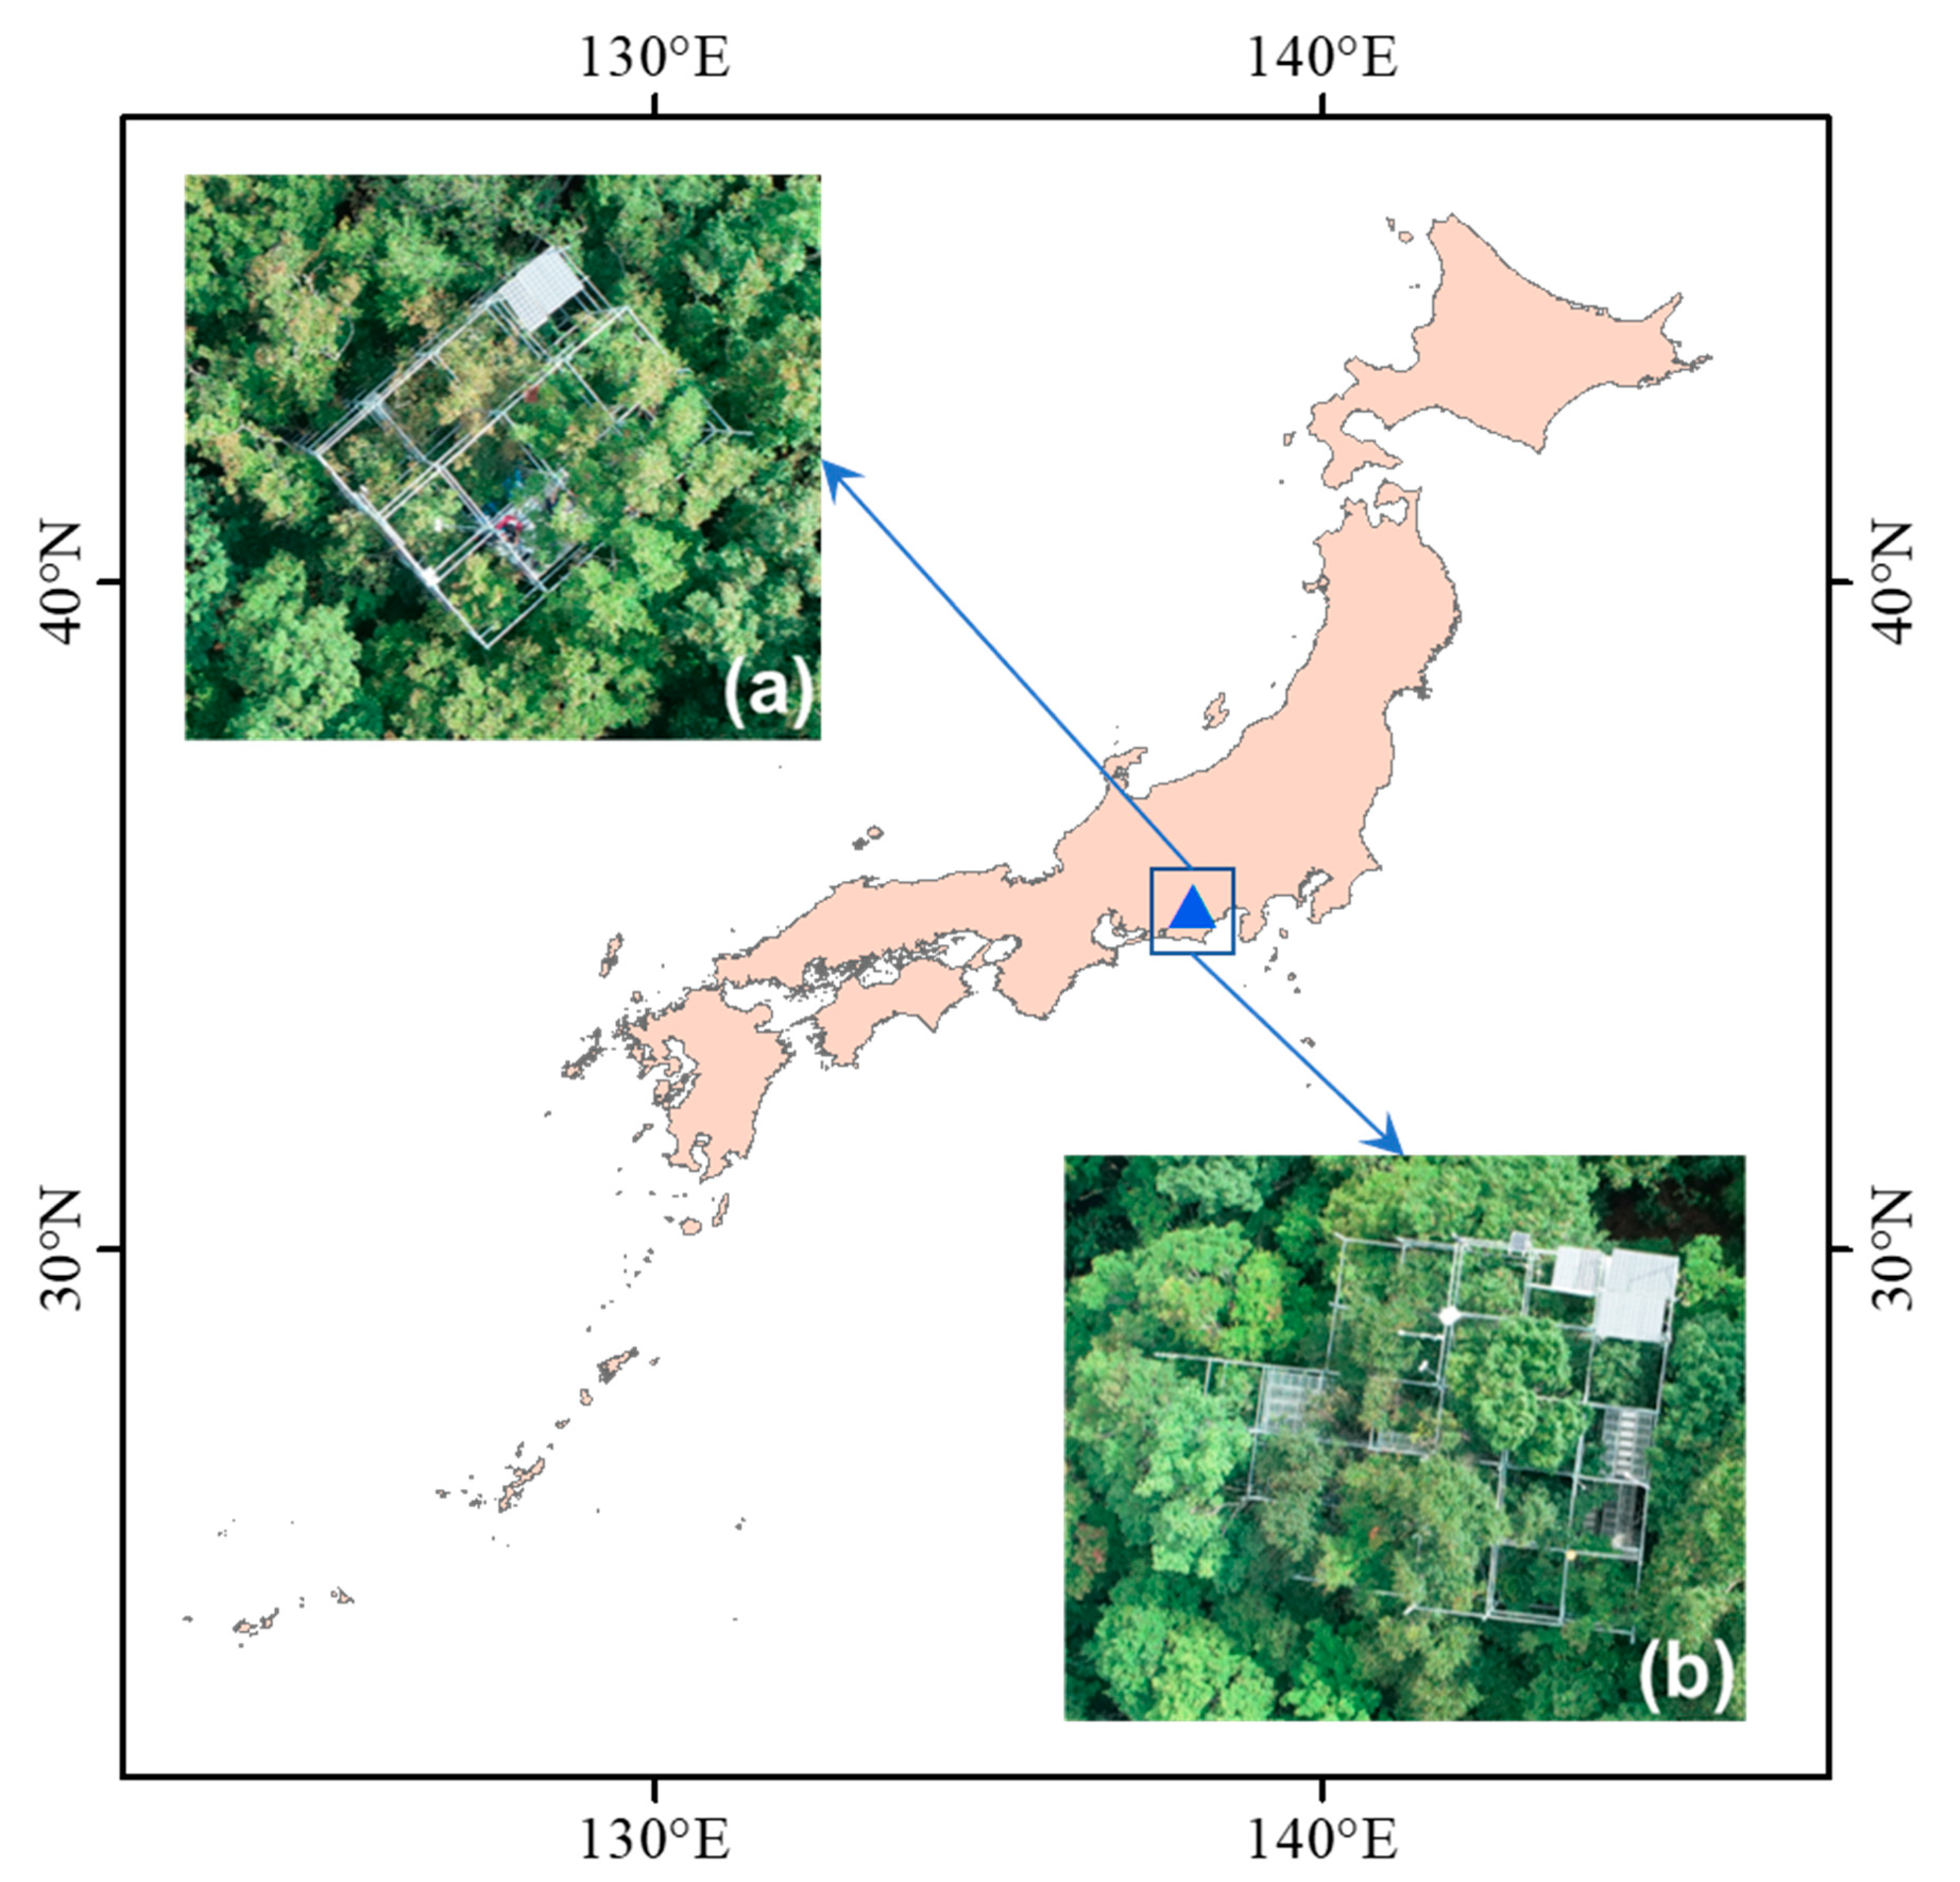
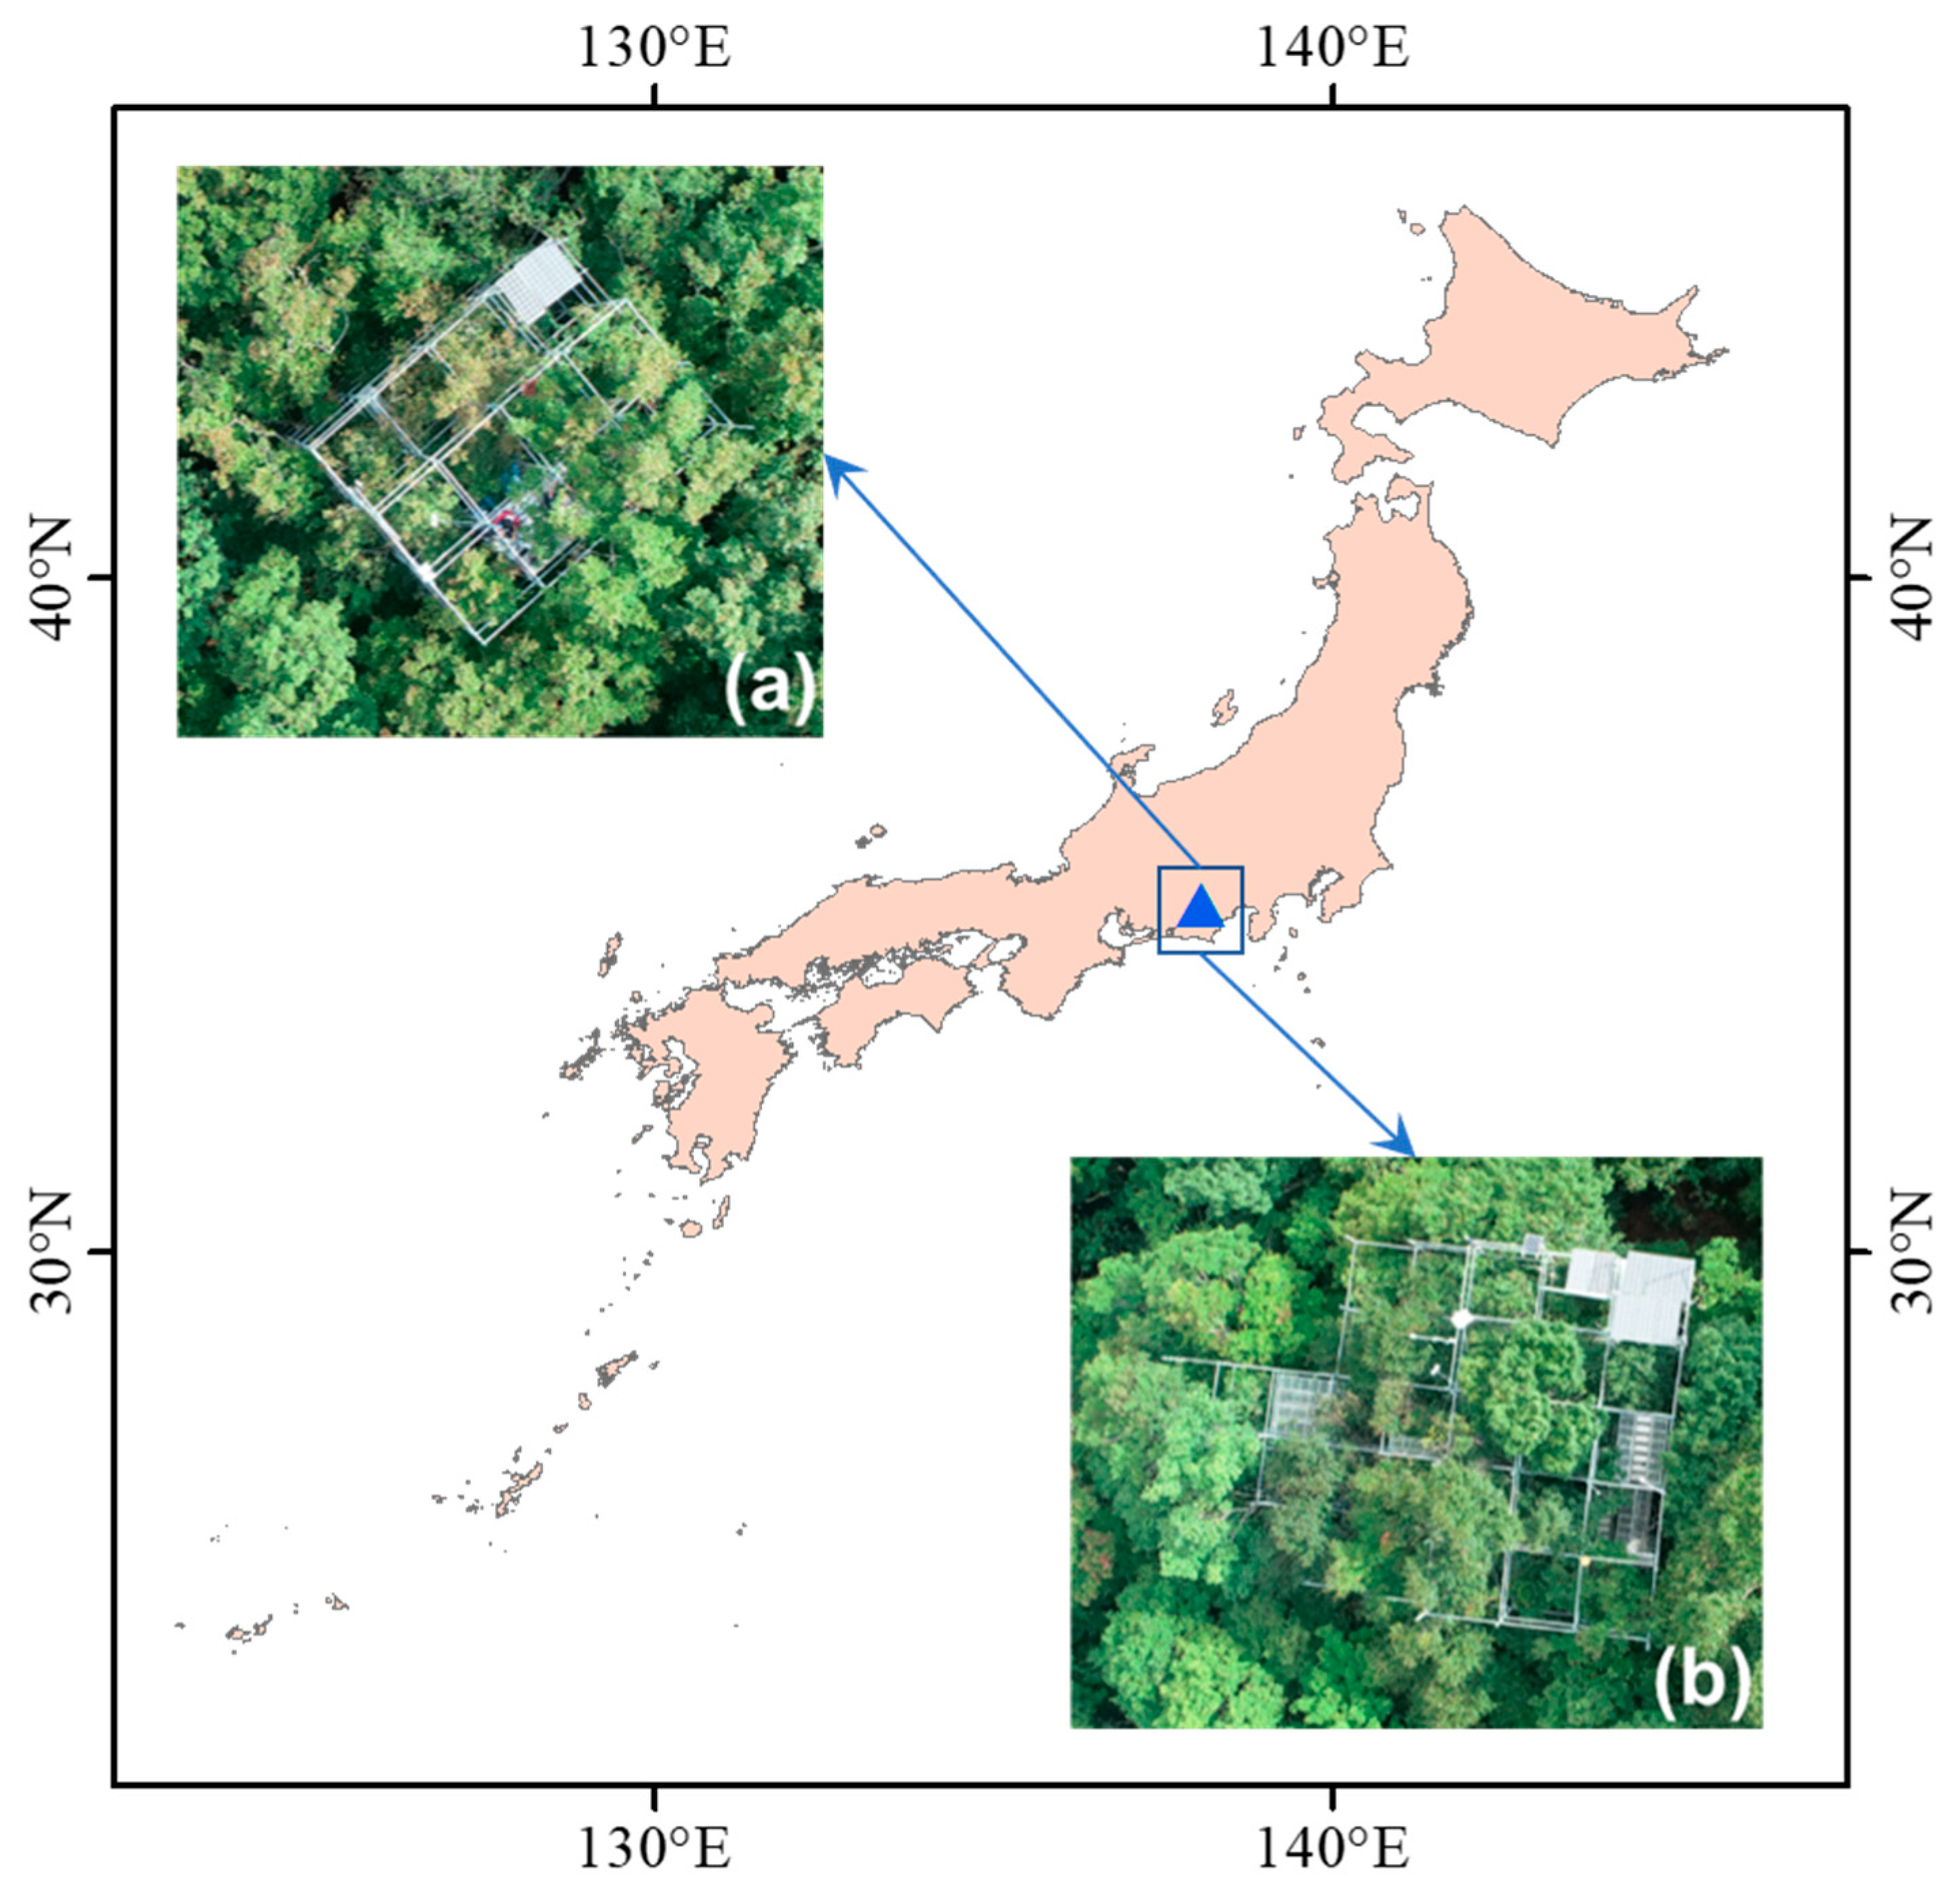
The study site is located in Nakakawane, one of the forestry research facilities of Shizuoka University (35°04′ N and 138°06’ E, Shizuoka Prefecture, Japan). The land cover in this study site is a deciduous temperate forest, dominated by Acer shirasawanum Koidz. The elevations vary from 390 to 1560 m with an annual precipitation of approximately 2153 mm. Meanwhile, the annual mean temperature is around 17 °C [36]. The location of this site is shown in Figure 1.
2.2. Measurements and the Dataset
A detached leaf sampling strategy has been followed in this study [37,38]. Leaf samples were collected in the years 2014, 2015, 2016, and 2018. All samples were taken pre-dawn by cutting the leaves from the branches and re-cutting underwater and were transported as soon as possible from the field to the laboratory under dark conditions. Measurements were taken with the dark-adapted leaves as soon as possible (no later than three days maximum) after the leaf samples were collected.
Gas exchange measurements were made for each sample following the standard method [8]. The LI-6400 (LI-COR Bioscience Inc., Lincoln, NE, USA) equipped with a leaf chamber was used. For dark-adapted samples, we took light response curves first in 2018, starting from a PAR (Photosynthetically Active Radiation) level of 0 μmol·m−2·s−1 and an ambient CO2 (Ca) concentration of 400 μmol mol−1. After all the graphs became stable, we gradually tuned the PAR to 100, 200, 400, 700, 850, 950, and 1000 μmol·m−2·s−1 for about two minutes each to reach stably. The A/Ci curve (net CO2 assimilation rate, A, versus calculated substomatal CO2 concentration, Ci) measurements were made after having obtained the light saturation points from the light response curves. However, for the years from 2014 to 2016 light response curves were not taken regularly, the A/Ci curve measurements were made with the PAR set to 1000 μmol·m−2·s−1, a light-saturated point as determined from previous light response curves. Then we decreased the Ca concentrations gradually from 400 μmol·mol−1 to 300, 200, 100 (but to 300, 250, 200, 150, 100 in 2018), and then finally to 50. Each step took about 2 minutes to stabilize. After that, we gradually increased the Ca back to 400 μmol mol−1, and then to 1200, 1500, 1800 in 2014-2016 while to 550, 650, 750, 850, 1000, 1200, 1500, 1700 in 2018, before finally reaching 2000 μmol·mol−1. The A/Ci curves were fitted using the plantecophys package [39] in R software [40] for Vcmax and Jmax.
For each sample, once the gas exchange measurements finished, leaf scale reflectance was immediately taken using a field spectrometer (Analytical Spectral Devices Inc., Boulder, CO, USA) equipped with a leaf clip. Reflectance measurements were done with both white and dark backgrounds, repeated three times for each measurement. The average values of the three repeats were used for further analysis.
The dominant species in our study site is A. shirasawanum, which has unique leafy periods. This species comes into leaf earlier than other species but matures at the almost same time as the others and has a longer leaf senescence period. On the other hand, one of the target species in this study is Fagus crenata. This species is native to Japan and is categorized as an endemic Fagus species from Japan together with Fagus japonica. The species is usually widespread and even the dominant tree of Japanese deciduous forest. In total, six species were used for this study. The list of species is presented in Table 1. These species were all easy-to-access trees surrounding the towers. Shaded and sunlit leaves were taken from each species separately, and their positions were recorded. Only mature leaves were used for this study (from June to the middle of September in each year). This is also to eliminate outliers, since a typhoon hit the study site at the end of September 2018. An exception was only found for A. shirasawanum since the species has a longer leaf senescence period and suffered more serious stress from the typhoon than the other species. Therefore, we excluded all September data from each year of measurements for this species. However, for the year 2017 only F. crenata was measured. The dataset used in this study finally contained 170 leaf samples (Table 1). Besides F. crenata and A. shirasawanum, the other four species have a small number of leaf samples due to the small number of trees within our study site.
2.3. Reported Indices
We collected a number of reported indices to validate their applicability for estimating photosynthetic parameters. The results were also compared with the new indices developed in this study. We tested a series of well-known vegetation indices of hyperspectral remote sensing. The formulae of the reported indices are shown in Table 2.
The wavelengths used for the Moderate Resolution Imaging Spectroradiometer (MODIS)-like indices were 858 nm for NIR (near infrared) and 645 nm for red. We also tried another combination of using the center Sentinel 2A wavelengths, in which the NIR was 833 nm and the red was 741 nm (vegetation red edge, Band 6). The reported indices were examined for their original reflectance form only.
2.4. New Indices Development
Several reported index types were used in this study for developing new indices, including the given wavelength (R), simple ratio (SR), wavelength difference (D), a normalized difference (ND), and inverse differences (ID). Besides these five types, we also included the double differences (DDn), modified simple ratio 1 (mSR1), modified simple ratio 2 (mSR2), modified normalized difference (mND) and modified inverse differences (mID) to the list (Table 3). Furthermore, all types using original reflectance, first-order derivatives spectra and apparent absorption were screened to identify the best index and the best type of reflectance forms. The first-order derivatives and apparent absorption spectra were used to reduce background noise and the possibilities of overlapping spectral features [45,46]. The calculations of the first-order derivatives and the apparent absorption spectra are listed in Equation (1) and Equation (2), respectively.
The value of Rλn was the original reflectance value at wavelength λn.
In addition, we also examined the consistency of the developed indices with different spectral resolutions. This was done by downscaling the original spectral resolution to 5 nm, 10 nm, 20 nm, and 50 nm, with the purpose of investigating the possibilities of applying the developed indices using airborne or satellite-borne data. The screening was done using the MATLAB software (The MathWorks, Inc.).
2.5. Statistical Criteria
The premier criterion used in this study to evaluate the performance of an index is the ratio of performance to deviation (RPD) (Equation (3)) to observe the goodness of fit. It is expressed as a ratio of the standard error in prediction to the standard deviation of the samples. The RPD is calculated as follows:
where SEP is the standard error prediction and SD is the standard deviation of photosynthetic capacity (Vcmax or Jmax).
Based on the RPD results, the indices are then categorized into three different groups (A, B, or C). The category of each group refers to Chang et al. [47]. Category A means the indices can be used, while category B means the indices can be used with several improvements. Category C means the indices cannot be reliably applied.
However, the Akaike’s information criterion corrected (AICc) (Equation (4)) served as the determinative criterion for the final selection of the candidates especially when several different indices give the same RPD value. The AICc is used due to its capability to address potential overfitting caused by a small sample size.
where is the maximum value of the likelihood function, n is the sample size, and k is the number of parameters. In addition, the coefficient of determination (R2) and the root mean square error (RMSE) were also calculated.
3. Results
3.1. Properties of Leaf Photosynthetic Parameters and Hyperspectral Reflectance
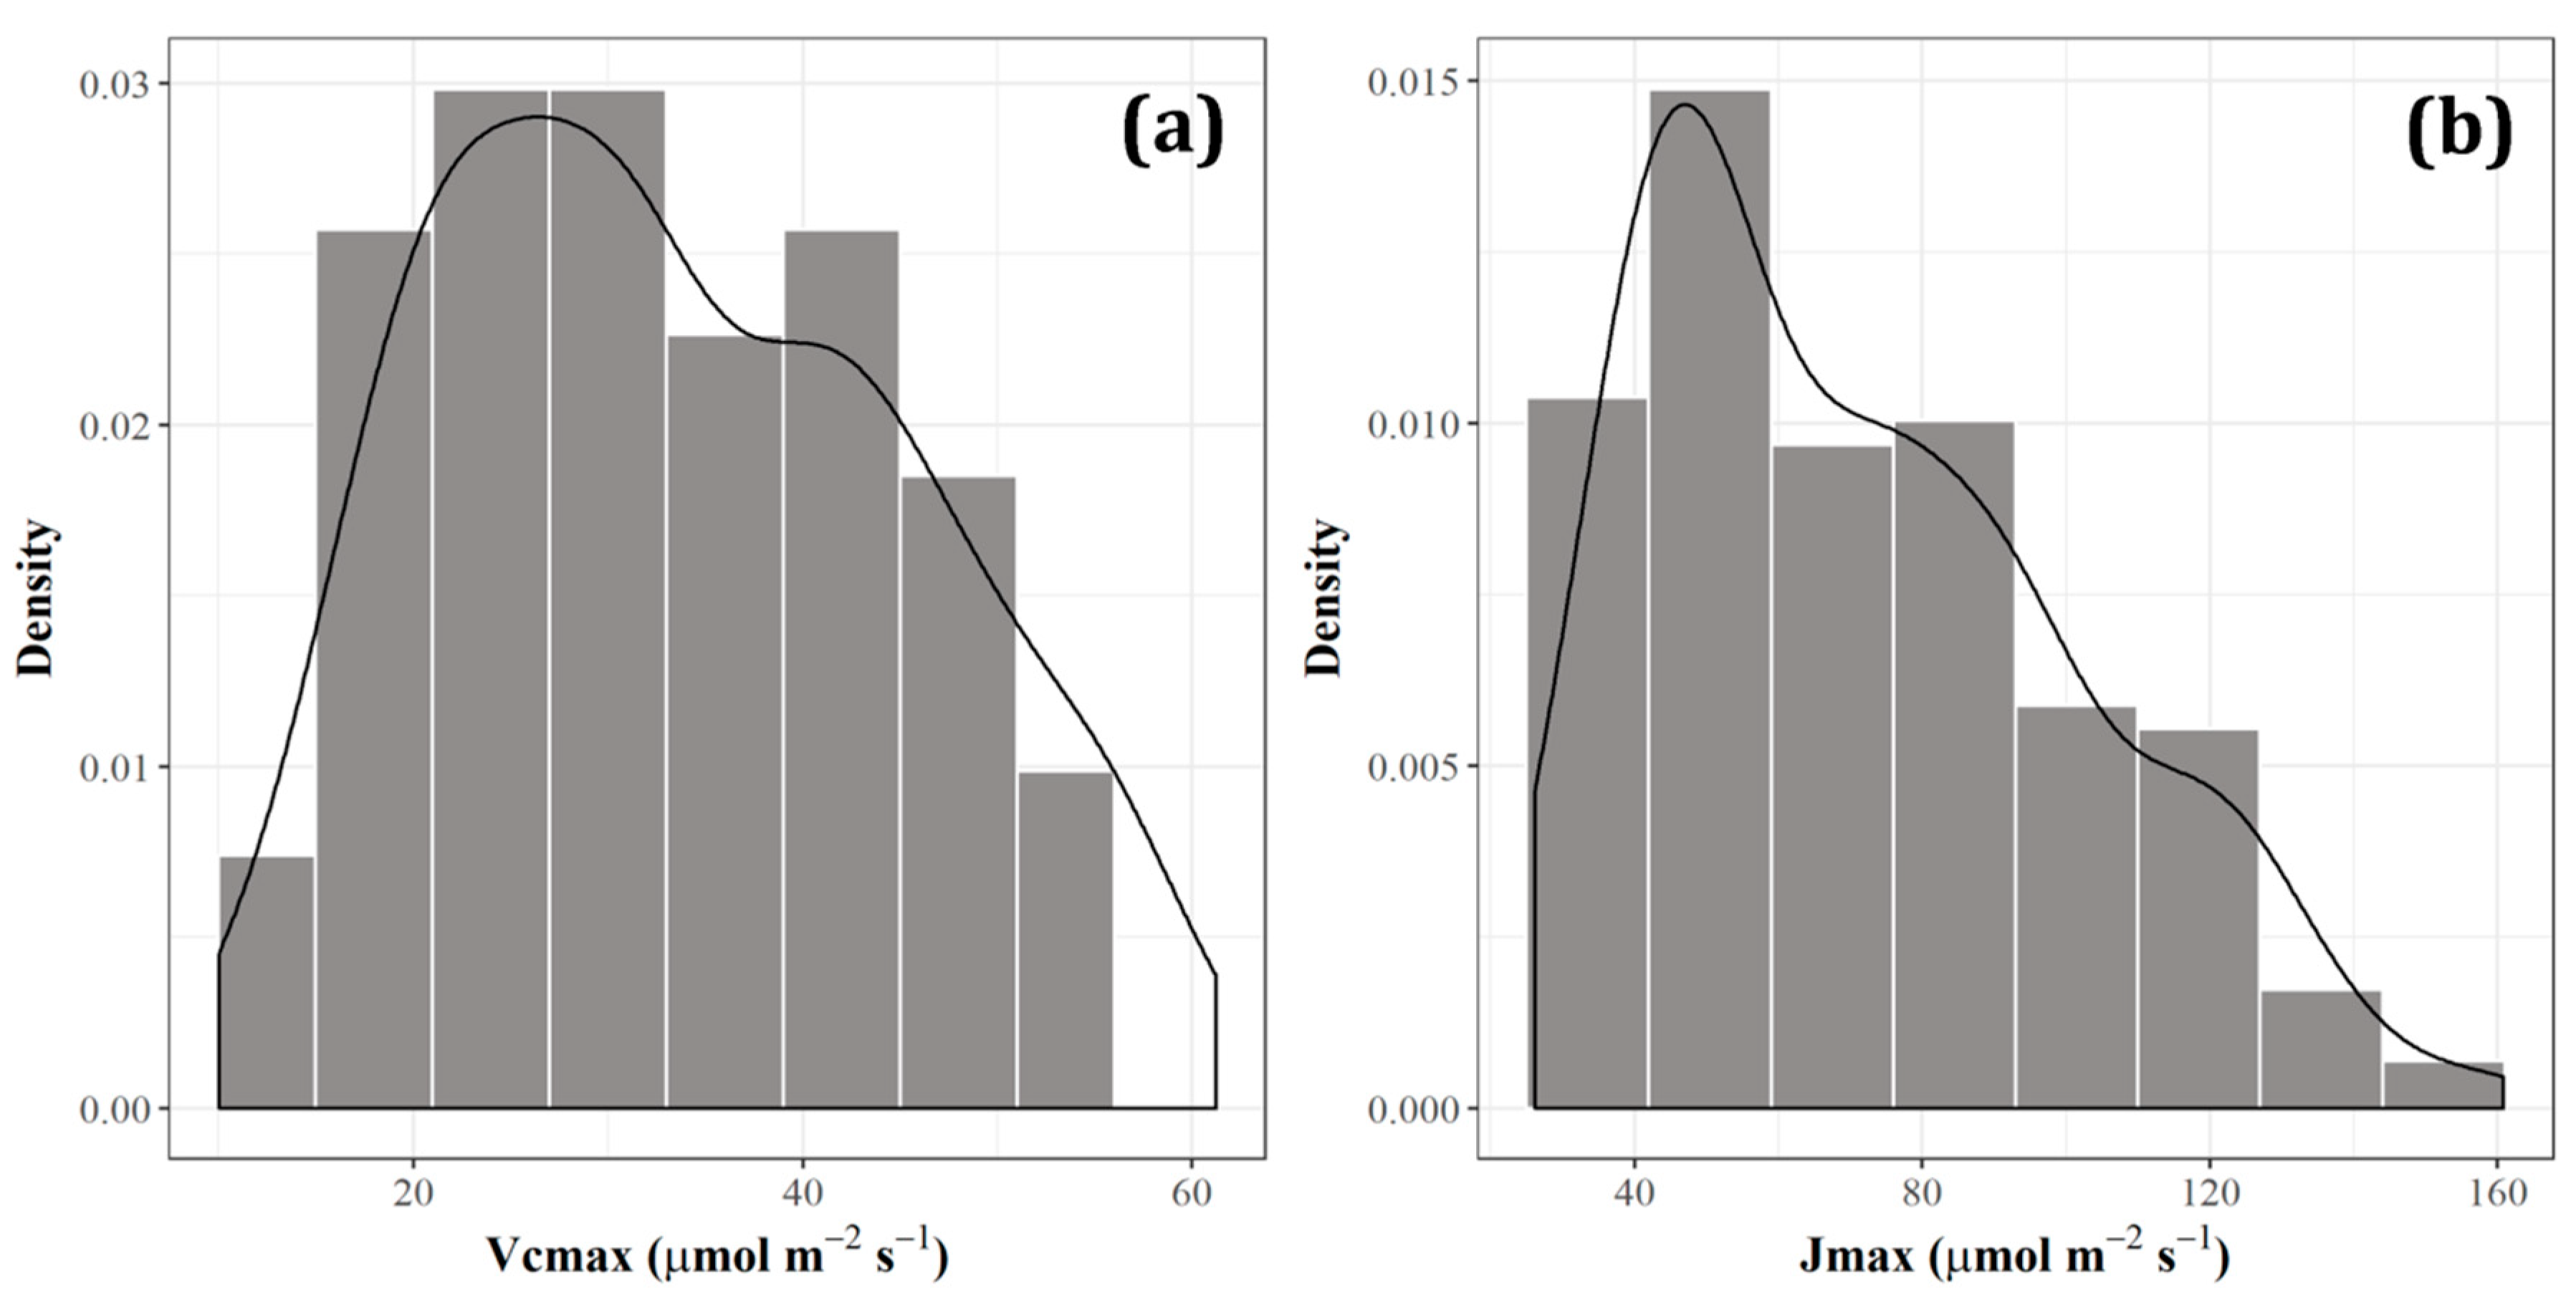
Six species from Nakakawane were measured for photosynthesis activities from 2014 until 2018. The mean value of Vcmax was estimated to be 33.48 μmol m−2 s−1, ranging from 10.01 μmol m−2 s−1 to 61.21 μmol m−2 s−1, with a median of 31.95 μmol m−2 s−1. Meanwhile, the Jmax data varied from 26.15 μmol m−2 s−1 to 160.80 μmol m−2 s−1, with the mean of 71.80 μmol m−2 s−1 and the median of 67.61 μmol m−2 s−1. Descriptive statistical results revealed that the Vcmax had a skewness of 0.284, a kurtosis of –0.851, and a standard deviation of 12.18 μmol m−2 s−1. On the other hand, the Jmax had 0.668 for skewness, –0.369 for kurtosis, and 29.98 μmol m−2 s−1 for the standard deviation. The distributions of every photosynthetic parameter are shown in Figure 2.
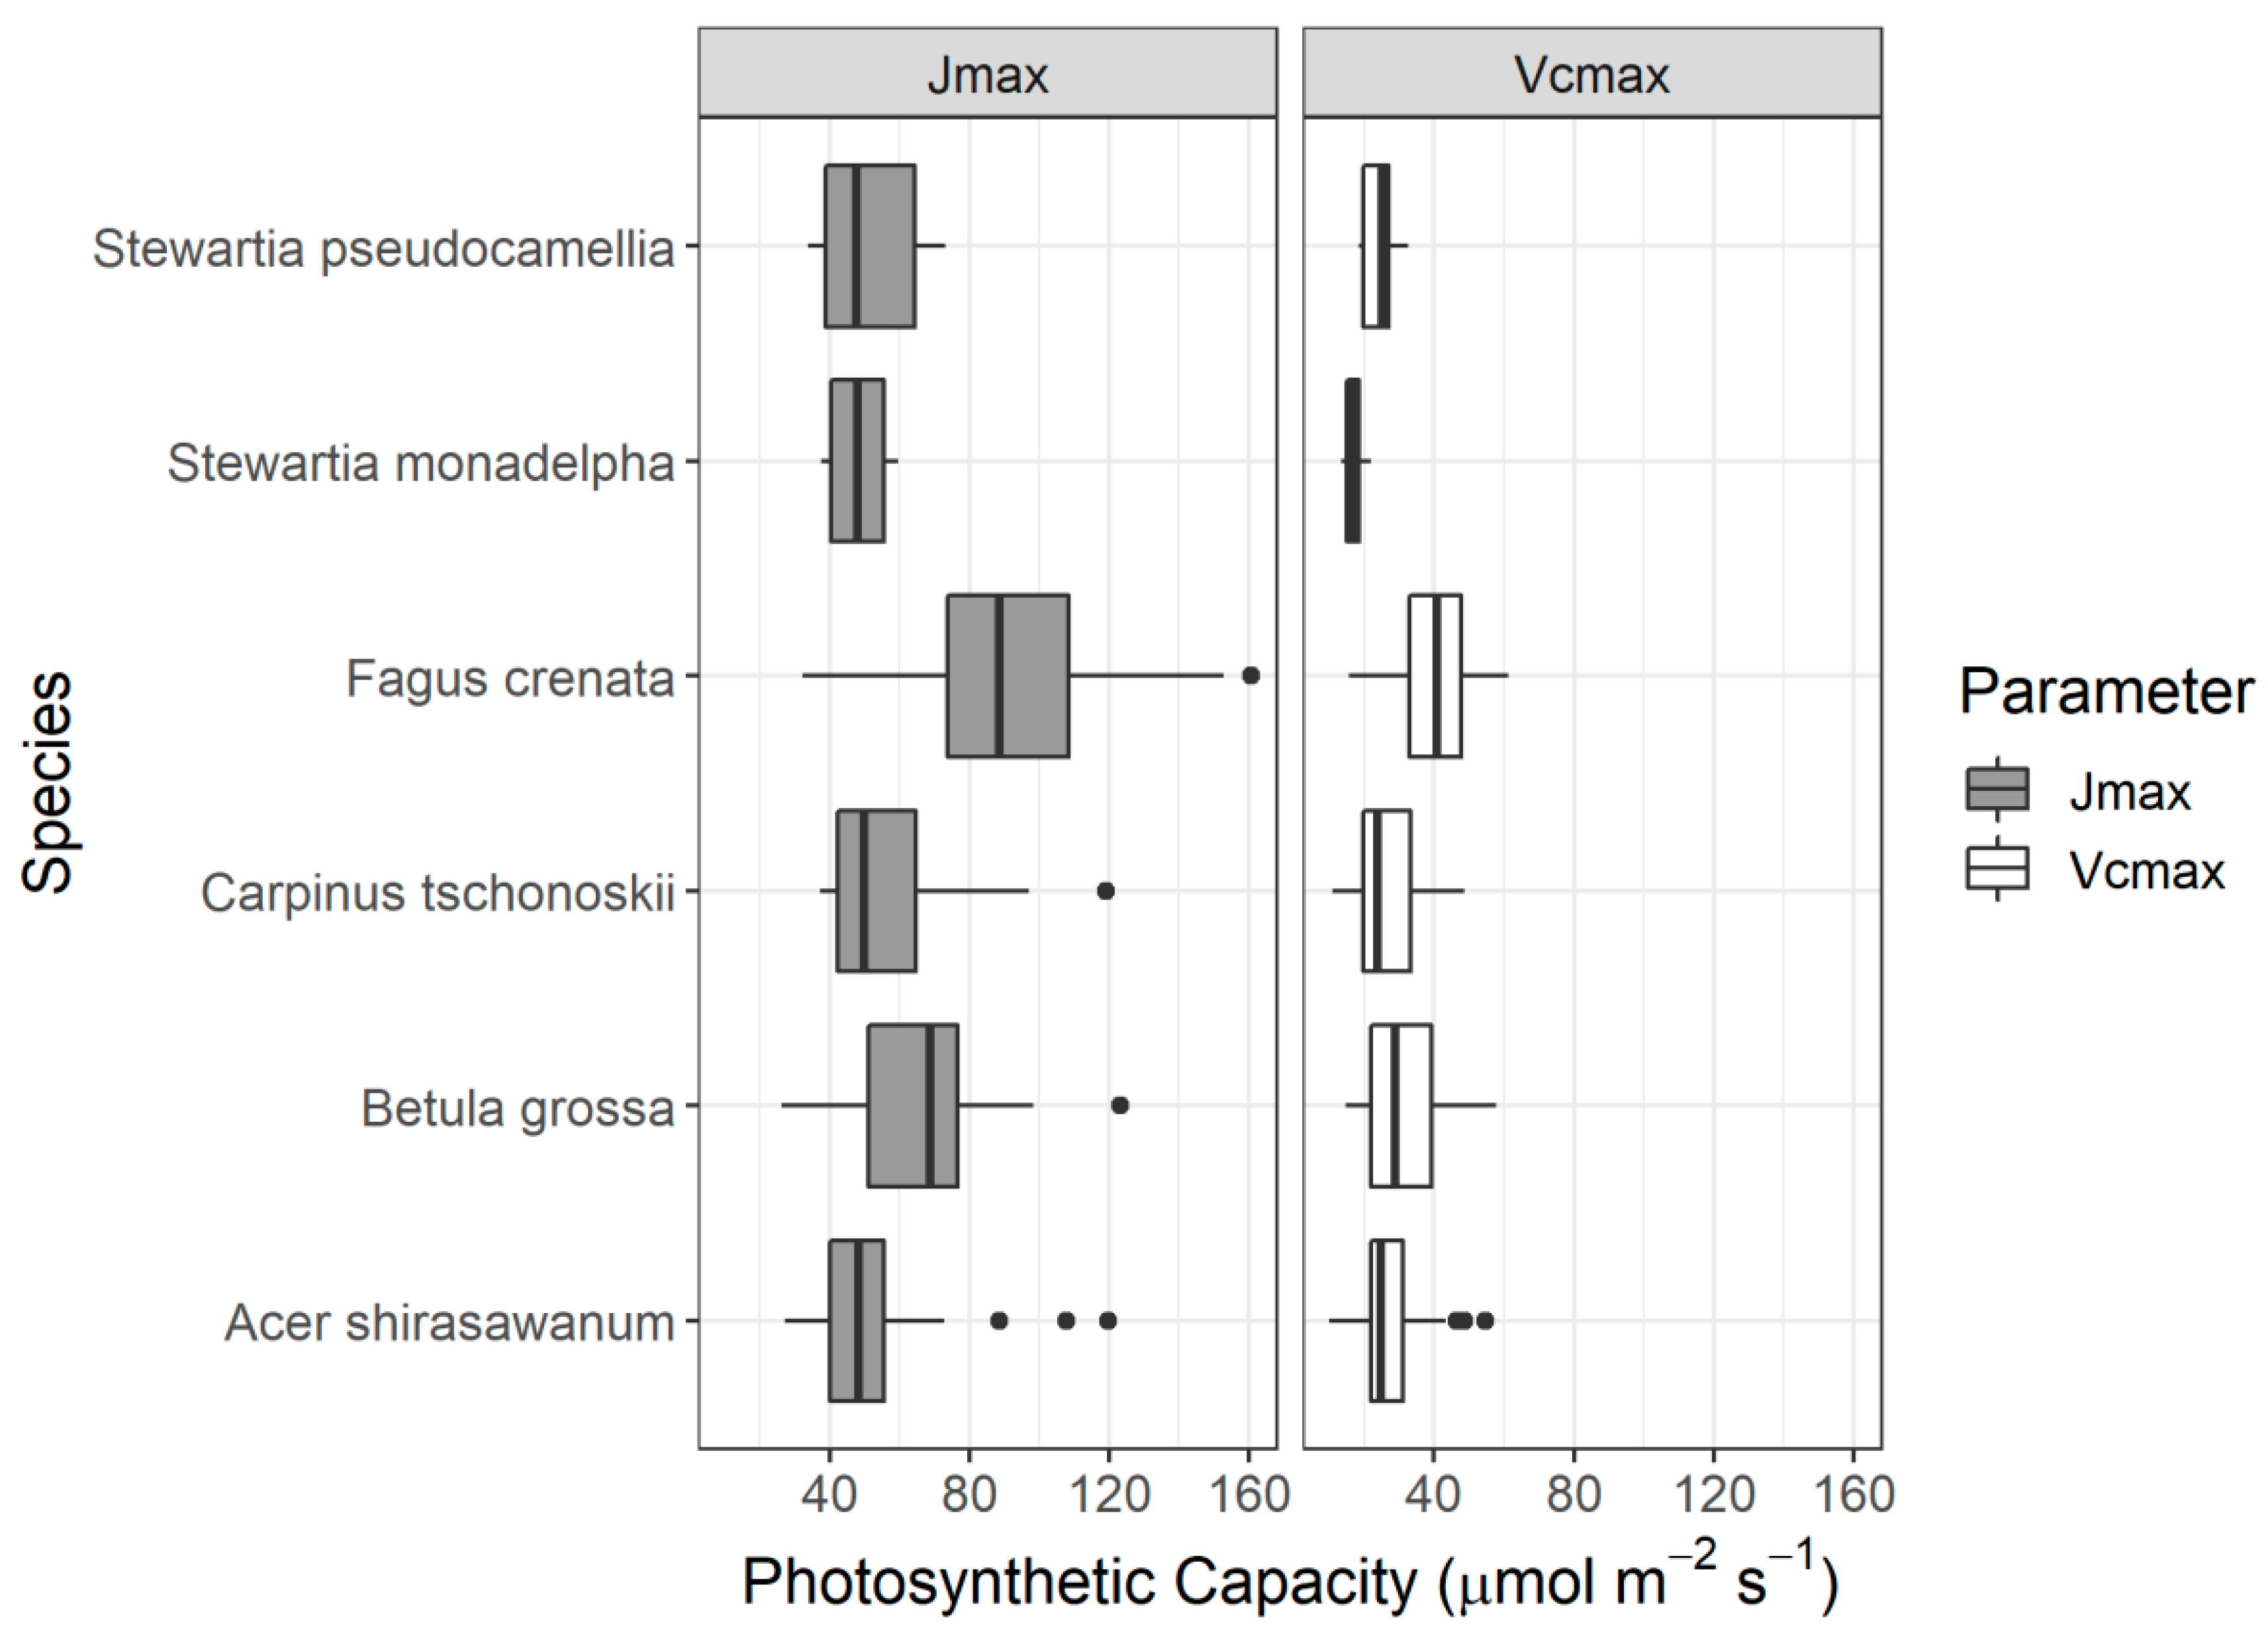
Species-based descriptive statistics for photosynthetic parameters are shown in Figure 3. The highest values for Vcmax and Jmax were both found in Fagus crenata, of 61.21 μmol m−2 s−1 and 160.80 μmol m−2 s−1, respectively. In contrast, the lowest value for Vcmax was observed in Acer shirasawanum (10.01 μmol m−2 s−1), while the lowest value for Jmax was found in Betula grossa (26.15 μmol m−2 s−1). The highest variance of Vcmax was found in B. grossa, which reached 146.41 μmol m−2 s−1 (14 samples). This was followed by Carpinus tschonoskii (135.09 μmol m−2 s−1; 11 samples), and F. crenata (112.73 μmol m−2 s−1; 84 samples). However, different trends were noted for the Jmax, for which F. crenata had the highest variance of 780.98 μmol m−2 s−1, followed by C. tschonoskii (713.10 μmol m−2 s−1) and B. grossa (668.18 μmol m−2 s−1).
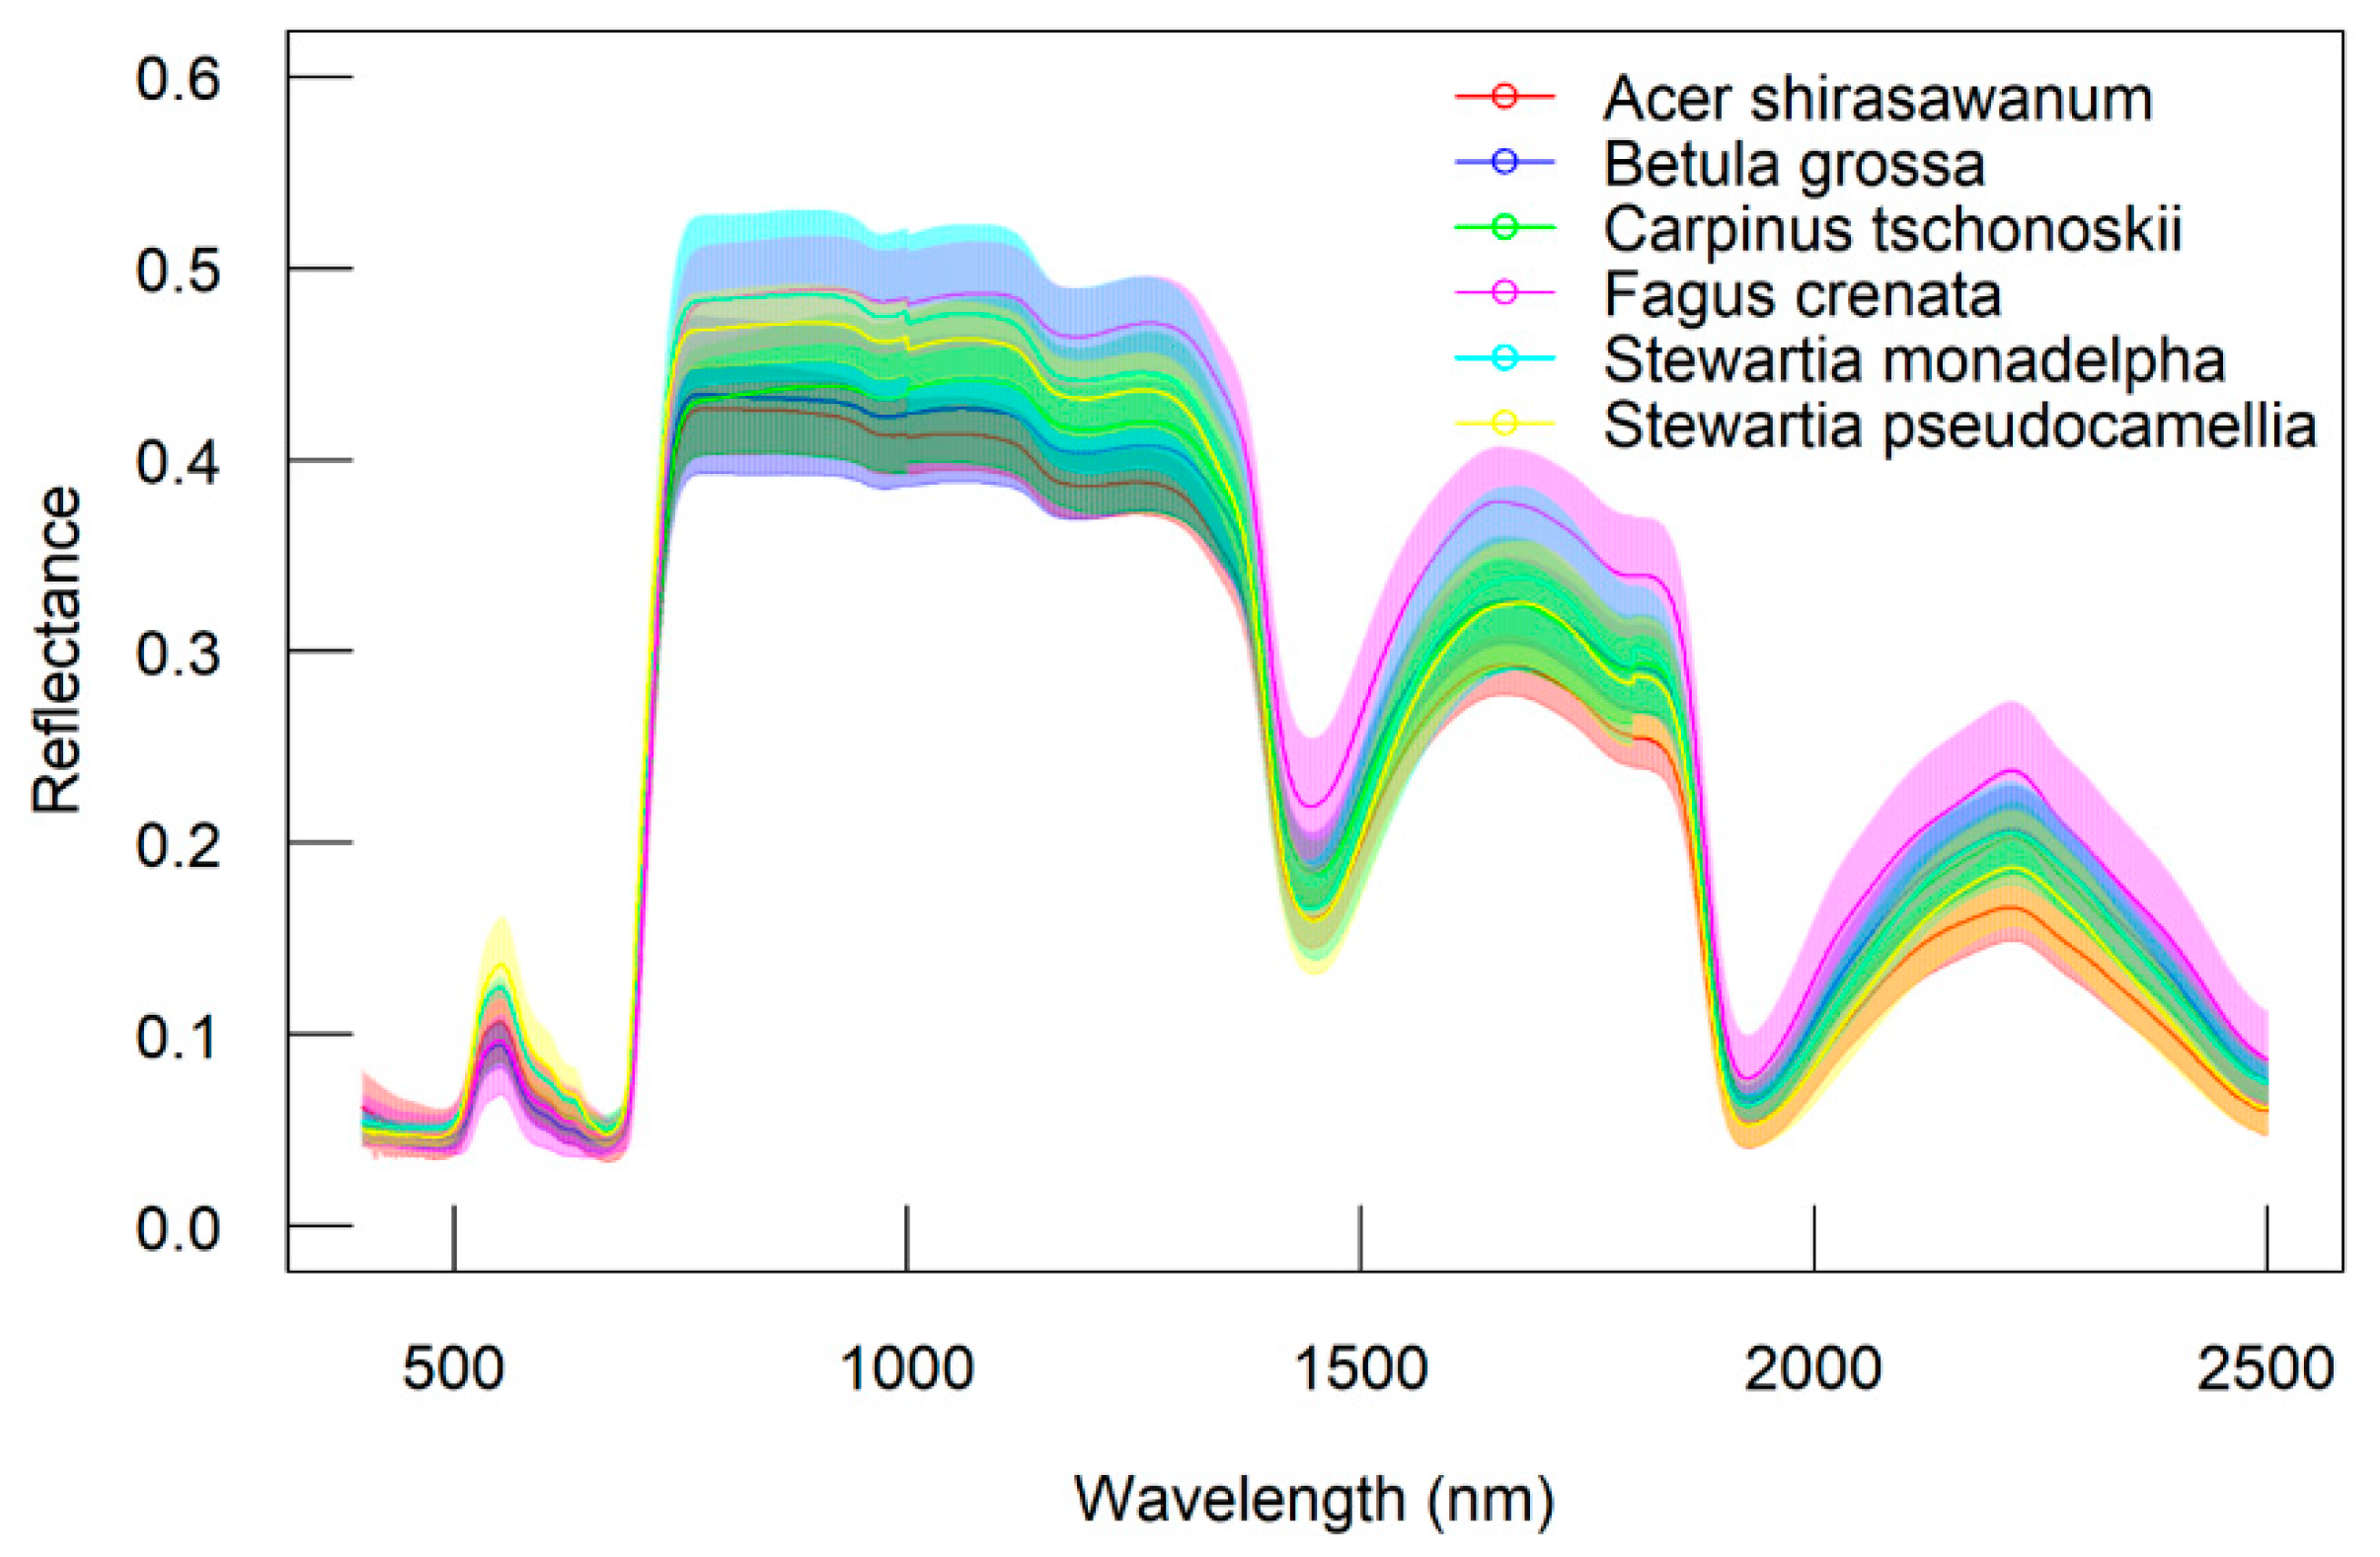
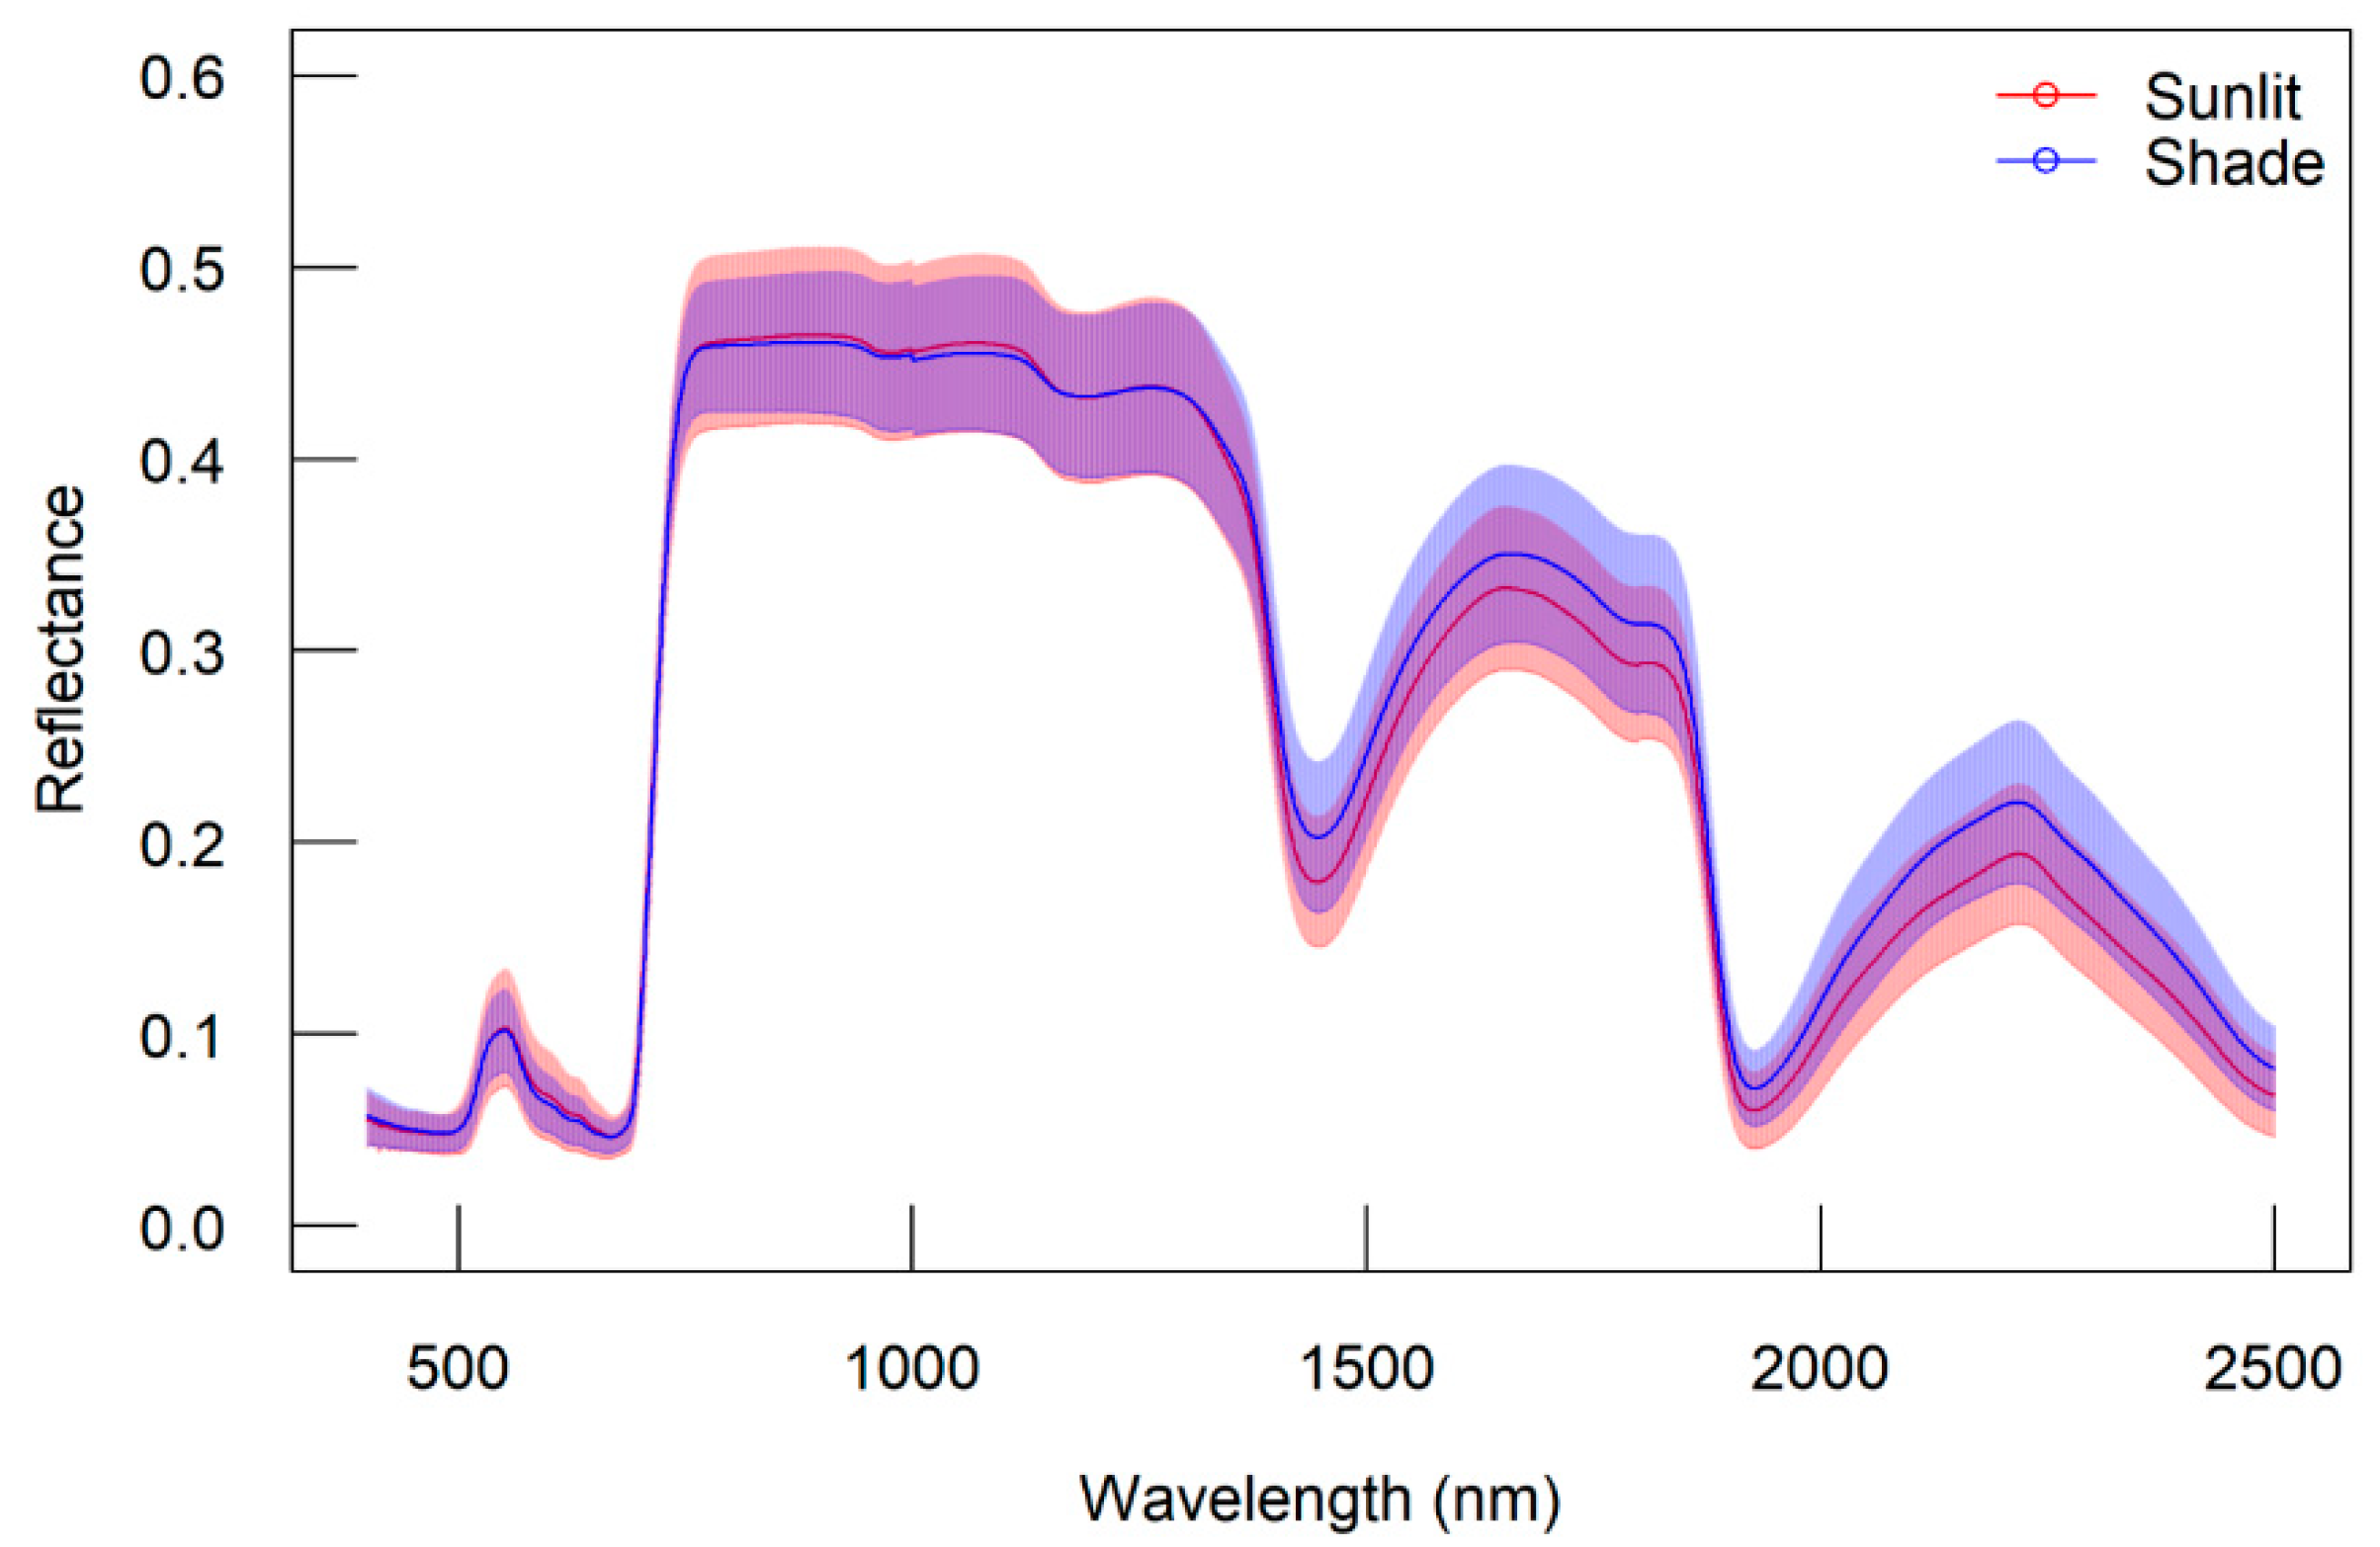
On the other hand, the reflectance data also varied among different species (Figure 4). The S. monadelpha had the highest standard deviations of reflectance spectra at the range of red-edge to NIR. Nevertheless, F. crenata had the highest mean reflectance in most wavelengths, especially for the domain of short-wave infrared (SWIR). For different leaf groups, there is no significant variation of reflectance from 400 to 1400 nm. However, the standard deviations of sunlit leaves were higher at 700 nm (red edge) to 1100 nm (NIR area), while shaded leaves were higher at 1400 to 2500 nm (SWIR area). The result is presented in Figure 5.
3.2. Performance of Reported Indices
The results from indices screening based on the original reflectance for both parameters using the reported indices are shown in Table 4. The reported indices used for this study gave poor performance, judged from their low RPD values and coefficients of determination (R2).
3.3. Development of New Indices
3.3.1. All Data
We developed new indices based on the original reflectance, the first-order derivatives, and the apparent absorption for both parameters. The screening of all indices using the original spectra suggested that the double difference (DDn) type of indices gave the best performance for quantifying both Vcmax and Jmax. The best index of this type used the first wavelength at 1652 nm and had an interval of 9 nm for Vcmax, which had an RPD of 1.42 and an R2 of 0.50. It also had the minimum AICc (=5.34) among all index types. In comparison, the best index identified for Jmax of this type used the nearby wavelength of 1644 nm with an interval of 16 nm and had an RPD of 1.75. Furthermore, its R2 reached 0.67.
Similar analysis on the indices calculated from the first-order derivatives spectra again suggested that the DDn type index performed best for predicting Vcmax (R2 = 0.51 and RPD = 1.43), with the central wavelength at 1831 nm and an interval of 419 nm. However, the wavelength difference (D) type index performed best for Jmax, which used the wavelengths of 1629 nm and 1658 nm. This index also had an R2 of 0.68 and its RPD was estimated as 1.78. The DDn type index with the central wavelength at 1600 nm and an interval of 65 nm was also effective to trace Jmax with an R2 of 0.64 and RPD of 1.68.
Furthermore, indices based on the apparent absorption spectra were also examined for their performance. The results suggested the mID type indices performed best for Vcmax while the DDn type for Jmax. The R2 between the mID index and Vcmax was higher than the SR, ND, and mSR1 indices (0.514 versus 0.513 for the other three indices, not shown in Table 5). The best mID index (R2 = 0.51, RPD = 1.44) used the wavelength of 2199 nm with an interval of 9 nm, while the best DDn index (R2 = 0.65, RPD=1.68) used 1651 nm with an interval of 11 nm for wavelengths before and after that.
Further, for all indices based on the different types of spectral forms, the indices based on first-order derivatives spectra gave the best performance, which had the highest RPD values for first-order derivatives of both Vcmax and Jmax.
3.3.2. Different leaf groups
We also explored the best indices for different leaf groups (sunlit and shaded) based on the original reflectance spectra, the first-order derivatives spectra and the apparent absorption spectra as well. The results for sunlit and shaded leaves are shown in Table 6. The bold type indicates the best RPD and coefficient of determination (R2).
As illustrated in Table 6, for sunlit leaves, the best performance indices based on the original reflectance form for Vcmax and Jmax are both the DDn type. Similarly, the best indices based on the first-order derivatives spectra are also the DDn type of indices for Jmax and for Vcmax. Further, the DDn type index using the apparent absorption spectra also performed best for Jmax. Although the SR type index based on apparent absorption performed best for Vcmax (with maximum RPD value, not shown in Table 6), the R2 values of SR, ND, DDn, mSR1, and mID were very similar (0.47 for SR, ND, mSR1 and mID indices, while 0.46 for DDn index). In addition, we also found that the RPD values generally increased from the indices based on original reflectance to indices based on first-order derivatives spectra.
For shaded leaves, the performance of indices based on the original reflectance mimicked that of sunlit leaves. The DDn type of indices were effective to trace both Vcmax and Jmax of shaded leaves. Although the D type index based on the original reflectance performed best for Vcmax, the DDn type index gave similar R2 values (0.55 versus 0.57). Similarly, the D type of index based on the first-order derivatives spectra performed best for Jmax and the DDn type index gave similar R2 values (0.62 versus 0.65). For apparent absorption spectra based indices, the performance of the DDn type index to trace Vcmax was comparable with the identified best index mID (R2 = 0.56 versus 0.57). Overall, the DDn type of indices based on all three spectra forms were effective to trace Vcmax and Jmax of both sunlit and shaded leaves.
3.3.3. Different Species
We also investigated the best indices for each species in this study, to determine whether it is necessary to trace photosynthetic parameters for each species individually or for species groups instead. The results indicated that the indices based on the first-order derivative spectra performed better in quantifying the photosynthetic capacity parameters for all species. For most species, except F. crenata and A. shirasawanum, the indices based on the first-order derivative spectra have RPD values > 2.00 (irrespective of index type) for Vcmax and even better for Jmax. For both F. crenata and A. shirasawanum, most index types have RPD values within 1.4 and 2.0 with Vcmax (except for R type for A. shirasawanum, RPD = 1.31). In comparison, all index types have RPD values within the range of 1.4 and 2.0 with Jmax for the two species.
In general, the DDn type of indices based on the original reflectance had a respectable performance for all species when quantifying Vcmax. However, each species has its own specific best-fitting index. For example, for quantifying the Vcmax of A. shirasawanum, F. crenata, S. monadelpha and S. pseudocamellia, the DDn type of index should be chosen. For the other two species (B. grossa and C. tschonoskii), the best-performing indices type were the D and mSR2, respectively. In contrast, for Jmax, the DDn type of index performed best with only two species (A. shirasawanum and S. monadelpha).
Due to the small sample sizes, the RPD values for S. monadelpha and S. pseudocamellia were higher than the other species and may, thus, provide misleading RPD results. The sample size was an important factor in ensuring accurate indices’ predictions.
3.4. Evaluation of Developed Indices With Downscaled Resolutions
Indices based on downscaled spectra were also examined in this study, in order to investigate the possibility of expanding their applications from hyperspectral to multispectral data. We downscaled the original 1 nm spectra into several different resolutions, namely, 5 nm, 10 nm, 20 nm, and 50 nm. The screening results proved that the RPD values for indices based on original reflectance did not change significantly, and that the type of indices used to quantify the photosynthetic parameters remained consistent for all resolutions except for 50 nm.
The results indicated that the RPD values of each type of index were relatively constant even when the resolutions were changed. The DDn type of indices based on either original reflectance or apparent absorption spectra showed a non-significant decrease of the RPD values for tracing Jmax. However, for the first-order derivatives spectra-based indices, the D type index performed better than the DDn type. Nevertheless, the RPD for the DDn index type was still respectable for different spectral resolutions. On the other hand, Vcmax can be traced better using the DDn type of indices based on the first-order derivatives and apparent absorption spectra. The RPD values of DDn type indices for Vcmax decreased with the spectral resolution of the original reflectance.
4. Discussion
Hyperspectral remote sensing, as a promising technique, has already been widely used for retrieving structural and biochemical parameters [11,48,49,50] Unfortunately, few studies have ever succeeded with physiological parameters [29,31,51,52]. Sensitivity analysis results of the newly developed model of soil-canopy spectral radiances, photosynthesis, fluorescence, temperature, and energy balance (SCOPE) [13] indicated that recognizable contributions of the physiological parameters (such as Ball–Berry stomatal conductance parameter, roughness length for the momentum of the canopy) were identified to reflectance [16]. What’s more, Vcmax showed a great contribution to the full broadband sun-induced chlorophyll fluorescence (SIF) flux and calculating total fluorescence yield [53]. These results laid the possibility of using hyperspectral remote sensing to trace photosynthetic capacity parameters.
In this study, we tried to reveal the possibility of using hyperspectral information to detect and to quantify photosynthetic capacity parameters, namely, the maximum rate of rubisco carboxylation (Vcmax) and maximum rate of photosynthesis electron transport (Jmax). We investigated the possibilities of using hyperspectral vegetation indices, the most popular applied empirical approach in current remote sensing activities. We first investigated the feasibility of using the reported indices based on our specific dataset containing synchronous data of gas exchange and reflectance. In total, ten well-known indices were validated, including the PRI and RVSI that are usually used for physiological trait assessment, and some for predicting biochemicals such as pigments (SIPI, CARI, mCARI) and nitrogen content (NDNI), as well as several (e.g., NDVI and EVI2 for structural assessment, such as LAI (leaf area index) and green biomass). These ten reported indices are in widespread use and are related, more or less, to photosynthetic capacity [54,55,56].
None of the reported indices could be recommended, as clearly indicated by their RPD values (all below 1.4). Although NDVI and EVI2 performed slightly better using the range of the central wavelength of Sentinel 2A, their RPD values were still below 1.4. Similar results were also found for other indices, such as PRI and RVSI. Surprisingly, although both the PRI and RVSI indices have frequently been used to quantify physiological parameters, they performed poorly with both photosynthetic parameters. Furthermore, several indices that are usually used to quantify pigments also gave poor results.
Possibly, the main reason for the poor performance of the reported indices may be the range of wavelengths used for calculations. All of the reported indices were developed using specific wavelengths to fit their specific purposes. For example, PRI was developed using green wavelengths at 531 nm and 570 nm, both of which are useful to detect chlorophyll fluorescence [57,58]. As such, a number of previous researches have already proved the feasibility of PRI for tracing other plant physiological activities related to chlorophyll pigment [24,59,60], but apparently not for photosynthetic parameters. The other reported indices are largely based on the red and NIR wavelengths that are sensitive to trace the change of vegetation, except for NDNI using the SWIR range. However, the wavelengths used were not feasible to trace other physiological changes, especially photosynthetic capacity.
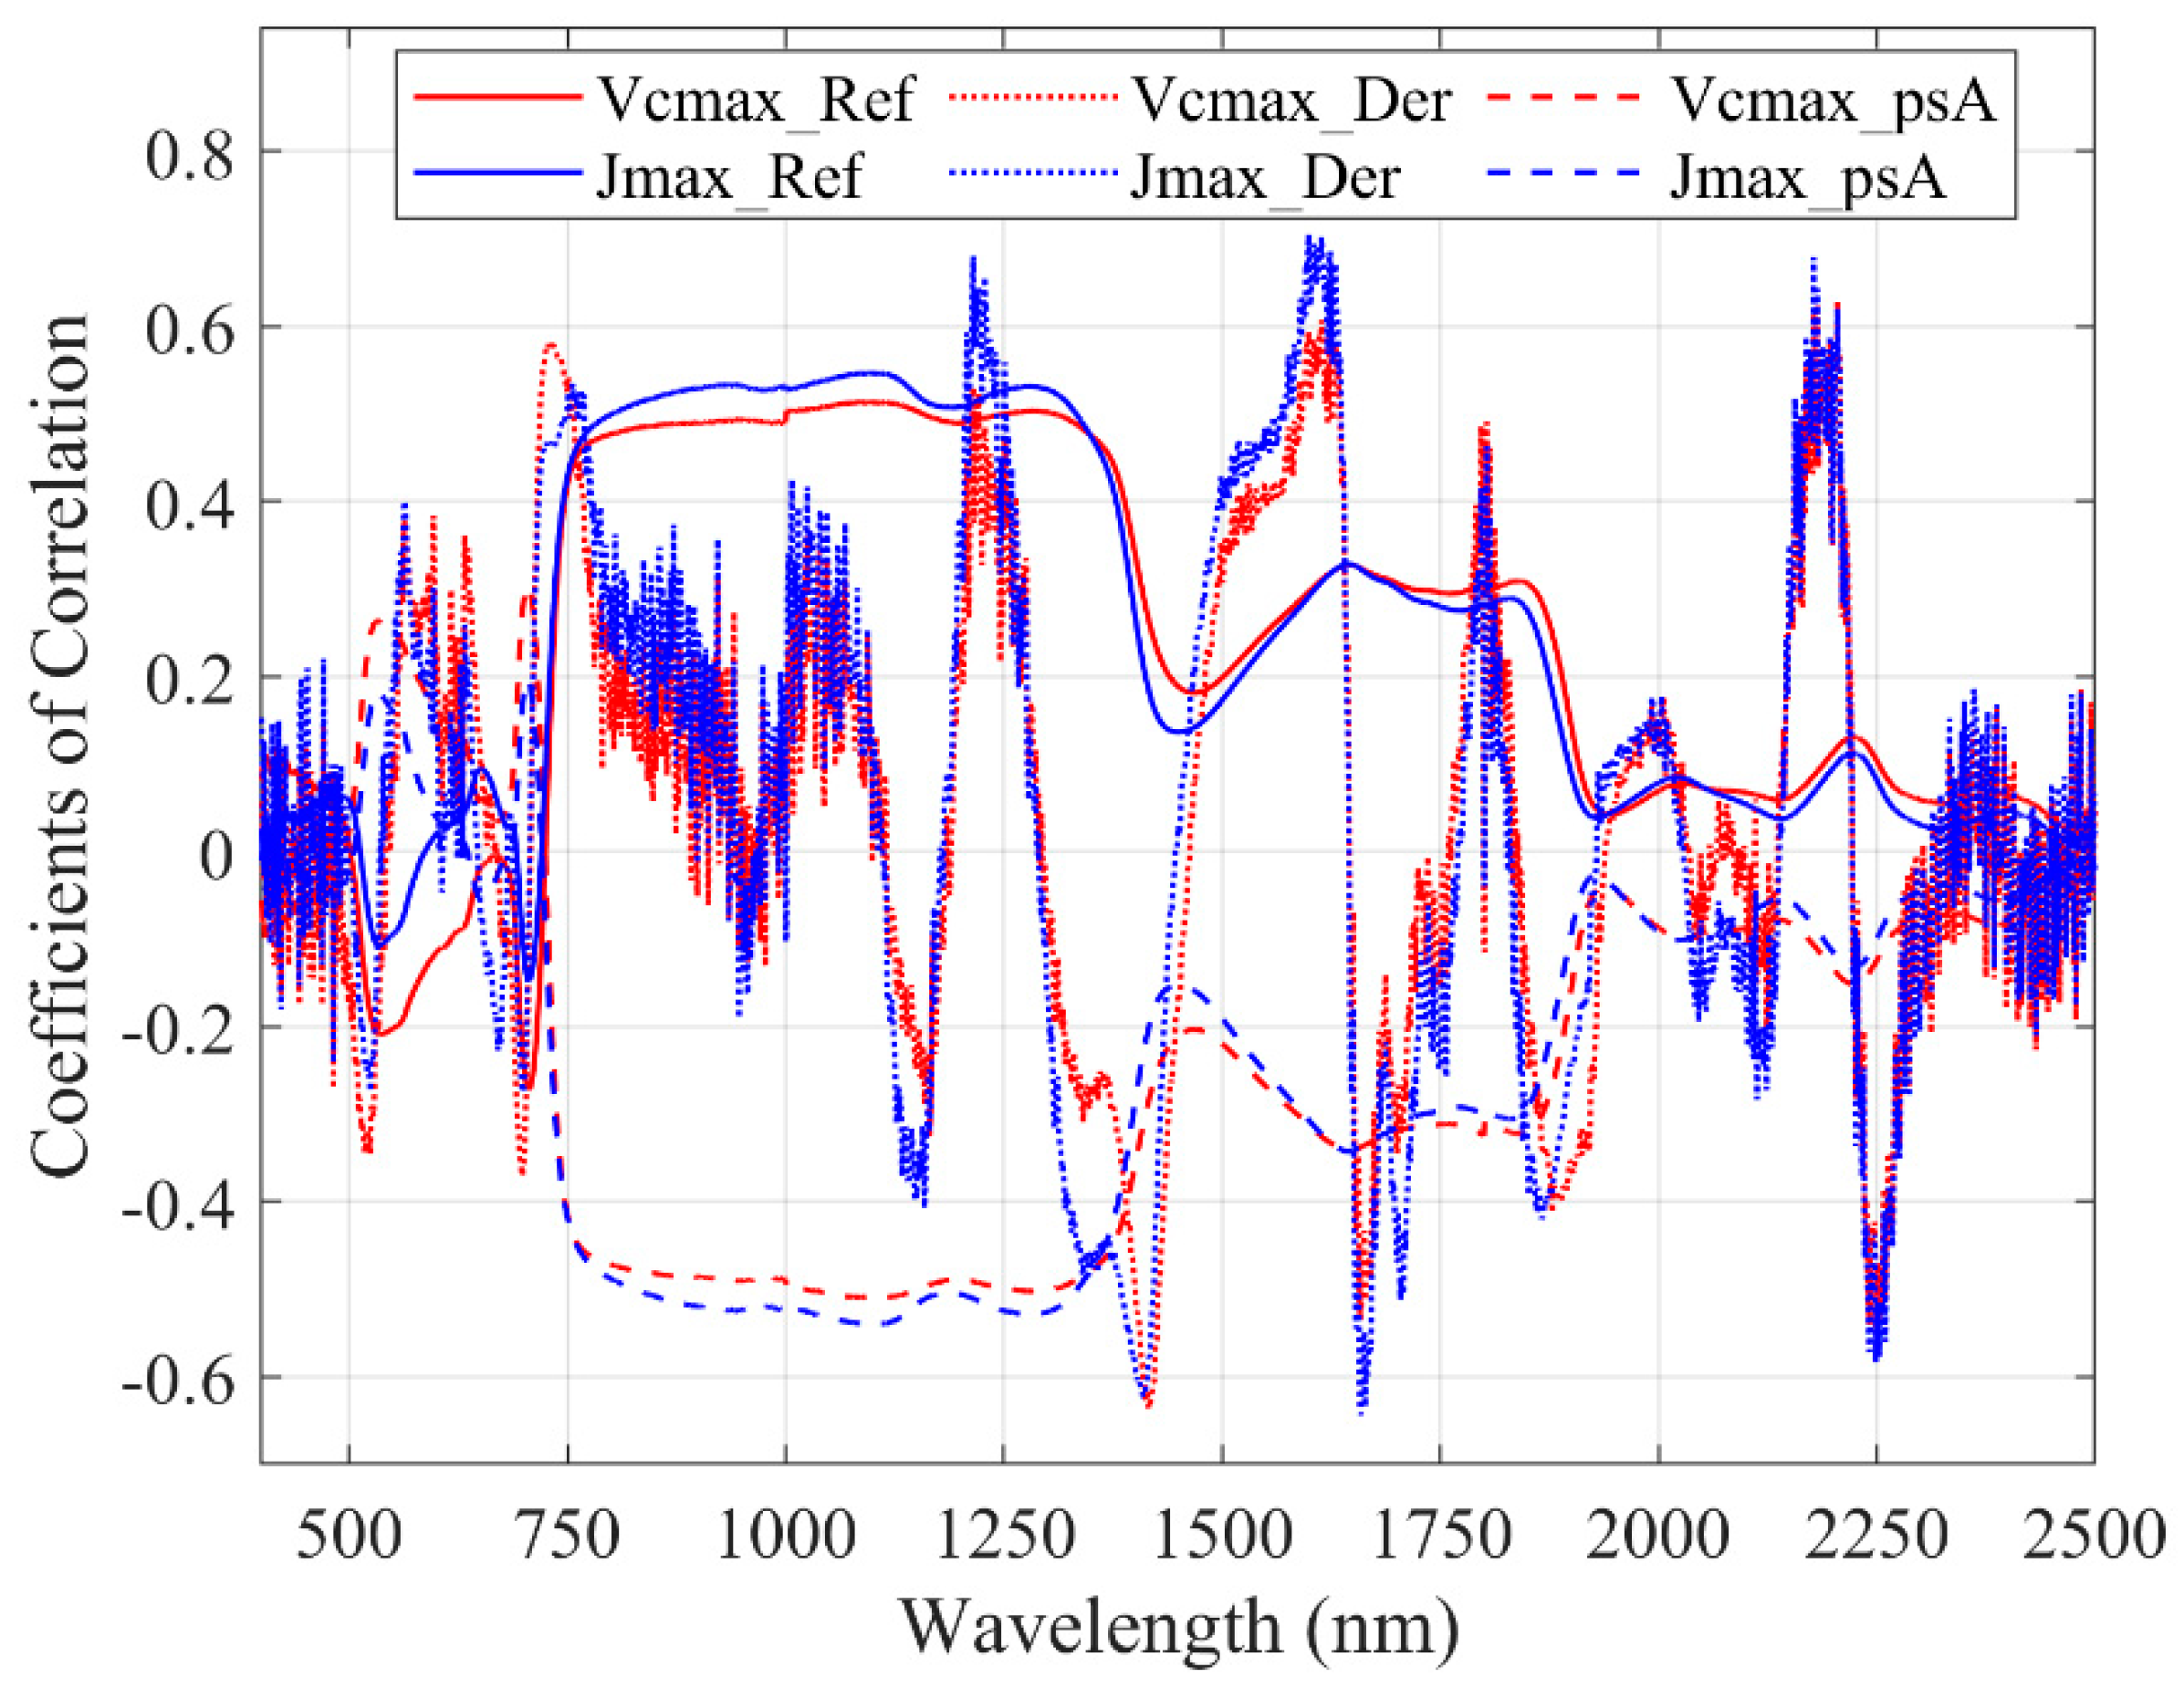
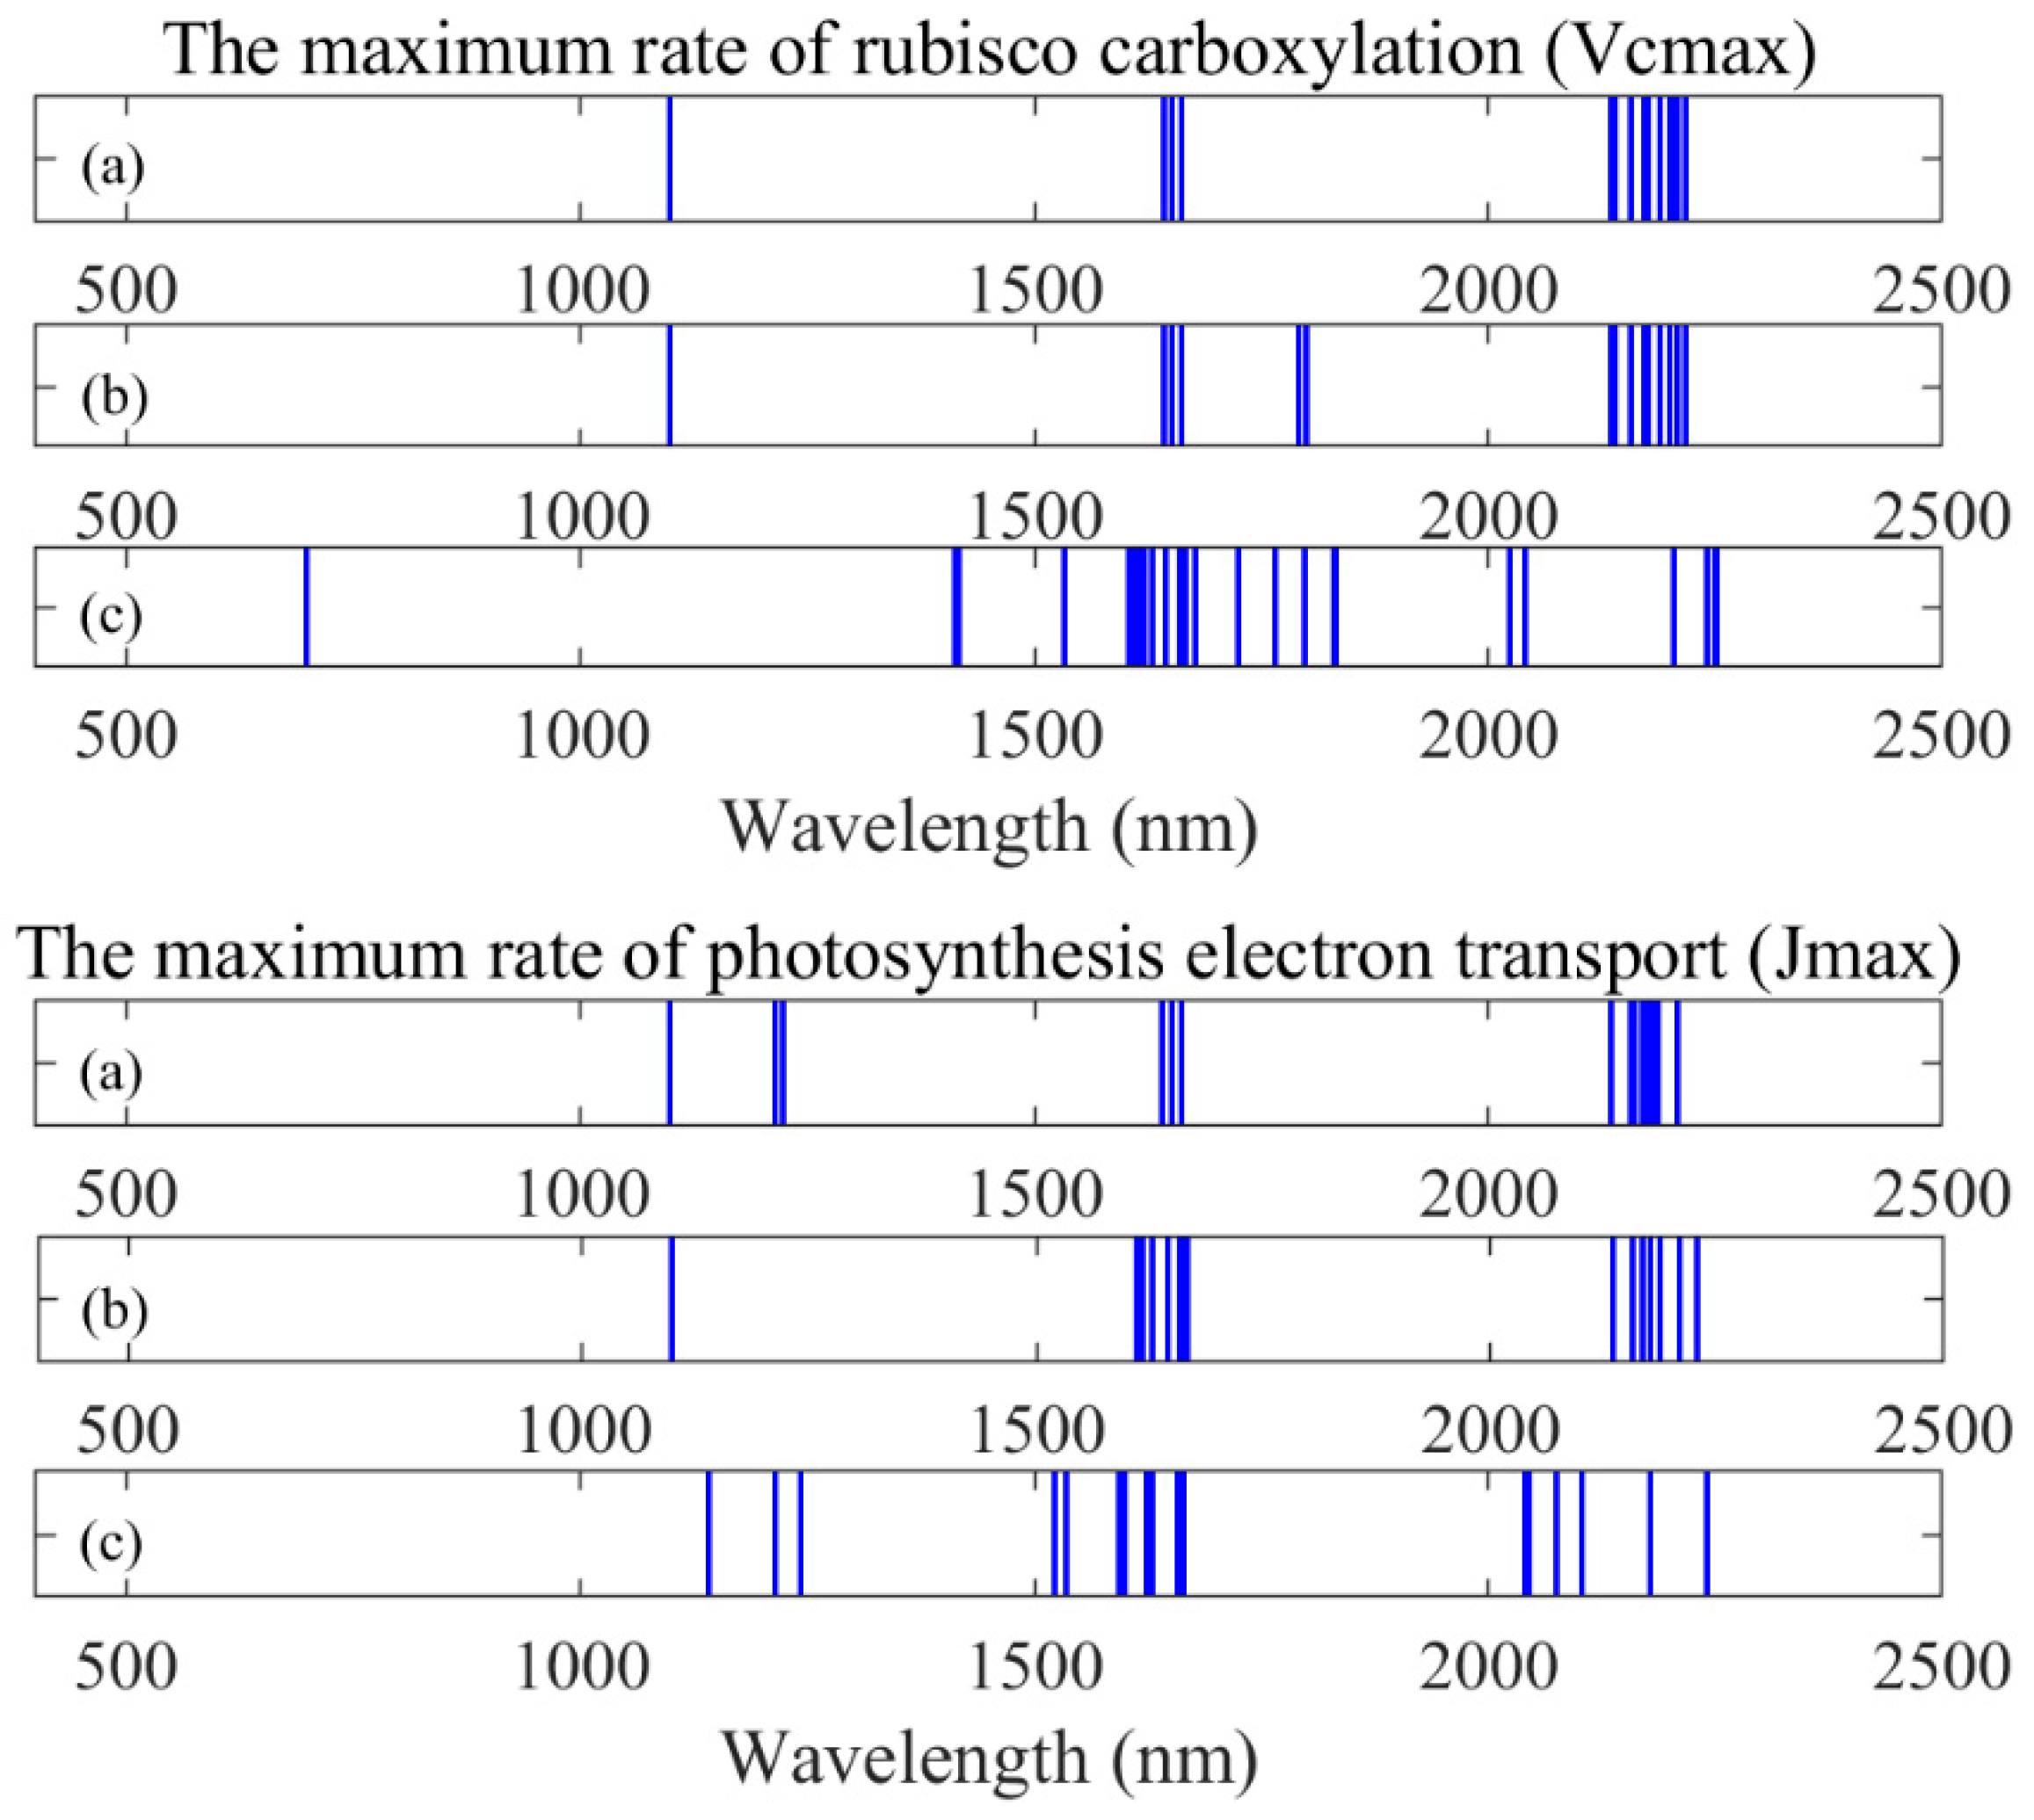
Clearly, new indices for quantifying photosynthetic capacity need to be developed. When using first-order derivatives spectra, we found DDn(1831,419) and D(1629,1658) to be the best indices for tracing Vcmax and Jmax based on our dataset. The RPD values of both indices are 1.43 and 1.78 for Vcmax and Jmax, respectively. Although this type of index is not the best on Jmax, the performance of DDn(1600,65) is still acceptable (RPD = 1.68, R2 = 0.64). We suggest that the DDn type of indices could be used as a general form for tracing photosynthetic parameters. We looked through the wavelengths and identified several negative coefficients of correlation (troughs) between the reflectance spectra and photosynthetic parameters. We found that our identified DDn index used a wavelength from the second trough and other troughs of first-order derivatives spectra, as shown in Figure 6. Meanwhile, the useful wavelengths for all of the indices based on original reflectance, first-order derivatives, and apparent spectra are presented in Figure 7. Most of the useful wavelengths for both parameters are from the peak regions or troughs region.
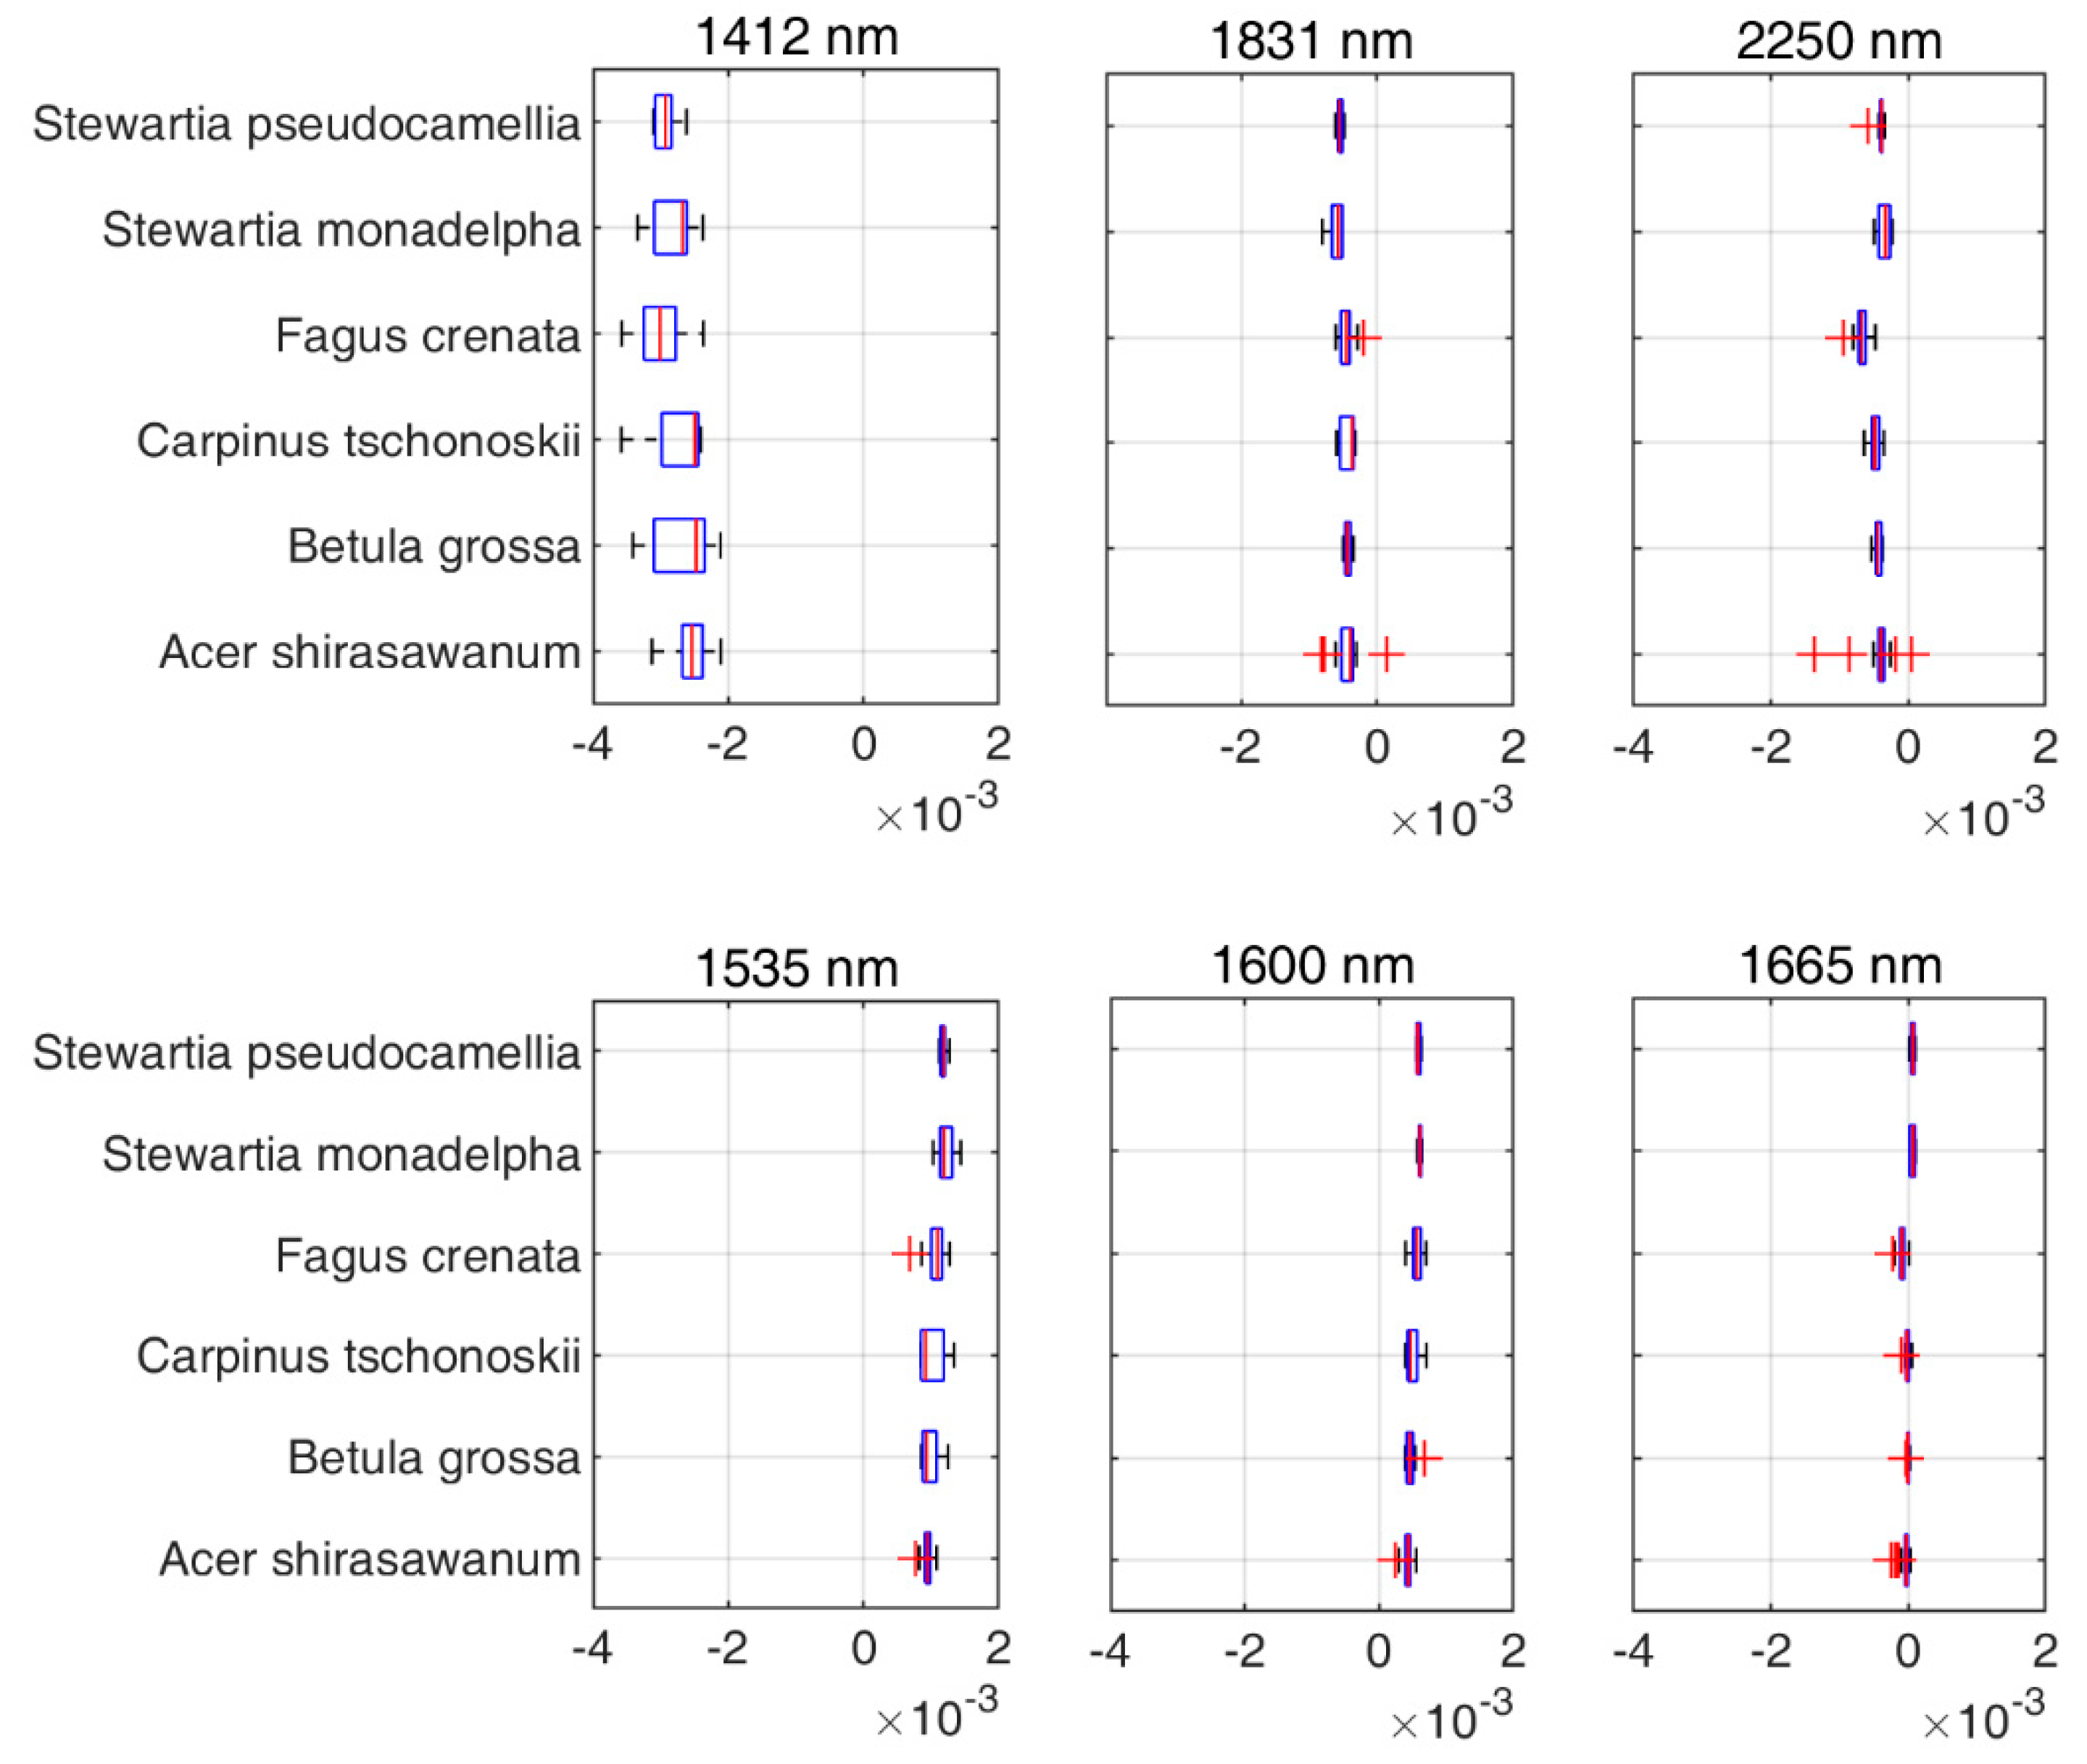
The indices based on the first-order derivatives spectra were found to perform better than those based on the original or apparent absorption spectra. The first-order derivatives spectra are known to be able to reduce noise between spectral data [45,46] and this is the probable reason. Another possible reason is that these identified indices all used wavelengths in the SWIR region (1300 nm to 2500 nm). The SWIR domain is known to be very informative for detecting physiological or chemical activity due to the wavelengths being absorbed or reflected by the object [61,62]. These SWIR wavelengths have properties that are more similar to visible light compared with the other infrared range. Based on Figure 7, we extracted six different wavelengths used by the DDn type of indices based on the first-order derivatives spectra. Wavelengths 1412 nm, 1831 nm, and 2250 nm were selected for Vcmax and wavelengths 1535 nm, 1600 nm, and 1665 nm were selected for Jmax. The wavelength 1412 nm used in the DDn index for Vcmax estimation was within the most sensitive domain of Vcmax. The first-order derivative spectra at 1412 nm were significantly related to Vcmax (the coefficient of correlation r = -0.62). Similarly, the wavelength 1600 nm used in the DDn index for Jmax estimation was also within the most sensitive domain of Jmax. The first-order derivative spectra at 1600 nm were significantly and positively related to Jmax (the coefficient of correlation r = 0.68). According to Figure 8, there were no significant differences between species in this range of wavelengths. However, the value range of the wavelengths differed in each case. The value of each wavelength is presented in Figure 8.
Furthermore, we investigated the robustness of the developed indices with different leaf groups. The difference in leaf groups (sunlit and shaded) used in this study is due to differences in their response to the photosynthesis process [63]. This leaf stratification also contributed to model accuracy when upscaling the leaf photosynthesis model to the canopy scale [64]. While in several vegetation indices that have already been developed, the sunlit leaves usually contain a higher ratio of chlorophyll A and are thicker than shaded leaves, the shaded leaves have more chlorophyll per dried leaf weight and emit the maximum chlorophyll fluorescence, higher than sunlit leaves [65].
We found that the DDn type of indices consistently traced Jmax well, even when the wavelengths used were slightly different. For the shaded leaf group, the best DDn index used the 1664 nm for λ1with a Δλ of 54 nm, while for the sunlit leaf group the 1609 nm was used for λ1 with the Δλ of 45 nm. Meanwhile, the RPD values of the DDn type indices for tracing Vcmax decreased, especially in the sunlit leaves group. The sunlit leaves and shaded leaves have different physical and pigment conditions, where the shaded leaves usually emit higher chlorophyll fluorescence compared with sunlit leaves [65]. Furthermore, the sunlit leaves mostly represent the lowest quantum yield of electron transport and lowest pigment content [66] while the shaded leaves generally obtain only one-third of the canopy carbon gain [67].
In addition to leaf groups, the screening results for different species also confirmed that the DDn type of indices performed best for B. grossa and F. crenata. However, the RPD value of the DDn index for A. shirasawanum was also respectable. As mentioned before, A. Shirasawanum and F. crenata have a large number of samples, being the dominant and targeted species in our study, while for other species, the DDn performed respectably in comparison with the other types of index and when using different forms of spectra also performed better than the original reflectance spectra.
Further, we tested the indices with downscaled datasets to check the possibility of using airborne or satellite-borne data that generally have coarse spectral resolutions. The DDn type of indices kept their good performance for tracing Jmax and even Vcmax, although the Vcmax results were slightly inferior to those of Jmax. We also tried to use different types of spectral forms to test the consistency of the DDn index, and the performance for the DDn type of indices was found to be acceptable even for different spectral resolutions.
We concluded that the best type of index for quantifying photosynthetic parameters is the DDn type, which proved to be robust even for different species. The index also performed stably for downscaled resolution spectra, suggesting that it could also be used for airborne or satellite-borne coarse spectral data.
However, we realize that the indices have several shortcomings that must be resolved before they can be applied widely, such as that the number of species needs to be increased, as the sensitivity of hyperspectral indices is often considered to be species-dependent [68,69]. Furthermore, the sample sizes for several specific species were too small and could possibly therefore be overfitted, since it has been claimed that the sample size could influence the value of statistical indicators [70]. The first-order derivatives spectra are the best type of spectra for quantifying photosynthetic parameters, as hyperspectral indices based on the spectra show a certain balance between accuracy and robustness on retrieving plant properties [71]. Even though we are confident that this type of index could work for the alpine deciduous forest, much more study is still needed in order to provide generally applicable indices for tracing photosynthetic parameters. However, we foresee that such indices could be developed and we have taken an important step towards this objective.
5. Conclusions
New hyperspectral vegetation indices have been developed for tracing photosynthetic parameters in an alpine deciduous forest containing six species. The results demonstrated that the DDn type of indices performed best in tracing photosynthetic capacity. The DDn type of indices used the first-order derivatives spectra in the SWIR region wavelength at 1831 nm with Δλ 419 nm for Vcmax and 1600 nm with Δλ 65 nm for Jmax. The result from this index type was relatively stable even for the downscaled resolution of 50 nm. The first-order derivatives spectra have been proven to be the best spectral form for tracing photosynthetic capacity. The DDn type of indices and first-order derivatives spectra have already demonstrated possibilities for tracing photosynthetic capacity using hyperspectral indices. The results obtained can contribute to the development of the vegetation index to assess photosynthetic capacity, especially for the alpine deciduous forest.
Author Contributions
Q.W. conceived and designed the experiments. J.J. and B.A.P. analyzed the data. J.J., B.A.P., and Q.W. wrote the manuscript. All authors have read and agreed to the published version of the manuscript.
Funding
This research was funded by the JSPS projects (Grant No. 16H04933 and Grant No. 16KK0170).
Acknowledgments
The authors would like to thank the members of the Macroecology Laboratory, Faculty of Agriculture, Shizuoka University, who helped with the field work and development of the tree physiological database in our study site. Bayu Arief Pratama would like to thank the RISET-Pro Scholarship from the Indonesian Ministry of Research, Science, Technology, and Higher Education for financing his master’s study.
Conflicts of Interest
The authors declare no conflict of interest.
References
- Cao, M.; Woodward, F.I. Dynamic responses of terrestrial ecosystem carbon cycling to global climate change. Nature 1998, 393, 249–252. [Google Scholar] [CrossRef]
- Pachauri, R.; Reisinger, A. Climate Change 2007. Synthesis Report. Contribution of Working Groups I, II and III to the Fourth Assessment Report; Cambridge University Press: Cambridge, UK, 2008. [Google Scholar]
- Stocker, B.D.; Wang, H.; Smith, N.G.; Harrison, S.P.; Keenan, T.F.; Sandoval, D.; Davis, T.; Prentice, I.C. P-model v1.0: An optimality-based light use efficiency model for simulating ecosystem gross primary production. Geosci. Model Dev. Discuss. 2019, 2019, 1–59. [Google Scholar] [CrossRef] [Green Version]
- Wang, H.; Prentice, I.C.; Keenan, T.F.; Davis, T.W.; Wright, I.J.; Cornwell, W.K.; Evans, B.J.; Peng, C. Towards a universal model for carbon dioxide uptake by plants. Nature Plants 2017, 3, 734–741. [Google Scholar] [CrossRef] [PubMed] [Green Version]
- Farquhar, G.D.; von Caemmerer, S.; Berry, J.A. A biochemical model of photosynthetic CO2 assimilation in leaves of C3 species. Planta 1980, 149, 78–90. [Google Scholar] [CrossRef] [PubMed] [Green Version]
- Ryu, Y.; Berry, J.A.; Baldocchi, D.D. What is global photosynthesis? History, uncertainties and opportunities. Remote Sens. Environ. 2019, 223, 95–114. [Google Scholar] [CrossRef]
- Walker, A.P.; Beckerman, A.P.; Gu, L.; Kattge, J.; Cernusak, L.A.; Domingues, T.F.; Scales, J.C.; Wohlfahrt, G.; Wullschleger, S.D.; Woodward, F.I. The relationship of leaf photosynthetic traits—Vcmax and Jmax—To leaf nitrogen, leaf phosphorus, and specific leaf area: A meta-analysis and modeling study. Ecol. Evol. 2014, 4, 3218–3235. [Google Scholar] [CrossRef] [Green Version]
- Long, S.P.; Bernacchi, C.J. Gas exchange measurements, what can they tell us about the underlying limitations to photosynthesis? Procedures and sources of error. J. Exp. Bot. 2003, 54, 2393–2401. [Google Scholar] [CrossRef] [Green Version]
- Croft, H.; Chen, J.M.; Luo, X.; Bartlett, P.; Chen, B.; Staebler, R.M. Leaf chlorophyll content as a proxy for leaf photosynthetic capacity. Glob. Chang. Biol. 2017, 23, 3513–3524. [Google Scholar] [CrossRef]
- Asner, G.P. Biophysical and biochemical sources of variability in canopy reflectance. Remote Sens. Environ. 1998, 64, 234–253. [Google Scholar] [CrossRef]
- Doughty, C.E.; Asner, G.P.; Martin, R.E. Predicting tropical plant physiology from leaf and canopy spectroscopy. Oecologia 2011, 165, 289–299. [Google Scholar] [CrossRef]
- Transon, J.; D’Andrimont, R.; Maugnard, A.; Defourny, P. Survey of Hyperspectral Earth Observation Applications from Space in the Sentinel-2 Context. Remote Sens. 2018, 10, 157. [Google Scholar] [CrossRef] [Green Version]
- Van der Tol, C.; Verhoef, W.; Timmermans, J.; Verhoef, A.; Su, Z. An integrated model of soil-canopy spectral radiances, photosynthesis, fluorescence, temperature and energy balance. Biogeosciences 2009, 6, 3109–3129. [Google Scholar] [CrossRef] [Green Version]
- Chen, J.M.; Leblanc, S.G. A four-scale bidirectional reflectance model based on canopy architecture. IEEE Trans. Geosci. Remote Sens. 1997, 35, 1316–1337. [Google Scholar] [CrossRef]
- Jacquemoud, S.; Verhoef, W.; Baret, F.; Bacour, C.; Zarco-Tejada, P.J.; Asner, G.P.; François, C.; Ustin, S.L. PROSPECT+ SAIL models: A review of use for vegetation characterization. Remote Sens. Environ. 2009, 113, S56–S66. [Google Scholar] [CrossRef]
- Jin, J.; Wang, Q.; Wang, J.; Otieno, D. Tracing water and energy fluxes and reflectance in an arid ecosystem using the integrated model SCOPE. J. Environ. Manag. 2019, 231, 1082–1090. [Google Scholar] [CrossRef]
- Camino, C.; Gonzalez-Dugo, V.; Hernandez, P.; Zarco-Tejada, P.J. Radiative transfer Vcmax estimation from hyperspectral imagery and SIF retrievals to assess photosynthetic performance in rainfed and irrigated plant phenotyping trials. Remote Sens. Environ. 2019, 231, 111186. [Google Scholar] [CrossRef]
- Galleguillos, M.; Jacob, F.; Prevot, L.; Lagacherie, P.; Liang, S. Mapping Daily Evapotranspiration Over a Mediterranean Vineyard Watershed. IEEE Geosci. Remote Sens. Lett. 2011, 8, 168–172. [Google Scholar] [CrossRef]
- Rouse, J.W.; Haas, R.H.; Schell, J.A.; Deering, D.W. Monitoring vegetation systems in the Great Plains with ERTS. In Proceedings of the Third Earth Resources Technology Satellite-1 Symposium, Washington, DC, USA, 10–14 December 1974; pp. 309–317. [Google Scholar]
- Gamon, J.A.; Serrano, L.; Surfus, J.S. The photochemical reflectance index: An optical indicator of photosynthetic radiation use efficiency across species, functional types, and nutrient levels. Oecologia 1997, 112, 492–501. [Google Scholar] [CrossRef]
- Barton, C.V.M.; North, P.R.J. Remote sensing of canopy light use efficiency using the photochemical reflectance index model and sensitivity analysis. Remote Sens. Environ. 2001, 78, 264–273. [Google Scholar] [CrossRef]
- Stylinski, C.D.; Gamon, J.A.; Oechel, W.C. Seasonal patterns of reflectance indices, carotenoid pigments and photosynthesis of evergreen chaparral species. Oecologia 2002, 131, 366–374. [Google Scholar] [CrossRef]
- Weng, J.H.; Lai, K.M.; Liao, T.S.; Hwang, M.Y.; Chen, Y.N. Relationships of photosynthetic capacity to PSII efficiency and to photochemical reflectance index of Pinus taiwanensis through different seasons at high and low elevations of sub-tropical Taiwan. Trees 2009, 23, 347–356. [Google Scholar] [CrossRef]
- Garbulsky, M.F.; Peñuelas, J.; Gamon, J.; Inoue, Y.; Filella, I. The photochemical reflectance index (PRI) and the remote sensing of leaf, canopy and ecosystem radiation use efficiencies. A review and meta-analysis. Remote Sens. Environ. 2011, 115, 281–297. [Google Scholar] [CrossRef]
- Croft, H.; Chen, J.M. Leaf Pigment Content. In Comprehensive Remote Sensing; Liang, S., Ed.; Elsevier: Oxford, UK, 2018; pp. 117–142. [Google Scholar]
- Kim, M.S.; Daughtry, C.; Chappelle, E.; McMurtrey, J.; Walthall, C. The Use of High Spectral Resolution Bands for Estimating Absorbed Photosynthetically Active Radiation A Par. In Proceedings of the CNES 6th International Symposium on Physical Measurements and Signatures in Remote Sensing, Val d’Isère, France, 17–21 January 1994; pp. 299–306. [Google Scholar]
- Merton, R.; Huntington, J. Early simulation results of the ARIES-1 satellite sensor for multi-temporal vegetation research derived from AVIRIS. In Proceedings of the Eighth Annual JPL Airborne Earth Science Workshop, Pasadena, CA, USA, 9–11 February 1999; pp. 9–11. [Google Scholar]
- Serrano, L.; Peñuelas, J.; Ustin, S.L. Remote sensing of nitrogen and lignin in Mediterranean vegetation from AVIRIS data: Decomposing biochemical from structural signals. Remote Sens. Environ. 2002, 81, 355–364. [Google Scholar] [CrossRef]
- Serbin, S.P.; Dillaway, D.N.; Kruger, E.L.; Townsend, P.A. Leaf optical properties reflect variation in photosynthetic metabolism and its sensitivity to temperature. J. Exp. Bot. 2012, 63, 489–502. [Google Scholar] [CrossRef] [Green Version]
- Heckmann, D.; Schlüter, U.; Weber, A.P.M. Machine Learning Techniques for Predicting Crop Photosynthetic Capacity from Leaf Reflectance Spectra. Mol. Plant 2017, 10, 878–890. [Google Scholar] [CrossRef] [PubMed]
- Barnes, M.L.; Breshears, D.D.; Law, D.J.; van Leeuwen, W.J.D.; Monson, R.K.; Fojtik, A.C.; Barron-Gafford, G.A.; Moore, D.J.P. Beyond greenness: Detecting temporal changes in photosynthetic capacity with hyperspectral reflectance data. PLoS ONE 2017, 12, e0189539. [Google Scholar] [CrossRef] [Green Version]
- Méléder, V.; Jesus, B.; Barnett, A.; Barillé, L.; Lavaud, J. Microphytobenthos primary production estimated by hyperspectral reflectance. PLoS ONE 2018, 13, e0197093. [Google Scholar] [CrossRef] [Green Version]
- DuBois, S.; Desai, A.R.; Singh, A.; Serbin, S.P.; Goulden, M.L.; Baldocchi, D.D.; Ma, S.; Oechel, W.C.; Wharton, S.; Kruger, E.L.; et al. Using imaging spectroscopy to detect variation in terrestrial ecosystem productivity across a water-stressed landscape. Ecol. Appl. 2018, 28, 1313–1324. [Google Scholar] [CrossRef]
- Mohammed, G.H.; Colombo, R.; Middleton, E.M.; Rascher, U.; van der Tol, C.; Nedbal, L.; Goulas, Y.; Pérez-Priego, O.; Damm, A.; Meroni, M.; et al. Remote sensing of solar-induced chlorophyll fluorescence (SIF) in vegetation: 50 years of progress. Remote Sens. Environ. 2019, 231, 111177. [Google Scholar] [CrossRef]
- Sonobe, R.; Wang, Q. Towards a Universal Hyperspectral Index to Assess Chlorophyll Content in Deciduous Forests. Remote Sens. 2017, 9, 191. [Google Scholar] [CrossRef] [Green Version]
- Japan Meteorological Agency. Tables of Monthly Climate Statistics. Available online: https://www.data.jma.go.jp/obd/stats/etrn/view/monthly_s3_en.php?block_no=47656&view=1 (accessed on 30 June 2019).
- Foley, S.; Rivard, B.; Sanchez-Azofeifa, G.A.; Calvo, J. Foliar spectral properties following leaf clipping and implications for handling techniques. Remote Sens. Environ. 2006, 103, 265–275. [Google Scholar] [CrossRef]
- Richardson, A.D.; Berlyn, G.P. Changes in foliar spectral reflectance and chlorophyll fluorescence of four temperate species following branch cutting. Tree Physiol. 2002, 22, 499–506. [Google Scholar] [CrossRef] [PubMed] [Green Version]
- Duursma, R.A. Plantecophys—An R package for analysing and modelling leaf gas exchange data. PLoS ONE 2015, 10, e0143346. [Google Scholar] [CrossRef] [PubMed]
- R Core Team. R: A Language and Environment for Statistical Computing; R Foundation for Statistical Computing: Vienna, Austria, 2019; Available online: https://www.R-project.org/ (accessed on 30 March 2019).
- Peñuelas, J.; Baret, F.; Filella, I. Semi-Empirical Indices to Assess Carotenoids/Chlorophyll-a Ratio from Leaf Spectral Reflectance. Photosynthetica 1995, 31, 221–230. [Google Scholar]
- Daughtry, C.S.T.; Walthall, C.L.; Kim, M.S.; de Colstoun, E.B.; McMurtrey, J.E. Estimating corn leaf chlorophyll concentration from leaf and canopy reflectance. Remote Sens. Environ. 2000, 74, 229–239. [Google Scholar] [CrossRef]
- Stimson, H.C.; Breshears, D.D.; Ustin, S.L.; Kefauver, S.C. Spectral sensing of foliar water conditions in two co-occurring conifer species: Pinus edulis and Juniperus monosperma. Remote Sens. Environ. 2005, 96, 108–118. [Google Scholar] [CrossRef]
- Jiang, Z.; Huete, A.R.; Didan, K.; Miura, T. Development of a two-band enhanced vegetation index without a blue band. Remote Sens. Environ. 2008, 112, 3833–3845. [Google Scholar] [CrossRef]
- Demetriades-Shah, T.H.; Steven, M.D.; Clark, J.A. High resolution derivative spectra in remote sensing. Remote Sens. Environ. 1990, 33, 55–64. [Google Scholar] [CrossRef]
- Lawley, V.; Lewis, M.; Clarke, K.; Ostendorf, B. Site-based and remote sensing methods for monitoring indicators of vegetation condition: An Australian review. Ecol. Indic. 2016, 60, 1273–1283. [Google Scholar] [CrossRef] [Green Version]
- Chang, C.; Laird, D.A.; Mausbach, M.J.; Hurburgh, C.R. Near-infrared reflectance spectroscopy–principal components regression analyses of soil properties. Soil. Sci. Soc. Am. J. 2001, 65, 480–490. [Google Scholar] [CrossRef] [Green Version]
- Haboudane, D.; Miller, J.R.; Pattey, E.; Zarco-Tejada, P.J.; Strachan, I.B. Hyperspectral vegetation indices and novel algorithms for predicting green LAI of crop canopies: Modeling and validation in the context of precision agriculture. Remote Sens. Environ. 2004, 90, 337–352. [Google Scholar] [CrossRef]
- Meroni, M.; Colombo, R.; Panigada, C. Inversion of a radiative transfer model with hyperspectral observations for LAI mapping in poplar plantations. Remote Sens. Environ. 2004, 92, 195–206. [Google Scholar] [CrossRef]
- Zheng, G.; Moskal, L.M. Retrieving Leaf Area Index (LAI) Using Remote Sensing: Theories, Methods and Sensors. Sensors 2009, 9, 2719–2745. [Google Scholar] [CrossRef] [PubMed] [Green Version]
- Inoue, Y.; Peñuelas, J.; Miyata, A.; Mano, M. Normalized difference spectral indices for estimating photosynthetic efficiency and capacity at a canopy scale derived from hyperspectral and CO2 flux measurements in rice. Remote Sens. Environ. 2008, 112, 156–172. [Google Scholar] [CrossRef]
- Rascher, U.; Pieruschka, R. Spatio-temporal variations of photosynthesis: The potential of optical remote sensing to better understand and scale light use efficiency and stresses of plant ecosystems. Precis. Agric. 2008, 9, 355–366. [Google Scholar] [CrossRef]
- Verrelst, J.; Rivera, J.P.; van der Tol, C.; Magnani, F.; Mohammed, G.; Moreno, J. Global sensitivity analysis of the SCOPE model: What drives simulated canopy-leaving sun-induced fluorescence? Remote Sens. Environ. 2015, 166, 8–21. [Google Scholar] [CrossRef]
- Niinemets, Ü. Components of leaf dry mass per area—Thickness and density—Alter leaf photosynthetic capacity in reverse directions in woody plants. New Phytol. 1999, 144, 35–47. [Google Scholar] [CrossRef]
- Zhou, Y.; Ju, W.; Sun, X.; Hu, Z.; Han, S.; Black, T.A.; Jassal, R.S.; Wu, X. Close relationship between spectral vegetation indices and Vcmax in deciduous and mixed forests. Tellus B Chem. Phys. Meteorol. 2014, 66, 23279. [Google Scholar] [CrossRef] [Green Version]
- Gamon, J.A.; Field, C.B.; Goulden, M.L.; Griffin, K.L.; Hartley, A.E.; Joel, G.; Penuelas, J.; Valentini, R. Relationships between NDVI, canopy structure, and photosynthesis in three Californian vegetation types. Ecol. Appl. 1995, 5, 28–41. [Google Scholar] [CrossRef] [Green Version]
- Evain, S.; Flexas, J.; Moya, I. A new instrument for passive remote sensing: 2. Measurement of leaf and canopy reflectance changes at 531 nm and their relationship with photosynthesis and chlorophyll fluorescence. Remote Sens. Environ. 2004, 91, 175–185. [Google Scholar] [CrossRef]
- Rahimzadeh-Bajgiran, P.; Munehiro, M.; Omasa, K. Relationships between the photochemical reflectance index (PRI) and chlorophyll fluorescence parameters and plant pigment indices at different leaf growth stages. Photosynth. Res. 2012, 113, 261–271. [Google Scholar] [CrossRef] [PubMed]
- Peñuelas, J.; Garbulsky, M.F.; Filella, I. Photochemical reflectance index (PRI) and remote sensing of plant CO2 uptake. New Phytol. 2011, 191, 596–599. [Google Scholar] [CrossRef] [PubMed]
- Nyongesah, M.J.; Wang, Q.; Li, P. Effectiveness of photochemical reflectance index to trace vertical and seasonal chlorophyll a/b ratio in Haloxylon ammodendron. Acta Physiol. Plant. 2015, 37, 1–11. [Google Scholar] [CrossRef]
- Malchow, D.; Battaglia, J.; Brubaker, R.; Ettenberg, M. High Speed Short Wave Infrared (SWIR) Imaging and Range Gating Cameras; Society of Photo-Optical Instrumentation Engineers (SPIE): Orlando, FL, USA, 2007; Volume 6541. [Google Scholar]
- Schnermann, M.J. Organic dyes for deep bioimaging. Nature 2017, 551, 176–177. [Google Scholar] [CrossRef]
- Reich, P.B.; Ellsworth, D.S.; Walters, M.B. Leaf structure (specific leaf area) modulates photosynthesis-nitrogen relations: Evidence from within and across species and functional groups. Funct. Ecol. 1998, 12, 948–958. [Google Scholar] [CrossRef]
- Chen, J.M.; Mo, G.; Pisek, J.; Liu, J.; Deng, F.; Ishizawa, M.; Chan, D. Effects of foliage clumping on the estimation of global terrestrial gross primary productivity. Glob. Biogeochem. Cycles 2012, 26, GB1019. [Google Scholar] [CrossRef]
- Lichtenthaler, H.K.; Buschmann, C.; Döll, M.; Fietz, H.J.; Bach, T.; Kozel, U.; Meier, D.; Rahmsdorf, U. Photosynthetic activity, chloroplast ultrastructure, and leaf characteristics of high-light and low-light plants and of sun and shade leaves. Photosynth. Res. 1981, 2, 115–141. [Google Scholar] [CrossRef]
- Chaves, A.R.M.; Ten-Caten, A.; Pinheiro, H.A.; Ribeiro, A.; Damatta, F.M. Seasonal changes in photoprotective mechanisms of leaves from shaded and unshaded field-grown coffee (Coffea arabica L.) trees. Trees 2008, 22, 351–361. [Google Scholar] [CrossRef]
- Caldwell, M.M.; Meister, H.P.; Tenhunen, J.D.; Lange, O.L. Canopy structure, light microclimate and leaf gas exchange of Quercus coccifera L. in a Portuguese macchia: Measurements in different canopy layers and simulations with a canopy model. Trees 1986, 1, 25–41. [Google Scholar] [CrossRef]
- Eitel, J.U.H.; Gessler, P.E.; Smith, A.M.S.; Robberecht, R. Suitability of existing and novel spectral indices to remotely detect water stress in Populus spp. For. Ecol. Manag. 2006, 229, 170–182. [Google Scholar] [CrossRef]
- Jin, J.; Wang, Q. Hyperspectral indices based on first derivative spectra closely trace canopy transpiration in a desert plant. Ecol. Inform. 2016, 35, 1–8. [Google Scholar] [CrossRef]
- Cornell, J.; Berger, R. Factors that influence the value of the coefficient of determination in simple linear and nonlinear regression models. Phytopathology 1987, 77, 63–70. [Google Scholar] [CrossRef]
- Wang, Q.; Jin, J.; Sonobe, R.; Chen, J.M. Derivative hyperspectral vegetation indices in characterizing forest biophysical and biochemical quantities. In Hyperspectral Indices and Image Classifications for Agriculture and Vegetation; Thenkabail, P.S., Lyon, J.G., Huete, A., Eds.; CRC Press: Boca Raton, FL, USA, 2018; pp. 27–63. [Google Scholar]
Figure 1.
Study site location: (a) north tower, and (b) south tower.

Figure 2.
Distribution of photosynthetic parameters: (a) the maximum rate of carboxylation (Vcmax), and (b) the maximum rate of electron transport (Jmax).
Figure 2.
Distribution of photosynthetic parameters: (a) the maximum rate of carboxylation (Vcmax), and (b) the maximum rate of electron transport (Jmax).

Figure 3.
Variation of photosynthetic capacity from each species. Boxes show 25% and 75% quartiles, while the thick center line represents the median. Dots represent outliers.
Figure 3.
Variation of photosynthetic capacity from each species. Boxes show 25% and 75% quartiles, while the thick center line represents the median. Dots represent outliers.

Figure 4.
Variation of reflectance from each species. Lines represent mean of reflectance and the opaque zones represent standard deviations.
Figure 4.
Variation of reflectance from each species. Lines represent mean of reflectance and the opaque zones represent standard deviations.

Figure 5.
Variation of reflectance based on leaf categories. Lines represent mean of reflectance and the opaque zones represent standard deviations.
Figure 5.
Variation of reflectance based on leaf categories. Lines represent mean of reflectance and the opaque zones represent standard deviations.

Figure 6.
Correlation test between photosynthetic capacity and wavelength. The suffix ‘Der’ refers to the first-order derivative spectra, while the ‘Ref’ for the original reflectance, and the ‘psA’ for the apparent absorption spectra.
Figure 6.
Correlation test between photosynthetic capacity and wavelength. The suffix ‘Der’ refers to the first-order derivative spectra, while the ‘Ref’ for the original reflectance, and the ‘psA’ for the apparent absorption spectra.

Figure 7.
Useful wavelengths from all index types for photosynthetic capacity. (a) Original reflectance, (b) first-order derivatives spectra, and (c) apparent absorption.
Figure 7.
Useful wavelengths from all index types for photosynthetic capacity. (a) Original reflectance, (b) first-order derivatives spectra, and (c) apparent absorption.

Figure 8.
Value range of first-order derivatives spectra for the DDn selected wavelengths.


Table 1.
List of species used in this study.
| No. | Species Name | Number of Leaf Samples |
|---|---|---|
| 1. | Acer shirasawanum Koidz. | 46 |
| 2. | Betula grossa Siebold & Zucc. | 14 |
| 3. | Carpinus tschonoskii Maxim. | 11 |
| 4. | Fagus crenata Blume | 84 |
| 5. | Stewartia monadelpha Siebold & Zucc. | 6 |
| 6. | Stewartia pseudocamellia Maxim. | 9 |
Table 2.
Formulae of reported indices used in this study.
| No. | Name of Index | Formula of Index |
|---|---|---|
| 1. | Photochemical Reflectance Index, PRI [20] | |
| 2. | Red-edge Vegetation Stress Index, RVSI [27] | |
| 3. | Structure-Insensitive Pigment Index, SIPI [41] | |
| 4. | Chlorophyll Absorption Ratio Index, CARI [26] | |
| 5. | modified Chlorophyll Absorption Ratio Index, mCARI [42] | |
| 6. | Normalized Difference Nitrogen Index, NDNI [28] | |
| 7. | Normalized Difference Vegetation Index, NDVI [43] (Hyperspectral) | |
| 8. | Normalized Difference Vegetation Index, NDVI [19] (Moderate Resolution Imaging Spectroradiometer (MODIS)-like & Sentinel 2A-like) | |
| 9. | 2-band Enhanced Vegetation Index, EVI 2 (Hyperspectral) | |
| 10. | 2-band Enhanced Vegetation Index, EVI 2 [44] (MODIS-like & Sentinel 2A-like) |
Table 3.
Index types used for developing new indices: Spectra at given wavelength (R), simple ratio (SR), wavelength difference (D), normalized difference (ND), inverse differences (ID), double differences (DDn), modified simple ratio 1 (mSR1), modified simple ratio 2 (mSR2), modified normalized difference (mND) and modified inverse differences (mID).
| No. | Index type | Formula of index |
|---|---|---|
| 1. | R(λ1) | |
| 2. | SR(λ1, λ2) | |
| 3. | D(λ1, λ2) | |
| 4. | ND(λ1, λ2) | |
| 5. | ID(λ1, λ2) | |
| 6. | DDn(λ1, Δλ) | |
| 7. | mSR1(λ1, Δλ) | |
| 8. | mSR2(λ1, Δλ) | |
| 9. | mND(λ1, Δλ) | |
| 10. | mID(λ1, Δλ) |
Table 4.
Result of reported indices screening based on original reflectance spectra.
| Reported Indices | Vcmax | Jmax | ||
|---|---|---|---|---|
| RPD | R2 | RPD | R2 | |
| PRI | 1.02 | 0.04 | 1.08 | 0.13 |
| RSVI | 1.09 | 0.15 | 1.05 | 0.09 |
| SIPI | 1.02 | 0.04 | 1.00 | 0.00 |
| CARI | 1.05 | 0.09 | 1.02 | 0.03 |
| mCARI | 1.05 | 0.08 | 1.02 | 0.03 |
| NDNI | 1.08 | 0.14 | 1.12 | 0.19 |
| NDVI_Hyp | 1.04 | 0.07 | 1.02 | 0.04 |
| NDVI_MOD | 1.03 | 0.05 | 1.01 | 0.01 |
| NDVI_2A | 1.13 | 0.22 | 1.11 | 0.19 |
| EVI2_Hyp | 1.12 | 0.19 | 1.09 | 0.16 |
| EVI2_MOD | 1.12 | 0.20 | 1.14 | 0.23 |
| EVI2_2A | 1.15 | 0.23 | 1.17 | 0.26 |
*bold type indicates the best ratio of performance to deviation (RPD), coefficient of determination (R2), and type of indices used.
Table 5.
RPD and coefficient of determination based on different spectral types.
| Spectral Type | Index Type | ||||||||||
|---|---|---|---|---|---|---|---|---|---|---|---|
| R | SR | D | ND | ID | DDn | mSR1 | mSR2 | mND | mID | ||
| Maximum rate of rubisco carboxylation (Vcmax) | |||||||||||
| Original reflectance | RPD | 1.17 | 1.35 | 1.41 | 1.35 | 1.18 | 1.42 | 1.35 | 1.30 | 1.30 | 1.35 |
| R2 | 0.26 | 0.45 | 0.49 | 0.45 | 0.28 | 0.50 | 0.45 | 0.41 | 0.40 | 0.45 | |
| First-order derivatives | RPD | 1.30 | 1.29 | 1.41 | 1.31 | 1.32 | 1.43 | 1.32 | 1.30 | 1.31 | 1.27 |
| R2 | 0.41 | 0.40 | 0.50 | 0.42 | 0.43 | 0.51 | 0.42 | 0.40 | 0.41 | 0.38 | |
| Apparent absorption | RPD | 1.17 | 1.44 | 1.35 | 1.44 | 1.34 | 1.39 | 1.44 | 1.29 | 1.29 | 1.44 |
| R2 | 0.26 | 0.51 | 0.45 | 0.51 | 0.44 | 0.48 | 0.51 | 0.40 | 0.39 | 0.51 | |
| Maximum rate of photosynthesis electron transport (Jmax) | |||||||||||
| Original reflectance | RPD | 1.20 | 1.41 | 1.44 | 1.41 | 1.29 | 1.75 | 1.41 | 1.48 | 1.48 | 1.41 |
| R2 | 0.30 | 0.49 | 0.52 | 0.49 | 0.39 | 0.67 | 0.50 | 0.54 | 0.54 | 0.49 | |
| First-order derivatives | RPD | 1.41 | 1.44 | 1.78 | 1.46 | 1.45 | 1.68 | 1.51 | 1.53 | 1.58 | 1.45 |
| R2 | 0.50 | 0.52 | 0.68 | 0.53 | 0.52 | 0.64 | 0.56 | 0.57 | 0.60 | 0.52 | |
| Apparent absorption | RPD | 1.19 | 1.51 | 1.41 | 1.51 | 1.41 | 1.68 | 1.51 | 1.47 | 1.47 | 1.51 |
| R2 | 0.29 | 0.56 | 0.49 | 0.56 | 0.49 | 0.65 | 0.56 | 0.53 | 0.53 | 0.56 | |
*bold type indicates the best RPD, coefficient of determination (R2), and type of wavelength used.
Table 6.
RPD and R2 from developed indices using different leaf group datasets.
| Leaf Groups | Spectral Type | Index Type | ||||||||||
|---|---|---|---|---|---|---|---|---|---|---|---|---|
| R | SR | D | ND | ID | DDn | mSR1 | mSR2 | mND | mID | |||
| Sunlit | Maximum rate of rubisco carboxylation (Vcmax) | |||||||||||
| Original reflectance | RPD | 1.16 | 1.29 | 1.38 | 1.29 | 1.17 | 1.40 | 1.29 | 1.39 | 1.39 | 1.29 | |
| R2 | 0.25 | 0.39 | 0.47 | 0.39 | 0.26 | 0.48 | 0.39 | 0.47 | 0.47 | 0.39 | ||
| First-order derivatives | RPD | 1.32 | 1.37 | 1.40 | 1.35 | 1.41 | 1.45 | 1.37 | 1.37 | 1.37 | 1.36 | |
| R2 | 0.42 | 0.46 | 0.48 | 0.45 | 0.49 | 0.51 | 0.46 | 0.46 | 0.46 | 0.45 | ||
| Apparent absorption | RPD | 1.17 | 1.39 | 1.29 | 1.39 | 1.32 | 1.37 | 1.39 | 1.33 | 1.33 | 1.39 | |
| R2 | 0.25 | 0.47 | 0.39 | 0.47 | 0.42 | 0.46 | 0.47 | 0.43 | 0.43 | 0.47 | ||
| Maximum rate of photosynthesis electron transport (Jmax) | ||||||||||||
| Original reflectance | RPD | 1.24 | 1.42 | 1.57 | 1.42 | 1.33 | 1.75 | 1.42 | 1.60 | 1.60 | 1.42 | |
| R2 | 0.34 | 0.50 | 0.59 | 0.50 | 0.42 | 0.67 | 0.50 | 0.60 | 0.60 | 0.50 | ||
| First-order derivatives | RPD | 1.56 | 1.59 | 1.84 | 1.59 | 1.65 | 1.87 | 1.58 | 1.74 | 1.76 | 1.72 | |
| R2 | 0.58 | 0.60 | 0.70 | 0.60 | 0.63 | 0.71 | 0.60 | 0.67 | 0.67 | 0.66 | ||
| Apparent absorption | RPD | 1.23 | 1.57 | 1.42 | 1.57 | 1.56 | 1.66 | 1.57 | 1.50 | 1.49 | 1.57 | |
| R2 | 0.33 | 0.59 | 0.50 | 0.59 | 0.58 | 0.63 | 0.59 | 0.55 | 0.54 | 0.59 | ||
| Shaded | Maximum rate of rubisco carboxylation (Vcmax) | |||||||||||
| Original reflectance | RPD | 1.20 | 1.44 | 1.53 | 1.44 | 1.25 | 1.50 | 1.45 | 1.40 | 1.41 | 1.44 | |
| R2 | 0.30 | 0.51 | 0.57 | 0.51 | 0.36 | 0.55 | 0.52 | 0.48 | 0.49 | 0.51 | ||
| First-order derivatives | RPD | 1.41 | 1.43 | 1.51 | 1.49 | 1.43 | 1.62 | 1.46 | 1.50 | 1.55 | 1.43 | |
| R2 | 0.49 | 0.51 | 0.55 | 0.55 | 0.51 | 0.62 | 0.53 | 0.55 | 0.58 | 0.50 | ||
| Apparent absorption | RPD | 1.19 | 1.48 | 1.44 | 1.50 | 1.47 | 1.52 | 1.48 | 1.39 | 1.40 | 1.52 | |
| R2 | 0.29 | 0.54 | 0.51 | 0.55 | 0.53 | 0.56 | 0.54 | 0.47 | 0.48 | 0.57 | ||
| Maximum rate of photosynthesis electron transport (Jmax) | ||||||||||||
| Original reflectance | RPD | 1.22 | 1.46 | 1.49 | 1.47 | 1.22 | 1.65 | 1.46 | 1.47 | 1.49 | 1.46 | |
| R2 | 0.32 | 0.53 | 0.55 | 0.53 | 0.33 | 0.63 | 0.53 | 0.53 | 0.55 | 0.53 | ||
| First-order derivatives | RPD | 1.43 | 1.53 | 1.70 | 1.60 | 1.37 | 1.62 | 1.42 | 1.60 | 1.46 | 1.41 | |
| R2 | 0.51 | 0.57 | 0.65 | 0.61 | 0.46 | 0.62 | 0.50 | 0.61 | 0.53 | 0.49 | ||
| Apparent absorption | RPD | 1.22 | 1.50 | 1.47 | 1.50 | 1.38 | 1.66 | 1.50 | 1.46 | 1.48 | 1.50 | |
| R2 | 0.32 | 0.55 | 0.53 | 0.55 | 0.47 | 0.63 | 0.55 | 0.52 | 0.54 | 0.55 | ||
*bold type indicates the best RPD and coefficient of determination (R2).
© 2020 by the authors. Licensee MDPI, Basel, Switzerland. This article is an open access article distributed under the terms and conditions of the Creative Commons Attribution (CC BY) license (http://creativecommons.org/licenses/by/4.0/).
Share and Cite
MDPI and ACS Style
Jin, J.; Arief Pratama, B.; Wang, Q. Tracing Leaf Photosynthetic Parameters Using Hyperspectral Indices in an Alpine Deciduous Forest. Remote Sens. 2020, 12, 1124. https://0-doi-org.brum.beds.ac.uk/10.3390/rs12071124
AMA Style
Jin J, Arief Pratama B, Wang Q. Tracing Leaf Photosynthetic Parameters Using Hyperspectral Indices in an Alpine Deciduous Forest. Remote Sensing. 2020; 12(7):1124. https://0-doi-org.brum.beds.ac.uk/10.3390/rs12071124
Chicago/Turabian StyleJin, Jia, Bayu Arief Pratama, and Quan Wang. 2020. "Tracing Leaf Photosynthetic Parameters Using Hyperspectral Indices in an Alpine Deciduous Forest" Remote Sensing 12, no. 7: 1124. https://0-doi-org.brum.beds.ac.uk/10.3390/rs12071124
Note that from the first issue of 2016, this journal uses article numbers instead of page numbers. See further details here.