Integrating Landsat-8 and Sentinel-2 Time Series Data for Yield Prediction of Sugarcane Crops at the Block Level


Applied Agricultural Remote Sensing Centre, School of Science and Technology, University of New England, Armidale, NSW 2351, Australia
*
Author to whom correspondence should be addressed.
Remote Sens. 2020, 12(8), 1313; https://0-doi-org.brum.beds.ac.uk/10.3390/rs12081313
Submission received: 27 March 2020
/
Revised: 20 April 2020
/
Accepted: 20 April 2020
/
Published: 21 April 2020
(This article belongs to the Section Remote Sensing in Agriculture and Vegetation)
Abstract
:Early prediction of sugarcane crop yield at the commercial block level (unit area of a single crop of the same variety, ratoon or planting date) offers significant benefit to growers, consultants, millers, policy makers, crop insurance companies and researchers. This current study explored a remote sensing based approach for predicting sugarcane yield at the block level by further developing a regionally specific Landsat time series model and including individual crop sowing (or previous seasons’ harvest) date. For the Bundaberg growing region of Australia this extends over a five months period, from July to November. For this analysis, the sugarcane blocks were clustered into 10 groups based on their specific planting or ratoon commencement date within the specified five months period. These clustered or groups of blocks were named ‘bins’. Cloud free (<20%) satellite data from the polar-orbiting Landsat-8 (launched 2013), Sentinel-2A (launched 2015) and Sentinel-2B (launched 2017) sensors were acquired over the cane growing region in Bundaberg (area of 32,983 ha), from the growing season starting in July 2014, with the average green normalised difference vegetation index (GNDVI) derived for each block. The number of images acquired for each season was defined by the number of cloud free acquisitions. Using the Simple Linear Machine Learning (ML) algorithm, the extracted Landsat derived GNDVI values for each of the blocks were converted to Sentinel GNDVI. The average GNDVI of each ‘bin’ was plotted and a quadratic model was fitted through the time series to identify the peak growth stage defined as the maximum GNDVI value. The model derived maximum GNDVI values for each of the bins were then regressed against the average actual yield (t·ha-1) achieved for the respective bin over the five growing years, producing strong correlations (R2 = 0.92 to 0.99). The quadratic curves developed for the different bins were shifted according to the specific planting or ratoon date of an individual block allowing for the peak GNDVI value of the block to be calculated, regressed against the actual block yield (t·ha-1) and the prediction of yield to be made. To validate the accuracies of the 10 time series algorithms representing each of the 10 bins, 592 individual blocks were selected from the Bundaberg region during the 2019 harvest season. The crops were clustered into the appropriate bins with the respective algorithm applied. From a Sentinel image acquired on the 5 May 2019, the prediction accuracies were encouraging (R2 = 0.87 and RMSE = 11.33 (t·ha-1)) when compared to actual harvested yield, as reported by the mill. The results presented in this paper demonstrate significant progress in the accurate prediction of sugarcane yield at the individual sugarcane block level using a remote sensing, time-series based approach.
1. Introduction
Sugarcane (Saccharum spp. L.) is the second largest export crop in Australia, after wheat, with 453,470 hectares grown in 2016–17, producing an estimated average yield of 90 tons per hectare (t·ha-1) [1]. Sugarcane is grown along a 2100 km of Australia’s east coastline between Mossman in far North Queensland and Grafton in northern New South Wales, by around 4000 farmers [2]. Accurate early predictions of yield at the block level provides growers with important information that can guide decisions around the variable rate application of fertiliser, irrigation and other in-season crop management, harvest scheduling, marketing, milling and forward selling strategies. Currently, in Australia, the growers or mill funded productivity officers estimate in-season yield at the regional level using visual or destructive sampling techniques coupled with their experience of regional weather conditions, cultivar performance, land type and the occurrences of pests and diseases. However, this method is time consuming, labour intensive and the accuracies can be influenced by varied seasonal climatic conditions, limited sample size, variability in growing cycle and human error. Commercially available harvester mounted yield monitors, which are now operational in some Australian sugarcane growing regions [3], also allow growers to map yield variability with some accuracy. However, the data is only available post-harvest and therefore not applicable for in-season decision making. Satellite based remote sensing techniques with high spatial and temporal resolution have gained considerable attention as an accurate and cost effective method for forecasting sugarcane yield and for crop loss assessment [4,5,6,7].
Time series analysis of satellite based remote sensing offers a unique opportunity to assess land cover change and for monitoring crop growth at varying spatial and temporal resolutions [5]. Several environmental factors influence the production of sugarcane. The advantage of time series observations of satellite images is that it provides a measure of crop canopy change over time in response to abiotic and biotic factors such as rainfall, temperature, nutrient deficiency, soil condition, irrigation, pests, weeds and diseases control, etc. [8,9,10]. Numerous studies have shown the potential of time series observations of satellite images for monitoring vegetation, detecting land cover change, crop identification, mapping the seasonal influence of crop performance, crop rotations and crop yield prediction using different resolution sensors. Sensors used for these studies include National Oceanic and Atmospheric Administration’s (NOAA’s) AVHRR (Advanced Very High Resolution Radiometer) (1 km) [11,12], MODIS (Moderate Resolution Imaging Spectroradiometer) (250 m–1000 m) [8,13,14], MERIS (Medium Resolution Imaging Spectrometer) (300 m–1200 m) [15,16,17], SPOT (Satellite Pour l’ Observation de la Terre) (6 m) [4,9,18,19] and Landsat TM/ETM+/OLE (30 m) [5,20,21]. For sugarcane, a previous study by Rahman and Robson [5], developed a time series Landsat model for predicting yield at the regional level for Bundaberg region, which was later implemented for many other sugarcane growing regions in Australia [6,22,23]. Although the accuracy of the model was high at the regional level, accuracies at the individual block level varied due to the large variation in crop age (due to the extended harvest), crop management practices, lodging and flowering events. The single capture SPOT algorithm method for yield forecasting developed by Robson et. al. [4] also showed good accuracies for regional level yield prediction. However, the small window (March to May) of image capture required to encompass the peak growing stage, was subject to continual cloud cover that prevented the acquisition of useable imagery. Also, the targeted acquisition of imagery to within only a three months window meant that the influences on plant stress and therefore canopy reflectance and yield that occurred during other times of the growing cycle, could not be accounted for.
Several researchers have integrated climate based crop growth models with different remote sensing approaches to predict sugarcane yield. Duveiller et al. [24] used SPOT 4 satellite images to derive several metrics (e.g., integral, maximum and slope) of the fraction of absorbed photosynthetically active radiation (fAPAR) to estimate sugarcane yield at the regional level in Brazil. In Kenya, Mulianga et al. [8] explored a time integral and spatial aggregation of normalised difference vegetation index (NDVI) data from MODIS to forecast sugarcane yield. Bégué et al. [10] compared SPOT time series acquired maximum NDVI values and integrated NDVI values to estimate yield on Reunion and Guadeloupe islands, and found comparable RMSE of 13.2 and 15 t/ha respectively. Morel et al. [19] compared three different remote sensing based models (i) integrated NDVI (ii) Kumar-Monteith efficiency model and (iii) forced coupling MOSICAS model, to estimate sugarcane yield on Reunion Island. Under the experimental conditions, these crop models, integrated with remote sensing data, generated satisfactory results. However, the limitation of climate-based models is the spatial resolution of the weather stations used to collect the relevant data. Even when interpolated to a 5km grid, for example, this coverage is not sufficient to account for farm and crop level variation. Additionally climate models cannot account for nonweather related changes in crop condition or yield potential, such as management, pest, disease, nutrition, stage of crop ratoon, planting or harvest date [25]. Therefore, the integration of high temporal and spatial remotely sensed information is essential.
The potential of sugarcane crop growth monitoring and biomass estimation using Synthetic Aperture Radar (SAR) signals were explored by several studies [26,27,28,29,30]. Molijn et al. [27], analysed two C-band SAR (Sentinel-1 and Radarsat-2), one L-band SAR (ALOS-2), and two optical sensors (Landsat-8 and WorldView-2), in the state of São Paulo, Brazil and reported that the satellite imagery from L-band SAR and optical sensors is preferred for monitoring sugarcane biomass growth in time and space. Baghdadi et al. [28], explored multitemporal TerraSAR-X, ASAR/ENVISAT and PALSAR SAR data for monitoring sugarcane crops. Their results showed a high correlation between the radar backscattering coefficients and NDVI as a function of sugarcane crop parameters and suggested high incidence angles to monitor sugarcane harvest regardless of the radar wavelength.
With the advent of new generation multispectral Sentinel-2 satellite constellations (Sentinel-2A and Sentinel-2B) by the European Space Agency (ESA), a new opportunity for the long term frequent monitoring of agricultural landscapes is available. The spectral characteristics of Sentinel-2 are similar to both the SPOT (Satellite Pour l’Observation de la Terre) and Landsat sensors and therefore offers some data continuity. Sentinel-2 also offers higher spectral resolution with more spectral bands (13 spectral bands with spatial resolution between 10 m and 60 m) and a greater revisit frequency (5 days with two satellites) [31]. There are four spectral bands (three visible and one near infrared) of 10 m pixel size, corresponding closely to the equivalent Landsat-8 OLI (operational Land Imager) bands, and six near infrared and short wave infrared bands of 20 m pixel size. Sentinel-2A was launched in 23 June 2015, and Sentinel-2B was launched on 7 March 2017.
Following National Aeronautics and Space Administration (NASA) first deployed of Landsat-1 Multi Spectral Scanner (MSS) in 1972, the constellation of Landsat satellites including Landsat observatories (Landsat 1–5 with MSS, Landsat 4 and 5 with Thematic Mapper (TM), Landsat 7 with Enhanced Thematic Mapper Plus (ETM+) and Landsat-8 with Operational Land Imager (OLI)) has provided the longest collection of earth observation data than any other platform [32]. Landsat-8, the latest member of Landsat platform was launched in 2013, with a resolution of 30 metres (15 for panchromatic) and a revisiting time of 16 days. The extensive amount of historic data collected by the Landsat constellation has inspired and supported much research and development [33,34]. However, with the availability of the Sentinel-2 constellation with increased spatial and temporal resolution, there is substantial opportunity to combine the imagery sources.
Previous studies have reported a significant agreement between Sentinel-2 and Landsat-8 data for continuous monitoring of global land surface [35,36,37,38]. However, the combined use of these two sensors or the transition of a model developed with a particular sensor to another, poses a number of challenges due to the difference in the orbital, spatial, and spectral configurations [35]. Mandanici and Bitelli [36] reported a very good correlation between corresponding bands of two sensors with correlation coefficient (R) greater than 0.98, and a slope slightly diverged from the 1:1 line, due to differences in the radiometric characteristics of two sensors. They analysed the data collected from six areas, located in Australia, Bolivia, China, Iraq and Italy. Vuolo, et al. [39] compared the surface reflectance between Sentinel-2 and Landsat-8 over six test sites in Europe and reported a good correlation with coefficient of determination (R2) = 0.90 and Root Mean Square Error (RMSE) = 0.03 reflectance units. Following the launch of two Sentinel satellites, NASA released the Harmonised Landsat--Sentinel-2 (HLS) product to produce a consistent, harmonised surface reflectance product from Landsat and Sentinel-2 data [38]. From this analysis a linear adjustment function was developed that enables the conversion of Sentinel-2 reflectance to Landsat-8 reflectance. Flood [35] also found a good compatibility of Sentinel-2A with Landsat-7 and 8, with systematic differences in the range of 1% to 9% for different corresponding bands. He developed simple adjustment functions and compared these with the NASA HLS product. The results of his study showed a substantial regional variation between two products and therefore suggested that a regional adjustment of the input factors is required for use in a specific region.
Although, NDVI has been recognised as the most popular vegetation index (VI) for biomass and crop productivity assessment, the Green Normalised Difference Vegetation Index (GNDVI) has been shown to experience less saturation issues when measuring the reflectance of sugarcane crops [4,5,6,22,40]. In this study, the Landsat-8 and Sentinel-2 derived GNDVI values were compared, with data from 2014 to 2018 and used to develop a time series yield prediction model at the block level for Bundaberg region. The methodology applied to develop the model was similar to the previous model of Rahman and Robson [5], which has been used for the last three years to accurately predict sugarcane yield on regional level for 13 sugarcane growing regions in Australia (data not shown). Moreover, the harvest date on the individual block level was added to refine the previous model and to predict yield at the block level for the Bundaberg region in Australia.
The aims of this study were to:
- Develop a conversion algorithm that enables the transition of the Landsat-8 GNDVI time series model for sugarcane to the higher spatial and temporal resolution Sentinel-2A and Sentinel-2B satellite.
- Improve the accuracies of the existing time series model at the individual block level by introducing sugarcane planting or previous harvest date.
2. Materials and Methods
2.1. Study Area and Crop
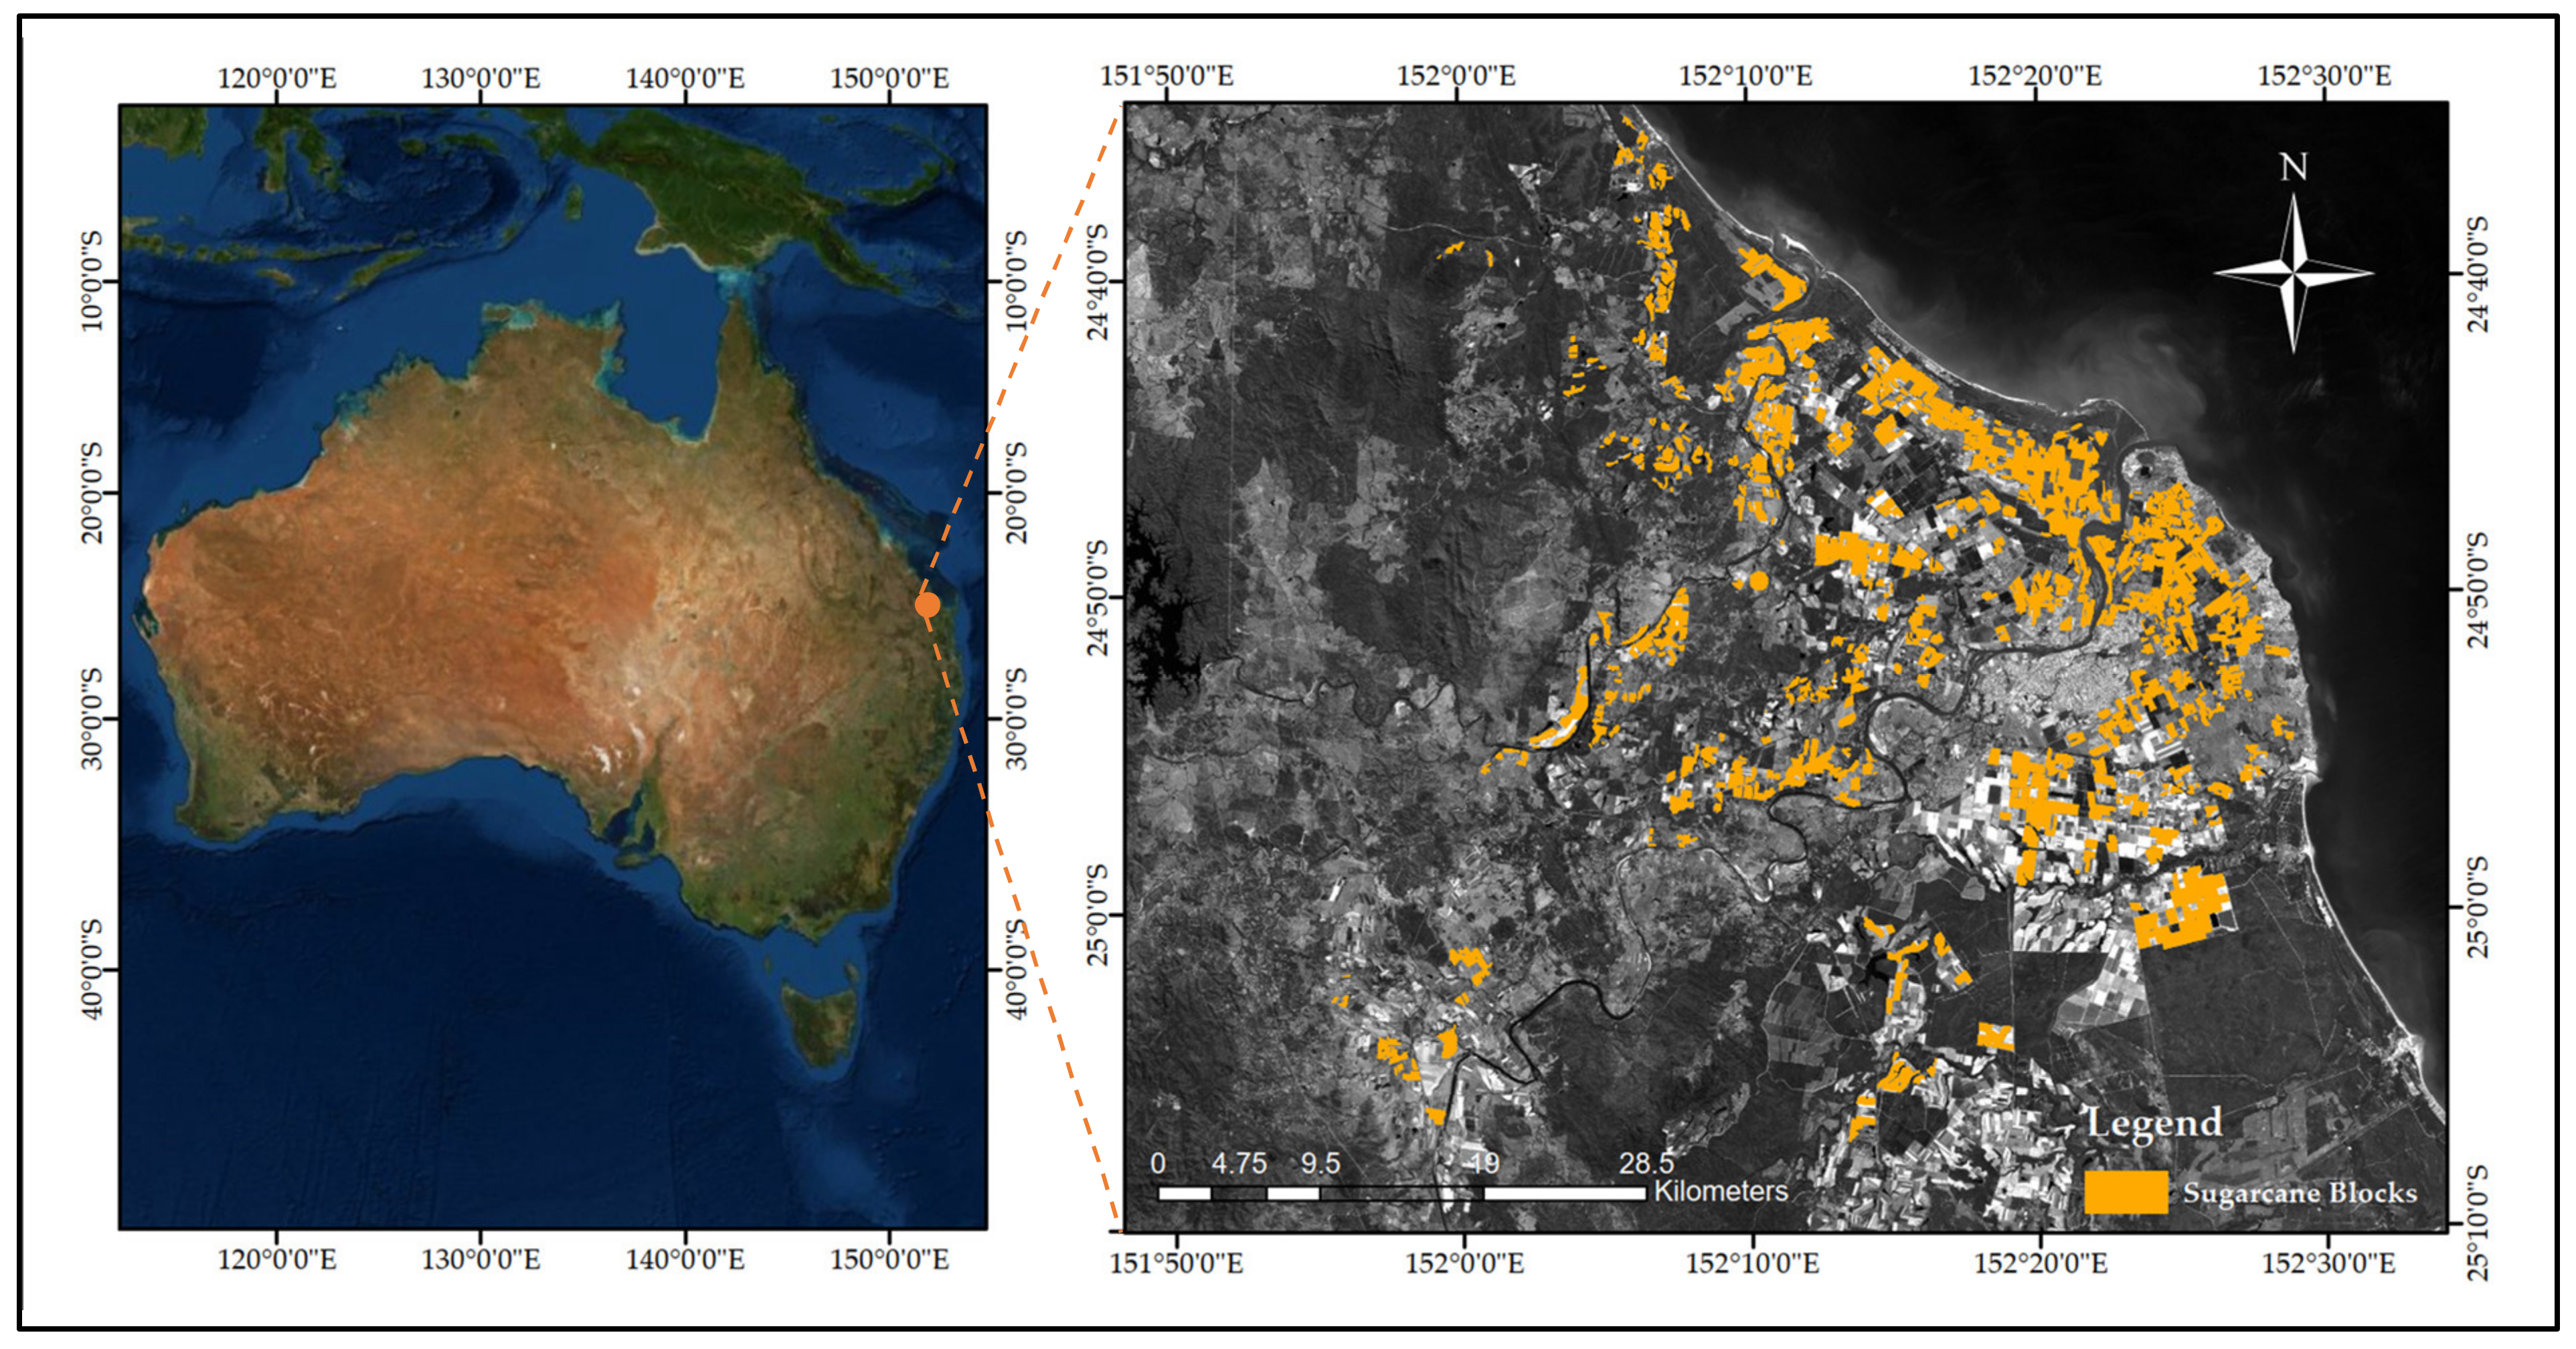
The Bundaberg cane growing region (Figure 1), located in the South East of Queensland in Australia was selected for this study. The area is located between longitudes 151.88˚E and 152.47˚E, and latitudes 24.49˚S and 25.10˚S, covering an area of 18,800 ha. Bundaberg has a warm, temperate climate with long hot summers and mild winters. The soil type of this region is highly varied due to the parent material of soil and topography. The mean annual rainfall is approximately 1022 mm (1959–2019), which mostly occurs during October to March. The mean maximum temperature is 26.8°C [41].
Sugarcane is propagated primarily from the setts or cuttings. The sections of the stalk of immature cane used for planting are known as seed cane or cane sets. Each set has two or three buds (eyes), from where the new plant grows. Another method of sugarcane propagation is called ratooning, where a portion of the stalk is left underground at the time of harvest, to give rise to a succeeding growth of sugarcane. In Bundaberg, Australia, the ratooning process is usually repeated four times. Therefore, the growers can get four economical crops from one original panting. The unit area of a single sugarcane crop of the same variety, ratoon or planting date is called a ‘block’. The size of the block in the Bundaberg region range from a minimum of 38 m2 to a maximum of 466,521 m2. Harvesting and milling begin in July and last for five to six months.
2.2. Satellite Data Acquisition and Preprocessing
In this study, 40 Landsat-8 OLI Level-2 (Surface Reflectance) images were acquired over the Bundaberg region (Path 90, Row 77) between June 2014 to December 2018 and with cloud cover less than 20%. The images were downloaded from the United States Geological Survey (USGS) National Center for Earth Resources Observation and Science (EROS) via the Earth Explorer portal (https://earthexplorer.usgs.gov/), under the “Landsat Archive” datasets.
Sentinel-2A and 2B Level-1C (radiometric and geometric corrections including ortho-rectification and spatial registration of top-of-atmosphere (ToA) reflectance) images for the study region (56JLT and 56JMT) were downloaded from European Space Agency’s (ESA’s) Copernicus Open Access Hub (https://scihub.copernicus.eu/dhus/#/home) portal. A total of 21 Sentinel-2A and 14 Sentinel-2B images acquired between May 2016 (First available cloud free image) and December 2018 with cloud cover less than 20% were sourced. The ESA’s “Sen2Cor-v2.8” algorithm [42] was applied to the L1C images to derive bottom-of-atmosphere (BoA) reflectance (Level-2A) data. The BoA reflectance, which is also known as top of canopy reflectance or surface reflectance (SR) is the measure of reflectance on the surface of the ground, whereas the ToA reflectance is the measure of reflectance at the sensor. The difference between ToA and BoA reflectance is the result of atmospheric attenuation. The projection of both Landsat-8 and Sentinel-2 were UTM/WGS84.
To validate the conversion algorithm and the developed time series model, another image pair of Landsat-8 and Sentinel-2A were acquired on 5 May 2019.
While processing the images, all image pixels with minor clouds, haze, shadow or bad data (the pixels that are largely different to the surrounding pixels, maybe due to cloud, cloud shadow or any other atmospheric effect) over the sugarcane growing regions were discarded.
2.3. Sugarcane Block Boundary Data
Sugarcane block boundary shape files from 2014 to 2018, were sourced from Bundaberg Sugar Limited under confidentiality agreement. The shape files were georeferenced projected to UTM/WGS84, to remain consistent with the coordinate system of Landsat and Sentinel. The blocks denoted as fallow within the five years study period were not considered, as a continuance of data was required for the development of the time series model. Blocks with no recorded yield data or those combined with other blocks, in any year, were also discarded from the study. An internal 10 m buffer was applied to each block boundary using ArcGIS 10.4 (Environmental Systems Research Institute. Redlands, CA, USA) to ensure that the extracted spectral information was specific to sugarcane only. All the Landsat-8 and Sentinel-2 images were masked according to these buffered boundary layers and the GNDVI was calculated using the following equation [43]:
where, RNIR and RGREEN are the reflectance measured in the near infrared and green spectral bands.
2.4. GNDVI Conversion for Landsat-8 and Sentinel-2
Due to the difference in orbits and swath widths of Landsat-8 and Sentinel-2, it is possible to find instances when two satellites acquire imagery over the same location on the same day. Considering that sugarcane growth and canopy morphology under normal growing conditions will not significantly change in the period of a few hours, and that both satellites are sun-synchronous with mid-morning overpass time, it can be assumed that on the same day there is no change in the land surface and the atmospheric conditions between the two acquisitions. However, the differences in orbits and swath widths of the two instruments can result in a significant difference in view angle, and therefore, atmospheric path length and the Bi-Directional Reflectance Distribution Function (BRDF). To minimise these differences, the BoA surface reflectance of both Landsat-8 and Sentinel-2 were used in the study.
Another important factor that needs to be considered is the difference in the pixel size of two instruments (10 m resolution RNIR and RGREEN bands of Sentinel-2 compared to 30 m resolution of Landsat-8), especially when comparing reflectance values within a specified boundary of area of interests (AOIs) such as small sugarcane blocks (<2 ha).
Three image pairs of Landsat-8 and Sentinel-2 were acquired on 29 June 2016, 15 May 2017 and 19 June 2018 to generate the conversion algorithm. Another image pair of Landsat-8 and Sentinel-2A acquired on 5 May 2019 was used to validate the algorithm. The date, time of acquisition defined as Coordinated Universal Time (UTC), sun elevation and azimuth angles (°) are given in Table 1 below.
2.5. Yield Prediction Model Development
To develop the individual block level time series models, all the blocks in the Bundaberg region were grouped or clustered according to their planting or ratoon commencement dates. For the five months harvesting window this resulted in 10 ‘bins’, based on half monthly increments. The average GNDVI value for individual crops within each ‘bin’ was derived from both Landsat-8 and Sentinel-2 satellite images acquired over a five years period (2014 to 2018) and plotted against the date of image acquisition and ten quadratic models (From July to November with half a month window) were fitted to visualise the progression of sugarcane crop growth in each individual bin. The vertex form of the quadratic equation as shown in Equation (2) was used to shift the horizontal axis of the curve according to the planting or ratoon date of the blocks and to shift vertical axis according to the acquired GNDVI value in a specific year.
Here, “a” is the curvature of the line, the sign (±) on “a” expresses whether the quadratic opens up or opens down, the sign (+) indicates that the quadratic opens up and the sign (−) indicates the quadratic opens down; h is the horizontal shift of the curve from x = 0, for a standard quadratic equation y = ax2 + bx + c, and k is the vertical shift of the curve from y = 0, which denotes as for a standard quadratic equation.
The maximum average GNDVI values from Equation (2) for each bin in different years were regressed against the actual yield data of that bin to predict yield at the bin level.
For developing the block level yield prediction model, the quadratic model developed at the bin level was adjusted according to the block level GNDVI value and the planting or ratoon date of that block. The maximum GNDVI value from the adjusted quadratic model for each block in different years were regressed against the actual block level yield.
2.6. Statistical Analysis
A simple linear machine learning (ML) algorithm was applied to the 2016, 2017 and 2018 data to develop the regression model between Landsat 8 and Sentinel 2 images. The data from 2019 was used for validation purpose. The model data were split into training and test sets as 8:2 ratio, 1727 data for model calibration and 347 for model validation.
Linear regression analysis on bin and block level was performed to evaluate the relationship between the model derived maximum GNDVI value and actual sugarcane yield. The ten bin level models using data from 2014 to 2018 were evaluated and compared using root mean square error (RMSE).
3. Results
3.1. GNDVI Conversion Algorithm for Landsat-8 and Sentinel-2
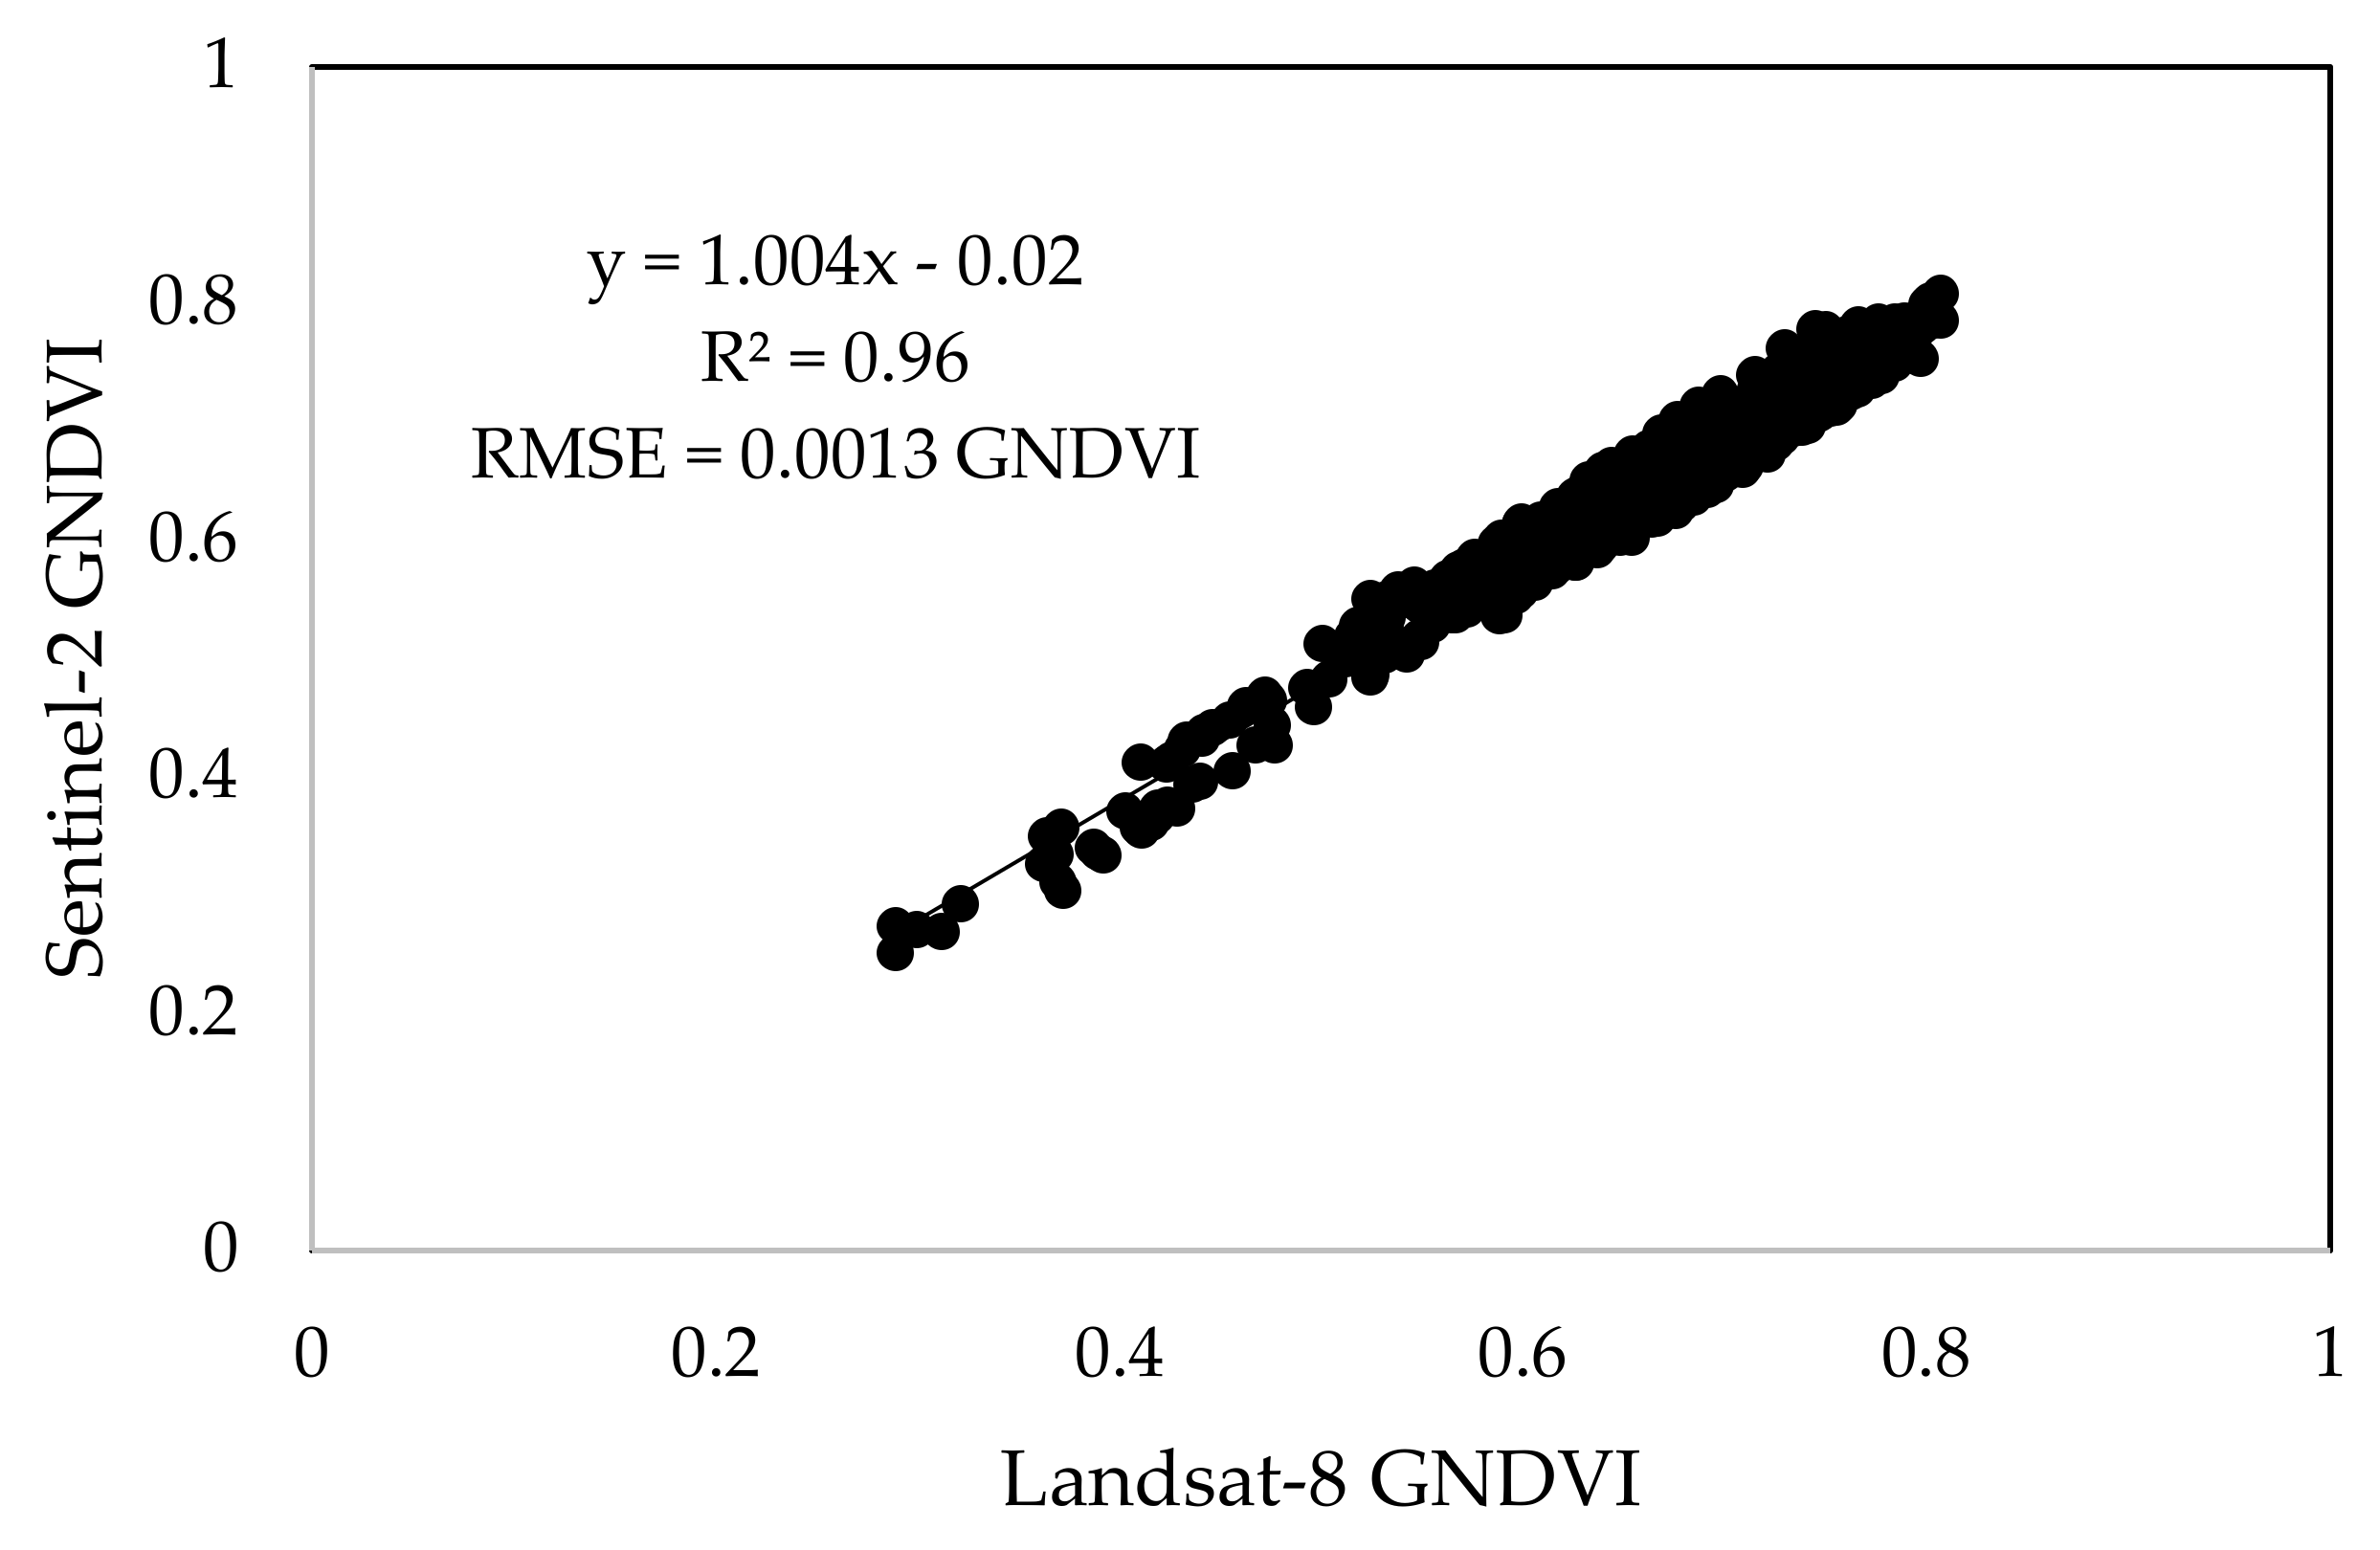
A comparison of average GNDVI values of individual sugarcane blocks derived from both Landsat-8 and Sentinel-2 platforms is shown in Figure 2. A good correlation was achieved using 2016, 2017 and 2018 data with R2 = 0.96 and RMSE = 0.0013 GNDVI. The slope of the regression line (Slope = 1.004), also showed a good agreement between Landsat-8 and Sentinel-2 derived GNDVI for Bundaberg sugarcane blocks.
3.2. Temporal Profile of GNDVI on Bin Level
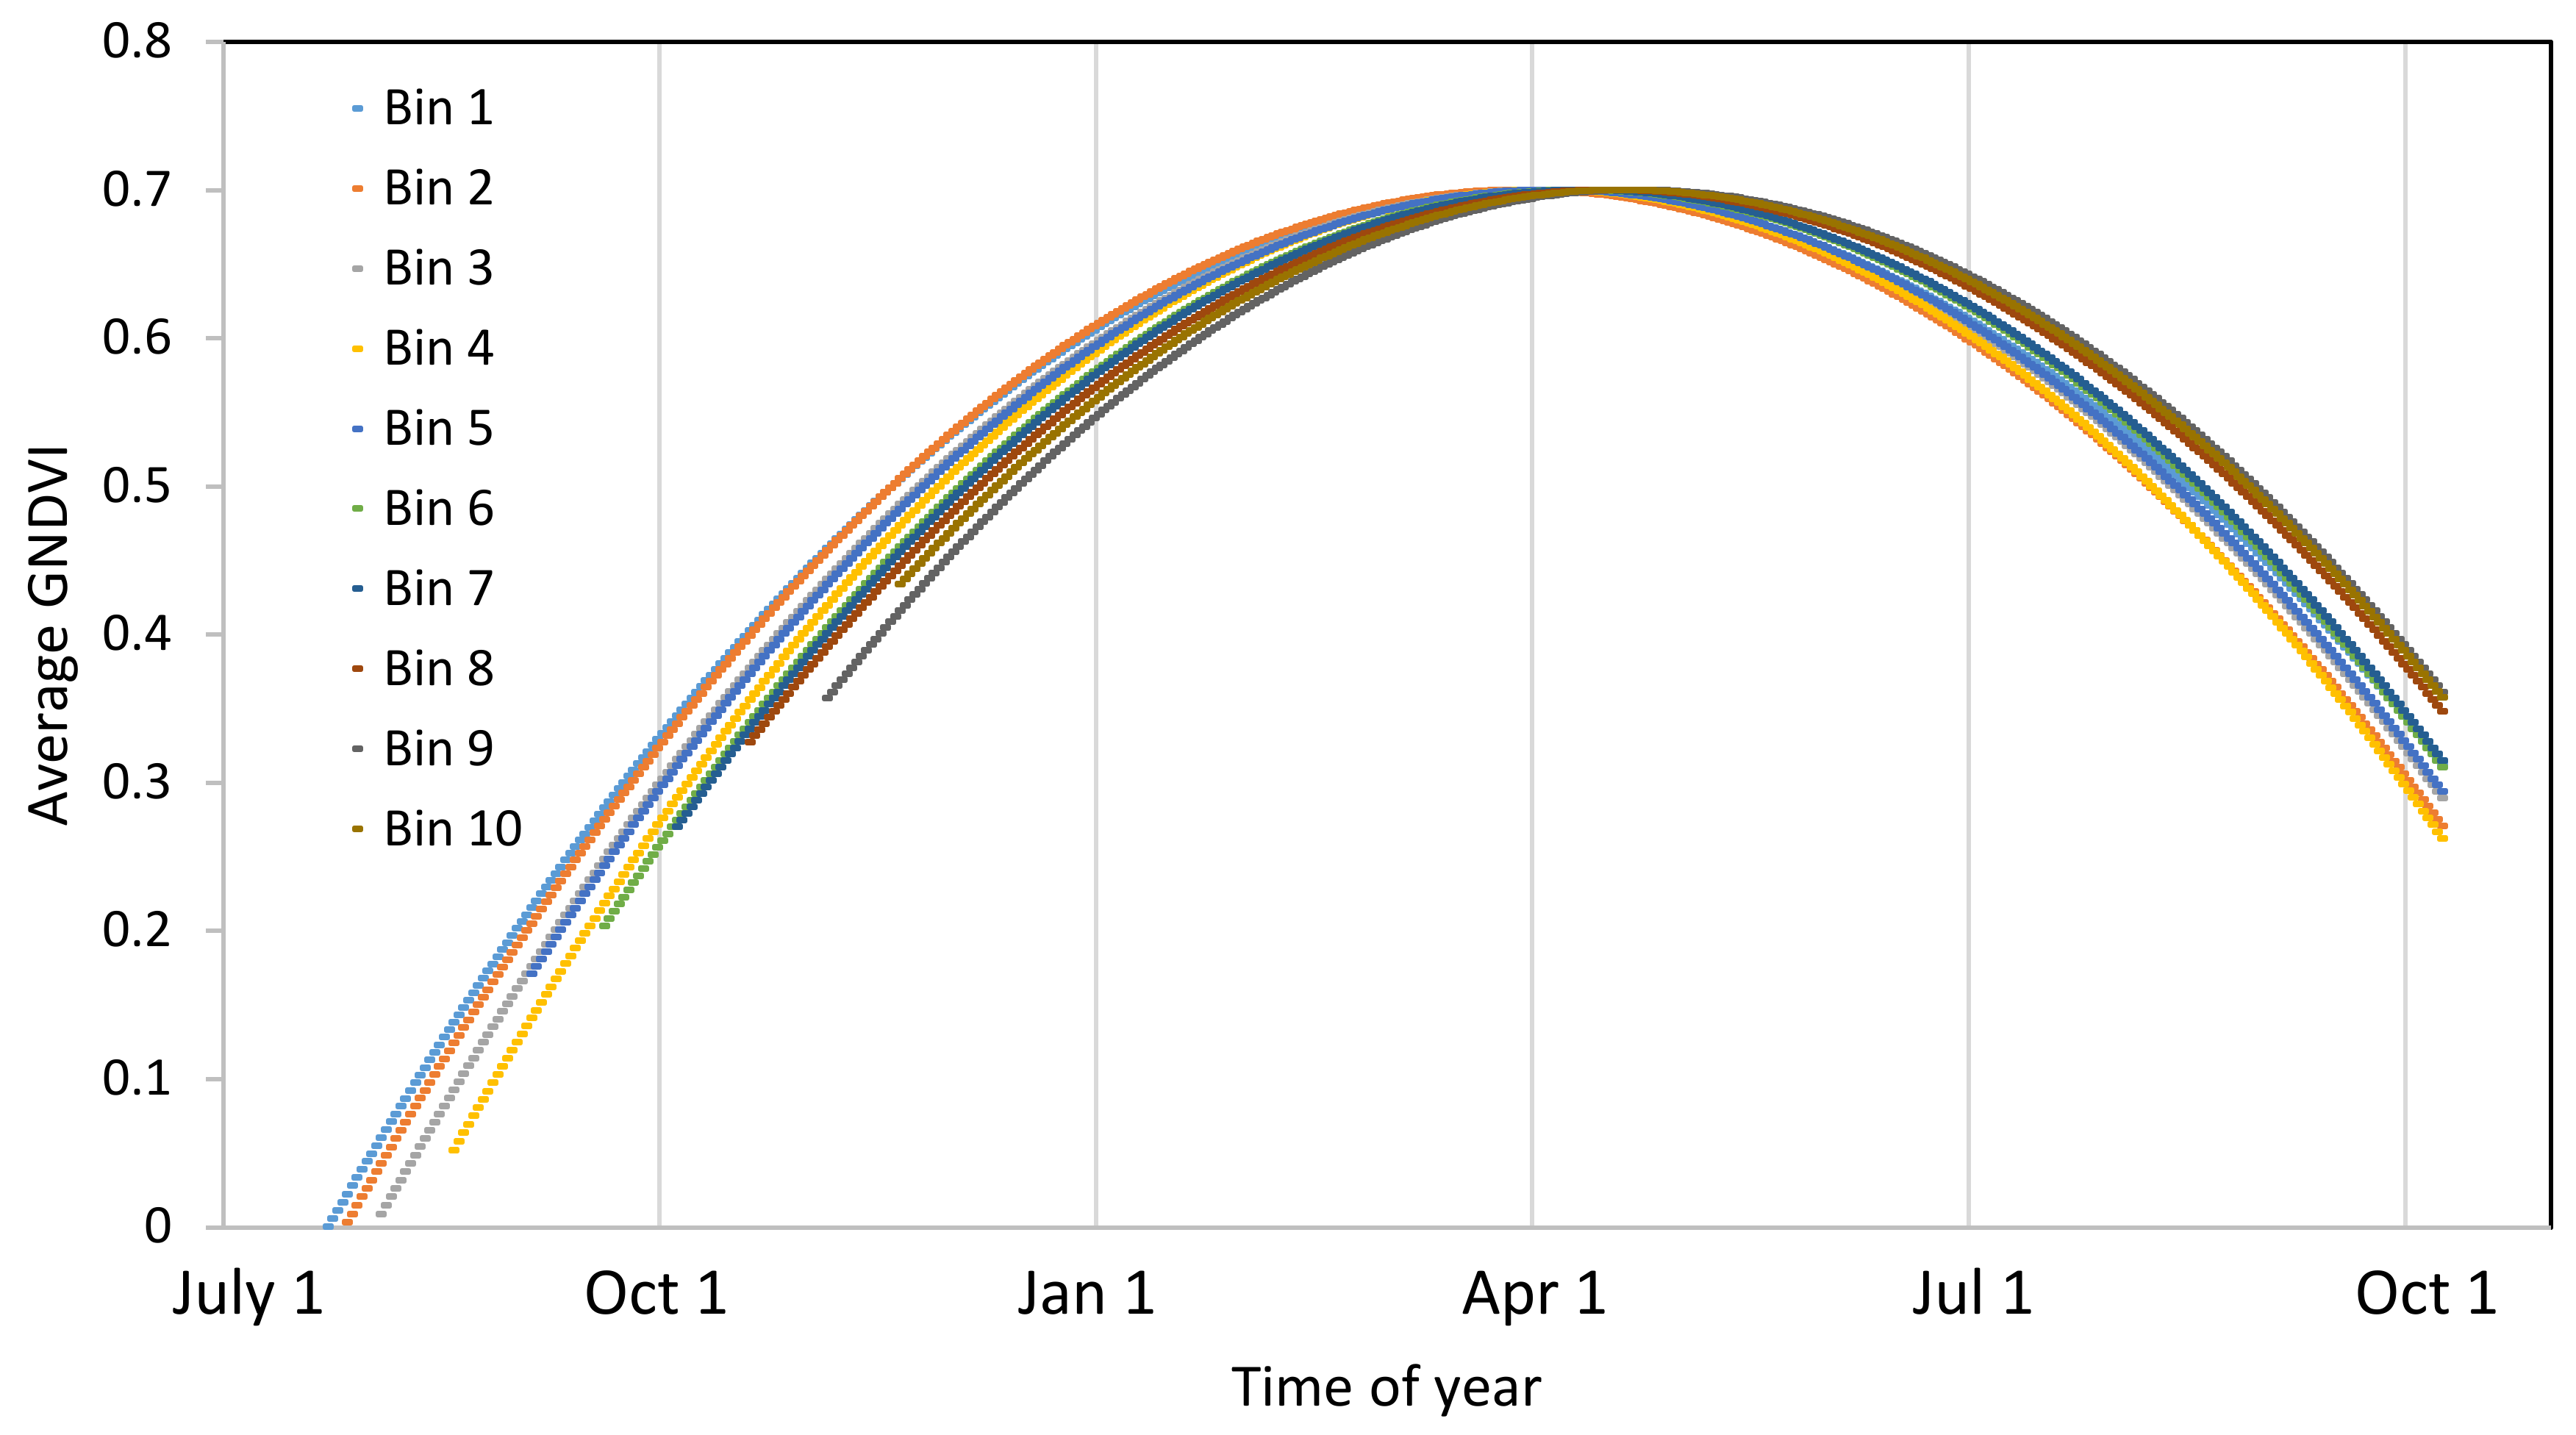
The average GNDVI values for the different bins from 2014 to 2018 growing seasons, as a function of image acquisition date of the year were plotted and the quadratic model fitted (Figure 4). Although the planting or ratoon date is different (across the five months period), the peak growth window is very close (from 24th of March to 17th of April), which shows that the crops planted in the early season (July–September) exhibit a slow initial growth rate during the predominantly cooler winter months compared to the later planted crops in the warmer months.
3.3. Bin Level Prediction Model
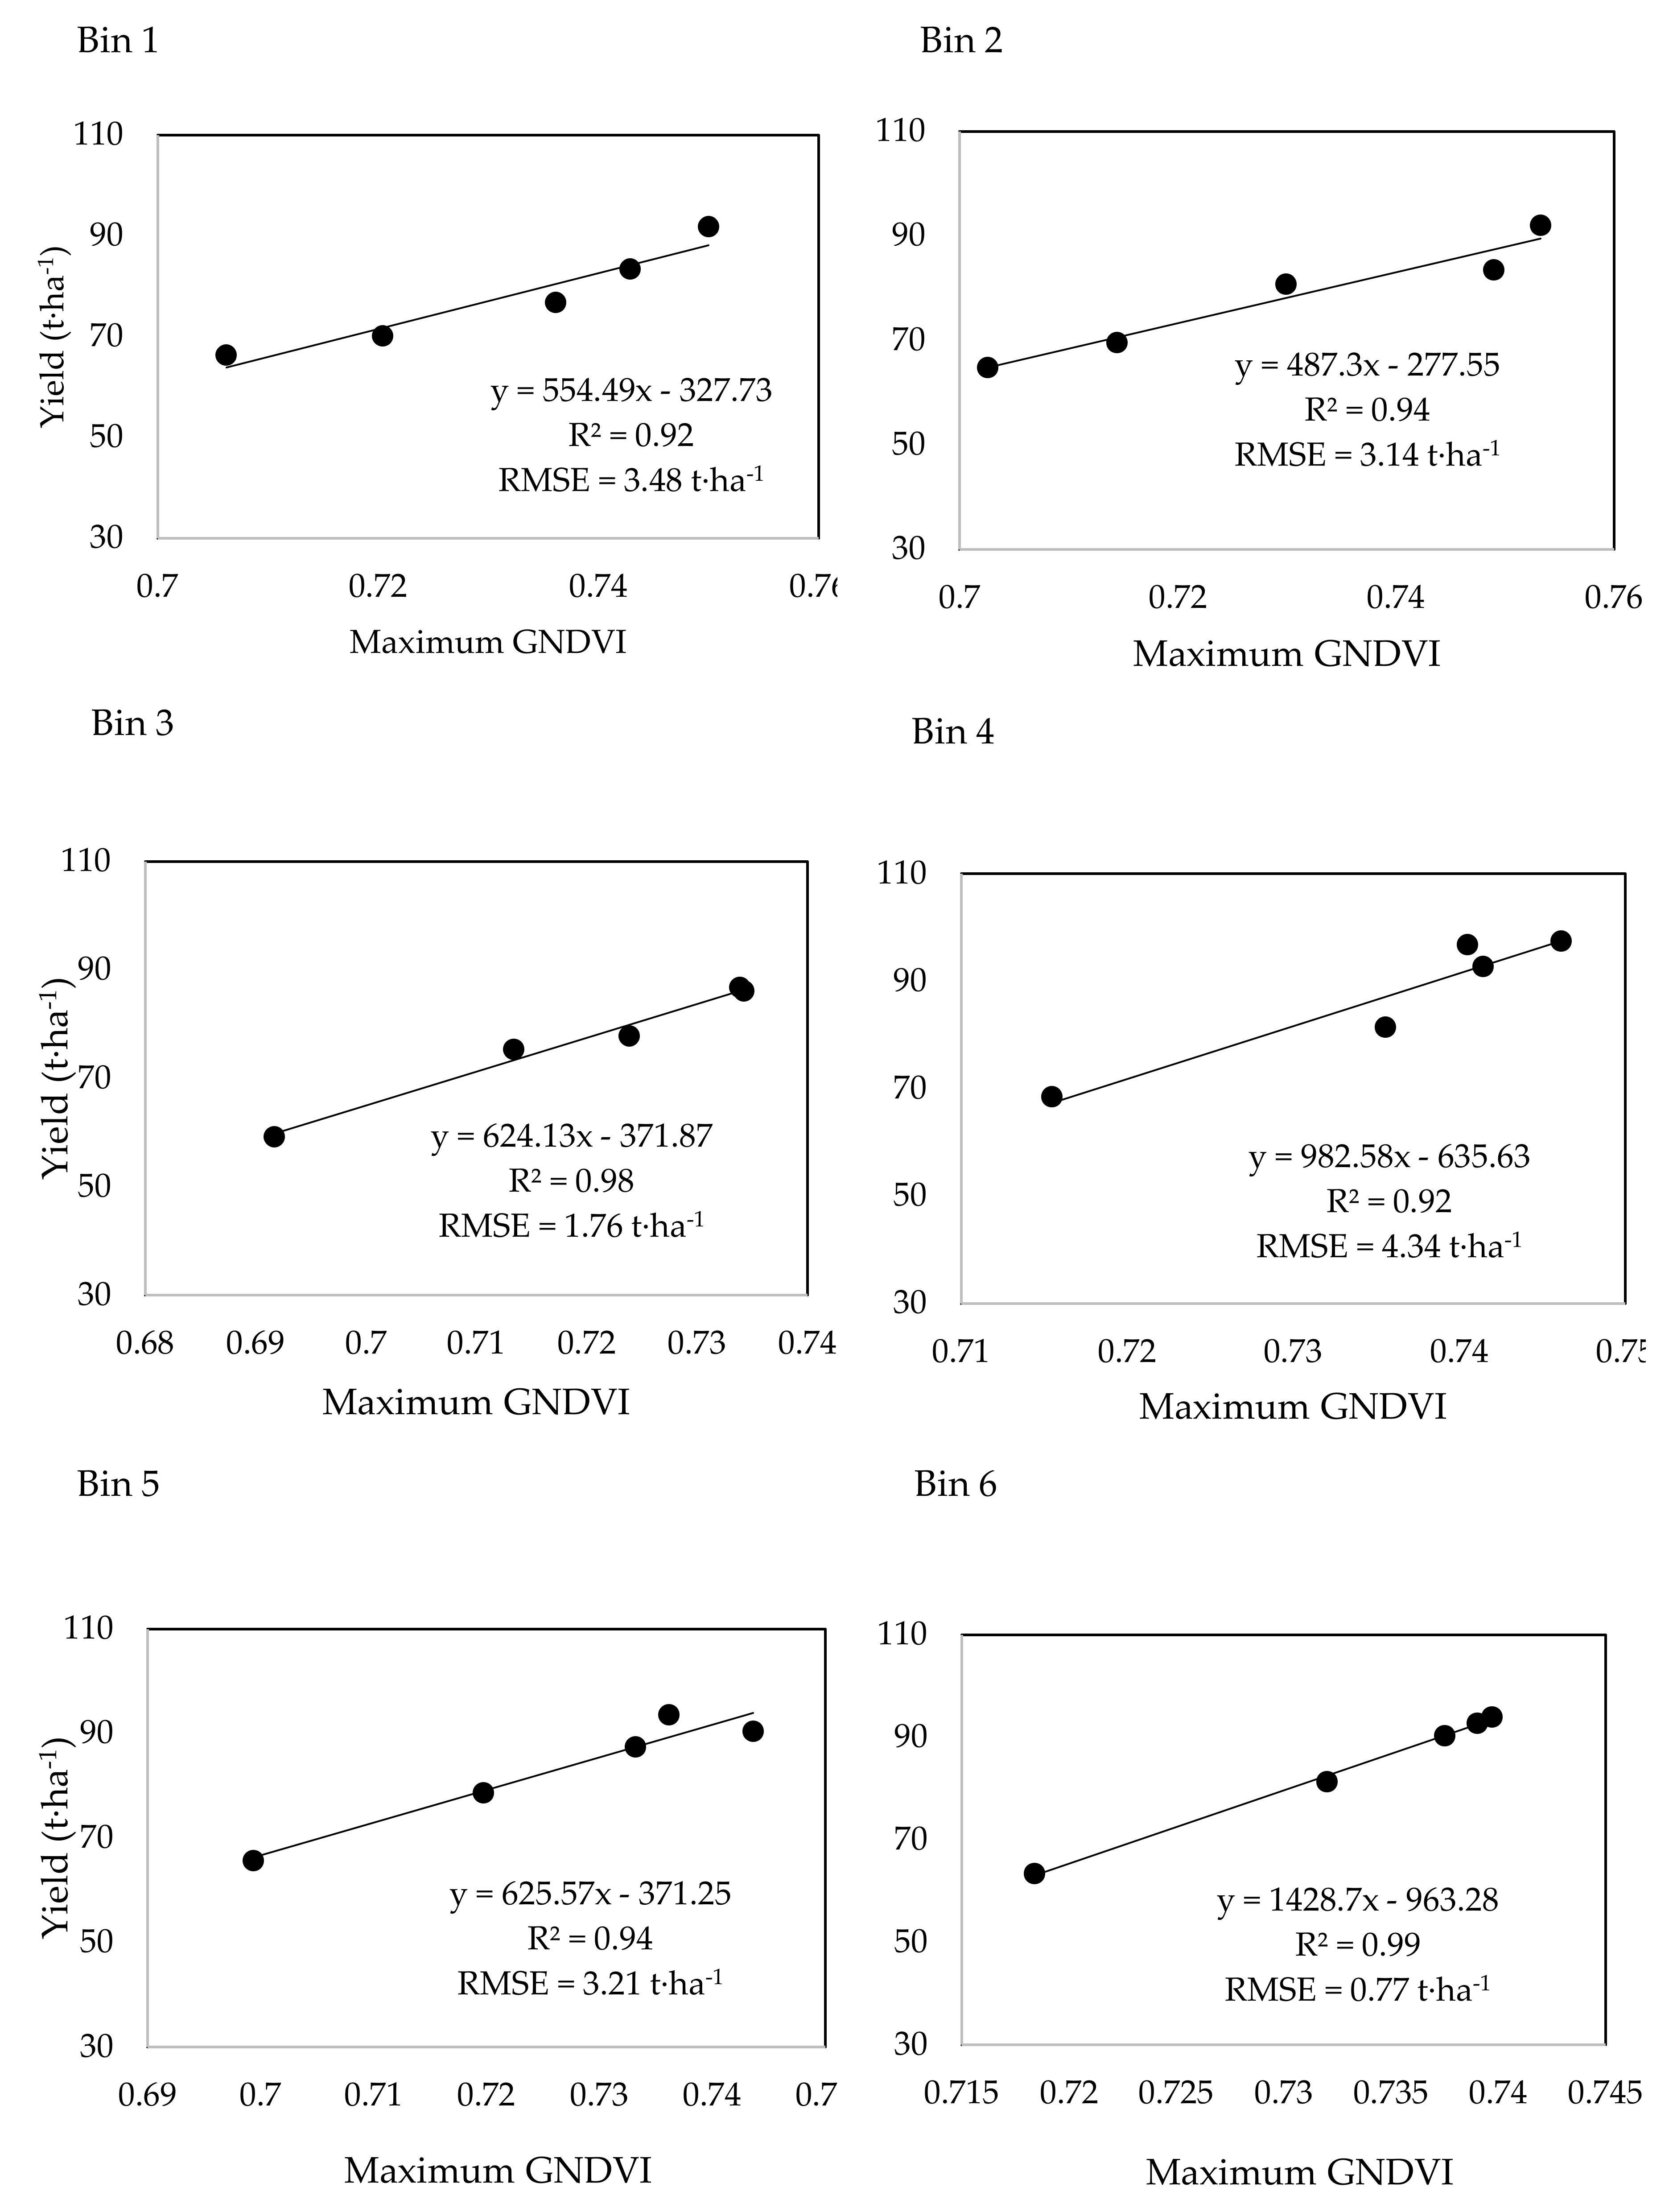
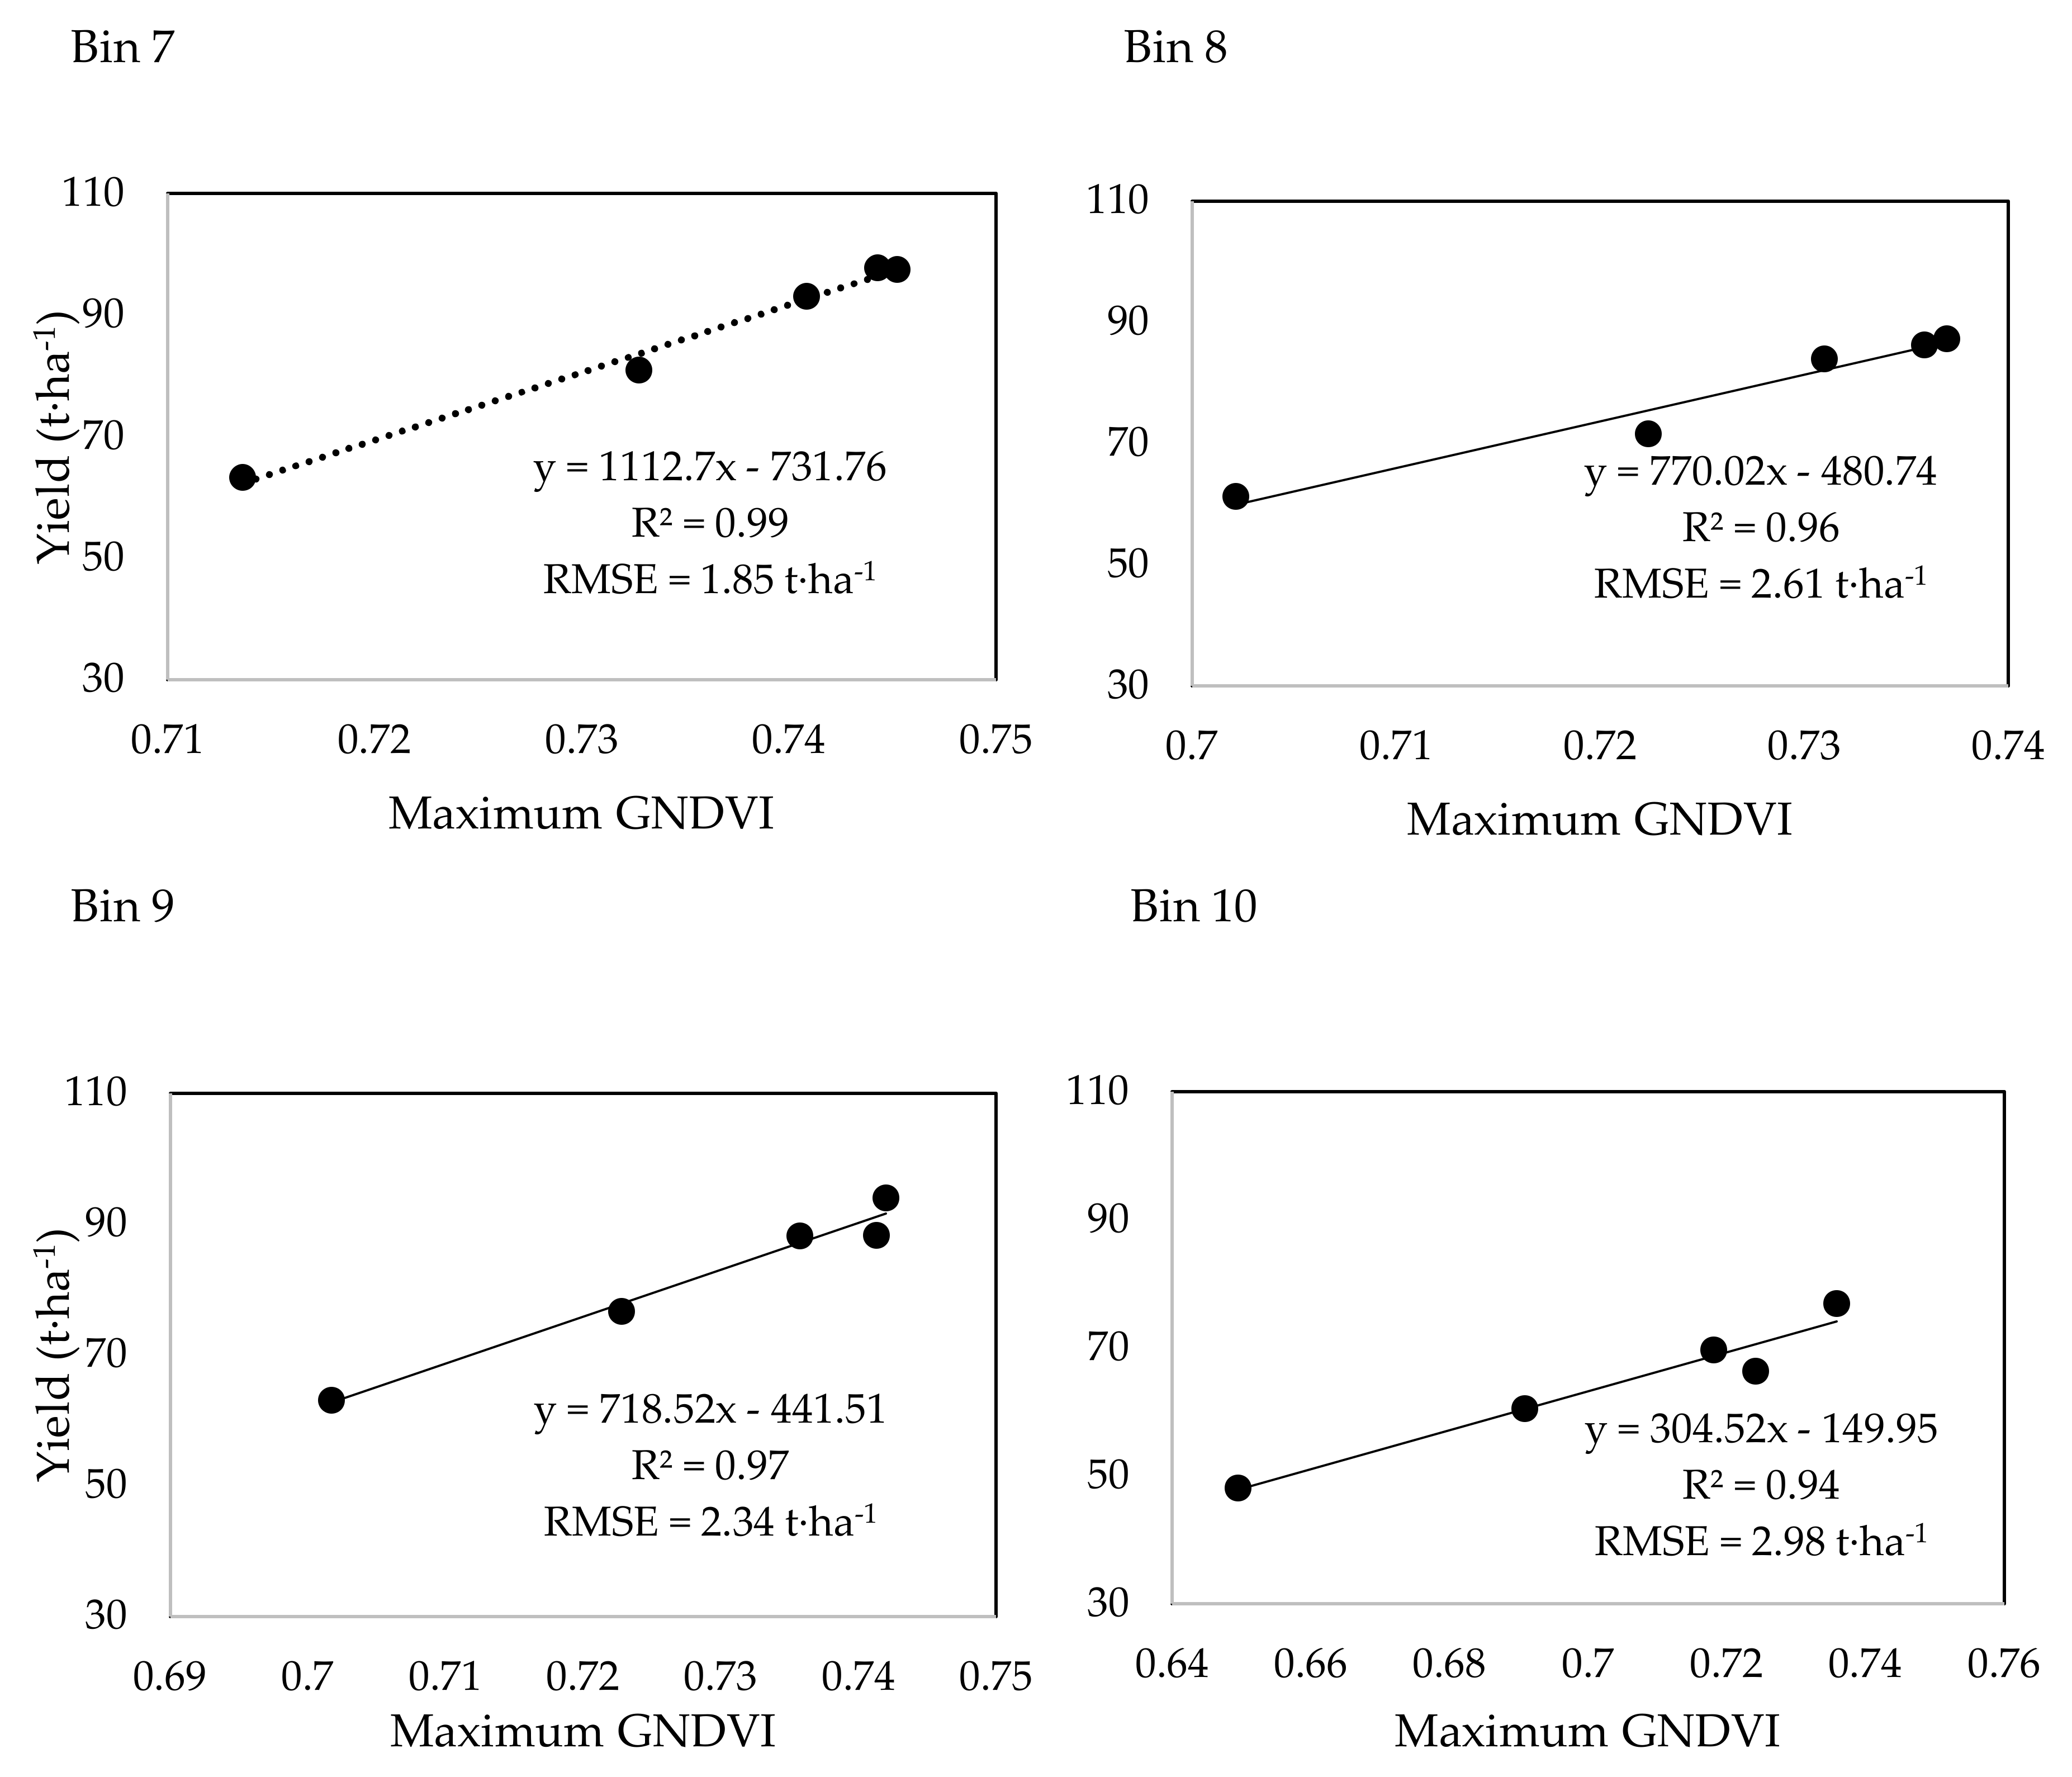
The scatter plots of the derived maximum GNDVI from each ‘bin’ model against the annual harvested yield (t·ha−1) reported from the growers (2014 to 2018) are shown in Figure 5. Strong correlation with R2 ranging from 0.92 to 0.99 and RMSE from 0.77 to 4.34 (t·ha−1) were achieved from the ten models.
3.4. Bin Level Prediction Accuracy
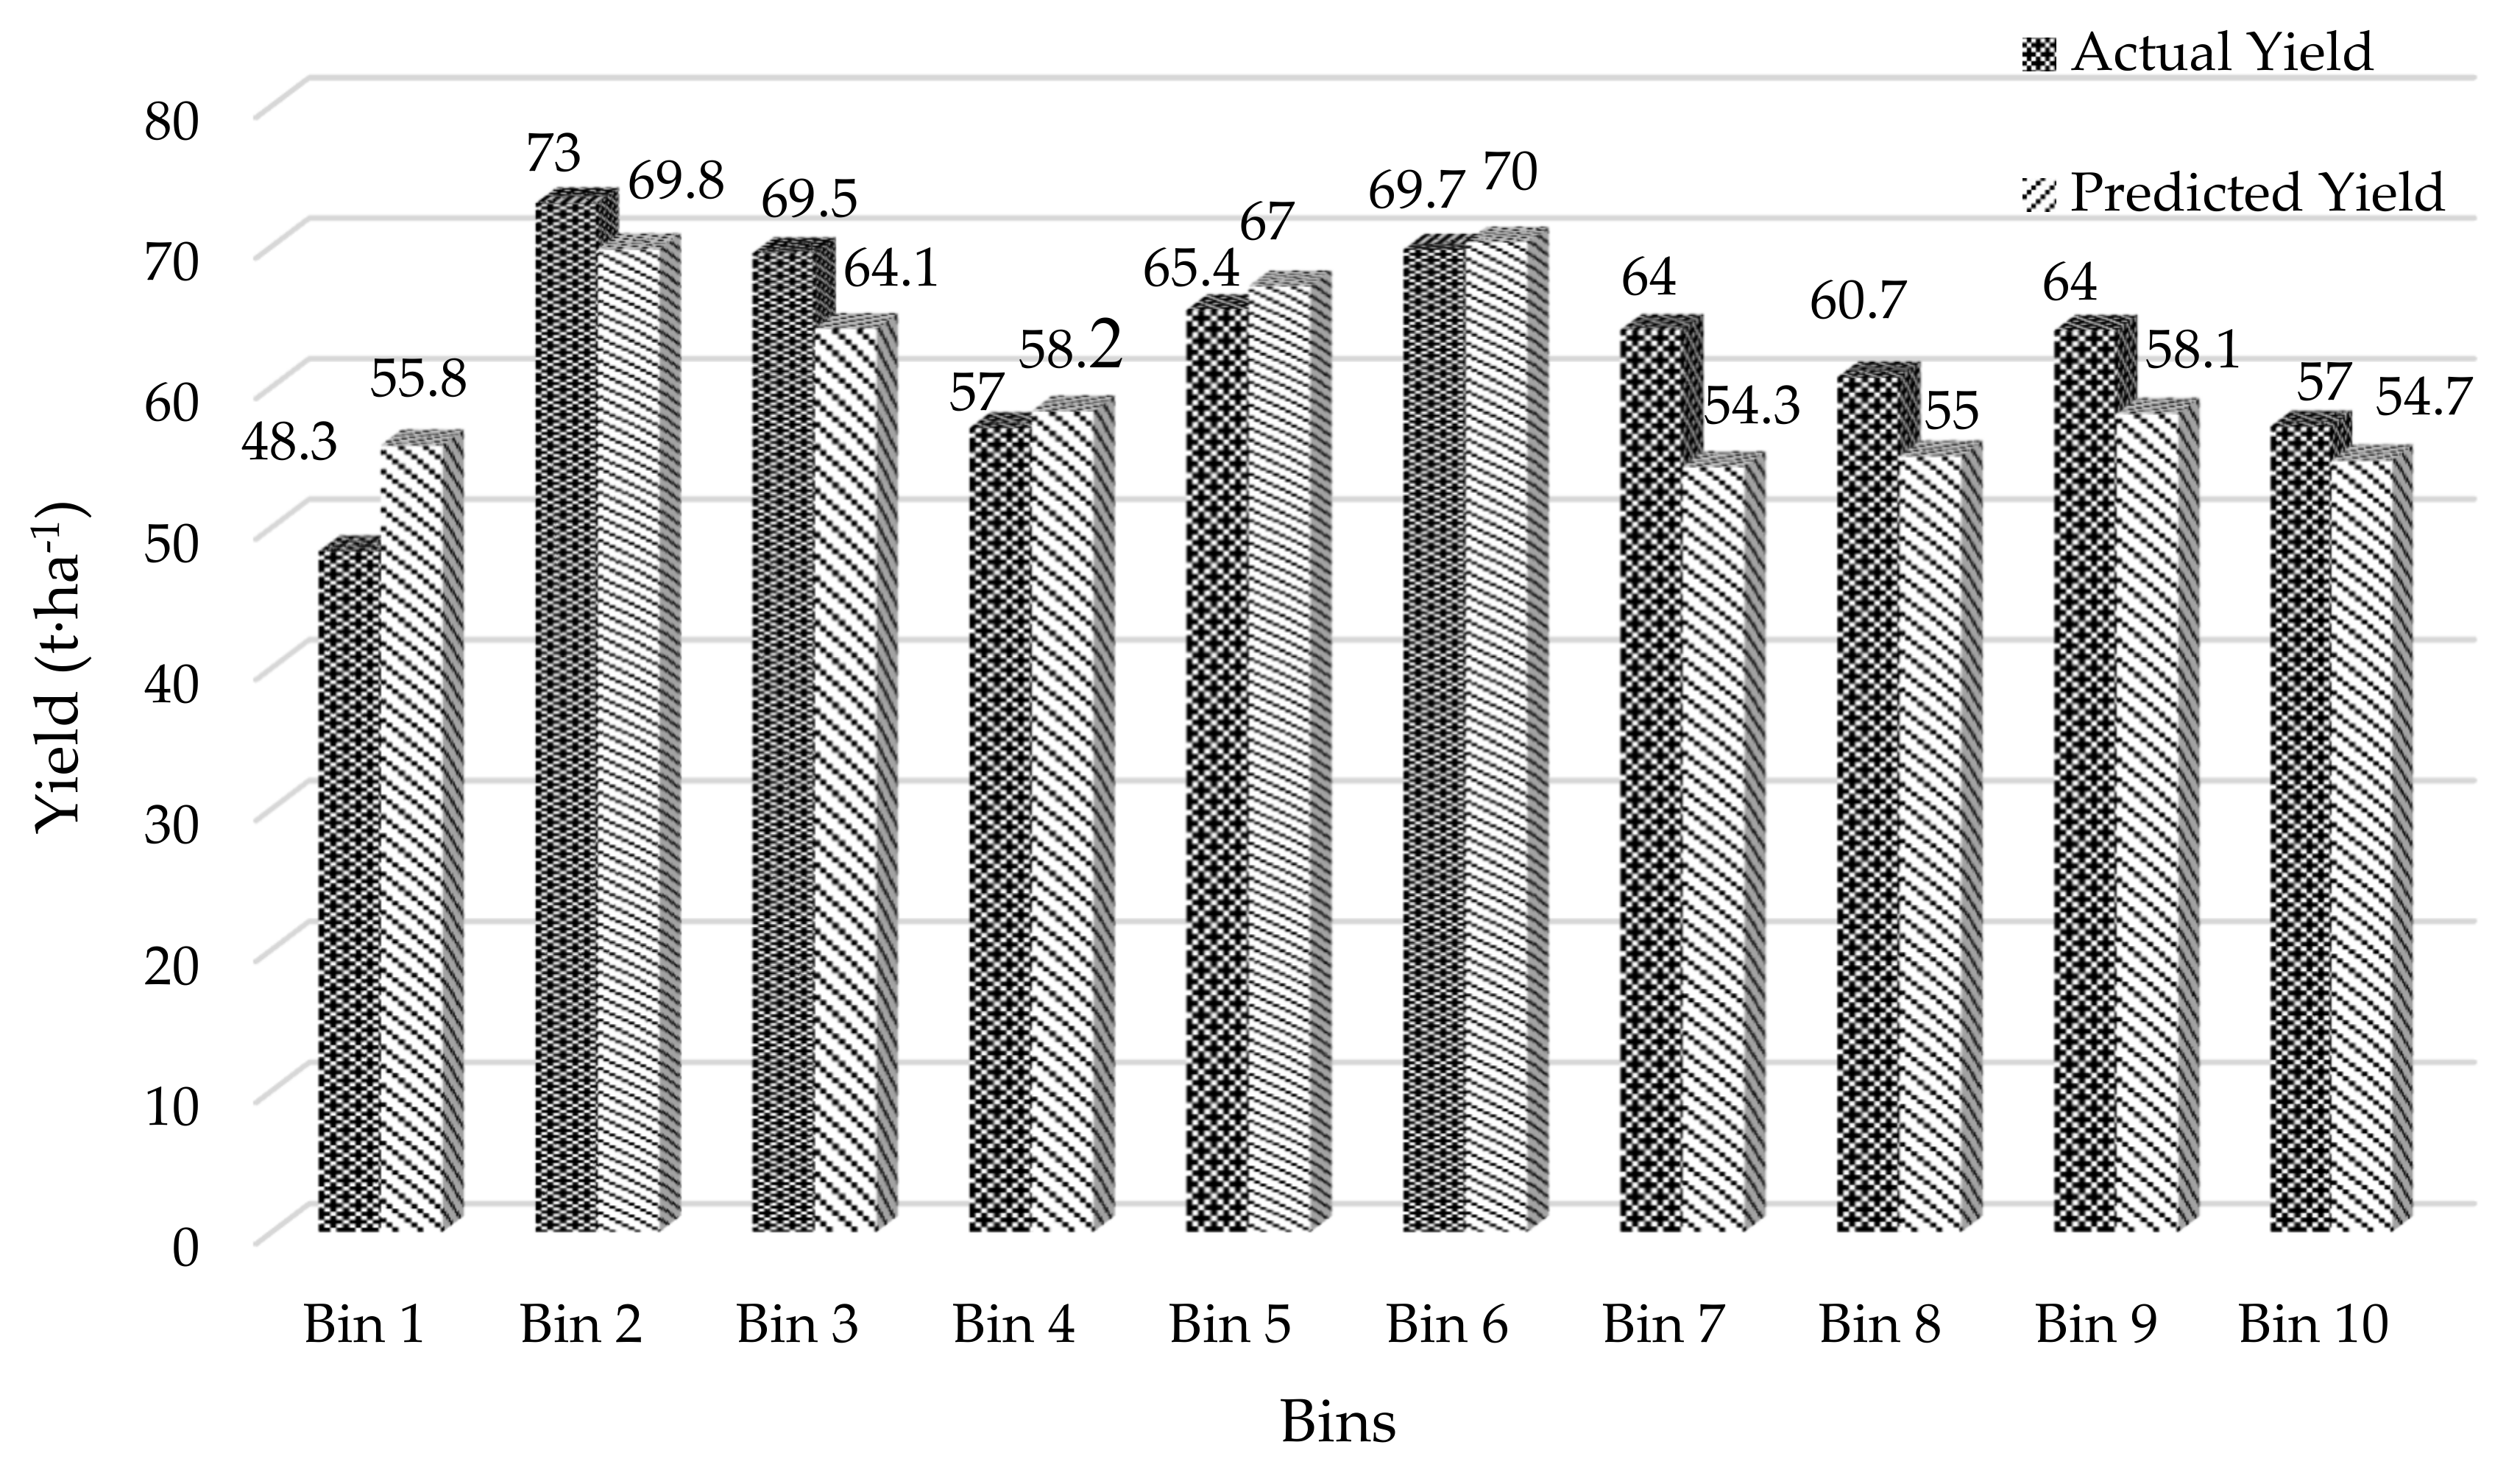
The accuracy of the 10 models were assessed over the Bundaberg growing region in the 2019 harvest season, where the predicted yield was compared against actual harvested yield (t·ha-1) provided by the Bundaberg Sugar Mill. Accuracies ranging from a 15% over estimation in Bin 1 and maximum 16% under estimation in Bin 7 were identified, with the strongest prediction achieved from Bin 6 with 100% accuracy (Figure 6). The RMSE found from these 10 bins was 4.5 (t·ha-1).
3.5. Block Level Prediction Accuracy
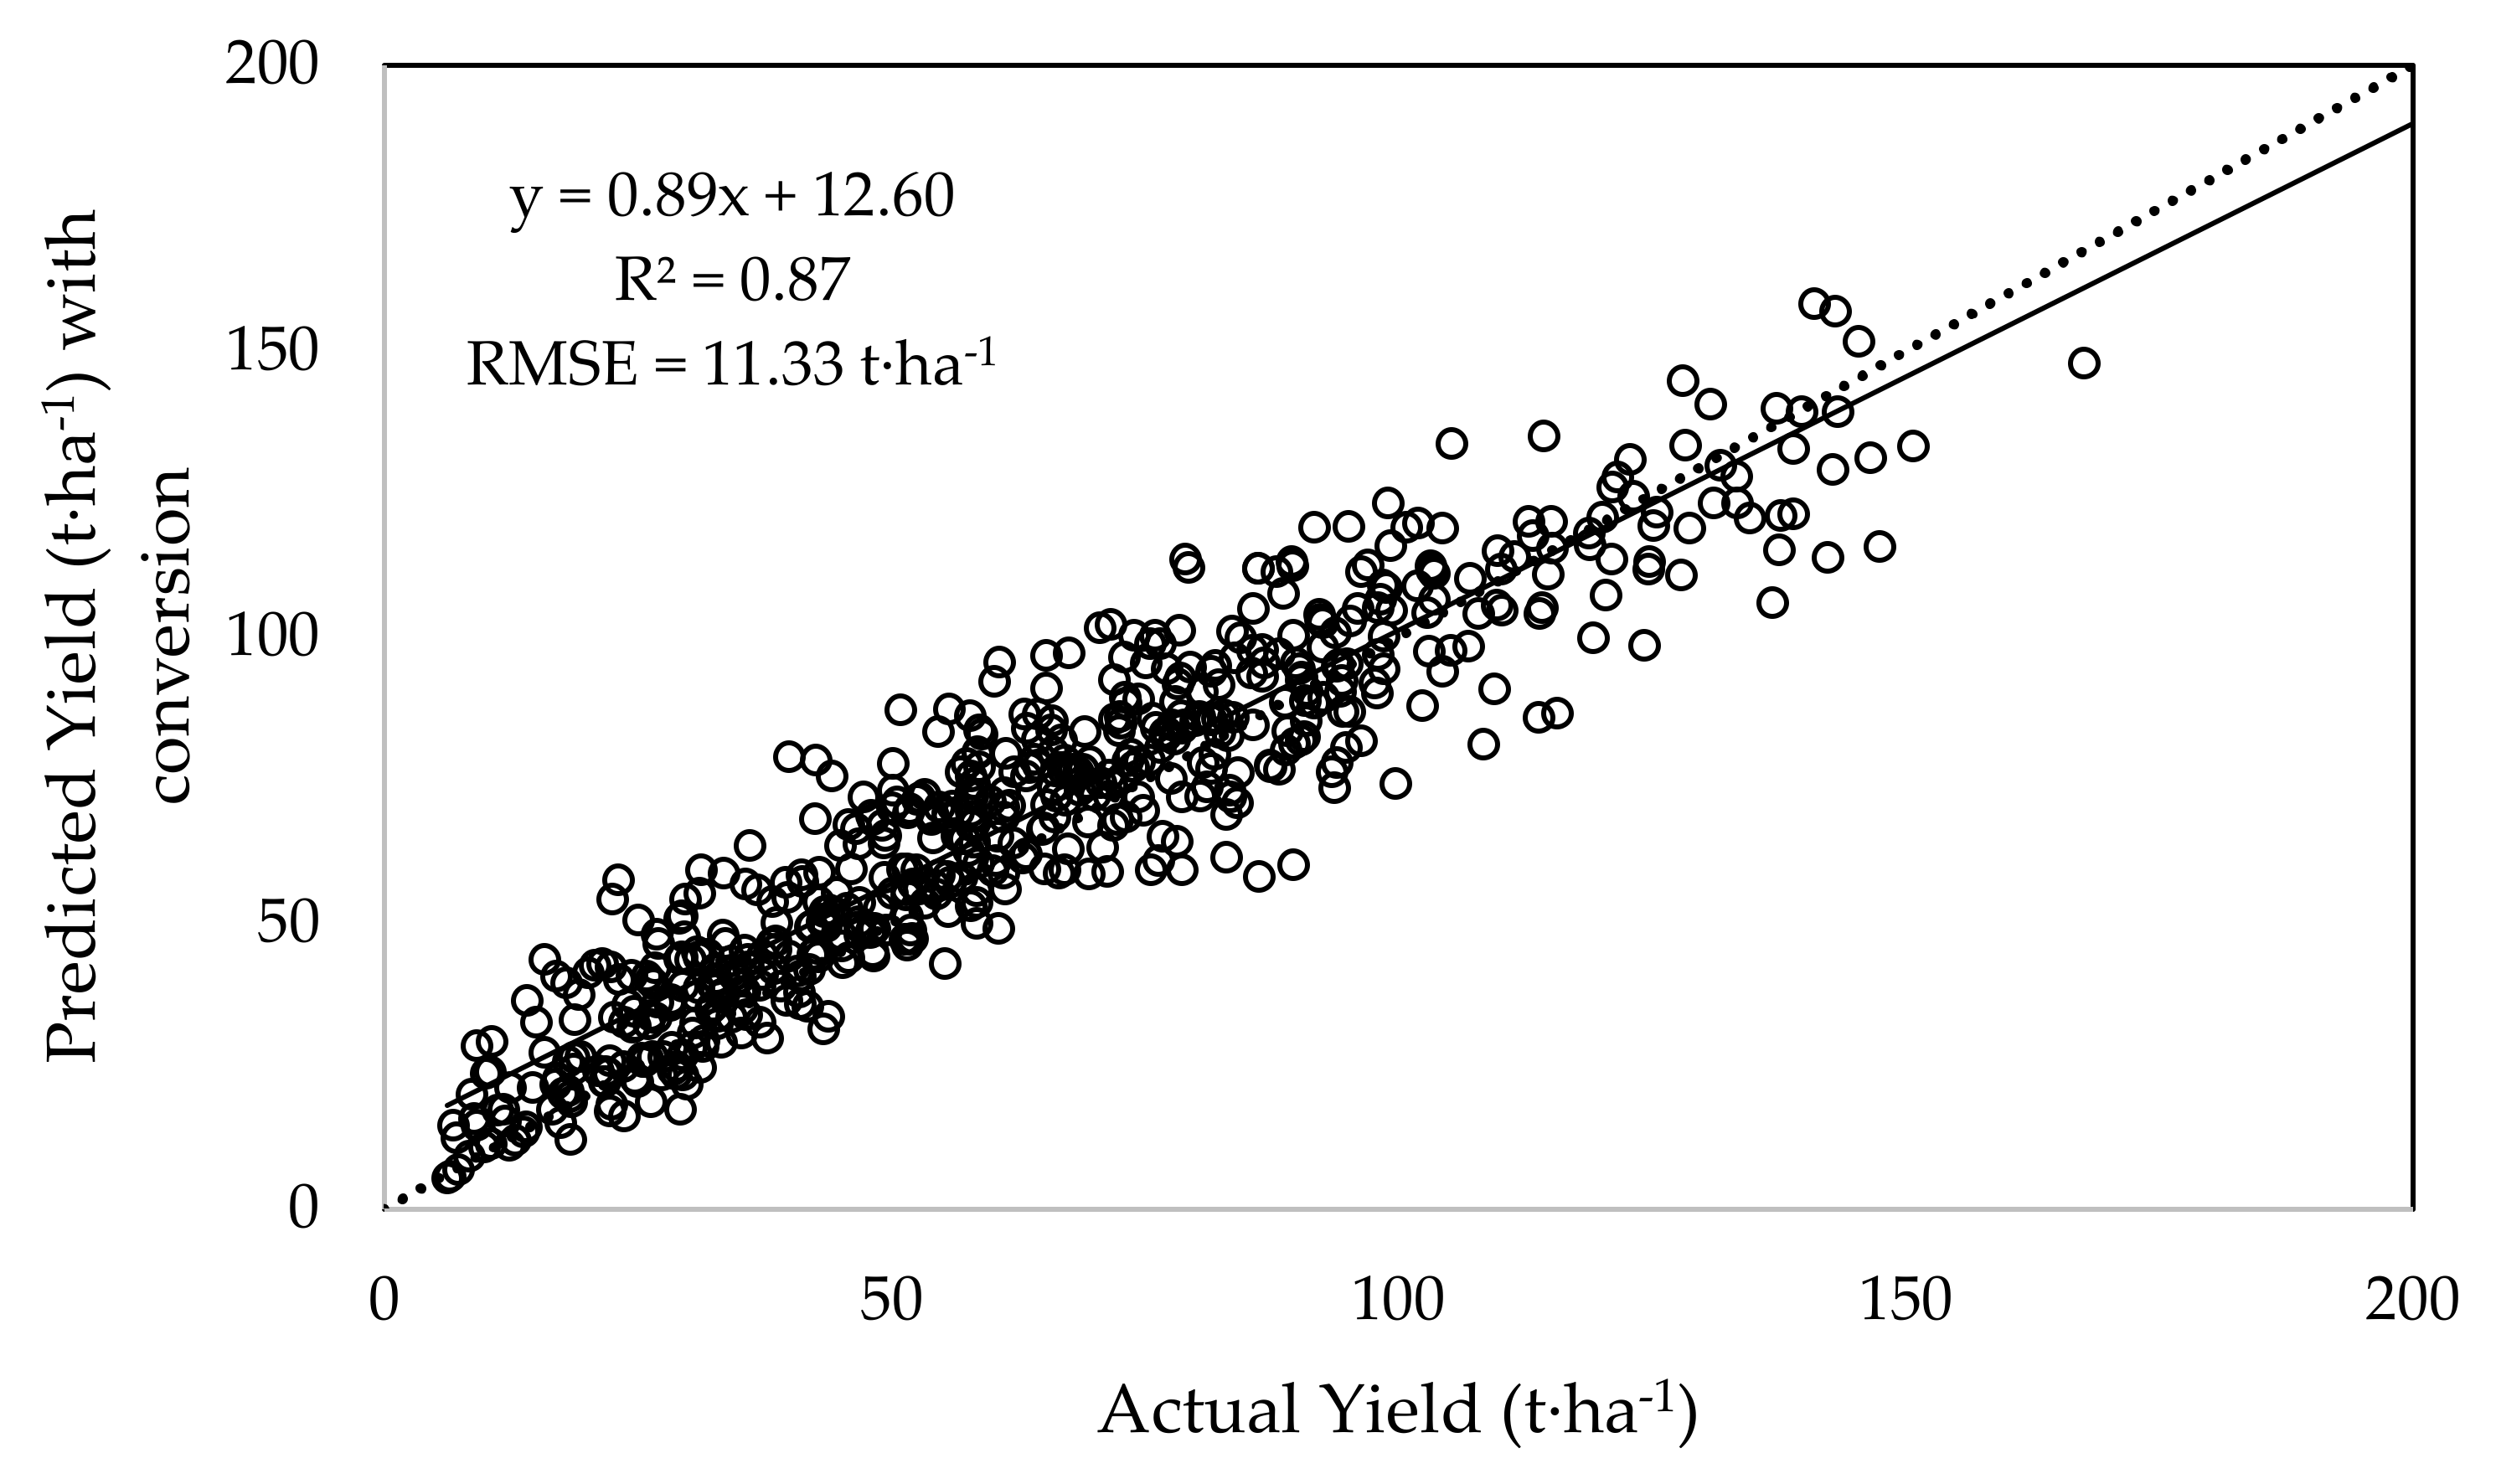
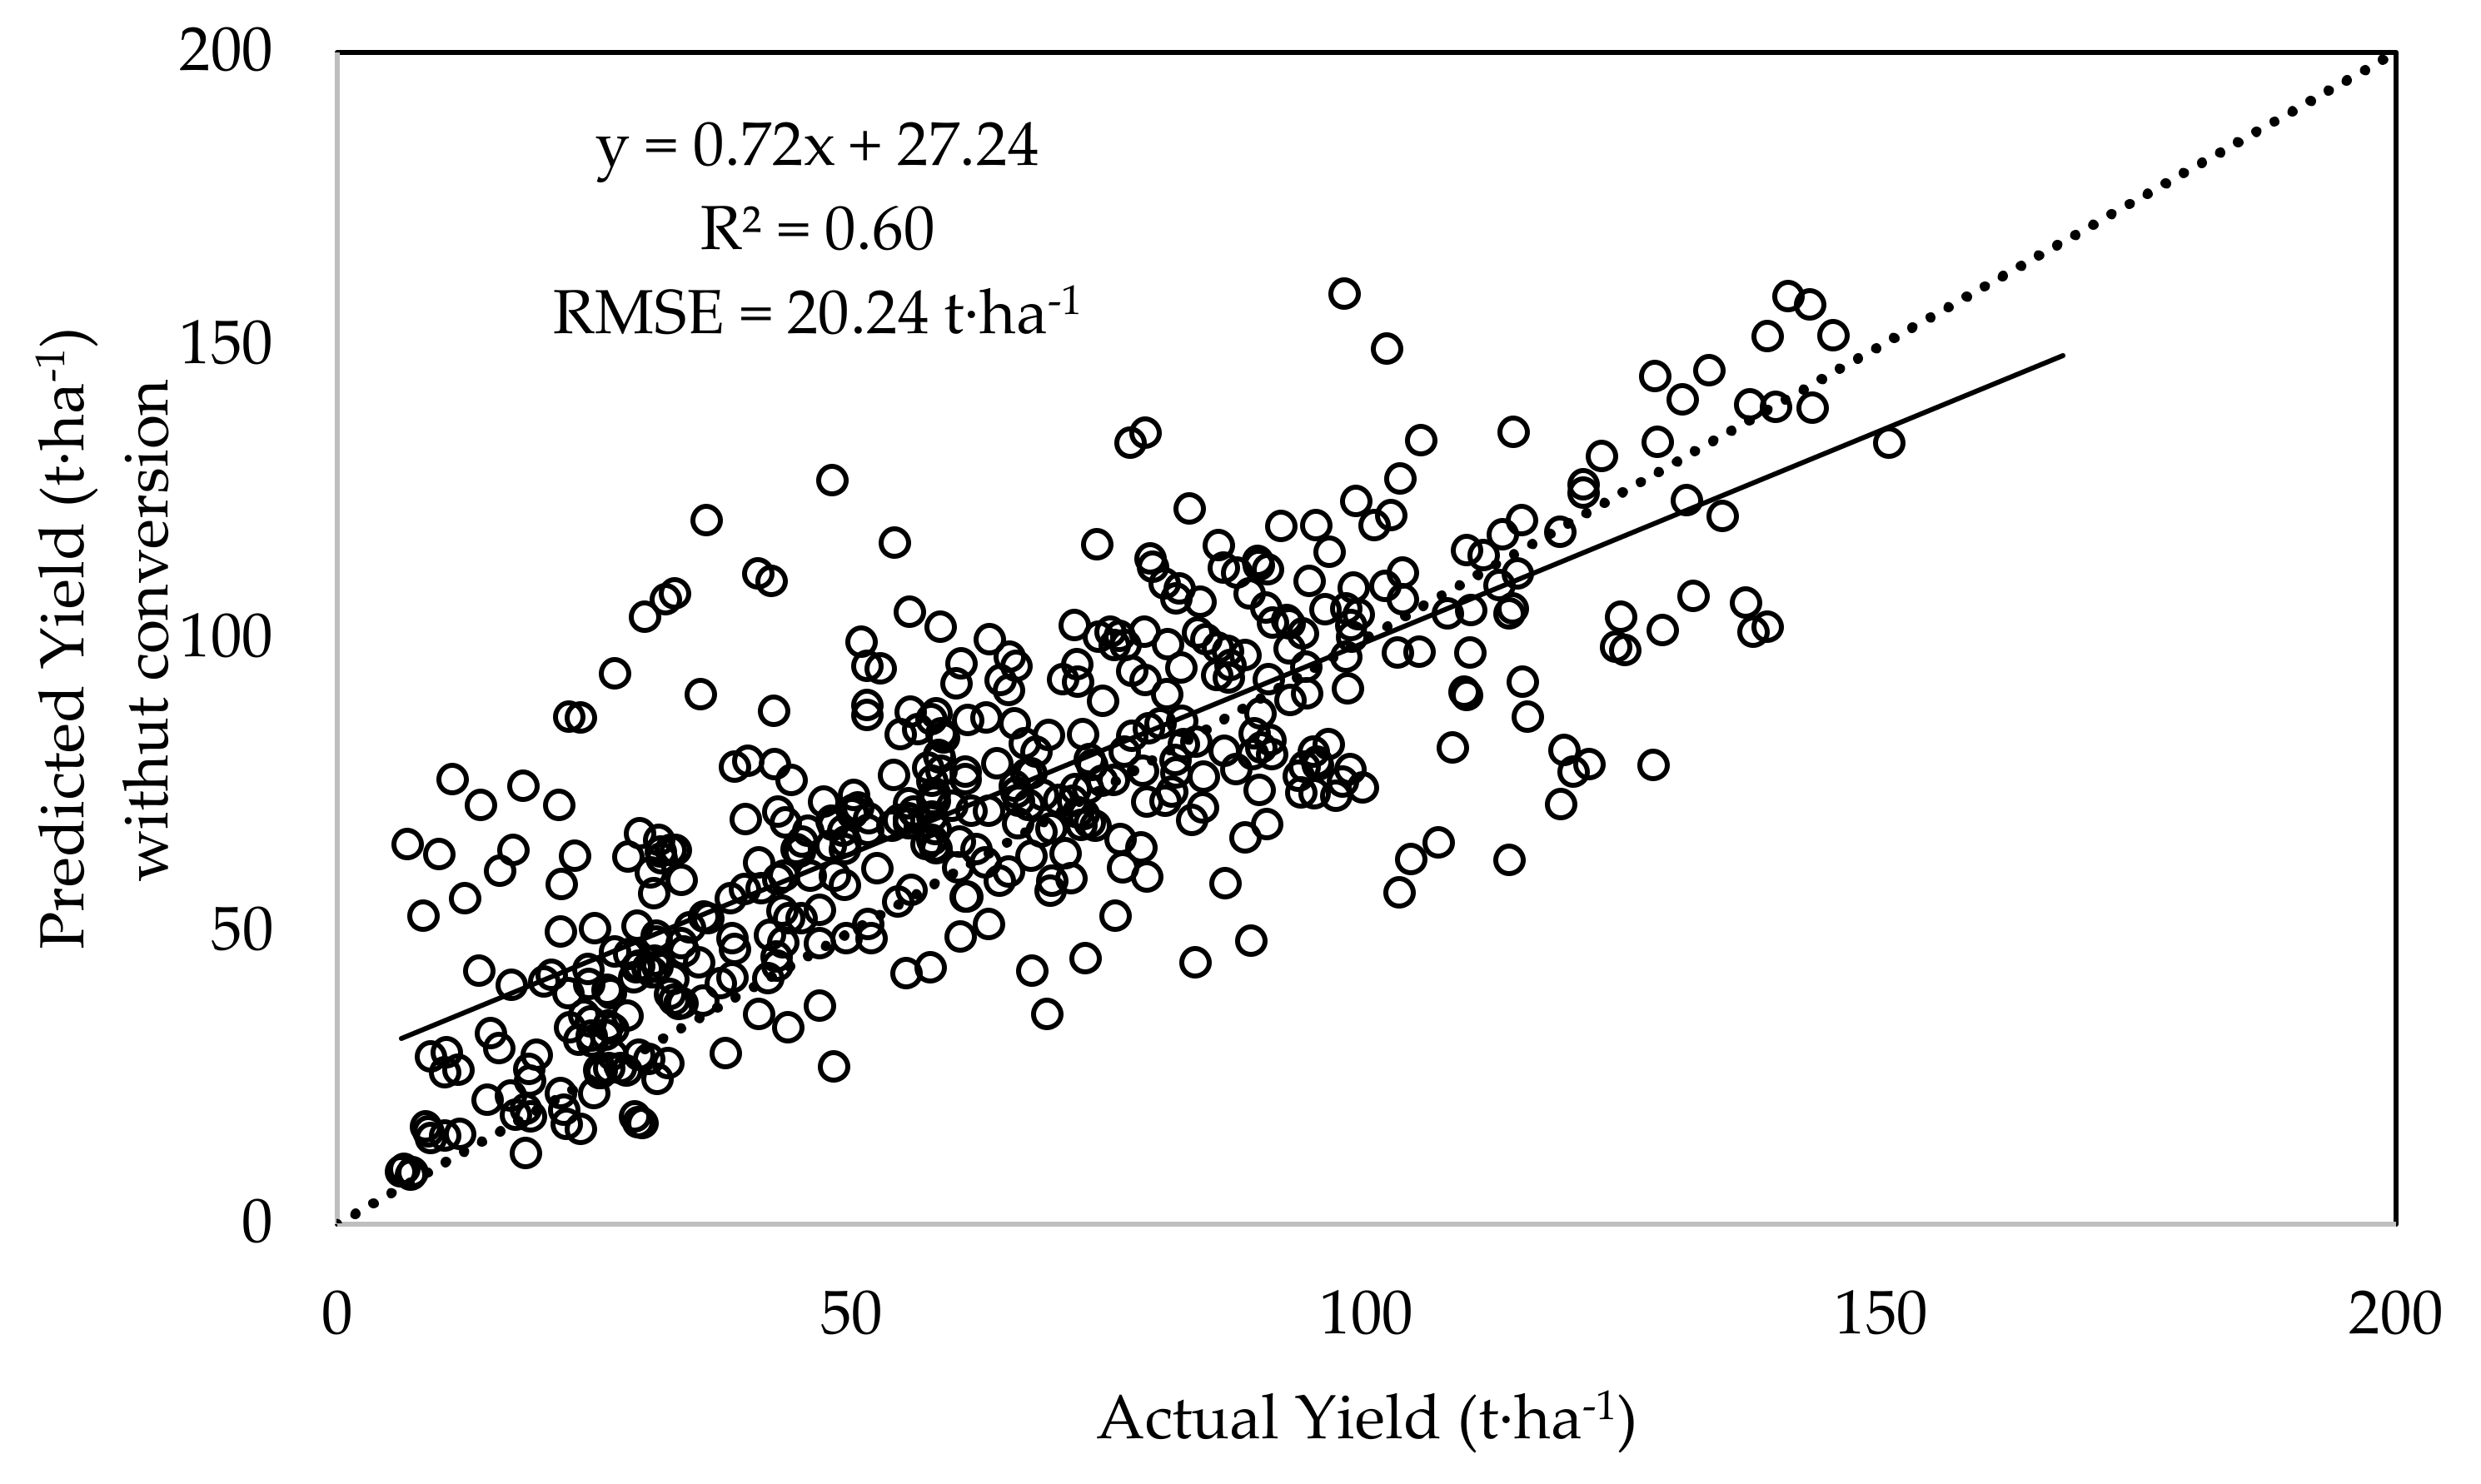
The scatterplot between actual harvested yield (t·ha−1) and the model predicted yield (t·ha−1) at the individual block level for the 2019 harvest season is shown in Figure 7. A good correlation was found with R2 = 0.87 and RMSE = 11.33 (t·ha−1) from all blocks (n = 592). The regression line fitted over the 1:1 line (dotted line in Figure 7) shows that the model prediction for high yielding blocks is slightly low whereas for low yielding blocks the prediction are slightly higher. In Figure 8, the scatterplot between actual harvested yield (t·ha−1) and the model predicted yield (t·ha−1) at the individual block level for the 2019 harvest season where the Landsat-8 to Sentinel-2 conversion algorithm was not applied is shown. The correlation of R2 = 0.60 and RMSE = 20.24 (t·ha−1), showing that, it is important to apply the conversion algorithm to develop the time series model using both Landsat-8 and Sentinel-2 satellite sensors.
4. Discussion
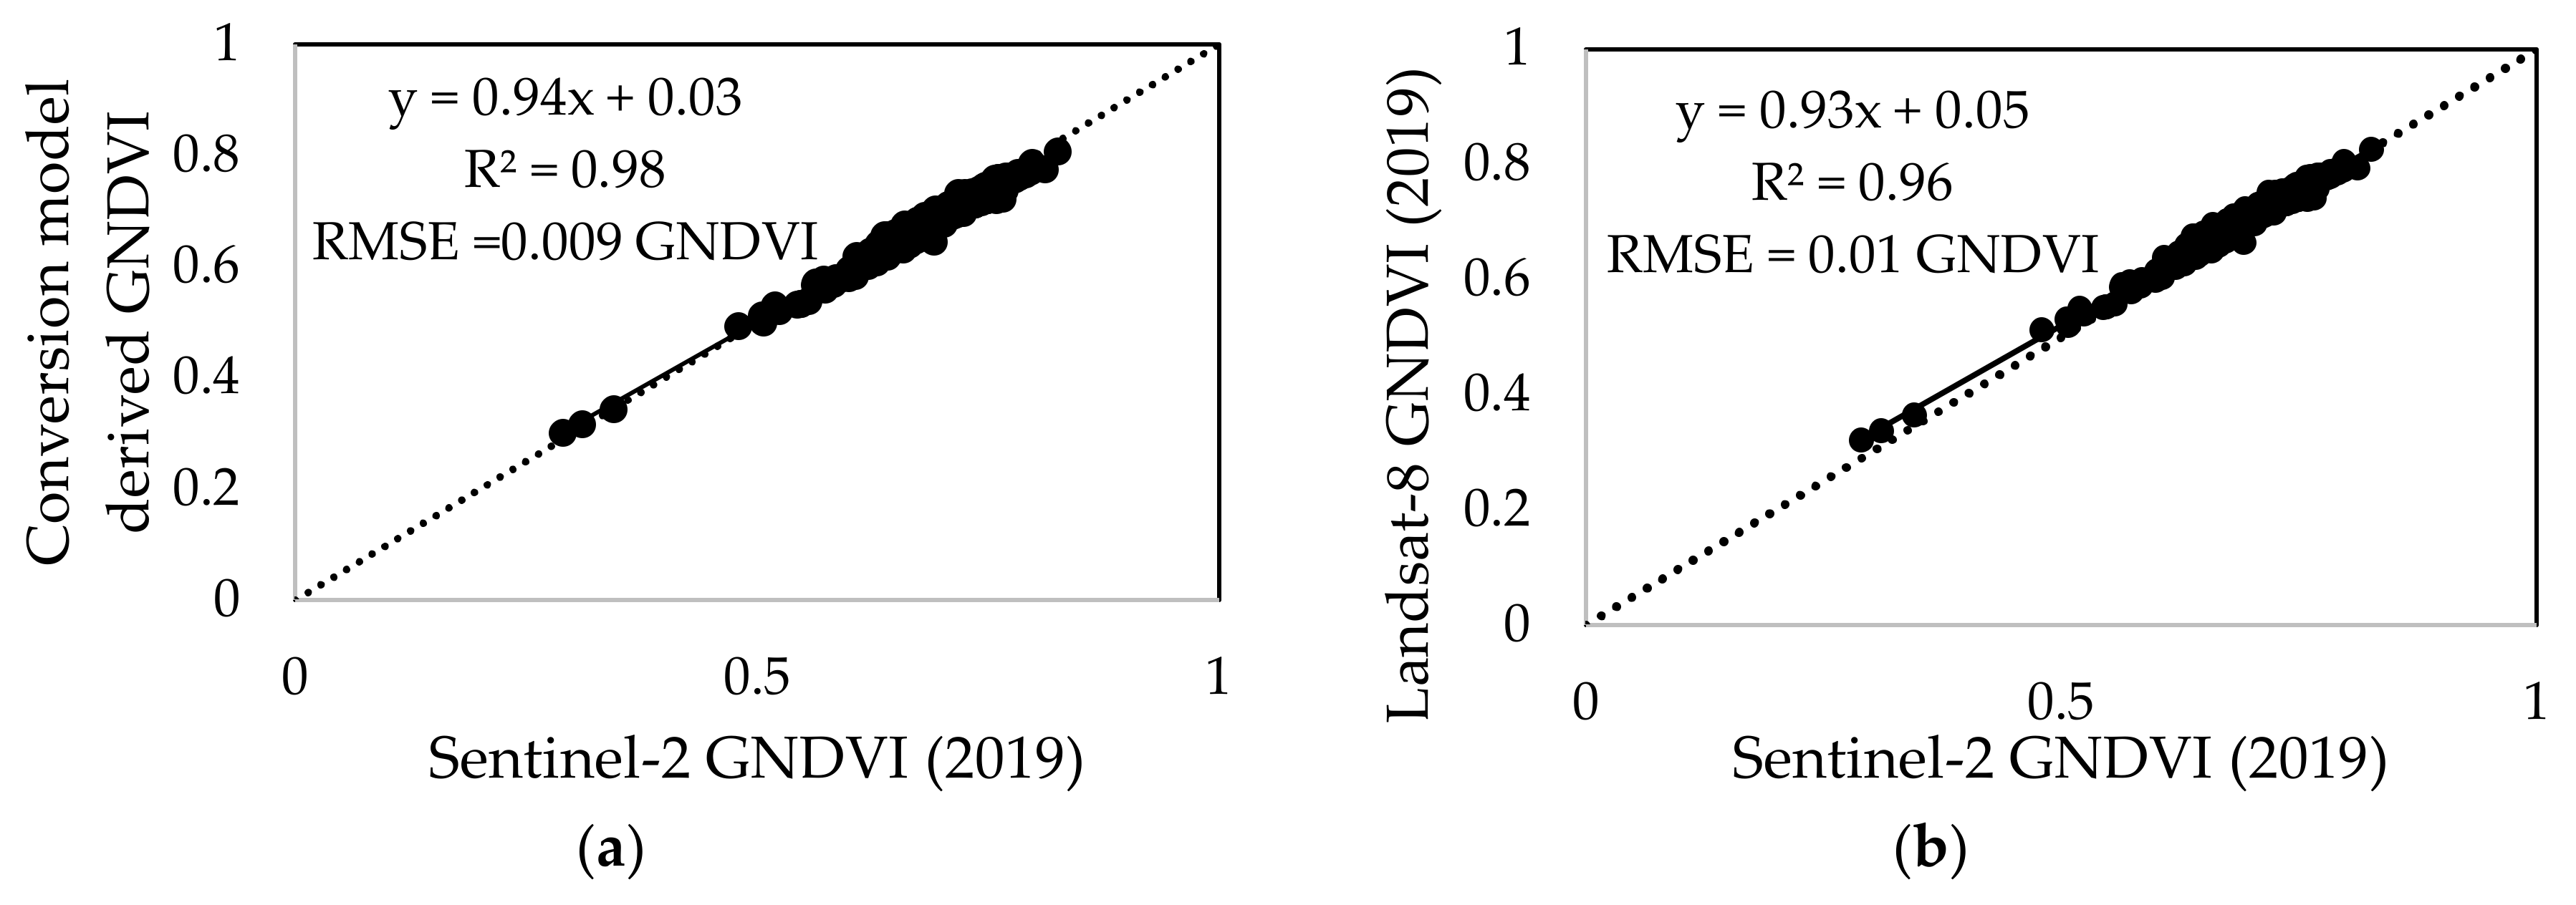
The comparison between Landsat-8 and Sentinel-2 derived GNDVI (Figure 2) identified strong agreement between Landsat-8 and Sentinel-2 sensors (R2 = 0.96 and slope 1.04) that was further validated by the image acquired on 5th of May 2019. These results indicate that the transference of a time series model can be achieved from Landsat-8 and Sentinel-2 or vice versa. Although, the correlation between Senteinel-2 GNDVI and Landsat-8 GNDVI, shows good results with R2 = 0.96 and RMSE = 0.01 GNDVI (Figure 3b), it shifted much from the 1:1 line, compared to the correlation between Sentinel-2 GNDVI and Conversion Model derived Landsat-8 GNDVI (Figure 3a), which ultimately can affect the accuracy of the model. Vuolo et al. [39] and Flood [30] also found a very good agreement between Landsat-8 and Sentinel-2. However, Flood [35] suggested that the conversion would require some regional calibration, as supported by the findings observed in this study for the Bundaberg region.
The comparison of GNDVI between the two sensors showed a certain amount of scatter, which could be due to a number of possible causes, such as image misregistration, and viewing geometry effects i.e., BRDF and atmospheric path length, which might not be fully accounted for in the conversion to surface reflectance. The different swath arrangements of Landsat-8 and Sentinel-2 sensors could also be an important factor, as this may affect the sensors viewing geometry.
Another important consideration should be the sugarcane block boundary file. When the images of Landsat-8 and Sentinel-2 images were clipped according to the block boundary file, they can detect a slightly different region due to their pixel size. However, for a specific block, as the boundary is static from year to year, this variation should be consistent.
The temporal profile of average GNDVI values at the bin level showed the sugarcane crop phenology at different stages of crop growth. Several researchers reported similar findings in numerous previous studies [5,6,22,40]. The ten temporal average GNDVI trend lines or growth profiles showed that crops planted in winter (July to September) initially had a slower growth rate than those crops planted in the warmer months (October to November), resulting all crops reaching maximum growth (defined as maximum GNDVI) at the same time. Bégué et al. [10] also showed the similar crop growth profile for crops planted in March and crops ratooned in July on Reunion Island.
The quadratic model derived maximum GNDVI plotted against annual actual yield (t·ha-1) produced a good correlation for all ten bins shown in Figure 5. The accuracy of prediction at the bin level varied from an under estimation of 16% to a 14% over estimation.
The block level prediction also showed good accuracy with a RMSE = 11.33 t·ha-1. However, the slope = 0.89 of the regression line in Figure 7 indicated the under prediction of the models at low yielding areas and over prediction at high yielding areas. This is due to the saturation effect of GNDVI values for high yielding crops, a result supported by previous research in the prediction of sugarcane yield [4,5,40,46]. Rahman and Robson [5] reported similar accuracies at the regional scale using a similar methodology, however the accuracies at the individual block level varied due to the large variation in crop age (due to the extended planting period), crop management practices, lodging and flowering events. Since the model developed in this study considered the individual block level planting date, which ultimately influenced the crop growth profile, accuracies at the block level achieved higher accuracies.
5. Conclusions
The algorithm developed between Landsat-8 and Sentinel-2 derived GNDVI for the Bundaberg sugar growing region shows that both sensing constellations can be combined when developing a time series based yield model.
The Landsat-8 and Sentinel-2 derived GNDVI time series model shows the progression of sugarcane crop growth at different planting or ratoon dates. Although the planting or ratoon dates of crops can be varied up to a five months period, maximum crop growth, defined as maximum GNDVI was achieved at a small window of only 25 days (from 24th of March to 17th of April) for the Bundaberg region.
The bin and block level predictions of yield from the developed models achieved strong accuracies for the 2019 growing season. Although the models were validated with the data captured on the 5th of May 2019, they have the potential to predict the yield (t·ha−1) earlier in the growing season depending on the availability of cloud free imagery.
The results from this study are highly encouraging. However, additional research is required to develop models for other growing regions in Australia and globally, as the environmental conditions and management practices can influence the model’s accuracy.
Author Contributions
Conceptualization, M.M.R. and A.R.; methodology, M.M.R.; investigation, M.M.R.; writing, M.M.R. and A.R.; funding acquisition, A.R. All authors have read and agree to the published version of the manuscript.
Funding
This research was funded by Sugar Research Australia (SRA), grant number AR008. Project title: “Sugar from space: Improved data access, yield forecasting and targeted nitrogen application for the Australian Sugar Industry”.
Acknowledgments
The authors acknowledge the financial support from Sugar Research Australia (SRA). They also gratefully acknowledge the assistance of Robert M Powell (Bundaberg Sugar Limited) for providing historical boundary layer map and actual block level yield data.
Conflicts of Interest
The authors declare no conflict of interest.
References
- ABS. Australian Bureau of Statistics. Agricultural Commodities, Australia, ‘Table 1: Agricultural Commodities—Australia—2016-17’, Data Cube: Excel Spreadsheet, Cat. No. 71210. 2018. Available online: https://www.abs.gov.au/AUSSTATS/[email protected]/DetailsPage/7121.02016-17?OpenDocument (accessed on 26 July 2019).
- Australian Government Department of Agriculture. Available online: http://www.agriculture.gov.au/ag-farm-food/crops/sugar (accessed on 26 July 2019).
- Jensen, T.A.; Baillie, C.; Bramley, R.G.V.; Panitz, J.H. An assessment of sugarcane yield monitoring concepts and techniques from commercial yield monitoring systems. In Proceedings of the 34th Annual Conference of the Australian Society of Sugarcane Technologists (ASSCT), Palm Cove, Australia, 1–4 May 2012; p. 7. [Google Scholar]
- Robson, A.; Abbott, C.; Lamb, D.; Bramley, R. Developing sugarcane yield prediction algorithms from satellite imagery. In Proceedings of the 34th Annual Conference of the Australian Society of Sugarcane Technologists (ASSCT), Palm Cove, Australia, 1–4 May 2012; pp. 452–462. [Google Scholar]
- Rahman, M.M.; Robson, A.J. A Novel Approach for Sugarcane Yield Prediction Using Landsat Time Series Imagery: A Case Study on Bundaberg Region. Adv. Remote Sens. 2016, 5, 93–102. [Google Scholar] [CrossRef] [Green Version]
- Rahman, M.M.; Robson, A.J. Multi-temporal remote sensing for yield prediction in sugarcane crops. In Proceedings of the 19th Symposium of Society of Precision Agriculture Australia Towoomba, QLD, Australia, 12–13 September 2016. [Google Scholar]
- Lobell, D.B. The use of satellite data for crop yield gap analysis. Field Crop. Res. 2013, 143, 56–64. [Google Scholar] [CrossRef] [Green Version]
- Mulianga, B.; Bégué, A.; Simoes, M.; Todoroff, P. Forecasting Regional Sugarcane Yield Based on Time Integral and Spatial Aggregation of MODIS NDVI. Remote Sens. 2013, 5, 2184–2199. [Google Scholar] [CrossRef] [Green Version]
- El Hajj, M.; Bégué, A.; Guillaume, S.; Martiné, J.-F. Integrating SPOT-5 time series, crop growth modeling and expert knowledge for monitoring agricultural practices—The case of sugarcane harvest on Reunion Island. Remote Sens. Environ. 2009, 113, 2052–2061. [Google Scholar] [CrossRef]
- Bégué, A.; Lebourgeois, V.; Bappel, E.; Todoroff, P.; Pellegrino, A.; Baillarin, F.; Siegmund, B. Spatio-temporal variability of sugarcane fields and recommendations for yield forecast using NDVI. Int. J. Remote Sens. 2010, 31, 5391–5407. [Google Scholar] [CrossRef] [Green Version]
- Gonçalves, R.R.V.; Nascimento, C.R.; Zullo, J., Jr.; Romani, L.A.S. Relationship between the spectral response of sugarcane, based on AVHRR/NOAA satellite images, and the climate condition, in the state of Sao Paulo (Brazil), from 2001 to 2008. In Proceedings of the Fifth International Workshop on the Analysis of Multi-temporal Remote Sensing Images, Groton, CT, USA, 28–30 July 2009; pp. 315–322. [Google Scholar]
- Nascimento, C.R.; Gonçalves, R.R.V.; Zullo, J., Jr.; Romani, L.A.S. Estimation of sugarcane productivity using a time series of AVHRR/NOAA-17 images and a phenology-spectral model. In Proceedings of the Fifth International Workshop on the Analysis of Multi-temporal Remote Sensing images, Groton, CT, USA, 28–30 July 2009; pp. 365–372. [Google Scholar]
- Xavier, A.C.; Rudorff, B.F.T.; Shimabukuro, Y.E.; Berka, L.M.S.; Moreira, M.A. Multi-temporal analysis of MODIS data to classify sugarcane crop. Int. J. Remote Sens. 2006, 27, 755–768. [Google Scholar] [CrossRef]
- Bastidas-Obando, E.; Carbonell-Gonzalez, J. Evaluating the Applicability of MODIS Data for Forecasting Sugarcane Yields in Colombia. In Proceedings of the International Society of Sugarcane Technologists (ISSCT), Durban, South Africa, 29 July–2 August 2007. [Google Scholar]
- Meng, J.; Wu, B.; Li, Q.; Du, X.; Jia, K. Monitoring Crop Phenology with MERIS Data—A Case Study of Winter Wheat in North China Plain. In Proceedings of the Progress In Electromagnetics Research Symposium, Beijing, China, 23–27 March 2009; pp. 1225–1228. [Google Scholar]
- Zurita-Milla, R.; Gomez-Chova, L.; Guanter, L.; Clevers, J.G.P.W.; Camps-Valls, G. Multitemporal Unmixing of Medium-Spatial-Resolution Satellite Images: A Case Study Using MERIS Images for Land-Cover Mapping. IEEE Trans. Geosci. Remote Sens. 2011, 49, 4308–4317. [Google Scholar] [CrossRef]
- Si, Y.; Schlerf, M.; Zurita-Milla, R.; Skidmore, A.; Wang, T. Mapping spatio-temporal variation of grassland quantity and quality using MERIS data and the PROSAIL model. Remote Sens. Environ. 2012, 121, 415–425. [Google Scholar] [CrossRef]
- Fernandes, J.L.; Rocha, J.V.; Lamparelli, R.A.C. Sugarcane yield estimates using time series analysis of spot vegetation images. Sci. Agric. 2011, 68, 139–146. [Google Scholar] [CrossRef] [Green Version]
- Morel, J.; Todoroff, P.; Bégué, A.; Bury, A.; Martiné, J.-F.; Petit, M. Toward a Satellite-Based System of Sugarcane Yield Estimation and Forecasting in Smallholder Farming Conditions: A Case Study on Reunion Island. Remote Sens. 2014, 6, 6620. [Google Scholar] [CrossRef] [Green Version]
- Lu, D.; Hetrick, S.; Moran, E.; Li, G. Application of Time Series Landsat Images to Examining Land-use/Land-cover Dynamic Change. Photogramm. Eng. Remote Sens. 2012, 78, 747–755. [Google Scholar] [CrossRef] [PubMed] [Green Version]
- Lehmann, E.A.; Wallace, J.F.; Caccetta, P.A.; Furby, S.L.; Zdunic, K. Forest cover trends from time series Landsat data for the Australian continent. Int. J. Appl. Earth Obs. Geoinf. 2013, 21, 453–462. [Google Scholar] [CrossRef]
- Rahman, M.M.; Muir, J.; Robson, A. Multi-temporal Landsat algorithms for the yield prediction of sugarcane crops in Australia. In Proceedings of the 7th Asian-Australasian Conference on Precision Agriculture, Hamilton, Newzealand, 16–18 October 2017. [Google Scholar]
- Muir, J.; Robson, A.; Rahman, M.M. ‘Sugar from space’: Using satllite imagery to predict cane yield variability and nitrogen uptake. In Proceedings of the 40th ASSCT Conference, Mackay, Australia, 17–20 April 2018. [Google Scholar]
- Duveiller, G.; López-Lozano, R.; Baruth, B. Enhanced Processing of 1-km Spatial Resolution fAPAR Time Series for Sugarcane Yield Forecasting and Monitoring. Remote Sens. 2013, 5, 1091–1116. [Google Scholar] [CrossRef] [Green Version]
- Morel, J.; Bégué, A.; Todoroff, P.; Martiné, J.-F.; Lebourgeois, V.; Petit, M. Coupling a sugarcane crop model with the remotely sensed time series of fIPAR to optimise the yield estimation. Eur. J. Agron. 2014, 61, 60–68. [Google Scholar] [CrossRef]
- Laneve, G.; Marzialetti, P.; Luciani, R.; Fusilli, L.; Mulianga, B. Sugarcane biomass estimate based on sar imagery: A radar systems comparison. In Proceedings of the 2017 IEEE International Geoscience and Remote Sensing Symposium (IGARSS), Fort Worth, TX, USA, 23–28 July 2017; pp. 5834–5837. [Google Scholar] [CrossRef]
- Molijn, R.A.; Iannini, L.; Vieira Rocha, J.; Hanssen, R.F. Sugarcane productivity mapping through C-band and L-band SAR and optical satellite imagery. Remote Sens. 2019, 11, 1109. [Google Scholar] [CrossRef] [Green Version]
- Baghdadi, N.; Boyer, N.; Todoroff, P.; El Hajj, M.; Bégué, A. Potential of SAR sensors TerraSAR-X, ASAR/ENVISAT and PALSAR/ALOS for monitoring sugarcane crops on Reunion Island. Remote Sens. Environ. 2009, 113, 1724–1738. [Google Scholar] [CrossRef]
- Picoli, M.C.A.; Lamparelli, R.A.C.; Sano, E.E.; Rocha, J.V. The use of ALOS/PALSAR data for estimating sugarcane productivity. Eng. Agrícola 2014, 34, 1245–1255. [Google Scholar] [CrossRef] [Green Version]
- Yuan, X.; Li, H.; Han, Y.; Chen, J.; Chen, X. Monitoring of Sugarcane Crop based on Time Series of Sentinel-1 data: A case study of Fusui, Guangxi. In Proceedings of the 2019 8th International Conference on Agro-Geoinformatics (Agro-Geoinformatics), Istanbul, Turkey, 16–19 July 2019; pp. 1–5. [Google Scholar] [CrossRef]
- Drusch, M.; Del Bello, U.; Carlier, S.; Colin, O.; Fernandez, V.; Gascon, F.; Hoersch, B.; Isola, C.; Laberinti, P.; Martimort, P.; et al. Sentinel-2: ESA’s Optical High-Resolution Mission for GMES Operational Services. Remote Sens. Environ. 2012, 120, 25–36. [Google Scholar] [CrossRef]
- Landgrebe, D.A.; Hoffer, R.M.; Goodrick, F.E. An Early Analysis of ERTS-1 Data. In Proceedings of the Earth Resources Technology Satellite-1 Symposium, Goddard Spaceflight Center, Greenbelt, MD, USA, 29 September 1972. [Google Scholar]
- Loveland, T.R.; Dwyer, J.L. Landsat: Building a strong future. Remote Sens. Environ. 2012, 122, 22–29. [Google Scholar] [CrossRef]
- Roy, D.P.; Wulder, M.A.; Loveland, T.R.; Woodcock, C.E.; Allen, R.G.; Anderson, M.C.; Helder, D.; Irons, J.R.; Johnson, D.M.; Kennedy, R.; et al. Landsat-8: Science and product vision for terrestrial global change research. Remote Sens. Environ. 2014, 145, 154–172. [Google Scholar] [CrossRef] [Green Version]
- Flood, N. Comparing Sentinel-2A and Landsat 7 and 8 using surface reflectance over Australia. Remote Sens. 2017, 9, 659. [Google Scholar] [CrossRef] [Green Version]
- Mandanici, E.; Bitelli, G. Preliminary comparison of sentinel-2 and landsat 8 imagery for a combined use. Remote Sens. 2016, 8, 1014. [Google Scholar] [CrossRef] [Green Version]
- Wang, Q.; Blackburn, G.A.; Onojeghuo, A.O.; Dash, J.; Zhou, L.; Zhang, Y.; Atkinson, P.M. Fusion of Landsat 8 OLI and Sentinel-2 MSI Data. IEEE Trans. Geosci. Remote Sens. 2017, 55, 3885–3899. [Google Scholar] [CrossRef] [Green Version]
- Claverie, M.; Masek, J.G.; Ju, J.; Dungan, J.L. Harmonized Landsat-8 Sentinel-2 (HLS) Product User’s Guide. Available online: https://hls.gsfc.nasa.gov/wp-content/uploads/2017/03/HLS.v1.2.UserGuide.pdf (accessed on 14 October 2019).
- Vuolo, F.; Żółtak, M.; Pipitone, C.; Zappa, L.; Wenng, H.; Immitzer, M.; Weiss, M.; Baret, F.; Atzberger, C. Data service platform for Sentinel-2 surface reflectance and value-added products: System use and examples. Remote Sens. 2016, 8, 938. [Google Scholar] [CrossRef] [Green Version]
- Robson, A.; Rahman, M.M.; Falzon, G.; Verma, N.K.; Johansen, K.; Robinson, N.; Lakshmanan, P.; Salter, B.; Skocaj, D. Evaluating remote sensing technologies for improved yield forecasting and for the measurement of foliar nitrogen concentration in sugarcane. In Proceedings of the 38th Australian Society of Sugar Cane Technologists, Mackay, Queensland, Australia, 27–29 April 2016. [Google Scholar]
- BOM. Bureau of Meteorology. Available online: http://www.bom.gov.au (accessed on 15 September 2019).
- Mueller-Wilm, U. Sen2Cor Software Release Note. Available online: http://step.esa.int/thirdparties/sen2cor/2.8.0/docs/S2-PDGS-MPC-L2A-SRN-V2.8.pdf (accessed on 15 September 2019).
- Gitelson, A.A.; Kaufman, Y.J.; Merzlyak, M.N. Use of a green channel in remote sensing of global vegetation from EOS-MODIS. Remote Sens. Environ. 1996, 58, 289–298. [Google Scholar] [CrossRef]
- R Development Core Team. R: A Language and Environment for Statistical Computing (Version 3.5); R Foundation for Statistical Computing: Vienna, Austria, 2018. [Google Scholar]
- Tuszynski, J.; Tuszynski, M.J. The caTools Package. 2007. Available online: https://cran.r-project.org/web/packages/caTools/caTools.pdf (accessed on 18 November 2019).
- Robson, A.; Wright, G. Accurate Regional to Field Scale Yield forecasting of Australian Sugarcane and Peanut Crops using Remote Sensing and GIS. In Proceedings of the Asia-Pacific Economic Cooperation (APEC): Training Course on the Application of Remote Sensing and GIS Technology in Crop Production, Beijing, China, 13 November 2013. [Google Scholar]
Figure 1.
Location of sugarcane blocks in Bundaberg, Australia.

Figure 2.
Scatterplot between Landsat-8 Green Normalised Difference Vegetation Index (GNDVI) and Sentinel-2 GNDVI.
Figure 2.
Scatterplot between Landsat-8 Green Normalised Difference Vegetation Index (GNDVI) and Sentinel-2 GNDVI.

Figure 3.
(a) The correlation between Sentinel-2 GNDVI in 2019 and Conversion Model derived GNDVI from Landsat-8 data. (b) The correlation between Sentinel-2 GNDVI and Landsat-8 GNDVI without Conversion Model.
Figure 3.
(a) The correlation between Sentinel-2 GNDVI in 2019 and Conversion Model derived GNDVI from Landsat-8 data. (b) The correlation between Sentinel-2 GNDVI and Landsat-8 GNDVI without Conversion Model.

Figure 4.
Ten fitted quadratic models based on the average GNDVI values for ten bins across the time of the year. Data from 2014 to 2018 growing season are illustrated.
Figure 4.
Ten fitted quadratic models based on the average GNDVI values for ten bins across the time of the year. Data from 2014 to 2018 growing season are illustrated.

Figure 5.
Scatter plots identifying the relationship between the model derived maximum GNDVI and Yield (t·ha−1) across five years period (2014–2018) for the ten bins.
Figure 5.
Scatter plots identifying the relationship between the model derived maximum GNDVI and Yield (t·ha−1) across five years period (2014–2018) for the ten bins.


Figure 6.
The comparison between actual yield (t·ha−1) and predicted yield (t·ha−1) over 10 bins in 2019 season.
Figure 6.
The comparison between actual yield (t·ha−1) and predicted yield (t·ha−1) over 10 bins in 2019 season.

Figure 7.
The scatterplot between actual yield (t·ha−1) and predicted yield (t·ha−1) on block level for 2019 season using Landsat-8 to Sentinel-2 conversion algorithm. The dotted line shows the 1:1 line.
Figure 7.
The scatterplot between actual yield (t·ha−1) and predicted yield (t·ha−1) on block level for 2019 season using Landsat-8 to Sentinel-2 conversion algorithm. The dotted line shows the 1:1 line.

Figure 8.
The scatterplot between actual yield (t·ha−1) and predicted yield (t·ha−1) on block level for 2019 season without Landsat-8 to Sentinel-2 conversion algorithm. The dotted line shows the 1:1 line.
Figure 8.
The scatterplot between actual yield (t·ha−1) and predicted yield (t·ha−1) on block level for 2019 season without Landsat-8 to Sentinel-2 conversion algorithm. The dotted line shows the 1:1 line.


Table 1.
The Coordinated Universal Time (UTC), Sun elevation and Sun azimuth angles (°) for image pairs of Landsat-8 and Sentinel-2.
Table 1.
The Coordinated Universal Time (UTC), Sun elevation and Sun azimuth angles (°) for image pairs of Landsat-8 and Sentinel-2.
| Satellite | Date | Time (UTC) | Sun Elevation (°) | Sun Azimuth (°) |
|---|---|---|---|---|
| Landsat-8 | 2016-06-29 | 23:47:20.468 | 33.28313465 | 35.21029636 |
| Sentinel-2 | 00:02:19.460 | 35.03771162 | 31.08598346 | |
| Landsat-8 | 2017-05-15 | 23:46:56.737 | 37.54211453 | 36.43211030 |
| Sentinel-2 | 00:02:21.026 | 39.63220987 | 32.06687238 | |
| Landsat-8 | 2018-06-19 | 23:46:27.002 | 33.22617686 | 34.73077325 |
| Sentinel-2 | 00:02:41.024 | 35.11356882 | 30.43385100 | |
| Landsat-8 | 2019-05-05 | 23:46:58.35 | 39.68742589 | 38.53144620 |
| Sentinel-2 | 00:02:41.024 | 41.92912089 | 34.06945308 |
© 2020 by the authors. Licensee MDPI, Basel, Switzerland. This article is an open access article distributed under the terms and conditions of the Creative Commons Attribution (CC BY) license (http://creativecommons.org/licenses/by/4.0/).
Share and Cite
MDPI and ACS Style
Rahman, M.M.; Robson, A. Integrating Landsat-8 and Sentinel-2 Time Series Data for Yield Prediction of Sugarcane Crops at the Block Level. Remote Sens. 2020, 12, 1313. https://0-doi-org.brum.beds.ac.uk/10.3390/rs12081313
AMA Style
Rahman MM, Robson A. Integrating Landsat-8 and Sentinel-2 Time Series Data for Yield Prediction of Sugarcane Crops at the Block Level. Remote Sensing. 2020; 12(8):1313. https://0-doi-org.brum.beds.ac.uk/10.3390/rs12081313
Chicago/Turabian StyleRahman, Muhammad Moshiur, and Andrew Robson. 2020. "Integrating Landsat-8 and Sentinel-2 Time Series Data for Yield Prediction of Sugarcane Crops at the Block Level" Remote Sensing 12, no. 8: 1313. https://0-doi-org.brum.beds.ac.uk/10.3390/rs12081313
Note that from the first issue of 2016, this journal uses article numbers instead of page numbers. See further details here.