A Soil Erosion Indicator for Supporting Agricultural, Environmental and Climate Policies in the European Union

 ,
,  , ,
, ,
Abstract
:
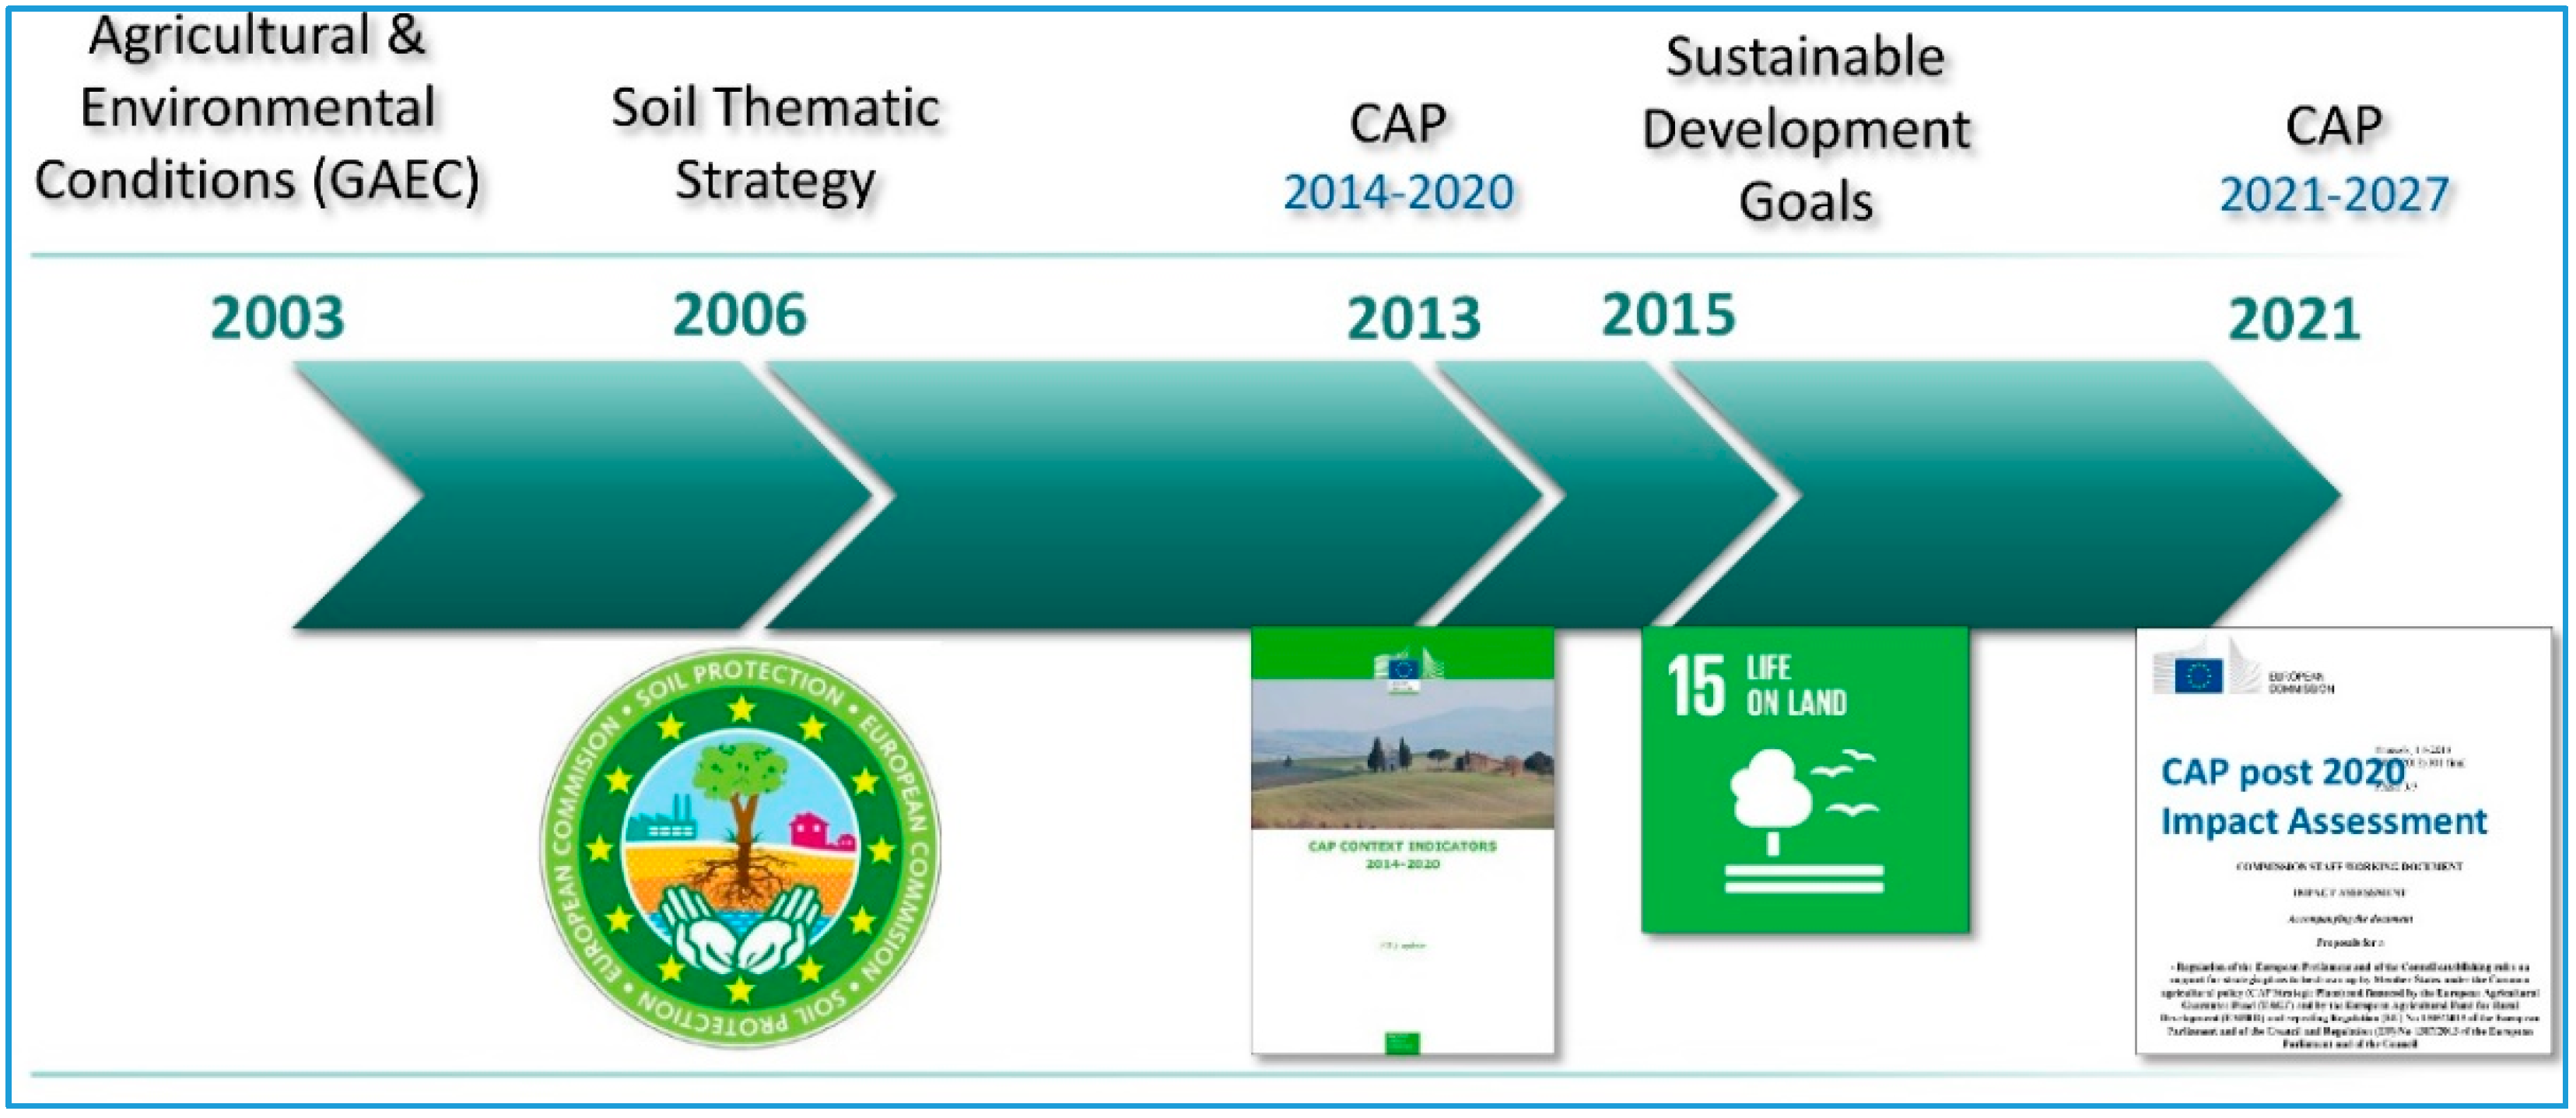
1. Background
2. Materials and Methods
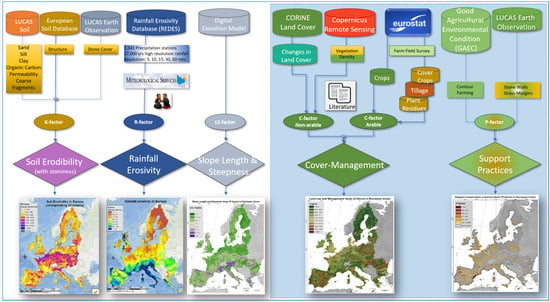
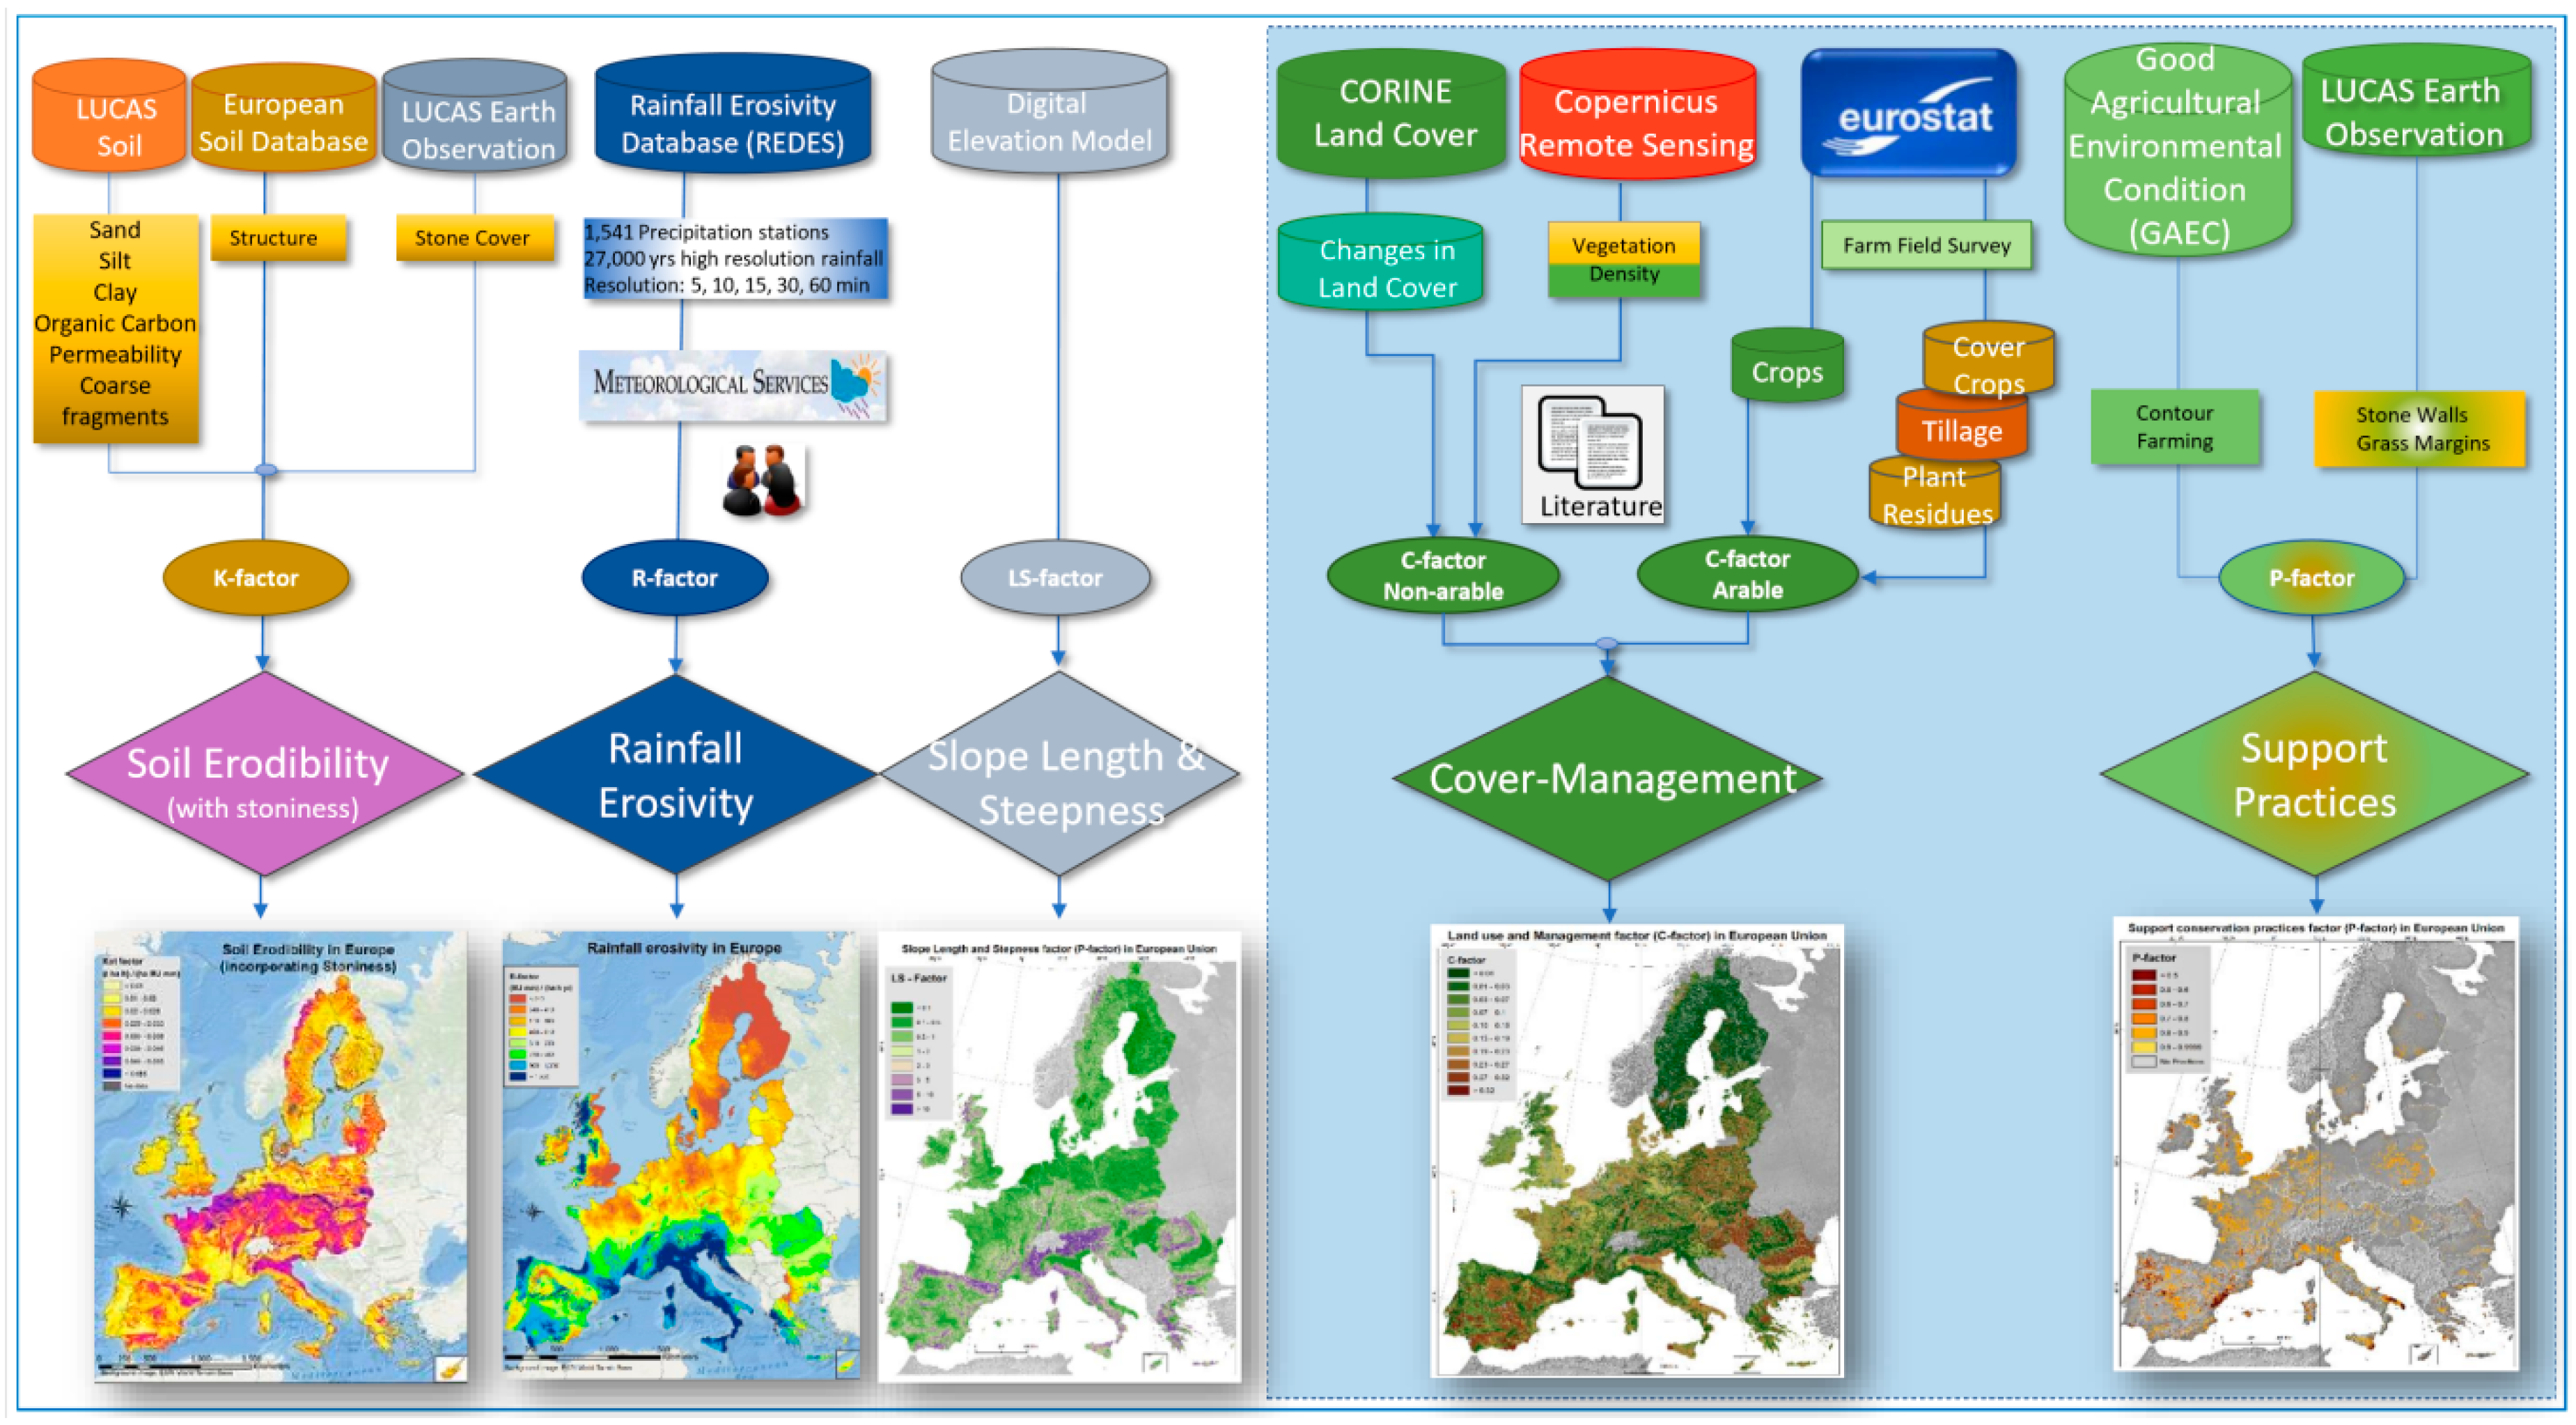
2.1. Modelling Soil Erosion at Continental Scale
2.2. Static Factors
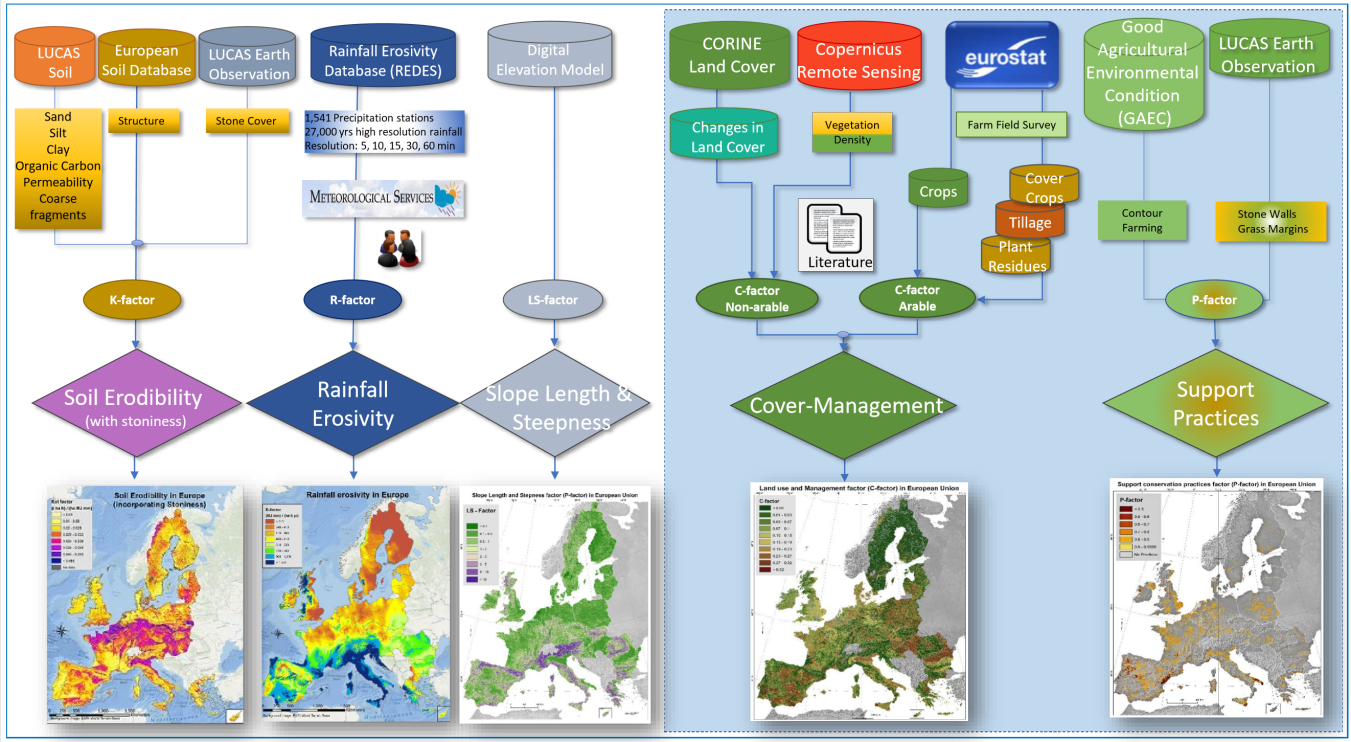
2.3. Dynamic Factors and Land Cover Changes
2.4. Changes in Tillage Practices, Cover Crops and Plant Residues
2.5. Changes in Grass Margins and Support Practices Factor (P)
2.6. Building a Framework for Indicators for Monitoring Soil Erosion
3. Results
3.1. C-Factor Update
3.2. P-Factor Update
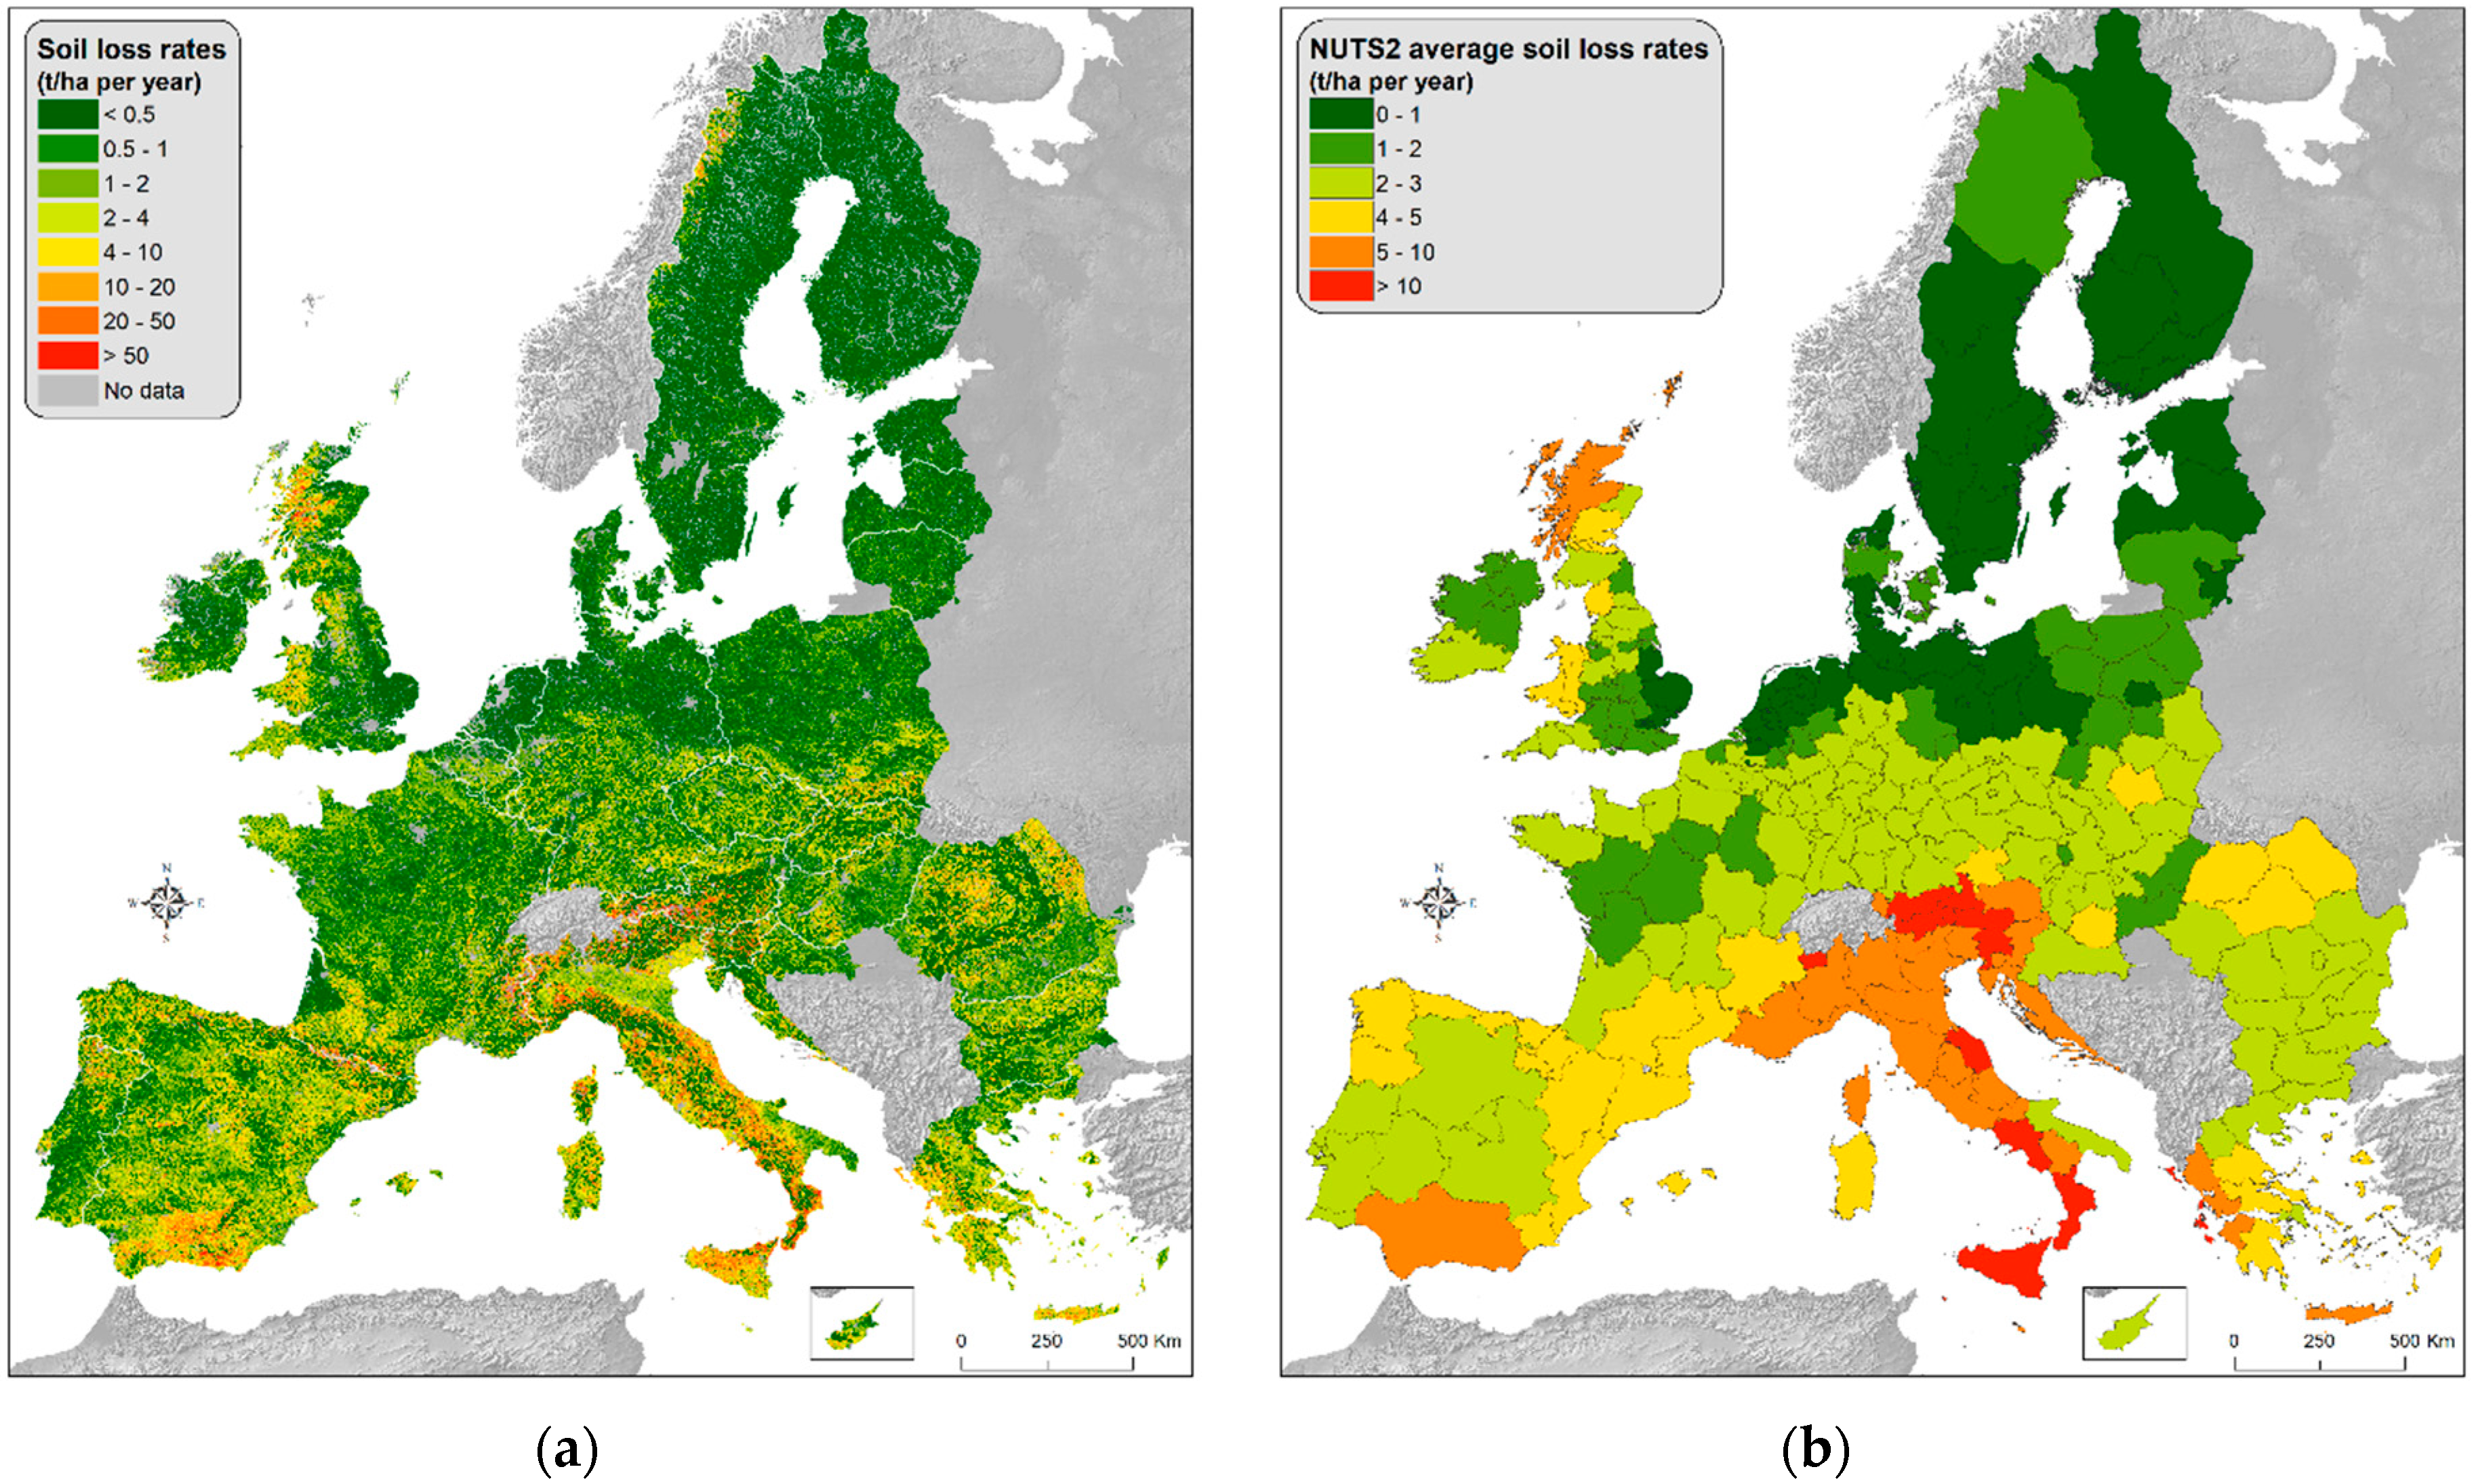
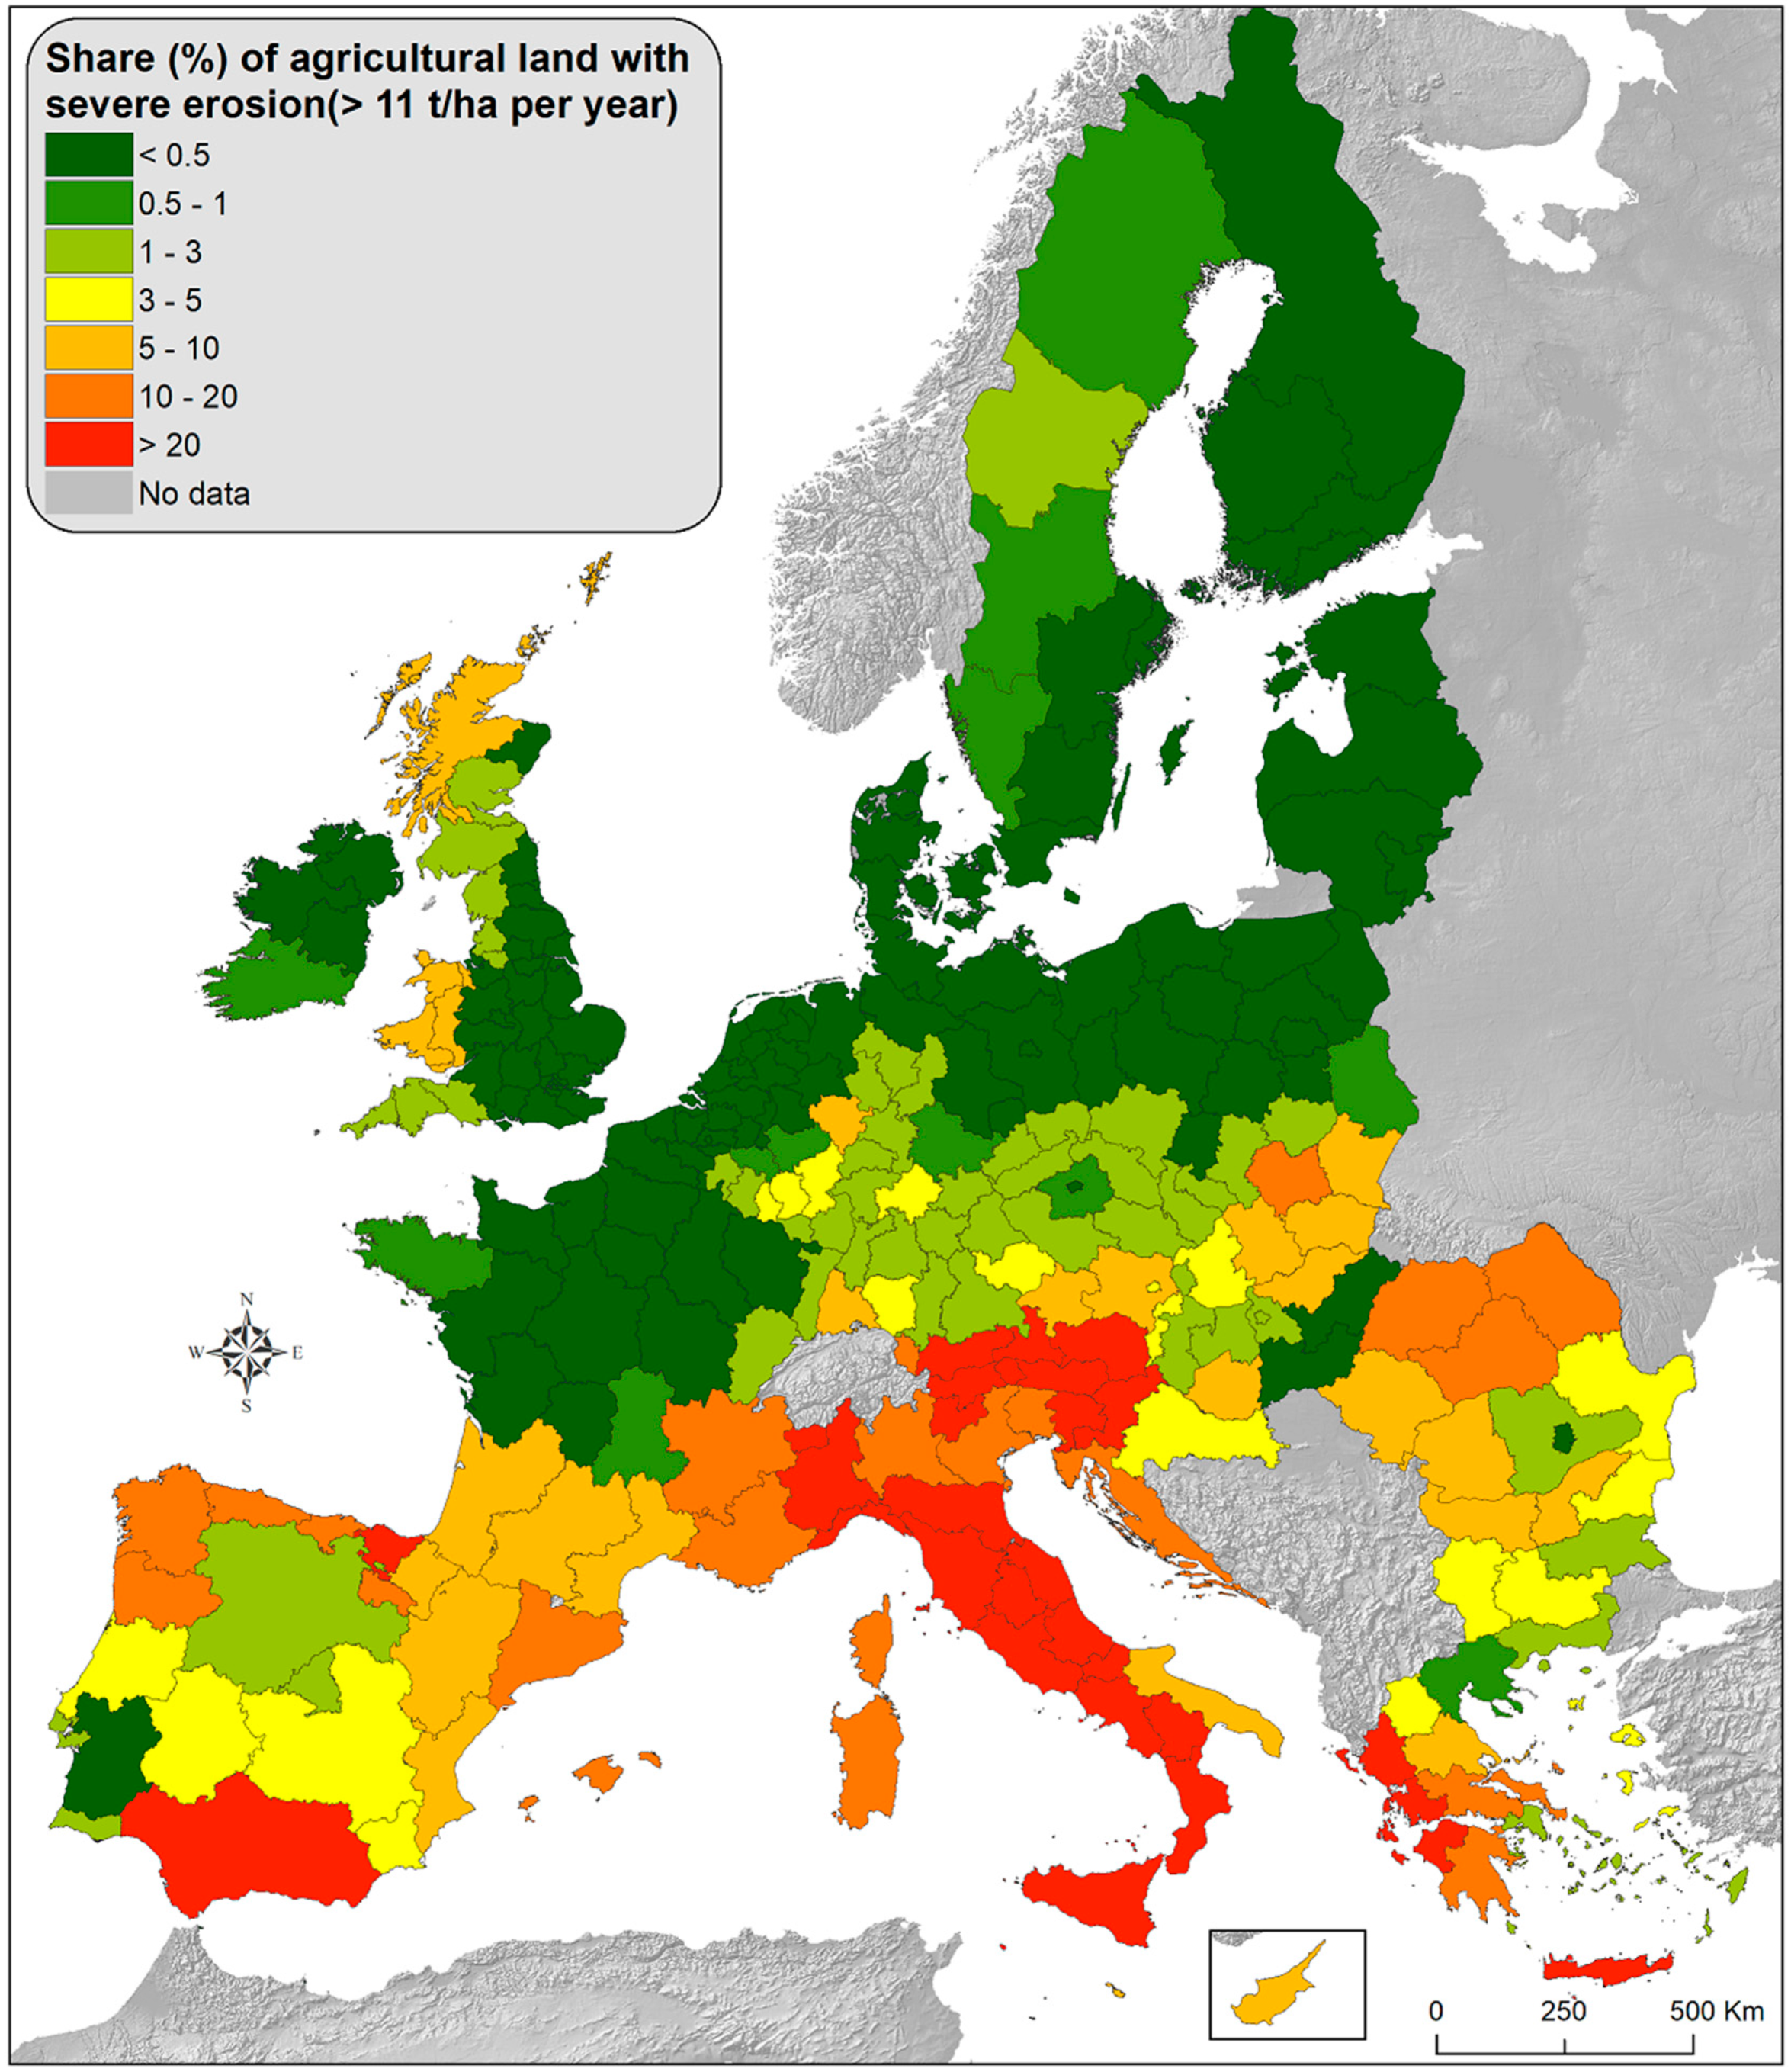
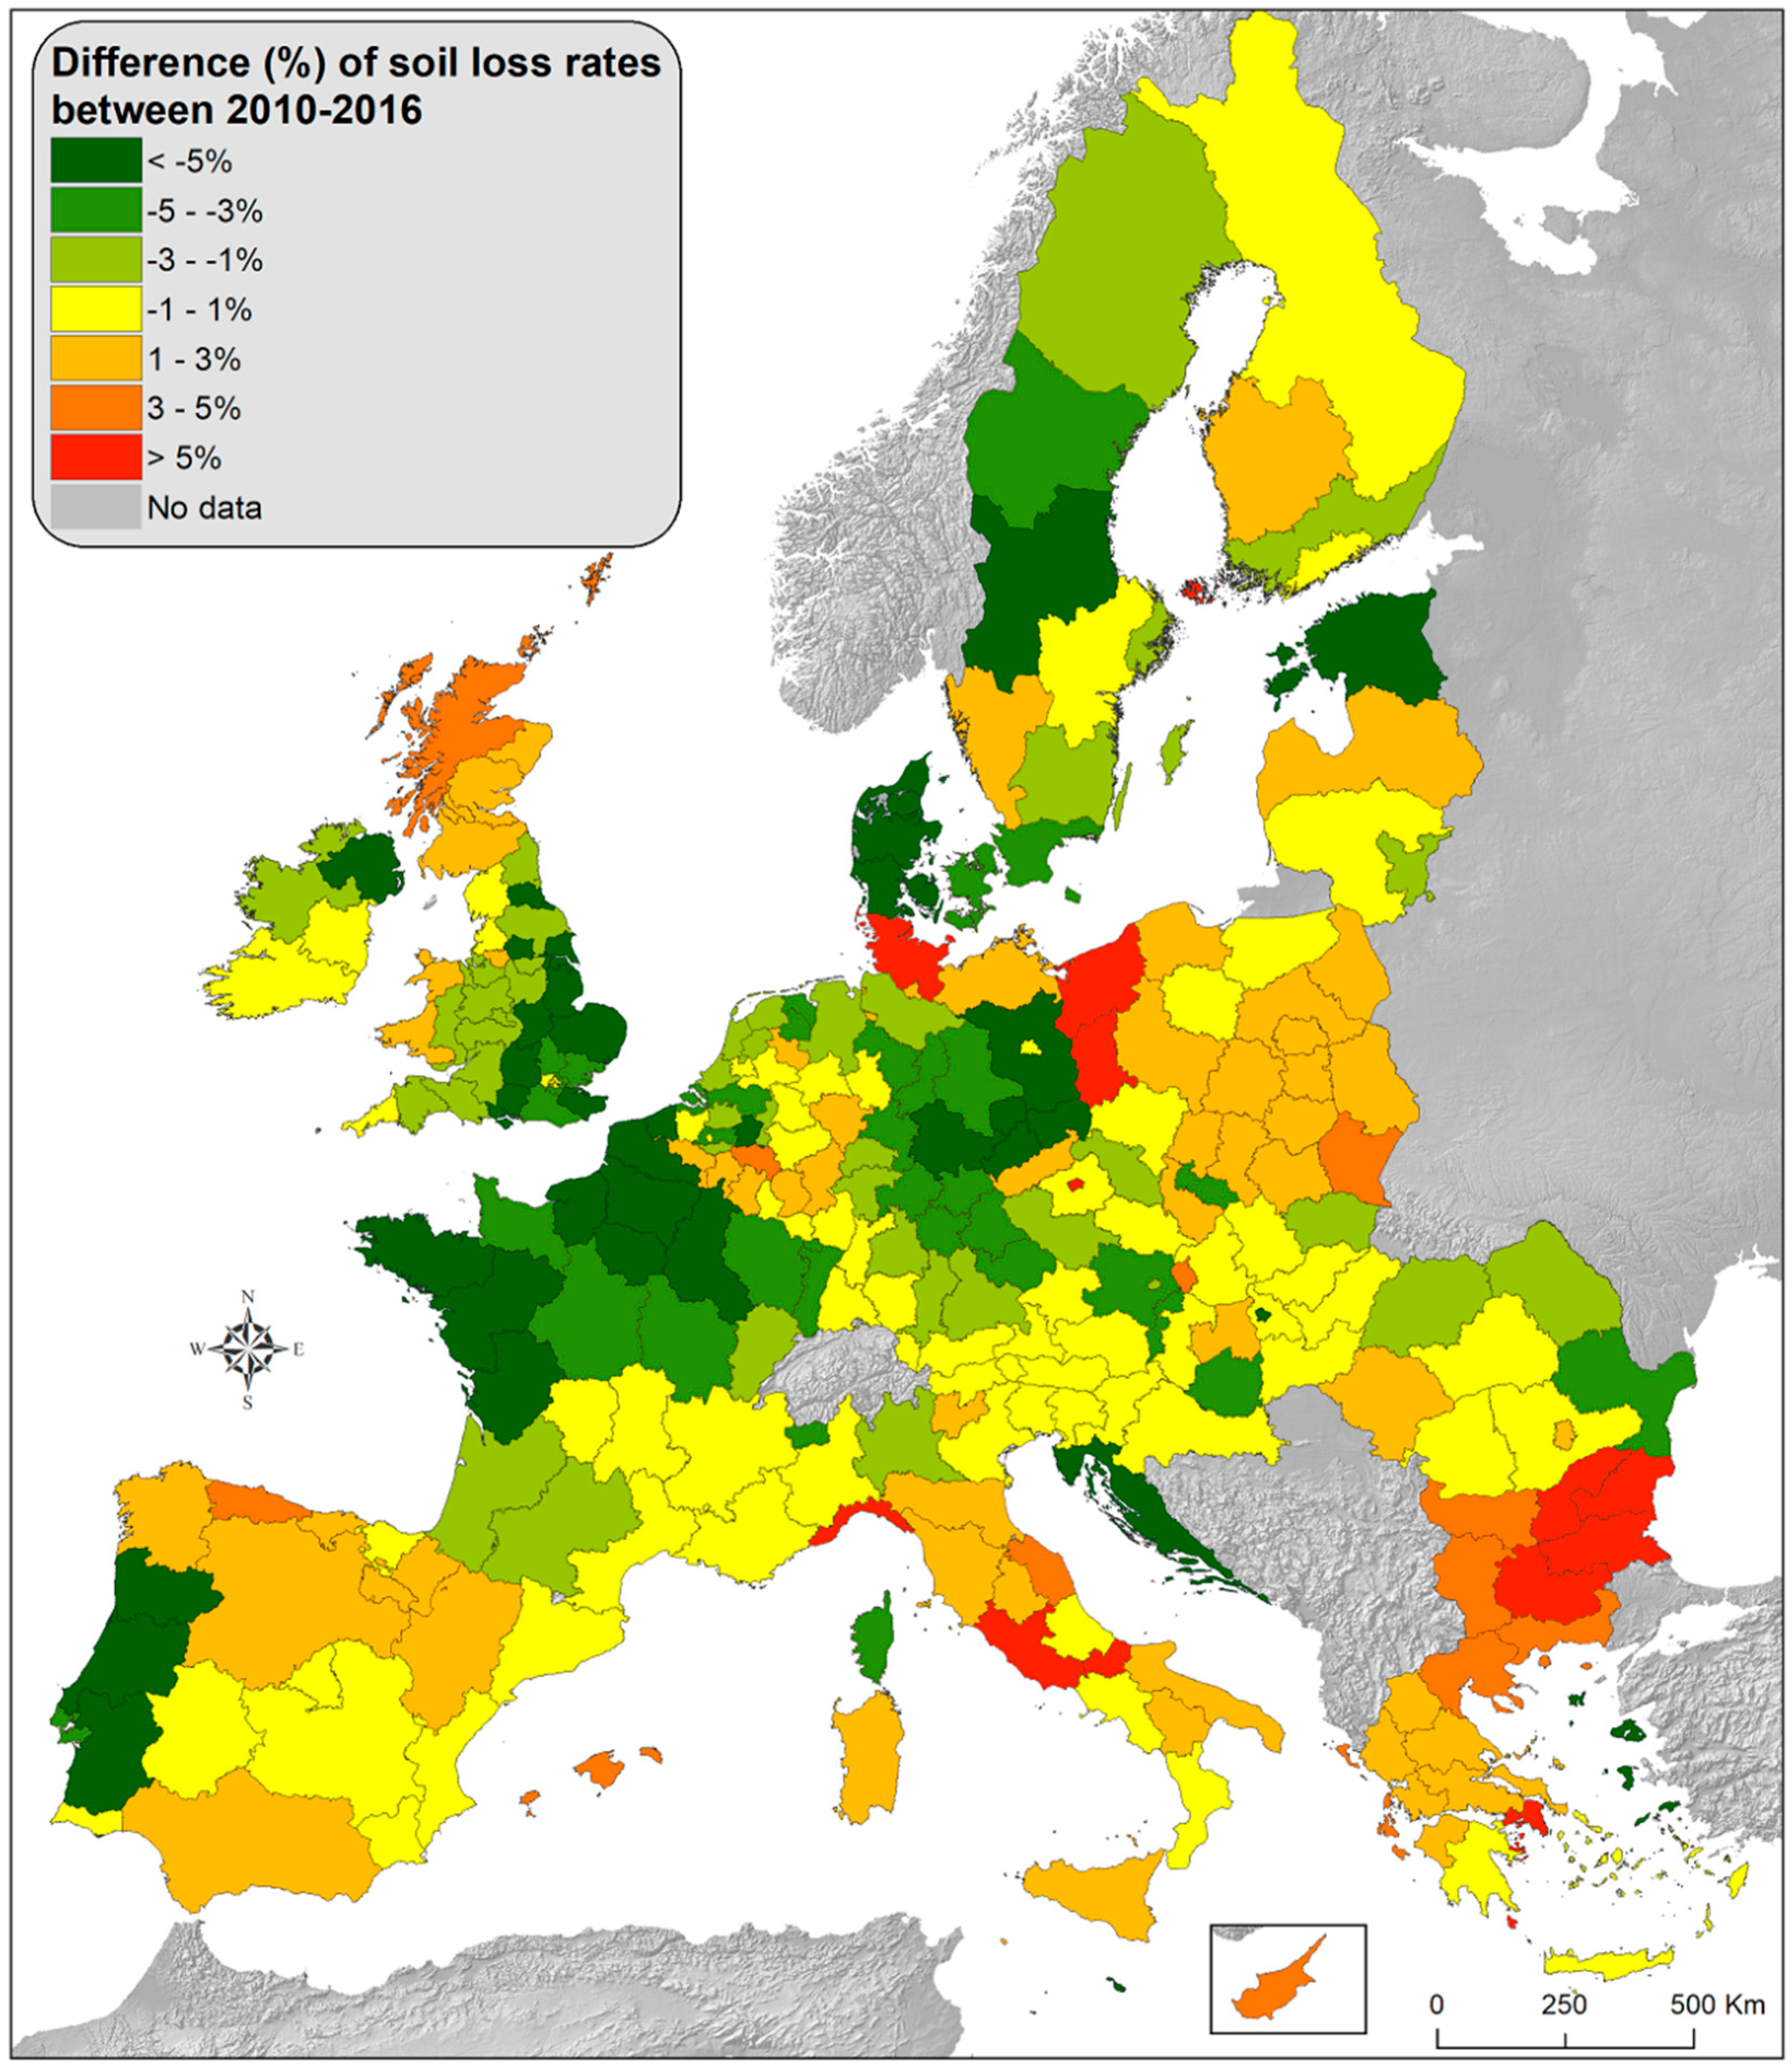
3.3. Soil Erosion Rates and Derived Indicators in 2016
4. Discussion
4.1. Progress in the Soil Erosion Indicators
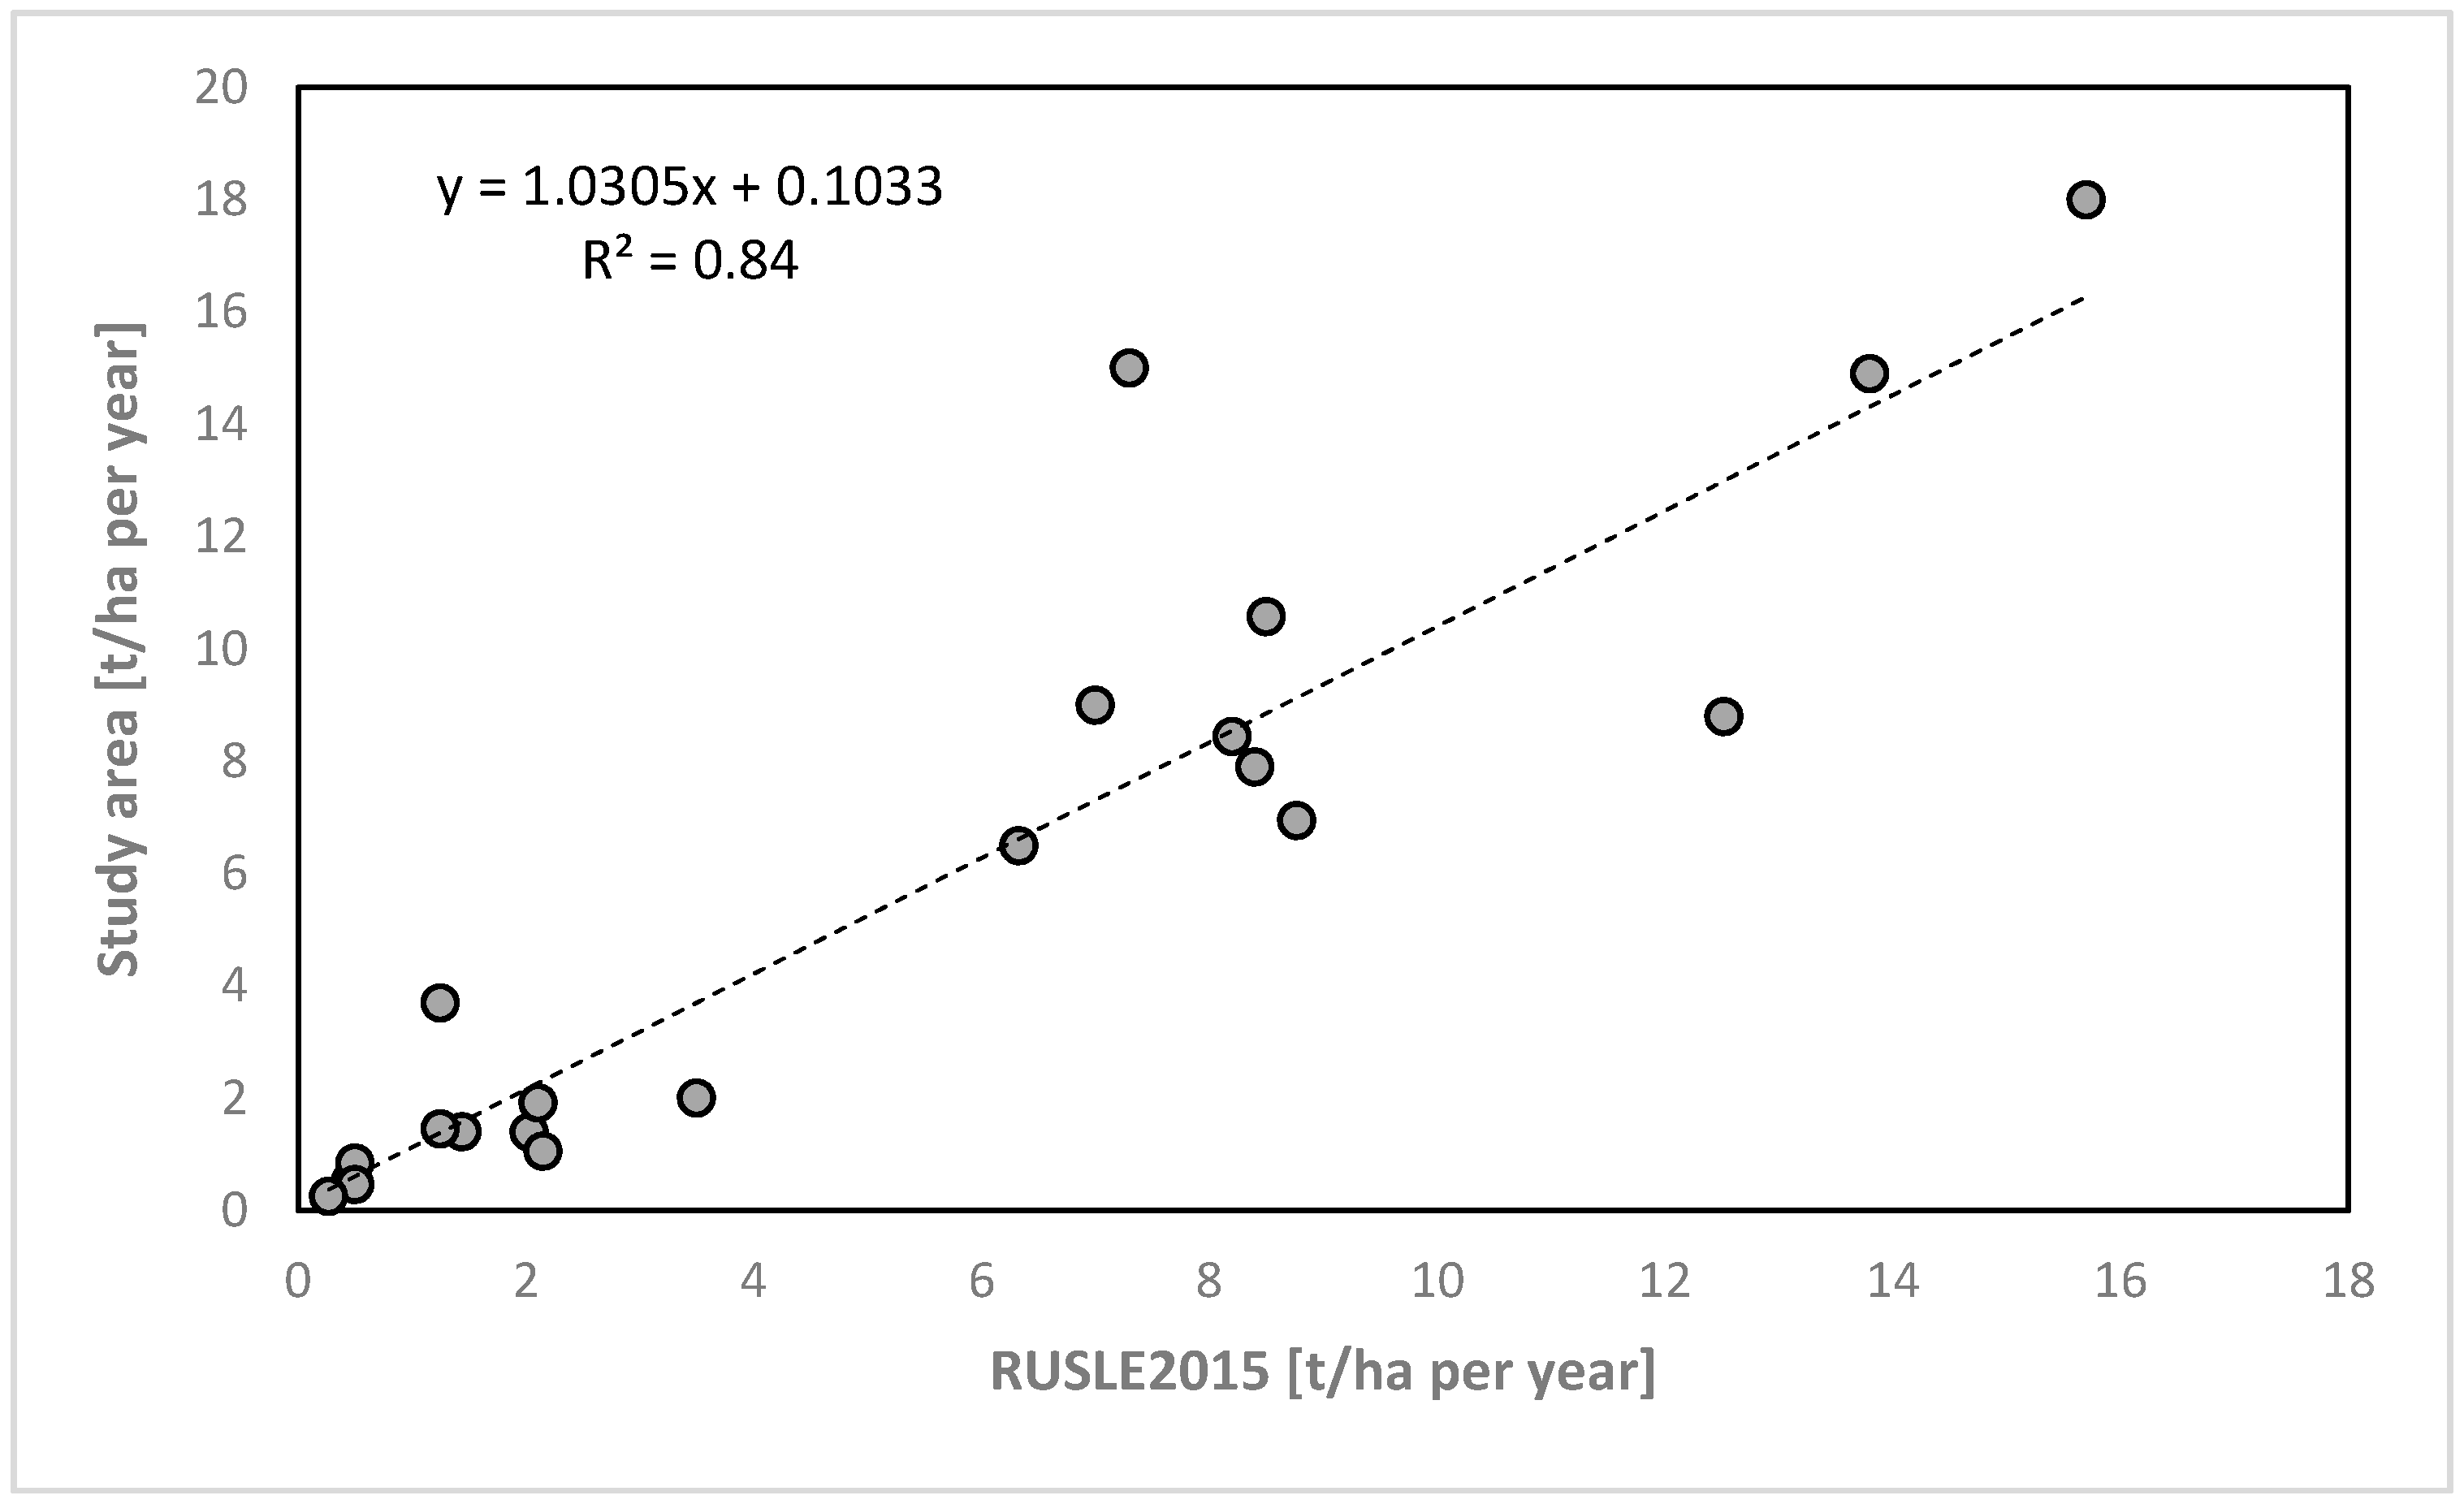
4.2. Model Comparison with Modelled Regional Assessments
4.3. Uncertainties and Model Development
4.4. Scenario Analysis Based on Policy Developments
4.5. Remote Sensing to Model Soil Erosion by Water at Pan-European Scale
4.6. Data Availability
5. Conclusions and Outlook
Author Contributions
Funding
Acknowledgments
Conflicts of Interest
Appendix A

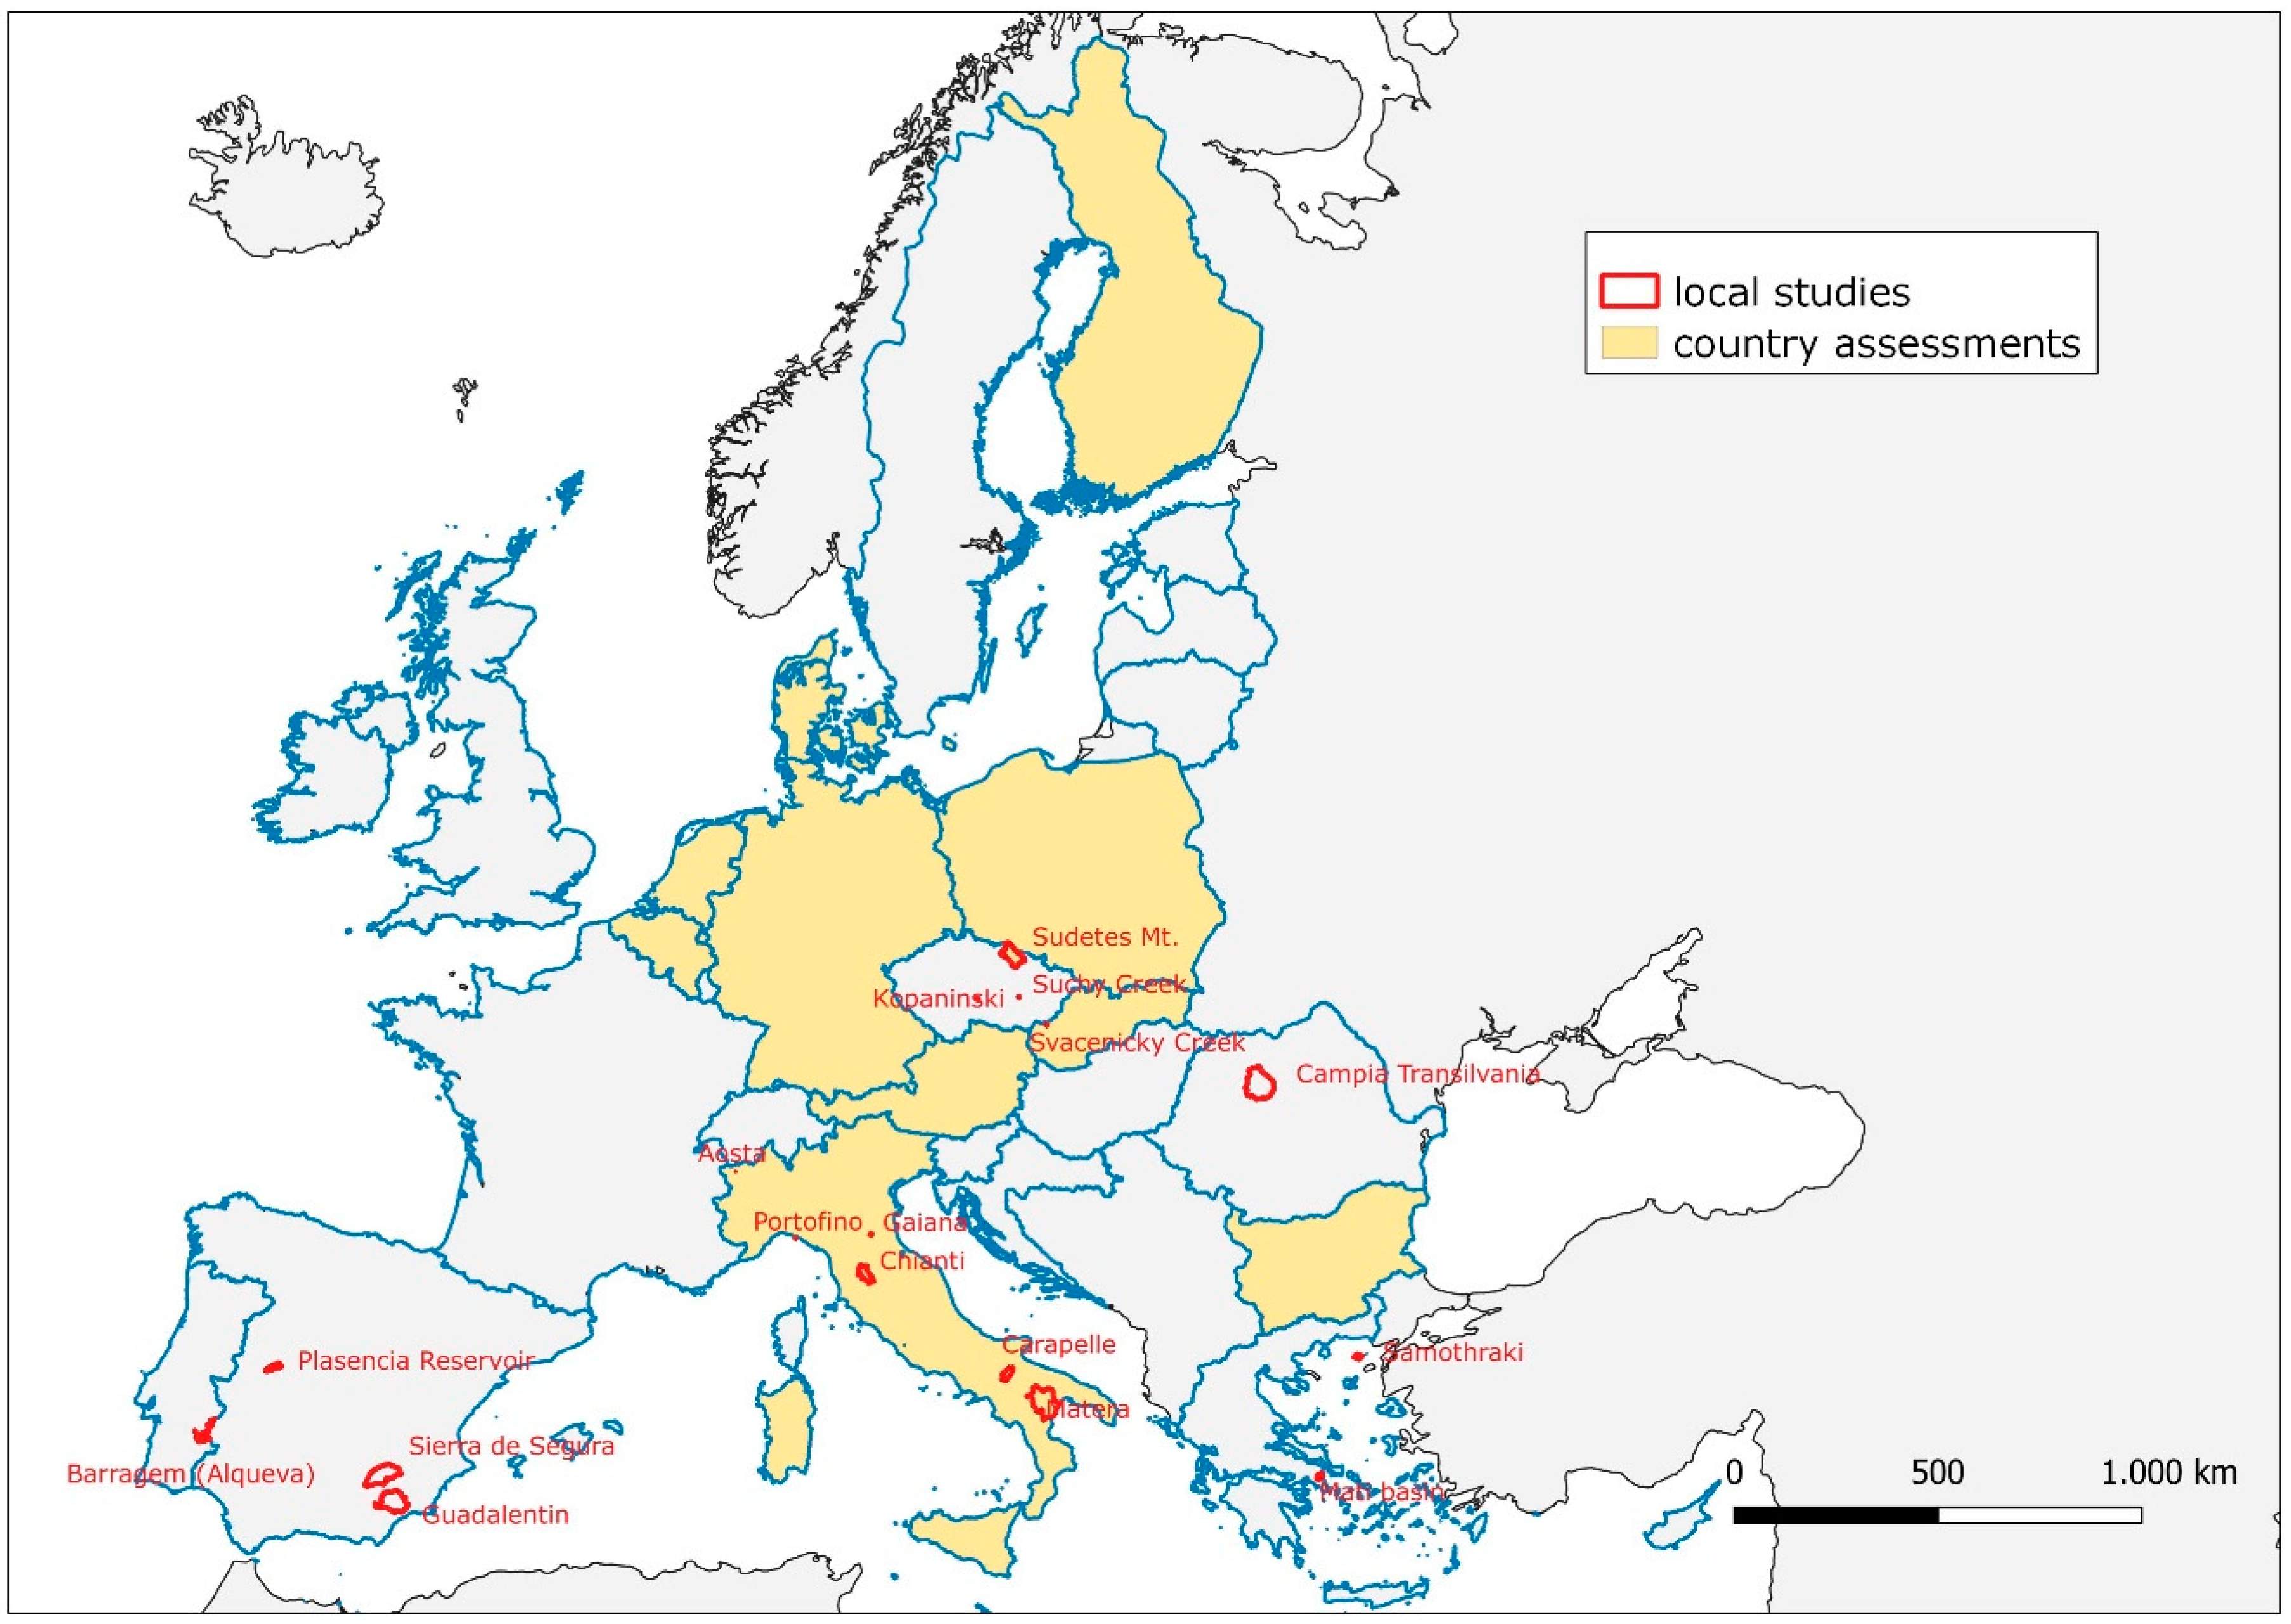
| Study Area | Km2 | Mean Soil Loss Rate RUSLE2015 (t ha−1 yr−1) | Mean Soil LossRate from Study Area (t ha−1 yr−1) | Reference |
|---|---|---|---|---|
| Denmark | 0.5 | 0.85 | [64] | |
| Italy | 8.4 | 7.9 | [65] | |
| Finland + plots | 0.46 | 0.53 | [66,67] | |
| Suchy Creek (CZ) | 3.21 | 13.8 | 14.9 | [68] |
| Svacenicky Creek (SK) | 6.23 | 8.5 | 10.58 | [68] |
| Campia Transilvania (RO) | 3599.34 | 15.7 | 18 | [69] |
| Carapelle (IT) | 493.52 | 12.52 | 8.8 | [70] |
| Kopaninski (CZ) | 7.1 | 6.33 | 6.5 | [71] |
| Plasencia Reservoir (ES) | 359.68 | 2.03 | 1.4 | [72] |
| Gaiana (IT) | 10.87 | 8.2 | 8.44 | [73] |
| Samothraki (GR) | 137.82 | 7.3 | 15 | [74] |
| Sierra de Segura (ES) | 2556.42 | 7 | 9 | [75] |
| Guadalentin (ES) | 2597.28 | 3.5 | 2.01 | [75] |
| Sudetes Mt. catchment (PL) | 1595.66 | 1.25 | 3.7 | [76] |
| Barragem (Alqueva) (PT) | 117.6 | 2.11 | 1.92 | [77] |
| Matera (IT) | 3346.21 | 1.44 | 1.41 | [78] |
| Chianti (IT) | 872.04 | 0.5 | 0.47 | [79] |
| Portofino (IT) | 2.33 | 8.77 | 6.95 | [80] |
| Mati basin (GR) | 104.43 | 0.27 | 0.26 | [81] |
| Aosta (vineyard) (IT) | 0.02 | 1.25 | 1.46 | [82] |
| Austria (agricultural) | 3.5 | 2.01 | [48] | |
| Belgium | 1.25 | 3.7 | ||
| Bulgaria | 2.11 | 1.92 | ||
| Germany | 1.44 | 1.41 | ||
| Denmark | 0.5 | 0.47 | ||
| Italy | 8.77 | 6.95 | ||
| Netherlands | 0.27 | 0.26 | ||
| Poland | 1.25 | 1.46 | ||
| Slovakia | 2.15 | 1.06 |


References
- Glæsner, N.; Helming, K.; de Vries, W. Do current European policies prevent soil threats and support soil functions? Sustainability 2014, 6, 9538–9563. [Google Scholar] [CrossRef] [Green Version]
- Juerges, N.; Hansjürgens, B. Soil governance in the transition towards a sustainable bioeconomy–A review. J. Clean. Prod. 2018, 170, 1628–1639. [Google Scholar] [CrossRef]
- Cowie, A.L.; Orr, B.J.; Castillo Sanchez, V.M.; Chasek, P.; Crossman, N.D.; Erlewein, A.; Louwagie, G.; Maron, M.; Metternicht, G.I.; Minelli, S.; et al. Land in balance: The scientific conceptual framework for Land Degradation Neutrality. Environ. Sci. Policy 2018, 79, 25–35. [Google Scholar] [CrossRef]
- Montanarella, L. Agricultural policy: Govern our soils. Nature 2015, 528, 32–33. [Google Scholar] [CrossRef] [PubMed]
- European Environment Agency. European Commission-Soil Thematic Strategy (COM 2006.231); European Environment Agency: Copenhagen, Denmark, 2006.
- Ronchi, S.; Salata, S.; Arcidiacono, A.; Piroli, E.; Montanarella, L. Policy instruments for soil protection among the EU member states: A comparative analysis. Land Use Policy 2019, 82, 763–780. [Google Scholar] [CrossRef]
- Swinbank, A.; Daugbjerg, C. The 2003 CAP Reform: Accommodating WTO Pressures. Comp. Eur. Polit. 2006, 4, 47–64. [Google Scholar] [CrossRef]
- Louwagie, G.; Gay, S.H.; Sammeth, F.; Ratinger, T. The potential of European Union policies to address soil degradation in agriculture. L. Degrad. Dev. 2011, 22, 5–17. [Google Scholar] [CrossRef]
- Recanati, F.; Maughan, C.; Pedrotti, M.; Dembska, K.; Antonelli, M. Assessing the role of CAP for more sustainable and healthier food systems in Europe: A literature review. Sci. Total Environ. 2019, 653, 908–919. [Google Scholar] [CrossRef]
- Matthews, A. Greening agricultural payments in the EU’s common agricultural policy. Bio-Based Appl. Econ. 2013, 2, 1–27. [Google Scholar]
- Costanza, R.; Fioramonti, L.; Kubiszewski, I. The UN Sustainable Development Goals and the dynamics of well-being. Front. Ecol. Environ. 2016, 14, 59. [Google Scholar] [CrossRef] [Green Version]
- Eurostat. Sustainable Development in the European Union-Monitoring Report on Progress towards the SDGs in an EU Context; Eurostat: Brussels, Belgium, 2019.
- Panagos, P.; Katsoyiannis, A. Soil erosion modelling: The new challenges as the result of policy developments in Europe. Environ. Res. 2019, 172, 470–474. [Google Scholar] [CrossRef] [PubMed]
- European Commission. CAP 2021–2027, COMMISSION STAFF WORKING DOCUMENT IMPACT ASSESSMENT SWD (2018) 301 Edition; European Commission: Brussels, Belgium, 2018. [Google Scholar]
- European Commission. CAP 2021-27, 2018. EGULATION OF THE EUROPEAN PARLIAMENT AND OF THE COUNCIL-CAP Strategic Plans-COM(2018) 392 Final; European Commission: Brussels, Belgium, 2018. [Google Scholar]
- Paleari, S. Is the European Union protecting soil? A critical analysis of Community environmental policy and law. Land Use Policy 2017, 64, 163–173. [Google Scholar] [CrossRef]
- Turpin, N.; ten Berge, H.; Grignani, C.; Guzmán, G.; Vanderlinden, K.; Steinmann, H.H.; Siebielec, G.; Spiegel, H.; Perret, E.; Ruysschaert, G.; et al. An assessment of policies affecting Sustainable Soil Management in Europe and selected member states. Land Use Policy 2017, 66, 241–249. [Google Scholar] [CrossRef]
- Virto, I.; Imaz, M.J.; Fernández-Ugalde, O.; Gartzia-Bengoetxea, N.; Enrique, A.; Bescansa, P. Soil degradation and soil quality in Western Europe: Current situation and future perspectives. Sustainability 2015, 7, 313–365. [Google Scholar] [CrossRef] [Green Version]
- Kirkby, M.J.; Irvine, B.J.; Jones, R.J.A.; Govers, G.; Boer, M.; Cerdan, O.; Daroussin, J.; Gobin, A.; Grimm, M.; Le Bissonnais, Y.; et al. The PESERA coarse scale erosion model for Europe. I.-Model rationale and implementation. Eur. J. Soil Sci. 2008, 59, 1293–1306. [Google Scholar] [CrossRef]
- Cerdan, O.; Govers, G.; Le Bissonnais, Y.; Van Oost, K.; Poesen, J.; Saby, N.; Gobin, A.; Vacca, A.; Quinton, J.; Auerswald, K.; et al. Rates and spatial variations of soil erosion in Europe: A study based on erosion plot data. Geomorphology 2010, 122, 167–177. [Google Scholar] [CrossRef]
- Panagos, P.; Borrelli, P.; Poesen, J.; Ballabio, C.; Lugato, E.; Meusburger, K.; Montanarella, L.; Alewell, C. The new assessment of soil loss by water erosion in Europe. Environ. Sci. Policy 2015, 54, 438–447. [Google Scholar] [CrossRef]
- Renard, K.; Foster, G.; Weesies, G.; McCool, D.; Yoder, D. Predicting soil erosion by water: A guide to conservation planning with the Revised Universal Soil Loss Equation (RUSLE); United States Government Printing: Washington, DC, USA, 1997; p. 404.
- Benavidez, R.; Jackson, B.; Maxwell, D.; Norton, K. A review of the (Revised) Universal Soil Loss Equation ((R)USLE): With a view to increasing its global applicability and improving soil loss estimates. Hydrol. Earth Syst. Sci. 2018, 22, 6059–6086. [Google Scholar] [CrossRef] [Green Version]
- Alewell, C.; Borrelli, P.; Meusburger, K.; Panagos, P. Using the USLE: Chances, challenges and limitations of soil erosion modelling. Int. Soil Water Conserv. Res. 2019, 7, 203–225. [Google Scholar] [CrossRef]
- Borrelli, P.; Robinson, D.A.; Fleischer, L.R.; Lugato, E.; Ballabio, C.; Alewell, C.; Meusburger, K.; Modugno, S.; Schütt, B.; Ferro, V.; et al. An assessment of the global impact of 21st century land use change on soil erosion. Nat. Commun. 2017, 8, 1–13. [Google Scholar] [CrossRef] [Green Version]
- Liu, Y.; Fu, B.; Liu, Y.; Zhao, W.; Wang, S. Vulnerability assessment of the global water erosion tendency: Vegetation greening can partly offset increasing rainfall stress. L. Degrad. Dev. 2019, 30, 1061–1069. [Google Scholar] [CrossRef]
- Panagos, P.; Meusburger, K.; Ballabio, C.; Borrelli, P.; Alewell, C. Soil erodibility in Europe: A high-resolution dataset based on LUCAS. Sci. Total Environ. 2014, 479, 189–200. [Google Scholar] [CrossRef] [PubMed]
- Panagos, P.; Borrelli, P.; Meusburger, K. A new European slope length and steepness factor (LS-factor) for modeling soil erosion by water. Geosciences 2015, 5, 117–126. [Google Scholar] [CrossRef] [Green Version]
- Panagos, P.; Ballabio, C.; Borrelli, P.; Meusburger, K.; Klik, A.; Rousseva, S.; Tadić, M.P.; Michaelides, S.; Hrabalíková, M.; Olsen, P.; et al. Rainfall erosivity in Europe. Sci. Total Environ. 2015, 511, 801–814. [Google Scholar] [CrossRef] [Green Version]
- Copernicus Copernicus Land Monitoring Service. Available online: https://land.copernicus.eu/pan-european/corine-land-cover (accessed on 6 January 2019).
- Borrelli, P.; Panagos, P. An indicator to reflect the mitigating effect of Common Agricultural Policy on soil erosion. Land Use Policy 2020, 92, 104467. [Google Scholar] [CrossRef]
- Panagos, P.; Borrelli, P.; Meusburger, K.; Alewell, C.; Lugato, E.; Montanarella, L. Estimating the soil erosion cover-management factor at the European scale. Land Use Policy 2015, 48, 38–50. [Google Scholar] [CrossRef]
- Panagos, P.; Borrelli, P.; Meusburger, K.; van der Zanden, E.H.; Poesen, J.; Alewell, C. Modelling the effect of support practices (P-factor) on the reduction of soil erosion by water at European scale. Environ. Sci. Policy 2015, 51, 23–34. [Google Scholar] [CrossRef]
- Blanco-Canqui, H.; Lal, R. Principles of Soil Conservation and Management; Springer: Berlin, Germany, 2010; ISBN 9789048185290. [Google Scholar]
- López-Vicente, M.; Navas, A. Predicting soil erosion with RUSLE in mediterranean agricultural systems at catchment scale. Soil Sci. 2009, 174, 272–282. [Google Scholar] [CrossRef] [Green Version]
- Gallego, J.; Delincé, J. The European Land Use and Cover Area-Frame Statistical Survey. In Agricultural Survey Methods; John Wiley & Sons: Hoboken, NJ, USA, 2010; pp. 149–168. [Google Scholar]
- Orgiazzi, A.; Ballabio, C.; Panagos, P.; Jones, A.; Fernández-Ugalde, O. LUCAS Soil, the largest expandable soil dataset for Europe: A review. Eur. J. Soil Sci. 2018, 69, 140–153. [Google Scholar] [CrossRef] [Green Version]
- Rickson, R.J. Can control of soil erosion mitigate water pollution by sediments? Sci. Total Environ. 2014, 468, 1187–1197. [Google Scholar] [CrossRef]
- Maetens, W.; Poesen, J.; Vanmaercke, M. How effective are soil conservation techniques in reducing plot runoff and soil loss in Europe and the Mediterranean? Earth-Sci. Rev. 2012, 115, 21–36. [Google Scholar] [CrossRef] [Green Version]
- Vogel, E.; Deumlich, D.; Kaupenjohann, M. Bioenergy maize and soil erosion-Risk assessment and erosion control concepts. Geoderma 2016, 261, 80–92. [Google Scholar] [CrossRef]
- Van Der Zanden, E.H.; Verburg, P.H.; Mücher, C.A. Modelling the spatial distribution of linear landscape elements in Europe. Ecol. Indic. 2013, 27, 125–136. [Google Scholar] [CrossRef]
- Yli-Viikari, A.; Hietala-Koivu, R.; Huusela-Veistola, E.; Hyvönen, T.; Perälä, P.; Turtola, E. Evaluating agri-environmental indicators (AEIs)-Use and limitations of international indicators at national level. Ecol. Indic. 2007, 7, 150–163. [Google Scholar] [CrossRef]
- Gobin, A.; Jones, R.; Kirkby, M.; Campling, P.; Govers, G.; Kosmas, C.; Gentile, A.R. Indicators for pan-European assessment and monitoring of soil erosion by water. Environ. Sci. Policy 2004, 7, 25–38. [Google Scholar] [CrossRef]
- Parris, K. Environmental indicators for agriculture: Overview in OECD countries. In Environmental Indicators and Agricultural Policy; CABI: Oxford, UK, 1999; pp. 25–44. [Google Scholar]
- Becker, S.O.; Egger, P.H.; von Ehrlich, M. Going NUTS: The effect of EU Structural Funds on regional performance. J. Public Econ. 2010, 94, 578–590. [Google Scholar] [CrossRef] [Green Version]
- Borrelli, P.; Van Oost, K.; Meusburger, K.; Alewell, C.; Lugato, E.; Panagos, P. A step towards a holistic assessment of soil degradation in Europe: Coupling on-site erosion with sediment transfer and carbon fluxes. Environ. Res. 2018, 161, 291–298. [Google Scholar] [CrossRef]
- Panagos, P.; Standardi, G.; Borrelli, P.; Lugato, E.; Montanarella, L.; Bosello, F. Cost of agricultural productivity loss due to soil erosion in the European Union: From direct cost evaluation approaches to the use of macroeconomic models. L. Degrad. Dev. 2018, 29, 471–484. [Google Scholar] [CrossRef]
- Panagos, P.; Meusburger, K.; Van Liedekerke, M.; Alewell, C.; Hiederer, R.; Montanarella, L. Assessing soil erosion in Europe based on data collected through a European network. Soil Sci. Plant Nutr. 2014, 60, 15–29. [Google Scholar] [CrossRef] [Green Version]
- Panagos, P.; Ballabio, C.; Meusburger, K.; Spinoni, J.; Alewell, C.; Borrelli, P. Towards estimates of future rainfall erosivity in Europe based on REDES and WorldClim datasets. J. Hydrol. 2017, 548, 251–262. [Google Scholar] [CrossRef]
- Estrada-Carmona, N.; Harper, E.B.; DeClerck, F.; Fremier, A.K. Quantifying model uncertainty to improve watershed-level ecosystem service quantification: A global sensitivity analysis of the RUSLE. Int. J. Biodivers. Sci. Ecosyst. Serv. Manag. 2017, 13, 40–50. [Google Scholar] [CrossRef]
- Langford, W.T.; Gergel, S.E.; Dietterich, T.G.; Cohen, W. Map misclassification can cause large errors in landscape pattern indices: Examples from habitat fragmentation. Ecosystems 2006, 9, 474–488. [Google Scholar] [CrossRef]
- Buttner, G. CORINE Land Cover and land cover change products. Remote Sens. Digit. Image Process 2014, 18, 55–74. [Google Scholar]
- Poesen, J. Soil erosion in the Anthropocene: Research needs. Earth Surf. Process. Landforms 2018, 84, 64–84. [Google Scholar] [CrossRef]
- Panagos, P.; Karydas, C.; Borrelli, P.; Ballabio, C.; Meusburger, K. Advances in soil erosion modelling through remote sensing data availability at European scale. In Second International Conference on Remote Sensing and Geoinformation of the Environment (RSCy2014); International Society for Optics and Photonics: Bellingham, DC, USA, 2014; Volume 9229. [Google Scholar]
- Borrelli, P.; Meusburger, K.; Ballabio, C.; Panagos, P.; Alewell, C. Object-oriented soil erosion modelling: A possible paradigm shift from potential to actual risk assessments in agricultural environments. L. Degrad. Dev. 2018, 29, 1270–1281. [Google Scholar] [CrossRef]
- Gelder, B.; Sklenar, T.; James, D.; Herzmann, D.; Cruse, R.; Gesch, K.; Laflen, J. The Daily Erosion Project–daily estimates of water runoff, soil detachment, and erosion. Earth Surf. Process. Landforms 2018, 43, 1105–1117. [Google Scholar] [CrossRef]
- Vrieling, A. Satellite remote sensing for water erosion assessment: A review. Catena 2006, 65, 2–18. [Google Scholar] [CrossRef]
- Borrelli, P.; Lugato, E.; Montanarella, L.; Panagos, P. A New Assessment of Soil Loss Due to Wind Erosion in European Agricultural Soils Using a Quantitative Spatially Distributed Modelling Approach. L. Degrad. Dev. 2017, 28, 335–344. [Google Scholar] [CrossRef] [Green Version]
- Borrelli, P.; Panagos, P.; Märker, M.; Modugno, S.; Schütt, B. Assessment of the impacts of clear-cutting on soil loss by water erosion in Italian forests: First comprehensive monitoring and modelling approach. Catena 2017, 149, 770–781. [Google Scholar] [CrossRef]
- Bagarello, V.; Ferro, V.; Giordano, G.; Mannocchi, F.; Todisco, F.; Vergni, L. Predicting event soil loss from bare plots at two Italian sites. Catena 2013, 109, 96–102. [Google Scholar] [CrossRef]
- Wakatsuki, T.; Rasyidin, A. Rates of weathering and soil formation. Geoderma 1992, 52, 251–263. [Google Scholar] [CrossRef]
- Verheijen, F.G.A.; Jones, R.J.A.; Rickson, R.J.; Smith, C.J. Tolerable versus actual soil erosion rates in Europe. Earth-Sci. Rev. 2009, 94, 23–38. [Google Scholar] [CrossRef] [Green Version]
- Egli, M.; Dahms, D.; Norton, K. Soil formation rates on silicate parent material in alpine environments: Different approaches-different results? Geoderma 2014, 213, 320–333. [Google Scholar] [CrossRef] [Green Version]
- Onnen, N.; Heckrath, G.; Stevens, A.; Olsen, P.; Greve, M.B.; Pullens, J.W.M.; Kronvang, B.; Van Oost, K. Distributed water erosion modelling at fine spatial resolution across Denmark. Geomorphology 2019, 342, 150–162. [Google Scholar] [CrossRef]
- Borrelli, P.; Paustian, K.; Panagos, P.; Jones, A.; Schütt, B.; Lugato, E. Effect of Good Agricultural and Environmental Conditions on erosion and soil organic carbon balance: A national case study. Land Use policy 2016, 50, 408–421. [Google Scholar] [CrossRef]
- Lilja, H.; Hyväluoma, J.; Puustinen, M.; Uusi-Kämppä, J.; Turtola, E. Evaluation of RUSLE2015 erosion model for boreal conditions. Geoderma Reg. 2017, 10, 77–84. [Google Scholar] [CrossRef]
- Puustinen, M.; Turtola, E.; Kukkonen, M.; Koskiaho, J.; Linjama, J.; Niinioja, R.; Tattari, S. VIHMA-A tool for allocation of measures to control erosion and nutrient loading from Finnish agricultural catchments. Agric. Ecosyst. Environ. 2010, 138, 306–317. [Google Scholar] [CrossRef]
- Honek, D.; Caletka, M. Longtherm and event-based modelling of soil water erosion in small catchments. Int. Multidiscip. Sci. GeoConference Surv. Geol. Min. Ecol. Manag. SGEM 2019, 13, 339–346. [Google Scholar]
- Roşian, G.; Csaba, H.; Kinga-Olga, R.; Boţan, C.N.; Gavrilă, I.G. Assessing landslide vulnerability using bivariate statistical analysis and the frequency ratio model. Case study: Transylvanian Plain (Romania). Zeitschrift Für Geomorphol. 2016, 60, 359–371. [Google Scholar] [CrossRef]
- Abdelwahab, O.M.M.; Ricci, G.F.; De Girolamo, A.M.; Gentile, F. Modelling soil erosion in a Mediterranean watershed: Comparison between SWAT and AnnAGNPS models. Environ. Res. 2018, 116, 363–376. [Google Scholar] [CrossRef]
- Jakubínský, J.; Pechanec, V.; Procházka, J.; Cudlín, P. Modelling of soil erosion and accumulation in an agricultural landscape-A comparison of selected approaches applied at the small stream basin level in the Czech Republic. Water 2019, 11, 404. [Google Scholar] [CrossRef] [Green Version]
- Sánchez, Y.; Martínez-Graña, A.; Santos-Francés, F.; Yenes, M. Influence of the sediment delivery ratio index on the analysis of silting and break risk in the Plasencia reservoir (Central System, Spain). Nat. Hazards 2018, 91, 1407–1421. [Google Scholar] [CrossRef]
- Pavanelli, D.; Cavazza, C. River suspended sediment control through riparian vegetation: A method to detect the functionality of riparian vegetation. Clean-Soil. Air Water 2010, 38, 1039–1046. [Google Scholar] [CrossRef]
- Panagopoulos, Y.; Dimitriou, E.; Skoulikidis, N. Vulnerability of a northeast Mediterranean island to soil loss. Can grazing management mitigate erosion? Water 2019, 11, 1491. [Google Scholar] [CrossRef] [Green Version]
- Eekhout, J.P.; De Vente, J. How soil erosion model conceptualization affects soil loss projections under climate change. Prog. Phys. Geogr. Earth Environ. 2019, 0309133319. [Google Scholar] [CrossRef]
- Latocha, A.; Szymanowski, M.; Jeziorska, J.; Stec, M.; Roszczewska, M. Effects of land abandonment and climate change on soil erosion-An example from depopulated agricultural lands in the Sudetes Mts., SW Poland. Catena 2016, 145, 128–141. [Google Scholar] [CrossRef]
- Ferreira, V.; Panagopoulos, T. Seasonality of soil erosion under Mediterranean conditions at the Alqueva dam watershed. Environ. Manag. 2014, 54, 67–83. [Google Scholar] [CrossRef]
- Mancino, G.; Nolè, A.; Salvati, L.; Ferrara, A. In-between forest expansion and cropland decline: A revised USLE model for soil erosion risk under land-use change in a Mediterranean region. Ecol. Indic. 2016, 71, 544–550. [Google Scholar] [CrossRef]
- Napoli, M.; Cecchi, S.; Orlandini, S.; Mugnai, G.; Zanchi, C.A. Simulation of field-measured soil loss in Mediterranean hilly areas (Chianti, Italy) with RUSLE. Catena 2016, 145, 246–256. [Google Scholar] [CrossRef]
- Rellini, I.; Scopesi, C.; Olivari, S.; Firpo, M.; Maerker, M. Assessment of soil erosion risk in a typical mediterranean environment using a high resolution RUSLE approach (Portofino promontory, NW-Italy). J. Maps 2019, 15, 356–362. [Google Scholar] [CrossRef]
- Efthimiou, N.; Psomiadis, E.; Panagos, P. Fire severity and soil erosion susceptibility mapping using multi-temporal Earth Observation data: The case of Mati fatal wildfire in Eastern Attica, Greece. Catena 2020, 187, 104320. [Google Scholar] [CrossRef] [PubMed]
- Biddoccu, M.; Zecca, O.; Audisio, C.; Godone, F.; Barmaz, A.; Cavallo, E. Assessment of Long-Term Soil Erosion in a Mountain Vineyard, Aosta Valley (NW Italy). L. Degrad. Dev. 2018, 29, 617–629. [Google Scholar] [CrossRef]


| Country | Number of Observations with Presence of Grass Margins | Total No. of Observations (2015) | Density (%) in 2015 | |||
|---|---|---|---|---|---|---|
| Name | Code | 2012 | 2015 | % Difference 2012–2015 | ||
| Austria | AT | 1593 | 1634 | 2.6% | 5241 | 31.2% |
| Belgium | BE | 1014 | 942 | −7.1% | 2133 | 44.2% |
| Bulgaria | BG | 1319 | 1287 | −2.4% | 5153 | 25.0% |
| Cyprus | CY | 164 | 193 | 17.7% | 1224 | 15.8% |
| Czechia | CZ | 784 | 843 | 7.5% | 5358 | 15.7% |
| Germany | DE | 7416 | 7768 | 4.7% | 23,177 | 33.5% |
| Denmark | DK | 995 | 1204 | 21.0% | 3262 | 36.9% |
| Estonia | EE | 273 | 272 | −0.4% | 1583 | 17.2% |
| Greece | GR | 1379 | 1504 | 9.1% | 6223 | 24.2% |
| Spain | ES | 9020 | 9663 | 7.1% | 29,990 | 32.2% |
| Finland | FI | 2080 | 2542 | 22.2% | 11,517 | 22.1% |
| France | FR | 12,161 | 13,130 | 8.0% | 33,713 | 38.9% |
| Croatia | HR | 319 | 2487 | 12.8% | ||
| Hungary | HU | 1084 | 1156 | 6.6% | 4225 | 27.4% |
| Ireland | IE | 419 | 642 | 53.2% | 2524 | 25.4% |
| Italy | IT | 5256 | 5475 | 4.2% | 15,723 | 34.8% |
| Lithuania | LT | 619 | 648 | 4.7% | 3457 | 18.7% |
| Luxembourg | LU | 77 | 74 | −3.9% | 188 | 39.4% |
| Latvia | LV | 403 | 507 | 25.8% | 3475 | 14.6% |
| Malta | MT | 20 | 21 | 5.0% | 69 | 30.4% |
| Netherlands | NL | 714 | 659 | −7.7% | 1958 | 33.7% |
| Poland | PL | 5599 | 6160 | 10.0% | 19,231 | 32.0% |
| Portugal | PT | 1131 | 1257 | 11.1% | 5758 | 21.8% |
| Romania | RO | 1948 | 2071 | 6.3% | 9759 | 21.2% |
| Sweden | SE | 1891 | 2137 | 13.0% | 16,133 | 13.2% |
| Slovenia | SI | 300 | 372 | 24.0% | 1402 | 26.5% |
| Slovakia | SK | 295 | 350 | 18.6% | 2067 | 16.9% |
| United Kingdom | UK | 3270 | 3548 | 8.5% | 9114 | 38.9% |
| Total | 61,224 | 66,378 | 8.4% | 226,144 | 29.4% | |
| Country | Mean Soil Loss Rates (t ha−1 yr−1) for All Lands | Mean Soil Loss Rates (t ha−1 yr−1) in Arable Lands (CORINE Classes 21x) | |||||
|---|---|---|---|---|---|---|---|
| 2010 | 2016 | Change (%) | 2010 | 2016 | Change (%) | ||
| Austria | AT | 7.19 | 7.19 | −0.1% | 3.97 | 3.79 | −4.5% |
| Belgium | BE | 1.22 | 1.22 | 0.1% | 2.06 | 2.04 | −0.8% |
| Bulgaria | BG | 2.05 | 2.18 | 5.9% | 2.47 | 2.79 | 12.6% |
| Cyprus | CY | 2.89 | 2.99 | 3.3% | 1.85 | 1.84 | −0.6% |
| Czechia | CZ | 1.65 | 1.63 | −0.7% | 2.52 | 2.52 | 0.0% |
| Germany | DE | 1.25 | 1.23 | −1.9% | 1.75 | 1.69 | −3.5% |
| Denmark | DK | 0.50 | 0.47 | −5.7% | 0.61 | 0.57 | −6.8% |
| Estonia | EE | 0.21 | 0.19 | −6.8% | 0.70 | 0.62 | −11.0% |
| Greece | EL | 4.13 | 4.19 | 1.6% | 2.77 | 2.90 | 4.8% |
| Spain | ES | 3.94 | 4.00 | 1.5% | 4.27 | 4.34 | 1.7% |
| Finland | FI | 0.06 | 0.06 | −0.4% | 0.46 | 0.46 | −1.1% |
| France | FR | 2.25 | 2.20 | −2.4% | 1.99 | 1.83 | −8.2% |
| Croatia | HR | 3.16 | 2.41 | −23.7% | 1.67 | 1.70 | 1.4% |
| Hungary | HU | 1.62 | 1.61 | −0.8% | 2.10 | 2.09 | −0.4% |
| Ireland | IE | 0.96 | 0.95 | −1.1% | 1.32 | 1.34 | 2.0% |
| Italy | IT | 8.46 | 8.59 | 1.5% | 8.38 | 8.62 | 2.8% |
| Lithuania | LT | 0.52 | 0.51 | −0.5% | 0.95 | 0.94 | −0.6% |
| Luxembourg | LU | 2.07 | 2.07 | −0.2% | 4.54 | 4.41 | −3.0% |
| Latvia | LV | 0.32 | 0.33 | 2.2% | 1.01 | 1.03 | 1.6% |
| Malta | MT | 6.02 | 4.47 | −25.7% | 15.93 | 9.49 | −40.5% |
| Netherlands | NL | 0.27 | 0.26 | −2.5% | 0.54 | 0.52 | −3.7% |
| Poland | PL | 0.96 | 0.99 | 2.3% | 1.61 | 1.66 | 3.3% |
| Portugal | PT | 2.31 | 2.17 | −6.0% | 2.94 | 2.75 | −6.5% |
| Romania | RO | 2.84 | 2.80 | −1.6% | 3.39 | 3.27 | −3.6% |
| Sweden | SE | 0.41 | 0.40 | −1.6% | 1.12 | 1.11 | −1.0% |
| Slovenia | SI | 7.43 | 7.46 | 0.3% | 4.63 | 4.60 | −0.7% |
| Slovakia | SK | 2.18 | 2.16 | −0.9% | 3.54 | 3.47 | −2.2% |
| United Kingdom | UK | 2.38 | 2.37 | −0.2% | 1.04 | 1.00 | −4.2% |
| European Union | EU | 2.46 | 2.45 | −0.4% | 2.67 | 2.65 | −0.8% |
| Year | <2 t/ha | >2 t/ha | 2–5 t/ha | 5–10 t/ha | >10 t/ha |
|---|---|---|---|---|---|
| 2010 | 75.6% | 24.4% | 12.8% | 6.3% | 5.3% |
| 2016 Difference | 75.8% (+0.2%) | 24.2% (+0.2%) | 12.8% (0%) | 6.2% (-0.1%) | 5.2% (-0.1%) |
© 2020 by the authors. Licensee MDPI, Basel, Switzerland. This article is an open access article distributed under the terms and conditions of the Creative Commons Attribution (CC BY) license (http://creativecommons.org/licenses/by/4.0/).
Share and Cite
Panagos, P.; Ballabio, C.; Poesen, J.; Lugato, E.; Scarpa, S.; Montanarella, L.; Borrelli, P. A Soil Erosion Indicator for Supporting Agricultural, Environmental and Climate Policies in the European Union. Remote Sens. 2020, 12, 1365. https://0-doi-org.brum.beds.ac.uk/10.3390/rs12091365
Panagos P, Ballabio C, Poesen J, Lugato E, Scarpa S, Montanarella L, Borrelli P. A Soil Erosion Indicator for Supporting Agricultural, Environmental and Climate Policies in the European Union. Remote Sensing. 2020; 12(9):1365. https://0-doi-org.brum.beds.ac.uk/10.3390/rs12091365
Chicago/Turabian StylePanagos, Panos, Cristiano Ballabio, Jean Poesen, Emanuele Lugato, Simone Scarpa, Luca Montanarella, and Pasquale Borrelli. 2020. "A Soil Erosion Indicator for Supporting Agricultural, Environmental and Climate Policies in the European Union" Remote Sensing 12, no. 9: 1365. https://0-doi-org.brum.beds.ac.uk/10.3390/rs12091365