Object-Based Analysis Using Unmanned Aerial Vehicles (UAVs) for Site-Specific Landslide Assessment


Abstract
:1. Introduction
2. Remote Sensing Evolution in Landslide Monitoring
3. Data Collection
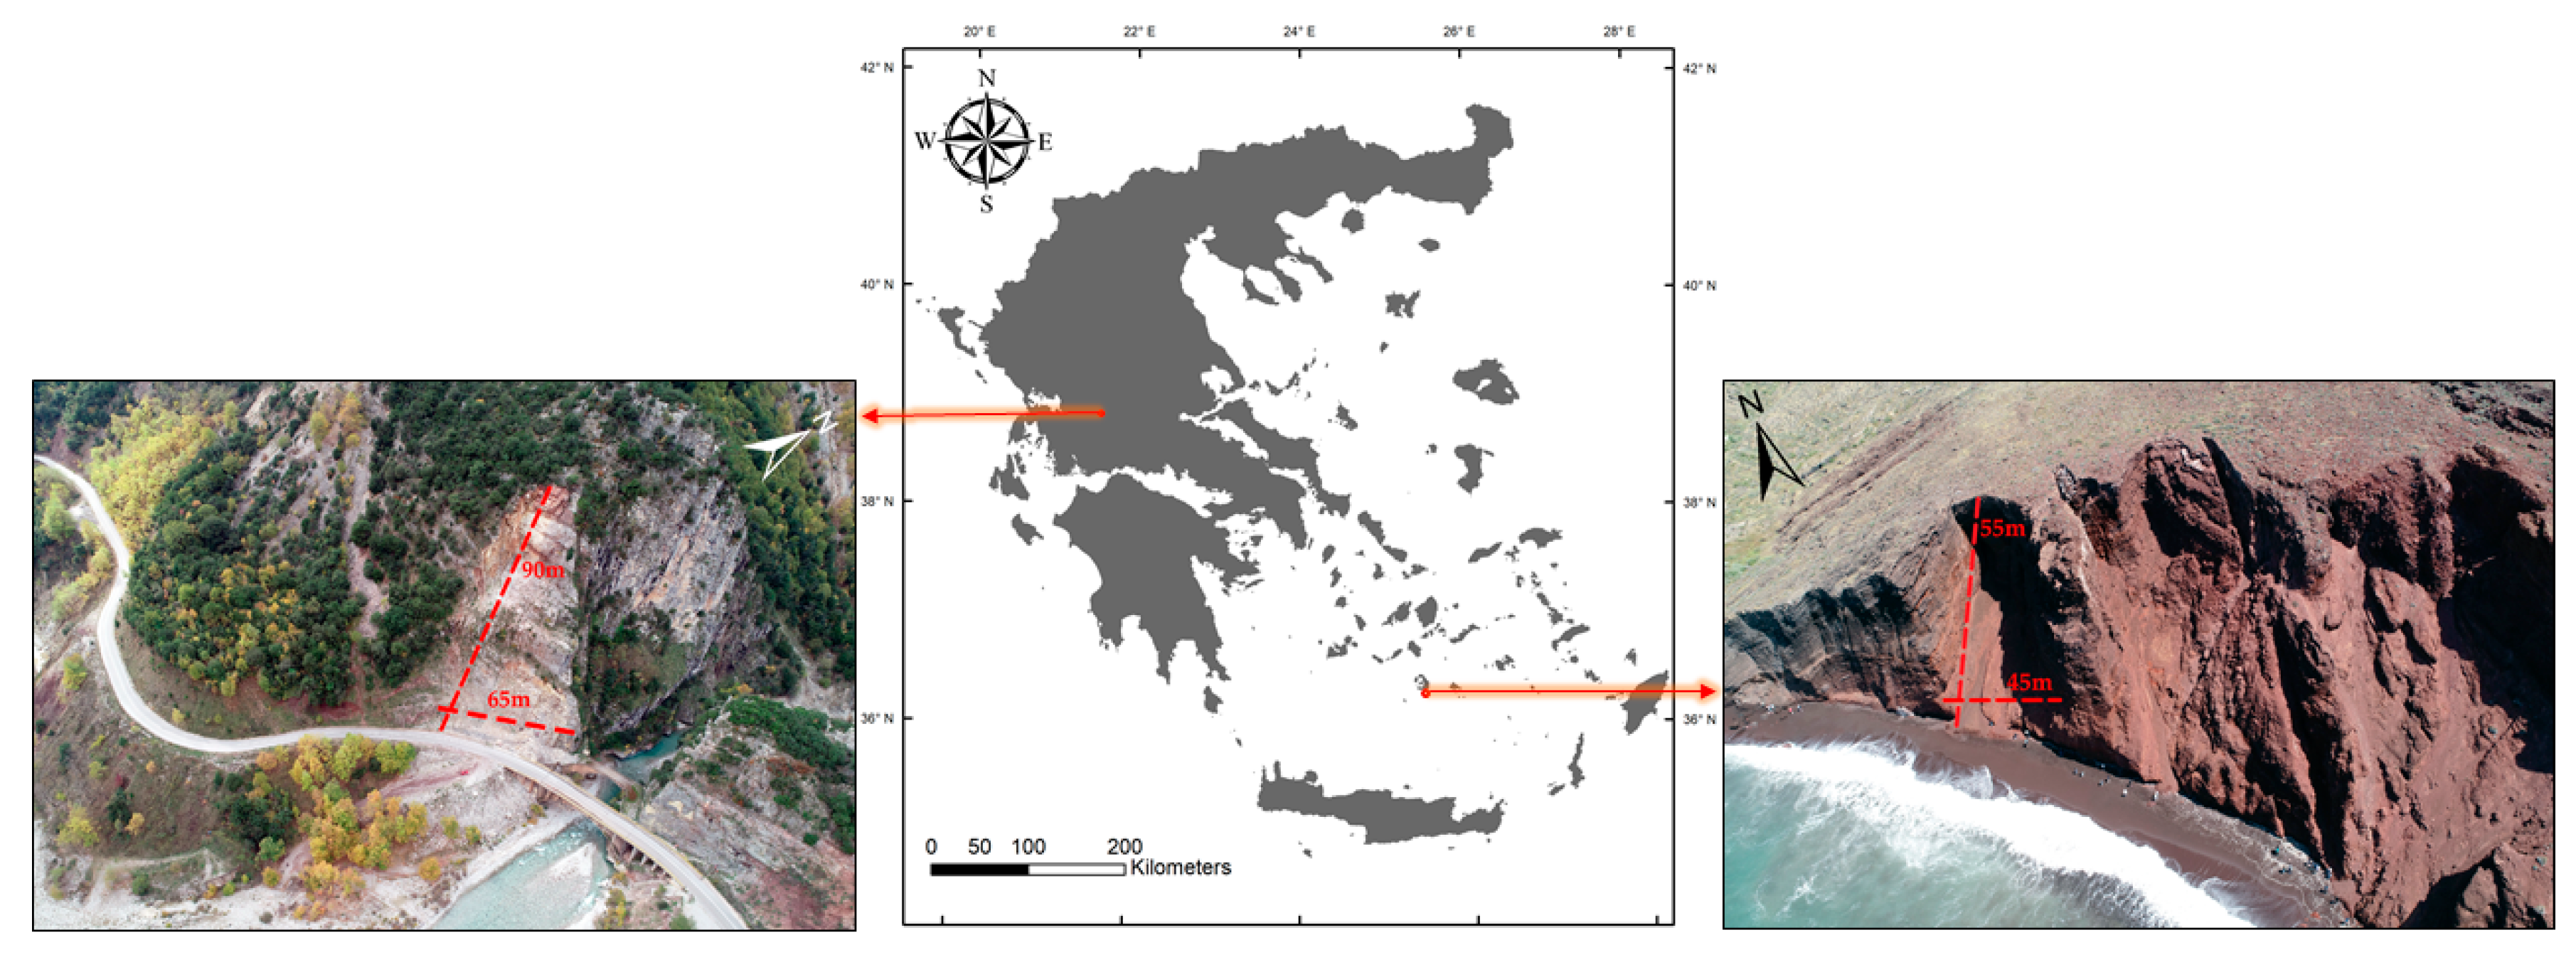
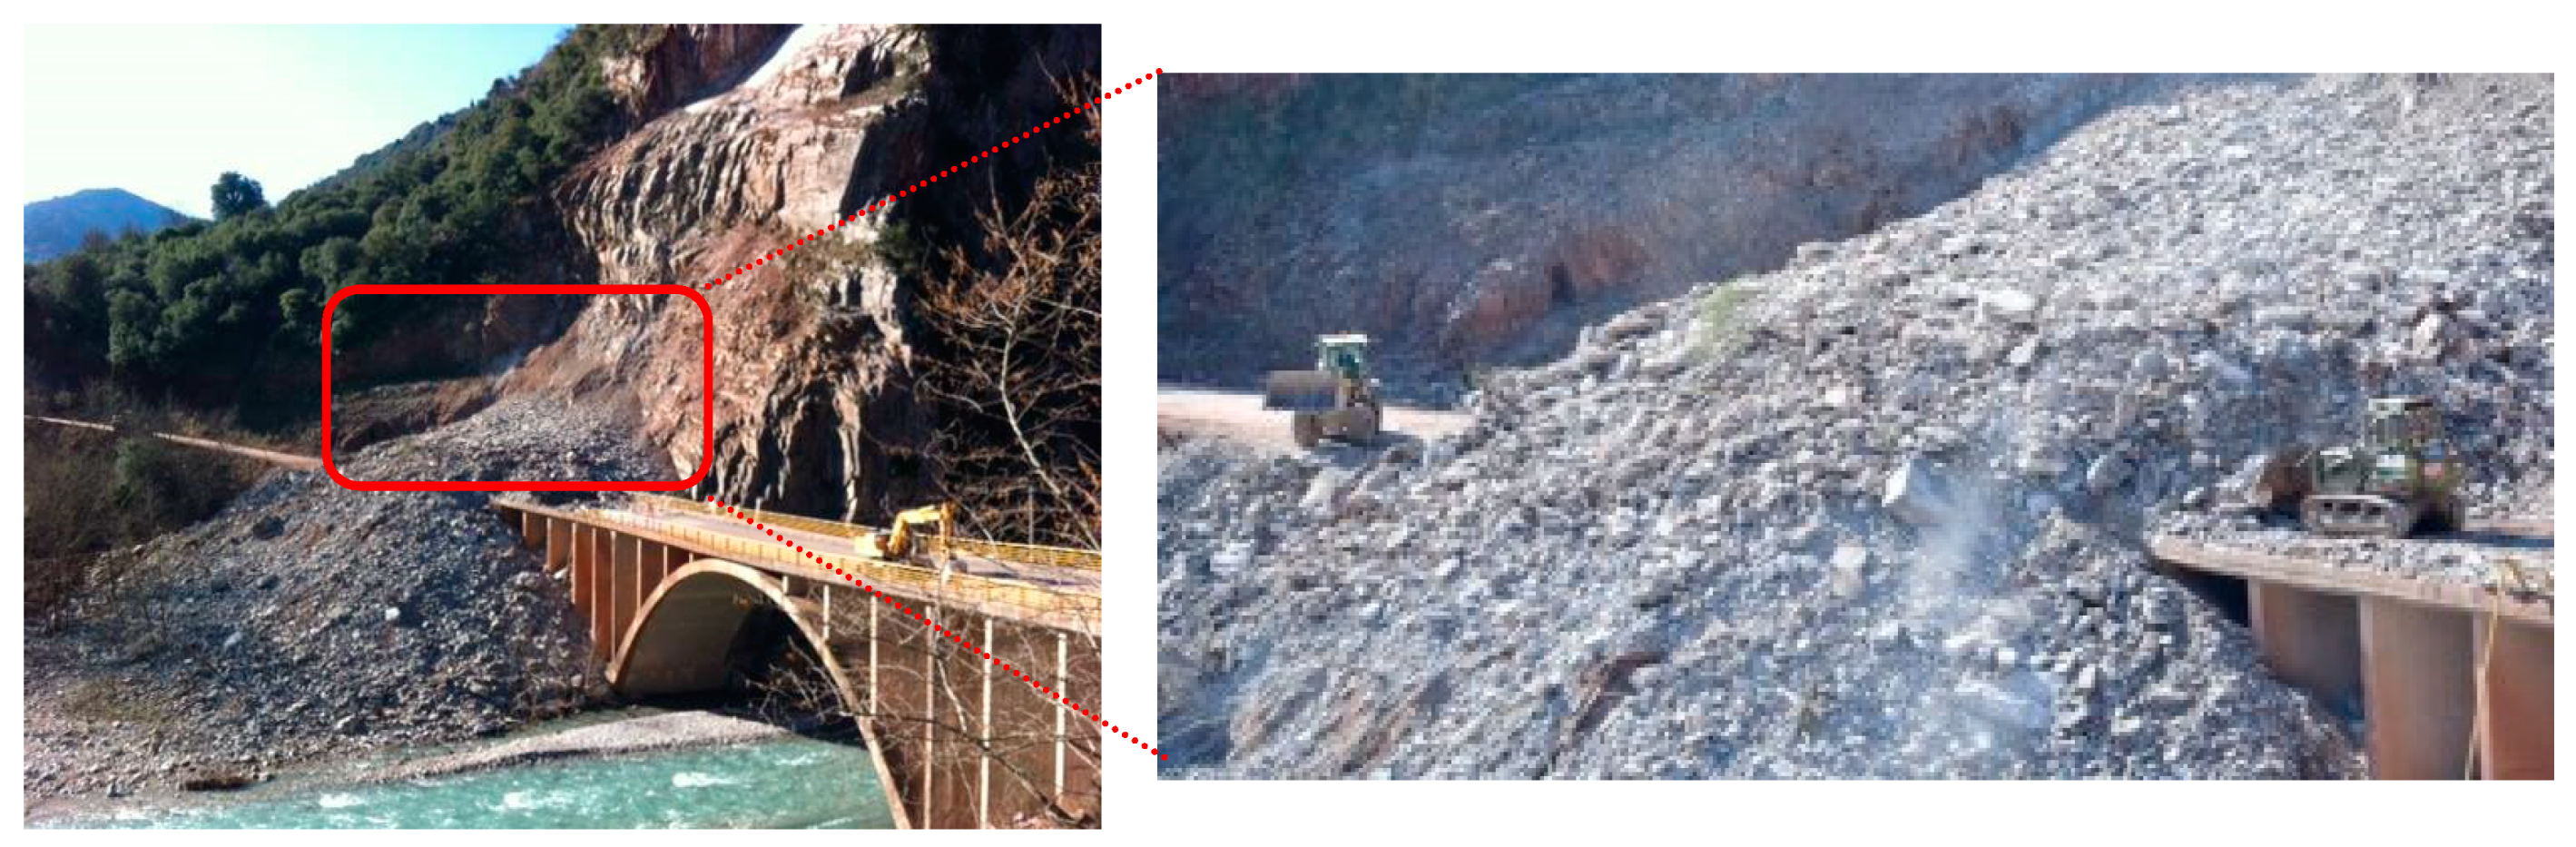
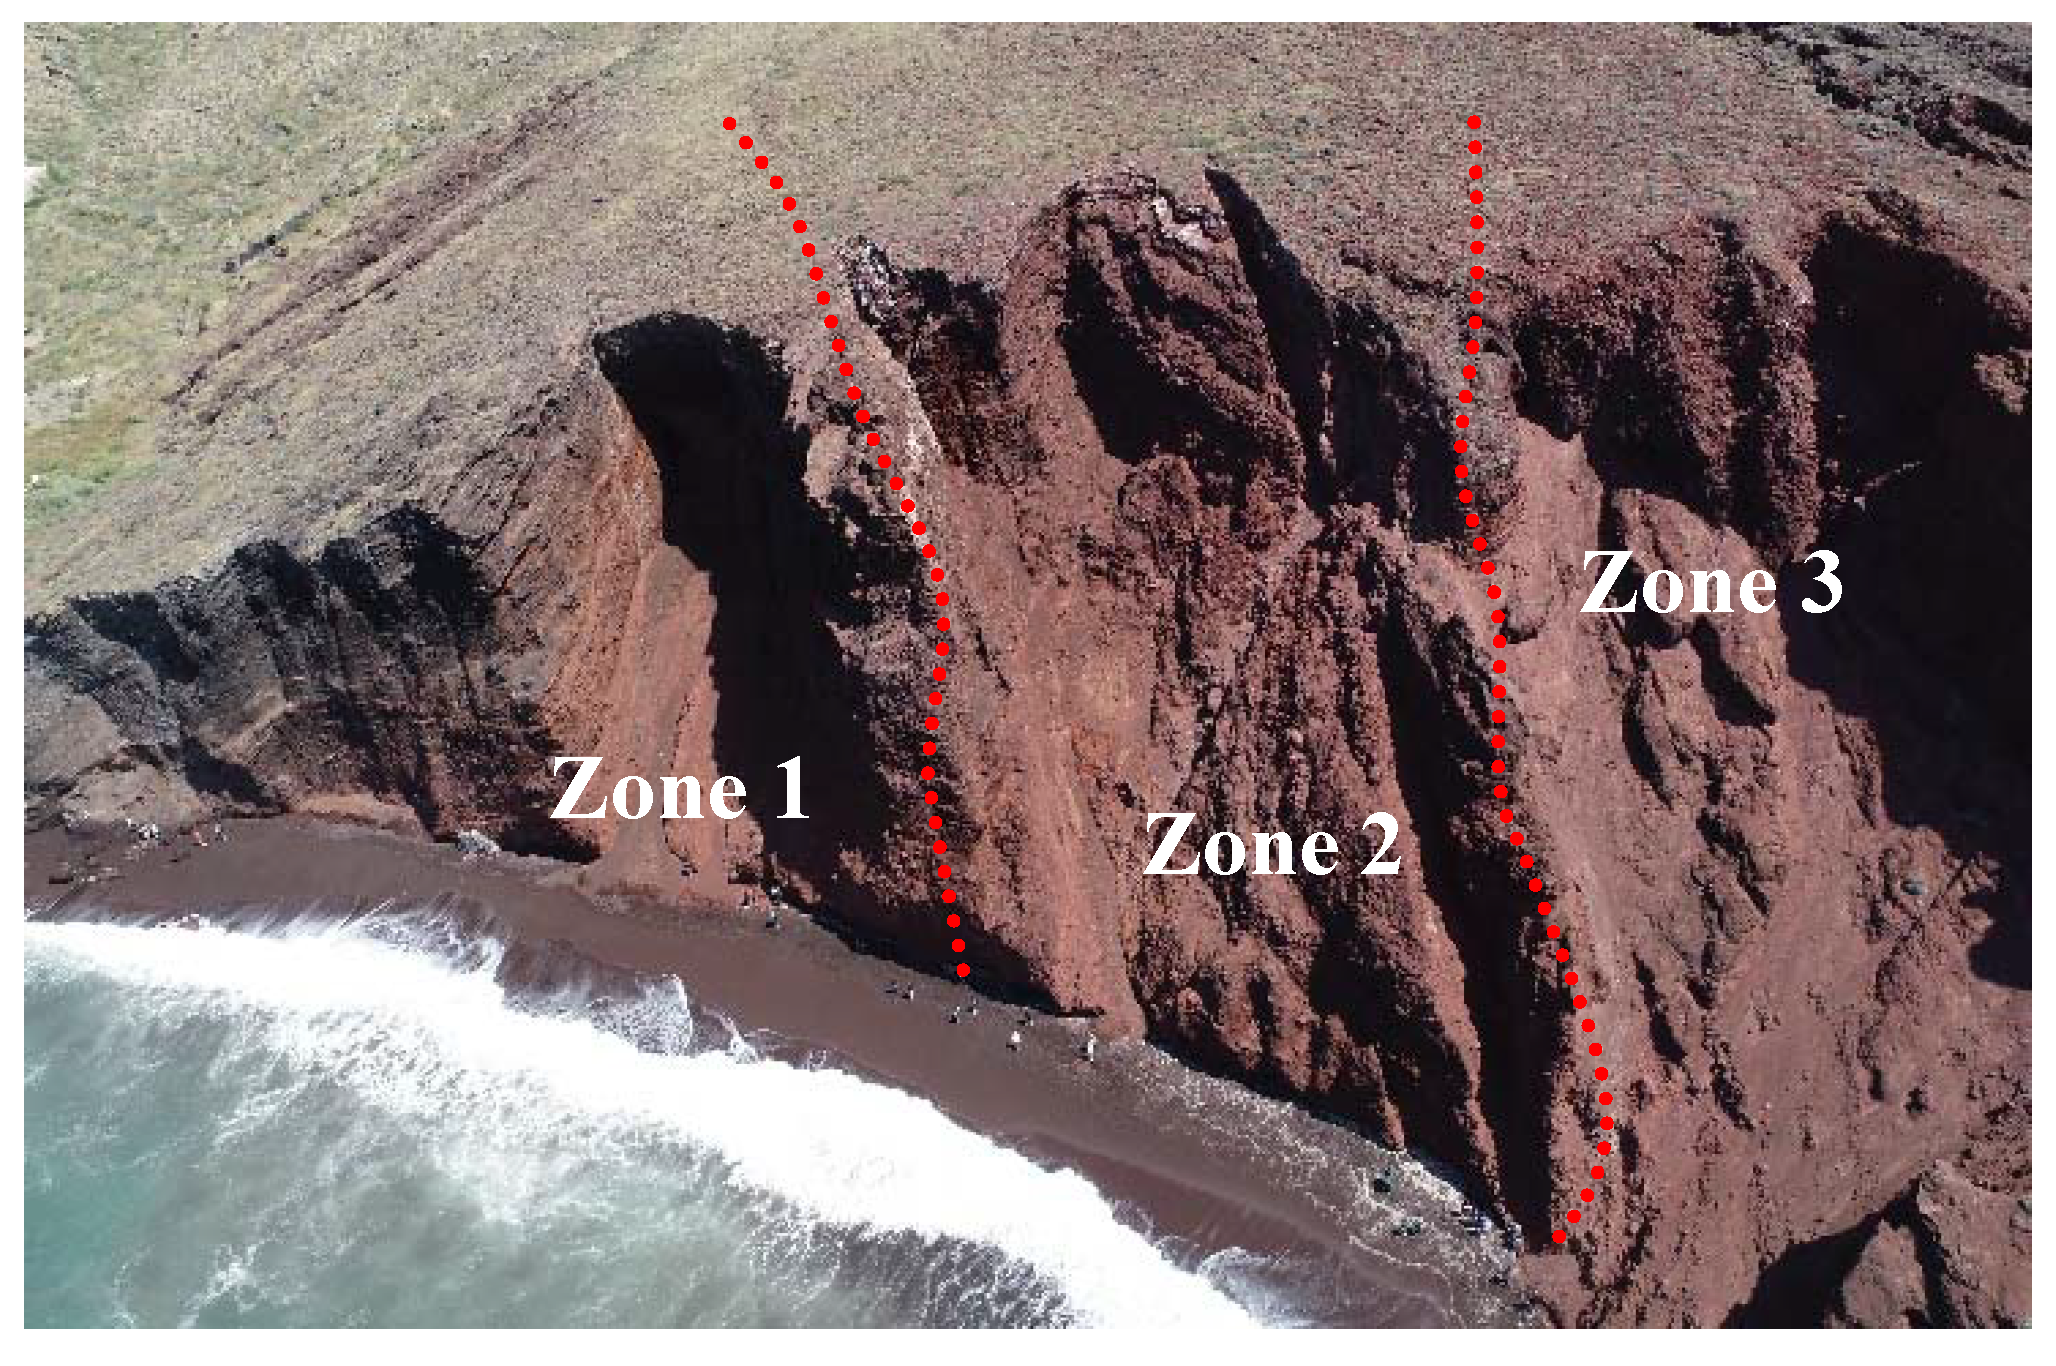
3.1. Study Areas
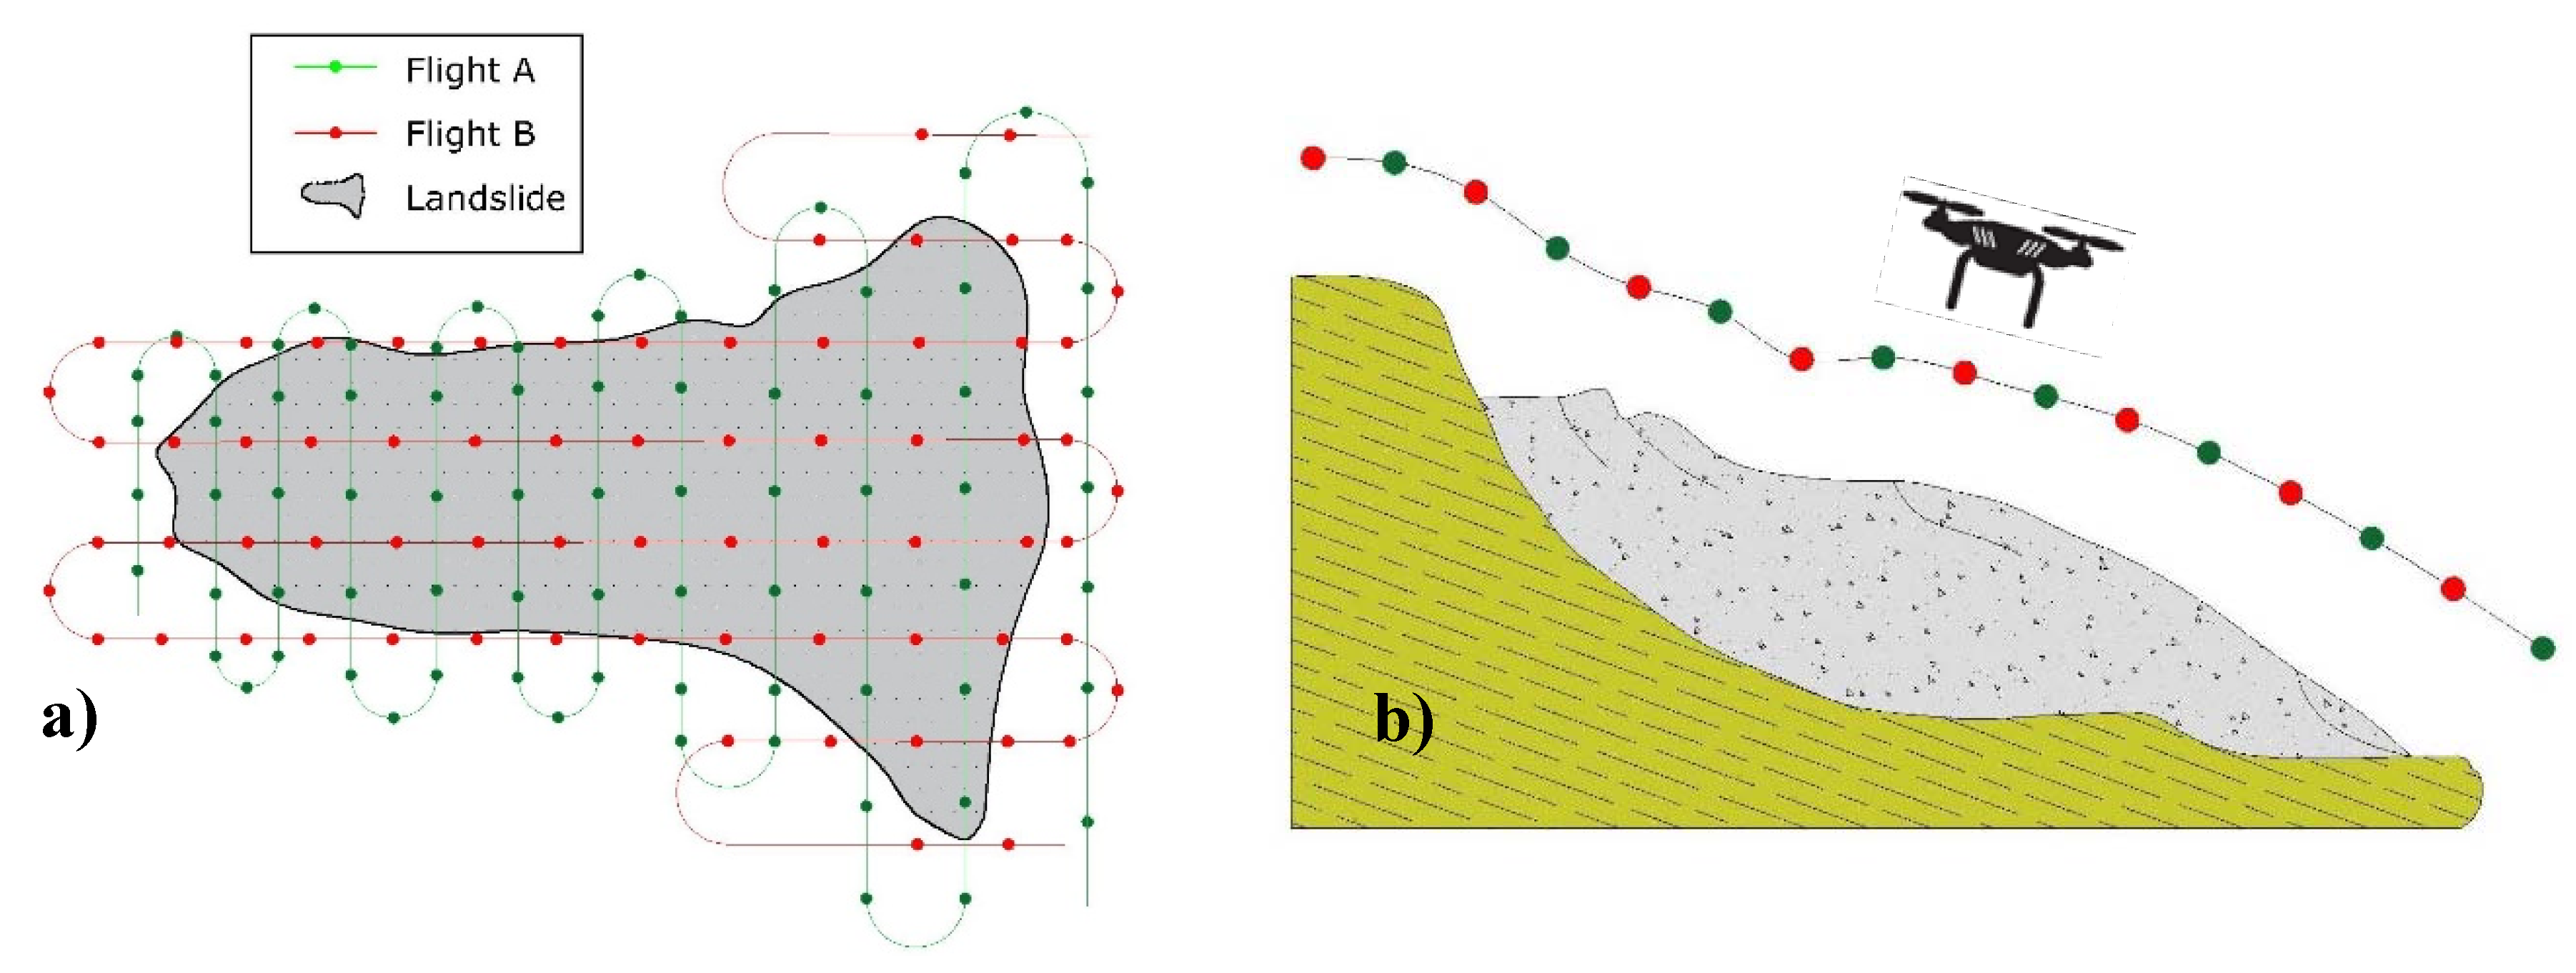
3.2. Data Planning and Collection
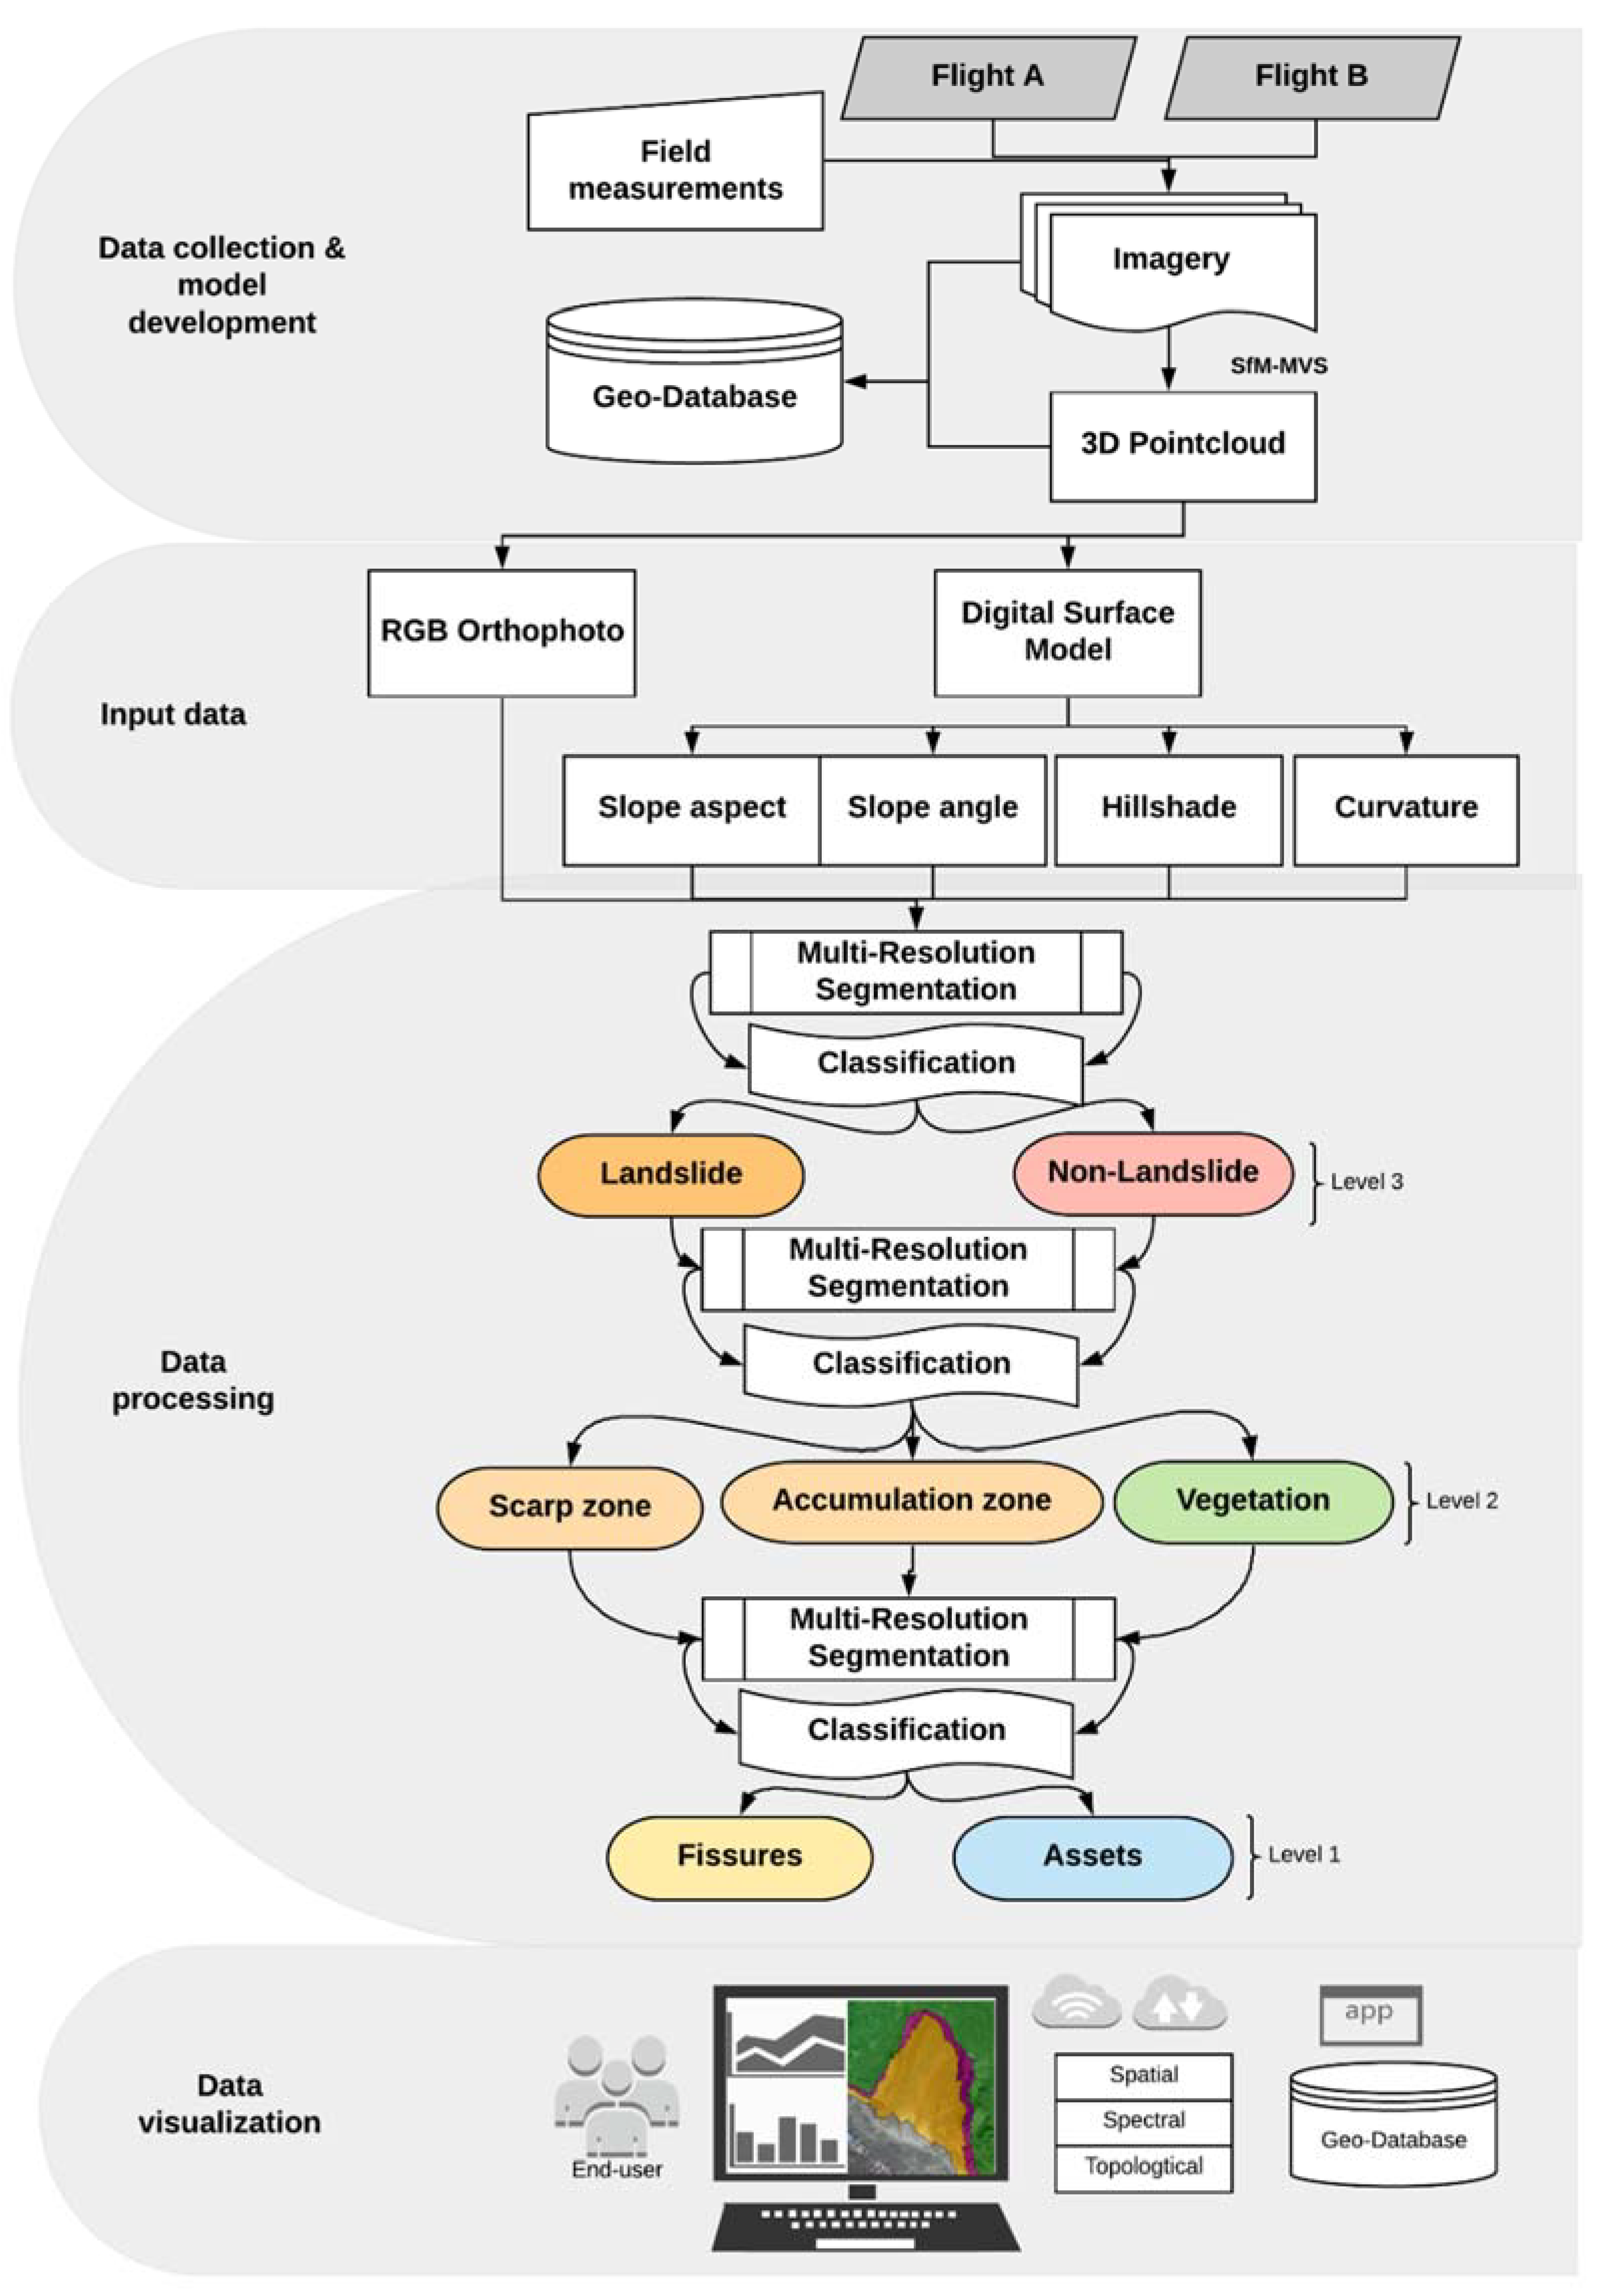
4. Object-Based Image Analysis (OBIA) Methodology
4.1. Pre-Processing
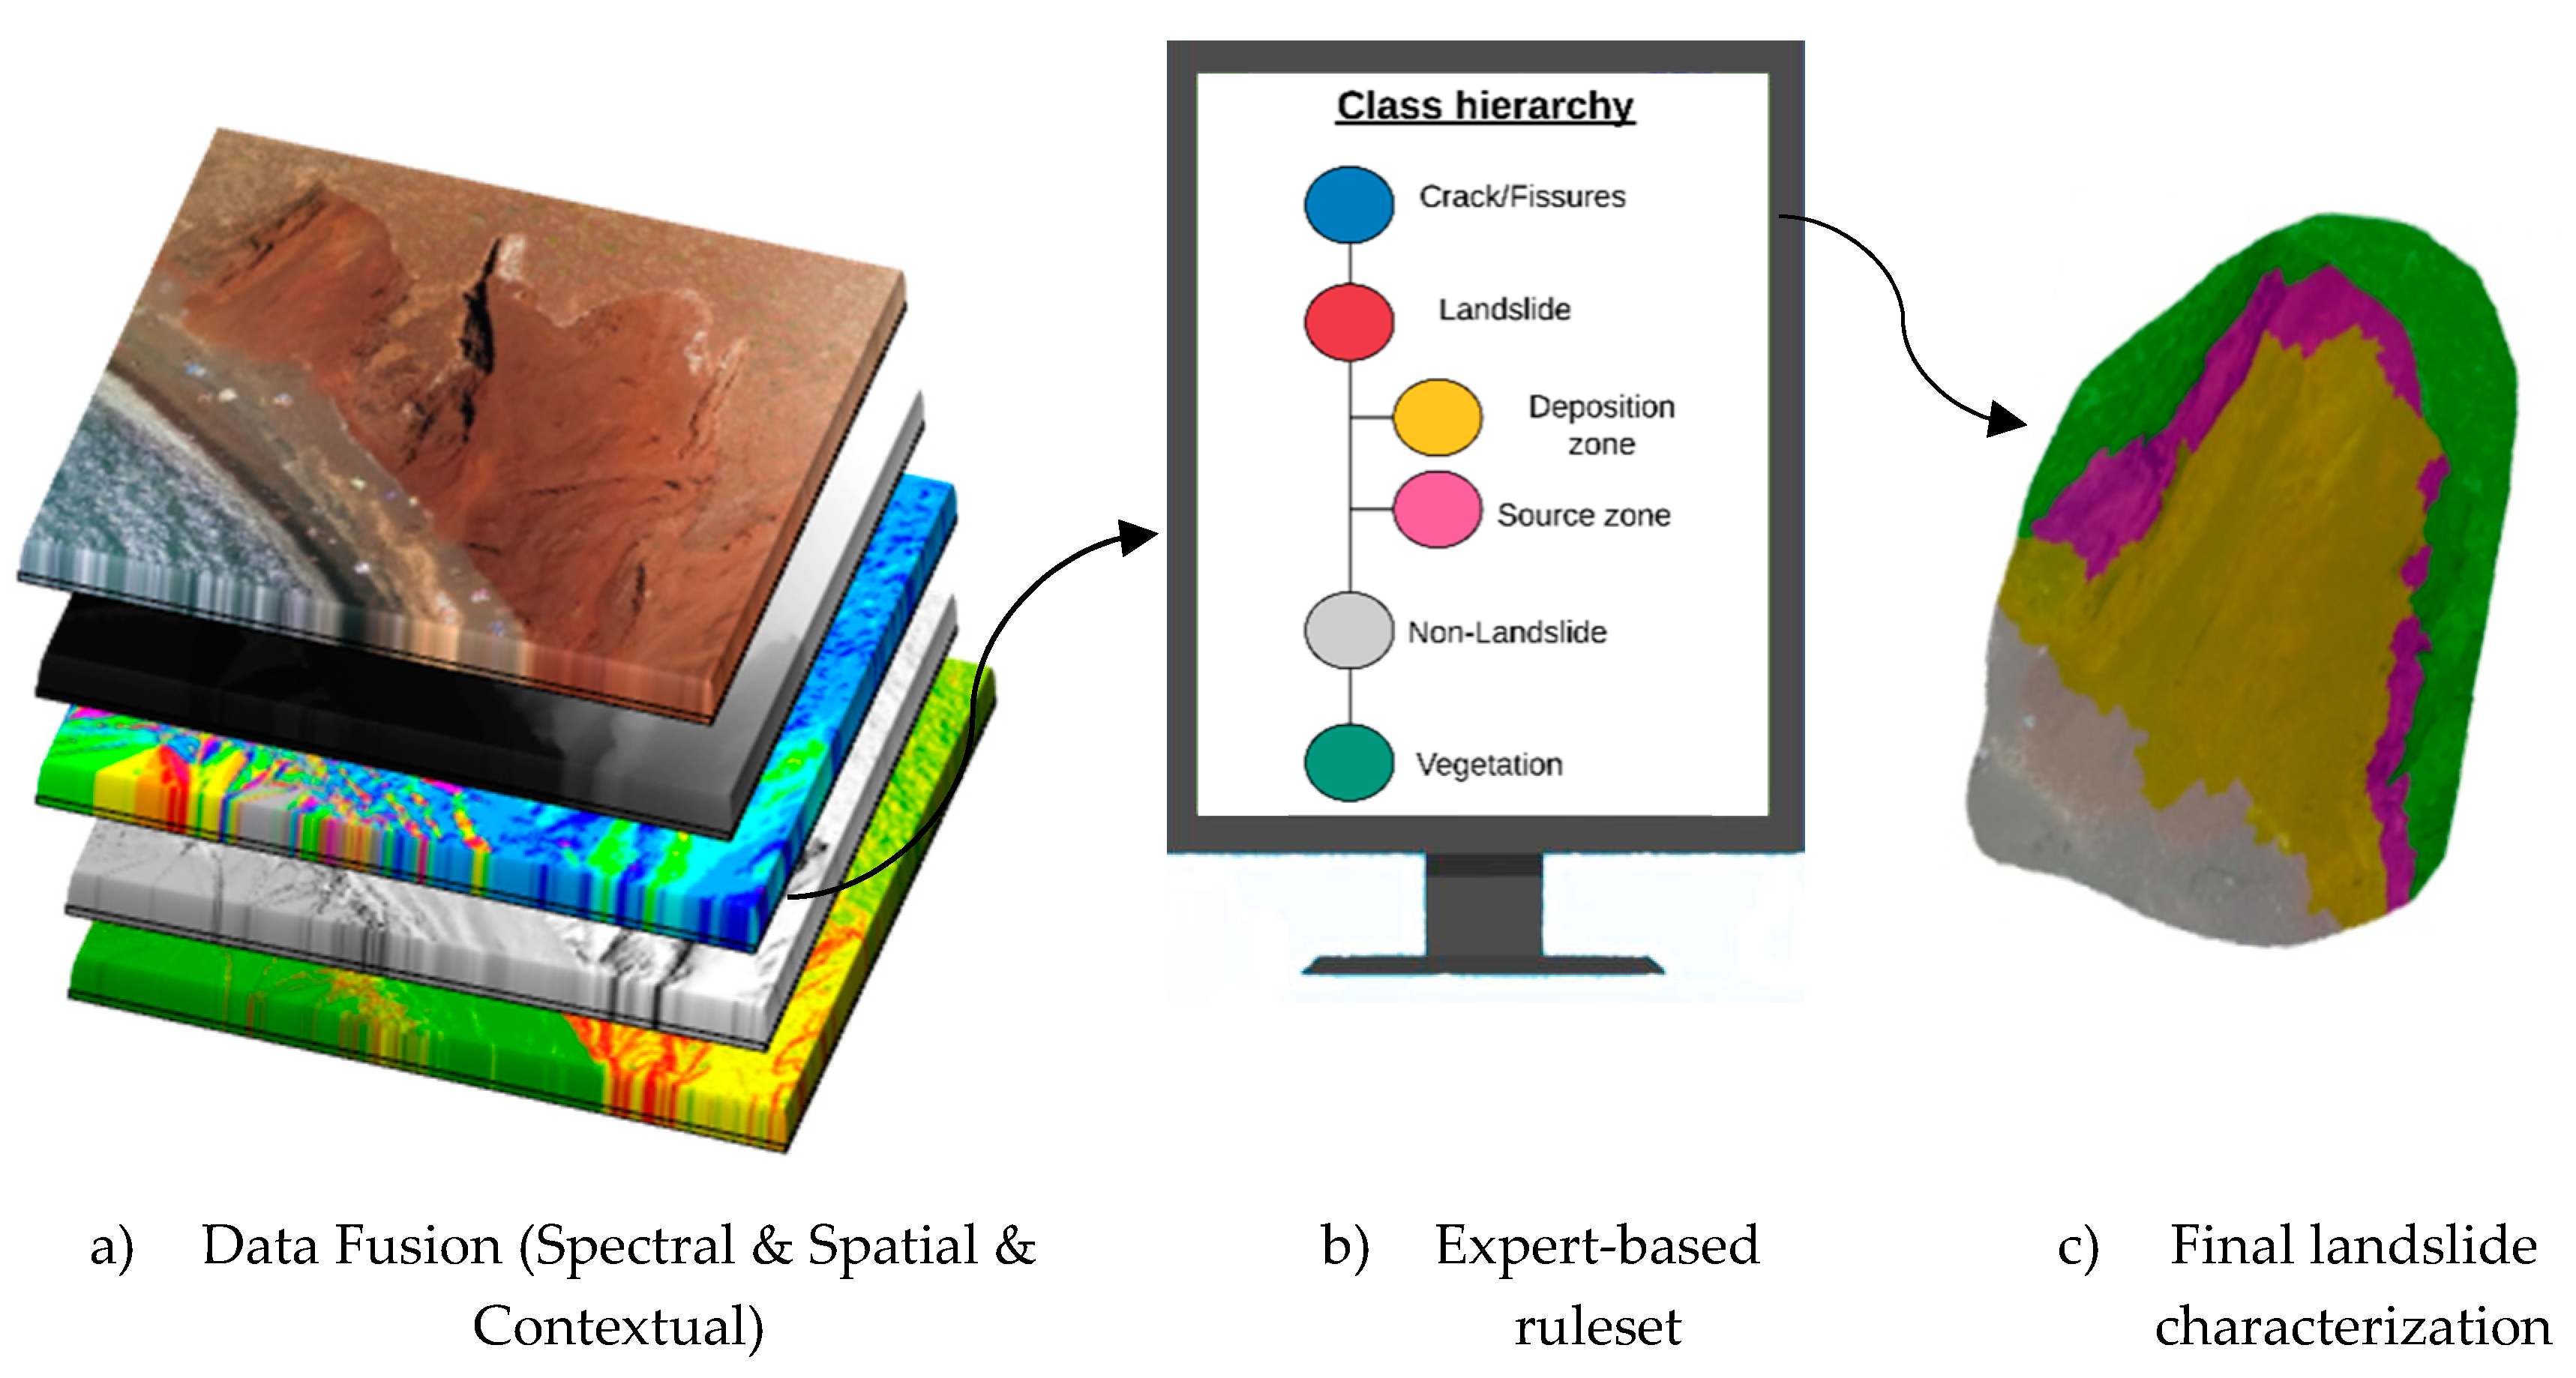
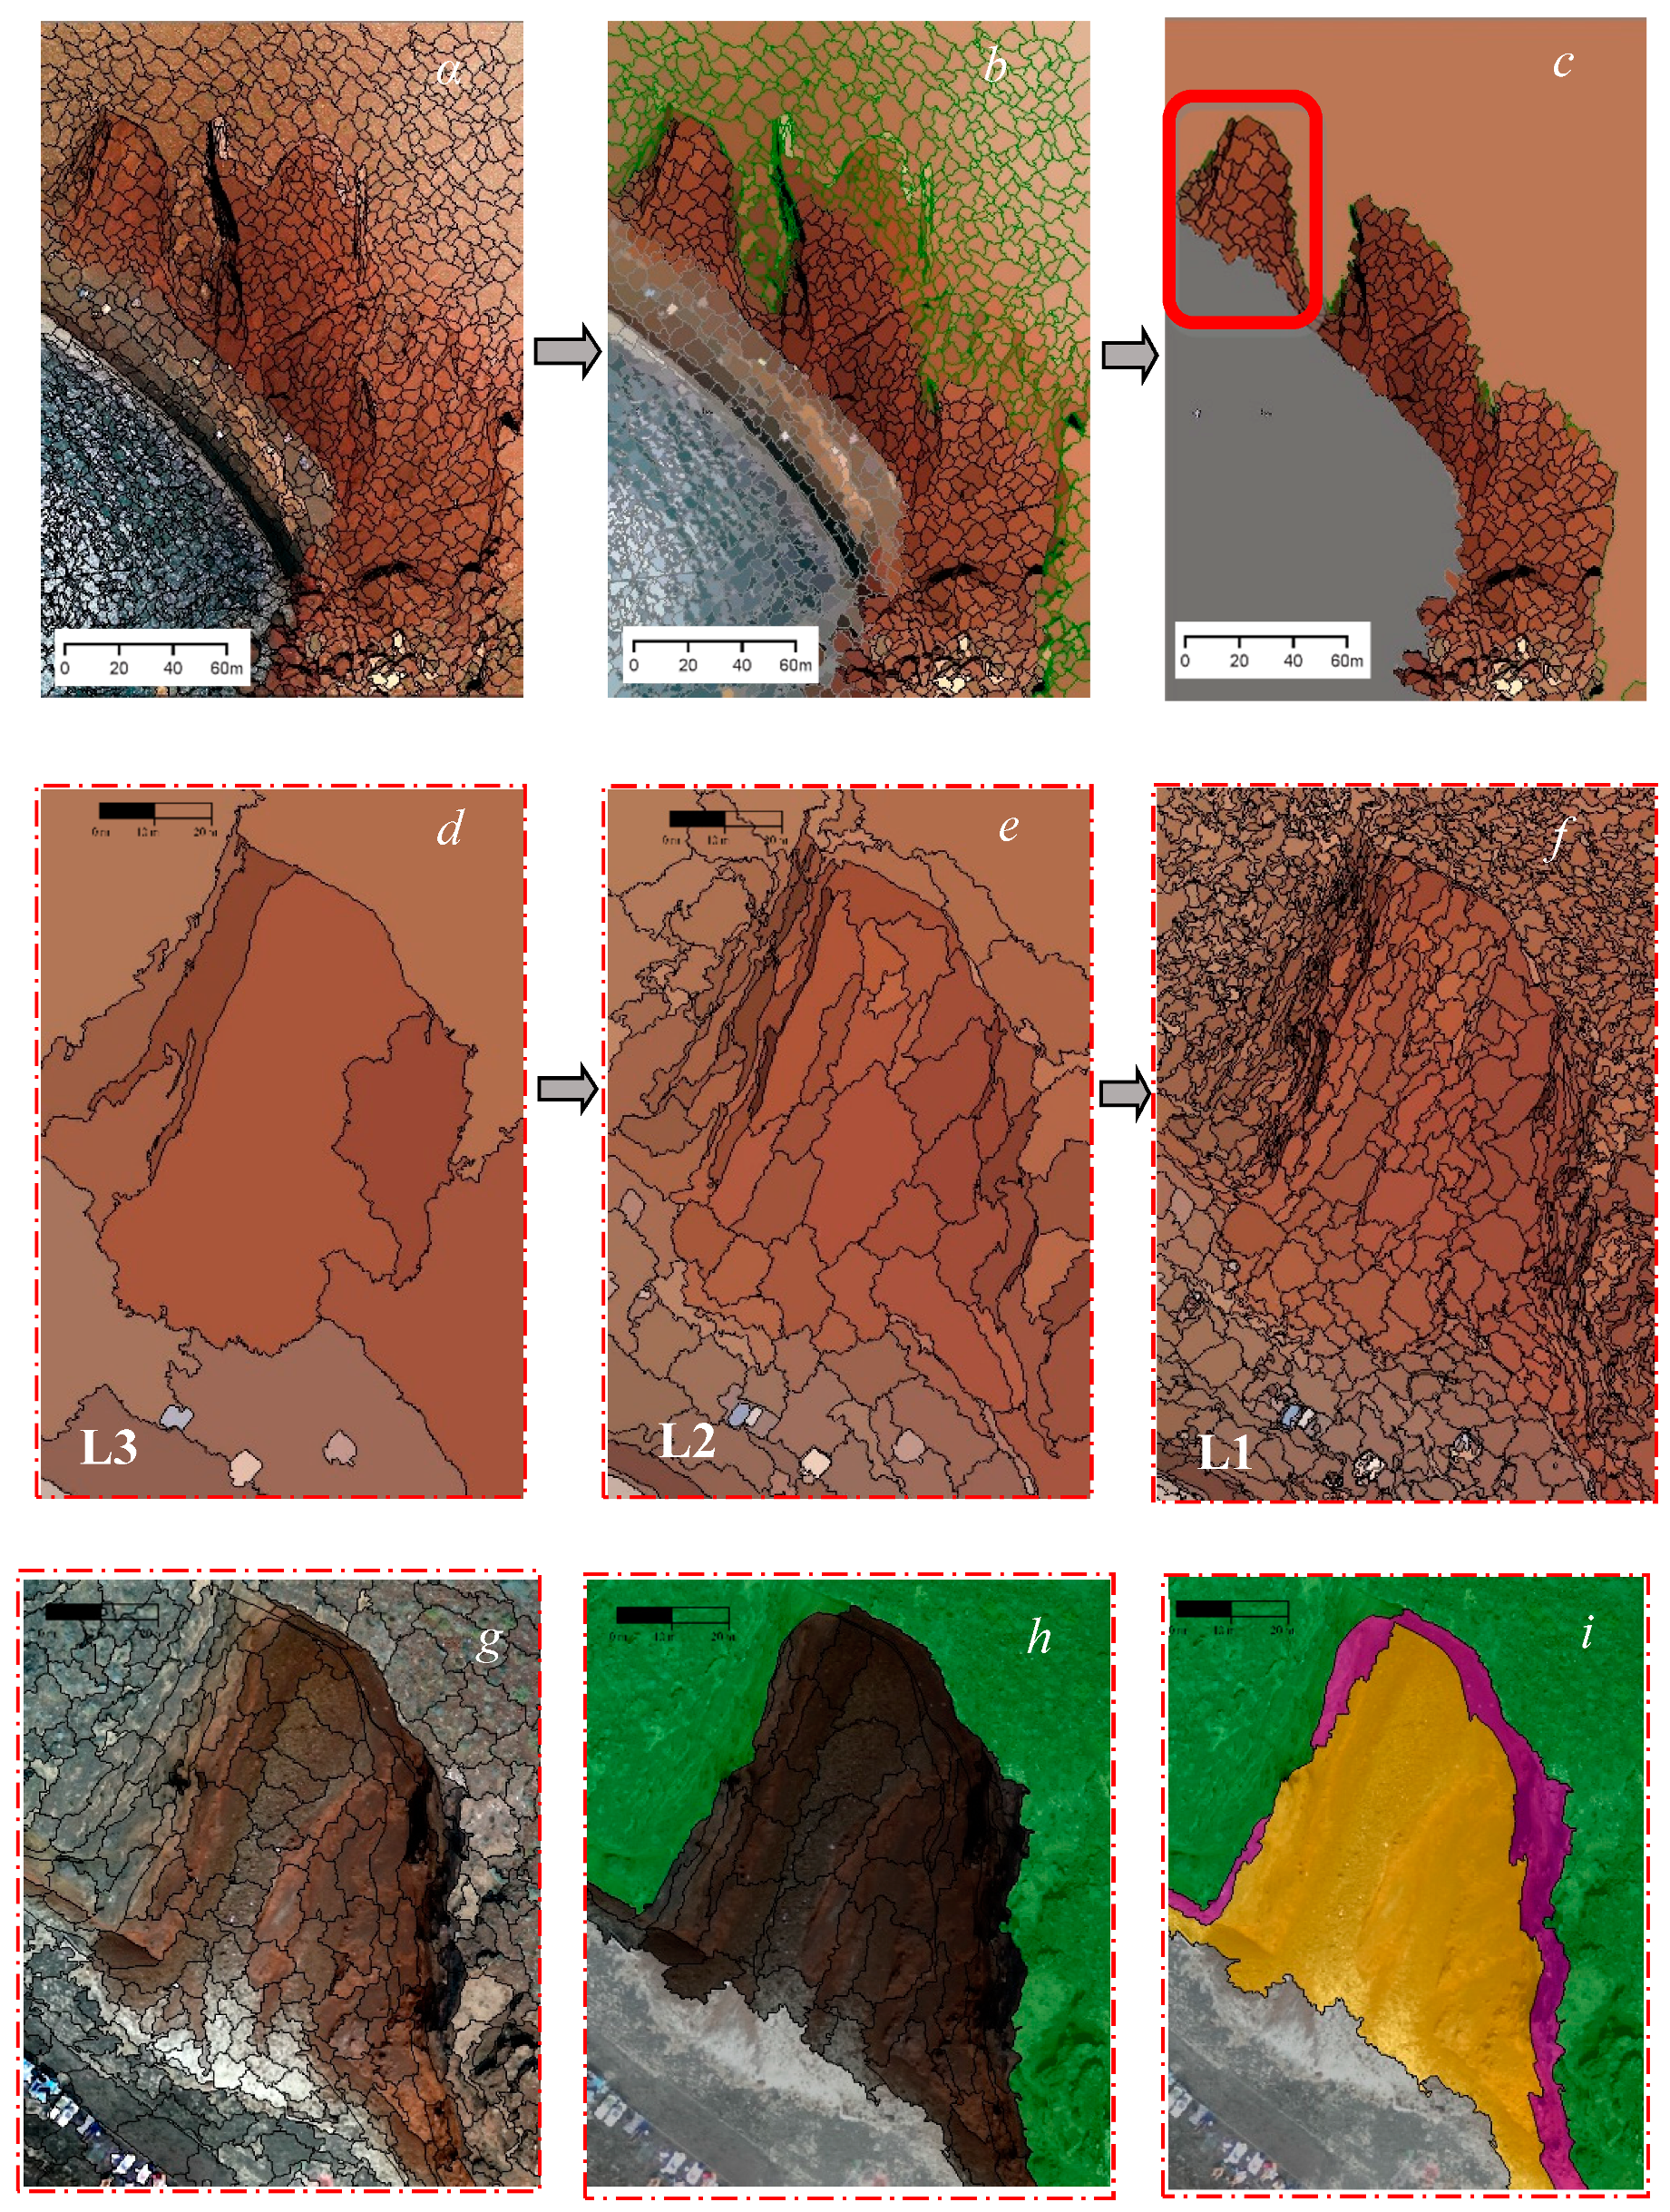
4.2. OBIA for Landslide Assessment
4.3. Accuracy Assessment
5. Analysis and Results
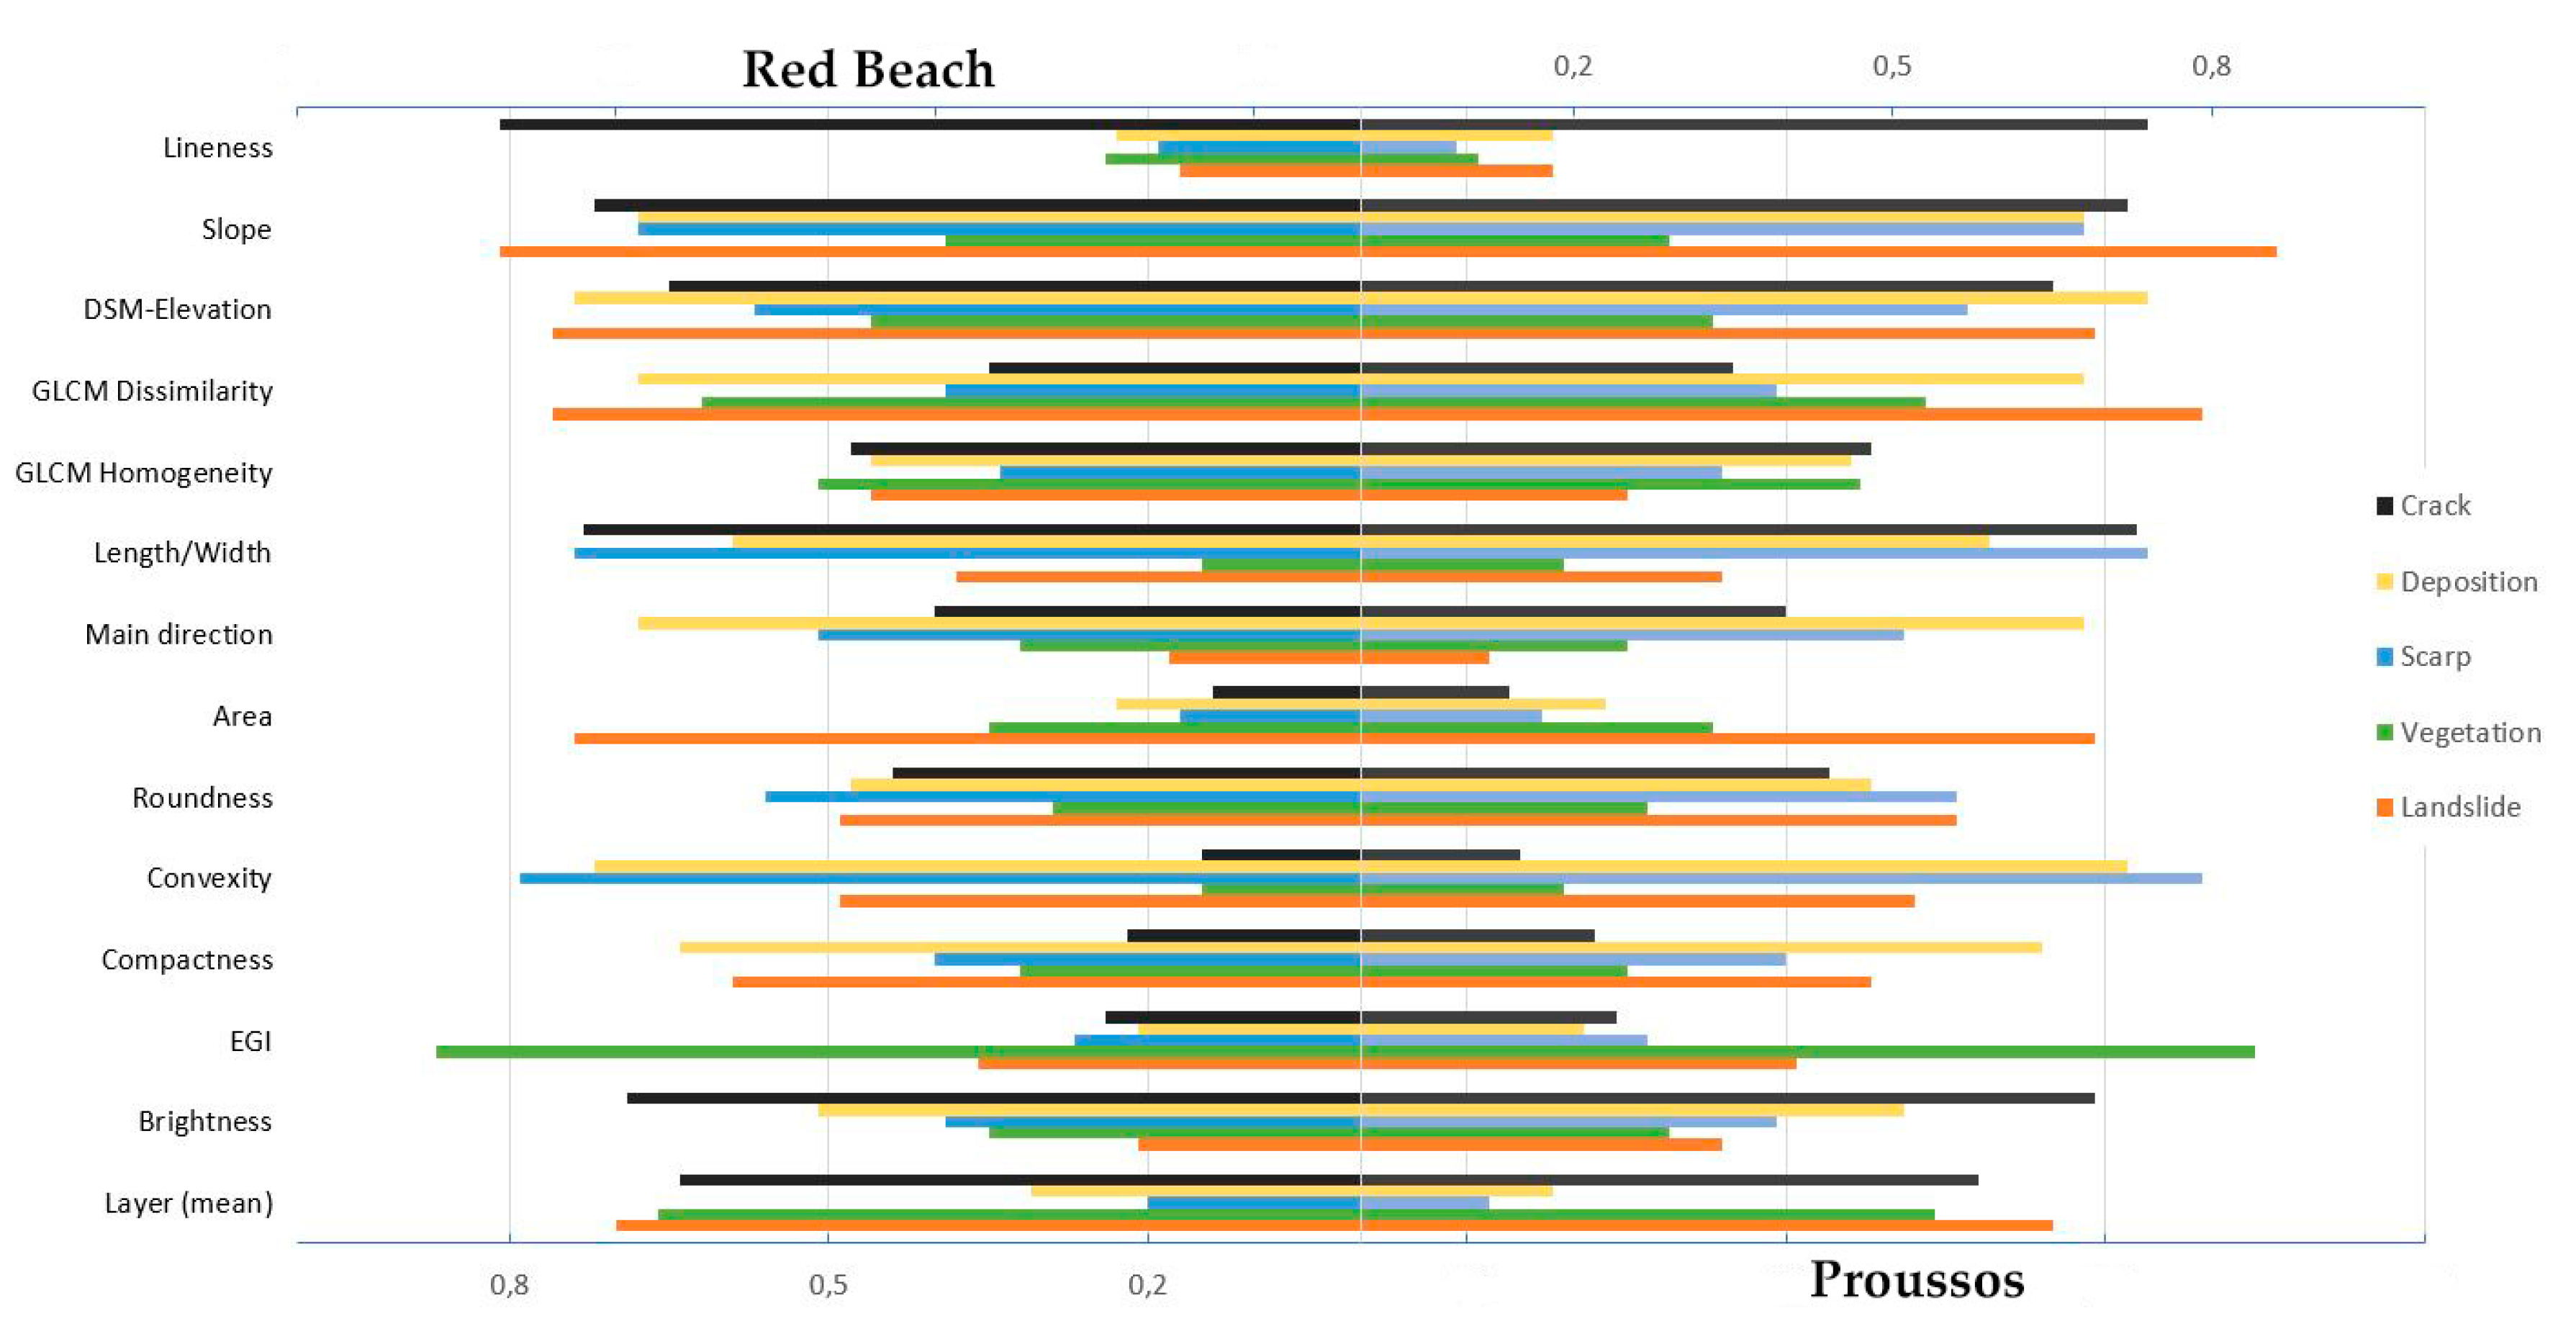
5.1. Data Analysis
5.1.1. Red Beach Site, Santorini
5.1.2. Proussos Site, Evritania
5.2. Validation
6. Discussion
7. Conclusions
Author Contributions
Funding
Acknowledgments
Conflicts of Interest
References
- Jaedicke, C.; Van Den Eeckhaut, M.; Nadim, F.; Hervás, J.; Kalsnes, B.; Vangelsten, B.V.; Smith, J.T.; Tofani, V.; Ciurean, R.; Winter, M.G.; et al. Identification of landslide hazard and risk “hotspots” in Europe. Bull. Eng. Geol. Environ. 2014, 73, 325–339. [Google Scholar] [CrossRef] [Green Version]
- Vassilakis, E.; Foumelis, M.; Erkeki, A.; Kotsi, E.; Parcharidis, I.; Lekkas, E. Multitemporal Surface Deformation Analysis of Amyntaio Slide (Greece) Using Remotely Piloted Airborne System and Structure-from-Motion photogrammetry; National and Kapodistrian University of Athens: Athens, Greece, 2019. [Google Scholar]
- Valkaniotis, S.; Papathanassiou, G.; Ganas, A. Mapping an earthquake-induced landslide based on UAV imagery; case study of the 2015 Okeanos landslide, Lefkada, Greece. Eng. Geol. 2018, 245, 141–152. [Google Scholar] [CrossRef]
- Guzzetti, F.; Mondini, A.C.; Cardinali, M.; Fiorucci, F.; Santangelo, M.; Chang, K.-T. Landslide inventory maps: New tools for an old problem. Earth-Sci. Rev. 2012, 112, 42–66. [Google Scholar] [CrossRef] [Green Version]
- Giordan, D.; Hayakawa, Y.; Nex, F.; Remondino, F.; Tarolli, P. Review article: The use of remotely piloted aircraft systems (RPASs) for natural hazards monitoring and management. Nat. Hazards Earth Syst. Sci. 2018, 18, 1079–1096. [Google Scholar] [CrossRef] [Green Version]
- Corominas, J.; van Westen, C.; Frattini, P.; Cascini, L.; Malet, J.-P.; Fotopoulou, S.; Catani, F.; Van Den Eeckhaut, M.; Mavrouli, O.; Agliardi, F.; et al. Recommendations for the quantitative analysis of landslide risk. Bull. Eng. Geol. Environ. 2014, 73, 209–263. [Google Scholar] [CrossRef]
- Lahousse, T.; Chang, K.T.; Lin, Y.H. Landslide mapping with multi-scale object-based image analysis—A case study in the Baichi watershed, Taiwan. Nat. Hazards Earth Syst. Sci. 2011, 11, 2715–2726. [Google Scholar] [CrossRef]
- Van Westen, C.J.; van Asch, T.W.J.; Soeters, R. Landslide hazard and risk zonation—Why is it still so difficult? Bull. Eng. Geol. Environ. 2006, 65, 167–184. [Google Scholar] [CrossRef]
- Corominas, J.; Moya, J. A review of assessing landslide frequency for hazard zoning purposes. Eng. Geol. 2008, 102, 193–213. [Google Scholar] [CrossRef]
- Casagli, N.; Cigna, F.; Bianchini, S.; Hölbling, D.; Füreder, P.; Righini, G.; Del Conte, S.; Friedl, B.; Schneiderbauer, S.; Iasio, C.; et al. Landslide mapping and monitoring by using radar and optical remote sensing: Examples from the EC-FP7 project SAFER. Remote Sens. Appl. Soc. Environ. 2016, 4, 92–108. [Google Scholar] [CrossRef] [Green Version]
- Scaioni, M.; Longoni, L.; Melillo, V.; Papini, M. Remote sensing for landslide investigations: An overview of recent achievements and perspectives. Remote Sens. 2014, 6, 9600–9652. [Google Scholar] [CrossRef] [Green Version]
- Zhao, C.; Lu, Z. Remote sensing of landslides—A review. Remote Sens. 2018, 10, 279. [Google Scholar] [CrossRef] [Green Version]
- Borghuis, A.M.; Chang, K.; Lee, H.Y. Comparison between automated and manual mapping of typhoon-triggered landslides from SPOT-5 imagery. Int. J. Remote Sens. 2007, 28, 1843–1856. [Google Scholar] [CrossRef]
- Joyce, K.; Samsonov, S.; Jolly, G. Satellite remote sensing of volcanic activity in New Zealand. In Proceedings of the 2008 Second Workshop on Use of Remote Sensing Techniques for Monitoring Volcanoes and Seismogenic Areas, Napoli, Italy, 11–14 November 2008; pp. 1–4. [Google Scholar]
- Blaschke, T.; Hay, G.J.; Kelly, M.; Lang, S.; Hofmann, P.; Addink, E.; Queiroz Feitosa, R.; van der Meer, F.; van der Werff, H.; van Coillie, F.; et al. Geographic object-based image analysis—Towards a new paradigm. ISPRS J. Photogramm. Remote Sens. 2014, 87, 180–191. [Google Scholar] [CrossRef] [PubMed] [Green Version]
- Hossain, M.D.; Chen, D. Segmentation for Object-Based Image Analysis (OBIA): A review of algorithms and challenges from remote sensing perspective. ISPRS J. Photogramm. Remote Sens. 2019, 150, 115–134. [Google Scholar] [CrossRef]
- Moosavi, V.; Talebi, A.; Shirmohammadi, B. Producing a landslide inventory map using pixel-based and object-oriented approaches optimized by Taguchi method. Geomorphology 2014, 204, 646–656. [Google Scholar] [CrossRef]
- Chen, Y.; Su, W.; Li, J.; Sun, Z. Hierarchical object oriented classification using very high resolution imagery and LIDAR data over urban areas. Adv. Space Res. 2009, 43, 1101–1110. [Google Scholar] [CrossRef]
- Hamedianfar, A.; Shafri, H.Z.M.; Mansor, S.; Ahmad, N. Improving detailed rule-based feature extraction of urban areas from WorldView-2 image and lidar data. Int. J. Remote Sens. 2014, 35, 1876–1899. [Google Scholar] [CrossRef]
- Berhane, T.; Lane, C.; Wu, Q.; Anenkhonov, O.; Chepinoga, V.; Autrey, B.; Liu, H. Comparing pixel- and object-based approaches in effectively classifying wetland-dominated landscapes. Remote Sens. 2017, 10, 46. [Google Scholar] [CrossRef] [Green Version]
- Keyport, R.N.; Oommen, T.; Martha, T.R.; Sajinkumar, K.S.; Gierke, J.S. A comparative analysis of pixel- and object-based detection of landslides from very high-resolution images. Int. J. Appl. Earth Obs. Geoinf. 2018, 64, 1–11. [Google Scholar] [CrossRef]
- Shackelford, A.K.; Davis, C.H. A combined fuzzy pixel-based and object-based approach for classification of high-resolution multispectral data over urban areas. IEEE Trans. Geosci. Remote Sens. 2003, 41, 2354–2364. [Google Scholar] [CrossRef] [Green Version]
- Lizarazo, I.; Elsner, P. Segmentation of remotely sensed imagery: Moving from sharp objects to fuzzy regions. In Image Segmentation; Ho, P.-G., Ed.; InTechOpen: London, UK, 2011; ISBN 978-953-307-228-9. [Google Scholar]
- Drăguţ, L.; Csillik, O.; Eisank, C.; Tiede, D. Automated parameterisation for multi-scale image segmentation on multiple layers. ISPRS J. Photogramm. Remote Sens. 2014, 88, 119–127. [Google Scholar] [CrossRef] [Green Version]
- Mohan Vamsee, A.; Kamala, P.; Martha, T.R.; Vinod Kumar, K.; Jai Sankar, G.; Amminedu, E. A tool assessing optimal multi-scale image segmentation. J. Indian Soc. Remote Sens. 2018, 46, 31–41. [Google Scholar] [CrossRef]
- Dou, J.; Chang, K.-T.; Chen, S.; Yunus, A.; Liu, J.-K.; Xia, H.; Zhu, Z. Automatic case-based reasoning approach for landslide detection: Integration of object-oriented image analysis and a genetic algorithm. Remote Sens. 2015, 7, 4318–4342. [Google Scholar] [CrossRef] [Green Version]
- Martha, T.R.; Kerle, N.; van Westen, C.J.; Jetten, V.; Kumar, K.V. Segment optimization and data-driven thresholding for knowledge-based landslide detection by object-based image analysis. IEEE Trans. Geosci. Remote Sens. 2011, 49, 4928–4943. [Google Scholar] [CrossRef]
- Stumpf, A.; Kerle, N. Object-oriented mapping of landslides using Random Forests. Remote Sens. Environ. 2011, 115, 2564–2577. [Google Scholar] [CrossRef]
- Chen, T.; Trinder, J.; Niu, R. Object-oriented landslide mapping using ZY-3 satellite imagery, random forest and mathematical morphology, for the Three-Gorges Reservoir, China. Remote Sens. 2017, 9, 333. [Google Scholar] [CrossRef] [Green Version]
- Liu, T.; Abd-Elrahman, A.; Morton, J.; Wilhelm, V.L. Comparing fully convolutional networks, random forest, support vector machine, and patch-based deep convolutional neural networks for object-based wetland mapping using images from small unmanned aircraft system. GISci. Remote Sens. 2018, 55, 243–264. [Google Scholar] [CrossRef]
- Mezaal, M.R.; Pradhan, B.; Sameen, M.I.; Mohd Shafri, H.Z.; Yusoff, Z.M. Optimized neural architecture for automatic landslide detection from high-resolution airborne laser scanning data. Appl. Sci. 2017, 7, 730. [Google Scholar] [CrossRef] [Green Version]
- Karantanellis, E.; Marinos, V.; Vassilakis, E. 3D hazard analysis and object-based characterization of landslide motion mechanism using UAV imagery. ISPRS-Int. Arch. Photogramm. Remote Sens. Spat. Inf. Sci. 2019, 425–430. [Google Scholar] [CrossRef] [Green Version]
- Blaschke, T. Object based image analysis for remote sensing. ISPRS J. Photogramm. Remote Sens. 2010, 65, 2–16. [Google Scholar] [CrossRef] [Green Version]
- Hölbling, D.; Eisank, C.; Albrecht, F.; Vecchiotti, F.; Friedl, B.; Weinke, E.; Kociu, A. Comparing manual and semi-automated landslide mapping based on optical satellite images from different sensors. Geosciences 2017, 7, 37. [Google Scholar] [CrossRef] [Green Version]
- Mayr, A.; Rutzinger, M.; Bremer, M.; Oude Elberink, S.; Stumpf, F.; Geitner, C. Object-based classification of terrestrial laser scanning point clouds for landslide monitoring. Photogramm. Rec. 2017, 32, 377–397. [Google Scholar] [CrossRef] [Green Version]
- Farmakis, I.; Marinos, V.; Papathanassiou, G.; Karantanellis, E. Automated 3D jointed rock mass structural analysis and characterization using LiDAR terrestrial laser scanner for rockfall susceptibility assessment: Perissa area case (Santorini). Geotech. Geol. Eng. 2020. [Google Scholar] [CrossRef]
- Nex, F.; Remondino, F. UAV for 3D mapping applications: A review. Appl. Geomat. 2014, 6, 1–15. [Google Scholar] [CrossRef]
- Peppa, M.V.; Mills, J.P.; Moore, P.; Miller, P.E.; Chambers, J.E. Brief communication: Landslide motion from cross correlation of UAV-derived morphological attributes. Nat. Hazards Earth Syst. Sci. 2017, 17, 2143–2150. [Google Scholar] [CrossRef] [Green Version]
- Eisenbeiß, H. UAV Photogrammetry; Mitteilungen/Institut für Geodäsie und Photogrammetrie an der Eidgenössischen Technischen Hochschule Zürich; ETH, Inst. für Geodäsie und Photogrammetrie: Zürich, Switzerland, 2009; ISBN 978-3-906467-86-3. [Google Scholar]
- Tziavou, O.; Pytharouli, S.; Souter, J. Unmanned Aerial Vehicle (UAV) based mapping in engineering geological surveys: Considerations for optimum results. Eng. Geol. 2018, 232, 12–21. [Google Scholar] [CrossRef] [Green Version]
- Lucieer, A.; Jong, S.M.d.; Turner, D. Mapping landslide displacements using Structure from Motion (SfM) and image correlation of multi-temporal UAV photography. Prog. Phys. Geogr. Earth Environ. 2014, 38, 97–116. [Google Scholar] [CrossRef]
- Colomina, I.; Molina, P. Unmanned aerial systems for photogrammetry and remote sensing: A review. ISPRS J. Photogramm. Remote Sens. 2014, 92, 79–97. [Google Scholar] [CrossRef] [Green Version]
- Bendea, H.; Boccardo, P.; Dequal, S.; Tonolo, F.G.; Marenchino, D.; Piras, M. Low cost UAV for post-disaster assessment. In Proceedings of the XXIst ISPRS Congress: International Society for Photogrammetry and Remote Sensing, Beijing, China, 3–11 July 2008; pp. 1373–1380. [Google Scholar]
- Tahar, K.N.; Ahmad, A.; Papamichail, D.; Ploussi, A.; Muniraj, I.; Guo, C.; Sheridan, J.T.; Liba, N. International Conference on Recent Trends in Physics 2016 (ICRTP2016). J. Phys. Conf. Ser. 2016, 755, 011001. [Google Scholar] [CrossRef]
- Turner, D.; Lucieer, A.; de Jong, S. Time series analysis of landslide dynamics using an Unmanned Aerial Vehicle (UAV). Remote Sens. 2015, 7, 1736–1757. [Google Scholar] [CrossRef] [Green Version]
- Vasuki, Y.; Holden, E.-J.; Kovesi, P.; Micklethwaite, S. Semi-automatic mapping of geological Structures using UAV-based photogrammetric data: An image analysis approach. Comput. Geosci. 2014, 69, 22–32. [Google Scholar] [CrossRef]
- Niethammer, U.; Rothmund, S.; James, M.R.; Travelletti, J.; Joswig, M. Nav-based remote sensing of landslides. Int. Arch. Photogramm. Remote Sens. Spat. Inf. Sci.-ISPRS Arch. 2010, 38, 496–501. [Google Scholar]
- D’Oleire-Oltmanns, S.; Marzolff, I.; Peter, K.D.; Ries, J.B. Unmanned aerial vehicle (UAV) for monitoring soil erosion in Morocco. Remote Sens. 2012, 4, 3390–3416. [Google Scholar] [CrossRef] [Green Version]
- Murphy, R.R.; Duncan, B.A.; Collins, T.; Kendrick, J.; Lohman, P.; Sanborn, F. Use of a small unmanned aerial system for the SR-530 Mudslide Incident near Oso, Washington. J. Field Robot. 2016, 33, 476–488. [Google Scholar] [CrossRef] [Green Version]
- Rau, J.Y.; Jhan, J.P.; Lo, C.F.; Lin, Y.S. Landslide mapping using imagery acquired by a fixed-wing Uav. ISPRS-Int. Arch. Photogramm. Remote Sens. Spat. Inf. Sci. 2012, 195–200. [Google Scholar] [CrossRef] [Green Version]
- Sui, L.; Wang, X.; Zhao, D.; Qu, J. Application of 3D laser scanner for monitoring of landslide hazards. Int. Arch. Photogramm. Remote Sens. Spat. Inf. Sci. 2008, XXXVII, 277–282. [Google Scholar]
- Koma, Z.; Székely, B.; Dorninger, P.; Rasztovits, S.; Roncat, A. Comparison of UAV and TLS DTMs for acquisition of geological, geomorphological information for Doren landslide. In Proceedings of the European Geosciences Union General Assembly 2014, Vienna, Austria, 27 April–2 May 2014; Volume 16. [Google Scholar]
- Remondino, F.; Spera, M.G.; Nocerino, E.; Menna, F.; Nex, F. State of the art in high density image matching. Photogramm. Rec. 2014, 29, 144–166. [Google Scholar] [CrossRef] [Green Version]
- Antonopoulos, J. The great Minoan eruption of Thera volcano and the ensuing tsunami in the Greek Archipelago. Nat. Hazards 1992, 5, 153–168. [Google Scholar] [CrossRef]
- Antoniou, A.A.; Lekkas, E. Rockfall susceptibility map for Athinios port, Santorini Island, Greece. Geomorphology 2010, 118, 152–166. [Google Scholar] [CrossRef]
- Marinos, V.; Prountzopoulos, G.; Asteriou, P.; Papathanassiou, G.; Kaklis, T.; Pantazis, G.; Lambrou, E.; Grendas, N.; Karantanellis, E.; Pavlides, S.; et al. Beyond the boundaries of feasible engineering geological solutions: Stability considerations of the spectacular Red Beach cliffs on Santorini Island, Greece. Environ. Earth Sci. 2017, 76, 513. [Google Scholar] [CrossRef]
- Lindner, G.; Schraml, K.; Mansberger, R.; Hübl, J. UAV monitoring and documentation of a large landslide. Appl. Geomat. 2016, 8, 1–11. [Google Scholar] [CrossRef]
- Pix4D. Pix4D www.pix4d.com, S.A.; Pix4D: Lausanne, Switzerland, 2019. [Google Scholar]
- Hungr, O.; Leroueil, S.; Picarelli, L. The Varnes classification of landslide types, an update. Landslides 2014, 11, 167–194. [Google Scholar] [CrossRef]
- Cruden, D.; Varnes, D. Landslides: Investigation and Mitigation; Turner, A.K., Schuster, R.L., Eds.; Special Report/Transportation Research Board, National Research Council; National Academy Press: Washington, DC, USA, 1996; ISBN 978-0-309-06208-4. [Google Scholar]
- eCognition Developer; Trimble: Sunnyvale, CA, USA, 2019.
- Eisank, C.; Smith, M.; Hillier, J. Assessment of multiresolution segmentation for delimiting drumlins in digital elevation models. Geomorphology 2014, 214, 452–464. [Google Scholar] [CrossRef] [PubMed] [Green Version]
- Hölbling, D.; Friedl, B.; Eisank, C. An object-based approach for semi-automated landslide change detection and attribution of changes to landslide classes in northern Taiwan. Earth Sci. Inform. 2015, 8, 327–335. [Google Scholar] [CrossRef] [Green Version]
- Comert, R.; Avdan, U.; Gorum, T. Rapid mapping of forested landslide from ultra-high resolution unmanned aerial vehicle data. ISPRS-Int. Arch. Photogramm. Remote Sens. Spat. Inf. Sci. 2018, 171–176. [Google Scholar] [CrossRef] [Green Version]
- Baatz, M.; Schape, A. Multi resolution Segmentation: An optimum approach for high quality multi scale image segmentation. Proc. Angew. Geogr. Inf. 2000, XII, 12–23. [Google Scholar]
- Woebbecke, D.M.; Meyer, G.E.; von Bargen, K.; Mortensen, D.A. Color indices for weed identification under various soil, residue, and lighting conditions. Trans. ASAE 1995, 38, 259–269. [Google Scholar] [CrossRef]
- Middleton, M.; Schnur, T.; Sorjonen-Ward, P. Geological lineament interpretation using the Object-based Image Analysis approach: Results of semi-automated analyses versus visual interpretation. Geol. Surv. Finl. 2015, 57, 135–154. [Google Scholar]
- Story, M.; Congalton, R. Accuracy assessment: A user’s perspective. Am. Soc. Photogramm. Remote Sens. 1986, 52, 397–399. [Google Scholar]


| Mission Specifications | ||
|---|---|---|
| Parameters | Proussos | Red Beach |
| Number of images | 112 | 180 |
| Flying altitude (m) | 60 | 90 |
| Sidelap-Frontlap | 75%–80% | 75%–80% |
| Ground Resolution (m) | 0.3 | 0.5 |
| Coverage area (km2) | 0.132 | 0.143 |
| Number of tie points | 832,147 | 1,776,246 |
| Overall error in XY (m) | 0.1 | 0.2 |
| Overall error in Z (m) | 0.23 | 0.4 |
| Orthomosaic resolution (m) | 0.5 | 0.5 |
| Digital surface model resolution (m) | 0.5 | 0.5 |
| Parameterization | |||
|---|---|---|---|
| Attribute | Information | Purpose | Landslide conception |
| Spectral attributes | |||
| Layer (min, max, average, Standard deviation) | The value of pixels comprising the region in band Red, Green, Blue | Classifier | Colour values used to distinguish eroded surfaces or specific class discrimination due to their individual spectral signatures |
| Brightness | The value is defined as the mean of all spectral bands. | Classifier | High brightness values in landslide affected areas, due to loss of vegetation and exposure of the rockmass |
| EGI (Excessive Greenness Index) | Vegetation index, EGI = (2 x g – r – b) [66] | Classifier | Spectral index used for vegetation classification |
| Spatial attributes | |||
| Convexity | Measures the object’s convexity or concavity. | Classifier | Scarp/Source zone: concave Downslope are mostly convex |
| Roundness | Measure that compares the area of the object to the square of the maximum diameter of the object. | Classifier - Refinement | Deposition zones are presented as round shaped areas of accumulated material |
| Area | Total area of the objects, minus the area of the holes. | Classifier - Refinement | Refinement of different classes based on their coverage |
| Main direction | Direction across the main polyline. | Classifier | Deposition: Diffused direction Scarp: main direction-flow in relation with aspect |
| Length/Width | The length of an object divided by its width. | Classifier | Cracking features present elongated features with high values of L/W |
| Lineness | Skeleton polylines which serve as surface discontinuities. | Classifier | Crack/fissure identification based on skeleton polylines |
| Texture attributes | |||
| GLCM Homogeneity | GLCM is a tabulation of how often different combinations of pixel brightness values (gray levels) occur. Image homogeneity, the value is high if GLCM is concentrated along the diagonal. | Classifier | Higher values at the failure material (Landslide zones) than stable terrain (Non landslide) |
| GLCM Dissimilarity | Texture measurement of the amount of local variation. It increases linearly and is high if the object has a high contrast. | Classifier | Higher values at the failure material (Landslide zones) than stable terrain (Non landslide) |
| Topological attributes | |||
| Mean diff to neighbors | For each neighboring object, the layer mean difference is computed and weighted with regard to the length of the border between the objects. | Refinement | Topological rules applied for classes refinement |
| Relative border to | Object’s common border percentage with neighboring ones. | Refinement | Topological rules applied for classes refinement |
| Elevation | Location of sharp-steep areas close to very flat ones. | Classifier | Stable part has higher elevation than landslide zone |
| Slope | Gradient: 0–90°, significant slope change. | Classifier | Scarp: Steep with its main direction-flow in relation with aspect Stable zones: Low values, small variations |
| Segmentation Parameters | Classification Parameters | |
|---|---|---|
| L1 | Scale: 40 Shape: 0.4 Compactness: 0.5 | Lineness, Brightness, Slope, Elevation Lineness |
| L2 | Scale: 80 Shape: 0.4 Compactness: 0.5 | RGB, GLCM, Convexity, Roundness, Length-width |
| L3 | Scale: 160 Shape: 0.4 Compactness: 0.5 | Slope, EGI, Direction |
| Segmentation Parameters | Classification Parameters | |
|---|---|---|
| L1 | Scale: 40 Shape: 0.4 Compactness: 0.5 | Lineness, Brightness, Slope, Elevation, Lineness |
| L2 | Scale: 80 Shape: 0.4 Compactness: 0.5 | RGB, GLCM, Convexity, Roundness, Length-width |
| L3 | Scale: 160 Shape: 0.4 Compactness: 0.5 | Slope, EGI, Direction |
| Metrics | Red Beach | Proussos | ||
|---|---|---|---|---|
| Scarp | Deposition | Scarp | Deposition | |
| Object-based image analysis classification (m2) | 277.75 | 457.26 | 1045.51 | 2198.47 |
| Expert classification (m2) | 91.52 | 428.58 | 764.27 | 1286.59 |
| Difference (m2) | +186.23 | +28.68 | +281.24 | +911.88 |
| Overlap (%) | 74 | 83 | 79 | 86 |
| Producer’s accuracy (%) | 78.1 | 80.8 | 81.4 | 80.2 |
| User’s accuracy (%) | 75.6 | 77.4 | 80.3 | 77.9 |
| Omission error (%) | 21.9 | 19.2 | 18.6 | 19.8 |
| Commission error (%) | 24.4 | 22.6 | 19.7 | 22.1 |
© 2020 by the authors. Licensee MDPI, Basel, Switzerland. This article is an open access article distributed under the terms and conditions of the Creative Commons Attribution (CC BY) license (http://creativecommons.org/licenses/by/4.0/).
Share and Cite
Karantanellis, E.; Marinos, V.; Vassilakis, E.; Christaras, B. Object-Based Analysis Using Unmanned Aerial Vehicles (UAVs) for Site-Specific Landslide Assessment. Remote Sens. 2020, 12, 1711. https://0-doi-org.brum.beds.ac.uk/10.3390/rs12111711
Karantanellis E, Marinos V, Vassilakis E, Christaras B. Object-Based Analysis Using Unmanned Aerial Vehicles (UAVs) for Site-Specific Landslide Assessment. Remote Sensing. 2020; 12(11):1711. https://0-doi-org.brum.beds.ac.uk/10.3390/rs12111711
Chicago/Turabian StyleKarantanellis, Efstratios, Vassilis Marinos, Emmanuel Vassilakis, and Basile Christaras. 2020. "Object-Based Analysis Using Unmanned Aerial Vehicles (UAVs) for Site-Specific Landslide Assessment" Remote Sensing 12, no. 11: 1711. https://0-doi-org.brum.beds.ac.uk/10.3390/rs12111711