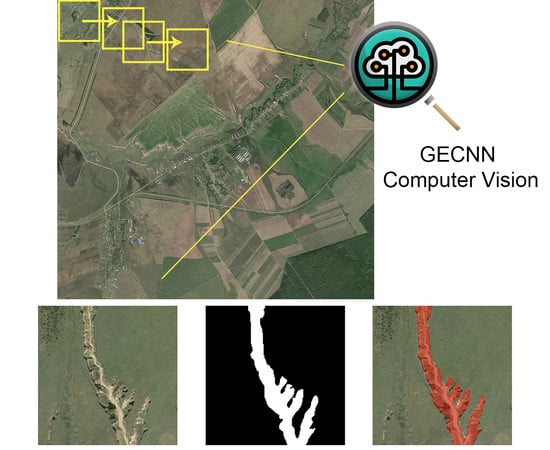
Automatic Gully Detection: Neural Networks and Computer Vision


Institute of Environmental Sciences, Department of Landscape Ecology, Kazan Federal University, Kremlevskaya St., 18, Kazan 420008, Russia
*
Author to whom correspondence should be addressed.
Remote Sens. 2020, 12(11), 1743; https://0-doi-org.brum.beds.ac.uk/10.3390/rs12111743
Submission received: 22 April 2020
/
Revised: 23 May 2020
/
Accepted: 25 May 2020
/
Published: 28 May 2020
(This article belongs to the Section Environmental Remote Sensing)
Abstract
:Transition from manual (visual) interpretation to fully automated gully detection is an important task for quantitative assessment of modern gully erosion, especially when it comes to large mapping areas. Existing approaches to semi-automated gully detection are based on either object-oriented selection based on multispectral images or gully selection based on a probabilistic model obtained using digital elevation models (DEMs). These approaches cannot be used for the assessment of gully erosion on the territory of the European part of Russia most affected by gully erosion due to the lack of national large-scale DEM and limited resolution of open source multispectral satellite images. An approach based on the use of convolutional neural networks for automated gully detection on the RGB-synthesis of ultra-high resolution satellite images publicly available for the test region of the east of the Russian Plain with intensive basin erosion has been proposed and developed. The Keras library and U-Net architecture of convolutional neural networks were used for training. Preliminary results of application of the trained gully erosion convolutional neural network (GECNN) allow asserting that the algorithm performs well in detecting active gullies, well differentiates gullies from other linear forms of slope erosion — rills and balkas, but so far has errors in detecting complex gully systems. Also, GECNN does not identify a gully in 10% of cases and in another 10% of cases it identifies not a gully. To solve these problems, it is necessary to additionally train the neural network on the enlarged training data set.
1. Introduction
Gully erosion is one of the most active geomorphic processes and one of the major causes of land degradation worldwide. The role of the process can hardly be underestimated, even with rough estimates, the area occupied by gullies only in Russia is 2.4 million ha [1], which is more than the area of some European countries such as Slovenia or the total area of Montenegro, Luxembourg, Andorra, Malta, and Liechtenstein. In the eastern part of the Russian Plain, gully erosion is particularly intense, forming what is known as the “erosion polis” [2,3]. All this leads to the fact that fertile and heavily used earlier agricultural land is withdrawn from circulation, which in turn generates alternative costs estimated at hundreds of billions of dollars per year [1].
Gullies within the European part of Russia are observed mostly within arable lands. Latest assessment and mapping of the gully dissection density for the European part of Russia was undertaken during the 1970s. Previous maps of gully erosion have a high degree of generalization. This is due to the fact that when such maps were created for the territory of the former USSR and its separate regions, the gully dissection density of the gully network was determined by topographic maps of different scales (1:420,000, 1:100,000, 1:50,000, and 1:25,000) [4,5,6,7,8,9]. Taking into account the large size of the USSR territory, even for some regions this was not a continuous mapping. The mapping was conducted for key areas on the basis of preliminary expert zoning. Thus, it becomes obvious that it is necessary to create a national register of gullies for control, monitoring, and modern assessment of gully erosion. Today there are several attempts to create regional gully databases in Russia. Thus, one of the largest in terms of quantity and time of field observations is the database of gullies of the Udmurt Republic [10], which contains information about linear growth of gullies in Udmurtia since the 1970s. Additionally, instrumental monitoring of the linear growth of gullies was conducted in the Republic of Tatarstan, Voronezh, Saratov, and Orenburg regions, and Stavropol Territory [11,12]. Similar studies have been conducted in a number of other regions of Russia [13,14,15,16,17]. However, there is still no unified database of gullies in Russia, especially reflecting their current state and identified by common methodological rules and mapping sources. In many ways this is due to the exceptionally large territory of the country, the variety of natural conditions, and the difficulty of making continuous instrumental observations in the field due to their high cost. The solution could be to map gullies in office conditions (without fieldwork) based on remote sensing data, but such work is also very time-consuming for a large territory. In addition, this approach raises a number of methodologically unsolved issues. For example, difficulties in identifying gullies, as is known, arise at the intermediate stages of gully development. What are the conditions under which linear forms of erosion such as a rill can be considered as a gully? Is the growing gully still a gully or a balka? It must be said that geomorphologists do not have clear criteria for answering these questions. The expert method is most often used [12,18]. Summarizing all the above, the main problems in gully erosion mapping are:
- Manual (visual) identification of gullies by remote sensing, especially in a large area, is very laborious and requires field verification of the results;
- There is no unified methodological basis for gully detection by remote sensing data and few regional detection references;
- Subjectivity in gully detection taking into account gully development stages.
These problems have been and are being investigated by many researchers from all over the world [19,20,21,22,23,24,25,26] and everyone, one way or another, comes to the conclusion that in order to minimize the subjectivity factors and methodological support it is necessary to switch to automated mapping. Three types of approach are proposed for this purpose.
In the first case, the use of land-use type classification methods with the addition of the class “Gully” is proposed [27,28,29]. However, in such an approach it is necessary to provide high-quality source RS data containing multiple bands, because the accuracy of classification depends directly on the amount of information contained in the reference data. Obviously, it is difficult to provide high-resolution multispectral RS data for such a large territory as the European part of Russia (about 4 million sq km). Besides, this approach is very poorly extrapolated to large territories due to the diversity of landscape conditions, which should be taken into account when solving classification tasks.
The second approach is to create mathematical models to predict the development of gully forms. A by-product of this approach is a map of gullies and territories susceptible to gully formation [20,22,23,30]. However, this approach is fully reliant on prediction based on high-precision digital elevation models [31] obtained either by aerial vehicles [32] or laser scanning [33], which cannot be used in Russia due to the lack of a national high-resolution digital elevation model.
The third approach is based on the use of object based image analysis or OBIA (GEOBIA) to achieve the best results in classifying RS data. This approach has already been implemented for gully detection on satellite images in Morocco [21], Australia [26], and South Africa [27]. Segmentation under this approach is similar to the first one using classical classification methods, but additional metrics based on analysis of objects on the image are used. Correspondingly, such an approach has the same disadvantages as the first one, at the same time requiring even more control by humans [34]. Besides, this approach requires much effort when selecting and setting parameters for the classifier, also introducing a subjective factor when applying it.
Thus, it becomes clearly evident that existing methods do not allow for reproducible mapping of gully erosion, especially over a large area. A new approach based on the use of artificial intelligence has been applied to solve this problem.
Neural networks are more and more actively used for processing RS data. Explosive growth in the number of works with the use of neural networks to solve the problem of object detection on satellite images was recorded in 2016, after which the number of such works increased exponentially [35,36]. Even now researchers in this field agree that the results obtained using neural networks are superior in quality even over those obtained using OBIA [34]. However, application of neural networks for object detection and contouring on satellite images is still poorly developed [37,38,39]. The traditional problem of classifying land use types and land cover is more or less solved [40,41,42,43,44,45], with less work on detecting specific objects. First of all, it is related to the availability of training data sets for the main classes of land use and land cover (AlexNet, ImageNet [46], GoogLeNet [47], VGGNet [48]).
The purpose of this study is to develop a methodology for automated detection of the planar form of gullies for their mapping based on remote sensing data using neural networks. The following interrelated tasks are being solved for this purpose:
- Selection of the remote sensing data source;
- Selection of the software development environment;
- Neural network architecture development;
- Collecting a training dataset;
- Training of the neural network;
- Evaluation of the recognition accuracy of objects (gullies) using the developed method.
2. Materials and Methods
2.1. Case Study Area
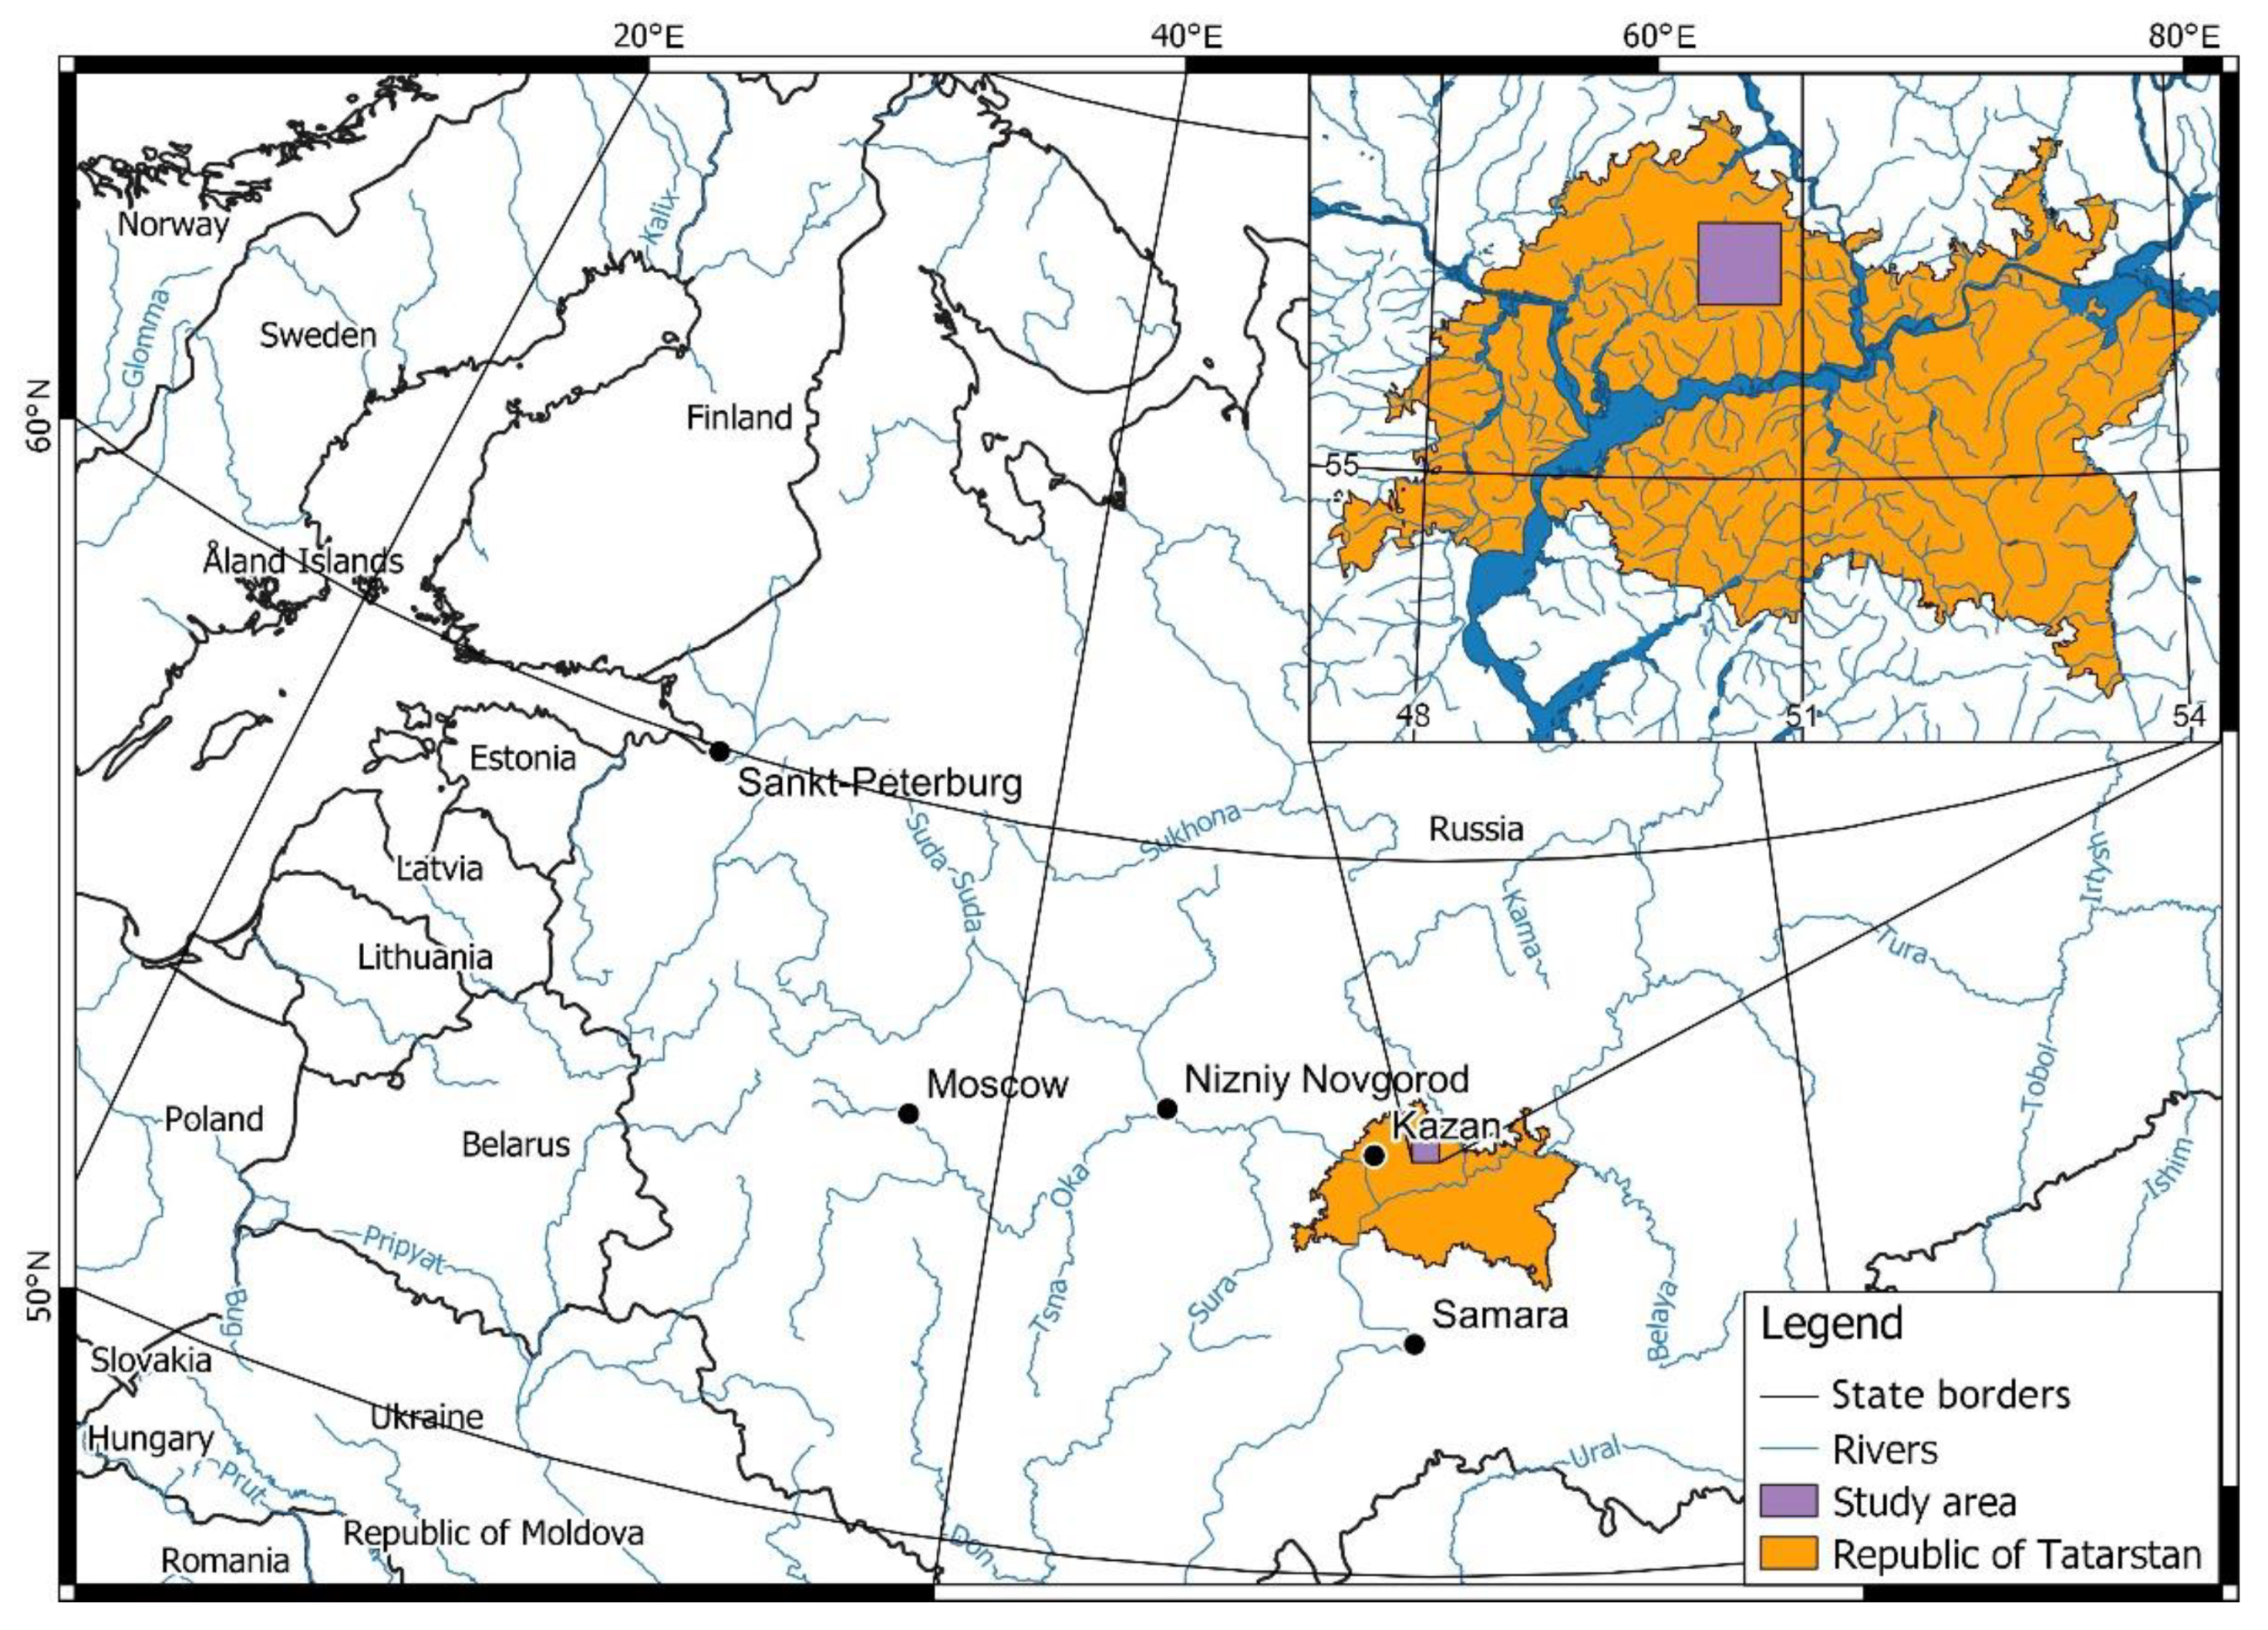
The chosen study area is the Republic of Tatarstan, a test region of the Russian Federation located on the eastern side of the boreal ecotone. The total area of the republic is comparable to the size of some European countries (Ireland, Latvia, Lithuania) and is 68 thousand sq km (Figure 1).
Gully erosion on the territory of the republic has been studied several times. Initial data were obtained by mapping 1:17,000 scale aerial photographs in the 1960–1970s. The matching of gully erosion forms on aerial photographs to the field forms was 95%–97%. Modern gully networks were mapped using visual detection from satellite images. To ensure a high quality of gully detection using satellite images, the images of different imaging seasons were used, having high and ultra-high resolution (0.5–1.5 m). A system of regional interpretation patterns was formed to detect gully forms on satellite images. The most informative signs of detection include: a) planar shape of the gully, which has well visible borders; b) a linear and dendrite-like planar image pattern with clear-cut boundaries and talveg; c) indirect signs (shadows, allowing determination of the transverse profile of the gully; color and tone of the image — identifying exposed areas of the gully slopes).
Dependence of gully clearness of the color of rocks, in which the erosive cut occurred on the satellite image, was also revealed. Forms having tone from light gray to almost white are reliably detected due to erosion cut into carbonate-siliceous, limestone and chalk-merged rocks. In order to identify gullies at the transition stages of their development, criteria were defined that allow excluding from the interpretation of the gully form the actual rills, which differ from the gully form by insignificant depth and width, not exceeding 1.5–3 m, and which can be ploughed by agricultural machinery during processing. The balka shapes have an indistinct boundary, a trapezoidal transverse profile with an indistinct bottom, slopes and bottoms overgrown with meadow and woody-shrubby vegetation, and a poorly defined mouth and top.
The choice of territory is determined by the diversity of natural conditions that determine the formation of gullies, the degree of its study and significant gully fragmentation [49,50].
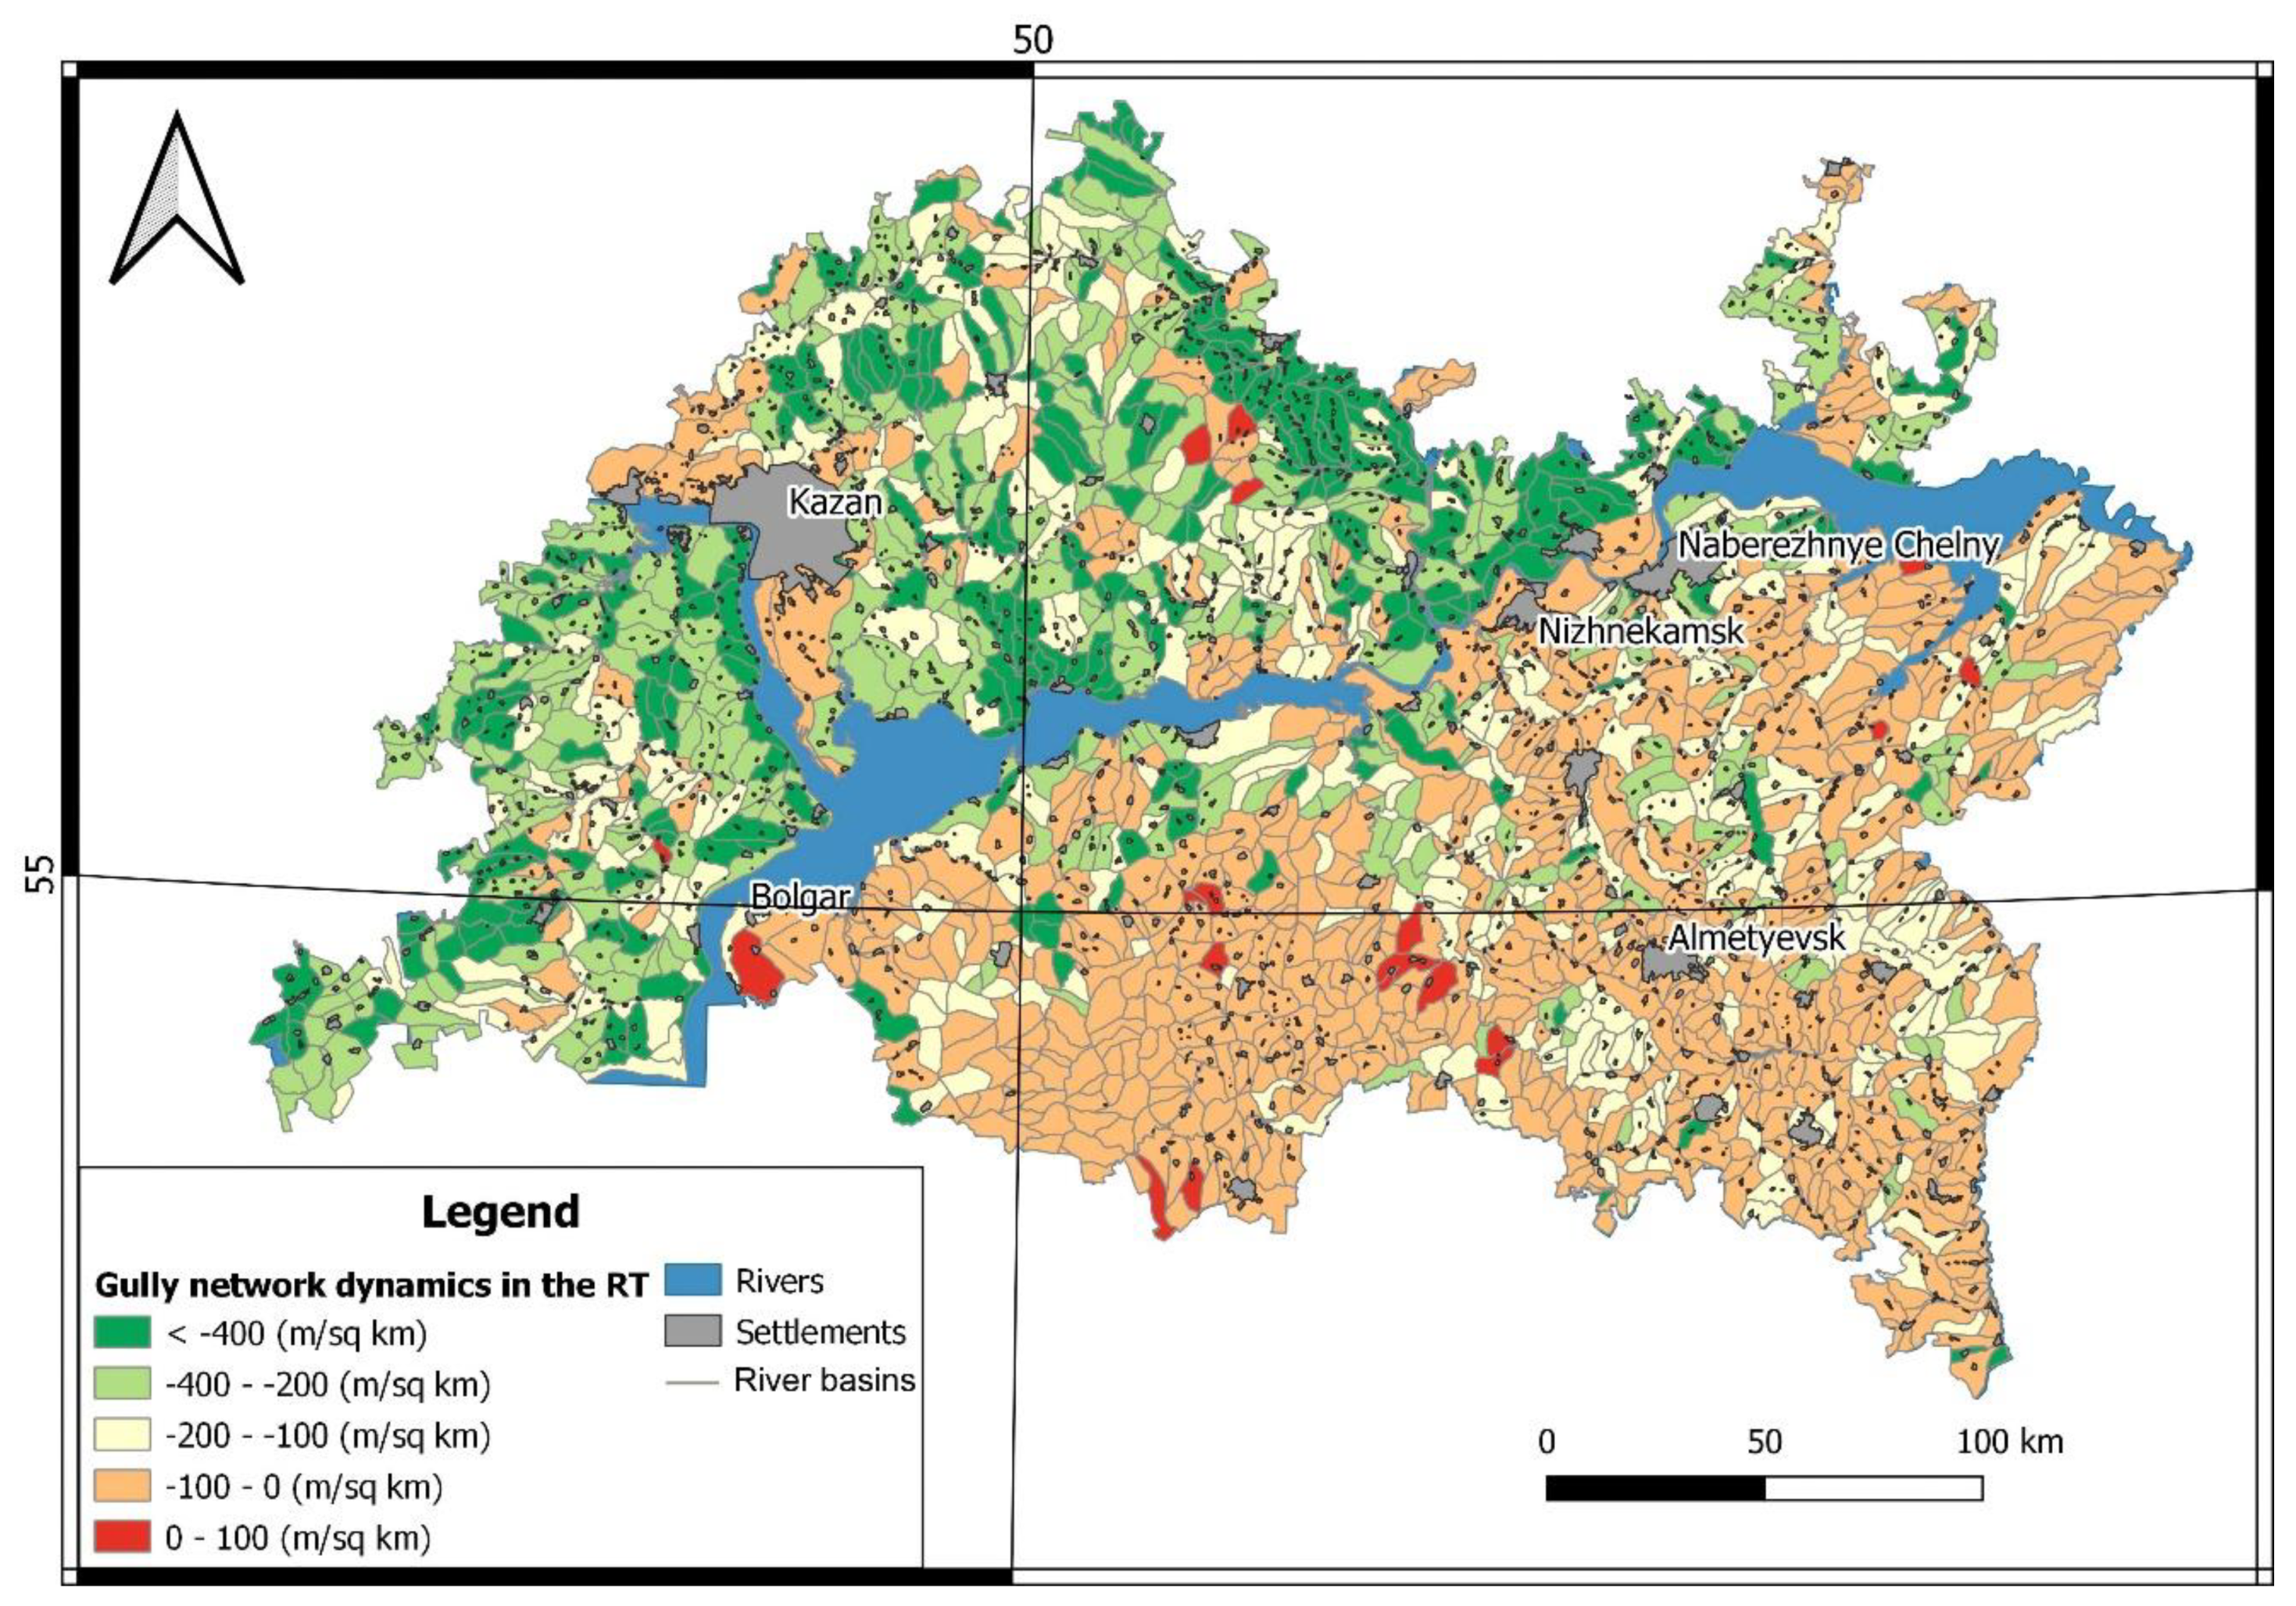
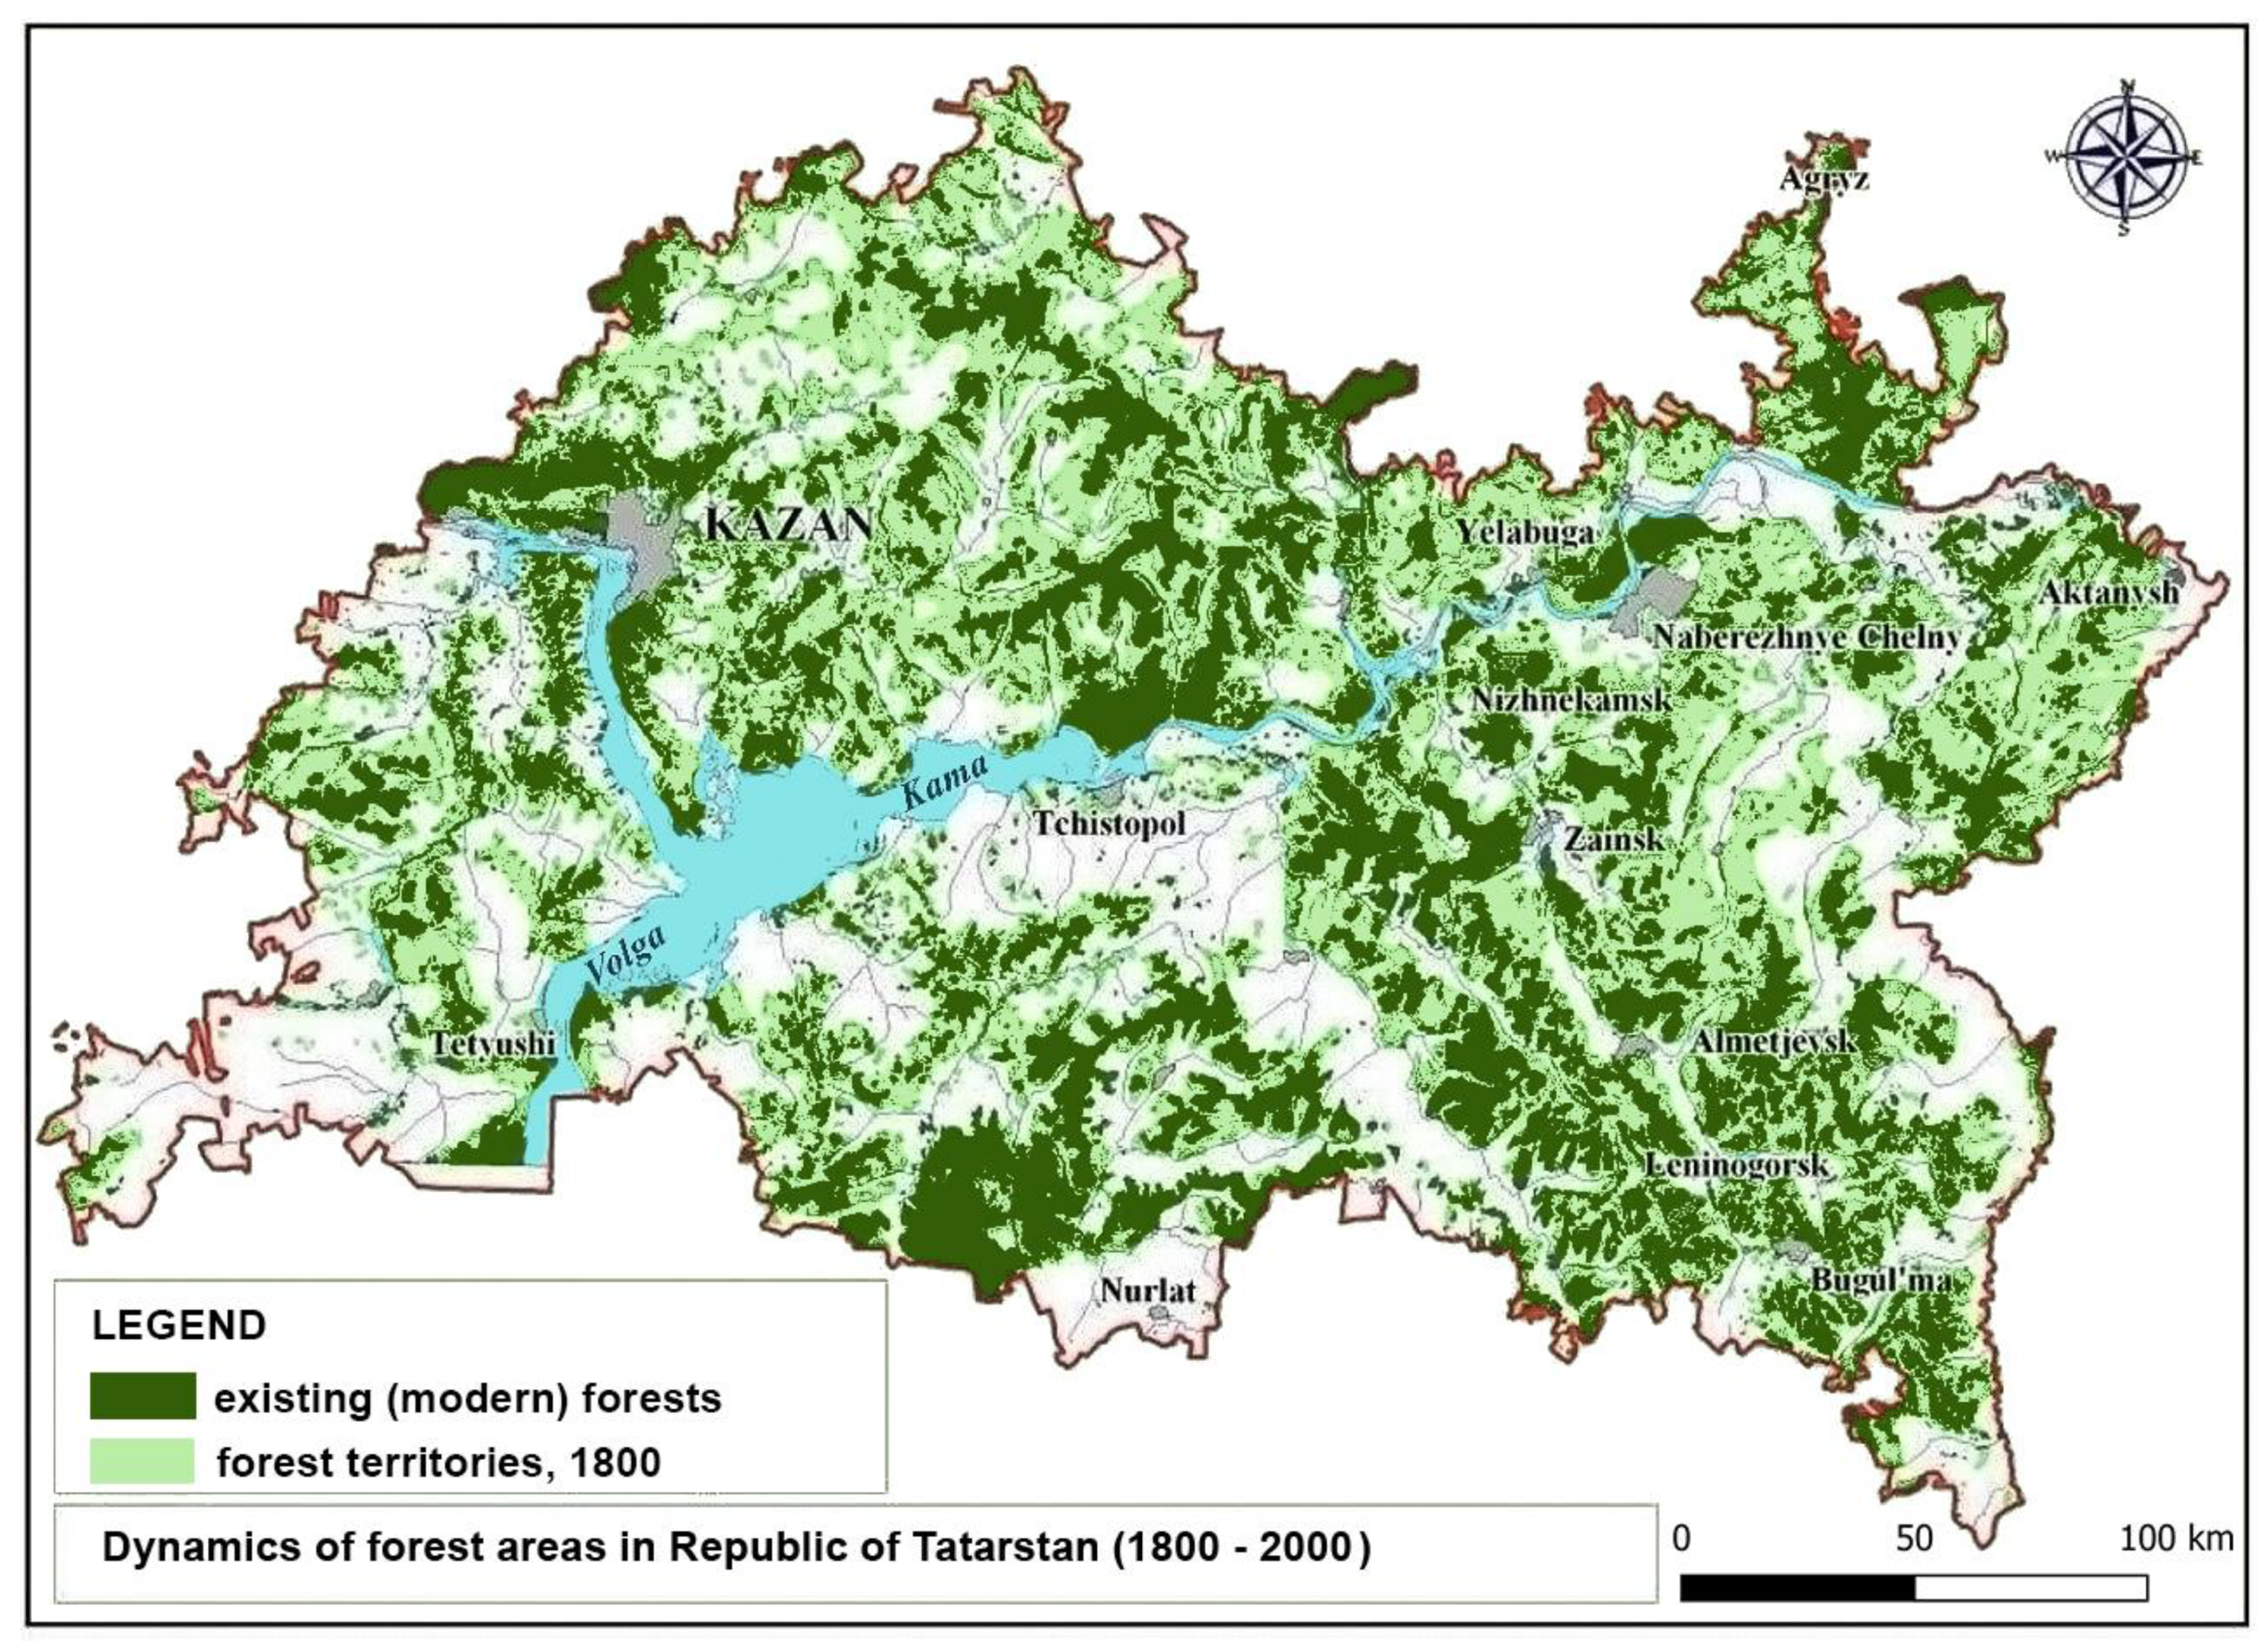
Previous studies have shown that the dissection density of the modern gully network is 10 m/sq km on average and reaches a maximum of 400 m/sq km [51]. When comparing multi-temporal maps of gully dissection density, we can note a clearly defined trend of a sharp decline in the gully network. Density of gully dissection over the last 50–60 years in most of the territory has decreased by an average of 230 m/sq km (Figure 2). The most heavily dissected region of the northern part of the republic with the area of 1.7 thousand sq km (coordinates of angles 50.15, 55.80; 50.82, 56.17) has been selected for development and approbation of the gully detection methodology (Figure 1). The selected region can be considered representative of the diversity of landscape conditions presented here, in which gullies develop in the forest and forest-steppe elevated landscapes of the east of the Russian Plain. The test region belongs to the boreal landscape zone, the sub-taiga landscape subzone. The geological basis of the relief, which are well developed by water latitudinal asymmetric river valleys, which were created by rocks of the Permian age. These are typical red-colored clayey rocks, which are underlain by the thicknesses of tiles passing into lagoon-marine sediments. These rocks are actively involved in the soil formation process. Quaternary sediments are mainly eluvial and deluvial medium and upper Quaternary loams with thickness in the lower parts of slopes from 19 to 21 m. The relief is represented by a hilly plain, dissected by river valleys into wide and gentle ridges. The watersheds are flat. Most of the territory is located at absolute heights of 140–200 m. The territory is dominated by minor (up to 2°) slopes. These are mainly watersheds, upper parts of slopes, floodplains, and river terraces. Steep slopes (>8°) represent only 0.5% of slopes. Besides gully erosion there is active soil erosion: about 40% of arable soils are washed away. The area is located in the moderate continental climate zone with cold winters, warm summers and sufficient precipitation. The average annual air temperature is −3.9 °C, the average temperature in January is −11.9 °C, the average temperature in July is +19.1 °C, and the average long-term annual air temperature amplitude is 53.8 °C. The continental climate coefficient, which includes both temperature conditions and atmospheric humidification of the cold season, is 2.1–2.2. Annual sum of precipitation 480–500 mm. From them in the warm period of the year falls between 320 and 340 mm, and for the period from November to March falls between 160 and 180 mm. Maximum height of snow cover varies from 32 to 44 cm. Water reserves in snow cover increase from north to south up to 148 mm. The density of the river network is on average 0.4 km/sq km. River runoff unit is 3.2 L/s× sq km. The annual runoff unit varies between 4.5 and 5.5 L/s× sq km, increasing from south to north. The runoff coefficient varies between 0.2 and 0.3. Surface river runoff varies from 136 to 161 mm/year. Soil-forming rocks are carbonate-sandy-clayey eluvial and deluvial loams. The predominant soils are forest light (Luvisols) (60%) and sod-podzolic (Albeluvisols, Podzols) (26%) soils. As compared to the 1800s, the area of forests in the region has decreased more than three times from 68% to 22% (Figure 3). The area is more than 50% ploughed.
2.2. Source Materials and Software
Ultra-high resolution DigitalGlobe satellite images (0.6 m) were chosen as the initial Earth remote sensing data. This choice was made based on the image resolution, ensuring continuous coverage of the entire study area, and choosing the best imaging time (second half of spring until the first half of June) for reliable identification of gullies and clear identification of gullies not yet covered by vegetation. However, in order to unify the interpretation methodology and to ensure image availability during the works in other areas the original set of multichannel images was not used, but instead the processed RGB-synthesis of images containing 3 channels with pixel values varying from 0 to 255. The images can be accessed free of charge by the HERE WeGo service [52] via API or Sas.Planet GIS package.
Development, debugging, and obtaining of results was carried out in the Python IDE version 3.7 and the open source neural network library Keras [53], which is an extension over the Tensorflow framework. The U-Net neural network architecture was chosen as a basis for neural network development for segmentation. U-Net is a convolutional neural network, which was created in 2015 for segmentation of biomedical images in the Computer Science department of the University of Freiburg (Germany). The network architecture is a fully interconnected convolutional network modified so that it can work with fewer examples (training images) and more precise segmentation [54]. The neural network contains 24 hidden layers, of which 11 are convolution layers and 13 are deconvolution layers.
2.3. Preparation of a Training Data
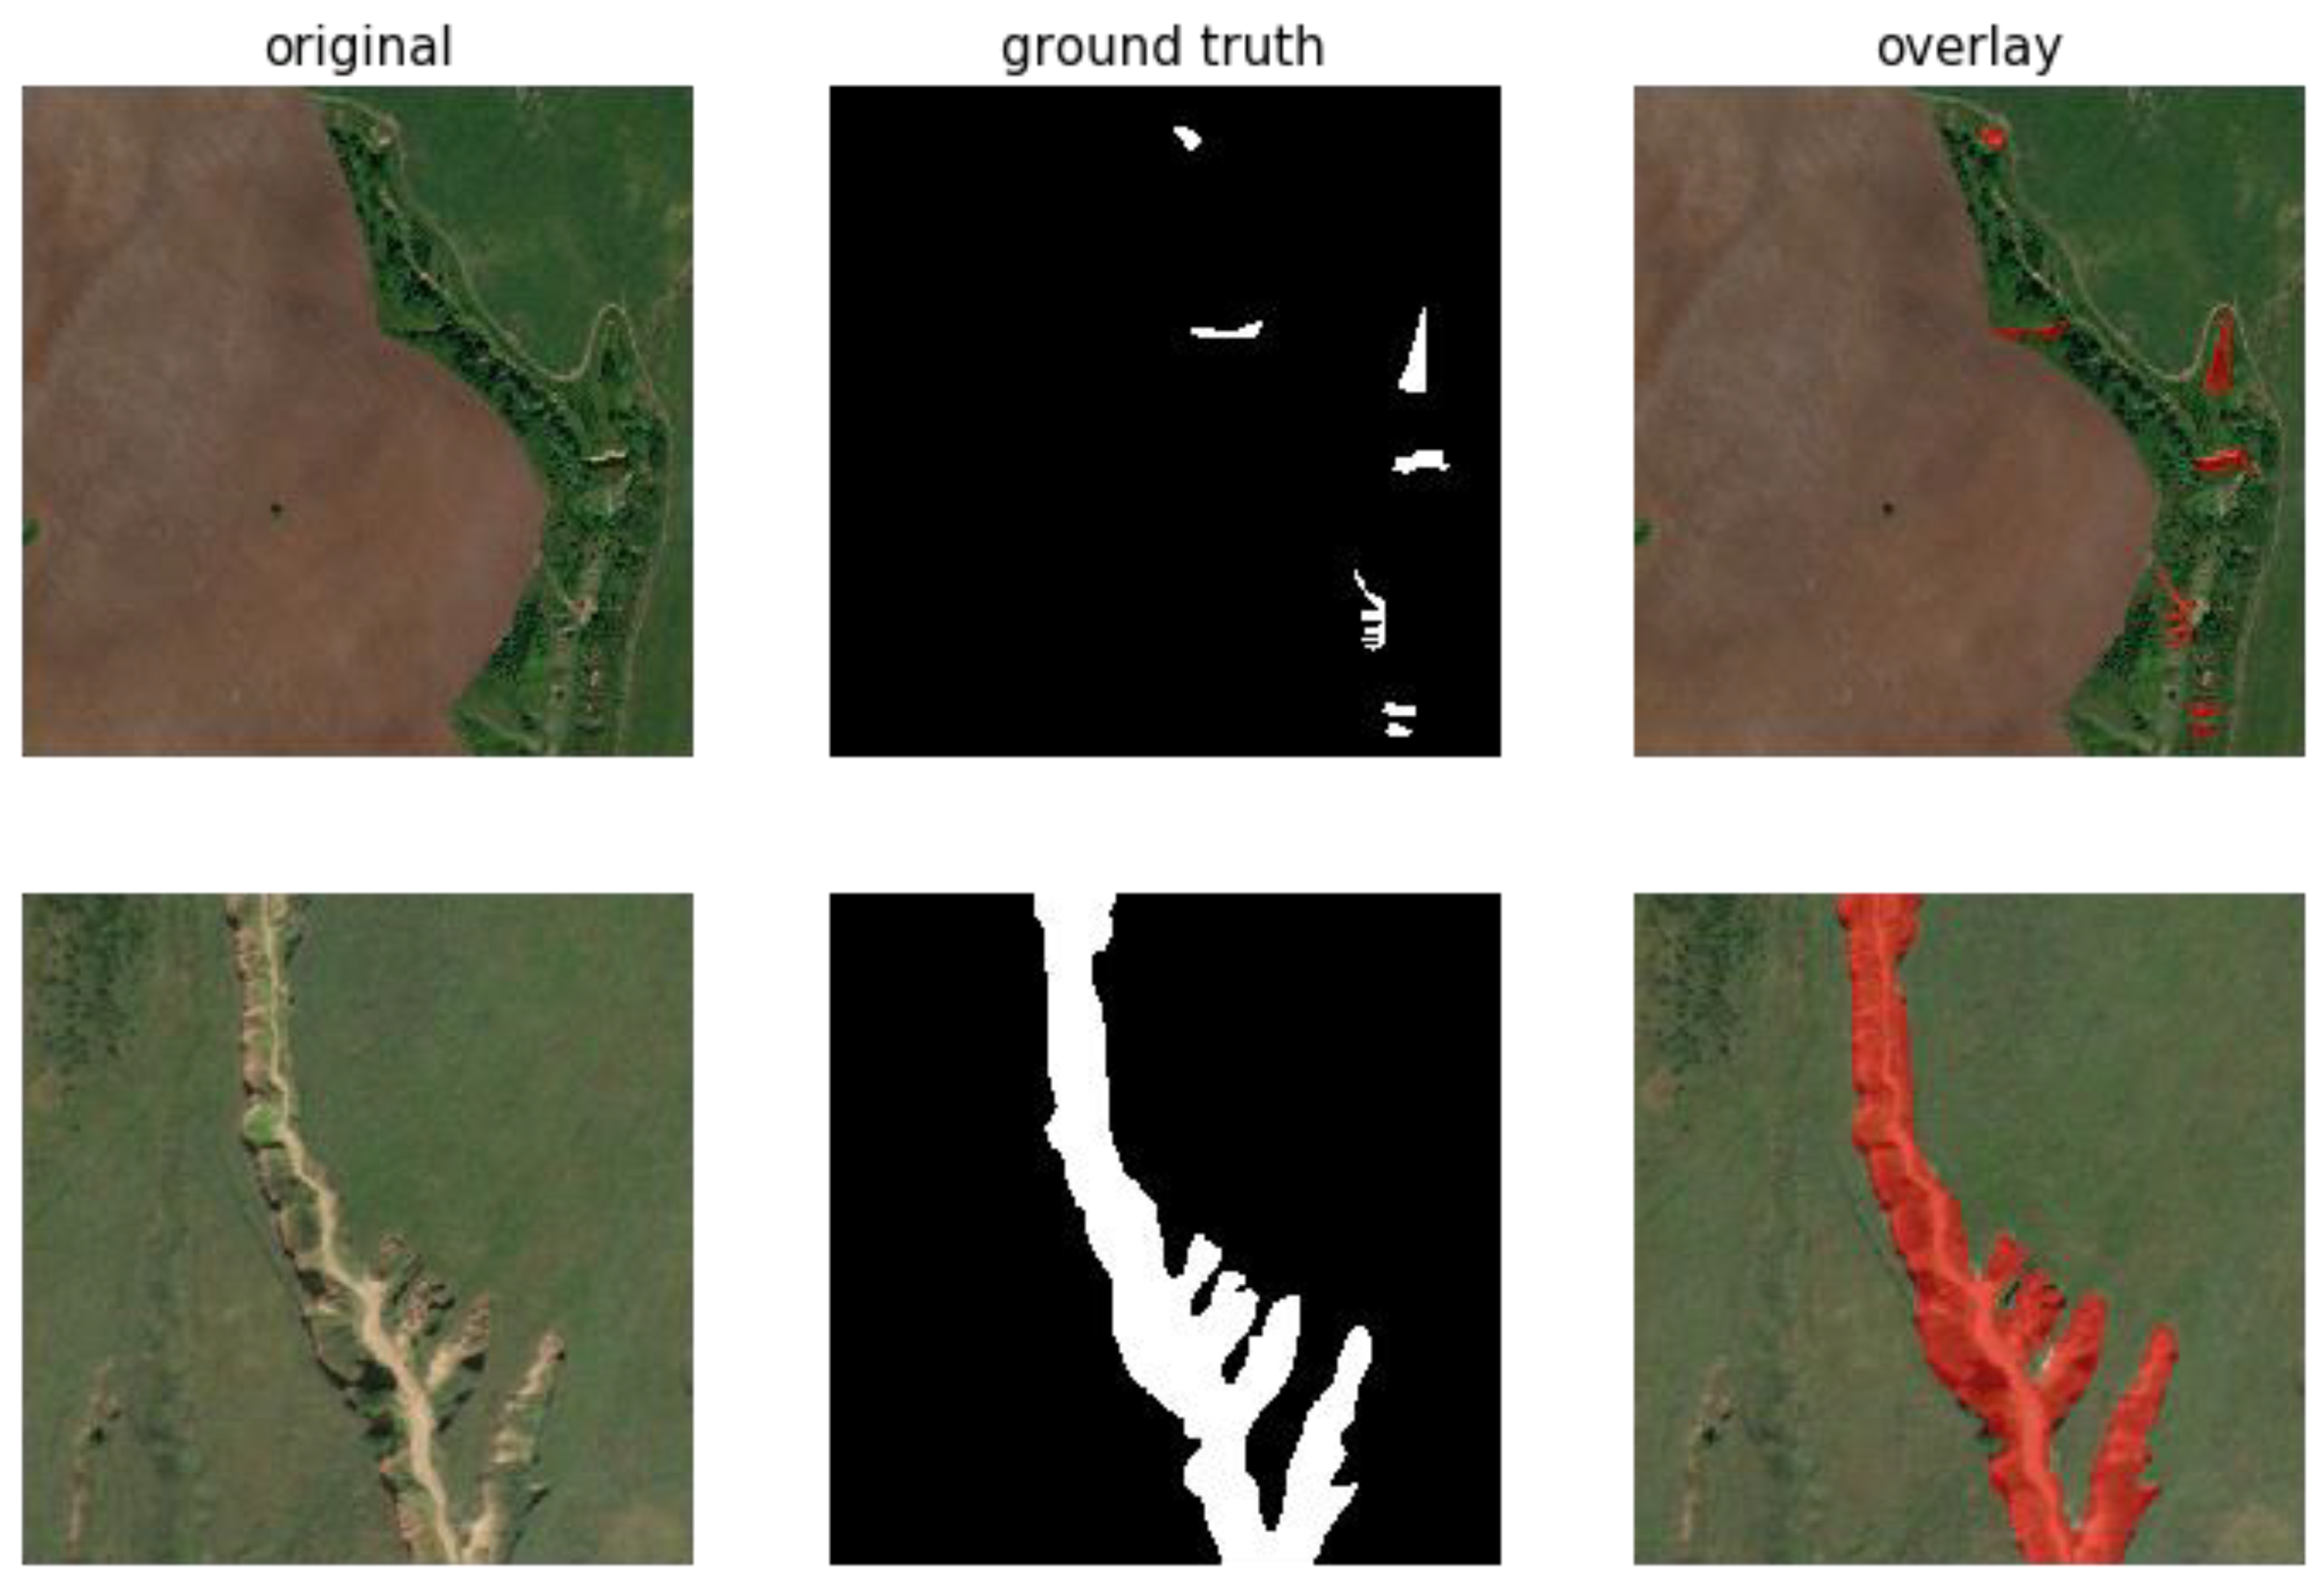
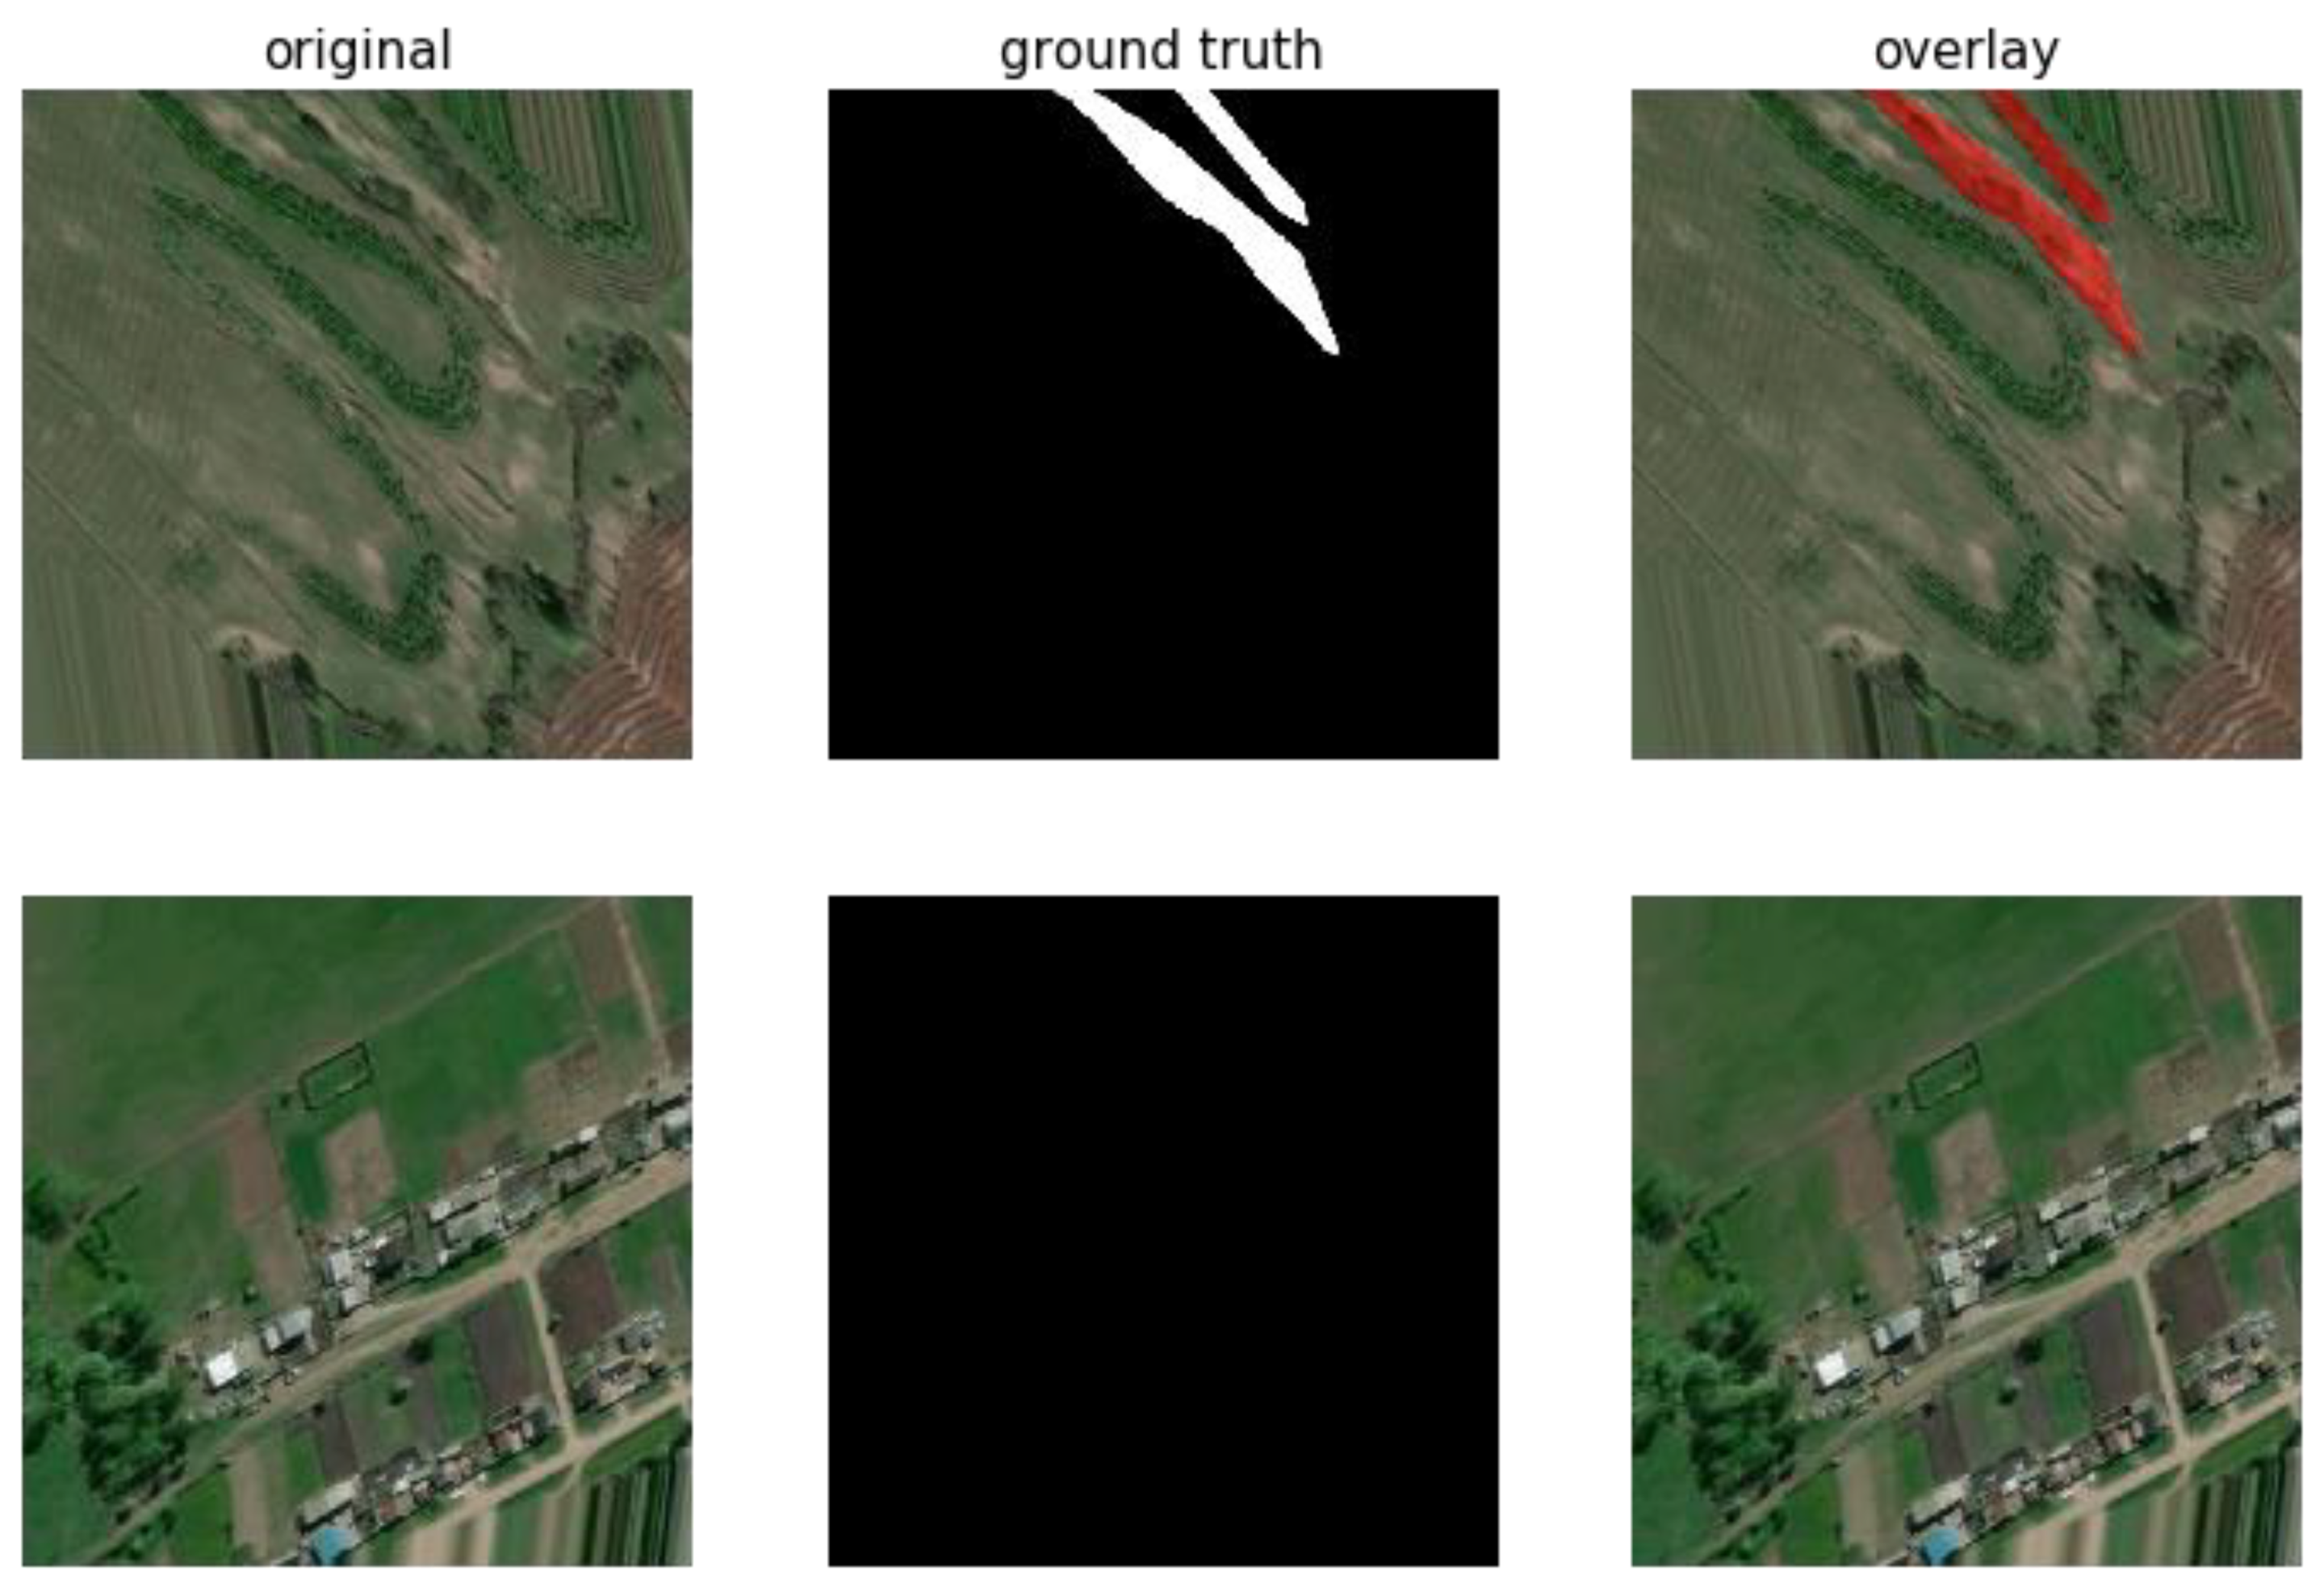
To train any neural network, a training dataset is required that directly depends on the type of neural network to be trained. In our case it is a convolutional neural network, which receives an RGB-synthesis of 512*512 image pixels at the input, and at the output gives a binary image with a mask that highlights the gully shape. In accordance with this, the training dataset consisted of more than 1000 pairs of DigitalGlobe satellite image fragments and a binary mask with the white color of the gully highlighted on this image (Figure 4).
If there was no gully in the fragment, the mask for this fragment was black. The training dataset was prepared in two stages using different tools. First, 219 fragments of 512*512 image pixels were selected, each fragment having a gully. A file mask was prepared for each image in Adobe Photoshop as a pair. This procedure was carried out as an experiment, as at the initial stage it was not completely clear whether the neural network was able to detect and highlight the gully. Later on, the samples were prepared by automated cutting of a large image with a spatial resolution of 0.6 m (15,360 × 15,360 pixels) and a corresponding layer with gully etalons in the form of a mask of similar size for 900 fragments. Then the prepared dataset was divided into a training dataset itself (80% of the entire dataset) and a test dataset (the remaining 20% of the entire dataset). To ensure better recognition accuracy the training sample was artificially enhanced by three times by random sequential and combined rotation, shift, compression and stretching of the source images of the training sample (Figure 5).
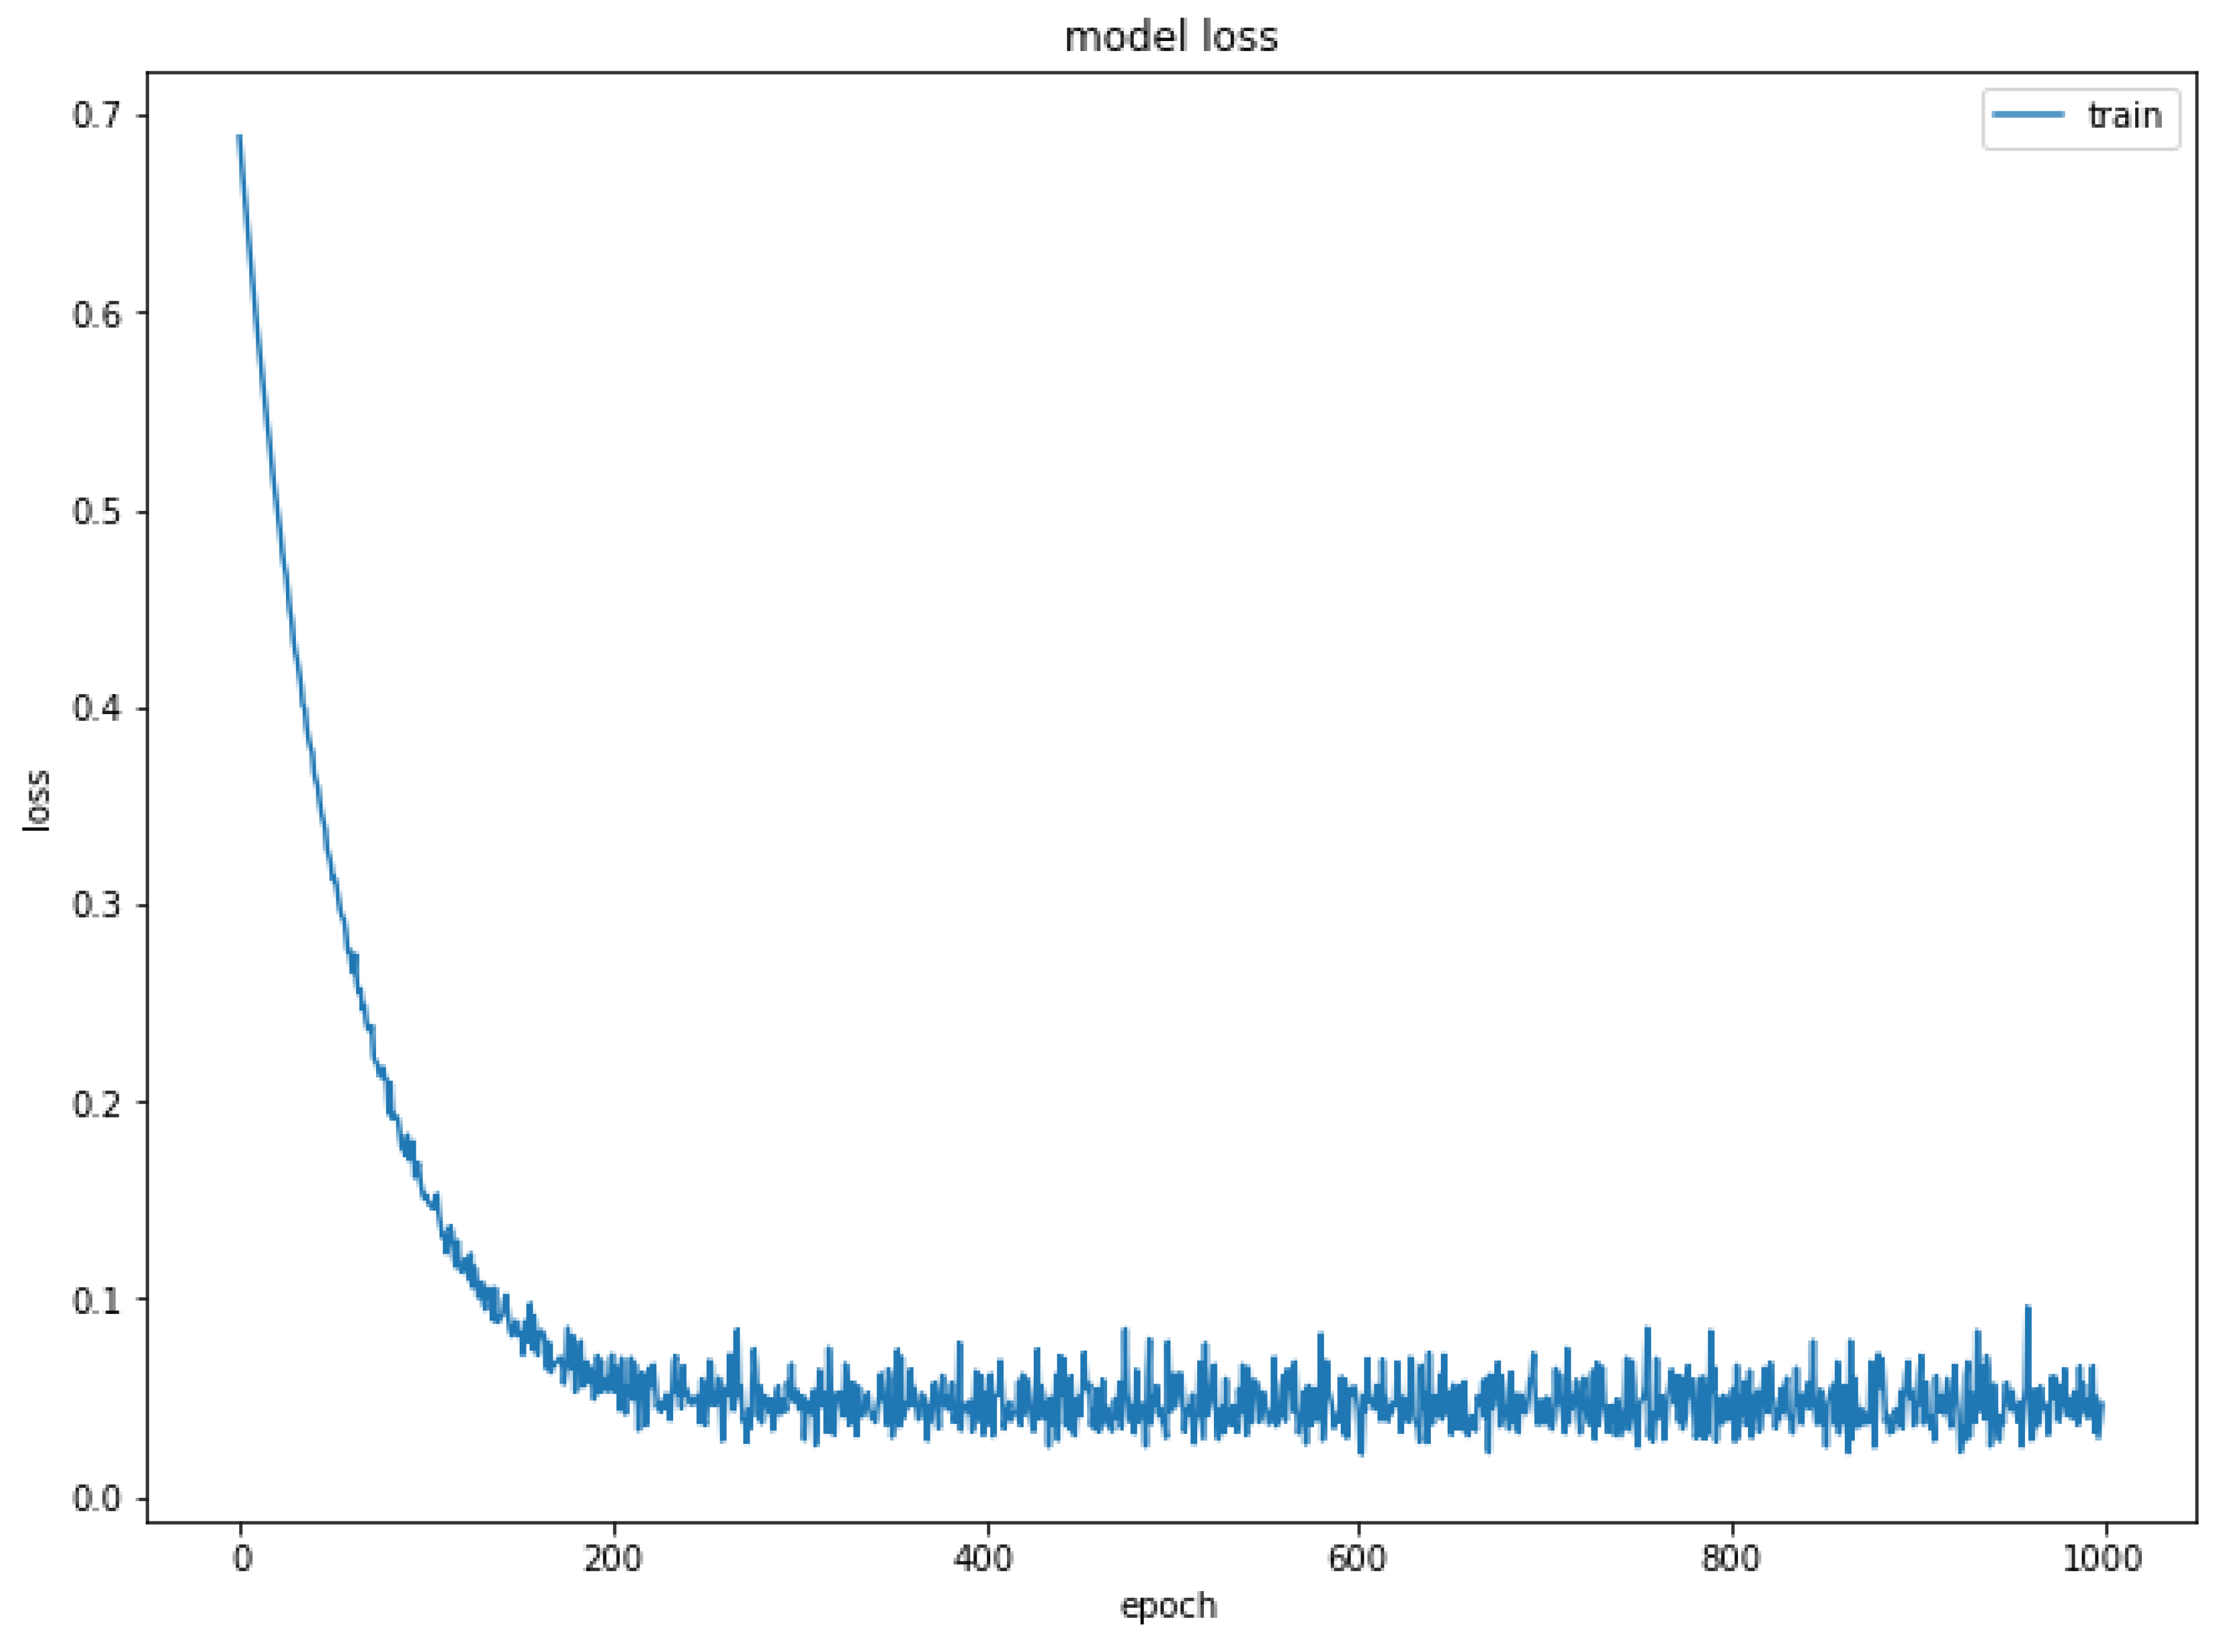
After the preparation of the training set of images, the training procedure of the gully erosion convolutional neural network (GECNN) was carried out. In total the training was carried out during 10 epochs (an epoch is an iteration over the entire x and y data provided [53] at 10 steps per epoch (total number of steps (batches of samples) before declaring one epoch finished and starting the next epoch [53])). The training was carried out until the recognition loss function became larger in comparison to the previous epoch. In the end, a model that can be applied to any image to detect gullies was developed.
The accuracy of training by the results of cross-validation was 0.9971 with the value of the loss function equal to 0.00801 (Figure 6).
3. Results
The developed neural network allowed identifying gully forms on the territory of more than 1.7 thousand sq km. The average dissection density of active gullies was 0.16 ha/sq km. Density was calculated on the basis of the ratio of the area of vectorized polygonal boundaries of gullies to the area of the study area. The average area of the recognized gullies was 0.082 ha, the maximum area was 3.456 ha. Due to the fact that the neural network in a number of cases identifies a gully with gaps in the areas with vegetation cover (meadow and shrub), it is not possible to correctly estimate the length of the entire gully network, however, this problem will be solved by additional training of GECNN.
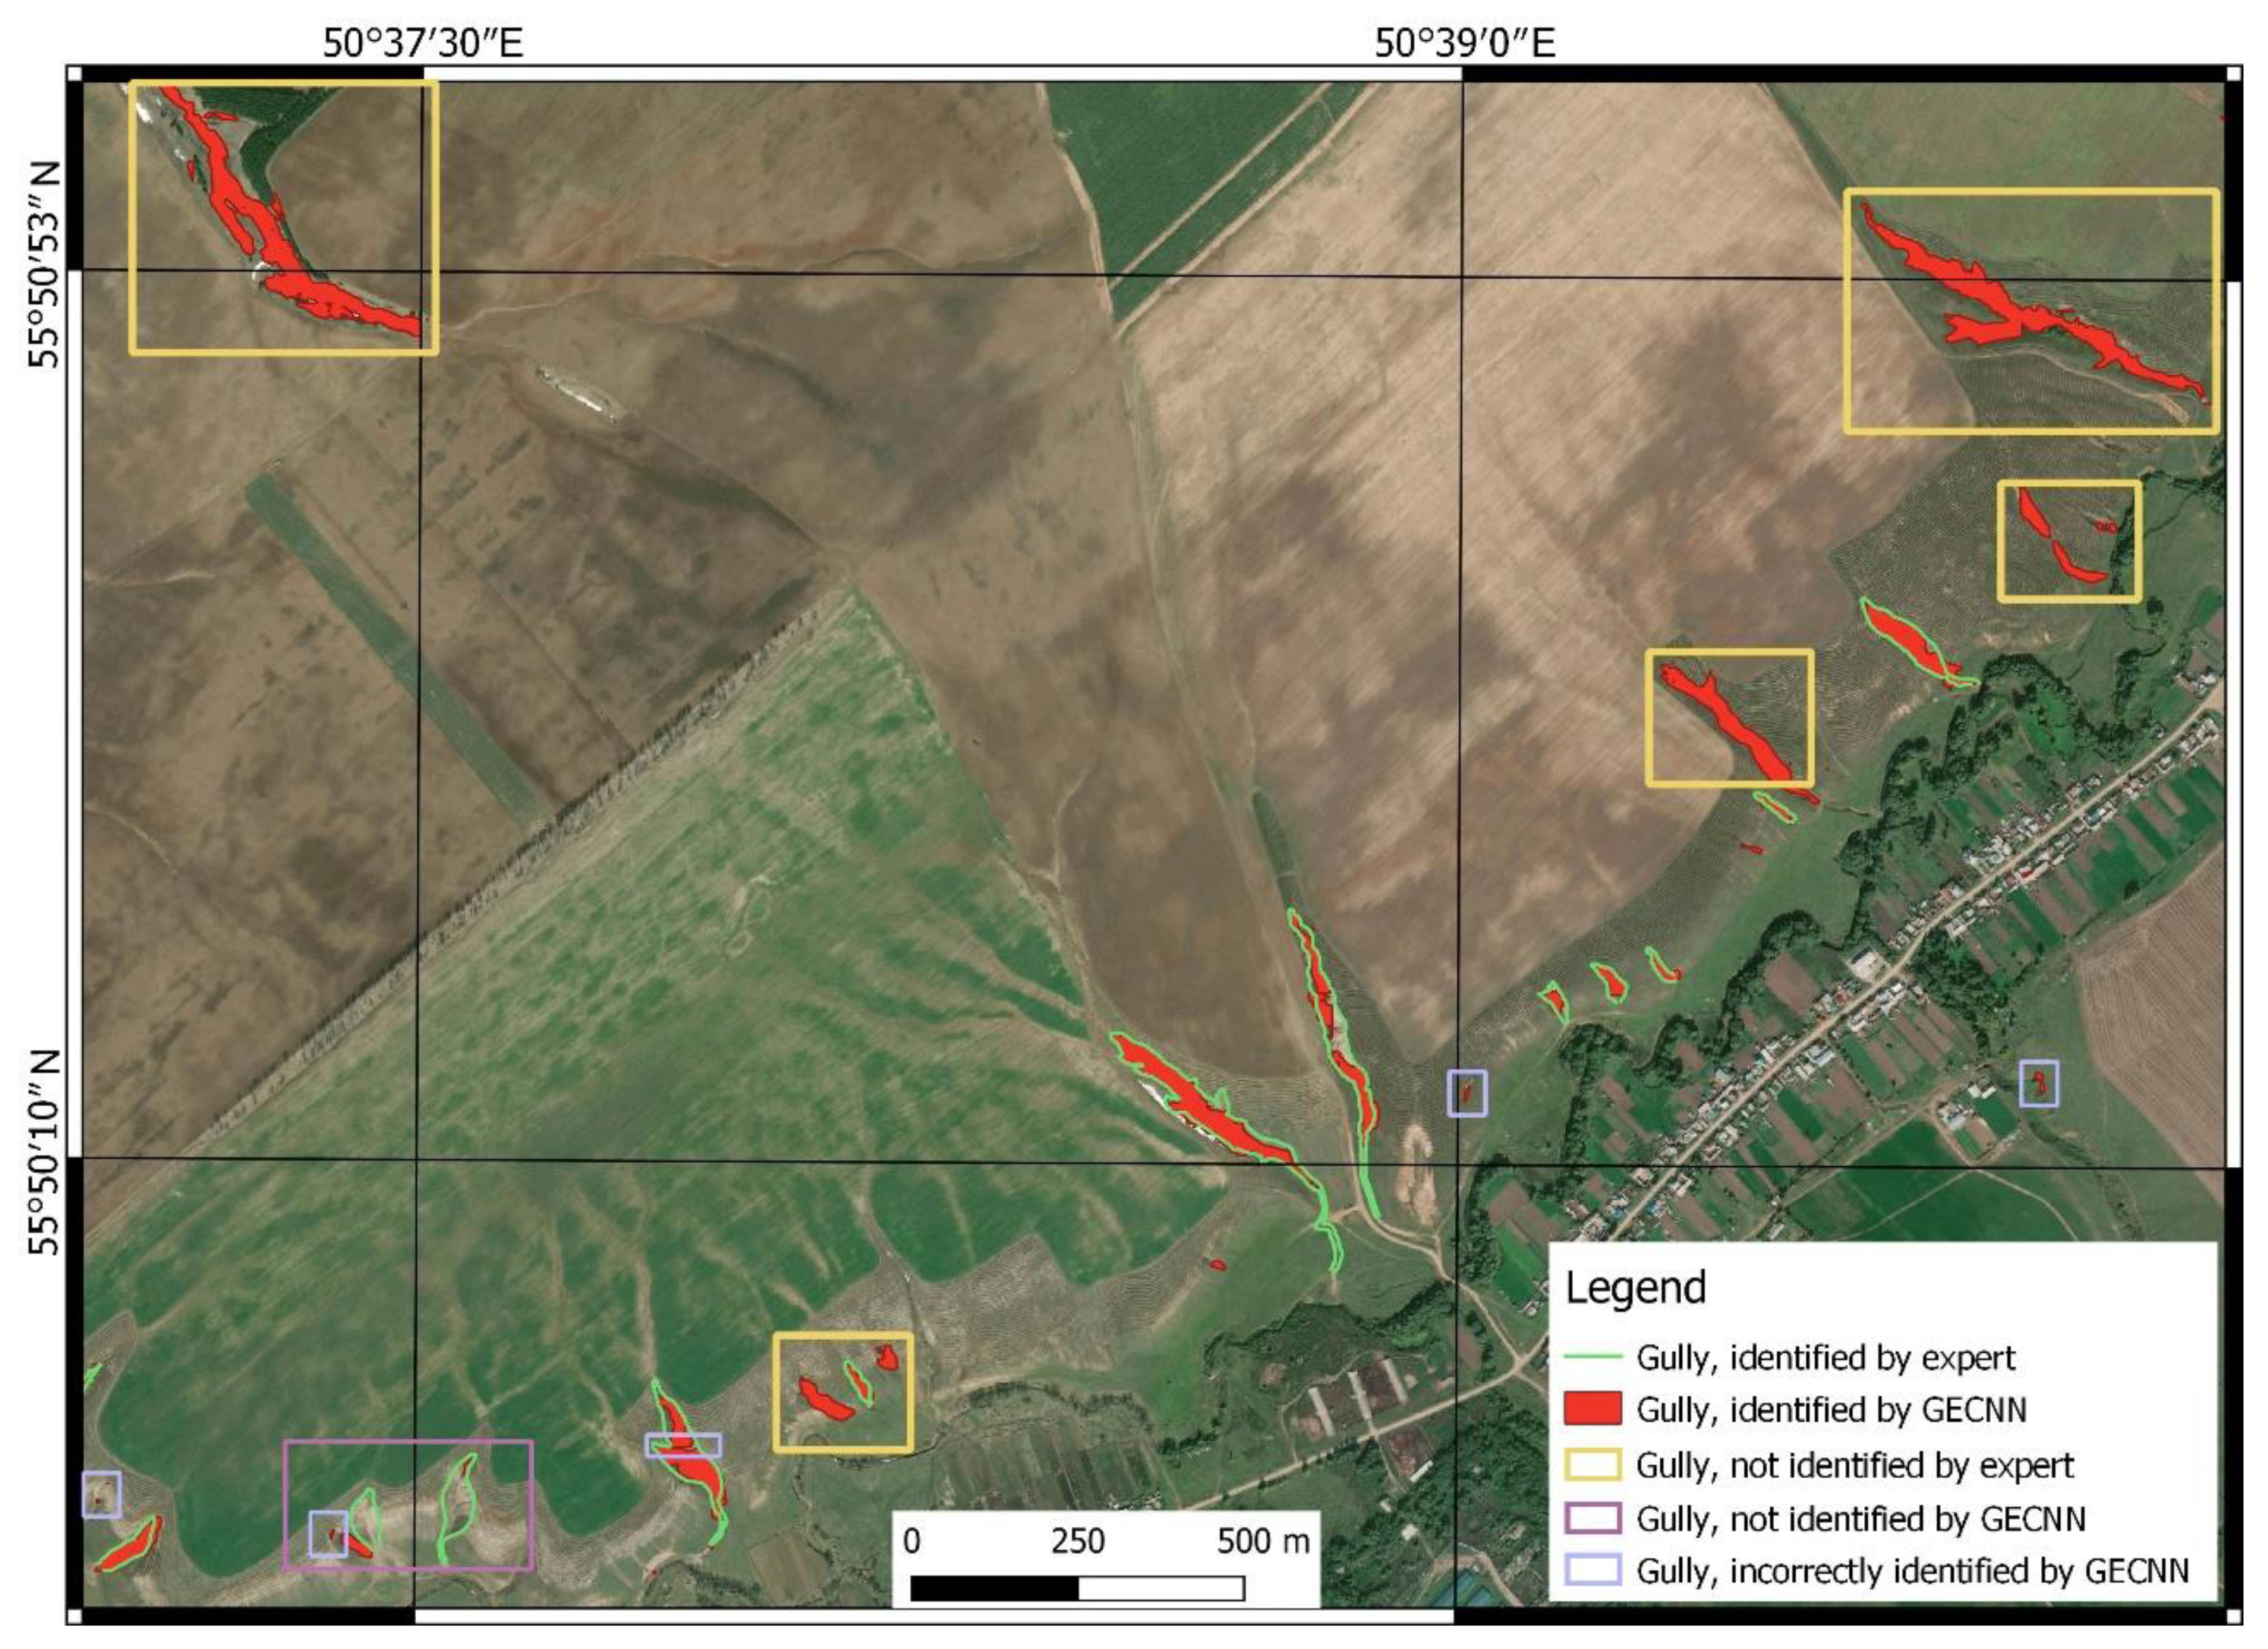
For verification, the results of automatic ravine selection were compared with the data obtained for this area by the expert method—with visual interpretation (Figure 7).
Since there are complexities of quantitative evaluation of objects, which have been singled out in different ways (in some cases some objects are not singled out by an expert, in some cases the algorithm may not identify the object or identify it with low confidence)—it was decided to make both quantitative and qualitative evaluation of the received errors.
The preliminary results show that the gullies identified by experts are half of those identified by GECNN. This is primarily due to the fact that not all objects in the image were classified as “gullies” by the experts. In other cases, the results of gully detection obtained in different ways do not overlap. The F1-Score metric was used to quantify the classifier. F1-Score is a harmonic mean between accuracy and completeness. It tends to zero if accuracy or completeness tends to zero. The resulting neural network classifier is evaluated at F1-Score value equal to 0.7. However, apart from rather good accuracy, it should be noted that the use of “computer vision” even on a small part of the study area of 40 sq km allowed allocating 3.5 times more objects (43 against 12), among which 93% belong to gullies. Assessing the quality of gully detection by GECNN, it should be noted that so far there are gaps (discretization) of the planar form in the selection of large gullies, due to the rotation of naked and overgrown areas. This does not allow identifying the gully as a complete erosion system. Also errors sometimes occur for different reasons. For example, snow-covered gullies (the gully is not identified or partially identified), or if the gully is on landslide slopes with no vegetation (the gully is not precisely shaped) or the gully is on exposed depressions of river valleys (the gully is falsely identified).
4. Discussion
The results show that recognition of gully forms using neural networks and computer vision is possible. However, the resulting GECNN neural network needs to be improved. For this purpose, the original training dataset size needs to be at least doubled. Receiving a neural network will increase productivity many times when assessing gully erosion, because even at this stage of development recognition of objects in the same area takes 10 minutes by an expert, and 29 sec with GECNN. Use of freely available ultra-high resolution satellite images allows unifying the developed methodology and expanding the study area. In case if the neural network starts to produce unpredictable results, it can be retrained on the basis of the reference data from a new territory, thanks to its ability to learn. Finally, it will be possible to comprehensively and objectively assess modern gully erosion and its dynamics in such a large area as the agriculturally developed part of the European part of Russia. Especially worth noting is the fact that according to the preliminary results of GECNN, computer vision algorithms with certainty distinguish the gully from other morphologically well-expressed forms of linear erosion on the slopes: rills, ephemeral gullies and beams. Their visual detection by remote sensing is rather difficult, laborious and very subjective.
Analyzing the results obtained, it is necessary to note several points that highlight the developed method. For example, comparative work on gully detection using GEOBIA (OBIA) methods has been carried out. This method of thematic classification is currently considered as one of the most accurate, so here we will describe it in detail. The results obtained by this method, in fact, do not differ from those that can be obtained by the expert method. Moreover, there is no increase in recognition speed, because for object-oriented image analysis it is necessary to segment the image, select samples with and without gullies and calculate statistics of textures and shape of the object, which even on a powerful computer hardware takes a long time (more than 2 hours for a small area of 40 sq km). Thematic classification of the image takes another 4 hours. At the same time, it should be taken into account that with an increasing number of samples, the time of calculation of statistical indicators increase. There is no doubt that neural network training also requires powerful computer hardware and takes much time, however, it can be reduced by using web servers and computing clusters, such as Google Colab, Amazon S3 or Yandex Cloud, which cannot be done in the case of analysis of images using OBIA. This is due to the existing implementation of algorithms in the form of commercial applications (e.g., eCognition Developer, which we used), or open source packages with very limited functionality, such as GIS GRASS, SAGA, RSGISLib, or Orfeo Toolbox. In addition, it should also be taken into account that OBIA algorithms work well in the case of highly detailed multispectral space imagery data, while our task was to develop a method to find a gully based only on RGB-synthesis of the image without requiring the DEM data or multispectral space imagery.
Analyzing the differences in the results obtained, it is necessary to note the presence of recognition errors using both methods, however, the result obtained using OBIA is not scaled to other areas, while GECNN allows covering a large area. However, the OBIA errors were of a systemic nature: if the gully sample was used for training, it was recognized by the thematic classification. An experiment was conducted to determine if the OBIA algorithm could find the gully. For this purpose, all gullies were identified by the expert in the image area. In the next stage, the OBIA classifier was trained, in which all but one gully recognized by the expert was used as samples. After training the classifier, it was applied to the image, however, the only remaining gully was not found. It follows that despite the fact that form and texture were used as statistical indicators, OBIA is not able to evaluate and extrapolate abstractions, which means that the classifier, no matter how many samples it was trained on, is not suitable for use in other territories.
Assessing the prospects of GECNN scaling, as well as the possibility of applying the neural network in other territories, it should be noted that the current implementation of the algorithm is aimed at identifying gullies in the Republic of Tatarstan, which is representative of the European part of Russia. Considering that images of gullies representing abstract forms are analyzed, there is no difference for the neural network, what type of soil is depicted and what humidity conditions are in the study area (within the European part of Russia). However, in case of necessity, additional training of the model with the use of images of gully development conditions specific for a particular territory will allow, in our opinion, to extend GECNN application possibilities.
5. Conclusions
The method of automated gully detection, which has no analogues at present, is proposed. The use of neural networks makes it possible to identify gully boundaries impartially, which makes it possible to quantitatively estimate not only the area taken by gully processes from agricultural circulation, but also to quickly map and evaluate key indicators of gully erosion. Additional training of GECNN is necessary to solve the problem of false positive recognition of objects, on the one hand, and gaps in mapping existing gullies and planar identification of complex gully systems, different parts of which may be at different stages of their evolution. Obviously, for this purpose it is necessary to increase the training dataset in times, which is not a problem for such a gully affected area of the Eastern Russian Plain and the European part of Russia in general.
Author Contributions
Conceptualization, A.M.G.; formal analysis, A.M.G.; funding acquisition, O.P.Y.; investigation, A.M.G.; methodology, A.M.G.; project administration, O.P.Y.; resources, A.M.G.; supervision, O.P.Y.; validation, A.M.G.; visualization, A.M.G.; writing—original draft, A.M.G. and O.P.Y.; writing—review and editing, O.P.Y. All authors have read and agreed to the published version of the manuscript.
Funding
The work was supported by the Russian Science Foundation (research methods, analysis and results) (project №19-17-00064).
Acknowledgments
The work was performed according to the Russian Government Program of Competitive Growth of Kazan Federal University (translation of text into English and proofreading paper).
Conflicts of Interest
The authors declare no conflict of interest.
References
- Sorokin, A.; Bryzzhev, A.; Strokov, A.; Mirzabaev, A.; Johnson, T.; Kiselev, S.V. The Economics of Land Degradation in Russia. In Economics of Land Degradation and Improvement—A Global Assessment for Sustainable Development; Nkonya, E., Mirzabaev, A., von Braun, J., Eds.; Springer International Publishing: Cham, Switzerland, 2016; pp. 541–576. ISBN 978-3-319-19167-6. [Google Scholar]
- Yermolaev, O.P. Basin approach to the study of erosion processes occurring in the territory of the Russian plain. Res. J. Pharm. Biol. Chem. Sci. 2015, 6, 1649–1654. [Google Scholar]
- Yermolaev, O.P. Erosion processes of the forest and forest-steppe zones in the eastern part of the Russian Plain. World Appl. Sci. J. 2014, 29, 453–459. [Google Scholar]
- Aver’yanova, G.A.; Petrov, G.P. Hydrographic network density of the Middle Volga region. Izv Kazan Branch USSR Energy Water Econ. Ser. 1961, 81–96. (In Russian) [Google Scholar]
- Sementovsky, V.N. Regularities of Platform Relief Morphology: (Case Study of Tatarstan); Izd in Kazan. Un-ta: Kazan, Russia, 1963. (In Russian) [Google Scholar]
- Sobolev, S.S. Development and Control of Erosion Processes in the European Part of the USSR; USSR Academy of Sciences Publishing: Moscow, Russia, 1948; Volume 1. (In Russian) [Google Scholar]
- Zorina, E.F. Gully Erosion: Regularities and Development Potential; GEOS, Moscow State University: Moscow, Russia, 2003. (In Russian) [Google Scholar]
- Kosov, B.F.; Konstantinova, G.S. Complex gully map of the plain territory of the USSR. Geomorphol. RAS 1973, 3–9. (In Russian) [Google Scholar]
- Nikol’skaya, I.I.; Prokhorova, S.D. Cartographic method of gully erosion analysis. Geomorphol. RAS 2015, 44. (In Russian) [Google Scholar]
- Yermolaev, O.P.; Rysin, I.I.; Ivanov, M.A.; Medvedeva, R.A.; Zaytseva, M.Y. Database of Growth Dynamics of the Gully Network of the Udmurt Republic and the Republic of Tatarstan 2016. Available online: https://repository.kpfu.ru/eng/?p_id=162281&p_lang=2 (accessed on 27 May 2020).
- Gafurov, A.M.; Rysin, I.I.; Golosov, V.N.; Grigoryev, I.I.; Sharifullin, A.G. Estimation of the recent rate of gully head retreat on the southern megaslope of the East European Plain using a set of instrumental methods. Vestn. Mosk. Univ. Seriya 5 Geogr. 2018, 2018-January, 61–71. [Google Scholar]
- Medvedeva, R.A.; Golosov, V.N.; Ermolaev, O.P. Spatio-Temporal Assessment of Gully Erosion in the Zone of Intensive Agriculture in the European Part of Russia. Geogr. Nat. Resour. 2018, 39, 204–211. [Google Scholar] [CrossRef]
- Lyubimov, B.P.; Kovalev, S.N. The temporal characteristics of gully erosion under different natural conditions. Geomorphol. RAS 2015, 66. [Google Scholar] [CrossRef]
- Mazaeva, O.; Pellinen, V.; Janicki, G. Development of bank gullies on the shore zone of the Bratsk Reservoir (Russia). Ann. Univ. Mariae Curie-Sklodowska Sect. B 2014, 69, 117–133. [Google Scholar] [CrossRef] [Green Version]
- Ryzhov, I.V.; Vyrkin, V.B. Formirovanie ovragov na yuge Vostochnoĭ Sibiri; Akademicheskoe izdatelʹstvo “GEO”: Novosibirsk, Russia, 2015; ISBN 978-5-906284-83-9. [Google Scholar]
- Veretennikova, M.V.; Zorina, E.F.; Lyubimov, B.P.; Nikolskaya, I.I.; Prokhorova, S.D. Maps of contemporary and prognosticated gully cutting of agricultural lands. Geomorfologiya 1997, 27–33. [Google Scholar]
- Zorina, Y.F.; Katash, I.G.; Lyubimov, B.P.; Nikol’Skaya, I.I.; Prokhorova, S.D. New maps of gully erosion. Mapp. Sci. Remote Sens. 1993, 30, 102–107. [Google Scholar] [CrossRef]
- Yermolaev, O.P.; Medvedeva, R.A.; Platoncheva, E.V. Methodological Approaches to Monitoring Erosion of Agricultural Lands in the European Part of Russia by Using Satellite Imagery. Uchenye Zap. Kazan. Univ.-Seriya Estestv. Nauki 2017, 159, 668–680. [Google Scholar]
- Arabameri, A.; Pradhan, B.; Rezaei, K.; Conoscenti, C. Gully erosion susceptibility mapping using GIS-based multi-criteria decision analysis techniques. CATENA 2019, 180, 282–297. [Google Scholar] [CrossRef]
- Conoscenti, C.; Agnesi, V.; Cama, M.; Caraballo-Arias, N.A.; Rotigliano, E. Assessment of Gully Erosion Susceptibility Using Multivariate Adaptive Regression Splines and Accounting for Terrain Connectivity. Land Degrad. Dev. 2018, 29, 724–736. [Google Scholar] [CrossRef]
- D’Oleire-Oltmanns, S.; Marzolff, I.; Tiede, D.; Blaschke, T. Detection of Gully-Affected Areas by Applying Object-Based Image Analysis (OBIA) in the Region of Taroudannt, Morocco. Remote Sens. 2014, 6, 8287–8309. [Google Scholar] [CrossRef] [Green Version]
- Javidan, N.; Kavian, A.; Pourghasemi, H.R.; Conoscenti, C.; Jafarian, Z. Gully Erosion Susceptibility Mapping Using Multivariate Adaptive Regression Splines—Replications and Sample Size Scenarios. Water 2019, 11, 2319. [Google Scholar] [CrossRef] [Green Version]
- Javidan, N.; Kavian, A.; Pourghasemi, H.R.; Conoscenti, C.; Jafarian, Z. Data Mining Technique (Maximum Entropy Model) for Mapping Gully Erosion Susceptibility in the Gorganrood Watershed, Iran. In Gully Erosion Studies from India and Surrounding Regions; Shit, P.K., Pourghasemi, H.R., Bhunia, G.S., Eds.; Springer International Publishing: Cham, Switzerland, 2020; pp. 427–448. ISBN 978-3-030-23242-9. [Google Scholar]
- Liu, K.; Ding, H.; Tang, G.; Na, J.; Huang, X.; Xue, Z.; Yang, X.; Li, F. Detection of Catchment-Scale Gully-Affected Areas Using Unmanned Aerial Vehicle (UAV) on the Chinese Loess Plateau. Isprs Int. J. Geo-Inf. 2016, 5, 238. [Google Scholar] [CrossRef]
- Noto, L.V.; Bastola, S.; Dialynas, Y.G.; Arnone, E.; Bras, R.L. Integration of fuzzy logic and image analysis for the detection of gullies in the Calhoun Critical Zone Observatory using airborne LiDAR data. Isprs J. Photogramm. Remote Sens. 2017, 126, 209–224. [Google Scholar] [CrossRef] [Green Version]
- Shahabi, H.; Jarihani, B.; Tavakkoli Piralilou, S.; Chittleborough, D.; Avand, M.; Ghorbanzadeh, O. A Semi-Automated Object-Based Gully Networks Detection Using Different Machine Learning Models: A Case Study of Bowen Catchment, Queensland, Australia. Sensors 2019, 19, 4893. [Google Scholar] [CrossRef] [Green Version]
- Mararakanye, N.; Nethengwe, N.S. Gully Features Extraction Using Remote Sensing Techniques. S. Afr. J. Geomat. 2012, 1, 10. [Google Scholar]
- Torkashvand, A.M. Investigation of Some Methodologies for Gully Erosion Mapping. J. Appl. Sci. 2008, 8, 2435–2441. [Google Scholar] [CrossRef]
- Torkashvand, A.M.; Alipour, H.R. Investigation of the Possibility to Prepare Supervised Classification Map of Gully Erosion by RS and GIS. Int. J. Geol. Environ. Eng. 2009, 3, 203–205. [Google Scholar]
- Conoscenti, C.; Angileri, S.; Cappadonia, C.; Rotigliano, E.; Agnesi, V.; Märker, M. Gully erosion susceptibility assessment by means of GIS-based logistic regression: A case of Sicily (Italy). Geomorphology 2014, 204, 399–411. [Google Scholar] [CrossRef] [Green Version]
- Tarolli, P. High-resolution topography for understanding Earth surface processes: Opportunities and challenges. 2014, 216, 295–312. Geomorphology 2014, 216, 295–312. [Google Scholar] [CrossRef]
- Gafurov, A.M. Small catchments DEM creation using Unmanned Aerial Vehicles. IOP Conf. Ser. Earth Environ. Sci. 2018, 107, 012005. [Google Scholar] [CrossRef]
- Yermolaev, O.P.; Gafurov, A.M.; Usmanov, B.M. Evaluation of Erosion Intensity and Dynamics Using Terrestrial Laser Scanning. Eurasian Soil Sci. 2018, 51, 814–826. [Google Scholar] [CrossRef]
- Guirado, E.; Tabik, S.; Alcaraz-Segura, D.; Cabello, J.; Herrera, F. Deep-learning Versus OBIA for Scattered Shrub Detection with Google Earth Imagery: Ziziphus lotus as Case Study. Remote Sens. 2017, 9, 1220. [Google Scholar] [CrossRef] [Green Version]
- Ma, L.; Liu, Y.; Zhang, X.; Ye, Y.; Yin, G.; Johnson, B.A. Deep learning in remote sensing applications: A meta-analysis and review. ISPRS J. Photogramm. Remote Sens. 2019, 152, 166–177. [Google Scholar] [CrossRef]
- Zhu, X.X.; Tuia, D.; Mou, L.; Xia, G.-S.; Zhang, L.; Xu, F.; Fraundorfer, F. Deep Learning in Remote Sensing: A Comprehensive Review and List of Resources. IEEE Geosci. Remote Sens. Mag. 2017, 5, 8–36. [Google Scholar] [CrossRef] [Green Version]
- Li, W.; Fu, H.; Yu, L.; Gong, P.; Feng, D.; Li, C.; Clinton, N. Stacked Autoencoder-based deep learning for remote-sensing image classification: a case study of African land-cover mapping. Int. J. Remote Sens. 2016, 37, 5632–5646. [Google Scholar] [CrossRef]
- Mondal, A.; Khare, D.; Kundu, S.; Mukherjee, S.; Mukhopadhyay, A.; Mondal, S. Uncertainty of soil erosion modelling using open source high resolution and aggregated DEMs. Geosci. Front. 2017, 8, 425–436. [Google Scholar] [CrossRef] [Green Version]
- Zhang, Z.; Liu, Q.; Wang, Y. Road Extraction by Deep Residual U-Net. IEEE Geosci. Remote Sens. Lett. 2018, 15, 749–753. [Google Scholar] [CrossRef] [Green Version]
- Basu, S.; Ganguly, S.; Mukhopadhyay, S.; DiBiano, R.; Karki, M.; Nemani, R. DeepSat: A learning framework for satellite imagery. In Proceedings of the 23rd SIGSPATIAL International Conference on Advances in Geographic Information Systems, Seattle, DC, USA, , 3–6 November 2015; pp. 1–10. [Google Scholar]
- Narine, L.L.; Popescu, S.C.; Malambo, L. Synergy of ICESat-2 and Landsat for Mapping Forest Aboveground Biomass with Deep Learning. Remote Sens. 2019, 11, 1503. [Google Scholar] [CrossRef]
- Papadomanolaki, M.; Vakalopoulou, M.; Zagoruyko, S.; Karantzalos, K. Benchmarking deep learning frameworks for the classification of very high resolution satellite multispectral data. ISPRS Ann. Photogramm. Remote Sens. Spat. Inf. Sci. 2016, III–7, 83–88. [Google Scholar] [CrossRef]
- Scott, G.J.; England, M.R.; Starms, W.A.; Marcum, R.A.; Davis, C.H. Training Deep Convolutional Neural Networks for Land–Cover Classification of High-Resolution Imagery. IEEE Geosci. Remote Sens. Lett. 2017, 14, 549–553. [Google Scholar] [CrossRef]
- Shafaey, M.A.; Salem, M.A.-M.; Ebied, H.M.; Al-Berry, M.N.; Tolba, M.F. Deep Learning for Satellite Image Classification. In Proceedings of the International Conference on Advanced Intelligent Systems and Informatics, Cairo, Egypt, 1–3 September 2018; Hassanien, A.E., Tolba, M.F., Shaalan, K., Azar, A.T., Eds.; Springer International Publishing: Cham, Switzerland, 2019; pp. 383–391. [Google Scholar]
- Zou, Q.; Ni, L.; Zhang, T.; Wang, Q. Deep Learning Based Feature Selection for Remote Sensing Scene Classification. IEEE Geosci. Remote Sens. Lett. 2015, 12, 2321–2325. [Google Scholar] [CrossRef]
- Krizhevsky, A.; Sutskever, I.; Hinton, G.E. ImageNet classification with deep convolutional neural networks. Commun. ACM 2017, 60, 84–90. [Google Scholar] [CrossRef]
- Szegedy, C.; Liu, W.; Jia, Y.; Sermanet, P.; Reed, S.; Anguelov, D.; Erhan, D.; Vanhoucke, V.; Rabinovich, A. Going deeper with convolutions. In Proceedings of the 2015 IEEE Conference on Computer Vision and Pattern Recognition (CVPR), Boston, MA, USA, 7–12 June 2015; IEEE: Boston, MA, USA, 2015; pp. 1–9. [Google Scholar]
- Simonyan, K.; Zisserman, A. Very deep convolutional networks for large-scale image recognition. arXiv 2015, arXiv:1409.1556, 14. [Google Scholar]
- Vanmaercke, M.; Poesen, J.; Van Mele, B.; Demuzere, M.; Bruynseels, A.; Golosov, V.; Bezerra, J.F.R.; Bolysov, S.; Dvinskih, A.; Frankl, A.; et al. How fast do gully headcuts retreat? Earth-Sci. Rev. 2016, 154, 336–355. [Google Scholar] [CrossRef]
- Yermolayev, O.P.; Rysin, I.I.; Golosov, V.N. Mapping assessment of gully erosion in the east of the Russian plain. Geomorphol. RAS 2017, 38–51. [Google Scholar] [CrossRef]
- Medvedeva, R.A. Trends of the gully erosion development in the territory of the Republic of Tatarstan. IOP Conf. Ser. Earth Environ. Sci. 2018, 107, 012016. [Google Scholar] [CrossRef]
- HERE WeGo. Available online: https://wego.here.com/ (accessed on 16 January 2020).
- Home—Keras Documentation. Available online: https://keras.io/ (accessed on 17 January 2020).
- Ronneberger, O.; Fischer, P.; Brox, T. U-Net: Convolutional Networks for Biomedical Image Segmentation. arXiv 2015, arXiv:150504597. [Google Scholar]
Figure 1.
Study area.

Figure 2.
Dynamics of the gully network for the period 1970–2017 on the territory of the Republic of Tatarstan (RT) (“minus” means reduction of the dissection density (the total length of the entire gully network in the river basin, divided by its area)).
Figure 2.
Dynamics of the gully network for the period 1970–2017 on the territory of the Republic of Tatarstan (RT) (“minus” means reduction of the dissection density (the total length of the entire gully network in the river basin, divided by its area)).

Figure 3.
Dynamics of forest areas in the Republic of Tatarstan (1800–2000).

Figure 4.
Example of the initial training dataset.

Figure 5.
An example of a transformed training dataset.

Figure 6.
Gully erosion convolutional neural network (GECNN) neural network training graphics.

Figure 7.
Typical errors detected when comparing gullies identified in different ways.

© 2020 by the authors. Licensee MDPI, Basel, Switzerland. This article is an open access article distributed under the terms and conditions of the Creative Commons Attribution (CC BY) license (http://creativecommons.org/licenses/by/4.0/).
Share and Cite
MDPI and ACS Style
Gafurov, A.M.; Yermolayev, O.P. Automatic Gully Detection: Neural Networks and Computer Vision. Remote Sens. 2020, 12, 1743. https://0-doi-org.brum.beds.ac.uk/10.3390/rs12111743
AMA Style
Gafurov AM, Yermolayev OP. Automatic Gully Detection: Neural Networks and Computer Vision. Remote Sensing. 2020; 12(11):1743. https://0-doi-org.brum.beds.ac.uk/10.3390/rs12111743
Chicago/Turabian StyleGafurov, Artur M., and Oleg P. Yermolayev. 2020. "Automatic Gully Detection: Neural Networks and Computer Vision" Remote Sensing 12, no. 11: 1743. https://0-doi-org.brum.beds.ac.uk/10.3390/rs12111743
Note that from the first issue of 2016, this journal uses article numbers instead of page numbers. See further details here.