Article

remotIO: A Sentinel-1 Multi-Temporal InSAR Infrastructure Monitoring Service with Automatic Updates and Data Mining Capabilities

1
Insar.sk Ltd., Lesna 35, 08001 Presov, Slovakia
2
Department of Environmental Management, Faculty of Management, University of Presov in Presov, 08001 Presov, Slovakia
3
Department of Theoretical Geodesy, Faculty of Civil Engineering, Slovak University of Technology in Bratislava, 81105 Bratislava, Slovakia
4
RASER Limited, Unit 609, 9Wing Hong Street, Lai Chi Kok, Hong Kong, China
*
Author to whom correspondence should be addressed.
Remote Sens. 2020, 12(11), 1892; https://0-doi-org.brum.beds.ac.uk/10.3390/rs12111892
Submission received: 30 April 2020 / Revised: 5 June 2020 / Accepted: 7 June 2020 / Published: 11 June 2020

Abstract

:
Multi-temporal synthetic aperture radar interferometry (MT-InSAR) is nowadays a well-developed remote sensing technique for monitoring of Earth’s surface deformation. The availability of regular and open Copernicus Sentinel-1 satellite data with enhanced spatiotemporal coverage has recently stimulated several initiatives for development of new monitoring services which can help to respond to emergencies faster and apply resilience measures more accurately as compared to conventional ground-based techniques. In this paper, the alpha version of the remotIO (Retrieval of Motions and Potential Deformation Threats) system is presented. It is currently able to provide continuous and autonomous updates of MT-InSAR results and post-processing methodology over sites with active deformation hazards to ease the interpretation and facilitate decision-supporting tools for on-time situational awareness. Our post-processing approach implemented in remotIO’s web application has proven to be useful in filtering the resultant deformation maps and in pinpointing problematic zones with potential ground deformation threats also over low-coherent areas.

Graphical Abstract

1. Introduction

In the last decades, synthetic aperture radar interferometry (InSAR) has proven to be a cost-effective technique for measuring subtle deformation with precision at the order of a centimeter to as much as a few millimeters. InSAR employs satellite radar images acquired by sensors with all-weather, day/night, high spatial resolution and wide area coverage imaging capabilities. Furthermore, satellite radar images have been acquired for almost 28 years already, and new images are continuously collected all over the world.
Conventional in-situ monitoring techniques provide point-wise information of the displacement activity; however, they often lack efficient and timely updates. InSAR as a remote sensing technique could complement or sometimes outperform ground-based methods by its ability to monitor tiny surface deformations over wide-areas without the need for in-situ observations or special equipment installation in the areas of interest.
The pioneer in multi-temporal InSAR (MT-InSAR) algorithms is the Permanent Scatterer InSAR technique [1,2]. Since its development, many groups worldwide have proposed different MT-InSAR approaches [3], such as Small Baseline Subset (SBAS) [4], the Interferometric Point Target Analysis (IPTA) [5,6], the Coherence Pixel Technique (CPT) [7,8], the Stanford method for PS (StaMPS) [9,10,11,12], the Stable Point Network (SPN) [13,14], the Persistent Scatterer Pairs (PSP) technique [15], the Temporarily coherent point interferometry (TCP) [16] or state-of-the-art Sequential Estimator [17,18].
Multi-temporal InSAR approaches are successfully applied for measuring subtle deformations which either occur naturally (volcano dynamics, co-seismic and post-seismic deformations along active faults, slope instability, subsidence phenomena, etc.) [19] or are anthropologically induced (mining, gas extraction, oil pumping, structural health monitoring, etc.) [20,21,22]. Due to typical precision of MT-InSAR results—<1–2 mm/year in estimating the displacement rate or <5 mm in estimating a single point displacement—the InSAR technology is gaining importance in structural health monitoring applications [23,24,25].
An effective InSAR monitoring strategy using regular Sentinel-1 acquisitions shall be able to acquire displacement parameters of the monitored areas continuously [26,27,28,29]. Thanks to improvements offered by Sentinel-1, new services are being introduced [30,31,32,33,34,35] and technology opens for new tools and procedures to be developed.
The spatial distribution of velocities as visible from a standard point cloud map might be affected by noises, which also depends on the quality of data processing and on the ability of InSAR interpreter to analyze the data. While producing final deformation maps, usually thresholds are applied in order to sample only highly coherent radar targets. Thresholding on coherence might, however, cause misinterpretation of the results over areas undergoing more complex deformation scenarios. If the discrepancies in the areas of moderate coherence share similar behavior in terms of estimated parameters, it is important to take into account their spatial correlation for correct inference.
Linear trends (i.e., displacement velocities) might be used to analyze the movements; however, alone, they are not providing information on the probability of movement for intervening areas. Velocities alone are sometimes not sufficient for interpretation purposes, especially for those areas that are affected by other than (usually assumed) linear movements.
This research aims to further develop a proposed approach [36] for the detection of different deformation patterns caused by different triggering factors, which are not recognizable by conventional analyses of the average line-of-sight (LOS) velocities alone.
For a better disentangling between technological constraints of InSAR and actual deformation processes, it is necessary to develop an effective identification methods and event recognition analysis to adopt appropriate risk mitigation strategies. Although various methodologies were implemented to map potentially hazardous areas from MT-InSAR displacement maps [37,38,39,40,41,42,43,44], most of them are adversely affected by deficiencies:
  • They are based on the assessment of a single variable, e.g., velocity.
  • They rely only on displacement time series analysis, producing less reliable outputs for smaller or non-equally sampled datasets, while ignoring underlying spatial relations.
  • They lack robustness for performing analysis solely on a set of highly coherent points.
  • They require manual handling of the data in different software or Geographic Information Systems (GIS).
  • They incorporate distortion to the spatial composition of point networks by involving interpolation or gridding.
  • Their application is limited to a one-off activity and utilization of a single technique (e.g., clustering only).
  • They do not support the analysis of more complex deformation scenarios over low-coherent areas.
Research and development of this topic aims to propose an effective way of extracting useful information from Multi-temporal InSAR deformation maps while providing an innovative approach for detection of outliers and potential deformation threats and for correct handling of the information over low-coherent areas, as also recommended in [45].
Our proposed data mining approach [36] allows for minimization of outliers in final results while preserving spatial dependency among low-coherent observations. Such localities might represent areas with fast deformation processes, seasonal changes and other effects or represent noise and inconsistencies added into the final results. These would remain undetected, especially over wide areas monitored by Sentinel-1, as their coherence is often weakened and by the rules of standard thresholding procedure they would be discarded. The information and full range of coherence over low-coherent areas might, however, be exploited in a similar way as the coherence is used in thematic mapping applications such as change detection.
While the operational nature of Sentinel-1 opens for the exploitation of InSAR data on an unprecedented level, the InSAR community faces new challenges [46], among them large data volumes and inadequate tools. The research and development of both the methodological approach and remotIO’s web-based platform are sought to enhance good practice and user experience and promote the diffusion of data derived from Sentinel-1 interferometry.

2. Study Area and Data

Within the scope of remotIO project, continuous MT-InSAR monitoring and all displacement products are provided for following pilot scenarios in Slovakia:
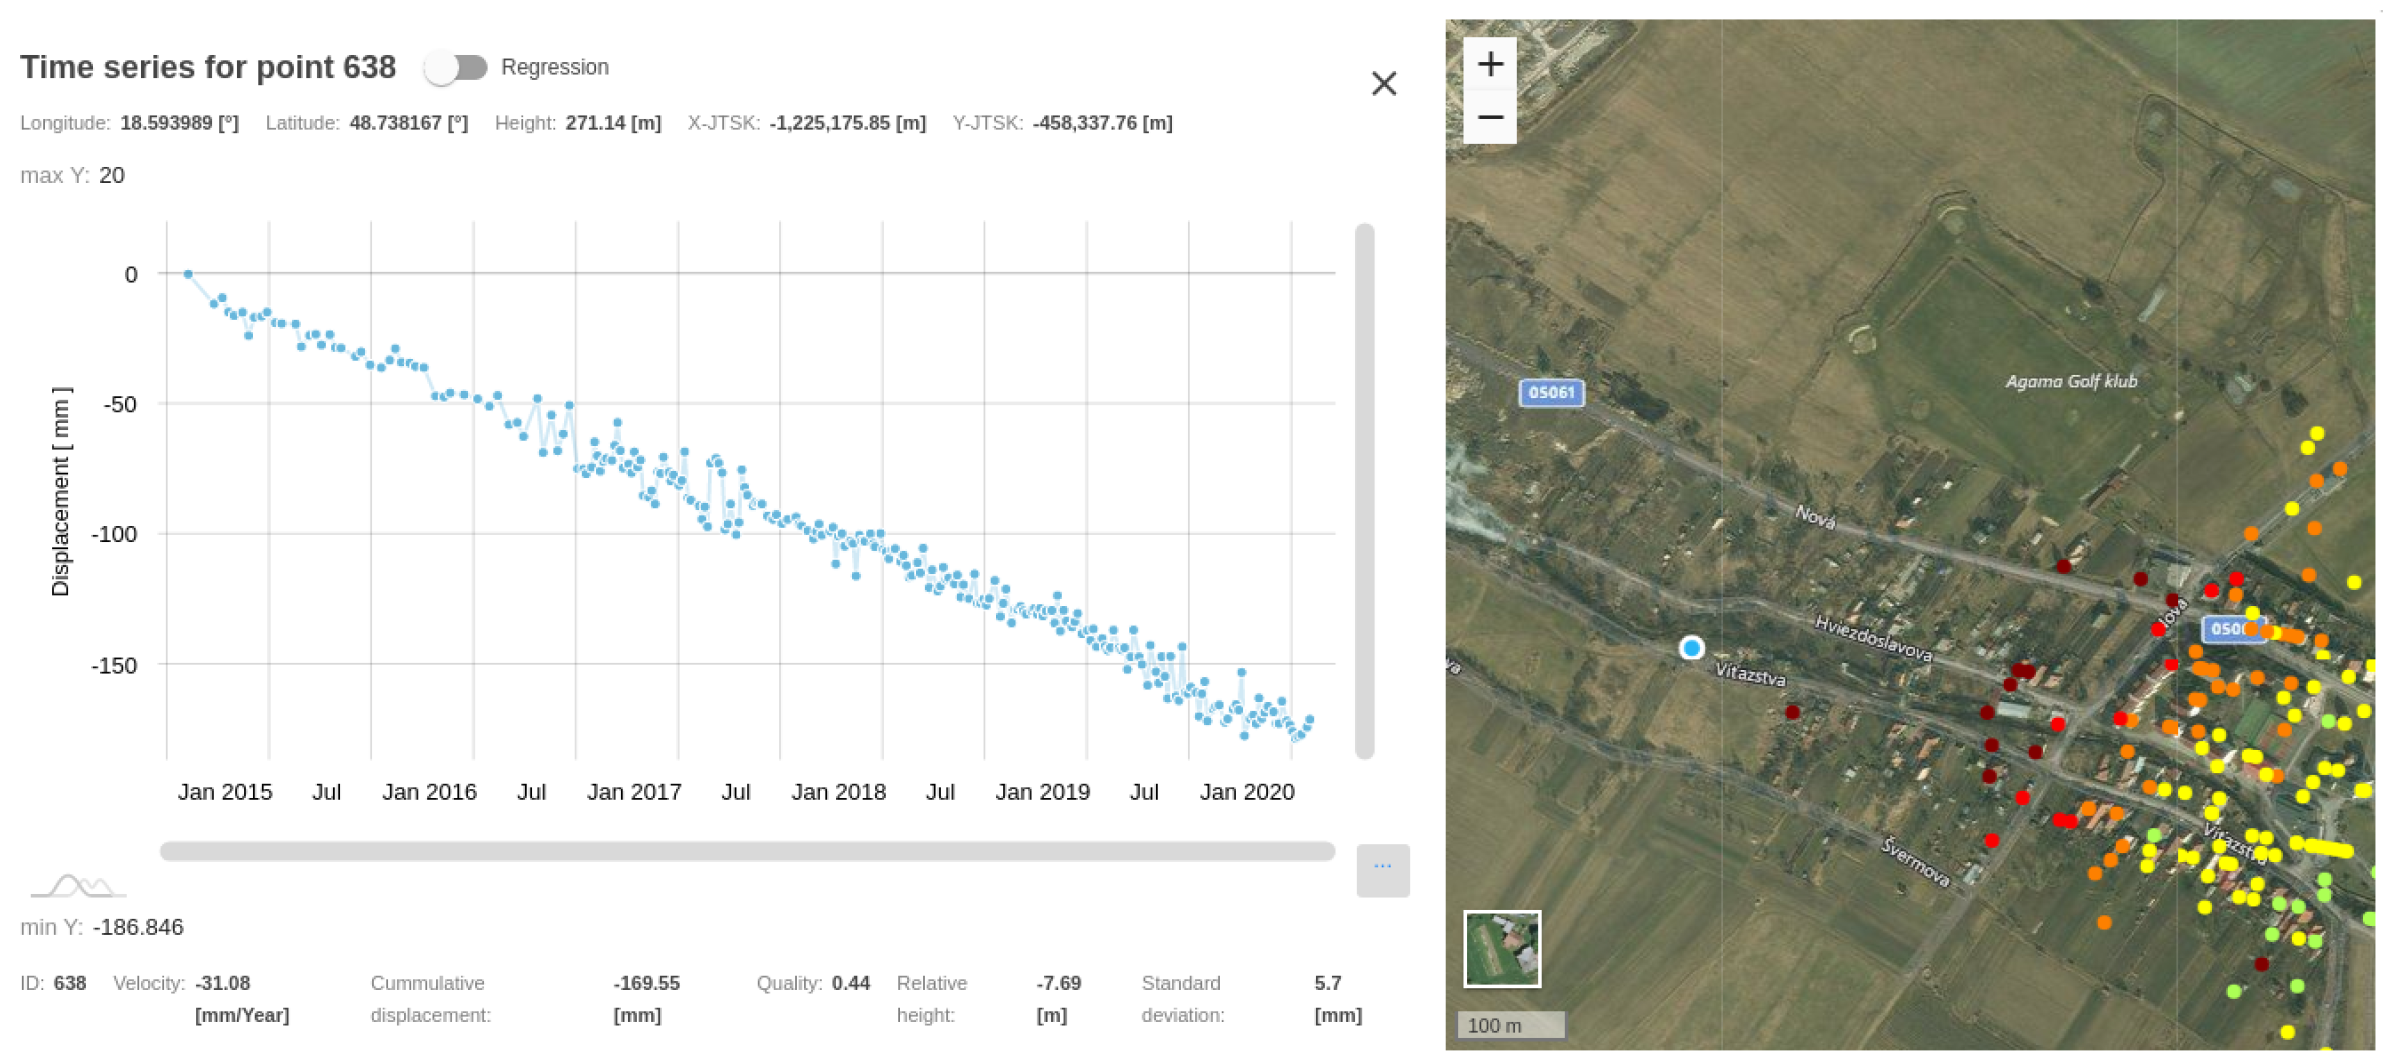
  • Landslides (Upper Nitra; Hradec, Velka and Mala Lehotka municipalities): The region of Upper Nitra (Prievidza) in Central Slovakia is affected by numerous slope failures and landslides. As a result of complex geological setting, the landslide susceptibility of the area is above 60%. Landslides represent direct threat to residents’ properties and health. After reactivation in 2013 and serious damage to the infrastructure, locations of active landslides are being monitored by State geological institute of Dionýz Štúr (SGUDS).
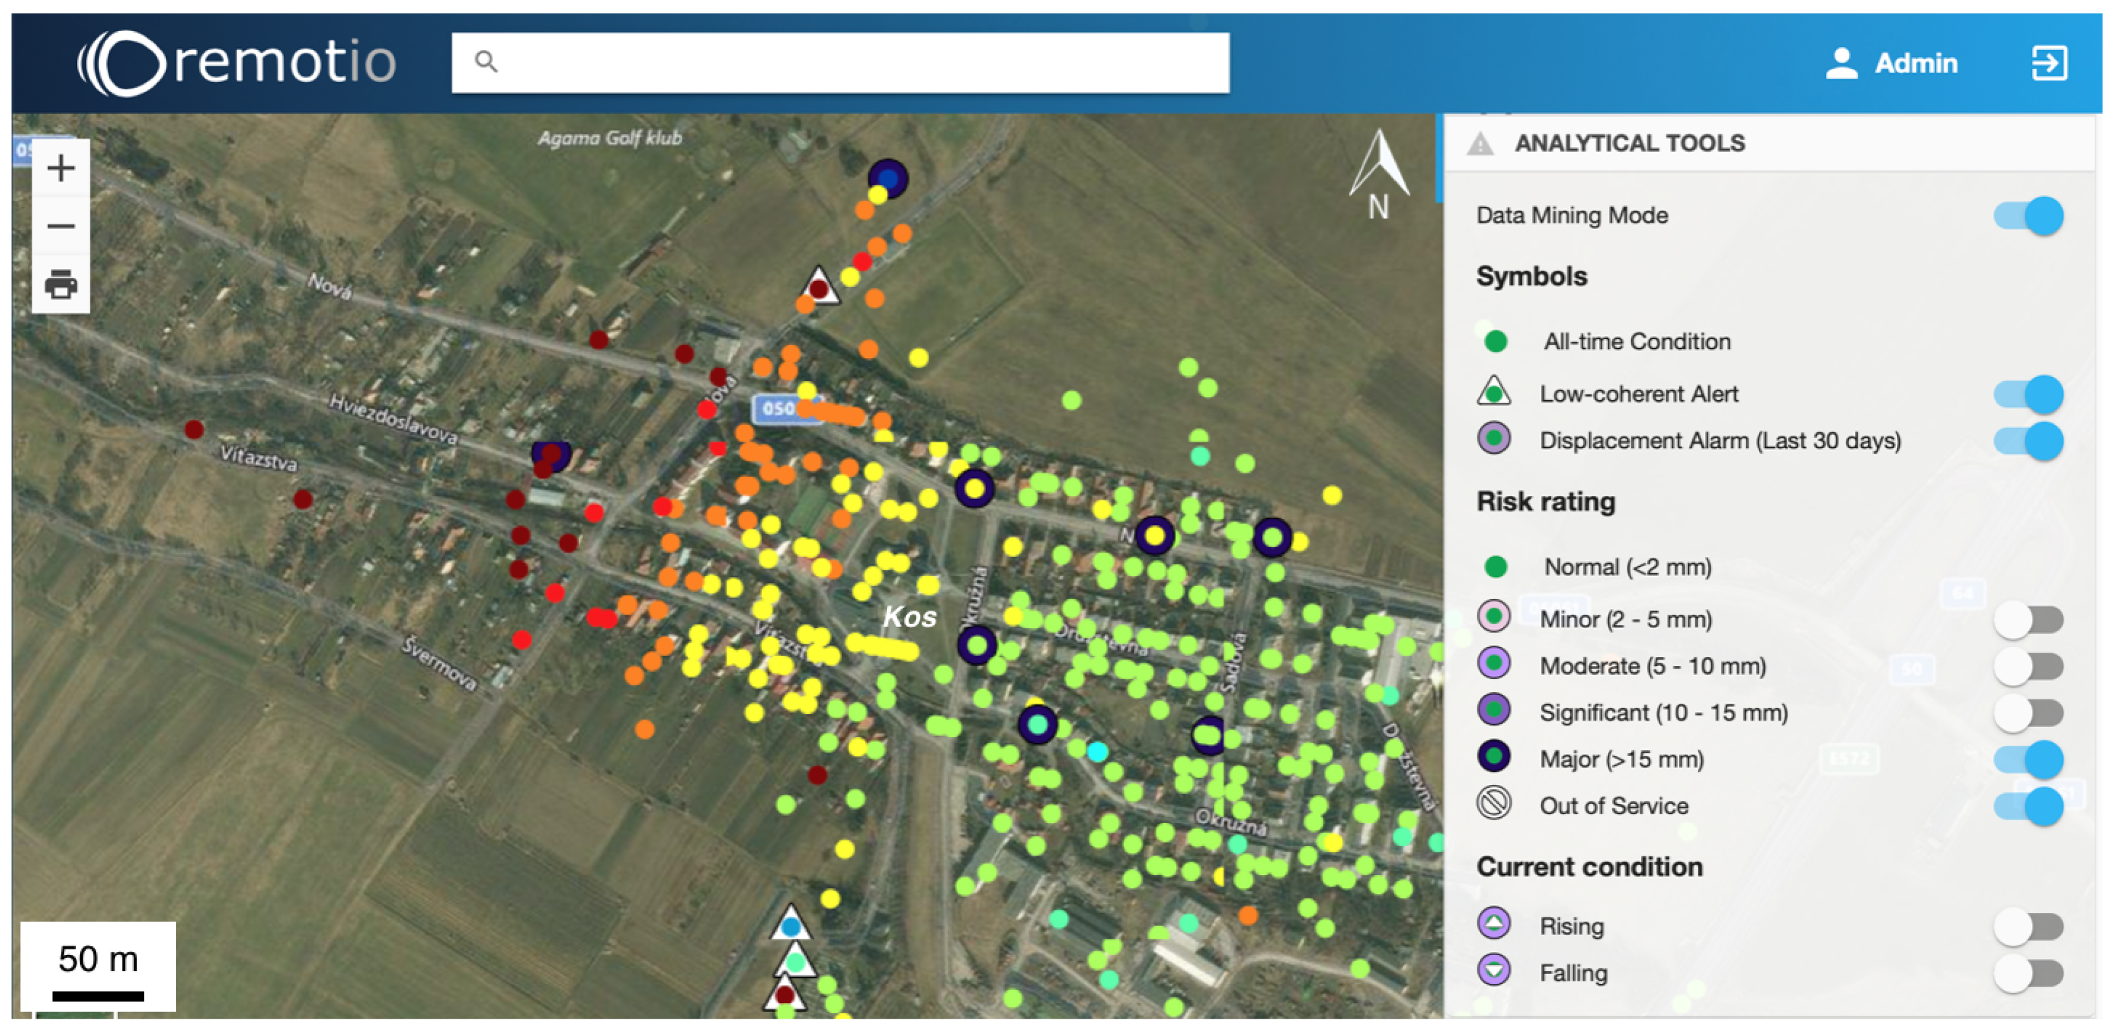
  • Mining subsidence (Upper Nitra; Kos village): Another geohazard posing a threat to properties of citizens in Upper Nitra region, Slovakia, is a ground subsidence due to undermining which has led to the abandonment of Kos village. Continually subsiding areas over the undermined fields are changing dynamically over time and consequences of undermining are strongly evident morphologically, via damage to buildings and infrastructure and by formation of sinkholes. Knowledge of surface movements within these areas is especially important because there are still inhabited houses, also monitored by leveling network.
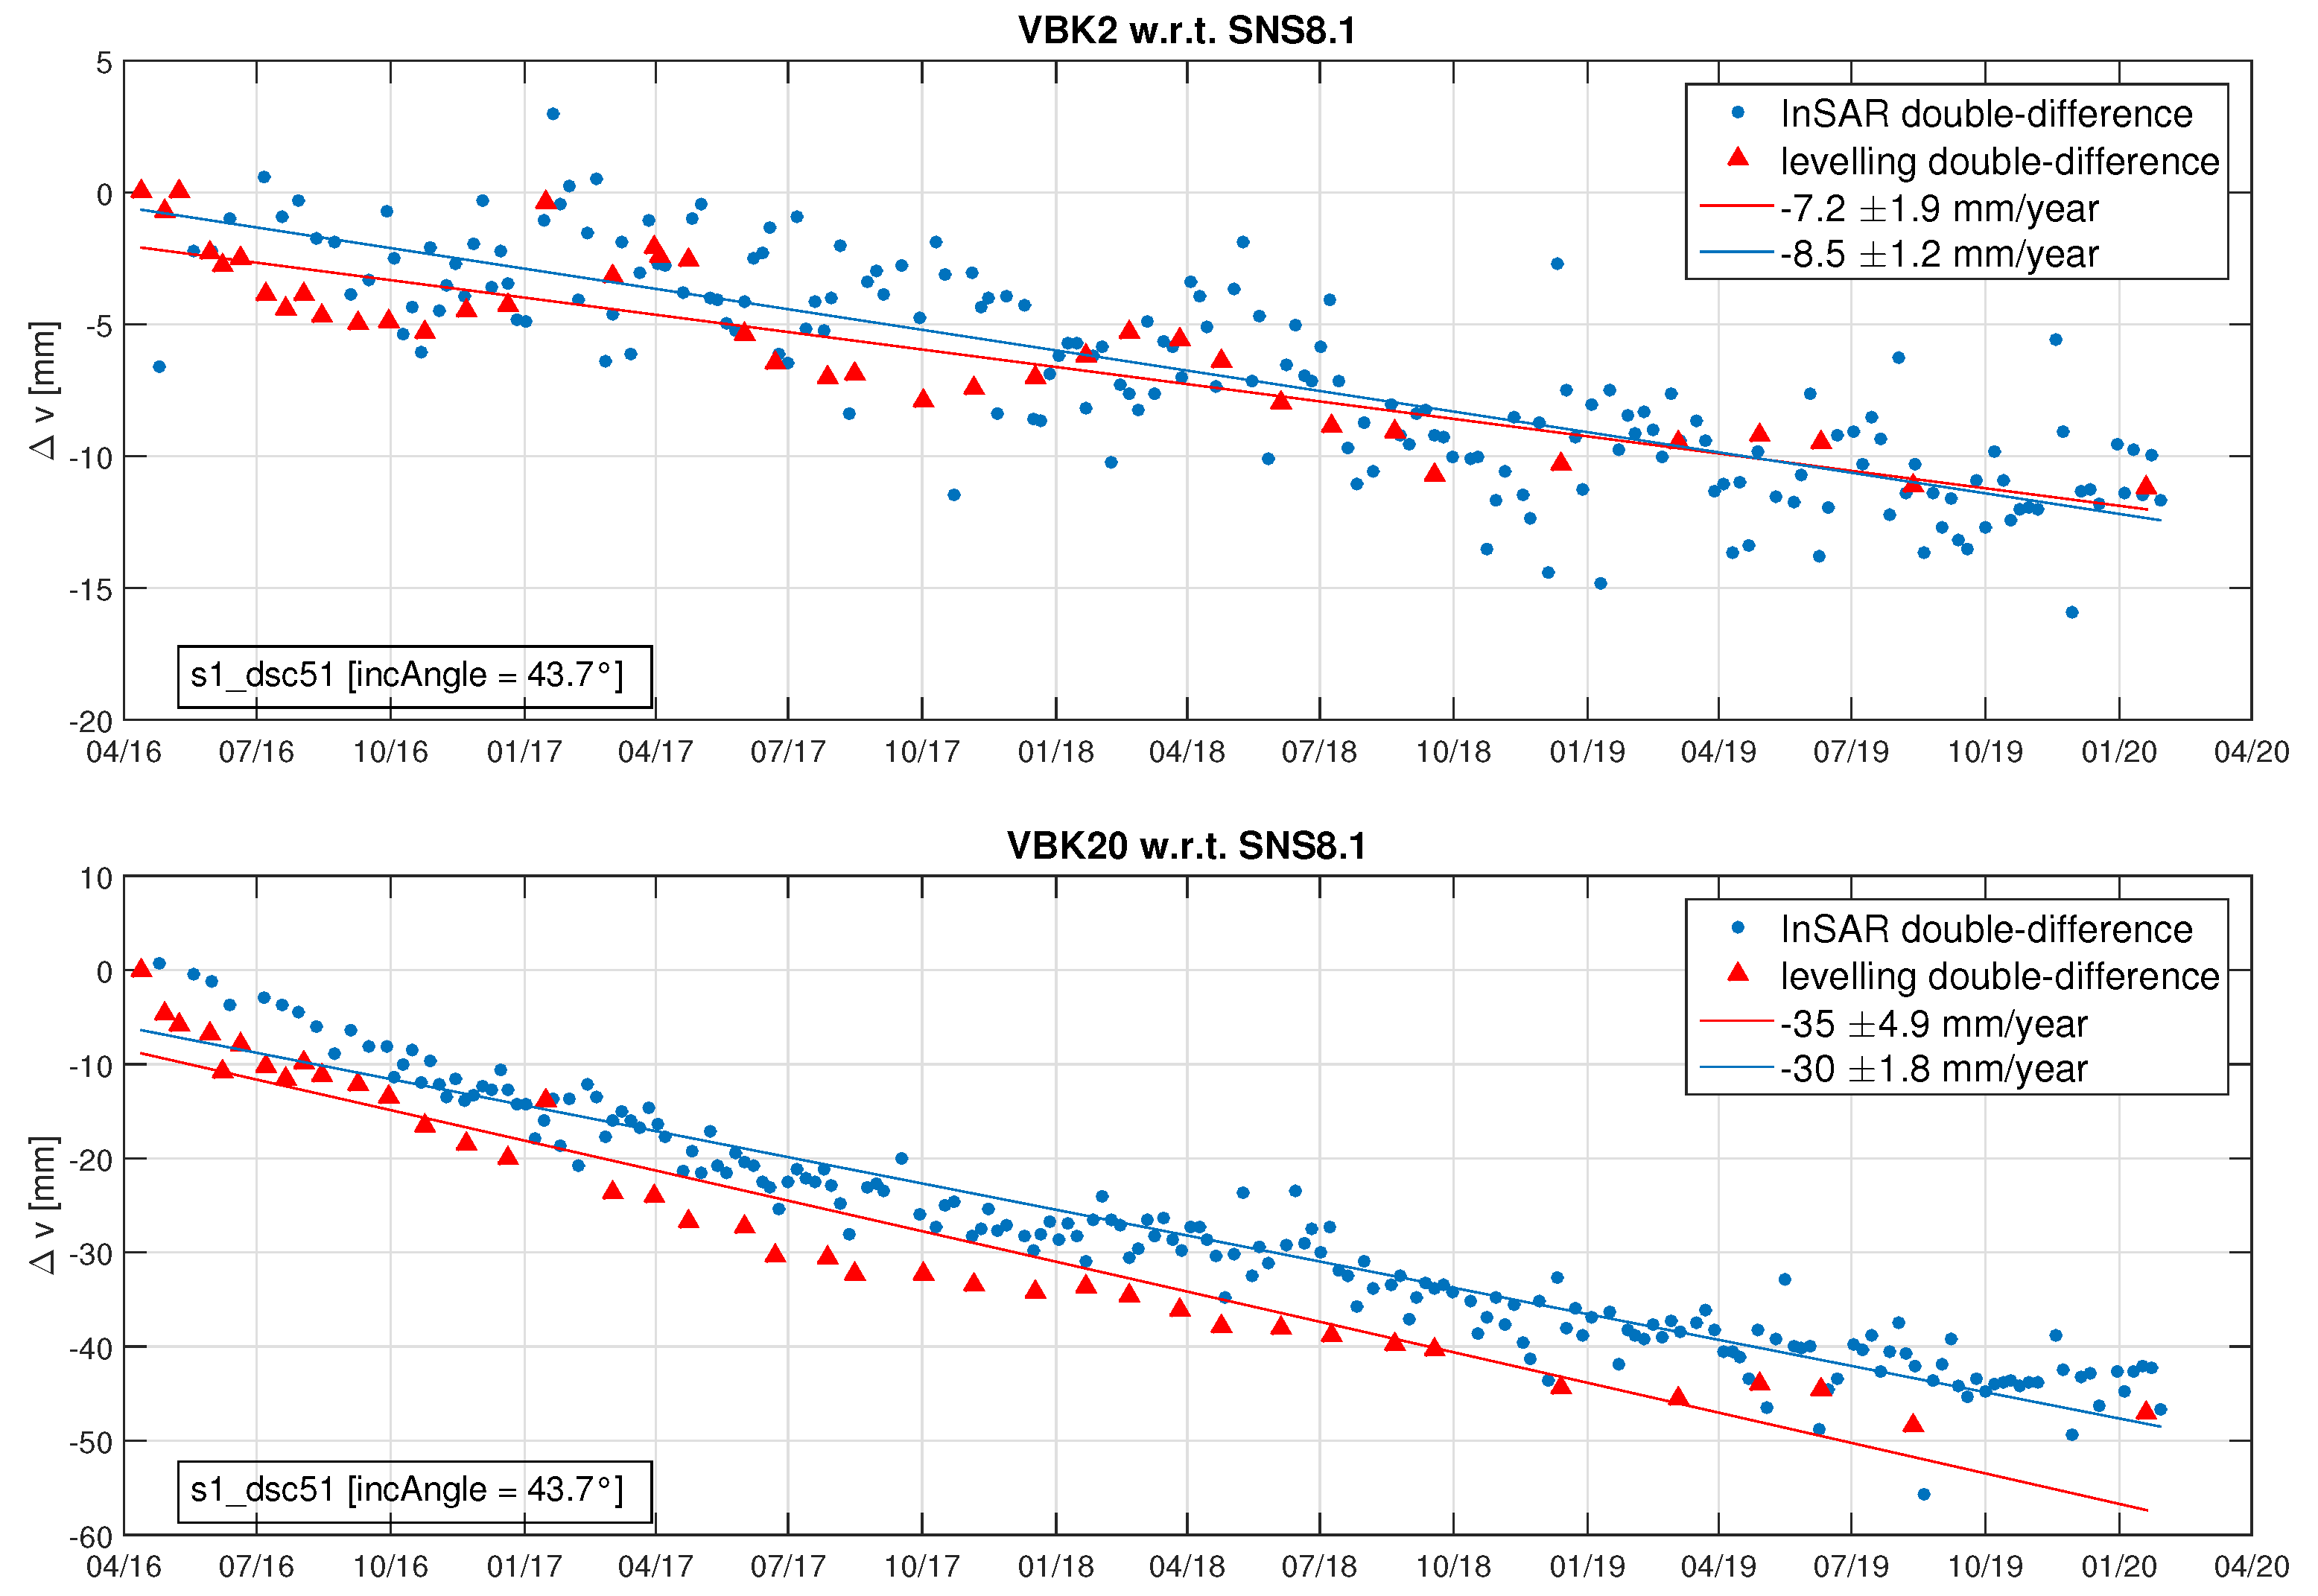
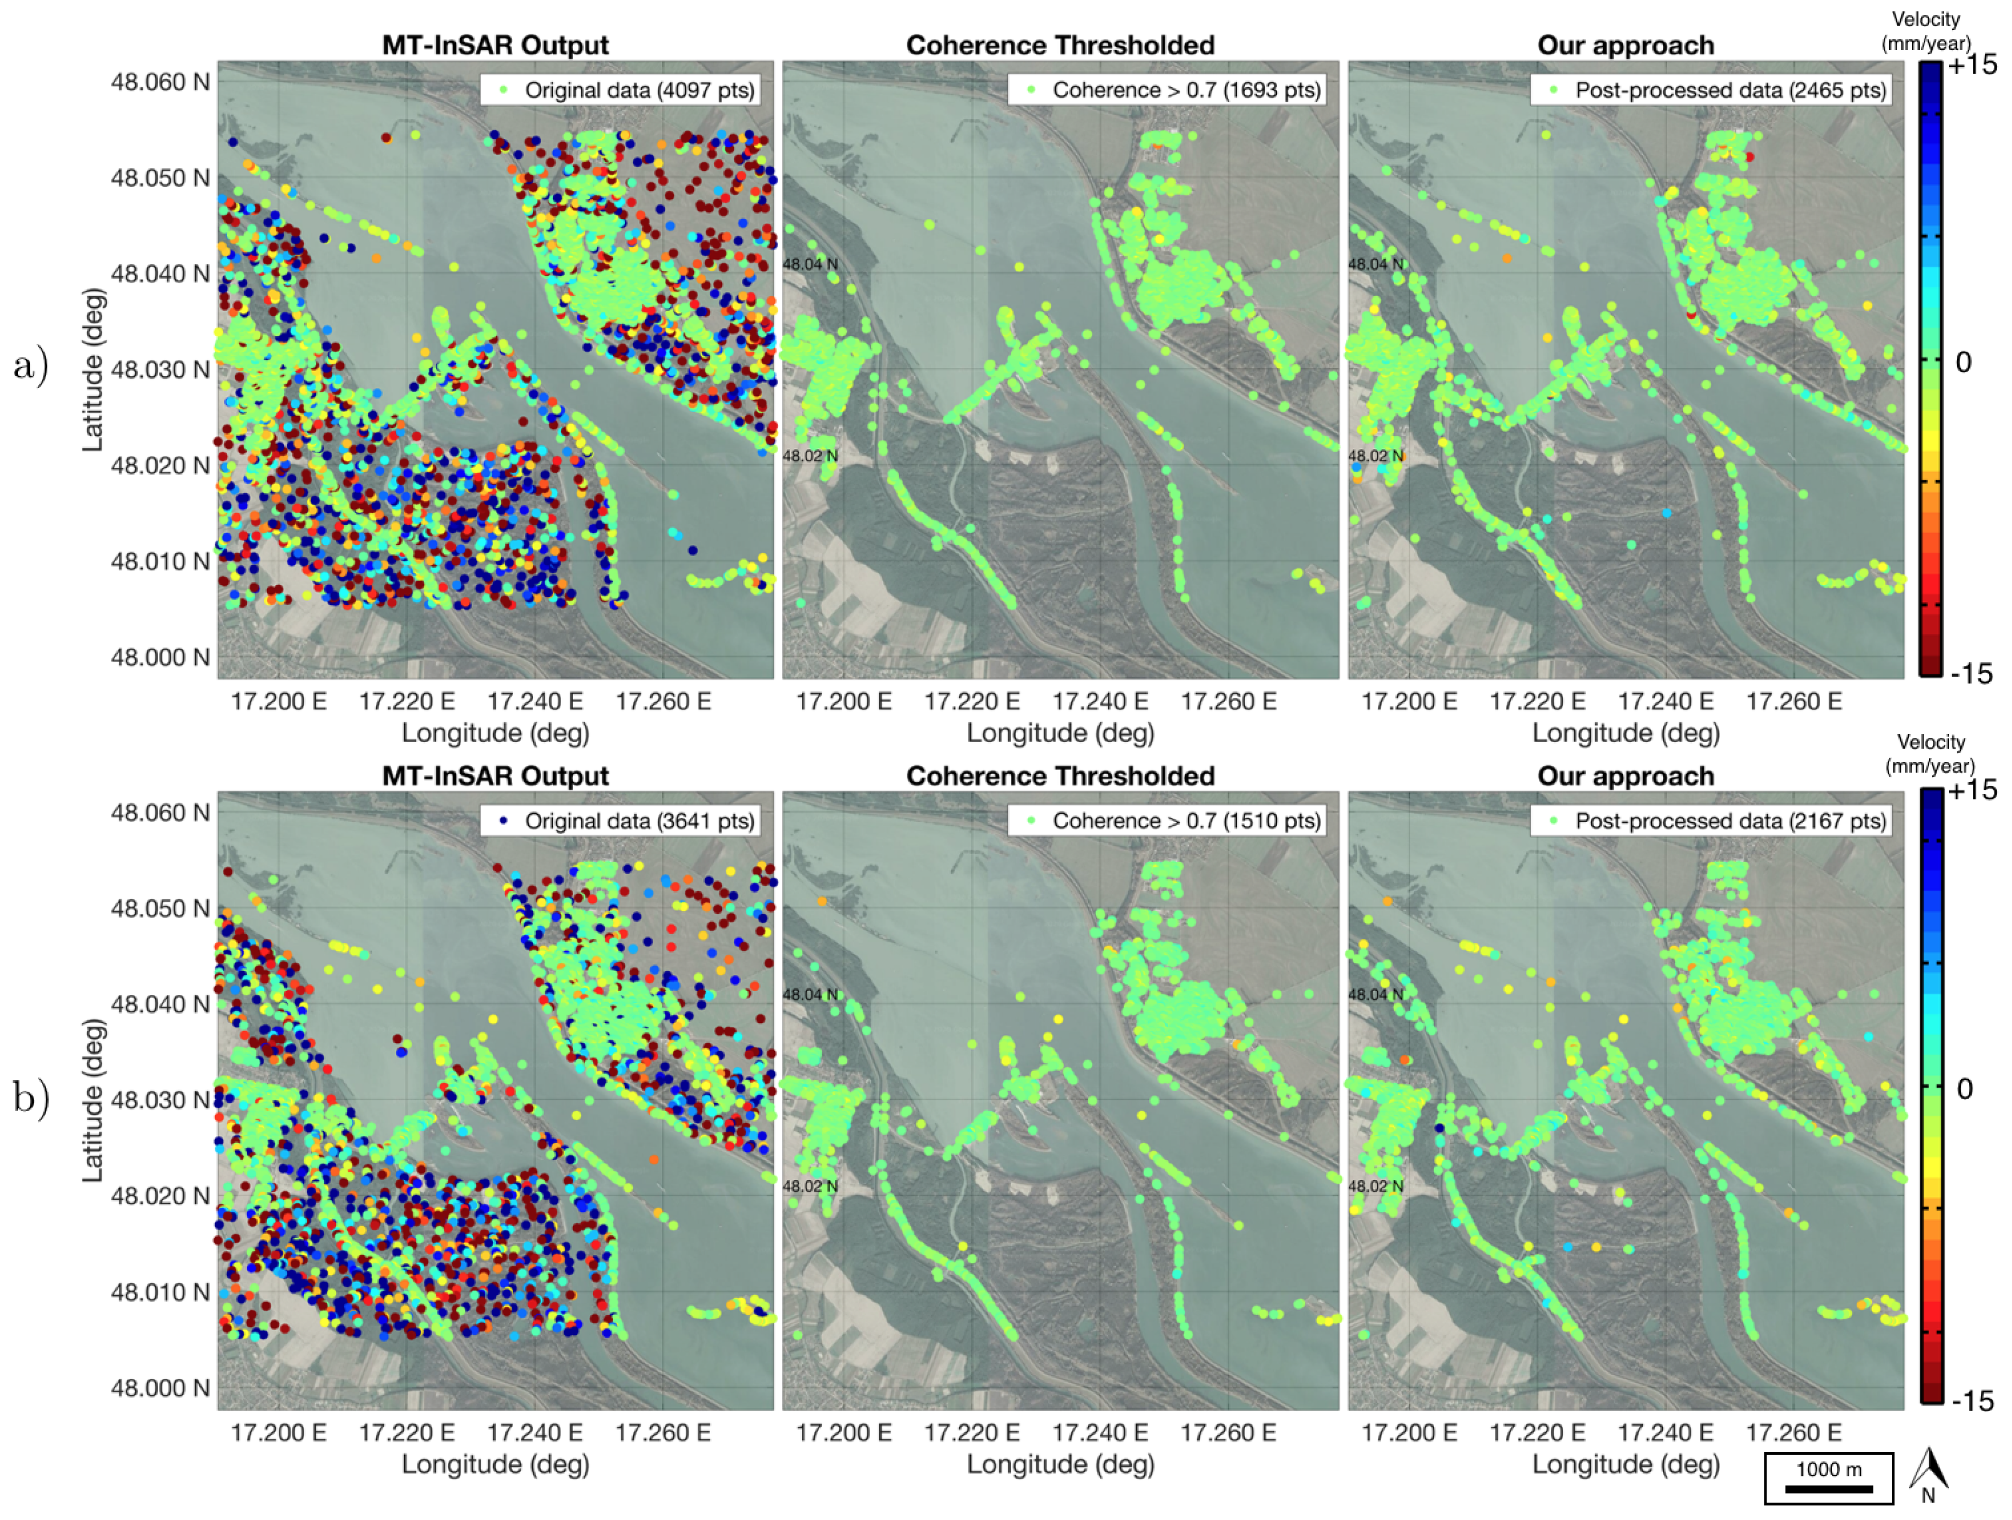
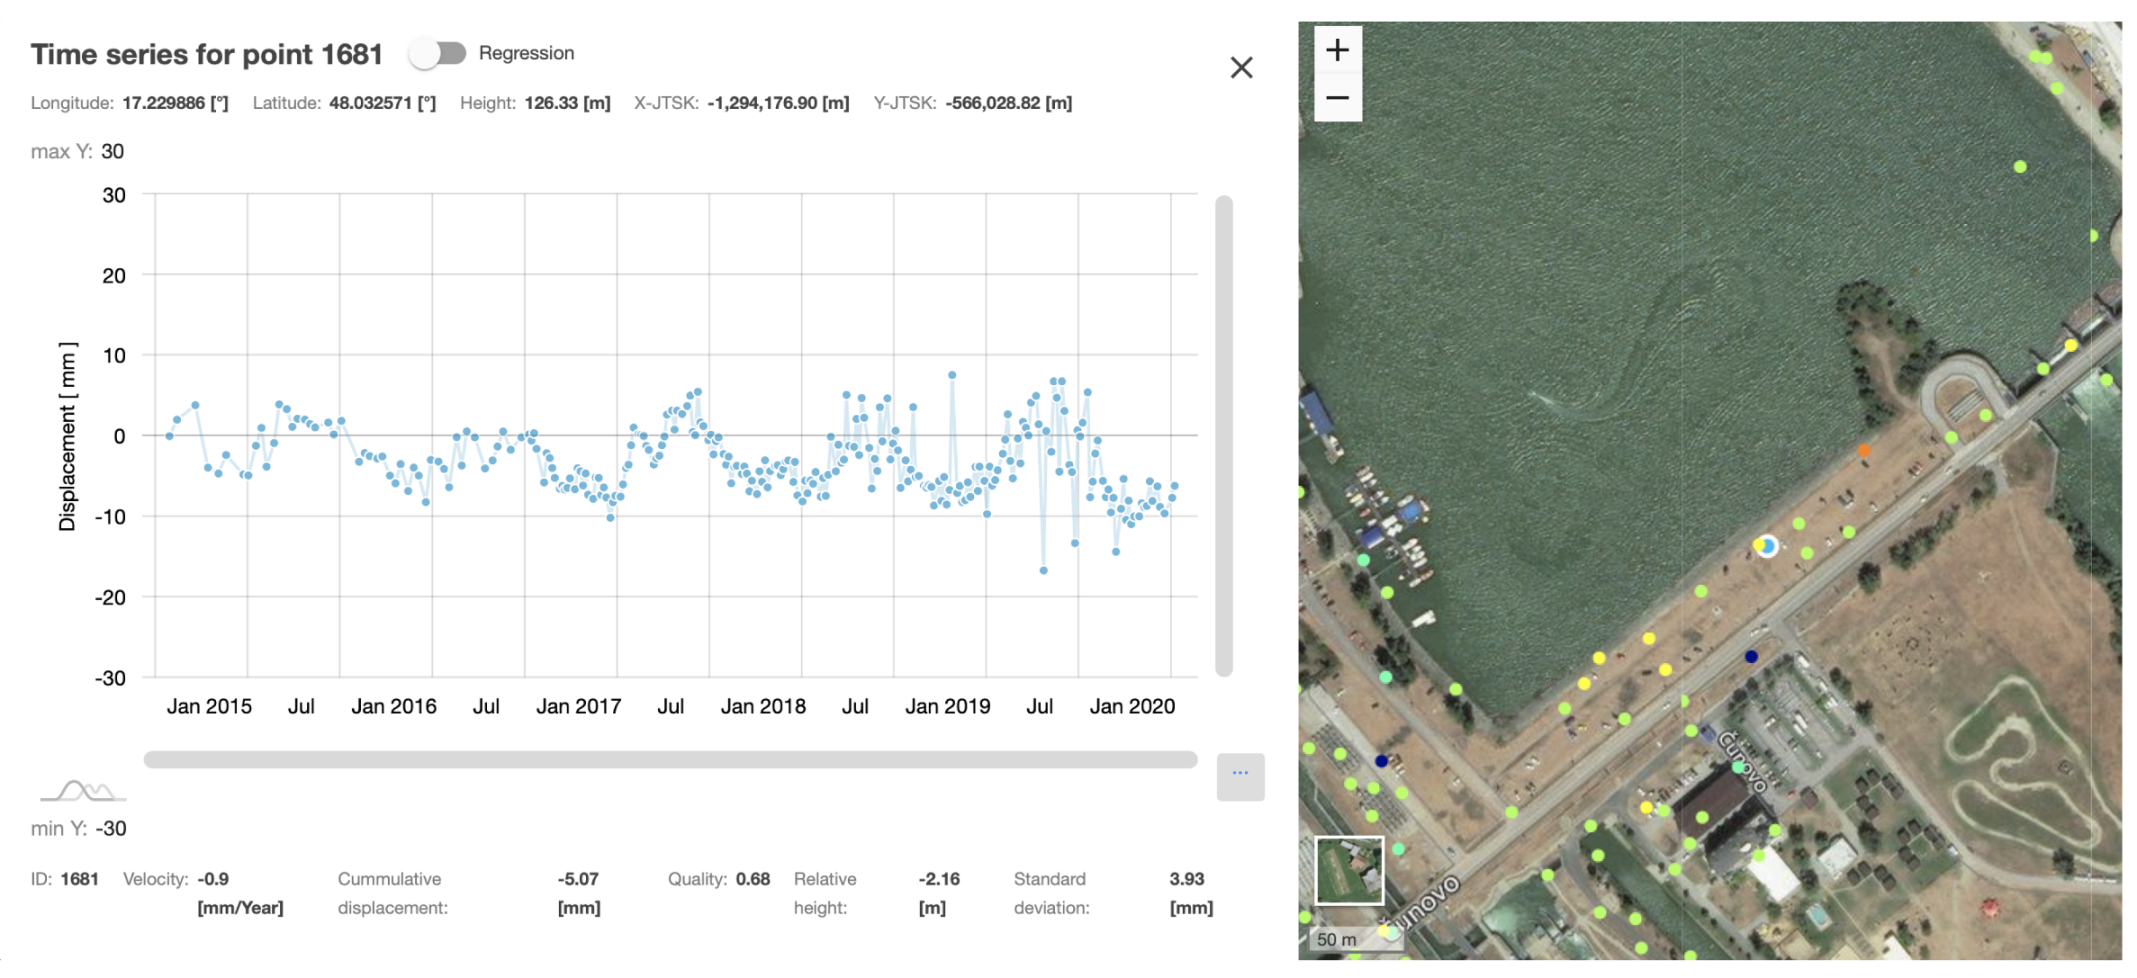
  • Dams, (Gabcikovo Waterworks): Gabcikovo waterworks, originally designed and built as part of Gabcikovo-Nagymaros framework waterworks are built on the Danube River nearby Bratislava, the capital of Slovakia. The main purpose of waterworks is to protect against floods, frequently present on the Danube historically as well as recently. Waterworks consist of two main levels: Cunovo dam and Gabcikovo dam. Both dams are predominantly concrete with some embarked parts.
remotIO results presented here are based on all available Sentinel-1 data acquired over monitored sites until March 2020. The dataset analyzed in this work currently contains a total number of 1012 Sentinel-1A/B Interferometric Wideswath (IW) Single-Look Complex (SLC) satellite radar images (Table 1) covering 5.4 years of consecutive measurements.

3. Methods

The remotIO (Retrieval of Motions and Potential Deformation threats) system has been developed under European Space Agency PECS (Plan for European Cooperating States) project in Slovakia. The remotIO platform is currently capable of providing autonomous Multi-temporal InSAR (MT-InSAR) processing and generation of regularly updated displacement maps.

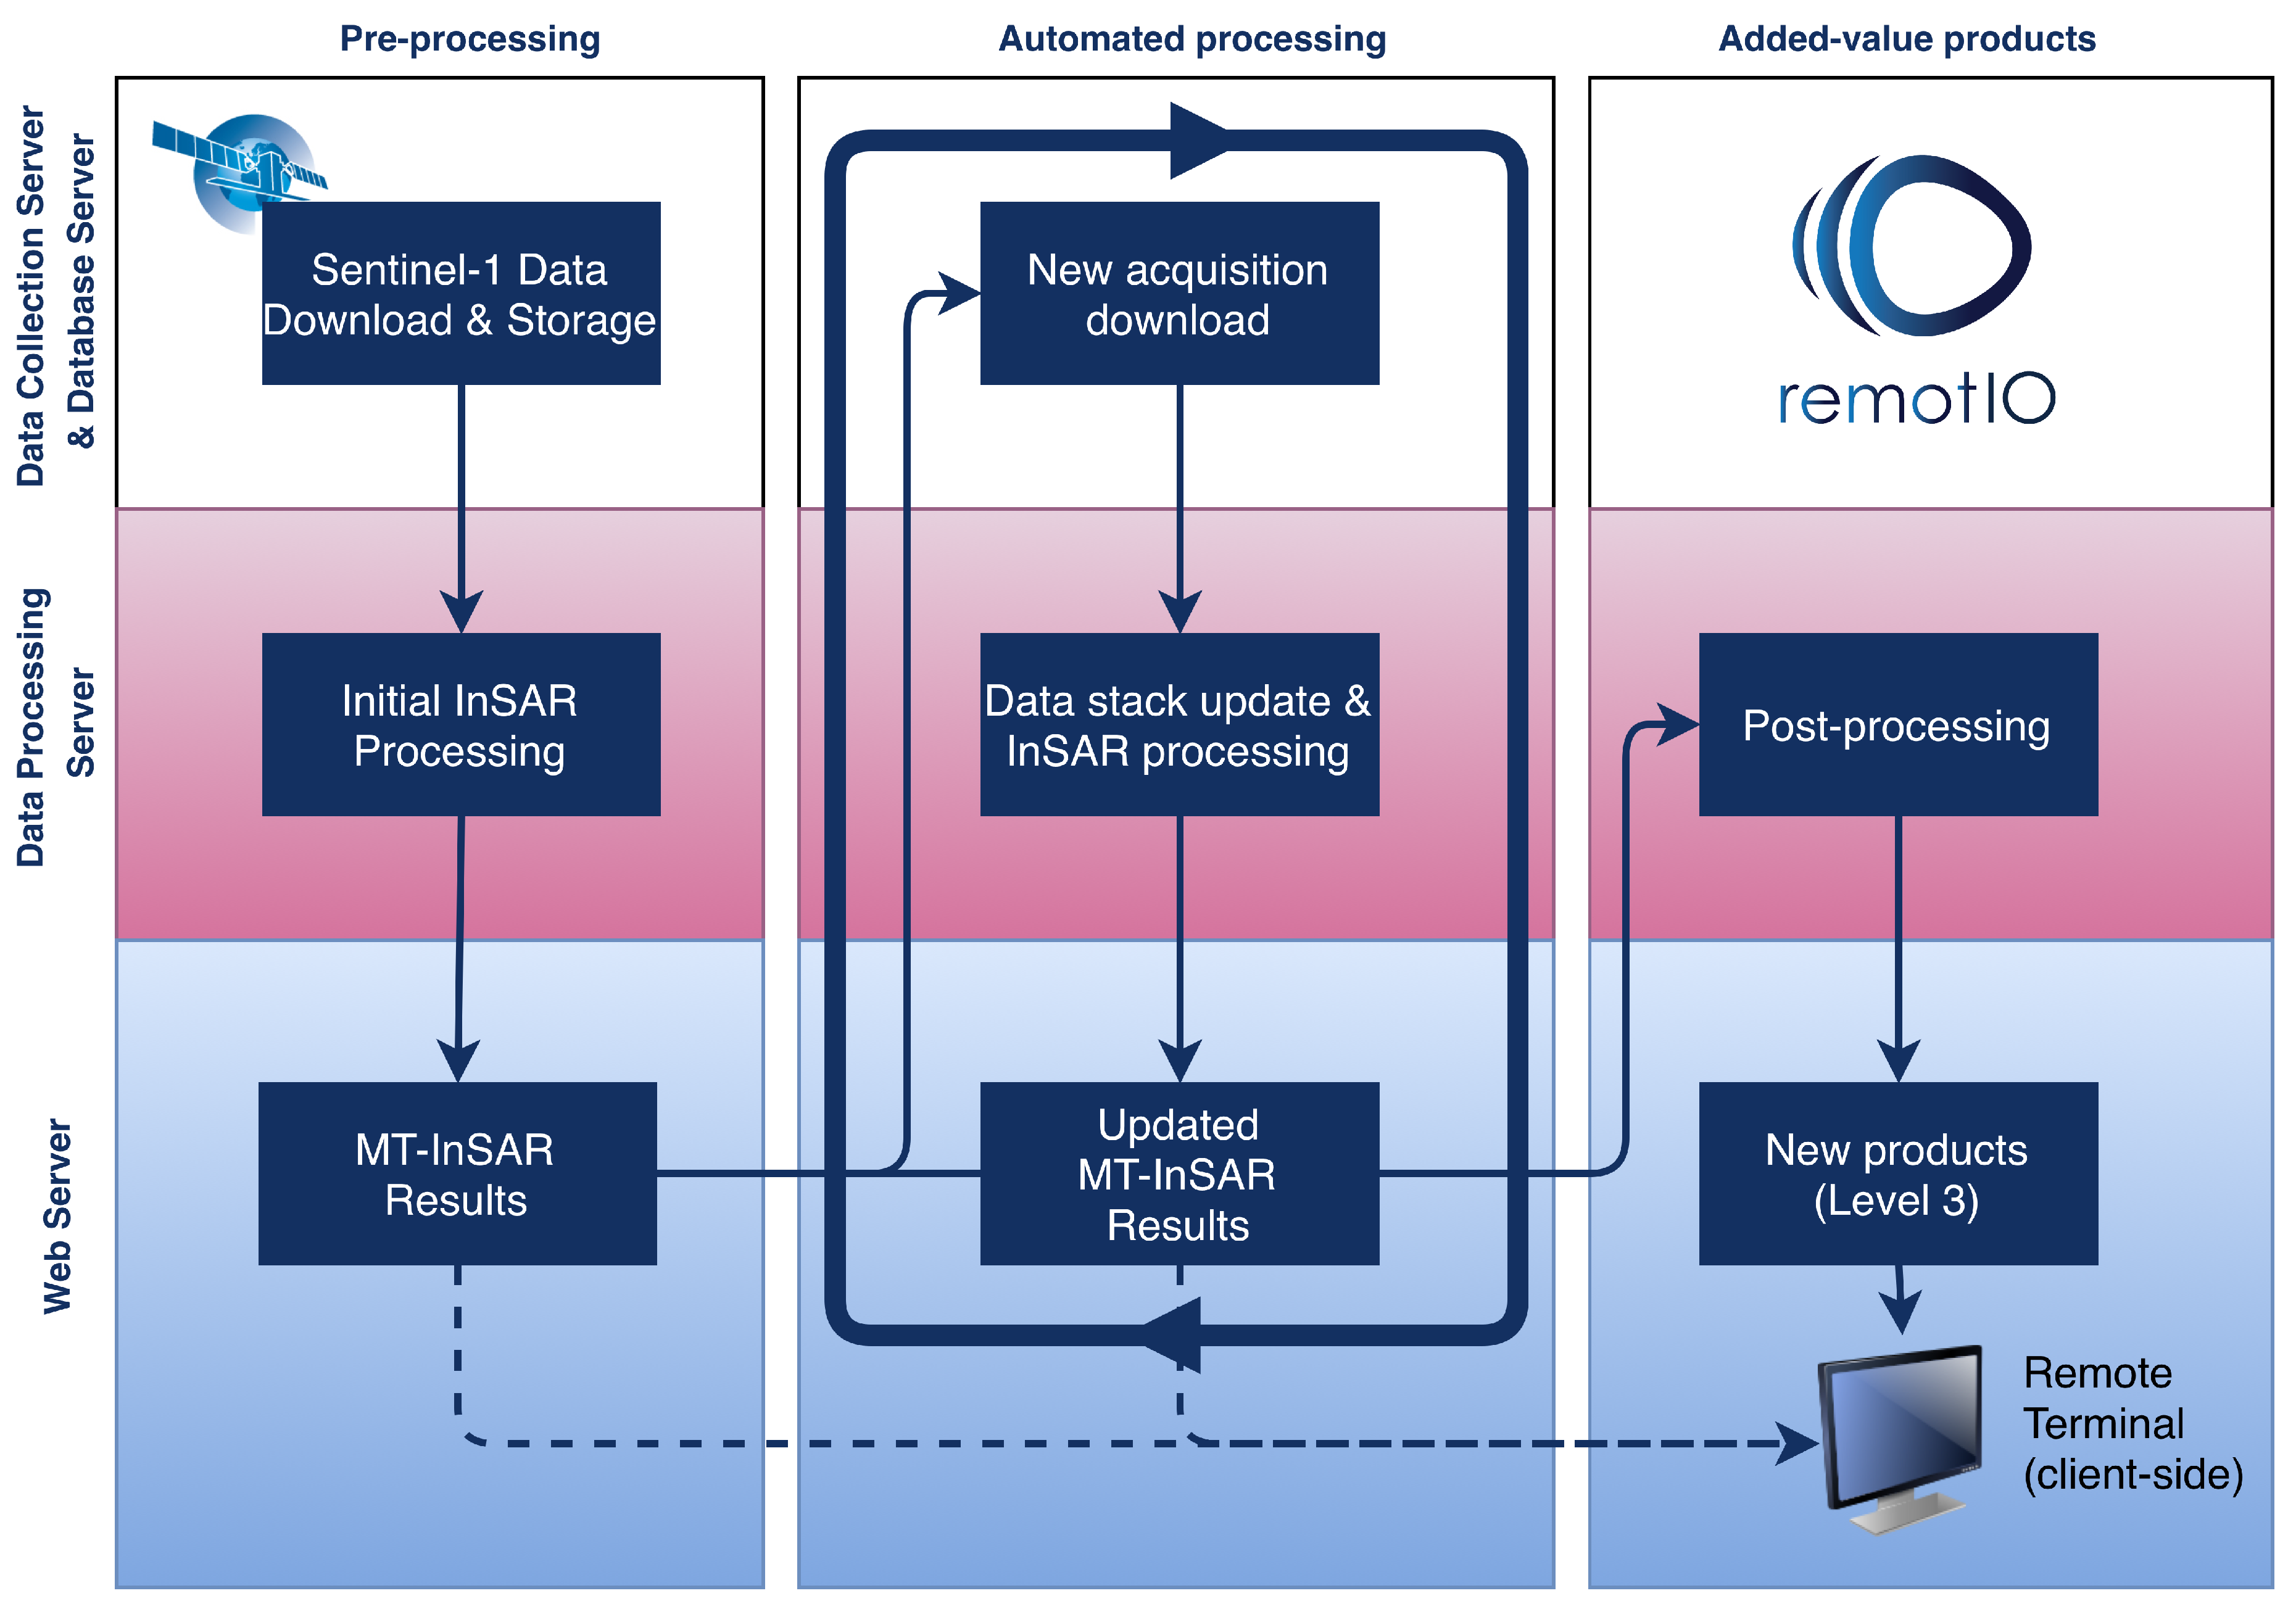
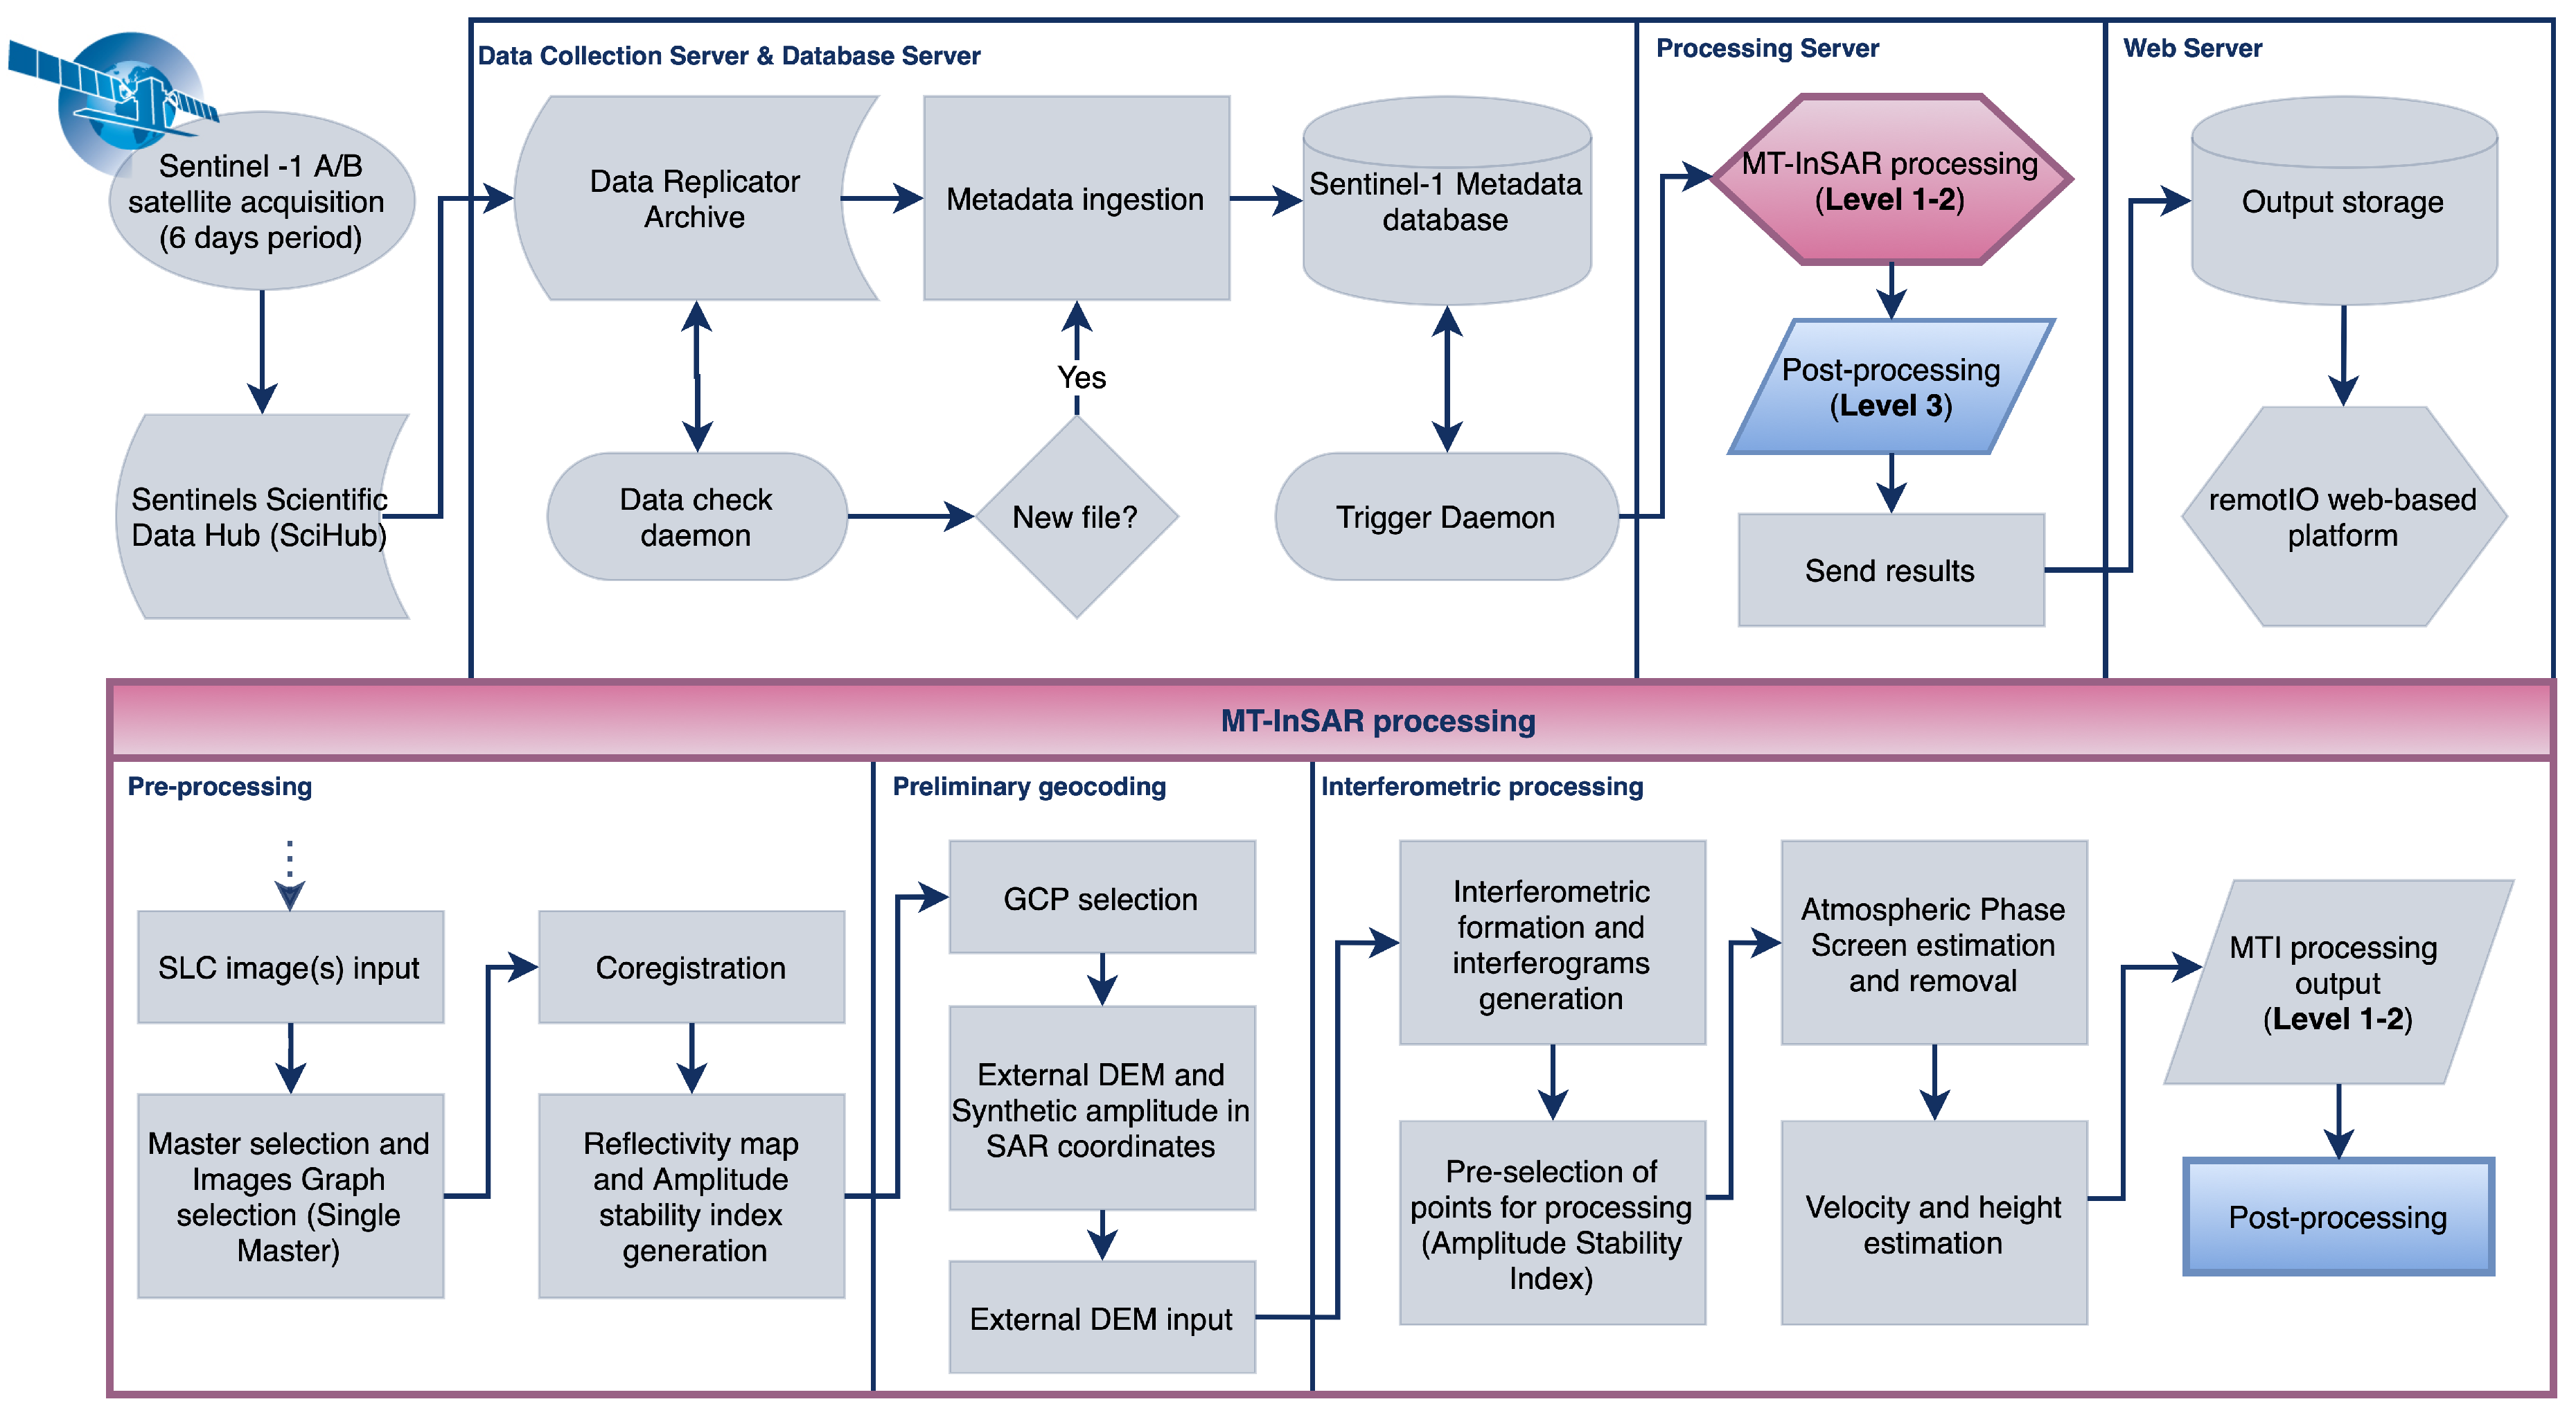
3.1. General Platform Design

The service components are integrated into one system which is composed of: (a) Data Collection Server and Database Server; (b) Data Processing Server; and (c) Web server (Figure 1). The system provides computational resources, data storage and tools for pre-processing and automated MT-InSAR processing and generation of added value products which are published on the Web server.
The data analytics services of the remotIO system represent a set of tools operating at Data Processing Server layer of the system (Figure 1, pink layer). These tools are utilized for performing MT-InSAR analysis and retrieval of displacement maps and displacement time series over monitored sites. Analytics services are also responsible for regular and automatic updates of the displacement products after initial processing is carried out. Finally, analytics services allow for post-processing of deformation products and generation of added value products, as described in Section 4.

3.2. Pre-Processing

The initial MT-InSAR-processing for each site is performed as the first step [1,2]. The processing chain for initial MT-InSAR processing is summarized in Figure 2. All available Sentinel-1A/B SLC images (with processing unit corresponding to approximately 20 km × 20 km crop) acquired over the areas of interest (Table 1) are co-registered on the sampling grid of a Master acquisition [47]. Single Master image is selected for each track based on optimal distribution of normal and temporal baselines. Precise Orbit Ephemeris (POE) are preferably used for the processing if available. Since precise orbits are only published after 20 days from the actual acquisition, for images acquired in a span of last 20 days, the only applicable are Restituted Orbits which are available few hours after satellite image acquisition. The digital elevation model SRTM-3 (Shuttle Radar Topography Mission) is used for removal of the topographic phase component. To get precise geolocation of PS (Persistent Scatterer) points, single Ground Control Point (GCP) is selected [48,49,50]. Full-resolution data are analyzed on a pixel-by-pixel basis to identify a sparse grid of points, usually corresponding to man-made structures (e.g., buildings, bridges, monuments, antennas, poles, conducts, etc.). The amplitude dispersion is used for pre-selection of the persistent scattering points for further processing [1,2]. A threshold on amplitude dispersion (0.42) [51] is used to create a network of pre-selected points for estimation of preliminary parameters and Atmospheric Phase Screen (APS). Considering the time periods, a large amount of acquisitions and the applied post-processing filtering, a slightly relaxed threshold of 0.42 is used to increase the densities of analyzed points (including scatterers that might be incoherent for short periods of time, relative to dataset timespan). After APS removal, phase time series are analyzed. Two key parameters are estimated here: residual height and annual displacement velocity. As with classical methodology of MT-InSAR [1,2] analysis, a linear model assumption for the deformation estimates is used. Finally, for each PS, a displacement time series related to the reference point identified in the stable area are estimated. Thanks to availability of both sensing geometries (ascending/descending), Line-of-Sight (LOS) velocities are decomposed into vertical and horizontal component in descending azimuth look direction [52] where a three-step approach is applied:
  • LOS velocities are re-sampled into regular grid of 50 m × 50 m.
  • The grid cells are assigned with the average of all LOS velocities allocated within individual cells.
  • The decomposition is performed in accordance with [21,51].

3.3. Automated Processing
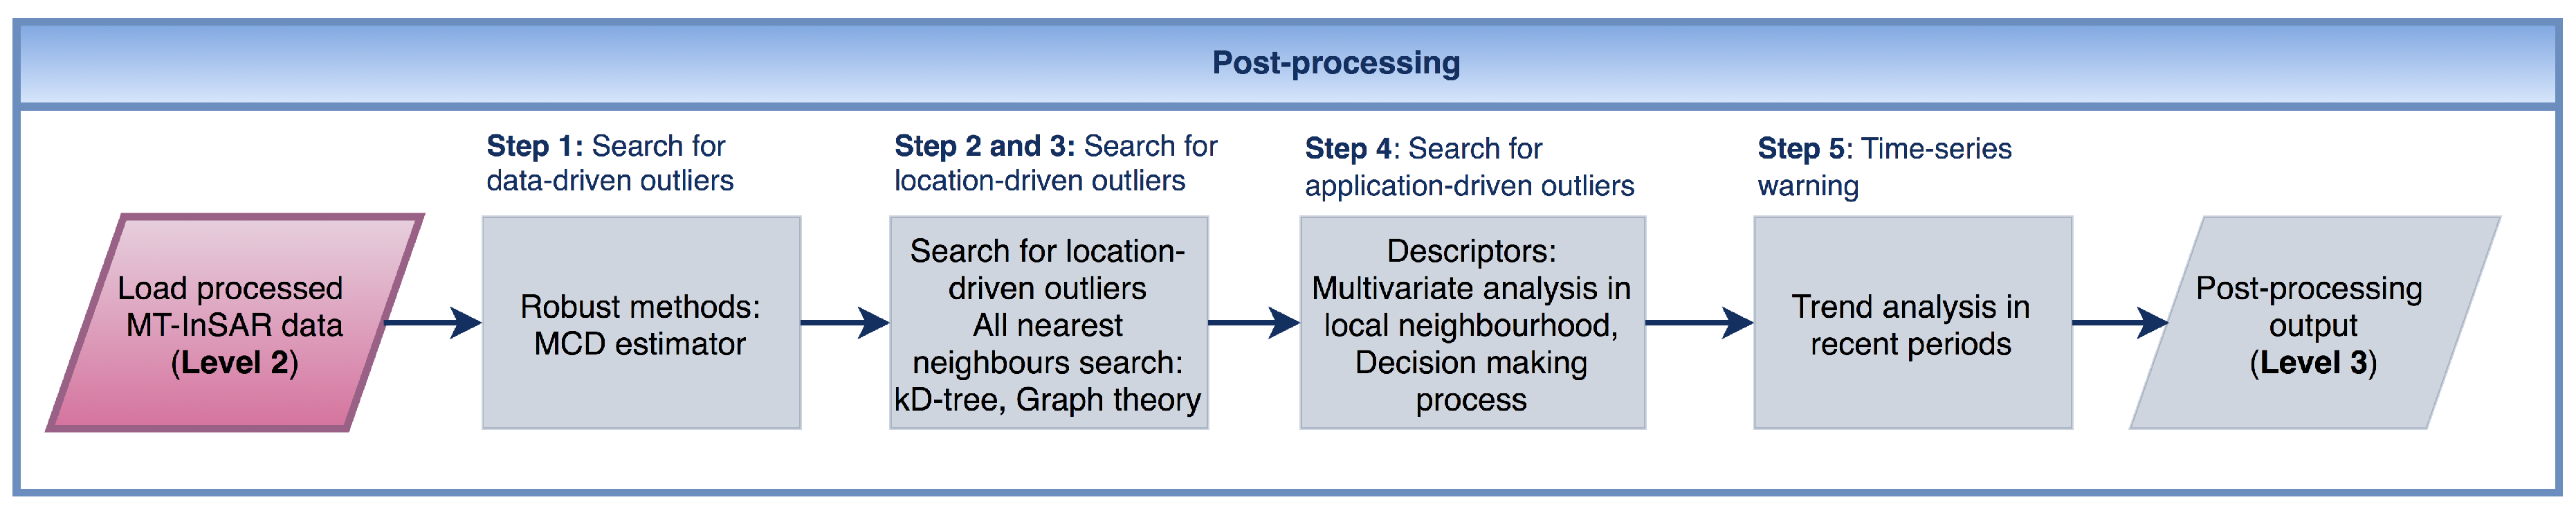
After initial MT-InSAR processing is performed for each site (Section 3.2), the set of software triggers controls each step of the system and handles processing of updated data stacks automatically (Figure 2). Data Collection Server is updated regularly every 4 h. After new image is allocated and downloaded in the main data repository, the Database Server updates the list of stored images. Processing Server regularly checks the database of available imagery every 1 h, and, if a new image is available from respective orbit track and monitored site, the automatic processing is performed. Software triggers are operating in periods of 4 h for downloading of the data, 1 h for checking the availability of new imagery and 3 h on average to carry out new processing. For the areas not exceeding approximately 80 km × 80 km, new results are produced every six days based on revisit periods of Sentinel-1A/B and within an 8-h window after every new acquisition is made available on Sentinels Scientific Data Hub (SciHub).
Currently, SARproZ software [53] is used to perform automatic processing, however any InSAR software can be used in processing chain (see MT-InSAR processing chain in Figure 2). Processing is controlled by programmatic scripts which are run from the Matlab command window. In such a way, it is possible to control each step of MT-InSAR processing, from mean reflectivity map generation, through ground control points selection, atmospheric phase screen estimation and removal, to generation of standardized Comma-Separated Value (CSV) files with all estimated parameters and displacement time series. CSV files are then linked to Web Server, where results are visualized in form of interactive displacement maps. The communication between individual components of the system (Figure 2) is maintained by the set of algorithms which are operating continuously as background processes.
The solution for continuous monitoring is fixed to the time of initial pre-processing of available data stack (see Section 3.2) in order to provide computationally and timely efficient updates. Newly acquired images are thus added to an existing solution and existing data stack. Pre-selected points for processing are not identical, although they are pre-selected with the same value of amplitude dispersion (0.42) [1,2,20,51]. New persistent scatterers will thus appear in an updated product, while identical points from new and previous datasets are tracked, and, if their coherence is significantly lost (or they will not appear in an updated dataset), the points are assigned with “Out of Service” label (see Analytical Tools Toolbar in Figure 3).
Standard remotIO’s outputs are geolocated point clouds of PS points (Levels 1–3), or regularly sampled grid of points (Level 0) with a corresponding unique identification, estimated displacement parameters and their precision, quality indicators, ETRS-89 coordinates, local datum coordinates as well as physical heights and decision-support parameters. Metadata (acquisition geometry-related, e.g. incidence and heading, master date, next acquisition dates and reference point coordinates) are included in header. Comma-separated value (CSV) files for all product tiers (Levels 0–3) are downloadable directly from the platform (Figure 3). All full-resolution products (Table 2) are updated continuously.
Displacement maps with Line-of-sight (LOS) velocities from ascending and descending orbit passes constitute a Level 1 product tier of the remotIO platform (Table 2), while Level 2 is extended for full displacement time series which are interactively visualized in GUI of the platform. LOS velocities decomposed into horizontal and vertical displacement velocity components [52,55] represent Level 0 tier (Table 2). Level 3 product tier (see Section 4) contains all Level 2 components, with addition of decision-support parameters (Section 4.2), which are represented by analytical tools, namely data mining filtering mode, low-coherent alerts, displacement alarms, risk ratings and current condition parameters, as shown in Figure 3.

4. Post-Processing

The standard quality indicator of displacement velocity and residual height estimates is the ensemble temporal coherence. The widely used approach in reporting the final MT-InSAR results is to impose a simple threshold (e.g., >0.7) on its value. However, some points could contain important information even when their temporal coherence is lower.
For points with low temporal coherence, the results are not reliable as the functional model employed within processing of InSAR time series is not matching the actual observations. Low values of temporal coherence are usually associated with limitations and constraints of InSAR technology [1,2,20,21]. Points with lower temporal coherence might also represent areas where deformation processes progress rapidly, in a way that was not assumed in applied mathematical models. In some cases, and specifically over small areas, reliable estimates in low-coherent zones could be obtained by extending the standard linear model for deformation estimates [1,2], by re-assessing solution space boundaries or by constructing complex mathematical models which better describe real deformation scenario. Wrong model drops the estimate of ensemble coherence, biases the estimate of parameters and increases chances of PS candidates rejection, even though it is in fact a PS (e.g., undergoing strong non-linear deformation), which needs to be considered during re-assessment of the processing strategy and applied models.
Our goal is to perform autonomous post-processing analysis of Multi-temporal InSAR results via multivariate analysis of all major variables (such as velocity, residual height, temporal coherence, etc.) and: (i) search for outliers; (ii) decide about removing/leaving them inside the dataset; and (iii) reduce noise incorporated in the final results. The primary aim is to look for the characteristics that could lead to the optimal results in terms of quality and interpretation purposes. Some outlying measurements could point the attention of an expert user towards the locations affected by motions which are un-modeled (e.g., non-linear displacements, seasonal fluctuations, sudden changes such as in the case of landslide activation, etc.). After detecting anomalous behavior, the processing strategy of expert users can be refined and real deformation profiles could be extracted for these areas. If the potential deformation threat has been identified, the non-expert user should be aware of such a situation in order to adopt appropriate prevention activities. Another advantage is the possibility for such post-processing procedure to operate autonomously and generate timely information for monitored sites. The research and development step was associated with the existing prototype first formulated in [36]. The techniques implemented in [36] allowed for extraction of location-, data- and application-driven outliers and has proven to be useful for extracting PS points with strong ground deformation processes, although their coherence is weakened and by the rules of standard thresholding procedure they would be discarded. However, these techniques were not tailored for automatic updates of MT-InSAR analysis over pilot test sites and do not account for easy-access to data, intuitiveness in interpreting the results and effectiveness in terms of providing timely information for better situational awareness. The research and development process was focused on implementing different data-mining strategies (see Section 4.1) to analyze Multi-temporal InSAR point clouds in various applications over pilot test-sites to possibly identify areas with significant movement. The modules implemented in [36] were rectified and a systematic methodology is developed and summarized in following sections. The development process allowed for designing a set of decision-supporting tools for detection and easy interpretation of problematic areas (Section 4.2).

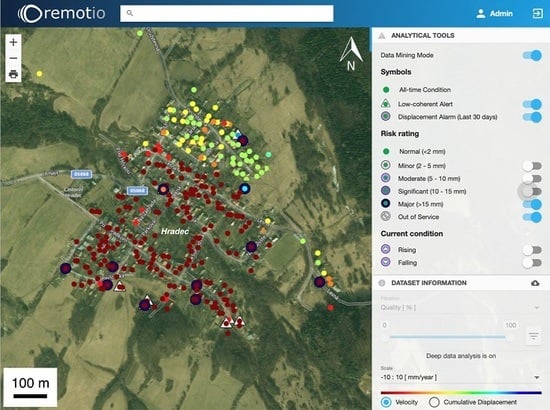
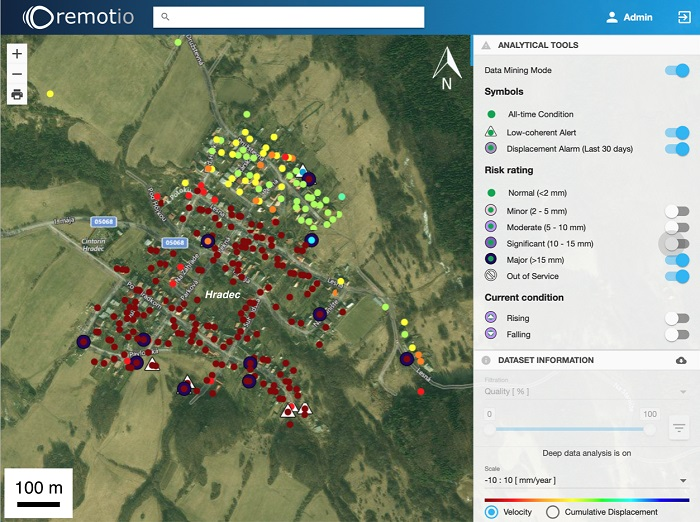
4.1. Data Mining Methodology

Given a set of persistent scatterers (PS) that have undergone standard MT-InSAR processing (Figure 2), the resultant spatial data are represented by multiple variables estimated in the PS position. These variables are: the annual displacement velocity, height or residual height with respect to reference DEM and corresponding standard deviations and temporal coherence, all with respect to an arbitrary reference point. The proposed data mining methodology consists of five consecutive steps, entailing outlier candidate detection, all nearest neighbors search, multivariate analysis in local neighborhood, decision making process and time series warning (see workflow diagram in Figure 3).

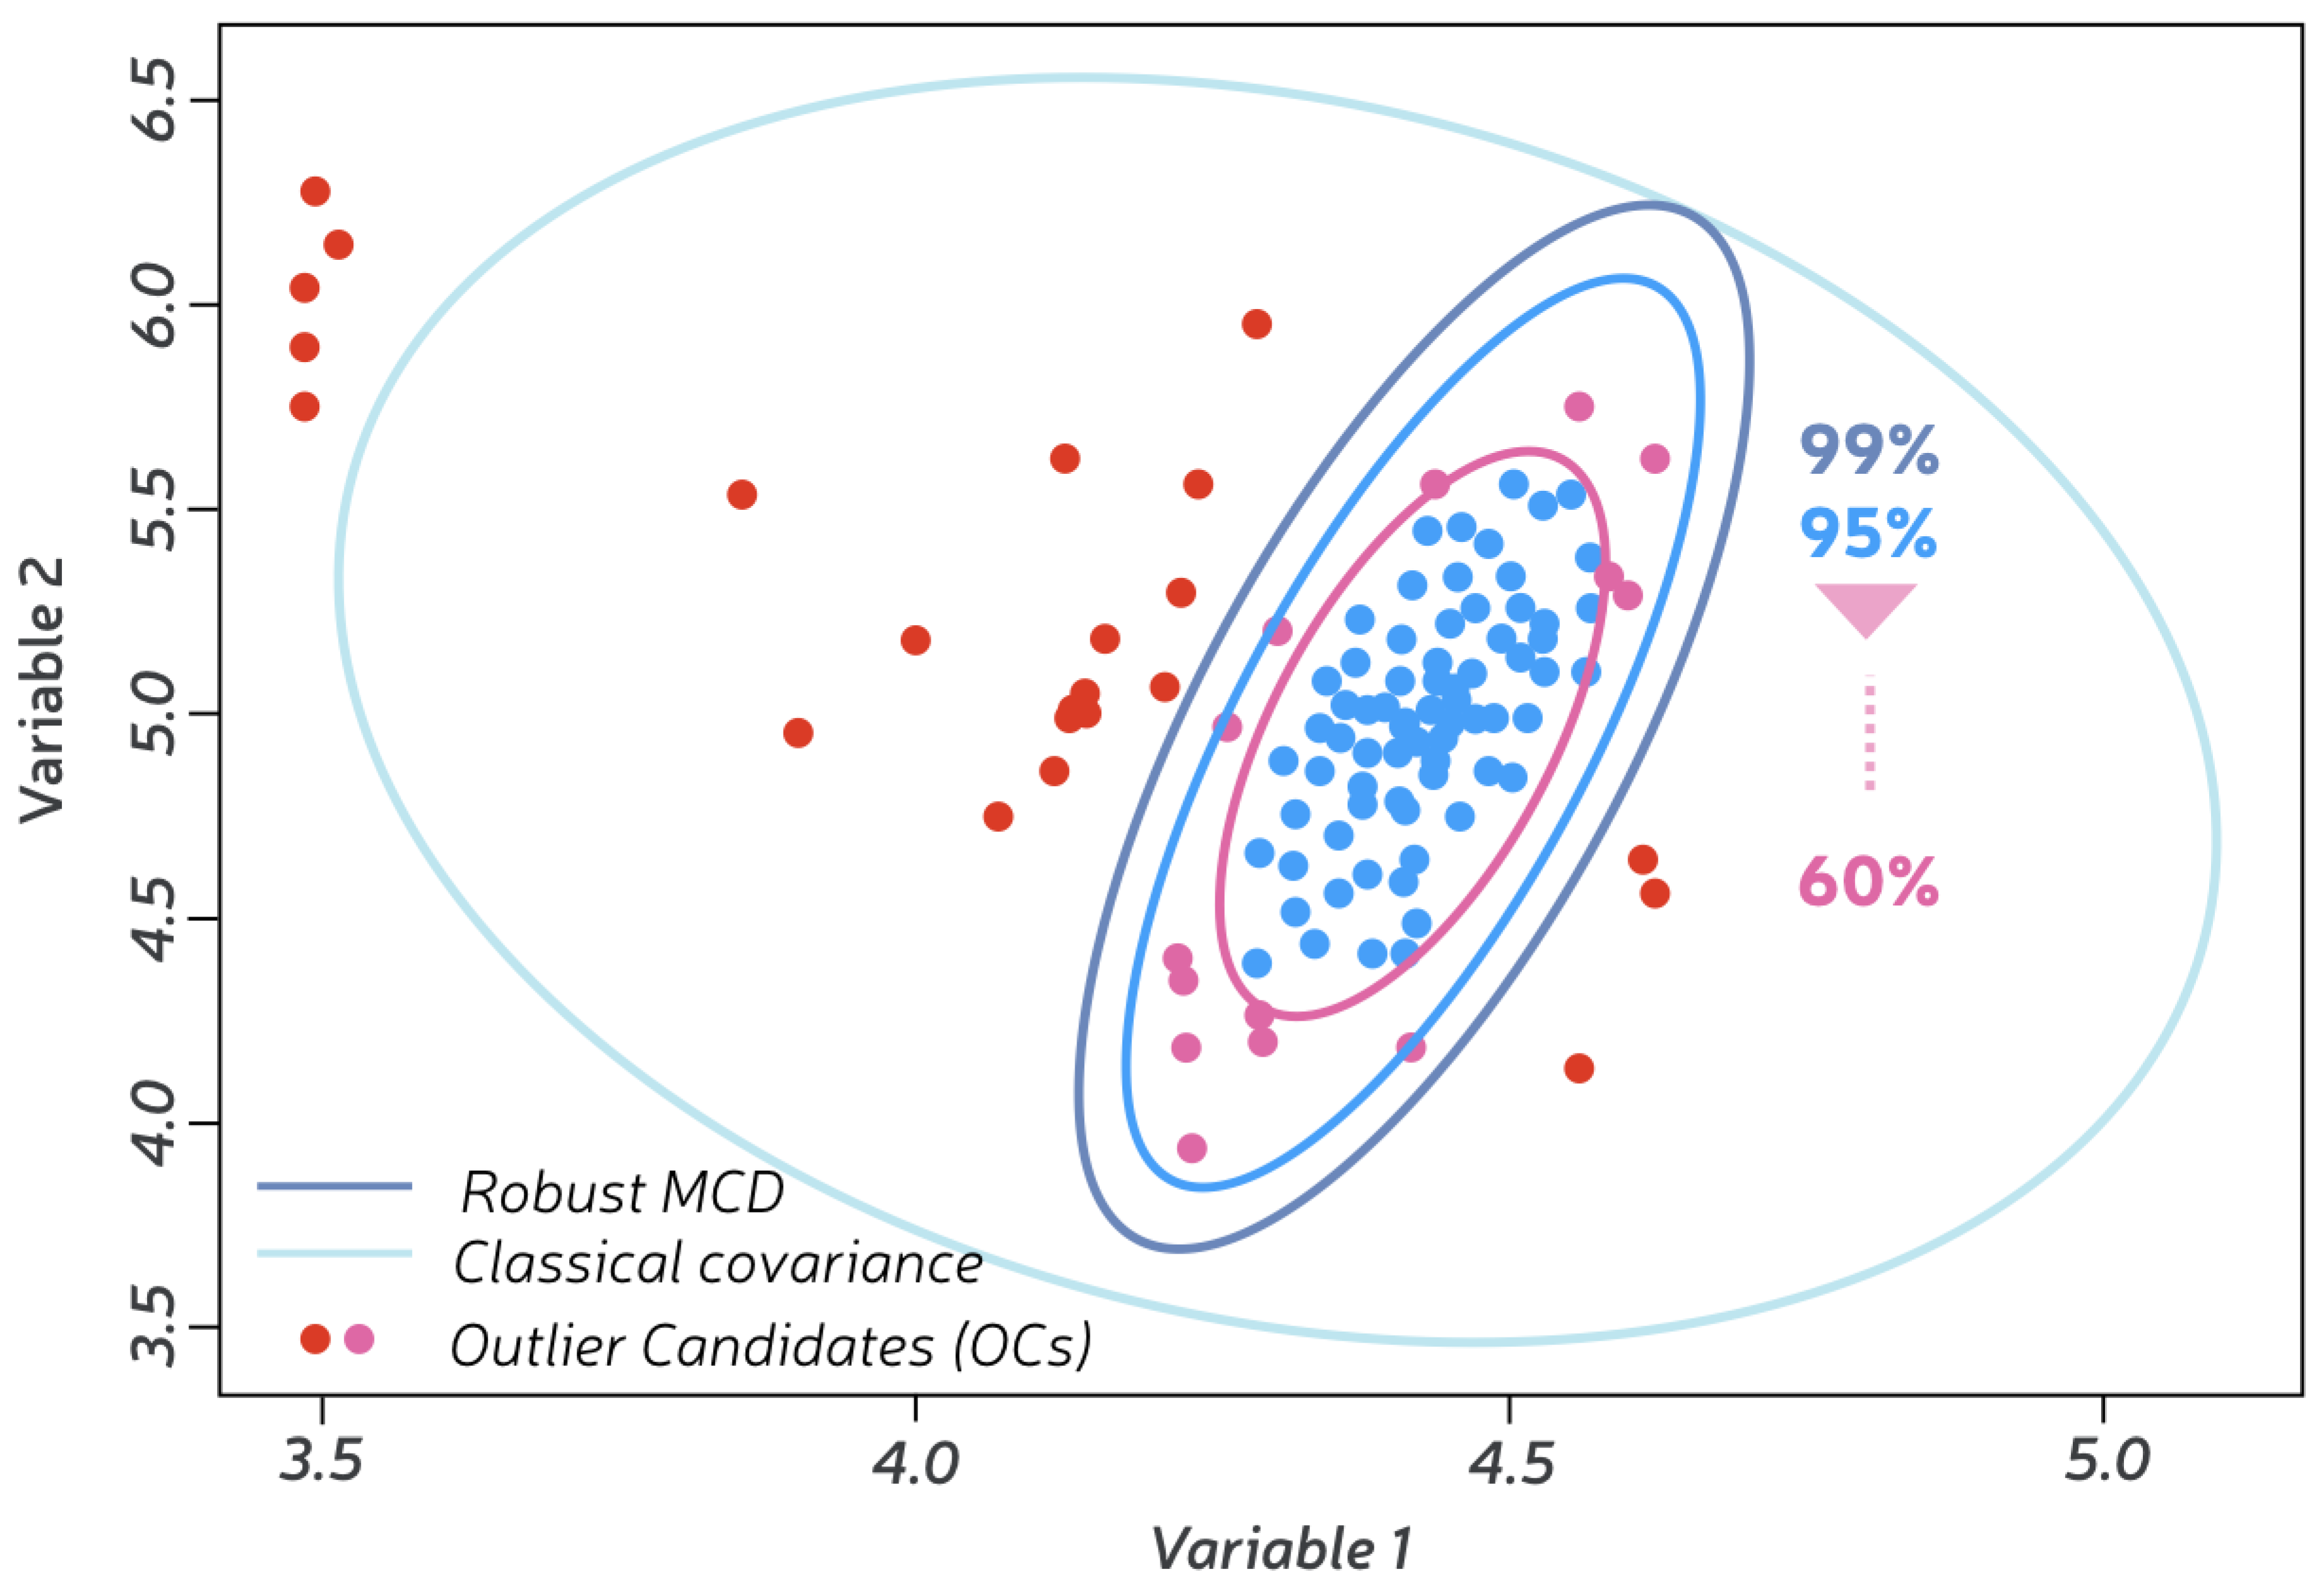
4.1.1. Step 1: Outlier Candidates (OCs) Detection

The goal of outlier detection is to separate a core of reliable observations from outlying ones. Assume a sufficiently large sample size from a population with a finite level of variance. In the initial step, all MT-InSAR estimates within population are tested for normal distribution (population size and processing time requirements are summarized in Section 4.1.6, Table 5). We aim to analyze observations which are far from the fitted distribution. As the first step, a robust covariance estimate to data is applied, and a confidence region (ellipse in 2D, Figure 4) to the central data points is fitted. For each dataset, we consider that 40% of samples might correspond to noise and points outside the confidence region are considered outlier candidates (OCs). The whole process estimates the inliers in a robust way, while the robust form of Mahalanobis distance (or robust distance) is used to derive a measure of outlyingness.
If we assume that the data are d-dimensional and are stored in an n × d data matrix X = ( x 1 , , x n ) T with x i = ( x i 1 , , x i d ) T we can compute robust estimates of covariance by the Minimum Covariance Determinant (MCD) method [56,57,58]. For explanatory purposes, we stick to two-dimensional data and variables of velocity and residual height (Figure 4). The MCD estimator, firstly introduced by the authors of [56,57], is defined as the mean and the covariance matrix of the half set H containing h observations whose covariance matrix has the smallest determinant. The usual value of h, i.e., the one which achieves the highest breakdown point, is h = n s a m p l e s + n v a r i a b l e s + 1 2 , where n s a m p l e s is the sample size and n v a r i a b l e s is the number of variables. In general, all h-subsets cannot be considered, and one must rely on approximate algorithms, such as those introduced by computationally efficient FAST-MCD algorithm [58]. A FastMCD algorithm [58,59] was implemented for the computation of MCD estimator.
The Minimum Covariance Determinant (MCD) can be used in highly contaminated datasets, with up to n s a m p l e s n v a r i a b l e s 1 2 outliers. As indicated in above paragraph, the goal is to find n s a m p l e s + n v a r i a b l e s + 1 2 observations whose empirical covariance has the smallest determinant. Such “pure” subset of observations is then used to compute standard estimates of location and covariance. The locations or the robust distances accurately reflect the true distribution of the observations [56]. Minimum Covariance Determinant (MCD) is a robust estimator and guarantees that the estimation is resistant to erroneous observations.
A high level of statistical significance α = 0.4, or a so-called statistical tolerance of 60%, represents the assumption that 40% of measurements might correspond to erroneous observations. This is given by M C D ( x ) χ d , 0.6 2 where χ d , 0.6 2 is the 0.6 quantile of the chi-squared distribution with d degrees of freedom. The argument of χ d , 0.6 2 represents a threshold for which data points becomes inliers or outliers (Figure 4). This proportion is the value given to the contamination parameter (i.e., outliers fraction) of the algorithm. Inliers are labeled 1, while outlier candidates are labeled –1 and this information is stored in ’Evaluation’ column of the rejection table (Table 3, Section 4.1.4).
Such separation of data into inliers and outliers does not imply that we are straight discarding the outliers. The outliers are further analyzed, so we instead prefer to use the term outlier candidates (OCs). OCs are not necessarily errors. The unusually high level of statistical tolerance in place (Figure 4) is justified by the fact that outlier candidates are further analyzed in accordance with spatial properties of the points in their neighborhood. This has an inherent benefit for the initial selection of the points for MT-InSAR processing, as parameter settings using, for example, amplitude dispersion [1,2] might be loosened to increase the densities of analyzed points.

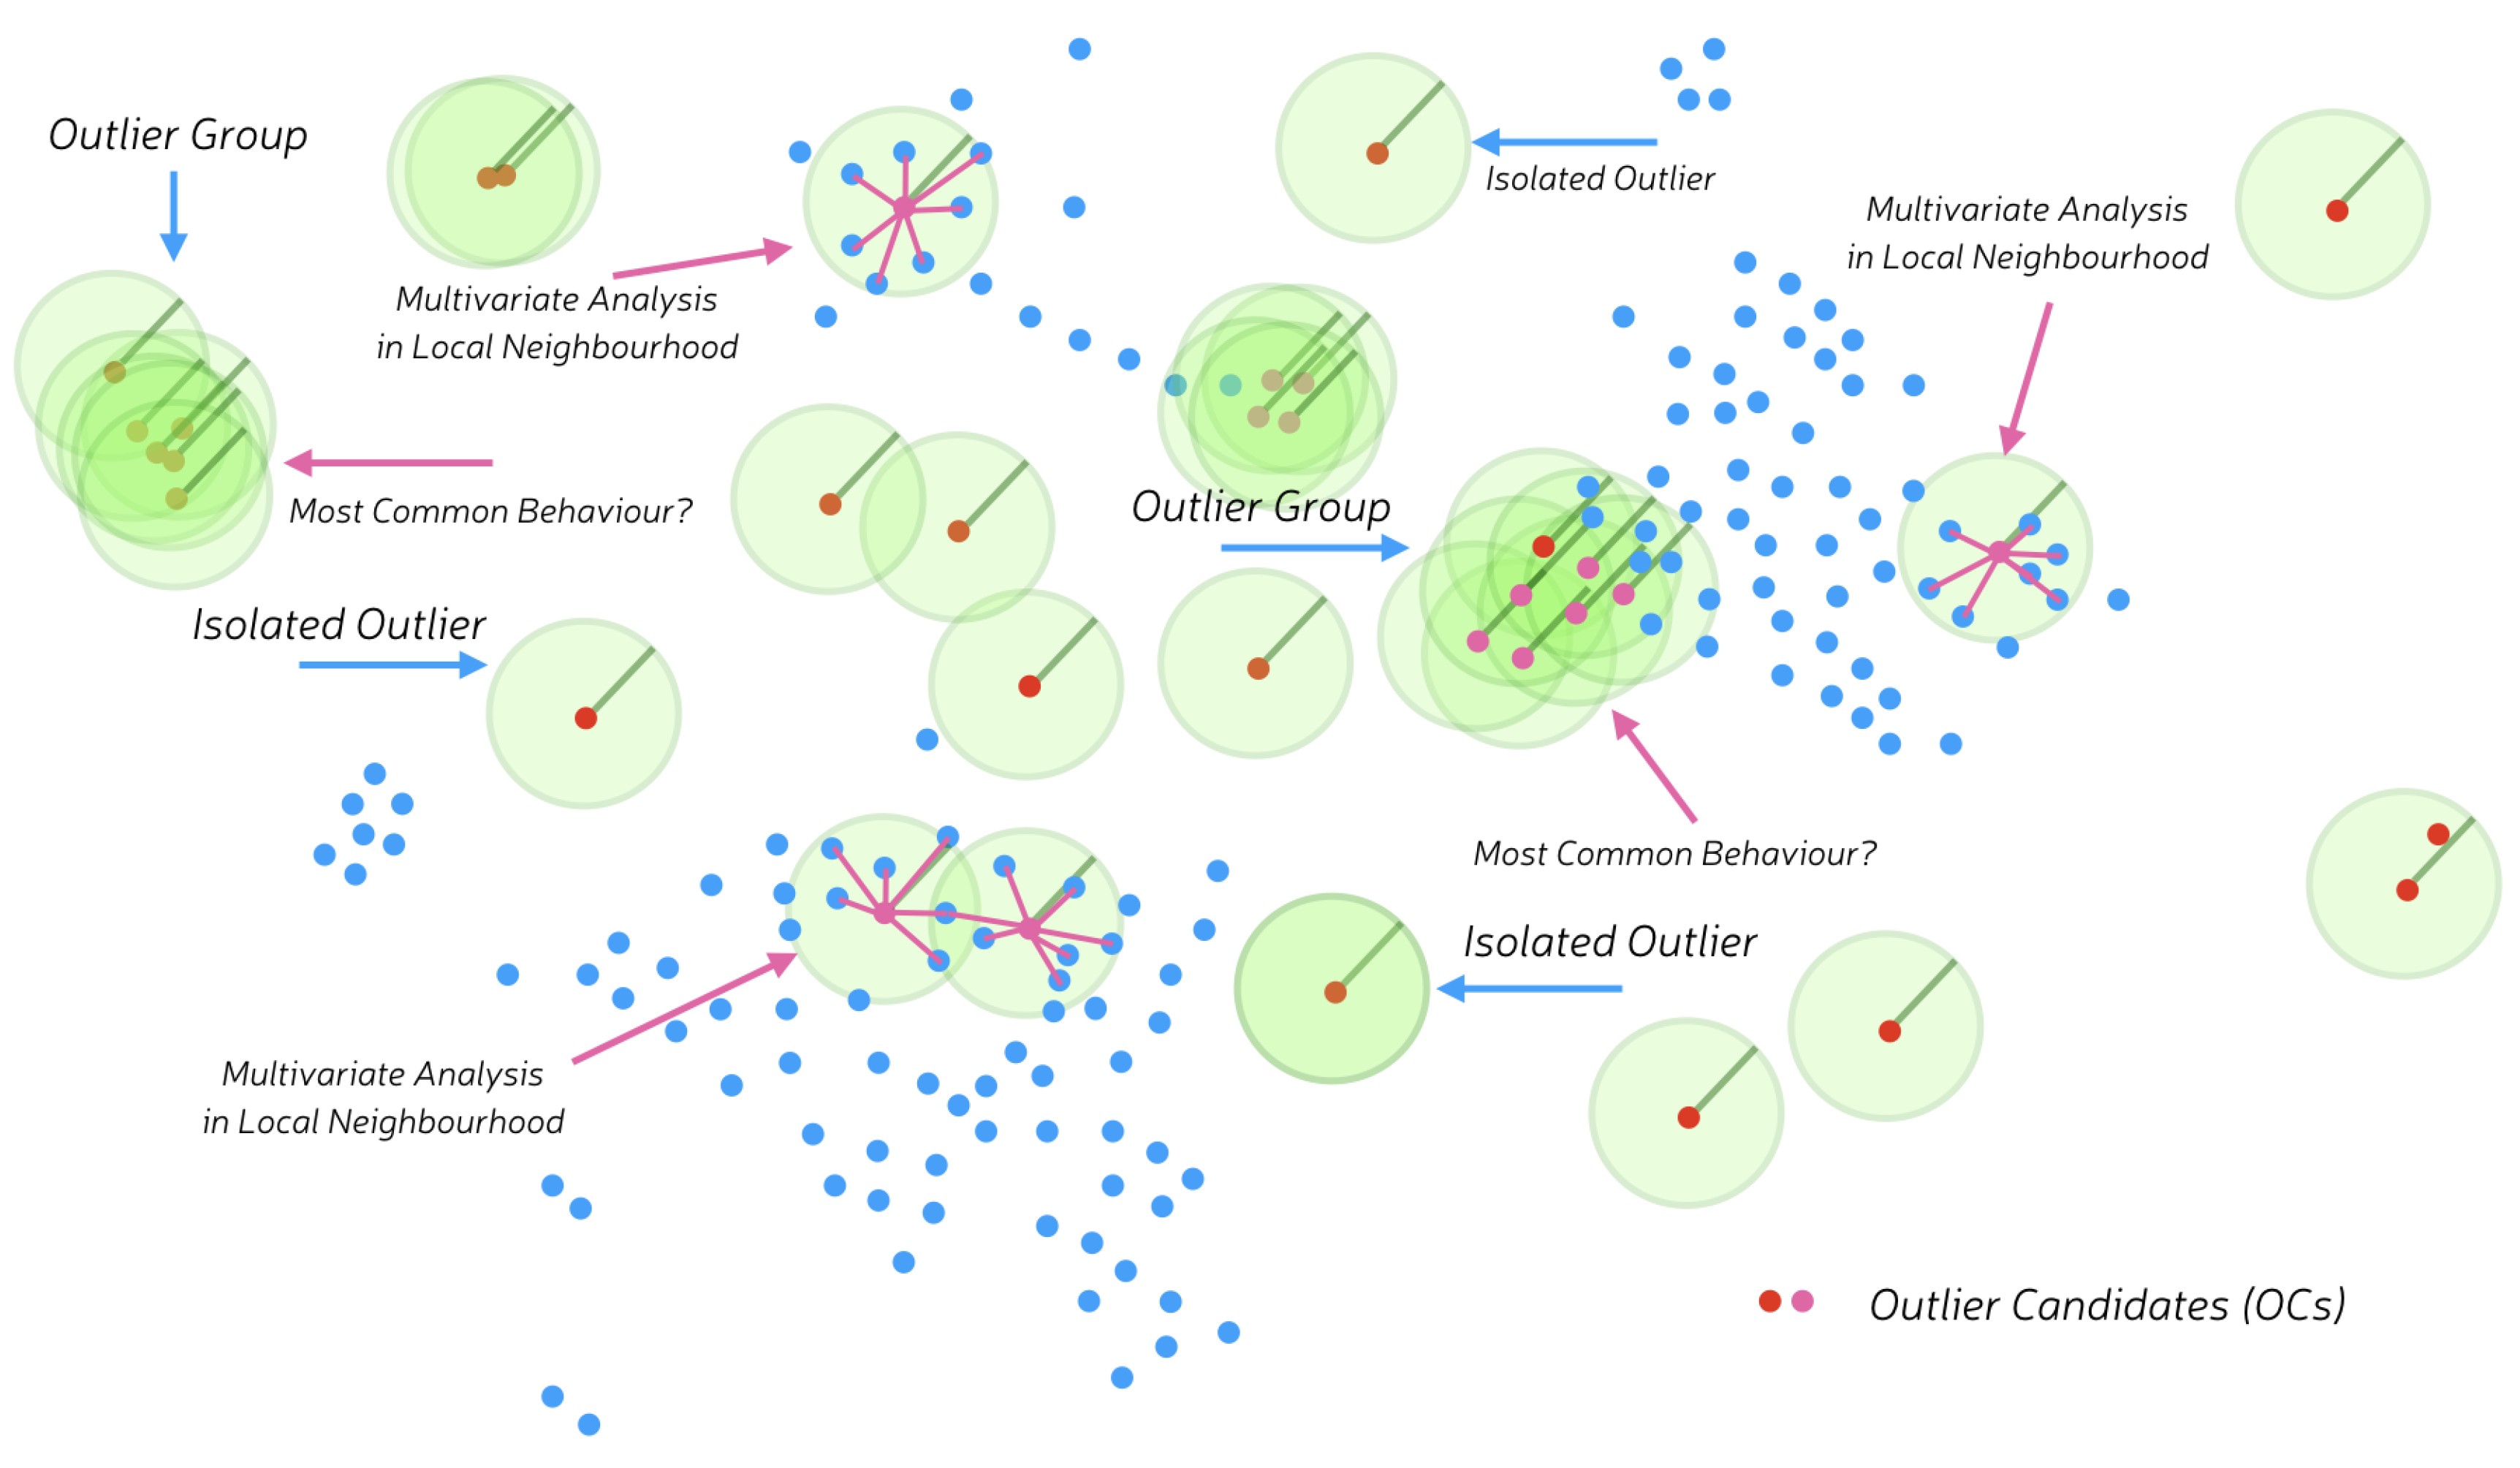
4.1.2. Step 2: All Nearest Neighbors Search

Performing outlier detection methodology as the first step of the proposed procedure is efficient since it is not necessary to perform clustering and/or nearest neighbor queries for every point inside the dataset, as proposed in [36]. Finding all nearest neighbors is performed in 50-m radius of every OC point. The radius should be chosen large enough with respect to data resolution (50–100 m for Sentinel-1), such that it still yields the same segmentation but maximizes the number of visited neighbors per query. All nearest neighbor search inside a given radius is an integral part of our approach since we aim to evaluate the underlying spatial relations of OCs among observations in the neighborhood. The fundamental output of this step is a list of neighboring points for each OC inside a dataset.
As a spatial-partitioning data structure, a kD-tree method [60,61] was selected as the most efficient data structure for arbitrary dimensions with quick lookup times for radially bounded queries. kD-trees are a widely used approach for performing nearest neighbors search in spatial data analysis, and research is currently concentrated on memory-efficient implementations for large-scale datasets. The expected complexity of the nearest neighbor lookup is O   ( log ( n ) ) and the construction time of a kD-tree is O   ( n log ( n ) ) [60].

4.1.3. Step 3: Multivariate Analysis in Local Neighborhood

The variables defined in location of each OC are compared towards variables of the neighboring points. Clusters of outliers (Figure 5) which are identified by looking for connected components of undirected graph, employing graph theory [62], are the main output of this step (Step 3).
The OCs are tested for the presence or non-presence of outliers in the neighborhood based on the evaluation labels (Table 3) provided from MCD method (Step 1) and list of neighboring points from kD-tree method (Step 2). In Step 3, the OCs with the presence of other outliers in the neighborhood are segmented into wider groups and are being evaluated separately. The segmentation of dataset into outliers clusters is performed to analyze statistical properties of OCs against representative proportion of PS points in spatial domain, since systematic errors might cause clusters of PSs separated by a large distance to behave differently from what is being anticipated in mathematical model applied amongst the majority of points [63,64].
All OCs which were not classified as grouped are considered isolated. Each isolated outlier with temporal coherence greater than selected minimum is kept inside the dataset. For OCs in groups and isolated outliers, the comparison is performed only with neighbors labeled as inliers (Evaluation = 1), in order to match the behavior of outliers towards proportion of the "normal" data. If the value for particular variable deviates more than the rejection criterion [65] of absolute deviation from the median of all inliers in the neigborhood [36,66], it is labeled 1. This way, OCs’ variables are labeled inside the rejection table (Table 3) with 0 (non-deviating) or 1 (deviating). Such labels are used to identify spatially correlated clusters and separate them from noise (Step 4). Outliers clusters with common statistical properties (Step 4) are sought to be preserved in final results as potential indicators of anomalous behavior. The re-assessment of the processing methodology might be required for low-coherent inliers (as discussed in Section 6), which is also the reason they are designated as potential ’problems’ inside the ’Decision Label’ of rejection table (Table 3) and in the following Step 4.

4.1.4. Step 4: Decision Making Process

The process of extracting useful information from OCs is represented by decision making-process (Figure 5) performed on the basis of rejection table (Table 3). The variable columns (Velocity, Height, etc.) are pre-assigned with 0 or 1 based on median absolute deviation [36,66] from prevailing values of inliers (Evaluation = 1) in the neighborhood (radius) or inside the cluster of outliers. If there are no inliers, OCs are considered isolated (’Isolated problem’). If the comparison with inliers in neighborhood does not exceed the rejection criterion [63,64], a point is kept inside a dataset as ’Unknown problem’. For outlier candidates (OCs) where individual variables exceed the rejection criterion, the problematic variables are flagged 1 (’Height problem’ or ’Velocity problem’). ’Low-coherent Alerts’ (Table 3) are indicated for groups of OCs sharing most common behavior, indicating that the respective part of the monitored area exhibits similar statistical properties and might represent a potential deformation threat.
Pre-assignment of labels for problematic variables in each outlier candidate (OC) and groups of outlier candidates are used to form classes ’Decision’ and ’Decision Labels’ (Table 3). The example in Table 3 is limited to variables of velocity and residual height as those constitute the primary estimates of MT-InSAR methodology. Decision classes are further utilized for designing set of decision-supporting tools which are accessible from the Graphical User Interface (GUI) of the remotIO web-app via the ’Analytical Tools’ toolbar (Figure 9).

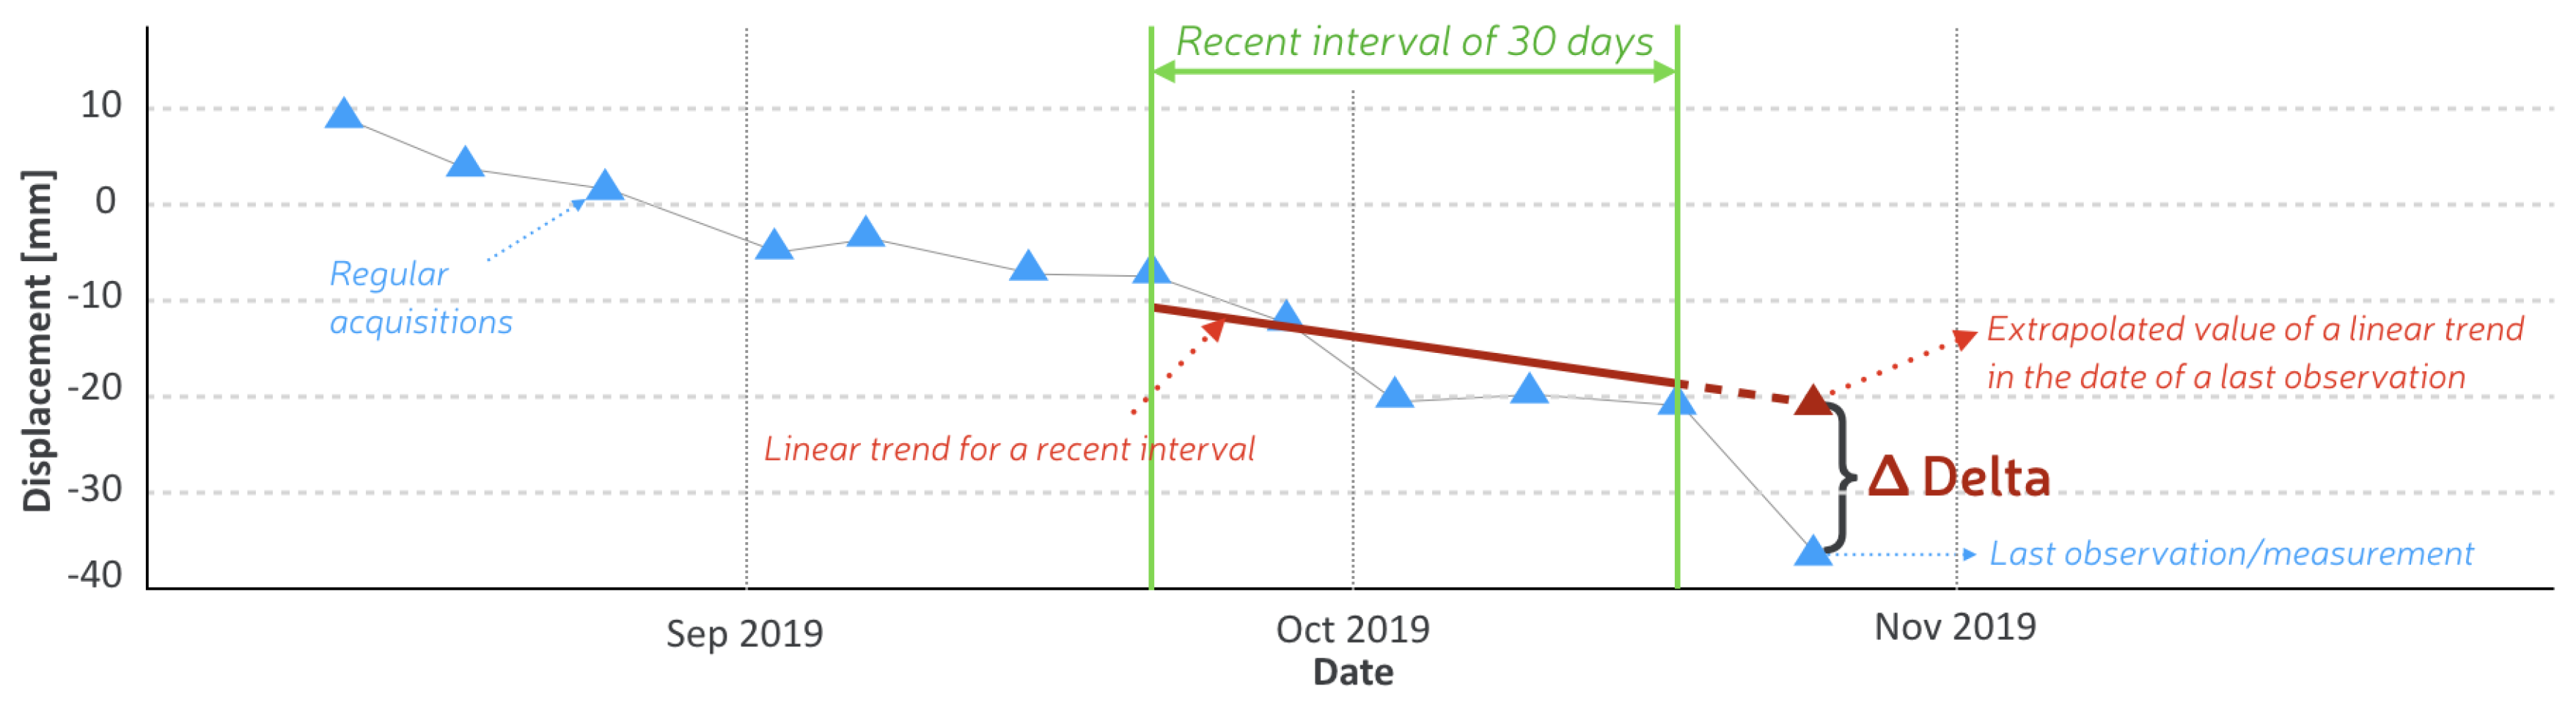
4.1.5. Step 5: Time Series Warning

Along with the multiple estimated parameters (displacement velocity and residual height for the scope of this paper), each PS point disposes of displacement time series, updated regularly inside remotIO platform. Since the interest of end-users is mainly focused on obtaining information on the current state of the monitored area, the time series warning step is dedicated to evaluating the behavior of the most recent observation. The time series analysis is based on the approach proposed by Raspini et al. [28]. Our approach is designed to evaluate the amount of deviation of the most recent observation with respect to the linear trend of observations in the last 30 days. Likewise, the total amount of deviation from the linear trend of historical data over arbitrary time-span can be used to set early warning mechanism. The procedure holds for (Figure 6):
  • estimation of the linear trend for observations acquired within an interval of last 30 days;
  • prediction (extrapolation) in the date of last observation; and
  • comparison of actual measurement with the expected value from the linear trend.
For each PS point, the ’Delta’ parameter value is estimated and assigned with a sign (+/−) and is then used to assign parameters for visualizing different characteristics of current warning state (Table 4):
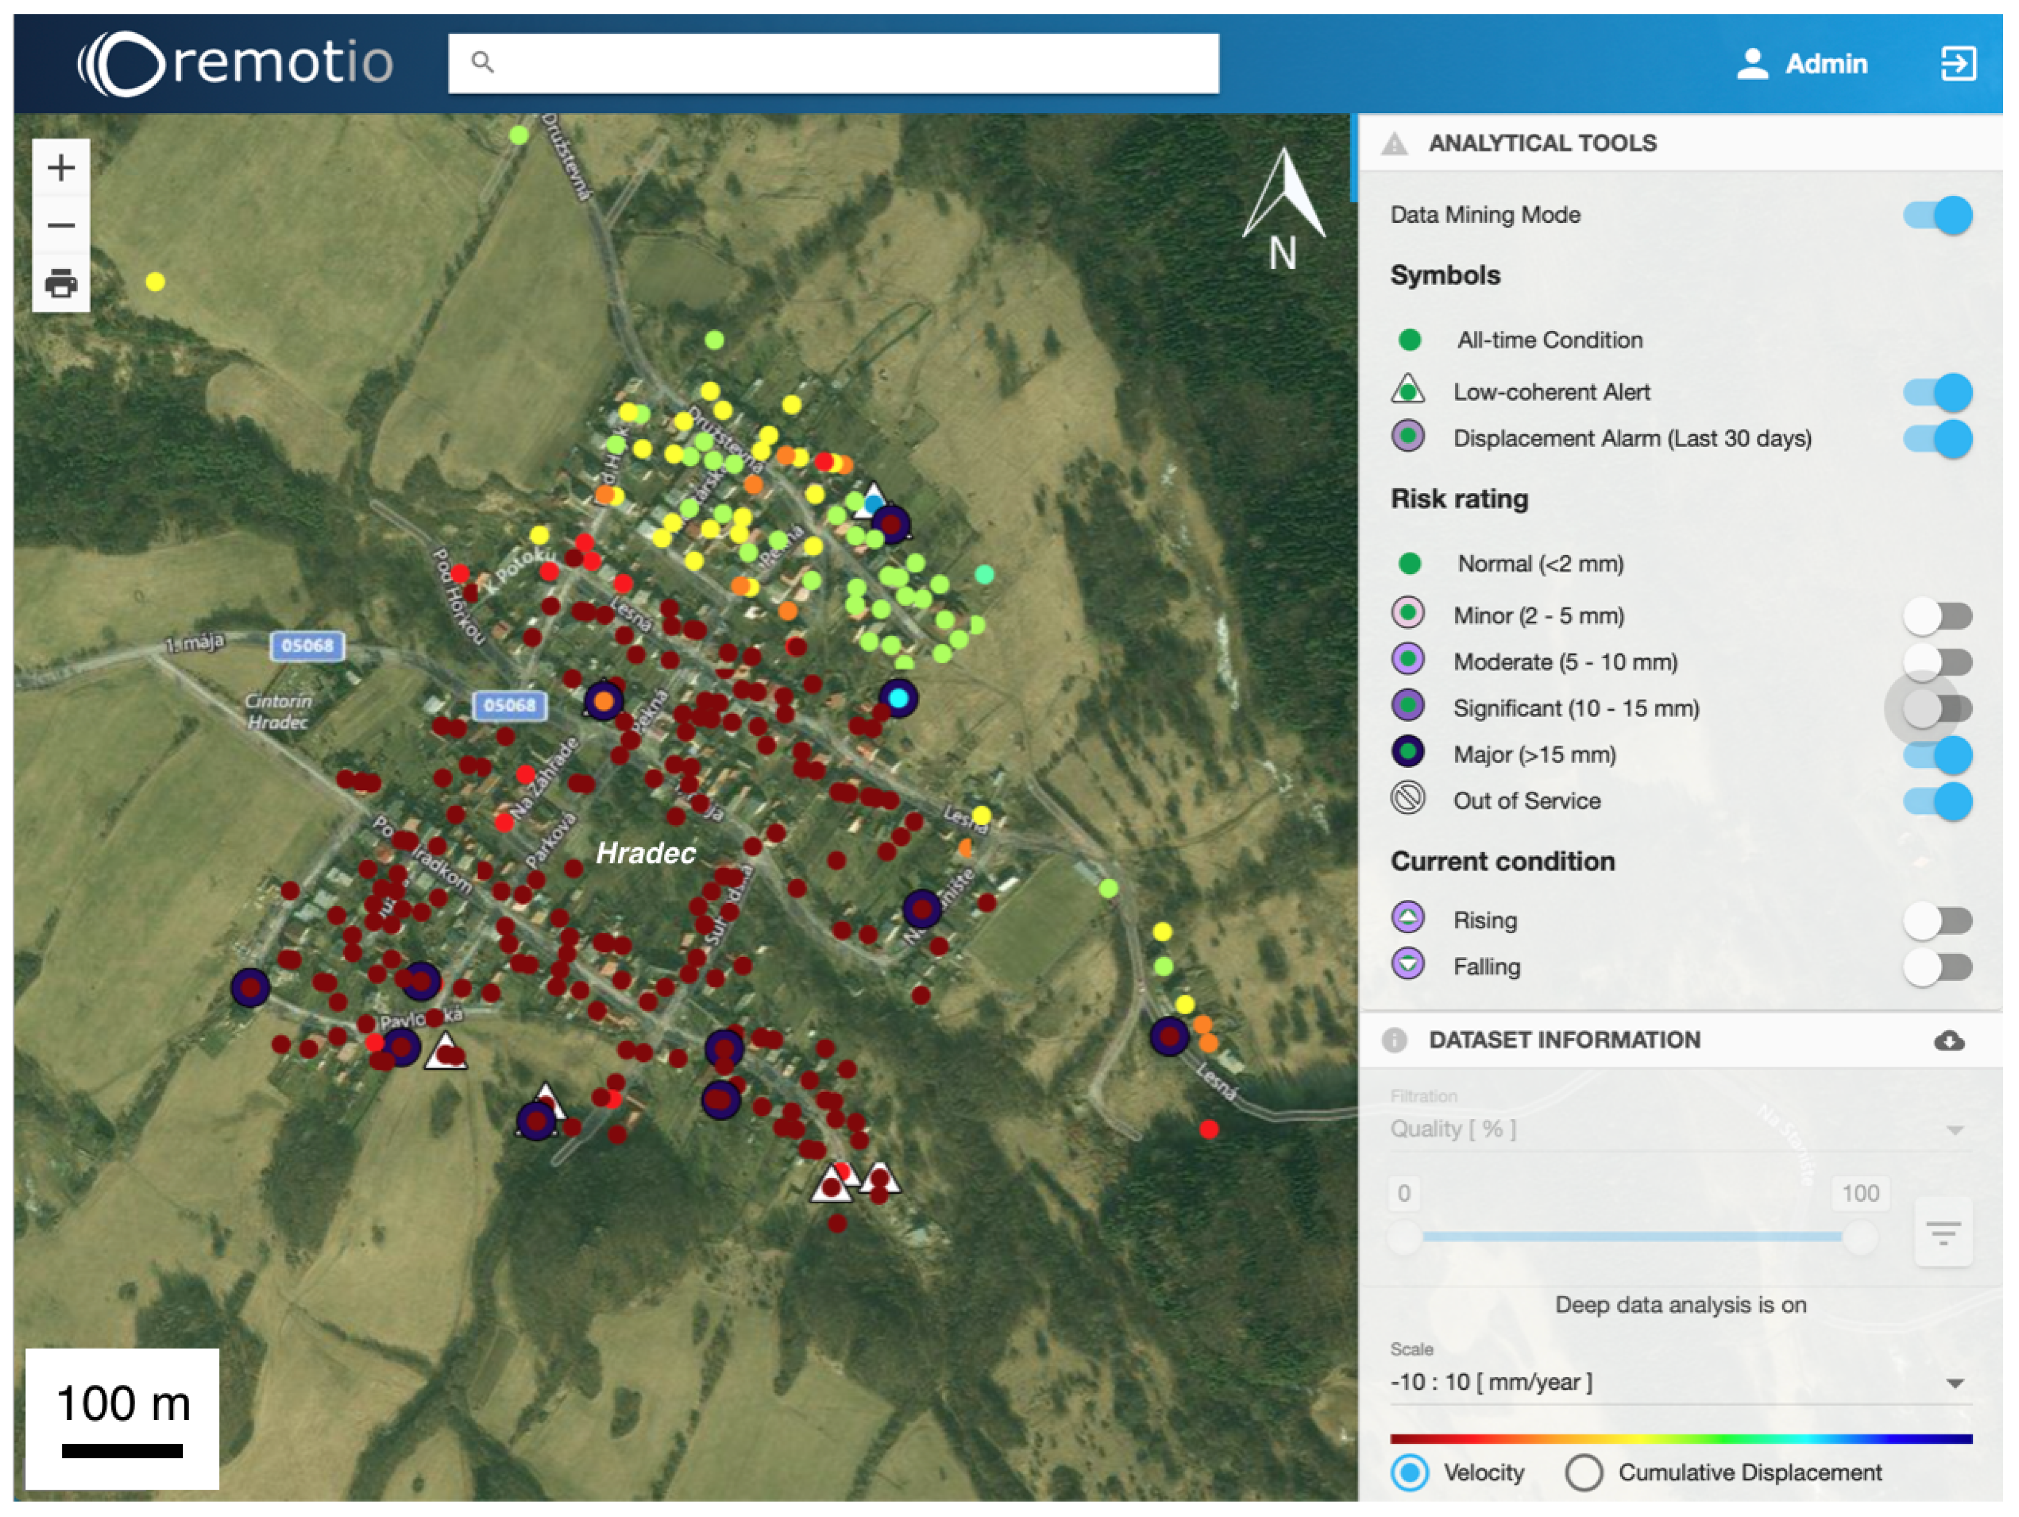
  • ’Displacement Alarms’ with pre-assigned levels of ’Risk Ratings’ with intervals defining the amount of deviation ((1) Normal; (2) Minor; (3) Moderate; (4) Significant; and (5) Major) of the last observation in comparison to velocity recorded for previous 30 days.
  • Symbols (▲/▼) expressing ’Current Condition’ of the observed point (Rising/Falling) in accordance with the sign (+/−) of the ’Delta’ value.
For the displacement alarms exceeding the phase change detectable in a single pixel (half the wavelength, i.e., 28 mm), the possibility of unwrapping error cannot be rejected. Moreover, considering the worst case scenario of scatterer with Signal-to-Clutter ratio as low as 4 dB, the three-sigma confidence bounds yield approximate threshold of 15 mm for false alarm rejection. The intervals of ’Risk ratings’ have been set in accordance with end-user requirements and observed deformation scenarios over pilot monitoring sites (see Section 5). Although we use the term ’risk’, we are actually referring to the ’vulnerability’ (Minor, Moderate, Significant, and Major) of detected zones where displacement alarms are triggered.

4.1.6. Comparison with Previous Version

Since the foundations of post-processing methodology were firstly introduced by Bakon et al. [36], changes introduced in current implementation are summarized in Table 5. The execution times of Bakon et al. [36] and newly developed version were tested on datasets with different total amount of points. The computations were performed on a server setup with the following characteristics: 24 CPUs (Intel® Xeon® CPU E5-2680 v4 @ 2.40GHz), 256GB RAM (16 × 16 GB DIMM DRAM EDO), 1 TB system SSD for processing and OS GNU/Linux Ubuntu 18.04 LTS. The results are shown in Table 5.

4.2. Added-Value Products

’Low-coherent Alerts’, ’Displacement Alarms’, ’Risk Ratings’ and ’Current Condition’ parameters (Section 4.1) are utilized for designing a set of decision-supporting tools which are accessible from the Graphical User Interface (GUI) of the remotIO web-app via ’Analytical Tools’ toolbar under Level 3 product tier of the remotIO’s framework. A set of GUI operators (Figure 9) allows end-users to further explore information stored over filtered deformation maps.
After activating the ’Data mining mode’ under Level 3 product tier, final results are filtered and could be superimposed with added-value information (’Low-coherent Alerts’, ’Displacement Alarms’, ’Risk Ratings’ and ’Current Condition’). When this information is matched together (see Section 5), the end-user should be able to easily interpret results which are continuously and regularly updated. Such methodology is beneficial for improving point densities, for tackling outliers with extremes in any variable and focusing attention towards evaluation or re-assessment of low-coherent areas.
With our approach, the final set of information provided by MT-InSAR analysis is enhanced for statistical layers of: (i) low-coherent inliers and ’Low-coherent Alerts’ which directs the attention of end-users towards problematic areas or zones with potential deformation threats; (ii) ’Displacement Alarms’ to evaluate the progress of displacement time series in recent periods; (iii) ’Risk Ratings’ to assess the amount of displacement in the most recent satellite acquisition; and (iv) ’Current Condition’ for overview of the actual movement tendency (up/down) of the observed point. As a result, the final set of standardized products provided under the remotIO’s decision-support framework is composed of three layers in comparison to traditional procedures, as schematically illustrated in Figure 7.

5. Results

Several case studies from monitoring urban environments are presented in this work in order to demonstrate the ability of our data mining approach to filter final deformation maps. The use of a full range of a coherence value enabled the detection of areas affected by significant movements or added inconsistencies. The preliminary results over three pilot monitoring scenarios ((1) Landslides; (2) Mining subsidence; and (3) Dams) are presented in this section.

5.1. Landslides (Upper Nitra; Hradec, Velka and Mala Lehotka)

Since conventional terrestrial techniques provide only point-wise information on the landslide’s activity without timely and efficient updates, the use of MT-InSAR technology as implemented within remotIO framework is foreseen to improve situational awareness in the area. For this particular case, our product can help demarcate distinct areas of motion; better understand the surface deformation pattern of landslides and its spatial and temporal evolution; and assess the success of remediation works. Monitored movements in the interval of several millimeters up to two centimeters per year are ideally traceable with mid-resolution C-band data of Sentinel-1.
remotIO’s pilot scenario for the continual monitoring case are the areas of Prievidza city districts Hradec, Vel’ká and Malá Lehôtka affected by recent activation of these geohazards. Ongoing landslides activity and its consequence (damaged buildings and infrastructure) emphasize the requirement for operational capabilities of monitoring schemes. Moreover, areas of lower coherence due to accelerating or decelerating movements are to be expected; hence, our data-mining approach could help attain sufficient attention towards problematic sectors for deeper investigation.
The PS deformation maps of remotIO Level 1 products (Figure S1a,b) are visualized in the area of 2.5 km × 2.5 km (6.25 km 2 ). The reference point is set in the stable part of Prievidza city, 1 km from the area of interest. The areas affected by strong deformation process (up to 2 cm/year) are evident over the vast majority of Hradec and Velka Lehotka suburbs. Several PSs in central part of Hradec village (northeastern one) even exceed the velocity of 2 cm/year.
Thanks to the availability of both sensing geometries (ascending and descending), a decomposition to vertical and horizontal component in descending azimuth look direction is possible [52]. The deformation pattern detected in ascending track (uplift) progresses in the opposite direction to descending track (subsidence). This is a consequence of prevailing horizontal (westward) direction of actual displacement vector, as illustrated by remotIO Level 0 product in Figure S2.
Since observed landslide is substantially active and several buildings are subject to continual damage, assessment of remediation works and operational routine monitoring is of utmost importance. The capabilities of decision-support analytics under the Level 3 product tier of the remotIO platform are presented here for the area of Hradec village (Figure S1). The areas affected by active deformation processes (up to 2 cm/year, show in red) are visible over the vast majority of Hradec suburb from Sentinel-1’s descending track No. 51 (Figure S1). Filtering capabilities of ’Data mining mode’ and proposed methodology are presented in Figure 8.
As observed in Figure 8, many of the points are discarded with thresholding on temporal coherence (>0.7). More than 300 points and additional alerts and alarms (as summarized in Table 6) from both orbit tracks are preserved in final results when data mining is used. Besides increasing the amount of preserved points in final results, there are several ’Low-coherent Alerts’ in the area and some ’Displacement Alarms’ with ’Major’ risk ratings that are concentrated in the southern part of the village, as showcased in remotIO’s web-app environment in Figure 9. Several buildings would have been left without any information if a simple thresholding procedure were applied. Additionally, newly preserved ‘Low-coherent Alerts’ and ‘Displacement Alarms’ might be crucial for the identification of buildings affected by motions in very recent periods.
Detailed and frequent remotIO’s Multi-temporal InSAR displacement time series in Level 2 and 3 products helped the monitoring authority (SGUDS) to reveal the slow deceleration of movement activity and overall stabilization of landslide body over past years for both Hradec and Velka Lehotka (example shown in Figure 10). SGUDS authority considers information provided by remotIO as good assessment indicator of remediation works already performed after critical situation in 2014 as well as for planning and good positioning of further such remediation works.
The example of displacement time-series that were recorded for series of alerts and alarms is shown in Figure 11. ’Displacement Alarm’ triggered for the point inside Hradec village reveals movement of −11.0 mm with change detected in April 2019. Such points could indicate a need for field inspection, prevention activities or re-assessment of processing methodology for mitigation of systematic errors (such as local inclusion of non-linear model or adaptation of solution space).

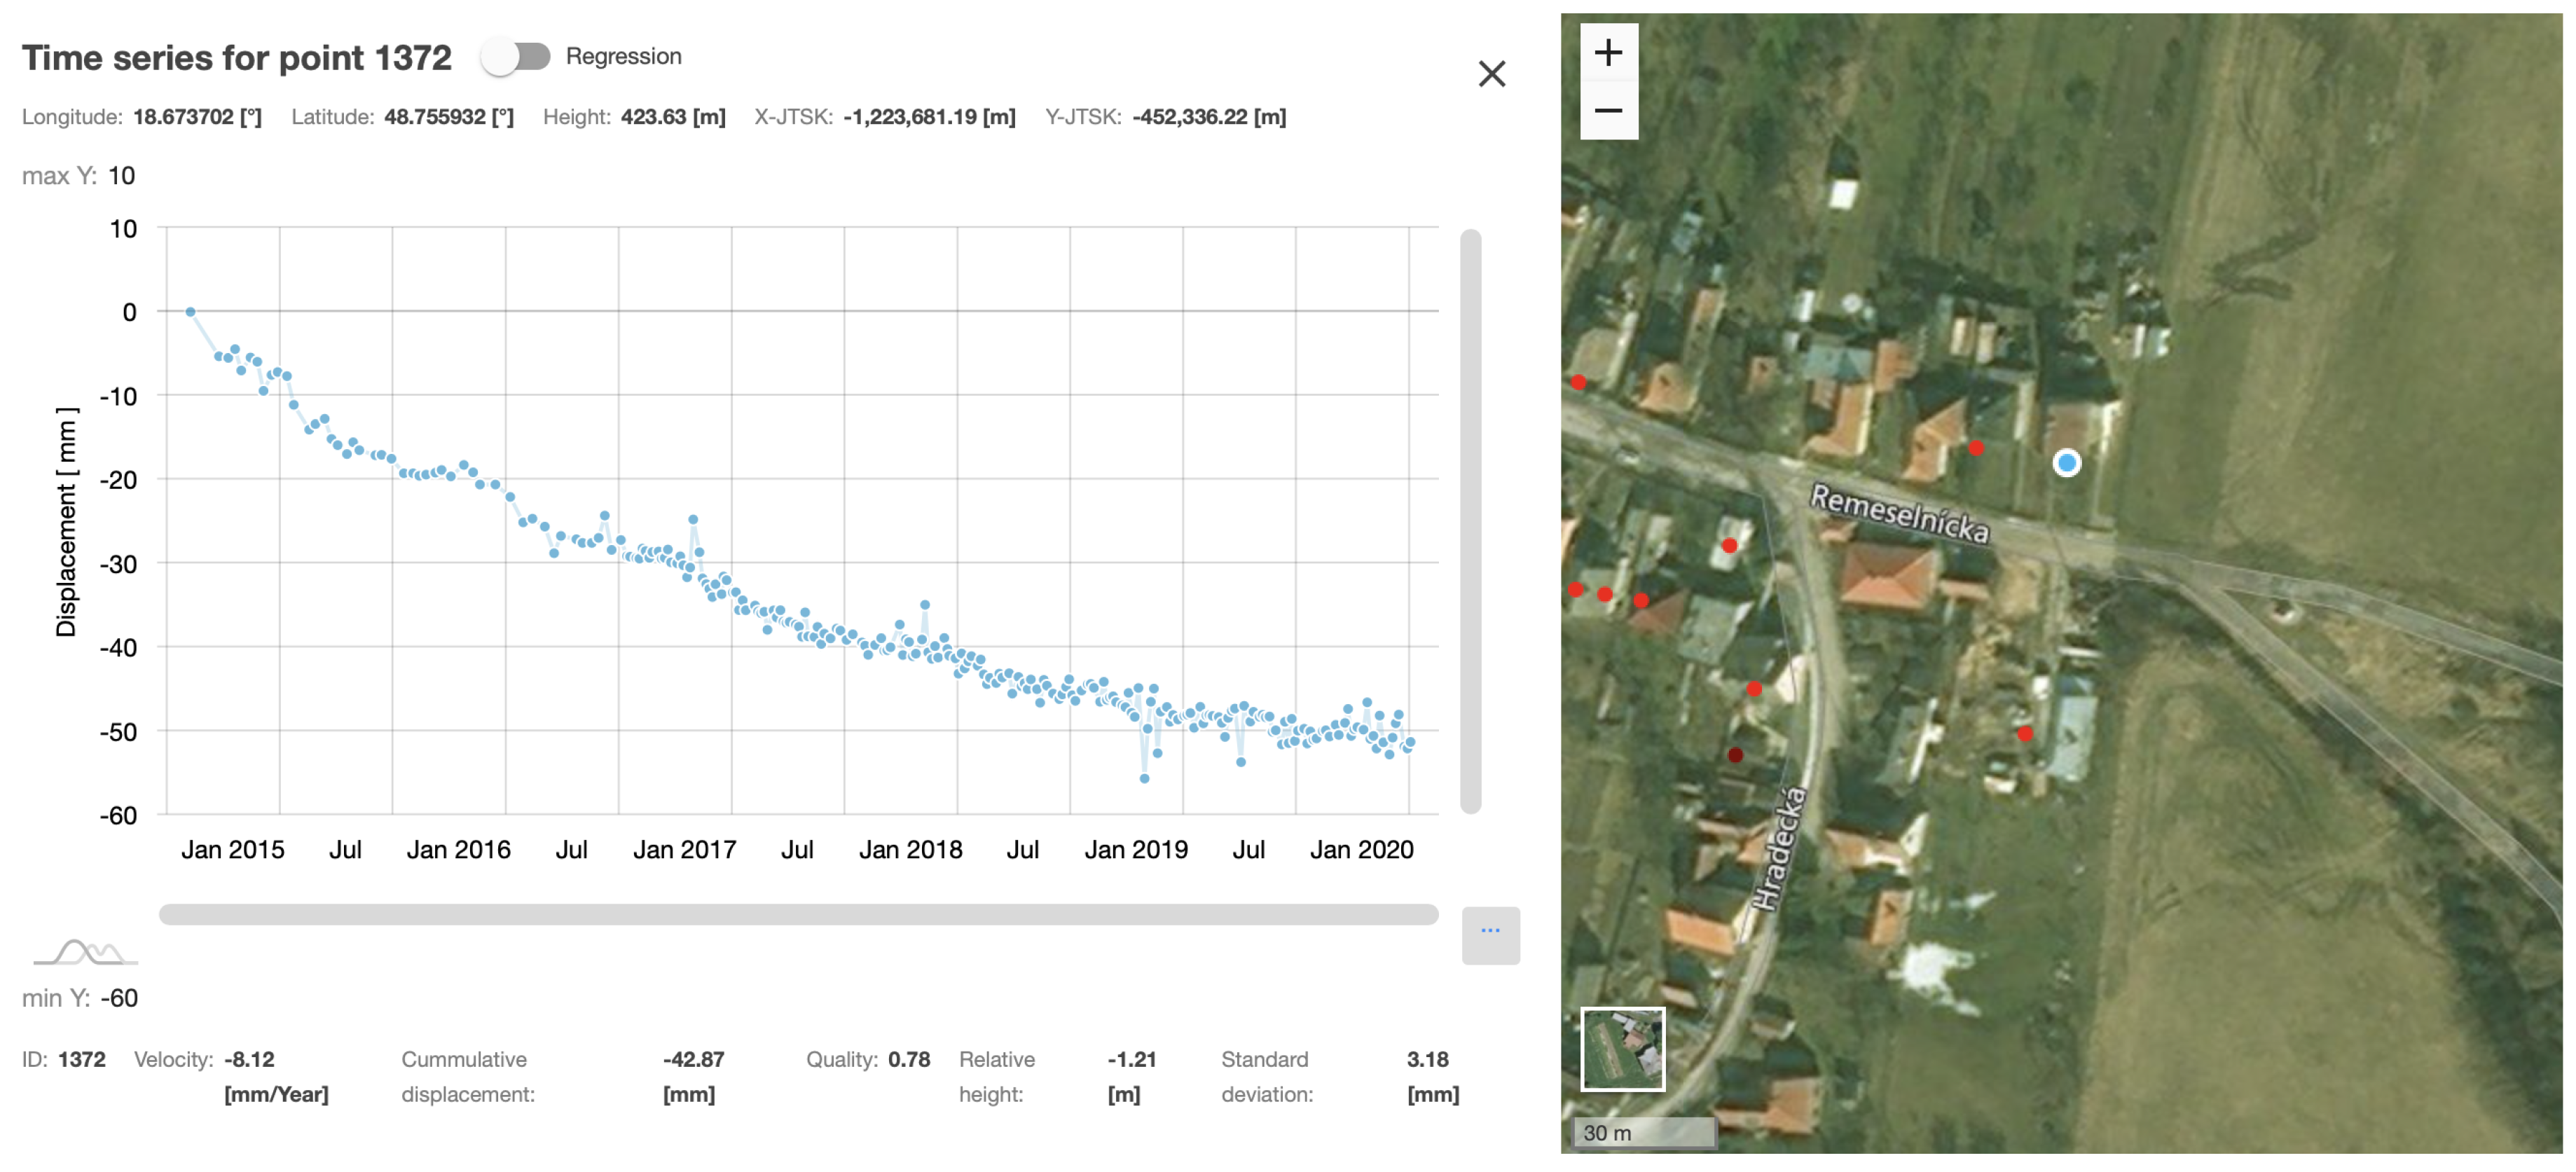
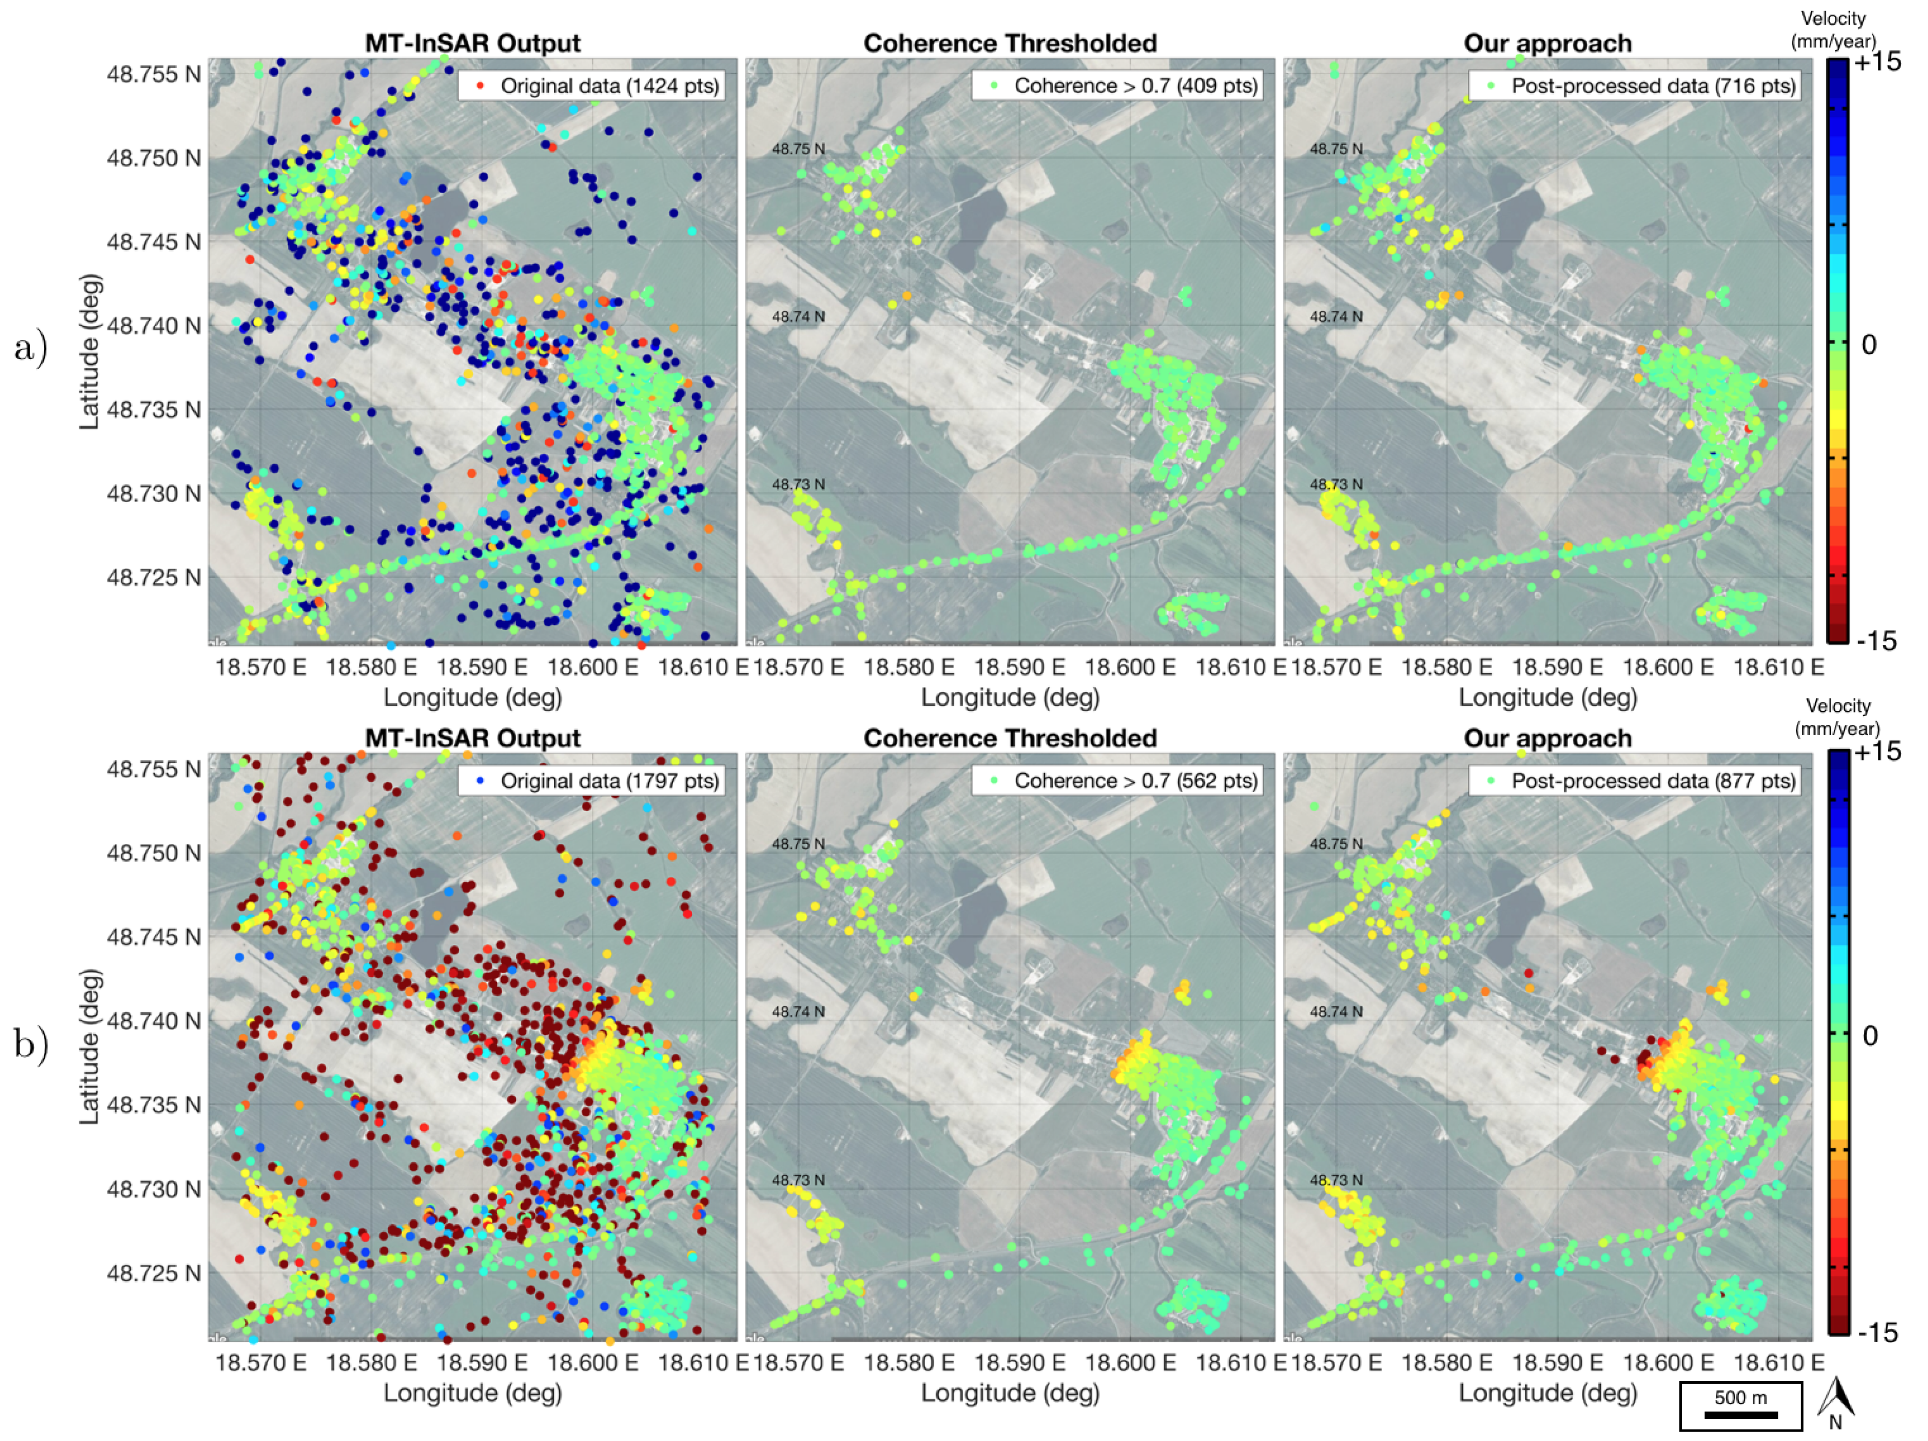
5.2. Mining Subsidence (Upper Nitra, Kos Village)

For the area of active mining in Kos municipality, the information about current conditions of ground stability plays an important role in safety surveillance of the residential area. The monitoring authority (Hornonitrianske bane (HB) Prievidza Mining Company) actively surveys impacted part of the Kos village via monthly leveling measurements (Figure 15), where subsidence of up to –3 cm per year has already been confirmed by remotIO’s products (Figure 13). The inhabited zones close to rapidly subsiding belt are of highest importance for operational monitoring. Since those are commonly less coherent areas, our data-mining approach could retrieve valuable information for some of the critical zones (Figure 12).
Lack of coherent points in the central part of the former Kos village is caused by significant geomorphological changes at the scale of several meters over past years which led to formation of sinkholes and wetlands and consequent demolition of buildings. Since results from the ascending sensing geometry (Figure 12a) exhibit total loss of a coherence over the affected area, retrieval of information from ascending track over critical zone is not possible. However, southeastern and northwestern parts of the village are still inhabited and are in focus of monitoring authority. ’Low-coherent Alerts’ and ’Displacement Alarms’ detected in the monitored area from descending track (Figure 13) increased the overall densities of observed points and pin-pointed areas with potentially dangerous progression of displacement time series in current monitoring periods.
For example, low-coherent inlier (0.44) was retrieved inside area above mining corridor cut (Figure 14), exhibiting accelerating displacement behavior due to ongoing mining operations.
Monthly leveling measurements are realized under HBP authority over dedicated monitoring network in the precinct of Koš village since April 2016, which was determined by the new mining corridors in a close vicinity of inhabited parts of the village.
Ground-truth validation of remotIO Level 2 products is performed automatically via time series comparison at double-differenced level. For each leveling benchmark, corresponding nearest coherent PS point is identified and its LOS displacement time series are approximately projected into vertical using acquisition’s local incidence angle for particular PS. Both leveling and projected PS displacement time series are transformed with respect to a common reference epoch (zero-epoch of leveling campaigns) and common reference point (reference leveling benchmark) to obtain displacement double-differences. An example of displacement time series comparison (Figure 15) with simple linear regression shows significant correlation at three-sigma level. In addition, two-sample Kolmogorovov–Smirnovov test was used to confirm whether unequally sampled time-series follow same probability distribution.
The high temporal redundancy and dense spatial coverage of PS points is superior to leveling and hence valuable for monitoring authority.

5.3. Dams (Gabcikovo Waterworks)

The monitoring tasks over the first level of Gabcikovo waterworks—the Cunovo dam—focus on the main parts of the waterworks: power plant, chambers, levees and weir on both stages. These are monitored by semi-annual precise leveling measurements. Another task focuses on the problematic part of the dam, which corresponds to the original riverbed of the Danube River. It is under investigation due to persistent seasonal movements (e.g., thermal expansion due to temperature changes and dam oscillations related to the water level change) that are difficult to observe using standard geodetic methods or employing standard assumptions on linear movement trend and correspondent coherence loss. Those seasonal signals are examined by remotIO products. From both ascending and descending sensing geometries of Sentinel-1 over Cunovo dam (Figure S3), good spatial coverage is attained for all structural parts of the waterworks body.
Such coverage is especially valuable in the areas lacking leveling ground control points, providing added-value for monitoring authority in critical parts of waterworks structure where realization of terrestrial measurements would not be possible. This is the case of retrieved low-coherent points (Figure 16) with series of alerts and alarms (Table 6) triggered for the part of the dam over-passing former river bed with strong seasonal effects recorded in displacement time series, as shown in the example (Figure 17). Although those movements are expected for such type of construction and the monitoring authority is well aware of them, even slight changes in its amplitude might be an indicator of unexpected activity.
The temporal sampling of six days is far superior to semi-annual leveling field campaigns. The higher temporal sampling is mostly appreciated by monitoring authority representatives. It is clear from the results in Figure 18, showing leveling and InSAR equivalent double-differences (projected to vertical) comparison, that even Sentinel-1 C-band data can map fine seasonal displacement signals over dams body.
The major parts of second waterworks level—Gabcikovo dam—which are under vital monitoring efforts correspond to the main body, hydropower plant and two lock chambers for ships passage. The MT-InSAR results as provided by remotIO have spotted displacement over specific parts of the Gabcikovo dam, which is visualized for both Sentinel-1’s sensing geometries (ascending/descending) in Figure S4.
Beside the subsidence tendencies over the central part of the Gabcikovo dam corresponding to the area between locks and hydro power plant (Figure S4), several more points over the dam locks have been preserved in final results utilizing data mining procedure. For the ’Displacement alarms’ triggered over this part of the dam, the abnormal progression of movement with a total displacement of 7.3 mm (significantly smaller than 28 mm phase ambiguity) in January 2019 has been recorded in time series, as shown in Figure 19. Such points of interest identified by data mining analytics are further evaluated under cooperation with monitoring authority. This is also an example how the use of remotIO’s added value information might help to focus the attention of experts for upcoming acquisitions and set the priority areas for deeper investigation.
The total number of points and additional issued warnings (alerts and alarms) preserved by data mining procedure in comparison to simple thresholding procedure (temporal coherence >0.7) is summarized in Table 6.

6. Discussion

remotIO concept represents a first stage of a complete MT-InSAR processing framework intended for monitoring of man-made objects and infrastructure mostly over urban areas. remotIO components have been developed to target zones with the highest displacement rates or displacement rate changes (e.g., landslides or undermining subsidence as presented in this manuscript) and to support structural health monitoring tasks (e.g., monitoring of buildings, bridges, dams or cities’ districts). The system was scaled to provide analysis over small-to-medium sized regions (5 km × 5 km up to 80 km × 80 km) and support the full life cycle of providing MT-InSAR monitoring products: from initial processing of full available archives of Sentinel-1 over monitoring sites, through continuous automatic updates, post-processing methodology for filtering resultant deformation maps and generation of added value products, until the delivery of results via web-based platform where all outputs are accessible to end-users.
The core focus of the manuscript is in post-processing methodology for designing a set of higher-order products that can be utilized by both expert and non-expert users. The information stored over problematic points should be perceived as indicative, since retrieval of reliable deformation estimates is not possible without appropriate re-assessment of the processing methodology and internal cross-validation. To partially address this issue, a new parallel processing is started immediately for problematic zones with images acquired in a span of more than 20 days (to acquire precise orbits) and with selected monthly, quarterly or semi-annual updates to avoid possible false alarms. Since the alpha version of the remotIO system (TRL 4) has been introduced to users over pilot monitoring sites (Section 5) only recently (end of April 2020), the false alarm rate is subject to further research and validation with ground truth observations.
The proposed filtering approach was tested on standard MT-InSAR processing employing linear displacement model. As the current application use cases are focused on monitoring man-made structures for the continuous periods, distributed scatterers are not incorporated into remotIO framework, although they can be included if proven necessary by insufficient spatial coverage.
It is important to note that, without proper refinement of MT-InSAR processing strategy and mitigation of systematic errors, inconsistencies to final results might be added. Pin-pointed problematic zones, especially over low-coherent areas, shall be further analyzed in detail, for example by applying different mathematical models for deformation estimates [25,68,69] or individual scatterer models for extracted low-coherent points [18,70,71], by exploiting partially coherent targets [72,73,74] or utilization of high-resolution X-band data (TerraSAR-X, Cosmo-SkyMed) might be required for more detailed structural analysis and precise engineering tasks. The system is scalable and fully open for integration of other satellite SAR data and new study areas. Additional work shall be focused on effective dissemination of actual alerts and false positives caused by processing model inconsistencies (i.e., unwrapping errors). Based on triggered alerts and alarms, expert InSAR users can advise or alone modify processing methodology before providing final statements and conclusions. This is also an example of how both expert and non-expert conceptualizations of operational InSAR service could be met in a single monitoring system. Similar studies addressing operational exploitation of Sentinel-1 measurements can be found in [27,28,29,30,31,32,33,34]. These studies are additionally oriented on nationwide monitoring schemes, where we foresee the possibility of joint exploitation of targeted analysis over small-to-medium sized regions (remotIO) with state-wide monitoring initiatives in Slovakia [75] and Europe [76].

7. Conclusions

In this work, an alpha version of an infrastructure monitoring and decision-support framework remotIO is presented. It provides regularly and automatically updated MT-InSAR analysis in three product tiers (Table 2). The third-level added-value product comprises post-processing procedure based on MCD outlier detection, space-partitioning and multivariate analysis, which allows the use of a full range of temporal coherence to filter the resultant datasets of outliers hence avoiding simple thresholding.
The use of data mining analytics on the basis of standard MT-InSAR products helps non-experts users: (a) to ease the interpretation of results; (b) to set the priority areas for deeper investigation in terms of systematic errors mitigation and correction of the processing procedures; and (c) to activate prevention measures or suitable risk mitigation activities when real motions are confirmed.
remotIO’s platform and analytical tools are integrated into the web-app graphical user interface, made accessible from [77].
The preliminary results over three pilot monitoring scenarios ((1) Landslides; (2) Mining subsidence; and (3) Dams) demonstrate the ability of a prototype to filter final deformation maps and improve point densities over zones with the highest displacement rates and low-coherent areas. By triggering a series of alerts and alarms over monitored sites, the system provides continuous information over areas where deformation processes are progressing also in recent monitoring periods. These areas are further investigated under cooperation with end-users that are involved in remotIO’s pilot monitoring scenarios. The initial end-users feedback on platform’s practical exploitation is positive.
Finally, existing ground truth data from conventional terrestrial geodetic (leveling and GNSS) and geotechnical (inclinometry) techniques carried out under authority of end-users of particular pilot monitoring scenarios shall be further utilized for validation of data-mining procedure outputs, especially over low-coherent zones.

Supplementary Materials

The following are available online at https://0-www-mdpi-com.brum.beds.ac.uk/2072-4292/12/11/1892/s1, Figure S1: Landslides in Prievidza city districts (Hradec, Velka and Mala Lehotka) as observed in remotIOLevel 1 product: mean line-of-sight (LOS) deformation velocity map from: (a) ascending Track No. 175; and (b) descending Track No. 51 shown in remotIO web interface, Figure S2: The remotIO Level 0 product: Decomposition of InSAR LOS velocities for landslides in Prievidza city districts (Hradec, Velka and Mala Lehotka) into: (a) vertical component; and (b) horizontal component, Figure S3: Cunovo dam as observed by remotIO: mean line-of-sight (LOS) displacement velocity map from: (a) ascending Track No. 73; and (b) descending Track No. 124, Figure S4: Gabcikovo dam as observed by remotIO. Mean line-of-sight (LOS) displacement velocity map from: (a) ascending Track No. 73; and (b) descending Track No. 124.

Author Contributions

M.B. performed the processing, scripted the data processing chain and designed the data mining algorithm. R.C. and J.P. analyzed the results. J.B. scripted the data mining algorithm. M.R. and P.A. assisted with the interpretation of results. D.P. provided consultations to data processing. M.B. drafted the article. R.C. revised the article. All authors contributed to the finalization of this paper. All authors have read and agreed to the published version of the manuscript.

Funding

The work described in this document was done under ESA PECS Contract. Responsibility for the contents resides in the author or organization that prepared it. The project is funded by the Government of Slovakia through an ESA Contract No. 4000123625/18/NL/SC under the PECS (Plan for European Cooperating States). The view expressed herein can in no way be taken to reflect the official opinion of the European Space Agency.

Acknowledgments

Sentinel-1 data were provided by ESA under free, full, and open data policy adopted for the Copernicus program. Data were processed by SARPROZ using Matlab and Google Maps. The authors would like to thank State Geological Institute of Dionyz Stur and Hornonitrianske bane Prievidza, a.s. and Vodohodpodarska vystavba, s.p. (section TBD) for providing ground truth data, discussion and collaboration. This work was supported by the VEGA grant agency under project 2/0100/20.

Conflicts of Interest

The authors declare no conflict of interest.

Abbreviations

The following abbreviations are used in this manuscript:
APSAtmospheric Phase Screen
CSVComma-Separated Value file
GUIGraphical User Interface
InSARInterferometric Synthetic Aperture Radar
LOSLine-of-Sight of the Satellite
MT-InSARMulti Temporal InSAR
MCDMinimum Covariance Determinant
PSPersistent Scatterer
ptspoints
SARSynthetic Aperture Radar
SLCSingle-Look Complex
TRLTechnology Readiness Level

References

  1. Ferretti, A.; Prati, C.; Rocca, F. Nonlinear subsidence rate estimation using permanent scatterers in differential SAR interferometry. IEEE Trans. Geosci. Remote. Sens. 2000, 38, 2202–2212. [Google Scholar] [CrossRef] [Green Version]
  2. Ferretti, A.; Prati, C.; Rocca, F. Permanent Scatterers in SAR Interferometry. IEEE Trans. Geosci. Remote. Sens. 2001, 39, 8–20. [Google Scholar] [CrossRef]
  3. Crosetto, M.; Monserrat, O.; Cuevas-González, M.; Devanthéry, N.; Crippa, B. Persistent Scatterer Interferometry: A review. ISPRS J. Photogramm. Remote. Sens. 2016, 115, 78–89. [Google Scholar] [CrossRef] [Green Version]
  4. Berardino, P.; Fornaro, G.; Lanari, R.; Sansosti, E. A new algorithm for surface deformation monitoring based on small baseline differential SAR interferograms. IEEE Trans. Geosci. Remote. Sens. 2002, 40, 2375–2383. [Google Scholar] [CrossRef] [Green Version]
  5. Werner, C.; Wegmuller, U.; Strozzi, T.; Wiesmann, A. Interferometric point target analysis for deformation mapping. In Proceedings of the 2003 IEEE International Geoscience and Remote Sensing Symposium, Toulouse, France, 21–25 July 2003; IEEE: Piscataway, NJ, USA, 2003; Volume 7, pp. 4362–4364. [Google Scholar] [CrossRef]
  6. Strozzi, T.; Wegmuller, U.; Keusen, H.; Graf, K.; Wiesmann, A. Analysis of the terrain displacement along a funicular by SAR interferometry. IEEE Trans. Geosci. Remote. Sens. 2006, 3, 15–18. [Google Scholar] [CrossRef]
  7. Mora, O.; Mallorquí, J.; Broquetas, A. Linear and nonlinear terrain deformation maps from a reduced set of interferometric SAR images. IEEE Trans. Geosci. Remote. Sens. 2003, 41, 2243–2253. [Google Scholar] [CrossRef]
  8. Lanari, R.; Mora, O.; Manunta, M.; Mallorqui, J.; Berardino, P.; Sansosti, E. Small-baseline approach for investigating deformations on full-resolution differential SAR interferograms. IEEE Trans. Geosci. Remote. Sens. 2004, 42, 1377–1386. [Google Scholar] [CrossRef]
  9. Hooper, A.; Zebker, H.; Segall, P.; Kampes, B. A new method for measuring deformation on volcanoes and other natural terrains using InSAR persistent scatterers. Geophys. Res. Lett 2004, 31, 1–5. [Google Scholar] [CrossRef]
  10. Hooper, A.; Segall, P.; Zebker, H. Persistent scatterer interferometric synthetic aperture radar for crustal deformation analysis, with application to Volcán Alcedo, Galápagos. J. Geophys. Res. Solid Earth 2007, 112, 1978–2012. [Google Scholar] [CrossRef] [Green Version]
  11. Hooper, A. Persistent Scatterer Radar Interferometry for Crustal Deformation Studies and Modeling of Volcanic Deformation. PhD Thesis, The Department of Geophysics, Stanford University, Stanford, CA, USA, 2006. [Google Scholar]
  12. Hooper, A. A multi-temporal InSAR method incorporating both persistent scatterer and small baseline approaches. Geophys. Res. Lett. 2008, 35, 1–5. [Google Scholar] [CrossRef] [Green Version]
  13. Casu, F.; Manzo, M.; Lanari, R. A quantitative assessment of the SBAS algorithm performance for surface deformation retrieval. Remote. Sens. Environ. 2006, 102, 195–210. [Google Scholar] [CrossRef]
  14. Crosetto, M.; Biescas, E.; Duro, J.; Closa, J.; Arnaud, A. Generation of advanced ERS and Envisat interferometric SAR products using the Stable Point Network technique. Photogramm. Eng. Remote. Sens. 2008, 74, 443–451. [Google Scholar] [CrossRef]
  15. Costantini, M.; Minati, F.; Falco, S.; Malvarosa, F.; Trillo, F. Method of persistent scatterer pairs (PSP) and high resolution SAR interferometry. In Proceedings of the 2009 IEEE International Geoscience and Remote Sensing Symposium, Cape Town, South Africa, 12–17 July 2009; Volume 3, pp. 904–907. [Google Scholar]
  16. Zhang, L.; Ding, X.; Lu, Z. Ground settlement monitoring based on temporarily coherent points between two SAR acquisitions. ISPRS J. Photogramm. Remote. Sens. 2011, 66, 146–152. [Google Scholar] [CrossRef]
  17. Ansari, H.; De Zan, F.; Bamler, R. Sequential Estimator: Toward Efficient InSAR Time Series Analysis. IEEE Trans. Geosci. Remote. Sens. 2017, 55, 5637–5652. [Google Scholar] [CrossRef] [Green Version]
  18. Ansari, H.; De Zan, F.; Bamler, R. Efficient Phase Estimation for Interferogram Stacks. IEEE Trans. Geosci. Remote. Sens. 2018, 56, 4109–4125. [Google Scholar] [CrossRef]
  19. Cigna, F. Observing Geohazards from Space. Geosciences 2018, 8, 59. [Google Scholar] [CrossRef] [Green Version]
  20. Kampes, B.M. Radar Interferometry: Persistent Scatterer Technique; Springer: Dordrecht, The Netherlands, 2006. [Google Scholar]
  21. Ketelaar, V.B.H. Satellite Radar Interferometry Subsidence Monitoring Techniques; Springer: Dordrecht, The Netherlands, 2009. [Google Scholar]
  22. Soergel, U. Radar Remote Sensing of Urban Areas; Springer Science+Bussines Media B.V.: Berlin, Germany, 2010. [Google Scholar]
  23. Lazecky, M.; Hlavacova, I.; Bakon, M.; Sousa, J.J.; Perissin, D.; Patricio, G. Bridge Displacements Monitoring Using Space-Borne X-Band SAR Interferometry. IEEE J. Sel. Top. Appl. Earth Obs. Remote. Sens. 2017, 10, 205–210. [Google Scholar] [CrossRef] [Green Version]
  24. Sousa, J.J.; Hlaváčová, I.; Bakoň, M.; Lazecký, M.; Patrício, G.; Guimarães, P.; Ruiz, A.M.; Bastos, L.; Sousa, A.; Bento, R. Potential of Multi-temporal InSAR Techniques for Bridges and Dams Monitoring. Procedia Technol. 2014, 16, 834–841. [Google Scholar] [CrossRef] [Green Version]
  25. Bakon, M.; Perissin, D.; Lazecky, M.; Papco, J. Infrastructure Non-linear Deformation Monitoring Via Satellite Radar Interferometry. Procedia Technol. 2014, 16, 294–300. [Google Scholar] [CrossRef] [Green Version]
  26. Frigerio, S.; Schenato, L.; Bossi, G.; Cavalli, M.; Mantovani, M.; Marcato, G.; Pasuto, A. A web-based platform for automatic and continuous landslide monitoring: The Rotolon (Eastern Italian Alps) case study. Comput. Geosci. 2014, 63, 96–105. [Google Scholar] [CrossRef]
  27. Raspini, F.; Bianchini, S.; Ciampalini, A.; Soldato, M.D.; Solari, L.; Novali, F.; Conte, S.D.; Rucci, A.; Ferretti, A.; Casagli, N. Continuous, semi-automatic monitoring of ground deformation using Sentinel-1 satellites. Sci. Rep. 2018, 8, 7253. [Google Scholar] [CrossRef] [PubMed] [Green Version]
  28. Raspini, F.; Bianchini, S.; Ciampalini, A.; Soldato, M.D.; Montalti, R.; Solari, L.; Tofani, V.; Casagli, N. Persistent Scatterers continuous streaming for landslide monitoring and mapping: The case of the Tuscany region (Italy). Landslides 2019, 16, 2033–2044. [Google Scholar] [CrossRef] [Green Version]
  29. Soldato, M.D.; Solari, L.; Raspini, F.; Bianchini, S.; Ciampalini, A.; Montalti, R.; Ferretti, A.; Pellegrineschi, V.; Casagli, N. Monitoring Ground Instabilities Using SAR Satellite Data: A Practical Approach. ISPRS Int. J. Geo-Inf. 2019, 8, 307. [Google Scholar] [CrossRef] [Green Version]
  30. Kalia, A.; Frei, M.; Lege, T. A Copernicus downstream-service for the nationwide monitoring of surface displacements in Germany. Remote. Sens. Environ. 2017, 202, 234–249. [Google Scholar] [CrossRef]
  31. Dehls, J.F.; Larsen, Y.; Marinkovic, P.; Lauknes, T.R.; Stødle, D.; Moldestad, D.A. INSAR.No: A National Insar Deformation Mapping/Monitoring Service In Norway—From Concept To Operations. In Proceedings of the IGARSS 2019—2019 IEEE International Geoscience and Remote Sensing Symposium, Yokohama, Japan, 28 July–2 August 2019; pp. 5461–5464. [Google Scholar]
  32. Bischoff, C.A.; Ferretti, A.; Novali, F.; Uttini, A.; Giannico, C.; Meloni, F. Nationwide deformation monitoring with SqueeSAR® using Sentinel-1 data. Proc. Int. Assoc. Hydrol. Sci. 2020, 382, 31–37. [Google Scholar] [CrossRef] [Green Version]
  33. Morishita, Y.; Lazecky, M.; Wright, T.J.; Weiss, J.R.; Elliott, J.R.; Hooper, A. LiCSBAS: An Open-Source InSAR Time Series Analysis Package Integrated with the LiCSAR Automated Sentinel-1 InSAR Processor. Remote. Sens. 2020, 12, 424. [Google Scholar] [CrossRef] [Green Version]
  34. Confuorto, P.; Bianchini, S.; Festa, D.; Raspini, F.; Casagli, N. Continuous Monitoring of Ground Deformational Scenario of Veneto Region (Italy) through Sentinel-1 Data. 2020. Available online: https://presentations.copernicus.org/EGU2020/EGU2020-3648_presentation.pdf (accessed on 27 May 2020). [CrossRef]
  35. Milan, L. An Automatic InSAR Tool for Measuring and Monitoring Tectonic and Volcanic Activity. 2020. [Google Scholar] [CrossRef]
  36. Bakon, M.; Oliveira, I.; Perissin, D.; Sousa, J.J.; Papco, J. A Data Mining Approach for Multivariate Outlier Detection in Postprocessing of Multitemporal InSAR Results. IEEE J. Sel. Top. Appl. Earth Obs. Remote. Sens. 2017, 10, 2791–2798. [Google Scholar] [CrossRef]
  37. Meisina, C.; Zucca, F.; Notti, D.; Colombo, A.; Cucchi, A.; Savio, G.; Giannico, C.; Bianchi, M. Geological interpretation of PSInSAR data at regional scale. Sensors 2008, 8, 7469–7492. [Google Scholar] [CrossRef] [Green Version]
  38. Spata, A.; Nunnari, G.; Puglisi, G.; Guglielmino, F.; Bonforte, A.; Montalto, P. A clustering analysis of three dimensional ground deformation map estimated by integrating DInSAR and GPS dataset. In Proceedings of the 4th International Conference on Physics and Control (PhysCon 2009), Catania, Italy, 1–4 September 2009. [Google Scholar]
  39. Milone, G.; Scepi, G. A clustering approach for studying ground deformation trends in Campania region through PS-InSAR TM time series analysis. J. Appl. Sci. 2011, 11, 610–620. [Google Scholar]
  40. Lu, P.; Casagli, N.; Catani, F.; Tofani, V. Persistent Scatterers Interferometry Hotspot and Cluster Analysis (PSI-HCA) for detection of extremely slow-moving landslides. Int. J. Remote. Sens. 2012, 33, 466–489. [Google Scholar] [CrossRef]
  41. Berti, M.; Corsini, A.; Franceschini, S.; Iannacone, J. Automated classification of Persistent Scatterers Interferometry time series. Nat. Hazards Earth Syst. Sci. 2013, 13, 1945–1958. [Google Scholar] [CrossRef] [Green Version]
  42. Lu, P.; Bai, S.; Casagli, N. Investigating Spatial Patterns of Persistent Scatterer Interferometry Point Targets and Landslide Occurrences in the Arno River Basin. Remote. Sens. 2014, 6, 6817–6843. [Google Scholar] [CrossRef] [Green Version]
  43. Peduto, D.; Cascini, L.; Arena, L.; Ferlisi, S.; Fornaro, G.; Reale, D. A general framework and related procedures for multiscale analyses of DInSAR data in subsiding urban areas. ISPRS J. Photogramm. Remote. Sens. 2015, 105, 186–210. [Google Scholar] [CrossRef]
  44. Notti, D.; Calò, F.; Cigna, F.; Manunta, M.; Herrera, G.; Berti, M.; Meisina, C.; Tapete, D.; Zucca, F. A user-oriented methodology for DInSAR time series analysis and interpretation: Landslides and subsidence case studies. Pure Appl. Geophys. 2015, 172, 3081–3105. [Google Scholar] [CrossRef] [Green Version]
  45. In Proceedings of the Scientific & Technical Memorandum of the International Forum on Satellite EO and Geohazards, Santorini, Greece, 21–23 May 2012; Available online: http://geomorphology.irpi.cnr.it/publications/repository/public/edited-books/santorini-2012/view (accessed on 27 May 2020). [CrossRef]
  46. Monserrat, O.; Barra, A.; Tomás, R.; Navarro, J.; Solari, L.; Herrera, G.; Crosetto, M. Tools for Fast Analysis of InSAR Based Displacement Maps. 2020. Available online: https://0-doi-org.brum.beds.ac.uk/10.5194/egusphere-egu2020-18944 (accessed on 27 May 2020). [CrossRef]
  47. Yague-Martinez, N.; De Zan, F.; Prats-Iraola, P. Coregistration of Interferometric Stacks of Sentinel-1 TOPS Data. IEEE Geosci. Remote. Sens. Lett. 2017, 14, 1002–1006. [Google Scholar] [CrossRef] [Green Version]
  48. Perissin, D.; Rocca, F. High-Accuracy Urban DEM Using Permanent Scatterers. IEEE Trans. Geosci. Remote. Sens. 2006, 44, 3338–3347. [Google Scholar] [CrossRef]
  49. Perissin, D. SAR Super-Resolution and Characterization of Urban Targets; Dipartimento di Elettronica e Informazione: Via Giuseppe Ponzio, Milano, Italy, 2006. [Google Scholar]
  50. Perissin, D.; Prati, C.; Rocca, F. ASAR parallel-track PS analysis in urban sites. In Proceedings of the 2007 IEEE International Geoscience and Remote Sensing Symposium, Barcelona, Spain, 23–28 July 2007; IEEE: Piscataway, NJ, USA, 2007. [Google Scholar]
  51. Lei, L.; Perissin, D.; Qin, Y. Change detection with spaceborne InSAR technique in Hong Kong. In Proceedings of the 2013 IEEE International Geoscience and Remote Sensing Symposium—IGARSS, Melbourne, VIC, Australia, 21–26 July 2013; pp. 338–341. [Google Scholar] [CrossRef]
  52. Samieie-Esfahany, S.; Hanssen, R.; van Thienen-Visser, K.; Muntendam-Bos, A. On the effect of horizontal deformation on InSAR subsidence estimates. In Proceedings of the Fringe 2009 Workshop, Frascati, Italy, 30 November–4 December 2009; Volume 30. [Google Scholar]
  53. Perissin, D. SARproZ Software. Official Product Web Page. Available online: http://www.sarproz.com/ (accessed on 27 May 2020).
  54. Li, Z.; Wright, T.; Hooper, A.; Crippa, P.; Gonzalez, P.; Walters, R.; Elliott, J.; Ebmeier, S.; Hatton, E.; Parsons, B. TOWARDS INSAR EVERYWHERE, ALL THE TIME, WITH SENTINEL-1. ISPRS Int. Arch. Photogramm. Remote. Sens. Spat. Inf. Sci. 2016, XLI-B4, 763–766. [Google Scholar] [CrossRef] [Green Version]
  55. Czikhardt, R.; Papco, J.; Bakon, M.; Liscak, P.; Ondrejka, P.; Zlocha, M. Ground Stability Monitoring of Undermined and Landslide Prone Areas by Means of Sentinel-1 Multi-Temporal InSAR, Case Study from Slovakia. Geosciences 2017, 7, 87. [Google Scholar] [CrossRef] [Green Version]
  56. Rousseeuw, P.J. Least Median of Squares Regression. J. Am. Stat. Assoc. 1984, 79, 871–880. [Google Scholar] [CrossRef]
  57. Rousseeuw, P.J. Multivariate estimation with high breakdown point. Mathematical statistics and applications. J. Am. Stat. Assoc. 1985, 8, 283–297. [Google Scholar]
  58. Rousseeuw, P.J.; Driessen, K.V. A Fast Algorithm for the Minimum Covariance Determinant Estimator. Technometrics 1999, 41, 212–223. [Google Scholar] [CrossRef]
  59. Pedregosa, F.; Varoquaux, G.; Gramfort, A.; Michel, V.; Thirion, B.; Grisel, O.; Blondel, M.; Prettenhofer, P.; Weiss, R.; Dubourg, V.; et al. Scikit-learn: Machine Learning in Python. J. Mach. Learn. Res. 2011, 12, 2825–2830. [Google Scholar]
  60. Bentley, J.L. Multidimensional binary search trees used for associative searching. Commun. ACM 1975, 18, 509–517. [Google Scholar] [CrossRef]
  61. Virtanen, P.; Gommers, R.; Oliphant, T.E.; Haberland, M.; Reddy, T.; Cournapeau, D.; Burovski, E.; Peterson, P.; Weckesser, W.; Bright, J.; et al. SciPy 1.0: Fundamental Algorithms for Scientific Computing in Python. Nat. Methods 2020. [Google Scholar] [CrossRef] [Green Version]
  62. Tarjan, R. Depth-First Search and Linear Graph Algorithms. SIAM J. Comput. 1972, 1, 146–160. [Google Scholar] [CrossRef]
  63. Hanssen, R.F. Radar Interferometry: Data Interpretation and Error Analysis; Kluwer Academic: Dordrecht, The Netherlands, 2001. [Google Scholar]
  64. Zhang, R.; Liu, G.; Li, Z.; Zhang, G.; Lin, H.; Yu, B.; Wang, X. A Hierarchical Approach to Persistent Scatterer Network Construction and Deformation Time Series Estimation. Remote. Sens. 2014, 7, 211. [Google Scholar] [CrossRef]
  65. Miller, J. Short Report: Reaction Time Analysis with Outlier Exclusion: Bias Varies with Sample Size. Q. J. Exp. Psychol. Sect. 1991, 43, 907–912. [Google Scholar] [CrossRef] [PubMed]
  66. Leys, C.; Ley, C.; Klein, O.; Bernard, P.; Licata, L. Detecting outliers: Do not use standard deviation around the mean, use absolute deviation around the median. J. Exp. Soc. Psychol. 2013, 49, 764–766. [Google Scholar] [CrossRef] [Green Version]
  67. Hubert, M.; Verboven, S. A robust PCR method for high-dimensional regressors. J. Chemom. 2003, 17, 438–452. [Google Scholar] [CrossRef] [Green Version]
  68. Wegmüller, U.; Werner, C.; Strozzi, T.; Wiesmann, A.; Spreckels, V.; Benecke, N.; Walter, D. Monitoring of mining induced surface deformation. In Proceedings of the IGARSS 2004. 2004 IEEE International Geoscience and Remote Sensing Symposium, Anchorage, AK, USA, 20–24 September 2004. [Google Scholar]
  69. Wegmüller, U.; Walter, D.; Spreckels, V.; Werner, C. Nonuniform Ground Motion Monitoring With TerraSAR-X Persistent Scatterer Interferometry. IEEE Trans. Geosci. Remote. Sens. 2010, 48, 895–904. [Google Scholar] [CrossRef]
  70. Chang, L.; Hanssen, R. A Probabilistic Approach for InSAR Time-series Postprocessing. IEEE Trans. Geosci. Remote. Sens. 2016, 54, 421–430. [Google Scholar] [CrossRef] [Green Version]
  71. Van de Kerkhof, B.; Pankratius, V.; Chang, L.; van Swol, R.; Hanssen, R.F. Individual Scatterer Model Learning for Satellite Interferometry. IEEE Trans. Geosci. Remote. Sens. 2020, 58, 1273–1280. [Google Scholar] [CrossRef]
  72. Ferretti, A.; Fumagalli, A.; Novali, F.; Prati, C.; Rocca, F.; Rucci, A. A New Algorithm for Processing Interferometric Data-Stacks: SqueeSAR. IEEE Trans. Geosci. Remote. Sens. 2011, 49, 3460–3470. [Google Scholar] [CrossRef]
  73. Perissin, D.; Wang, T. Repeat-Pass SAR Interferometry with Partially Coherent Targets. IEEE Trans. Geosci. Remote. Sens. 2012, 50, 271–280. [Google Scholar] [CrossRef]
  74. Hu, F.; Wu, J.; Chang, L.; Hanssen, R.F. Incorporating Temporary Coherent Scatterers in Multi-Temporal InSAR Using Adaptive Temporal Subsets. IEEE Trans. Geosci. Remote. Sens. 2019, 57, 7658–7670. [Google Scholar] [CrossRef] [Green Version]
  75. Czikhardt, R.; Papco, J.; Bakon, M. Sentinel-1 state-wide multi-temporal InSAR processing for recognition of active natural hazards in Slovakia. In Proceedings of the European Space Agency (ESA) Living Planet Symposium 2019, MiCo-Milano Congressi, Milan, Italy, 13–17 May 2019. [Google Scholar]
  76. Larsen, Y.; Marinkovic, P.; Dehls, J.F.; Bredal, M.; Bishop, C.; Jøkulsson, G.; Gjøvik, L.P.; Frauenfelder, R.; Salazar, S.E.; Vöge, M.; et al. European Ground Motion Service: Service Implementation Plan and Product Specification Document. Available online: https://land.copernicus.eu/user-corner/technical-library/egms-specification-and-implementation-plan (accessed on 27 May 2020).
  77. Insar.sk Ltd. remotIO Web-based Application. Official Product Web Page. Available online: https://remotio.space (accessed on 27 May 2020).
Figure 1. Schematic illustration of remotIO system corresponding to IT architecture.
Remotesensing 12 01892 g001
Figure 2. remotIO: auto-processing concept and flowchart [54].
Remotesensing 12 01892 g002
Figure 3. Landslides in Prievidza city district Hradec: Analytical Tools output superimposed on mean line-of-sight (LOS) deformation velocity map from Descending Track No. 51 shown in remotIO’s web interface.
Remotesensing 12 01892 g003
Figure 4. Flowchart of the post-processing methodology. Interested readers could refer to [36] for the comparison with previous version.
Remotesensing 12 01892 g004
Figure 5. Classical and robust confidence ellipse [67].
Remotesensing 12 01892 g005
Figure 6. Schematic of identified outlier candidates, all nearest neighbors search, formation of Outlier Candidate (OC) groups and multivariate analysis in local neighborhood.
Remotesensing 12 01892 g006
Figure 7. Schematic illustration of time series warning. A similar approach can be found in [27,28].
Remotesensing 12 01892 g007
Figure 8. Higher-order products for final MT-InSAR analysis provided by remotIO’s decision-support framework.
Remotesensing 12 01892 g008
Figure 9. Filtering capabilities of post-processing methodology over area of active landslides in Prievidza disctricts (Hradec, Velka Lehotka): Mean line-of-sight (LOS) velocities from: (a) ascending Track No. 175; and (b) descending Track No. 51.
Remotesensing 12 01892 g009
Figure 10. Example of remotIO PS point at Velka Lehotka village exhibiting deceleration of movement activity over past years.
Remotesensing 12 01892 g010
Figure 11. Example of remotIO PS point with triggered ’Displacement Alarm’.
Remotesensing 12 01892 g011
Figure 12. Filtering capabilities of post-processing methodology in monitoring mining subsidence over Kos municipality: Mean line-of-sight (LOS) velocities from: (a) ascending Track No. 175; and (b) descending Track No. 51.
Remotesensing 12 01892 g012
Figure 13. Mining subsidence in Kos: Analytical Tools and mean line-of-sight (LOS) velocities from Descending Track No. 51 shown in remotIO’s web interface.
Remotesensing 12 01892 g013
Figure 14. Displacement time series over retained low-coherence point inside active mining area of Kos municipality.
Remotesensing 12 01892 g014
Figure 15. Example of remotIO InSAR vs. leveling double-differenced displacement time series projected to vertical at selected leveling benchmarks.
Remotesensing 12 01892 g015
Figure 16. Filtering capabilities of post-processing methodology in monitoring Cunovo dam: Mean line-of-sight (LOS) velocities from: (a) ascending Track No. 73; and (b) descending Track No. 124.
Remotesensing 12 01892 g016
Figure 17. Time-series shown for low-coherent point (0.68) preserved in final results over Cunovo dam with seasonal effect recorded for the problematic part of the dam.
Remotesensing 12 01892 g017
Figure 18. Comparison of InSAR and leveling double-differenced displacement time series projected to vertical over dam’s inundation weir.
Remotesensing 12 01892 g018
Figure 19. Displacement time-series shown for point over Gabcikovo dam.
Remotesensing 12 01892 g019
Table 1. Sentinel-1A/B datasets used.
Pilot ScenarioTrackOrbit PathImagesTime Period
(1) Landslides and (2) Mining subsidence175Ascending26117 October 2014–13 March 2020
51Descending24521 October 2014–11 March 2020
(3) Dams (Gabcikovo Waterworks)73Ascending25110 October 2014–12 March 2020
124Descending25514 October 2014–04 March 2020
Table 2. Different tiers of product levels as accessible from remotIO’s web-app.
Level No.DescriptionResolution
Level 0Line-of-sight (LOS) velocities [mm/year]
decomposed into vertical and horizontal vectors
coarse (50–100 m grid)
Level 1Line-of-sight (LOS) velocities [mm/year]fine (full-resolution of SLC product)
Level 2Line-of-sight (LOS) velocities [mm/year]
+ displacement time series [mm/per acquisition]
fine (full-resolution of SLC product)
Level 3Level 2 + additional decision-support information
(e.g., Low-coherent alerts, Displacement alarms)
fine (full-resolution of SLC product)
Table 3. Rejection table: Variables and classes produced for Level 3 product tier.
ClassEvaluationVelocityHeightMost Common
Behavior
DecisionDecision
Label
Outliers final0 0Outlier
Inliers final1 1Inlier
1 N/AN/A 1 Isolated problem
1 00 1 Unknown problem
1 01 2 Height problem
1 10 2 Velocity problem
1 11 2 Velocity + Height
Problem
Low-Coherent
Alerts
1 1010, 11,
1011, 1110
3 Velocity Alert
1 1110, 11,
1011, 1110
4 Velocity + Height
Alert
Displacement
Alarms
Step 5: Time Series Warning
Table 4. Structure and characteristics of risk ratings and current condition parameters.
ParameterDeltaRisk RatingCurrent Condition
Displacement Alarm<2 mm0—Normal
2–5 mm1—Minor
5–10 mm2—Moderate
10–15 mm3—Significant
>15 mm4—Major *
N/A5—Out of Service
Current Condition+ (positive) ▲ Rising
− (negative) ▼ Falling
* Possible phase unwrapping error, issue further referenced in a text.
Table 5. Properties and processing time comparison between new and old version.
Properties ComparisonProcessing Time (Seconds)
PropertyOld VersionNew VersionNumber of PointsOld VersionNew Version
Programming LanguageMatlabPython100,00080,798 s3012 s
InterfaceGUIScript50,00011,742 s1304 s
Operation/ControlManualAutomatic20,0004498 s462 s
Platform RequirementsMatlab basedIndependent10,0001887 s260 s
Speed/EfficiencySlowFast5000 *1095 s116 s
Computational demandsHighLow2000 *470 s45 s
CompactNoYes1000257 s24 s
Time Series WarningNoYes500131 s13 s
* Prevailing total number of points for pilot monitoring scenarios under remotIO project.
Table 6. Summary of point counts for filtered deformation maps.
MT-InSAR
Output
Data Mining
OFF
Data Mining
ON
Pilot ScenarioTrackOrbitAll PointsCoherence > 0.7InliersAlertsAlarms
(1) Landslides
Prievidza districts175Asc.1846411725732
Prievidza districts51Desc.23615078861953
(2) Mining subsidence
Kos municipality175Asc.1424409716949
Kos municipality51Desc.17975628771063
(3) Dams
Cunovo dam73Asc.4097169324651885
Cunovo dam124Desc.364115102167868
Gabcikovo dam73Asc.1242397748535
Gabcikovo dam124Desc.1165349667734

