Author Contributions
Conceptualization, F.M. and J.A.; methodology, J.A., F.M., W.B. and W.J.B.; software, F.M.; validation, J.A., W.B., A.A. and W.J.B.; formal analysis, F.M., J.A., and S.S.; investigation, F.M., J.A. and W.B.; resources, J.A. and F.M.; data curation, F.M., J.A., W.B. and S.S.; writing–original draft preparation, F.M., J.A. and S.S.; writing–review and editing, J.A., W.B., W.J.B., F.M., A.A. and S.R.; visualization, F.M.; supervision, J.A., W.B. and W.J.B.; project administration, J.A., W.B., and W.J.B.; funding acquisition, J.A., W.B. and S.R.; All authors have read and agreed to the published version of the manuscript.
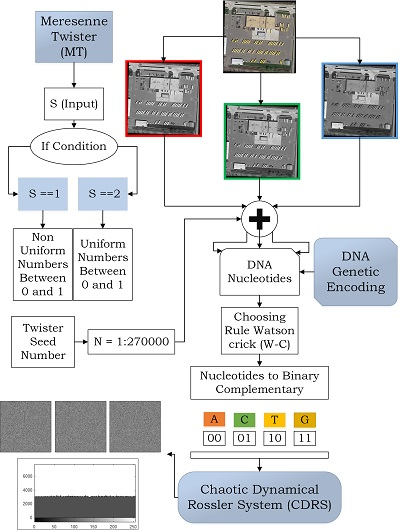
Figure 1.
Basic procedure of proposed cryptosystem.
Figure 1.
Basic procedure of proposed cryptosystem.
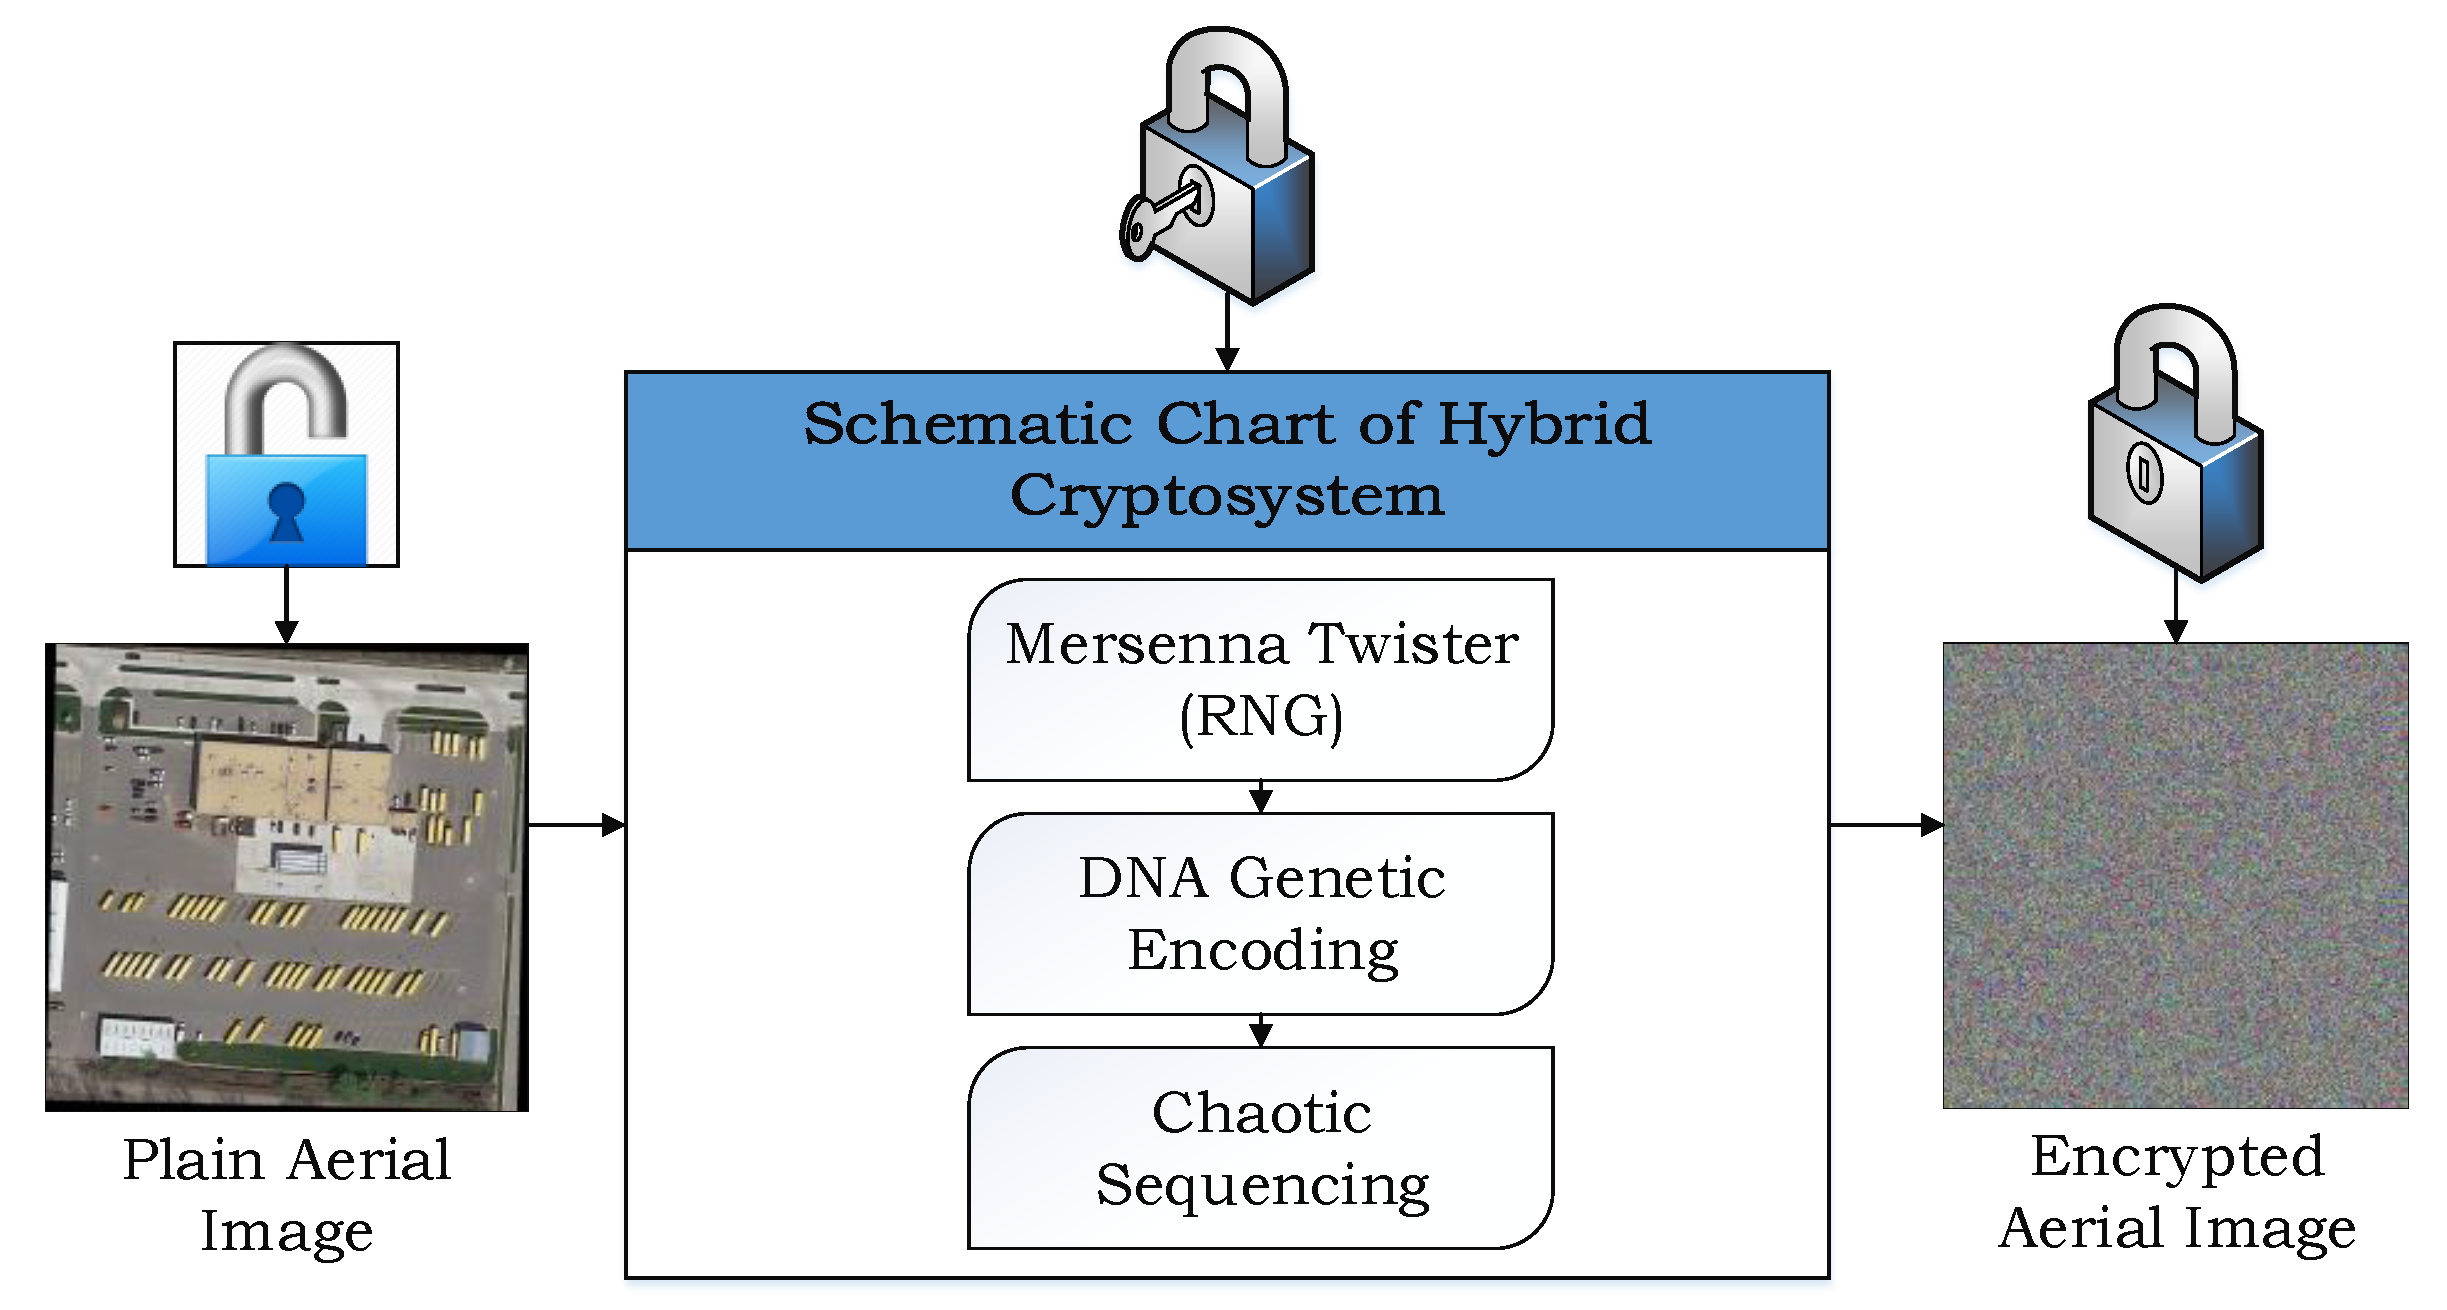
Figure 2.
Schematic chart of image encryption.
Figure 2.
Schematic chart of image encryption.
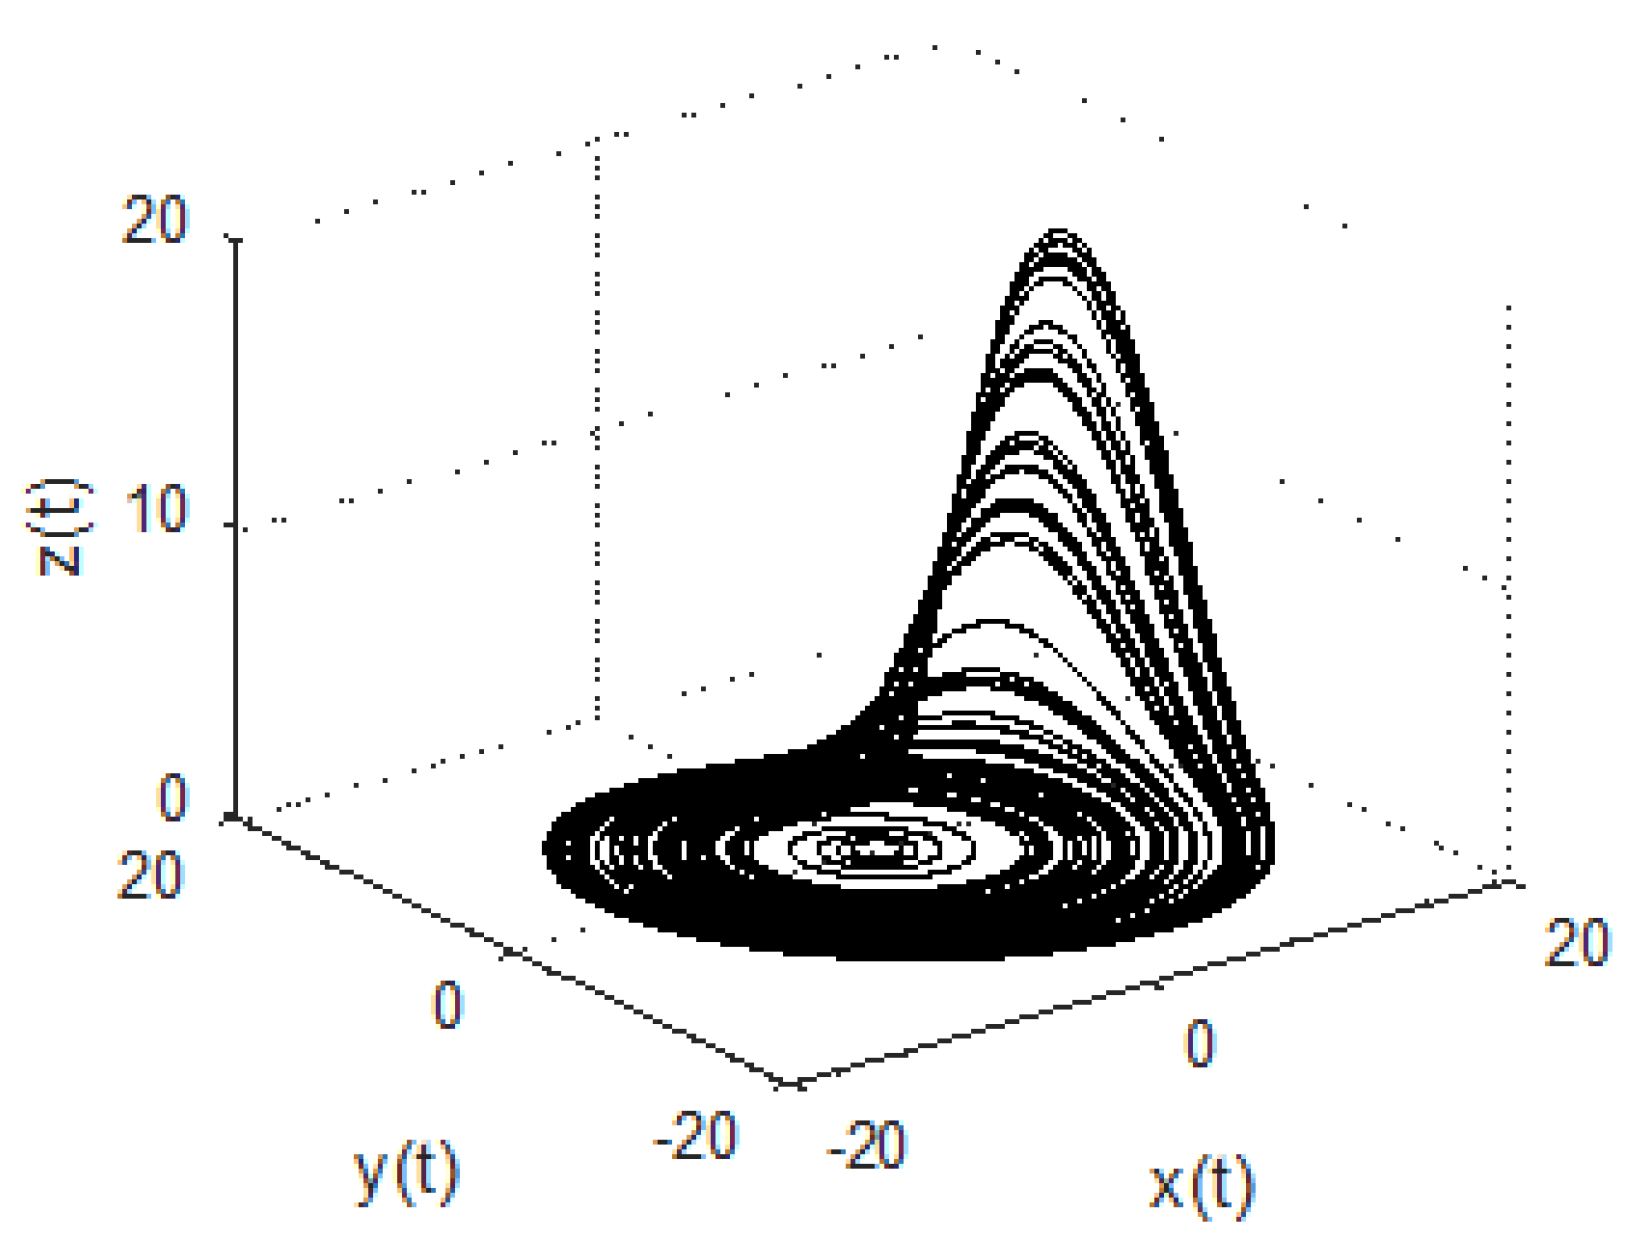
Figure 3.
CDRS generated attractor.
Figure 3.
CDRS generated attractor.
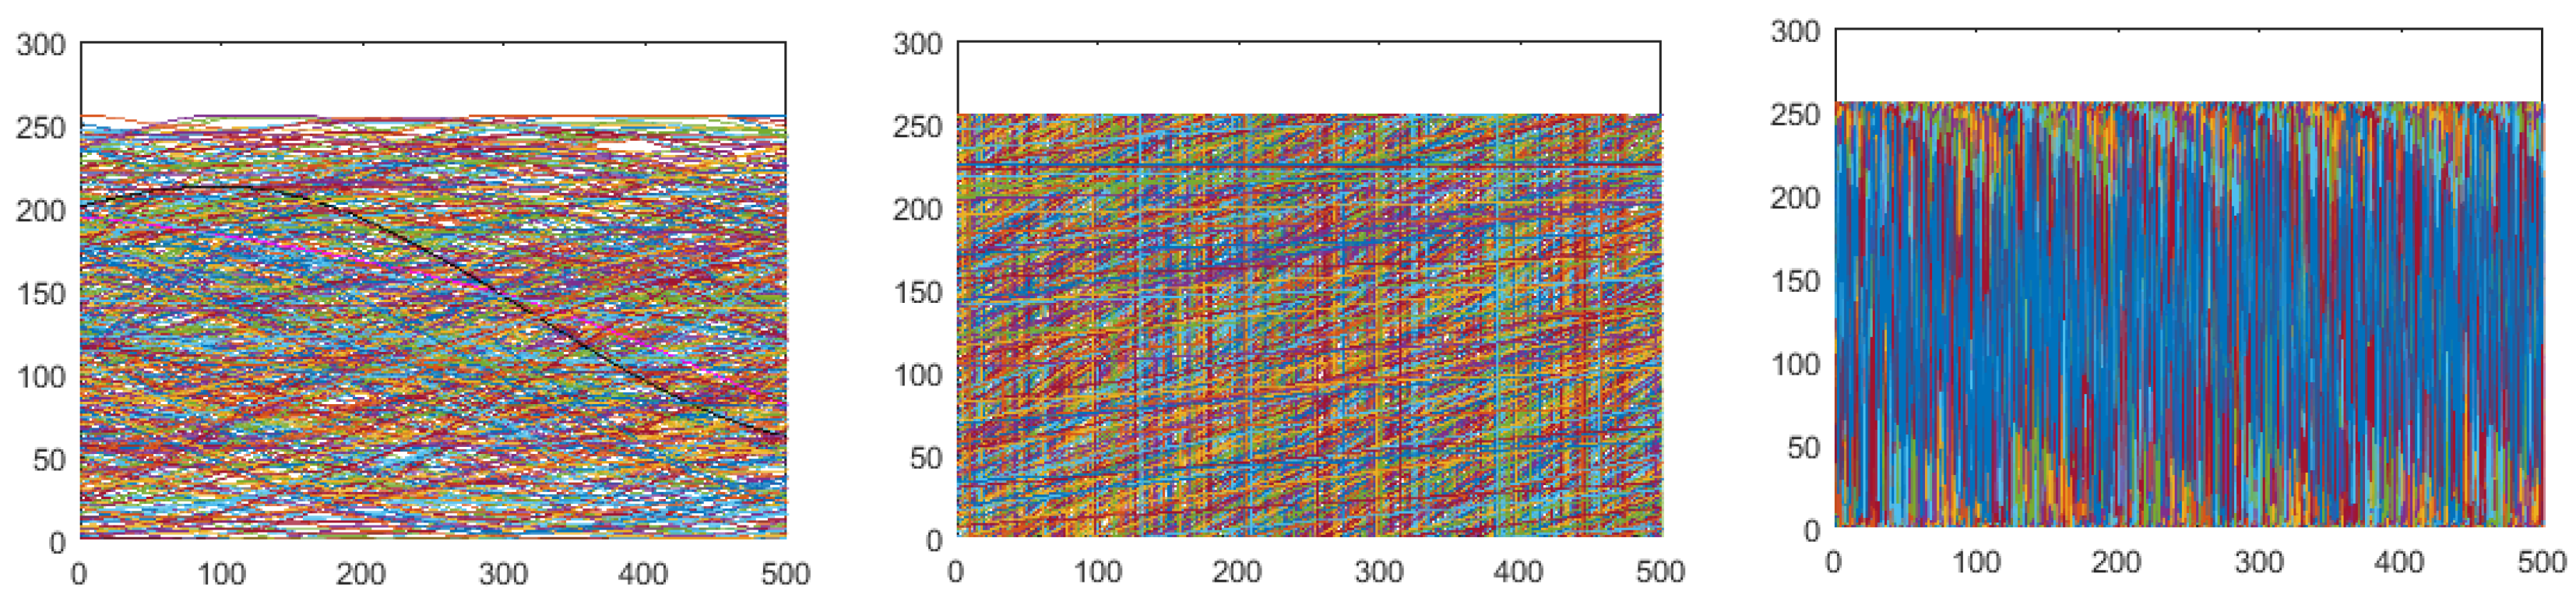
Figure 4.
Plotting of MT, DNA, and CDRS random numbers.
Figure 4.
Plotting of MT, DNA, and CDRS random numbers.
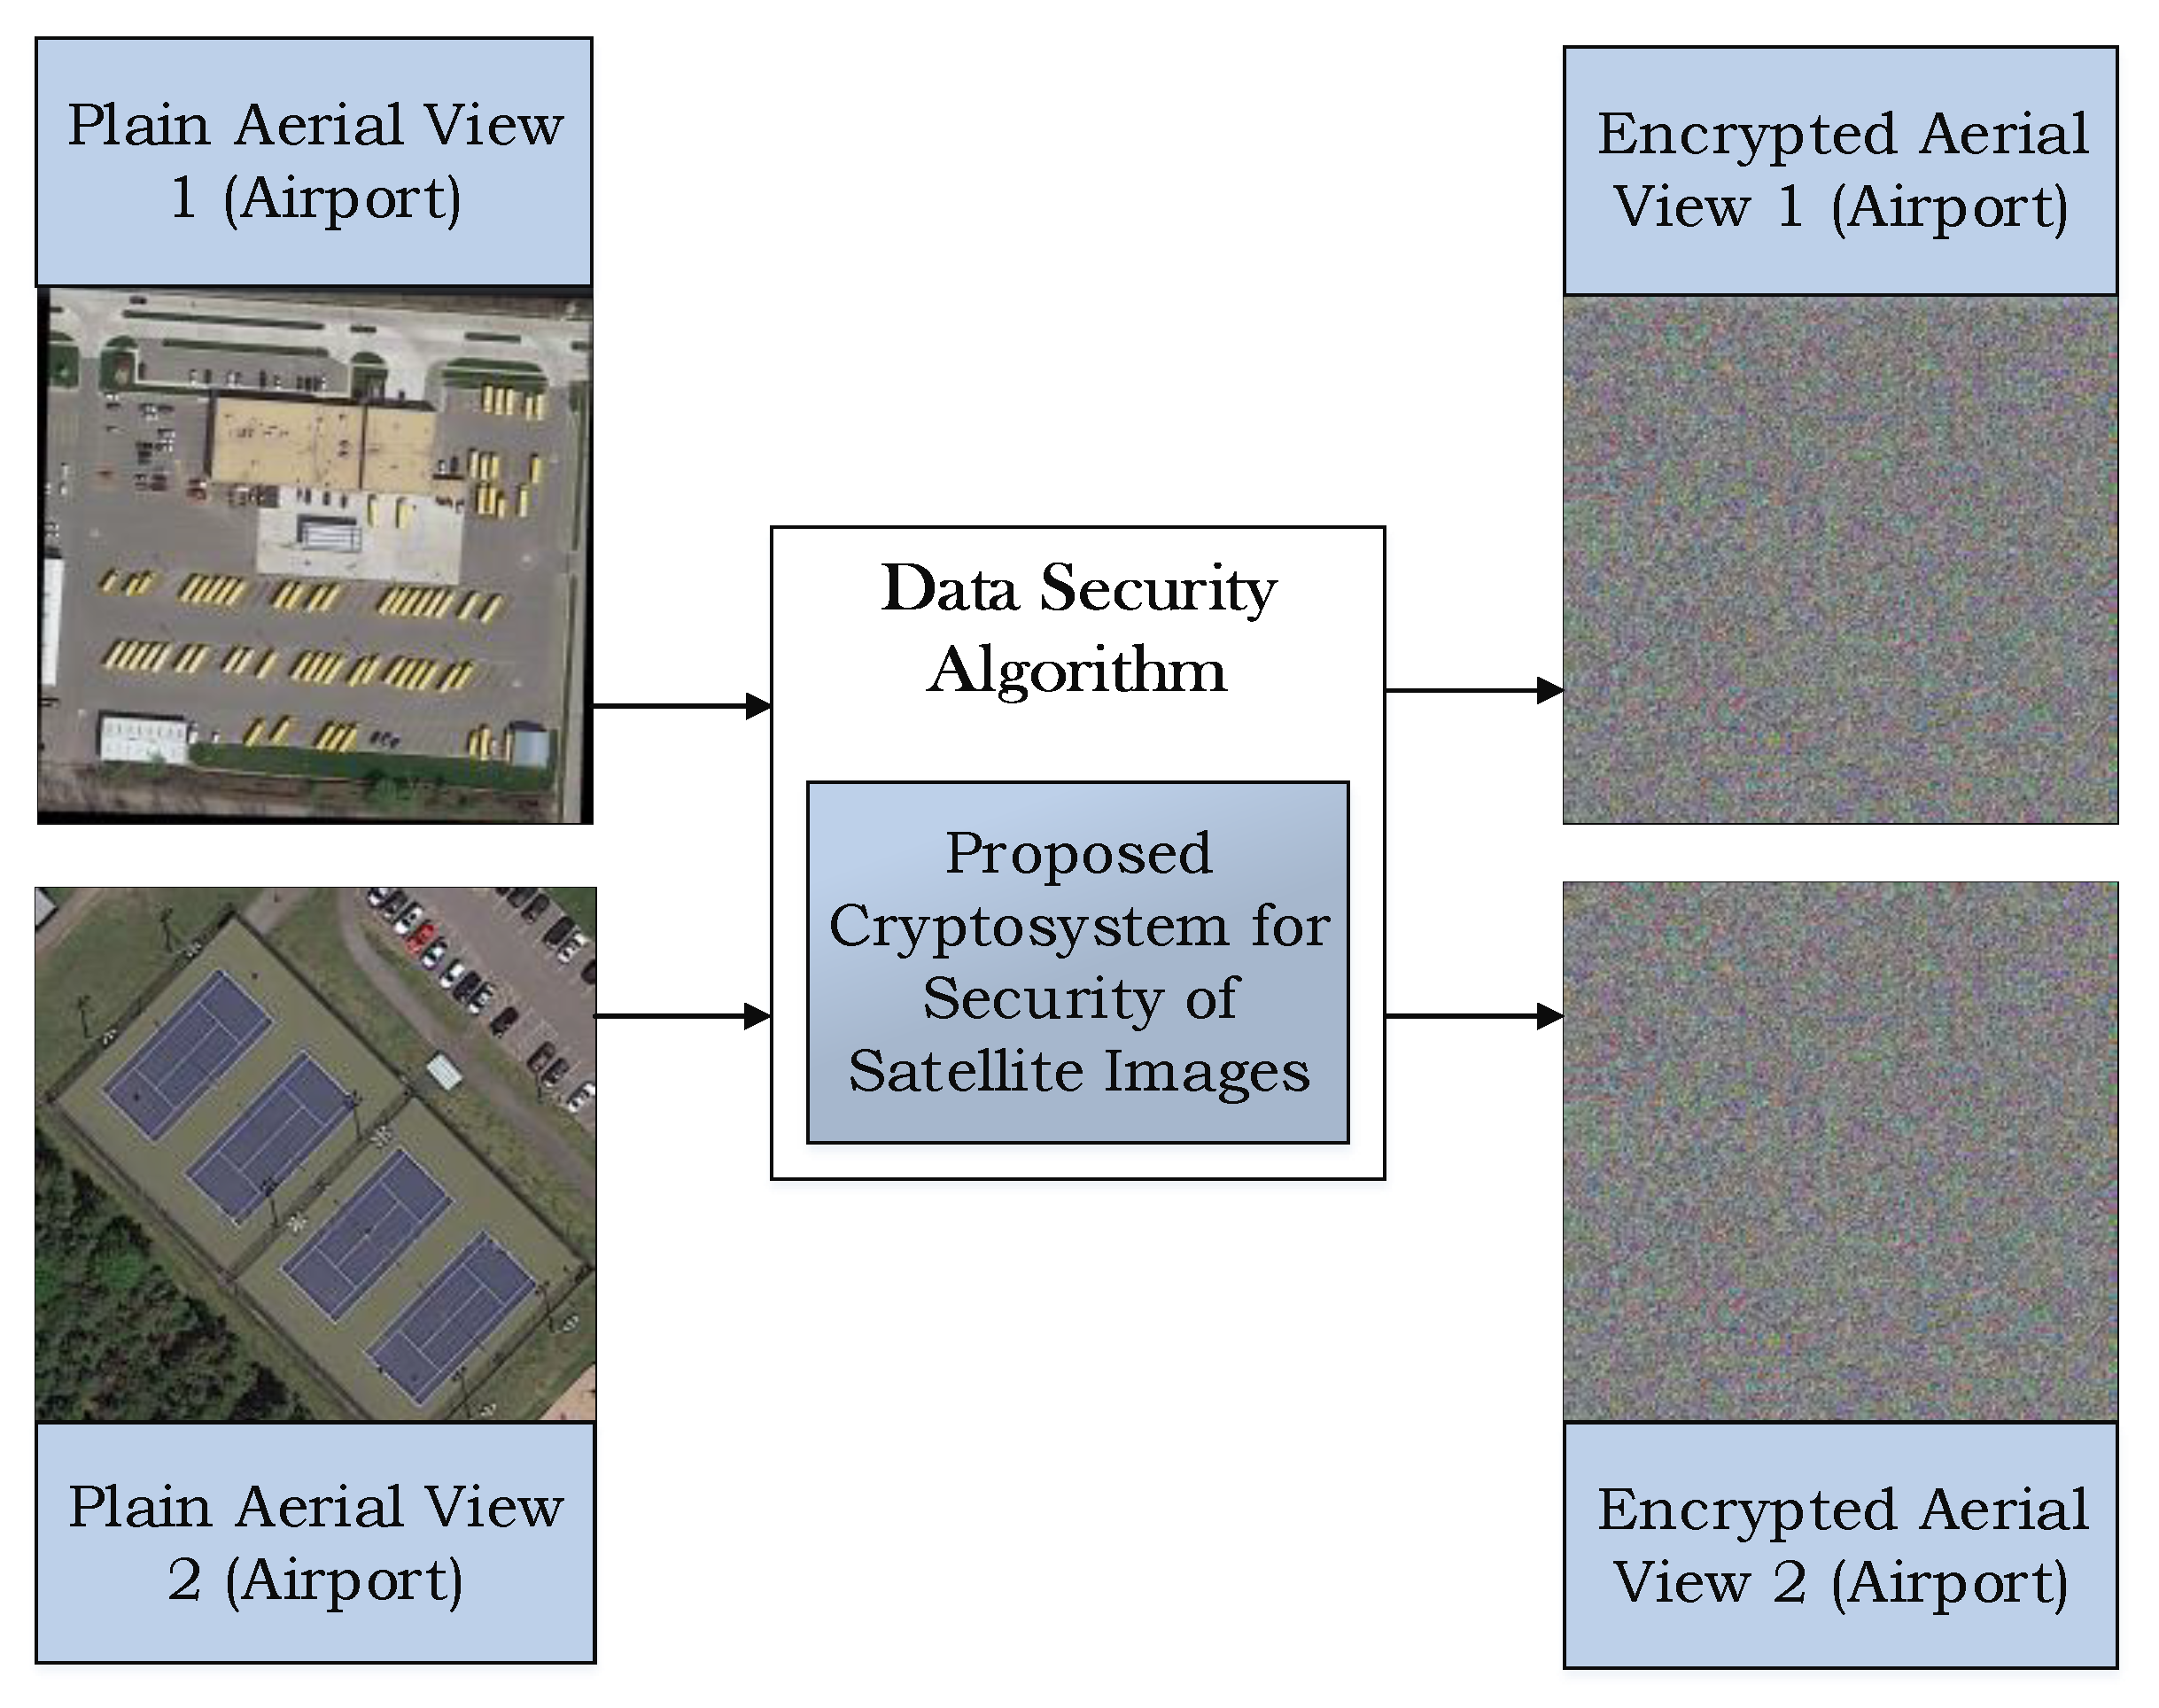
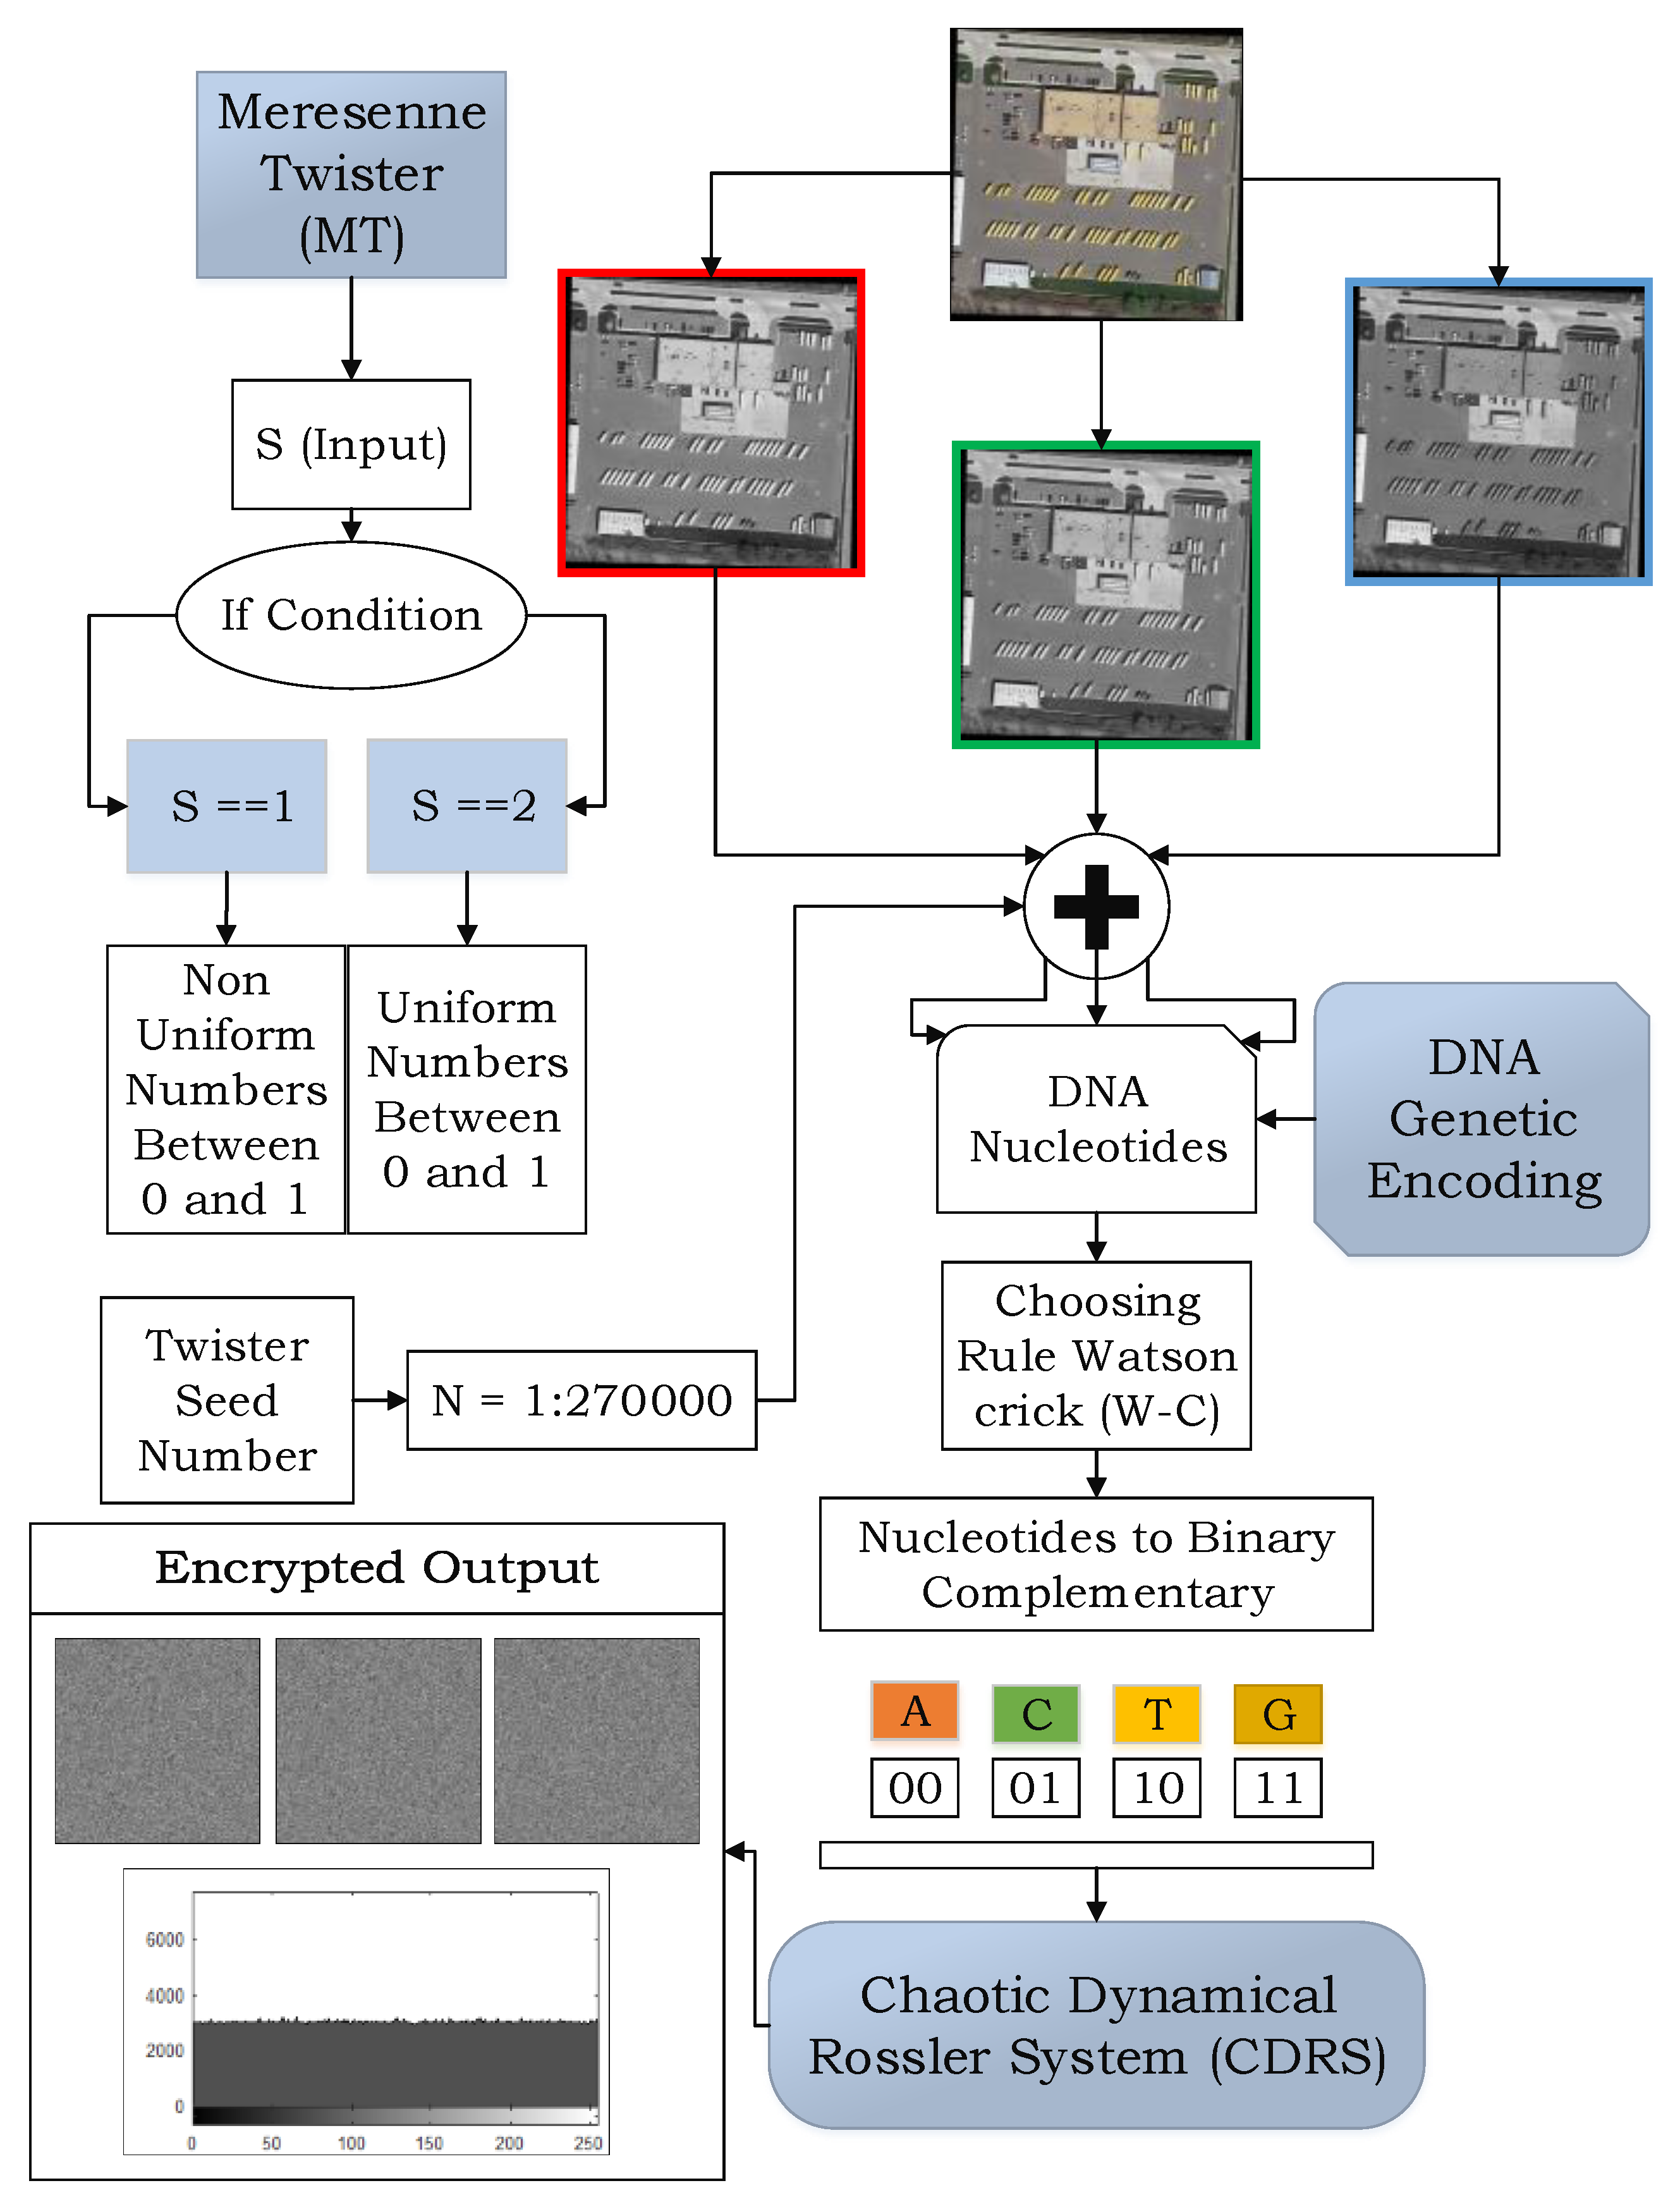
Figure 5.
Flow chart of aerial view images encryption.
Figure 5.
Flow chart of aerial view images encryption.
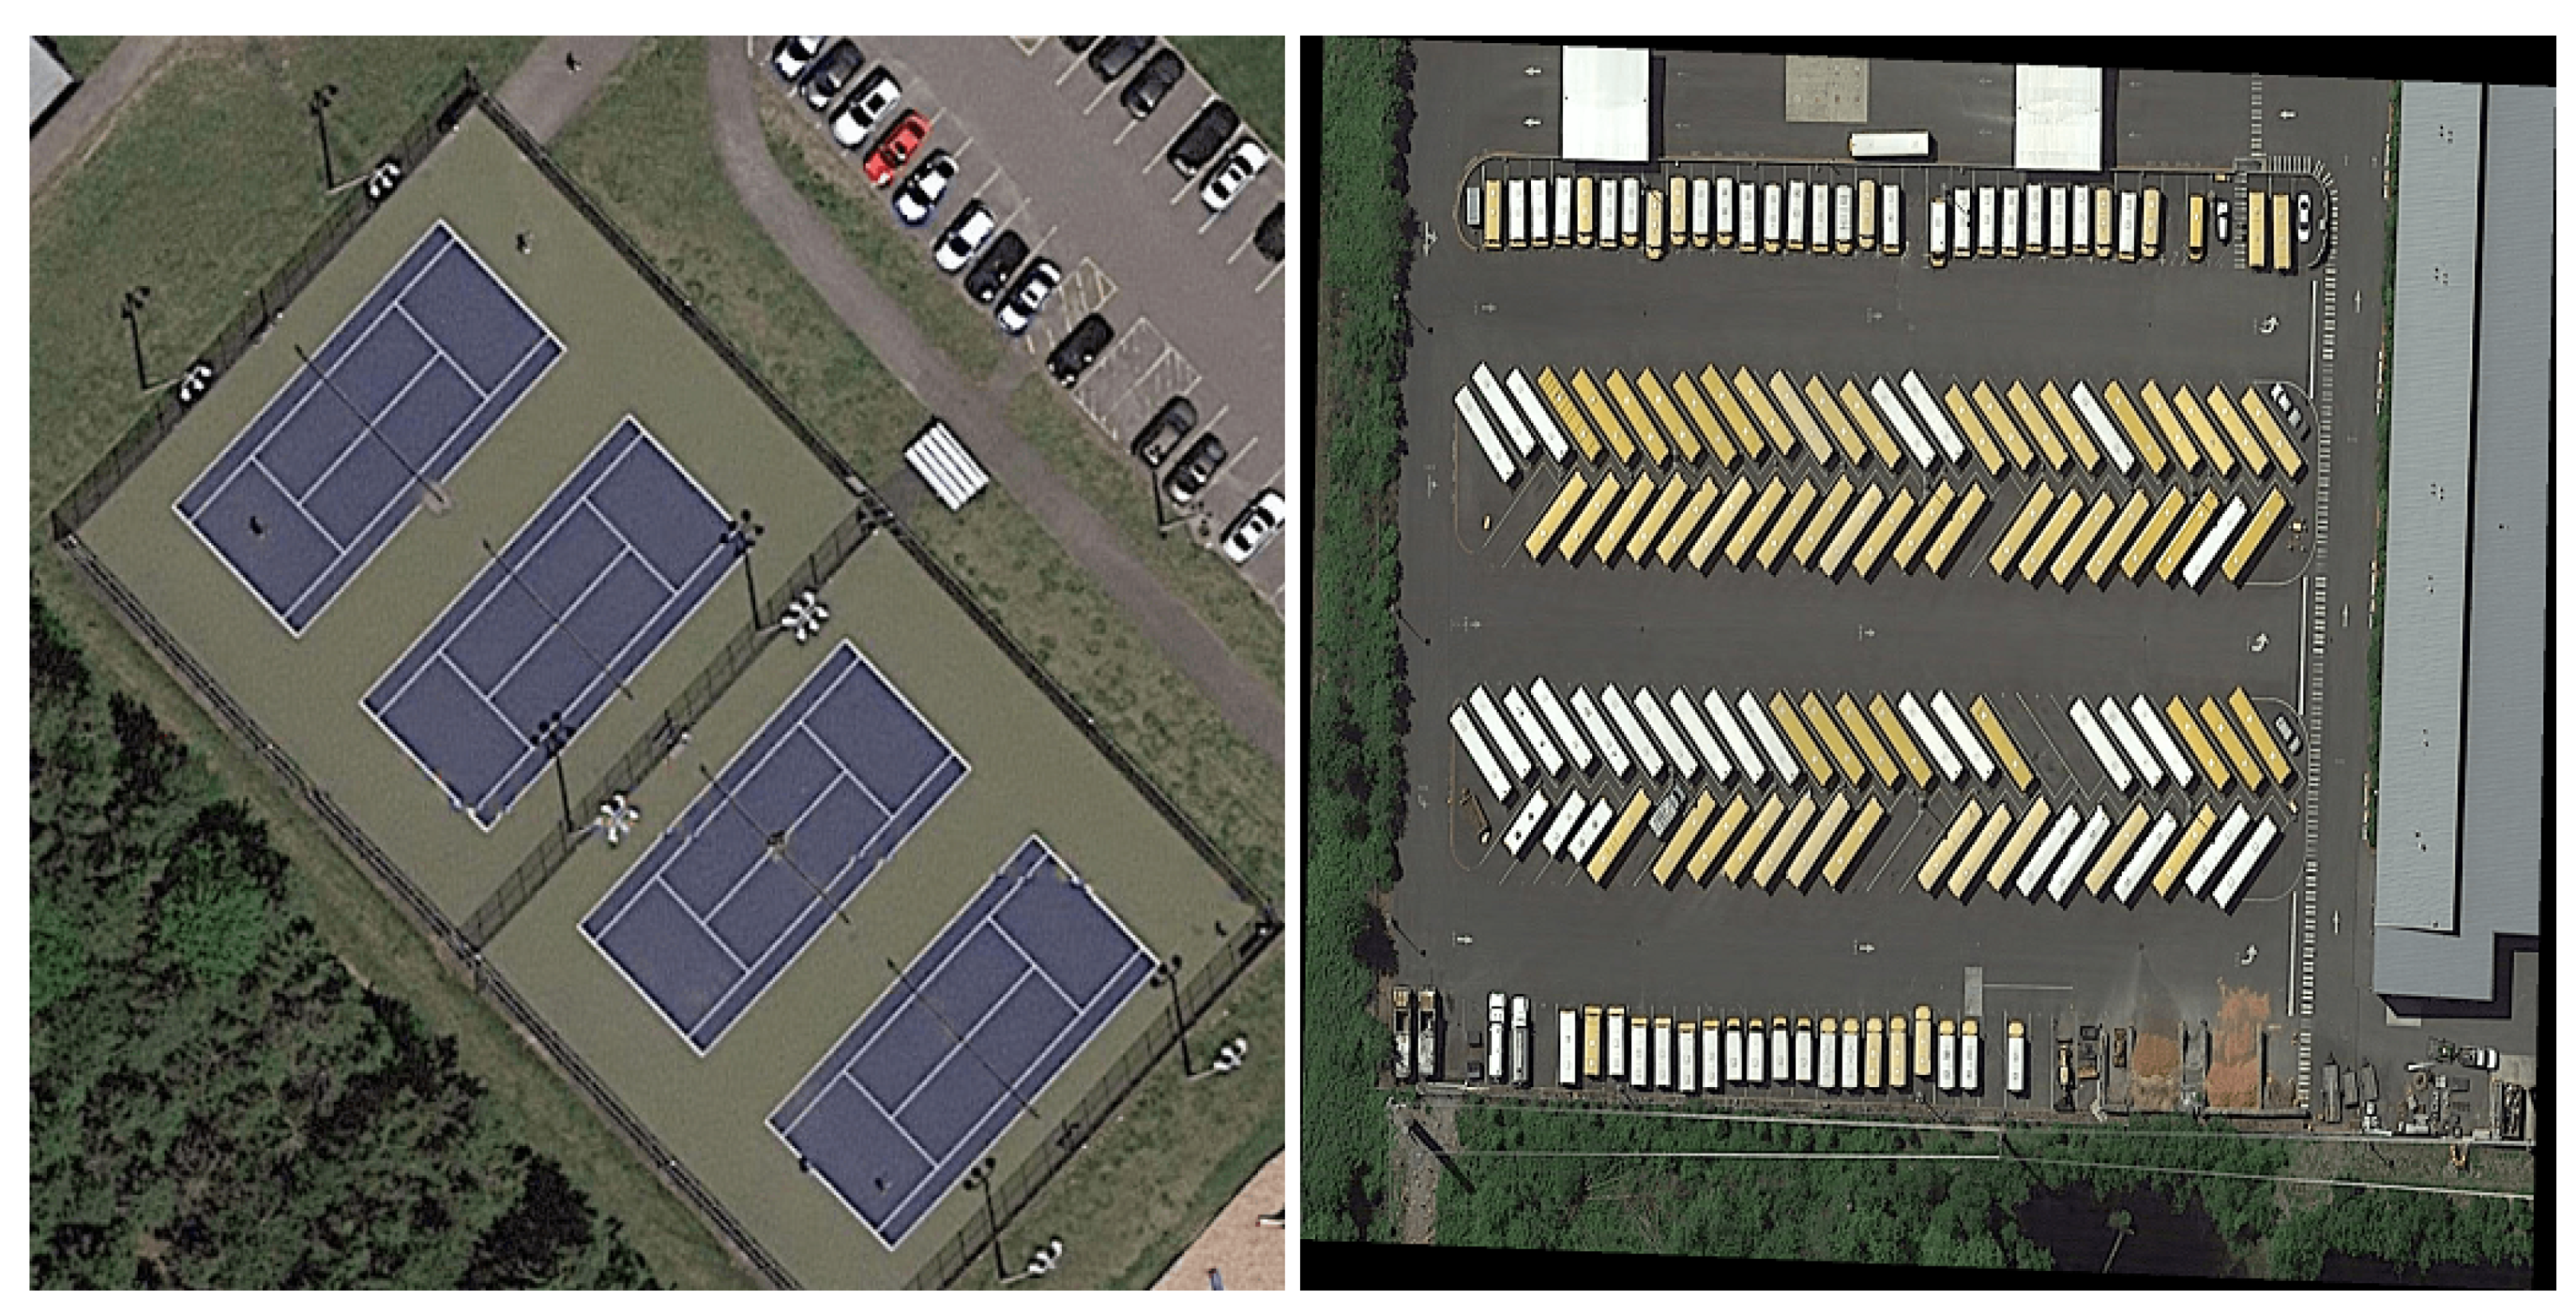
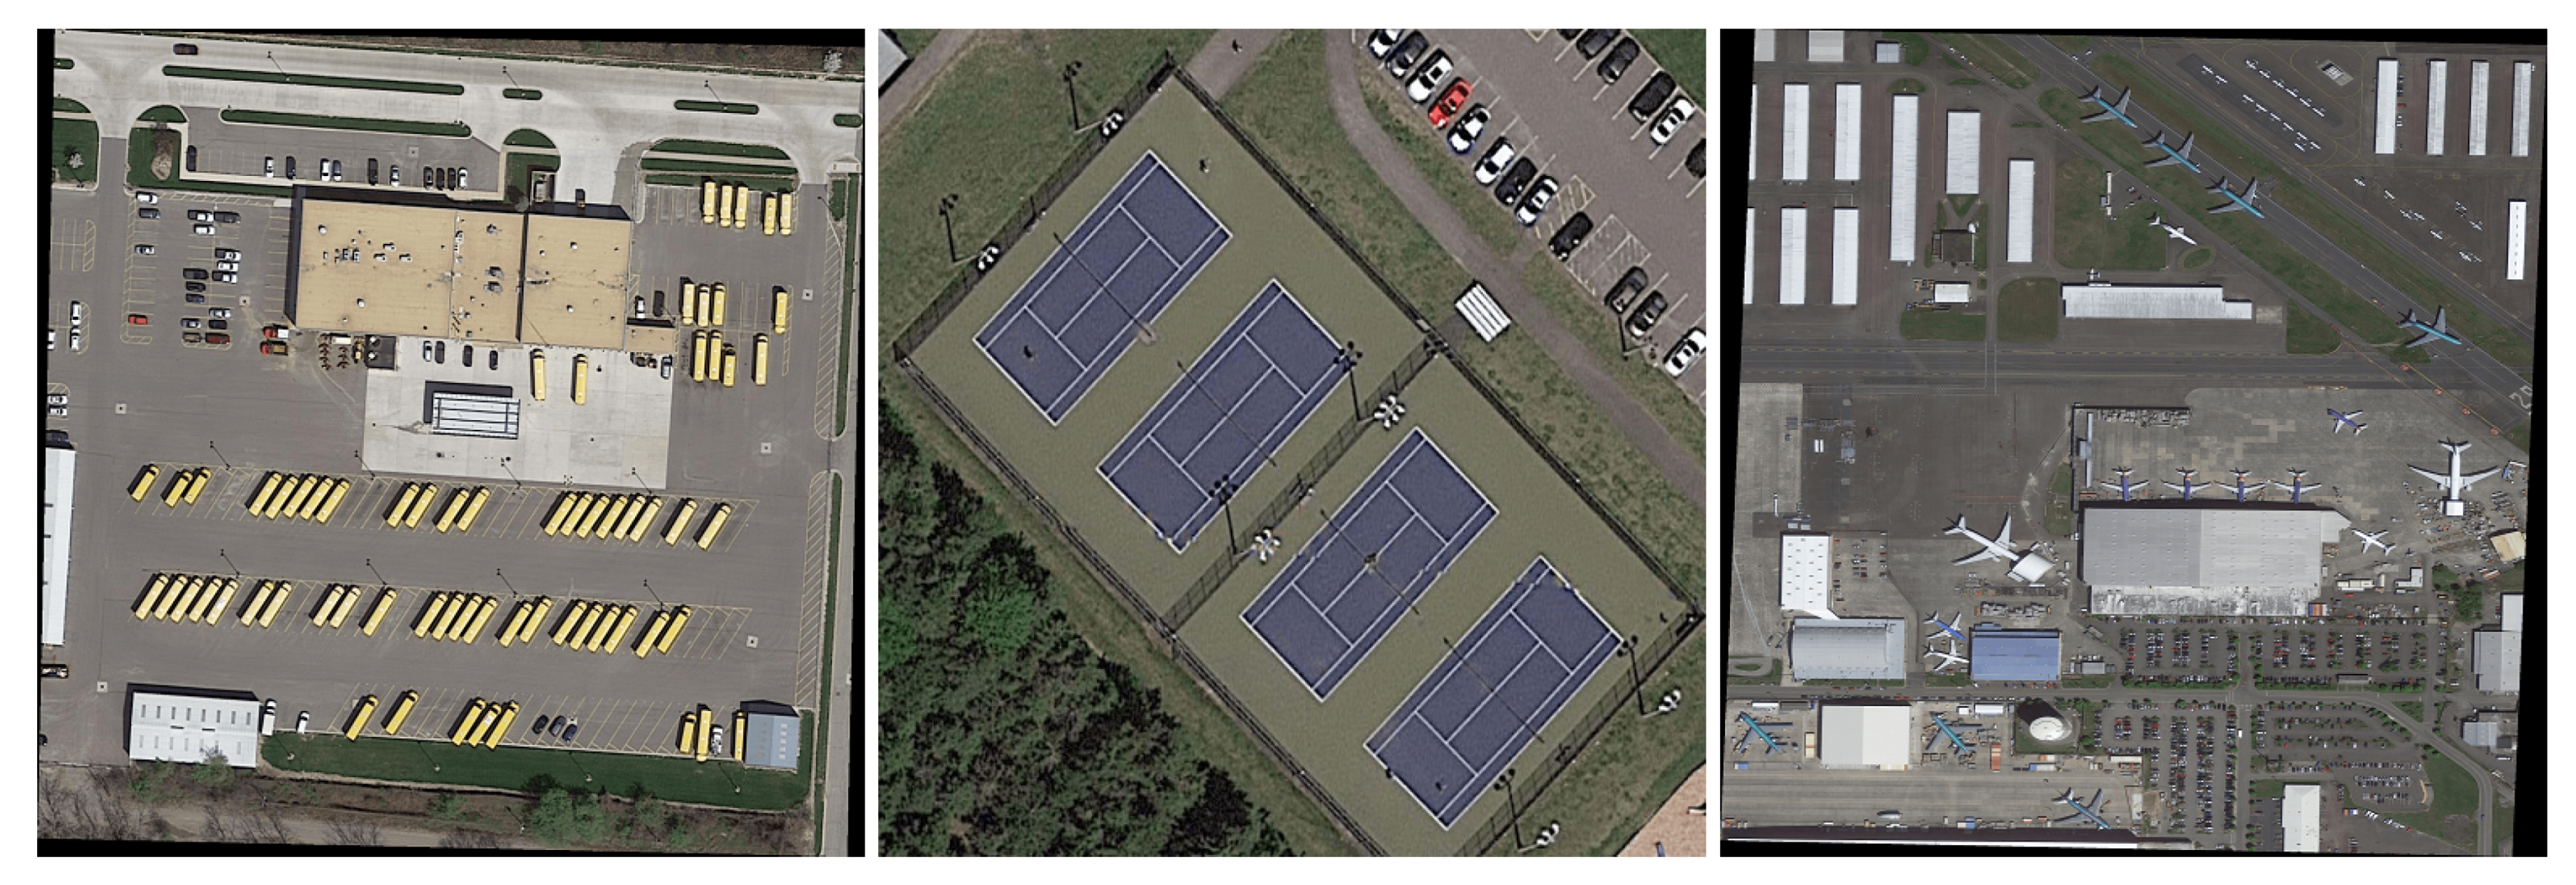
Figure 6.
Aerial view photography 1: Yellow and white buses.
Figure 6.
Aerial view photography 1: Yellow and white buses.
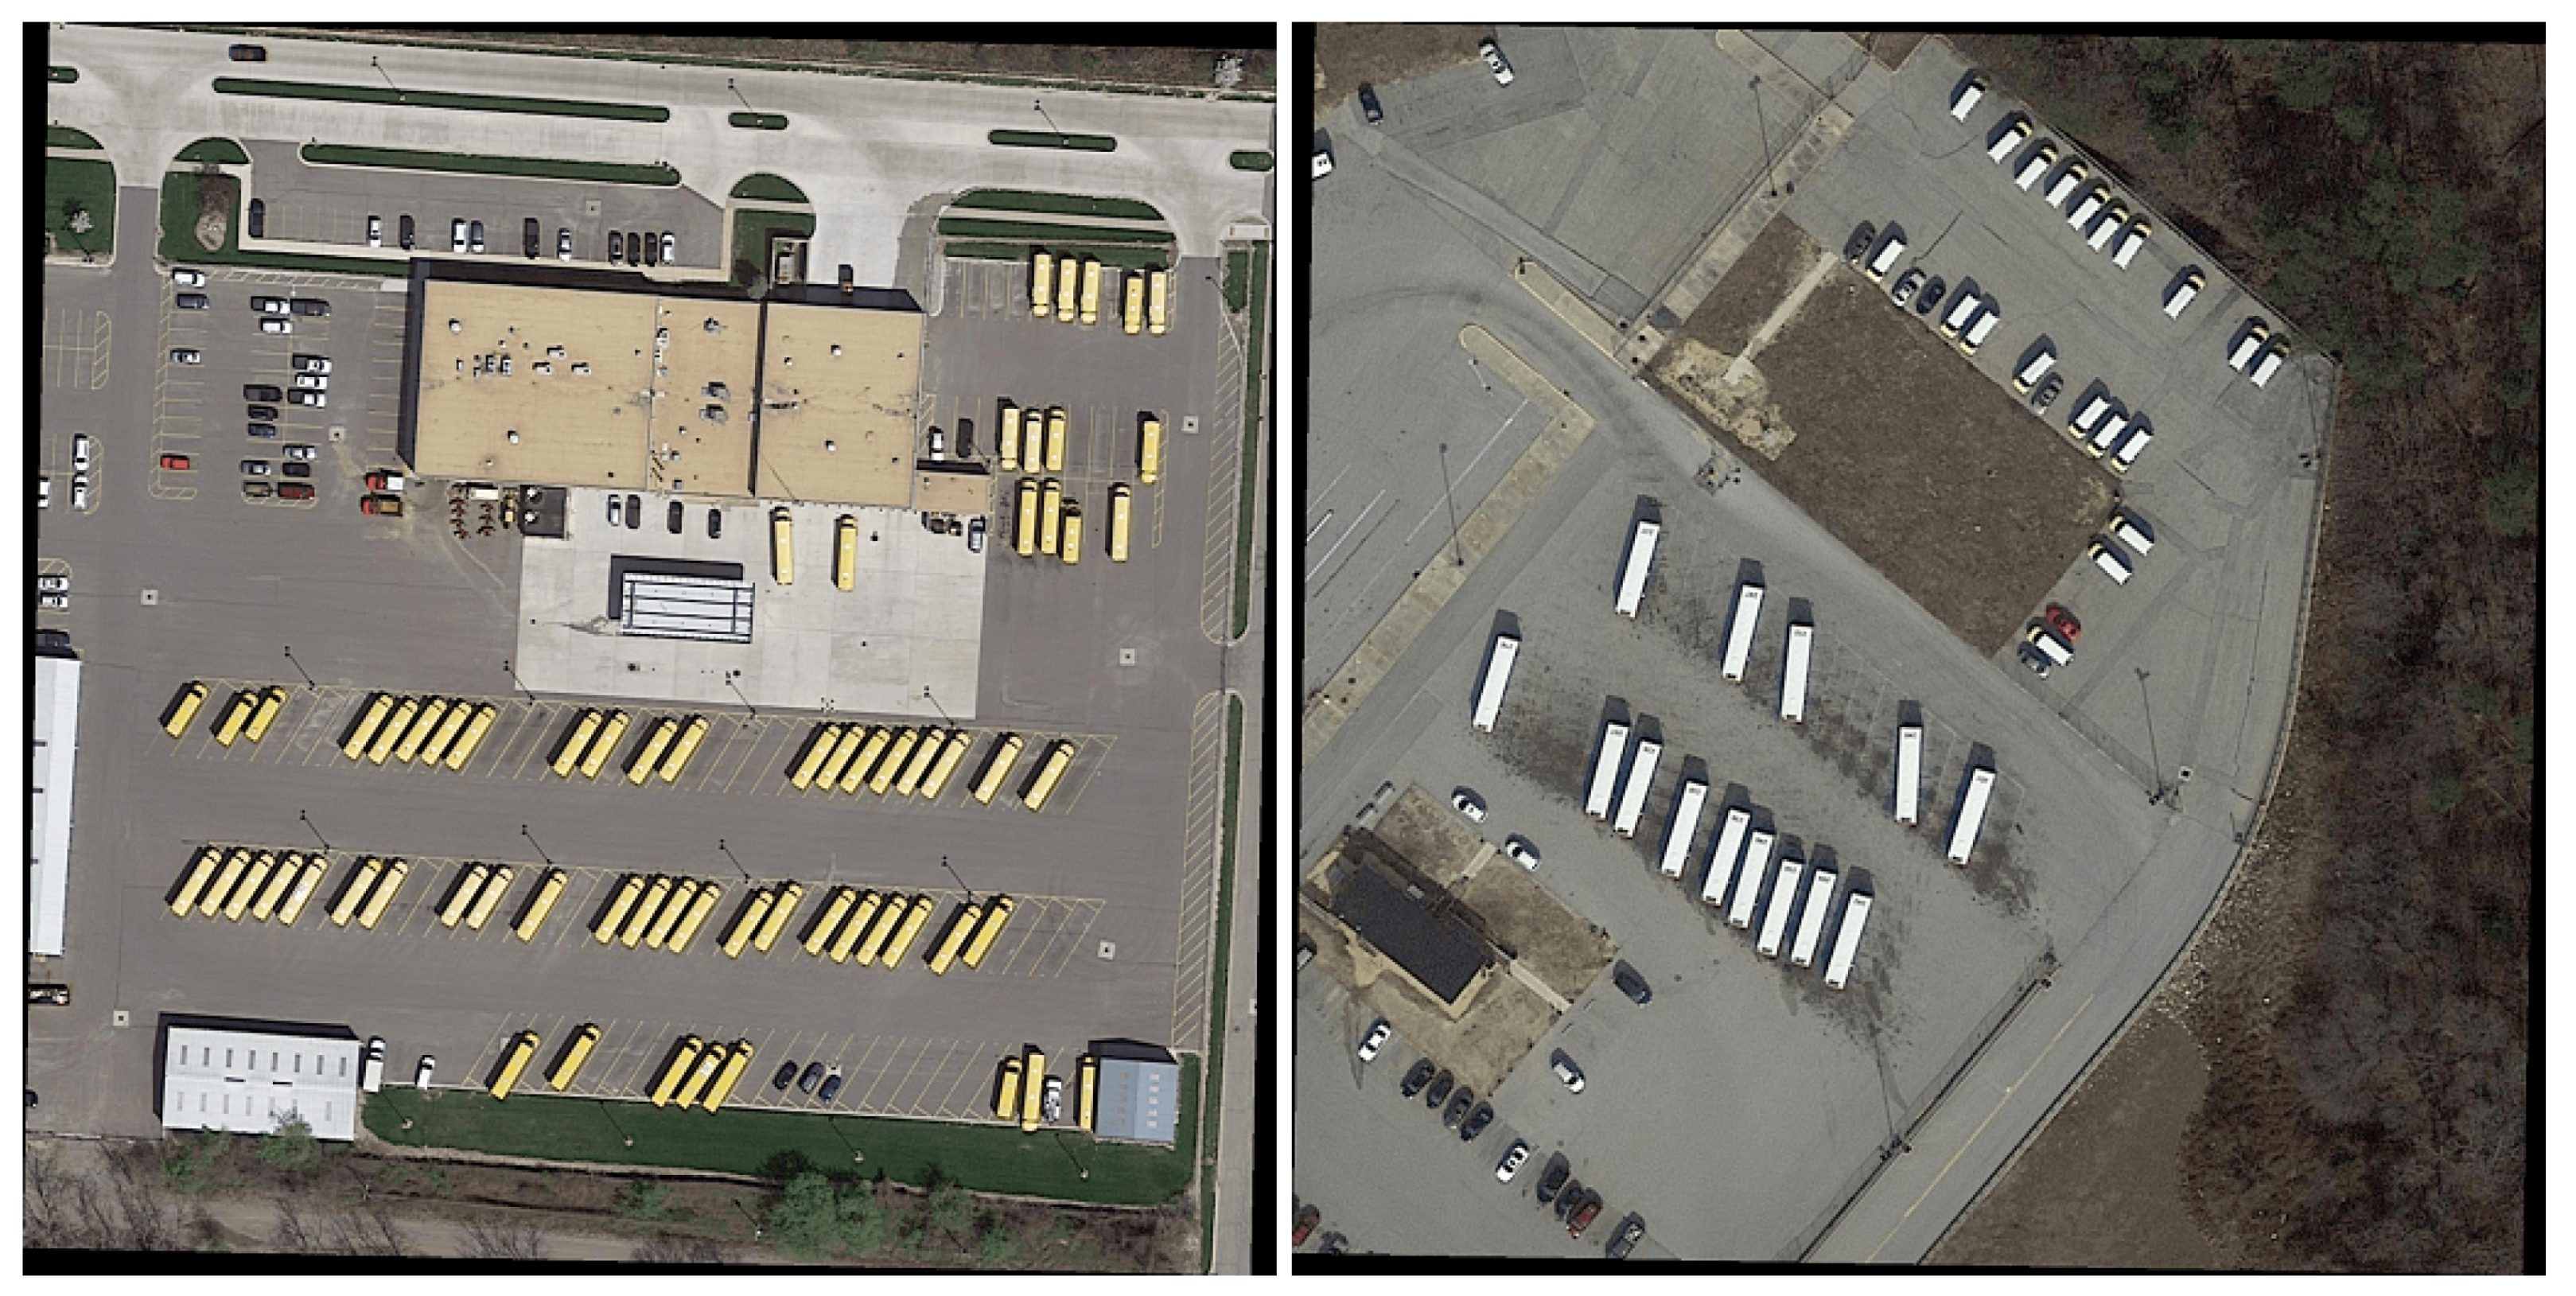
Figure 7.
Aerial view photography 2: Cars and mixed buses.
Figure 7.
Aerial view photography 2: Cars and mixed buses.
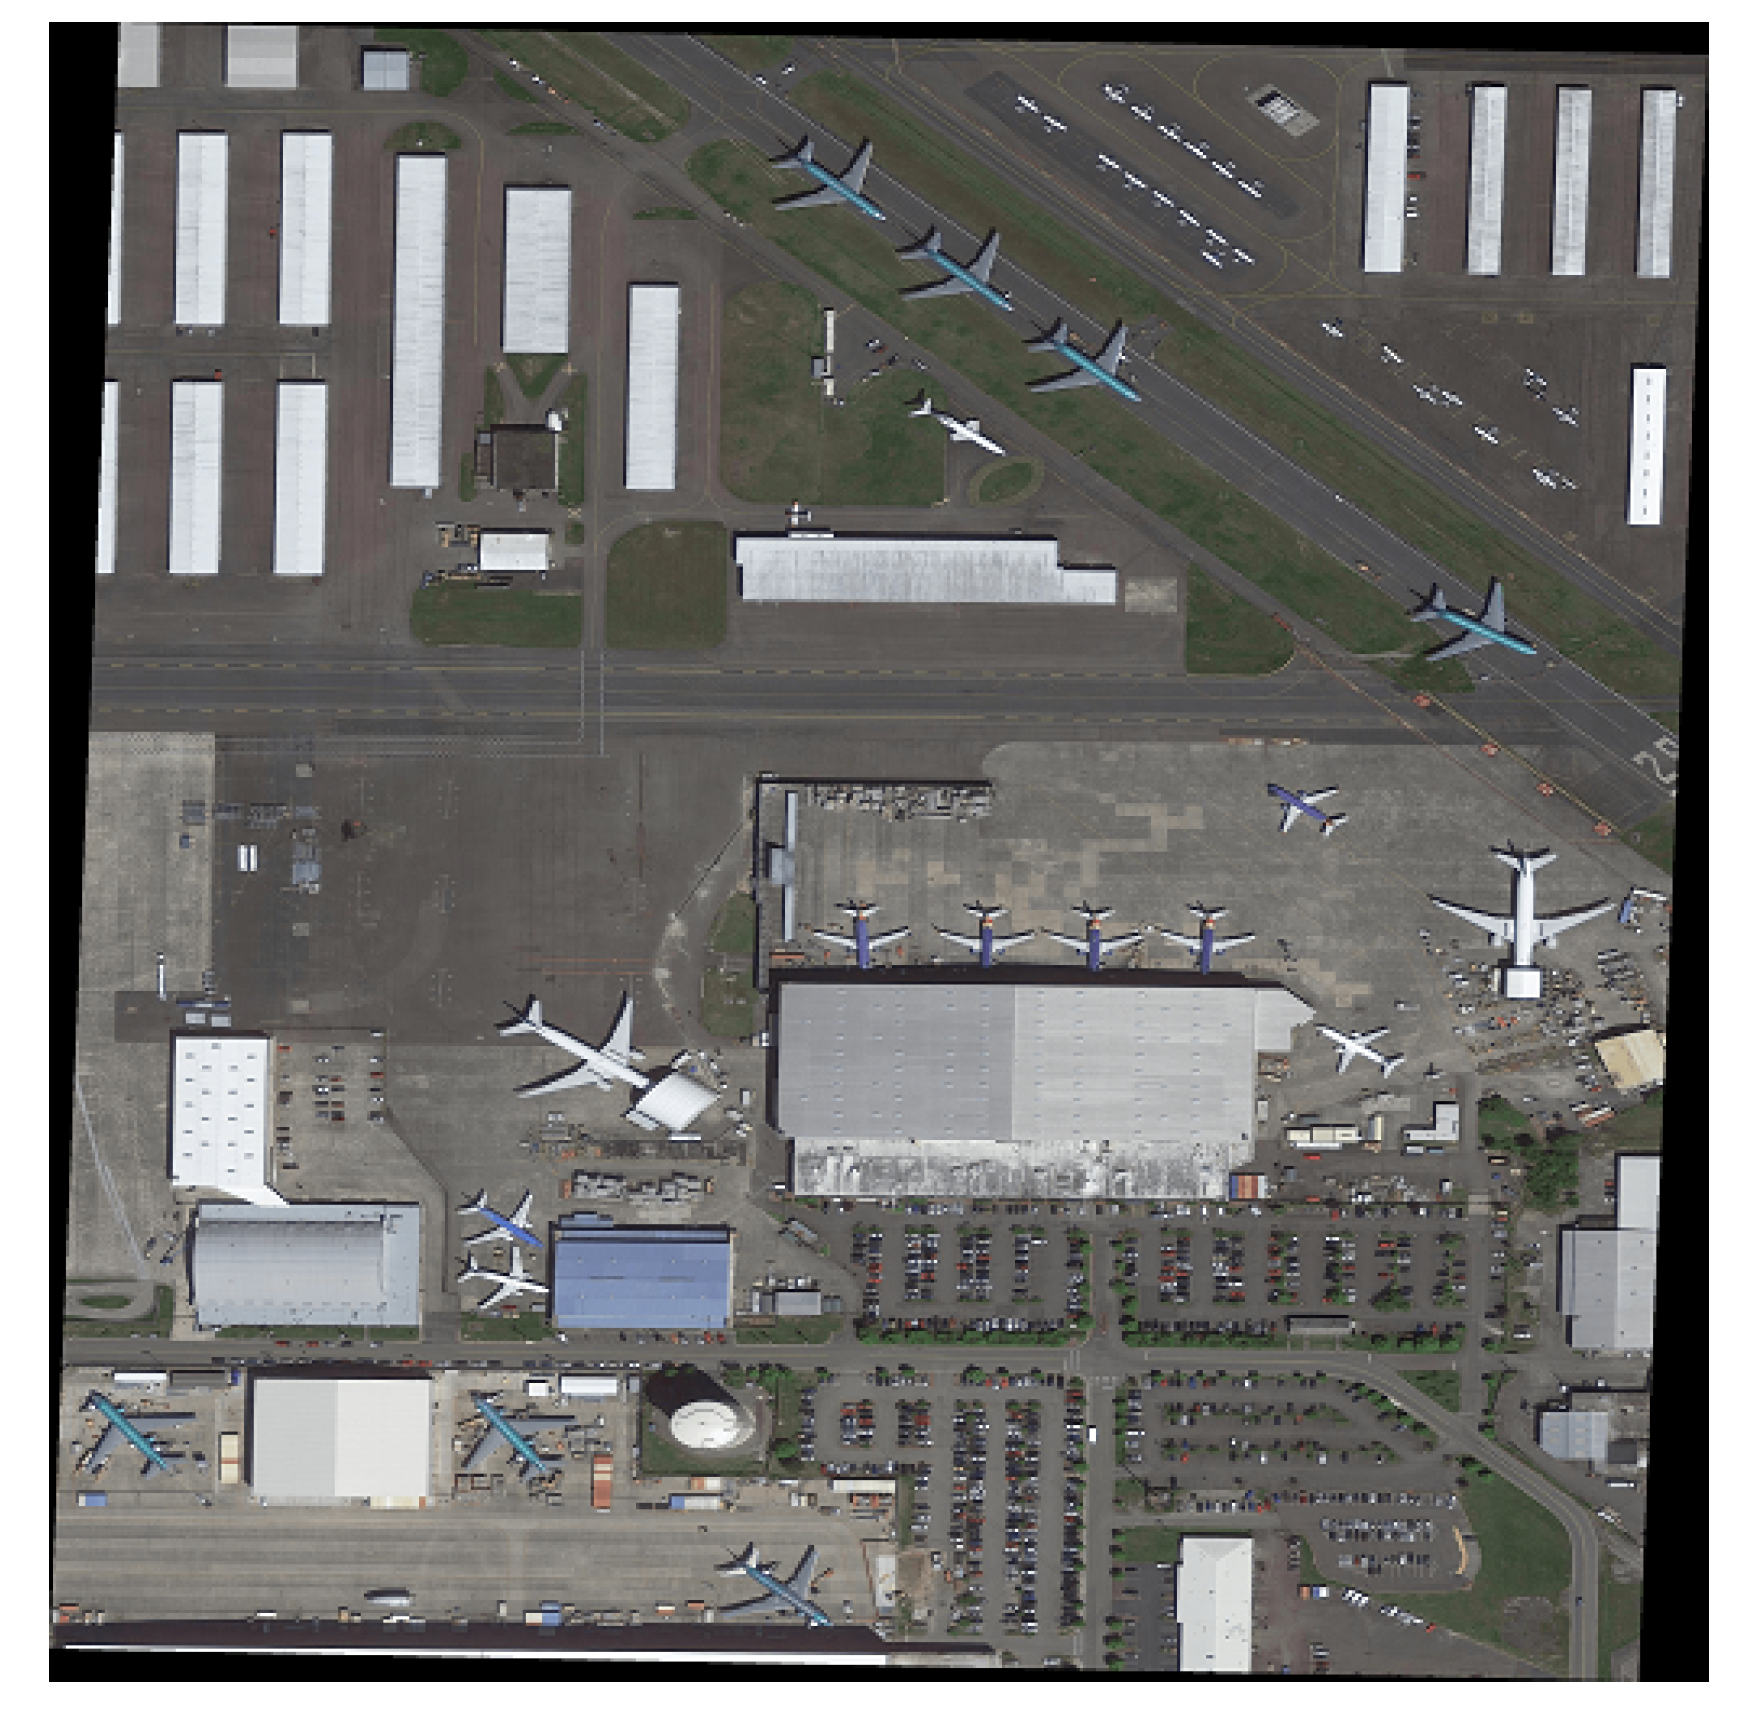
Figure 8.
Aerial view photography 3: airplanes.
Figure 8.
Aerial view photography 3: airplanes.
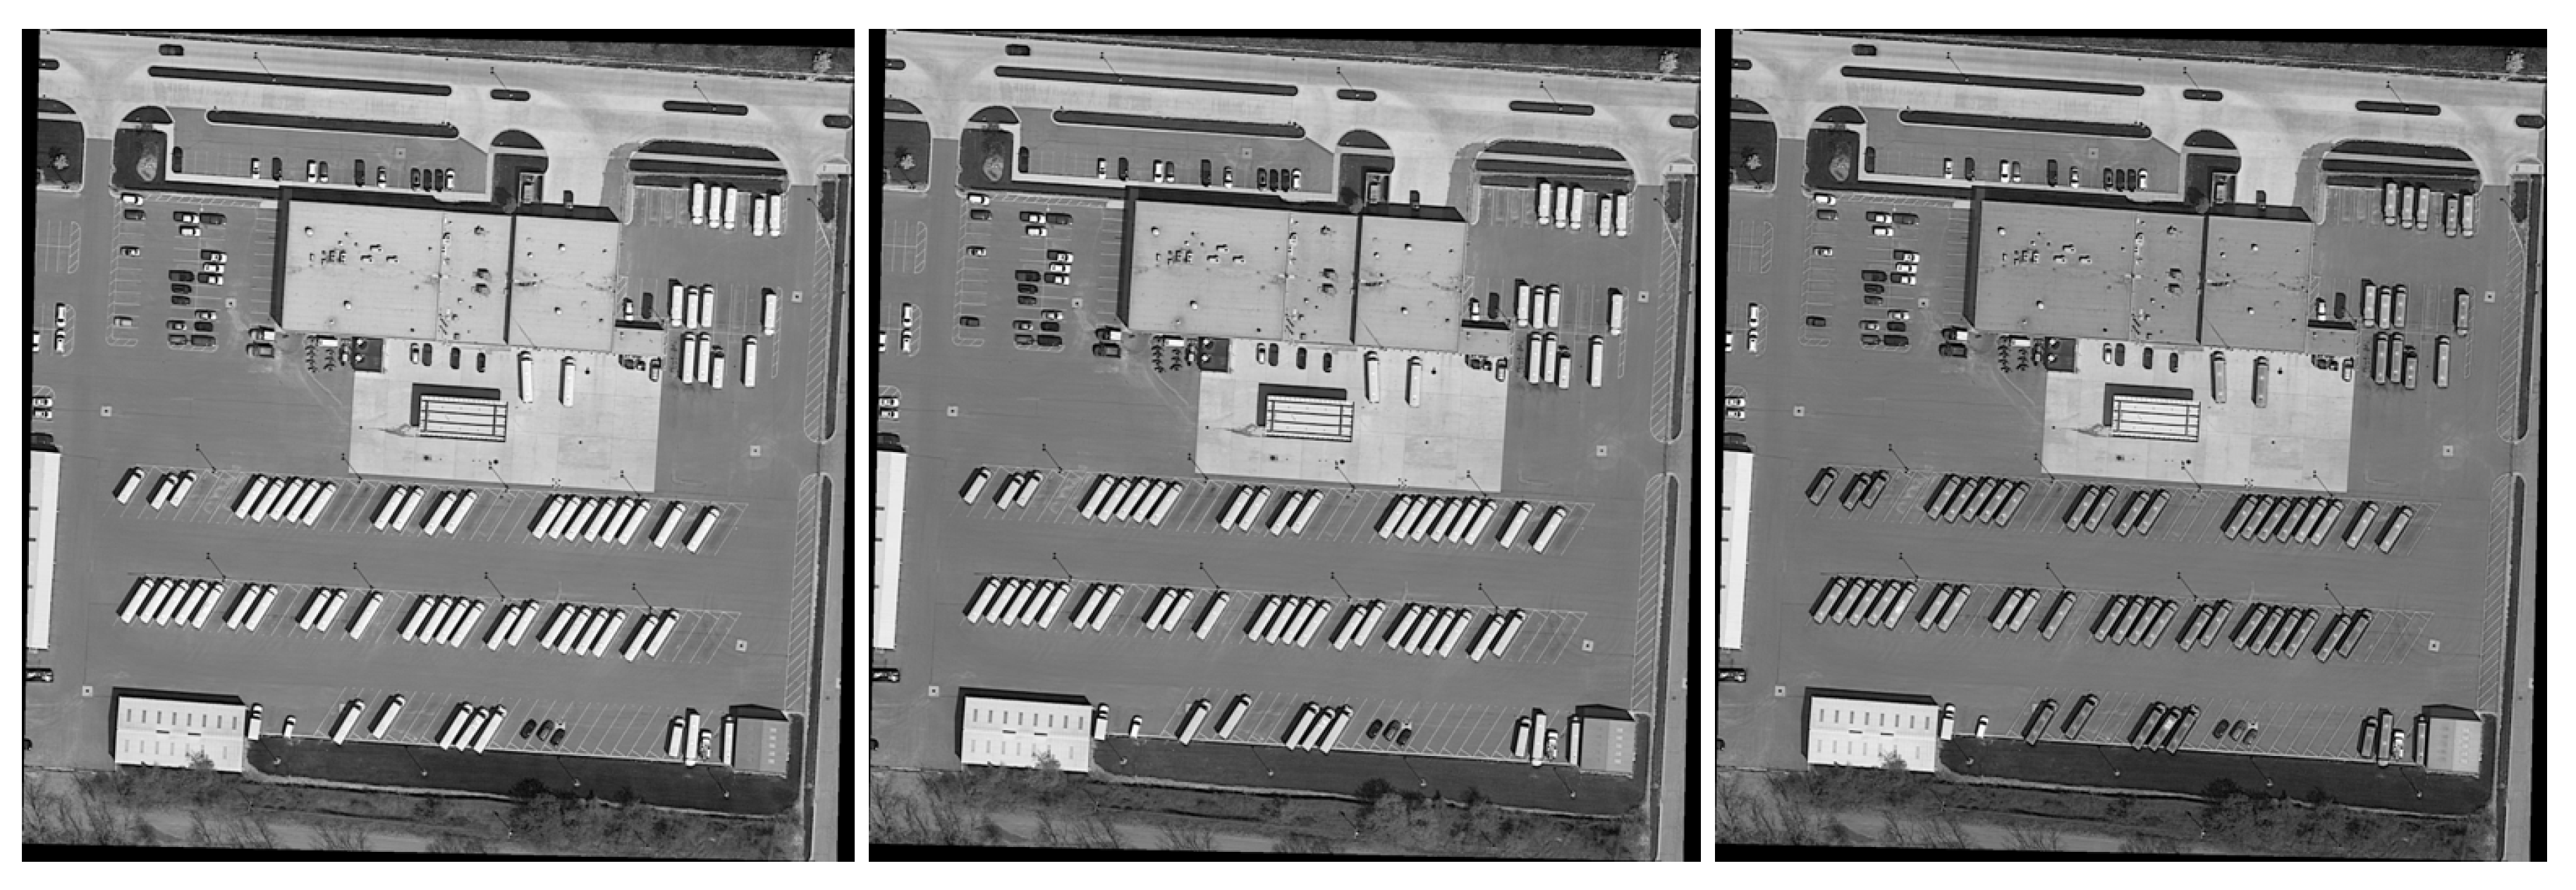
Figure 9.
Aerial view photography 1, plain image with three layers (red, green, blue) of yellow buses. Images measures and each of three layers measures .
Figure 9.
Aerial view photography 1, plain image with three layers (red, green, blue) of yellow buses. Images measures and each of three layers measures .
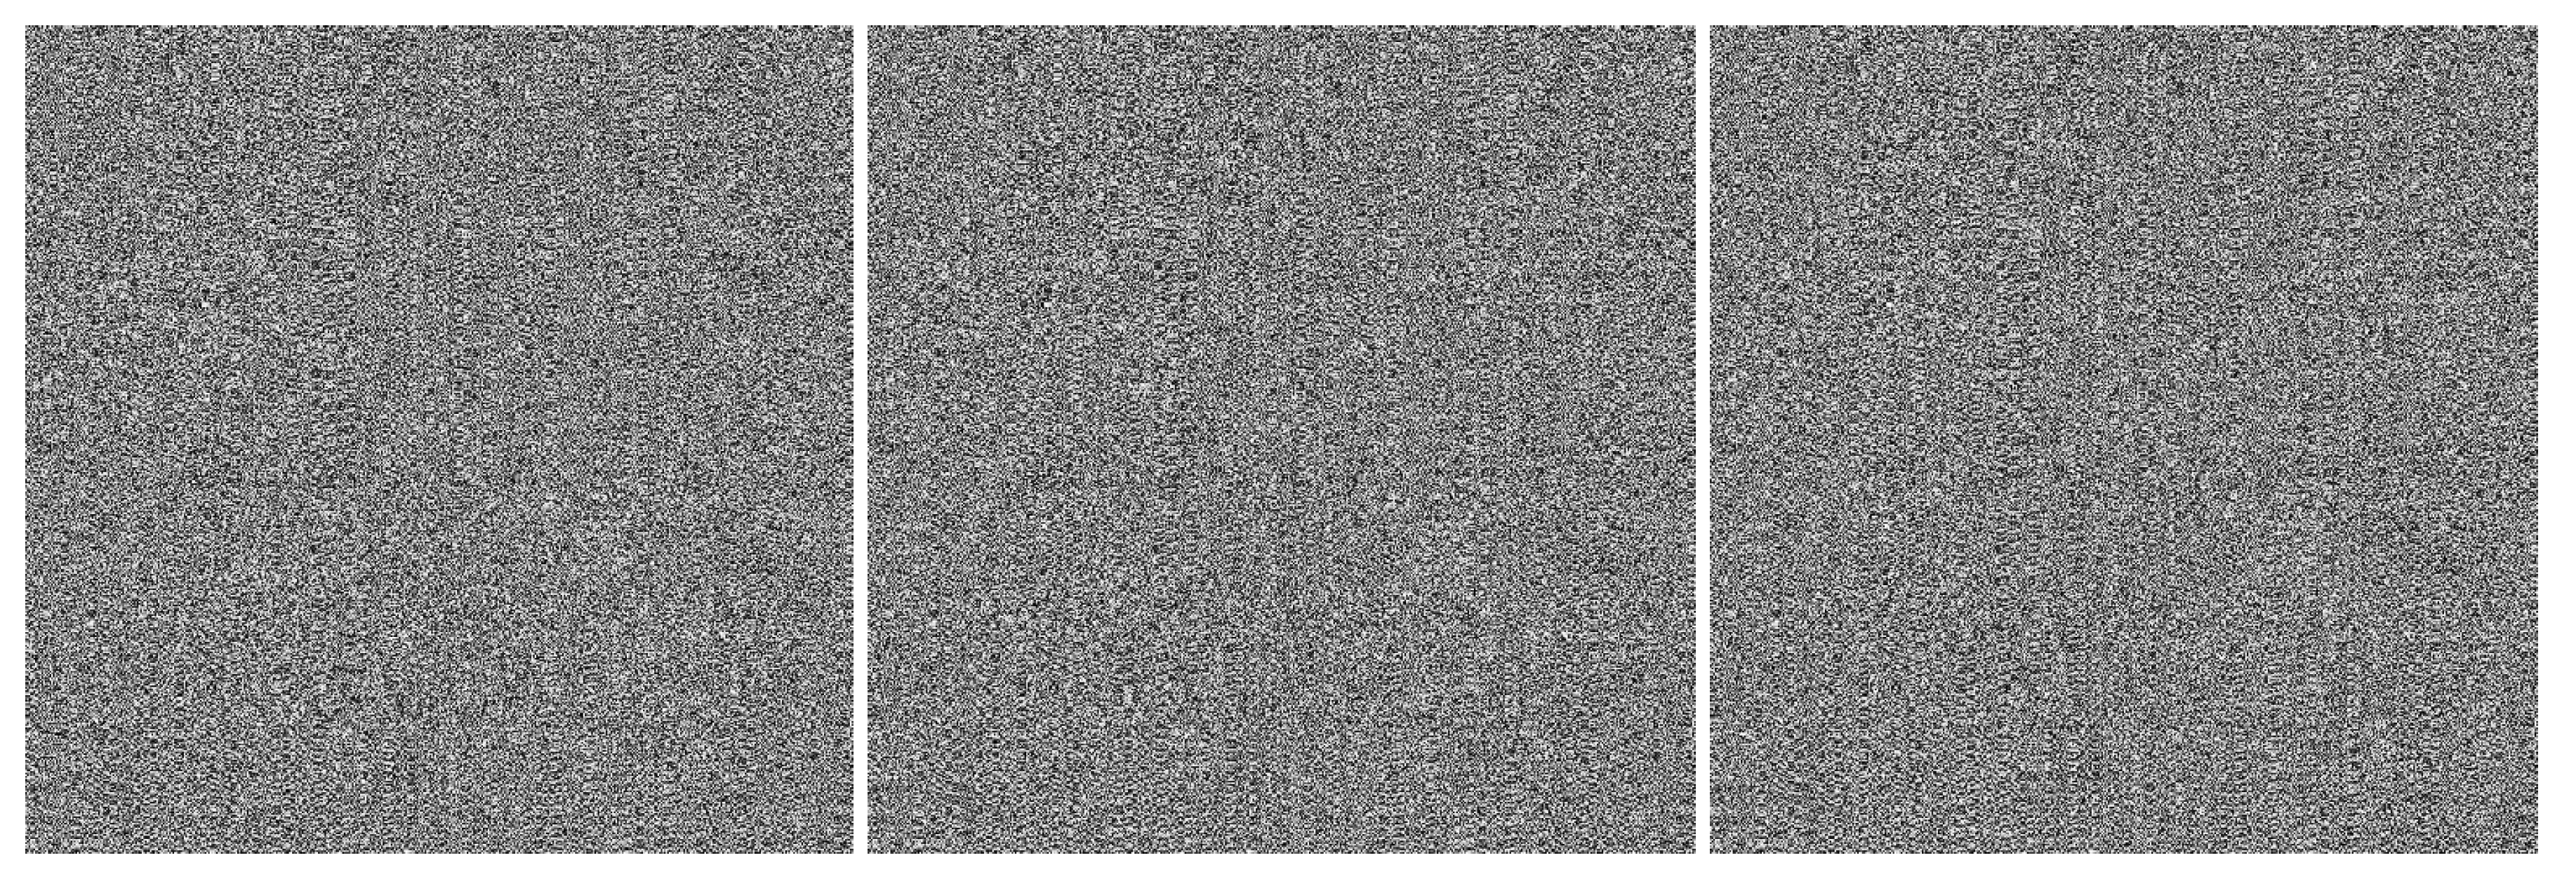
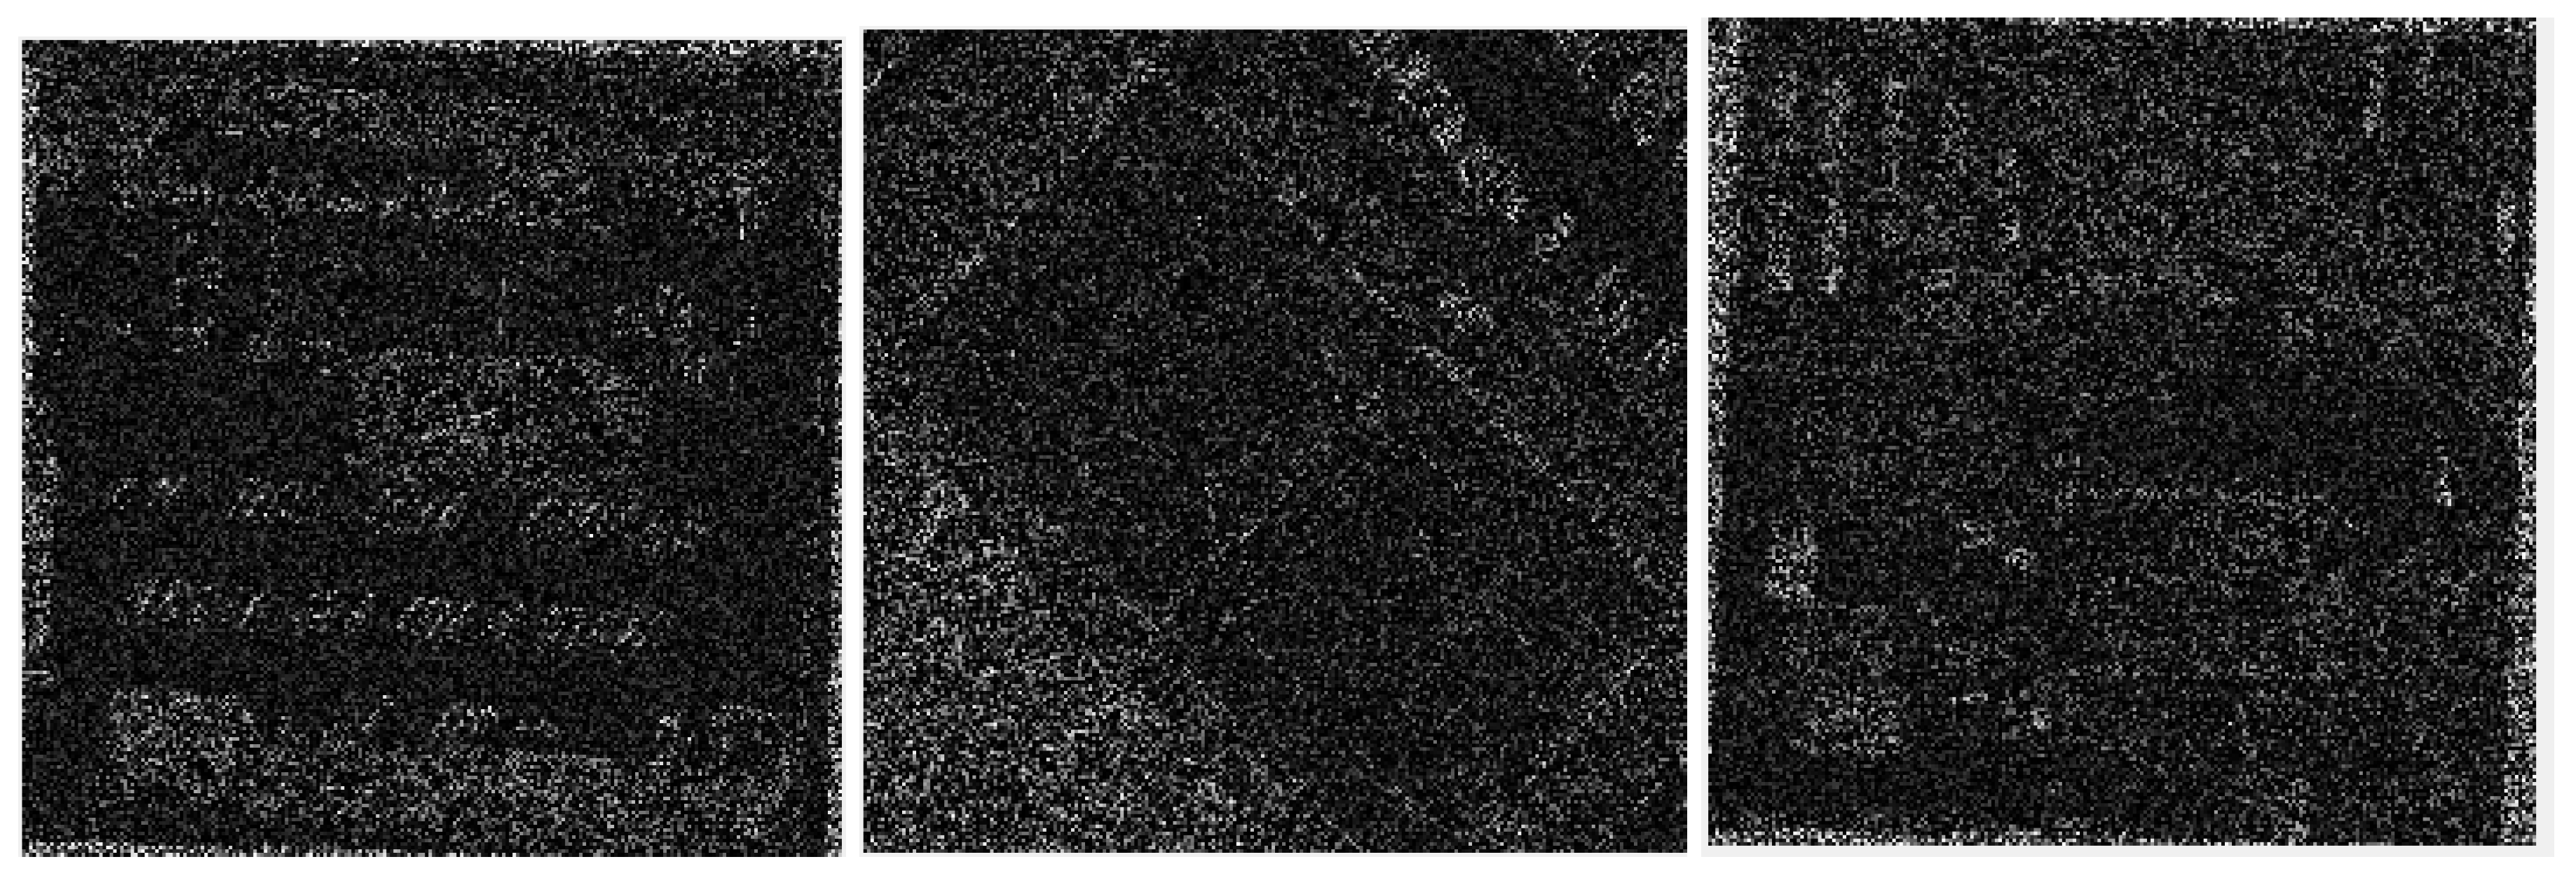
Figure 10.
Aerial view photography 1, encrypted image three layers (R, G, B) of yellow buses using MT method: Each layer size .
Figure 10.
Aerial view photography 1, encrypted image three layers (R, G, B) of yellow buses using MT method: Each layer size .
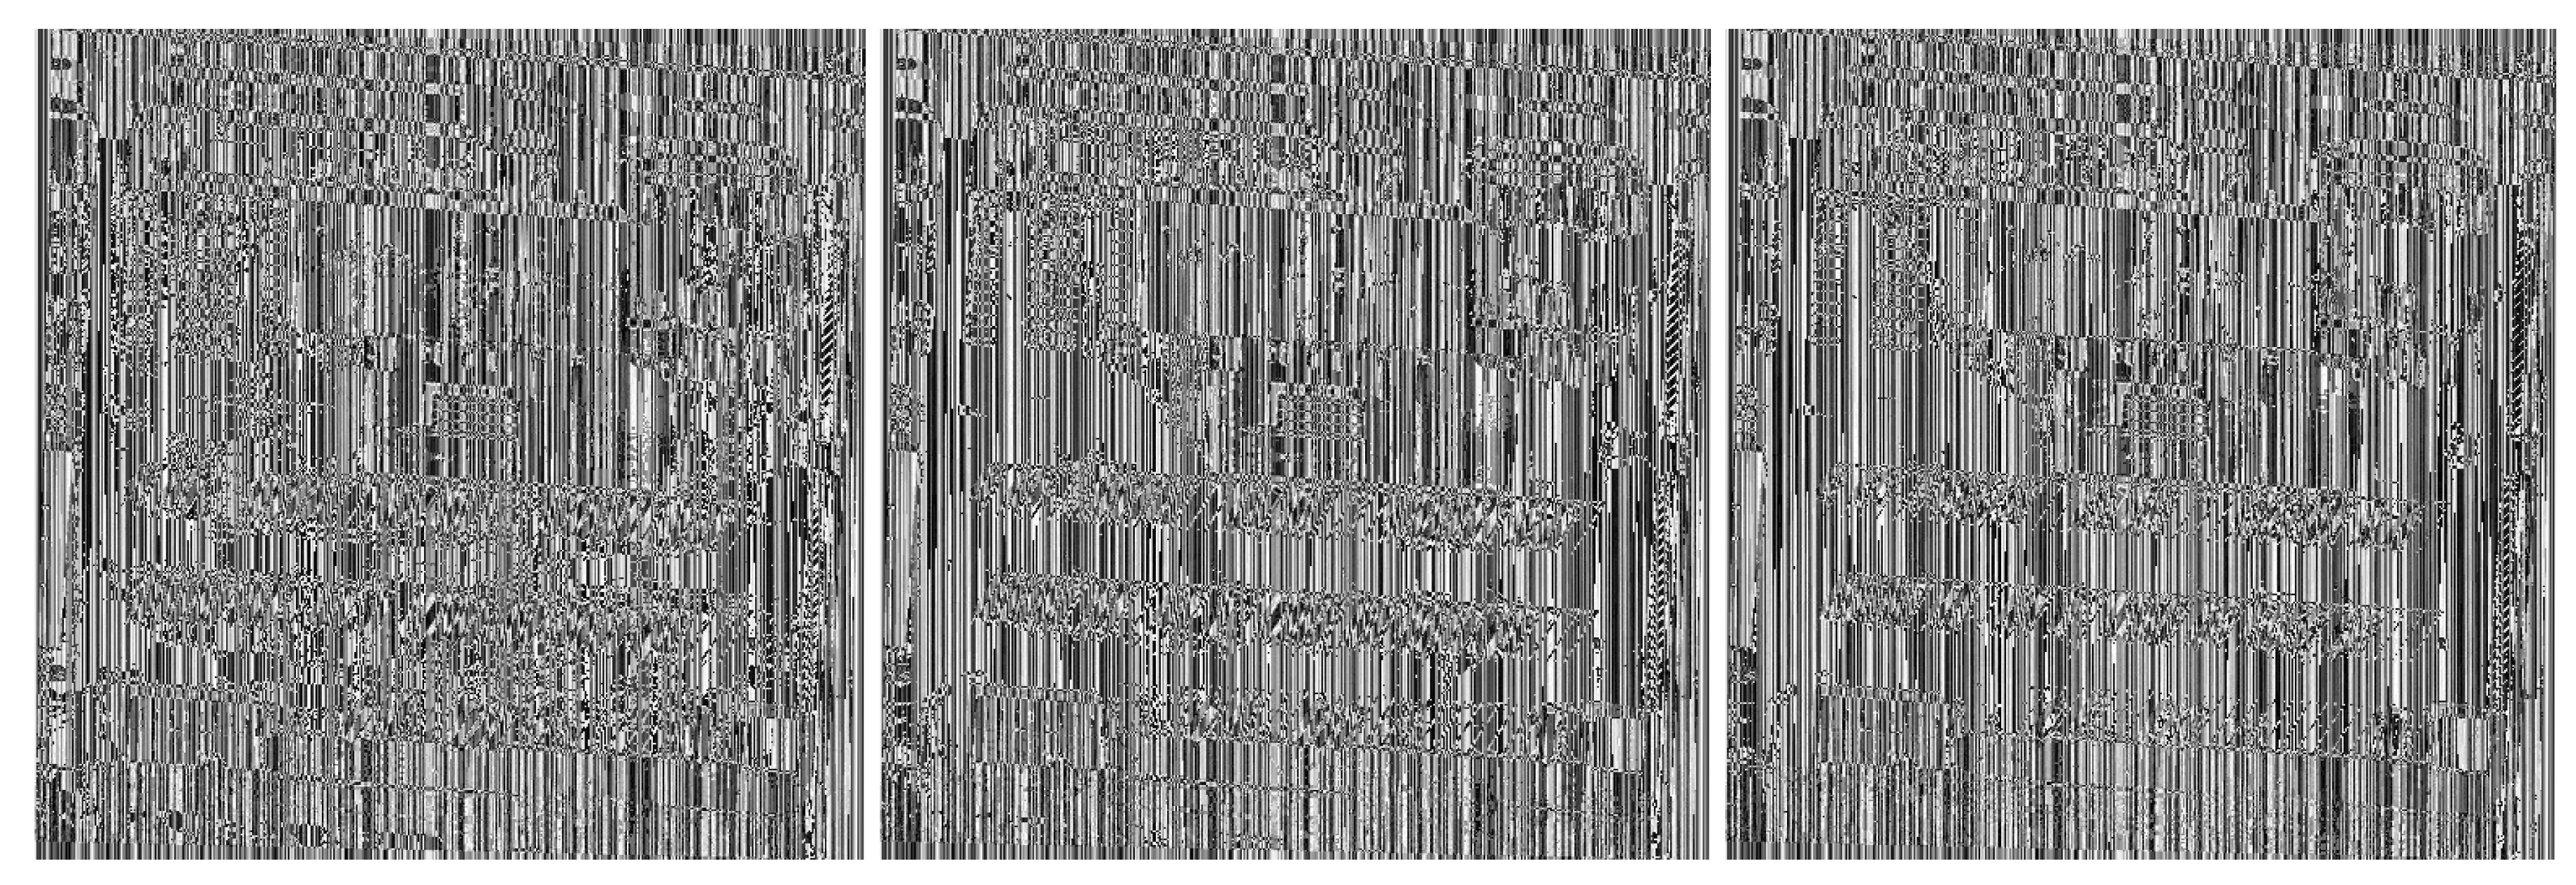
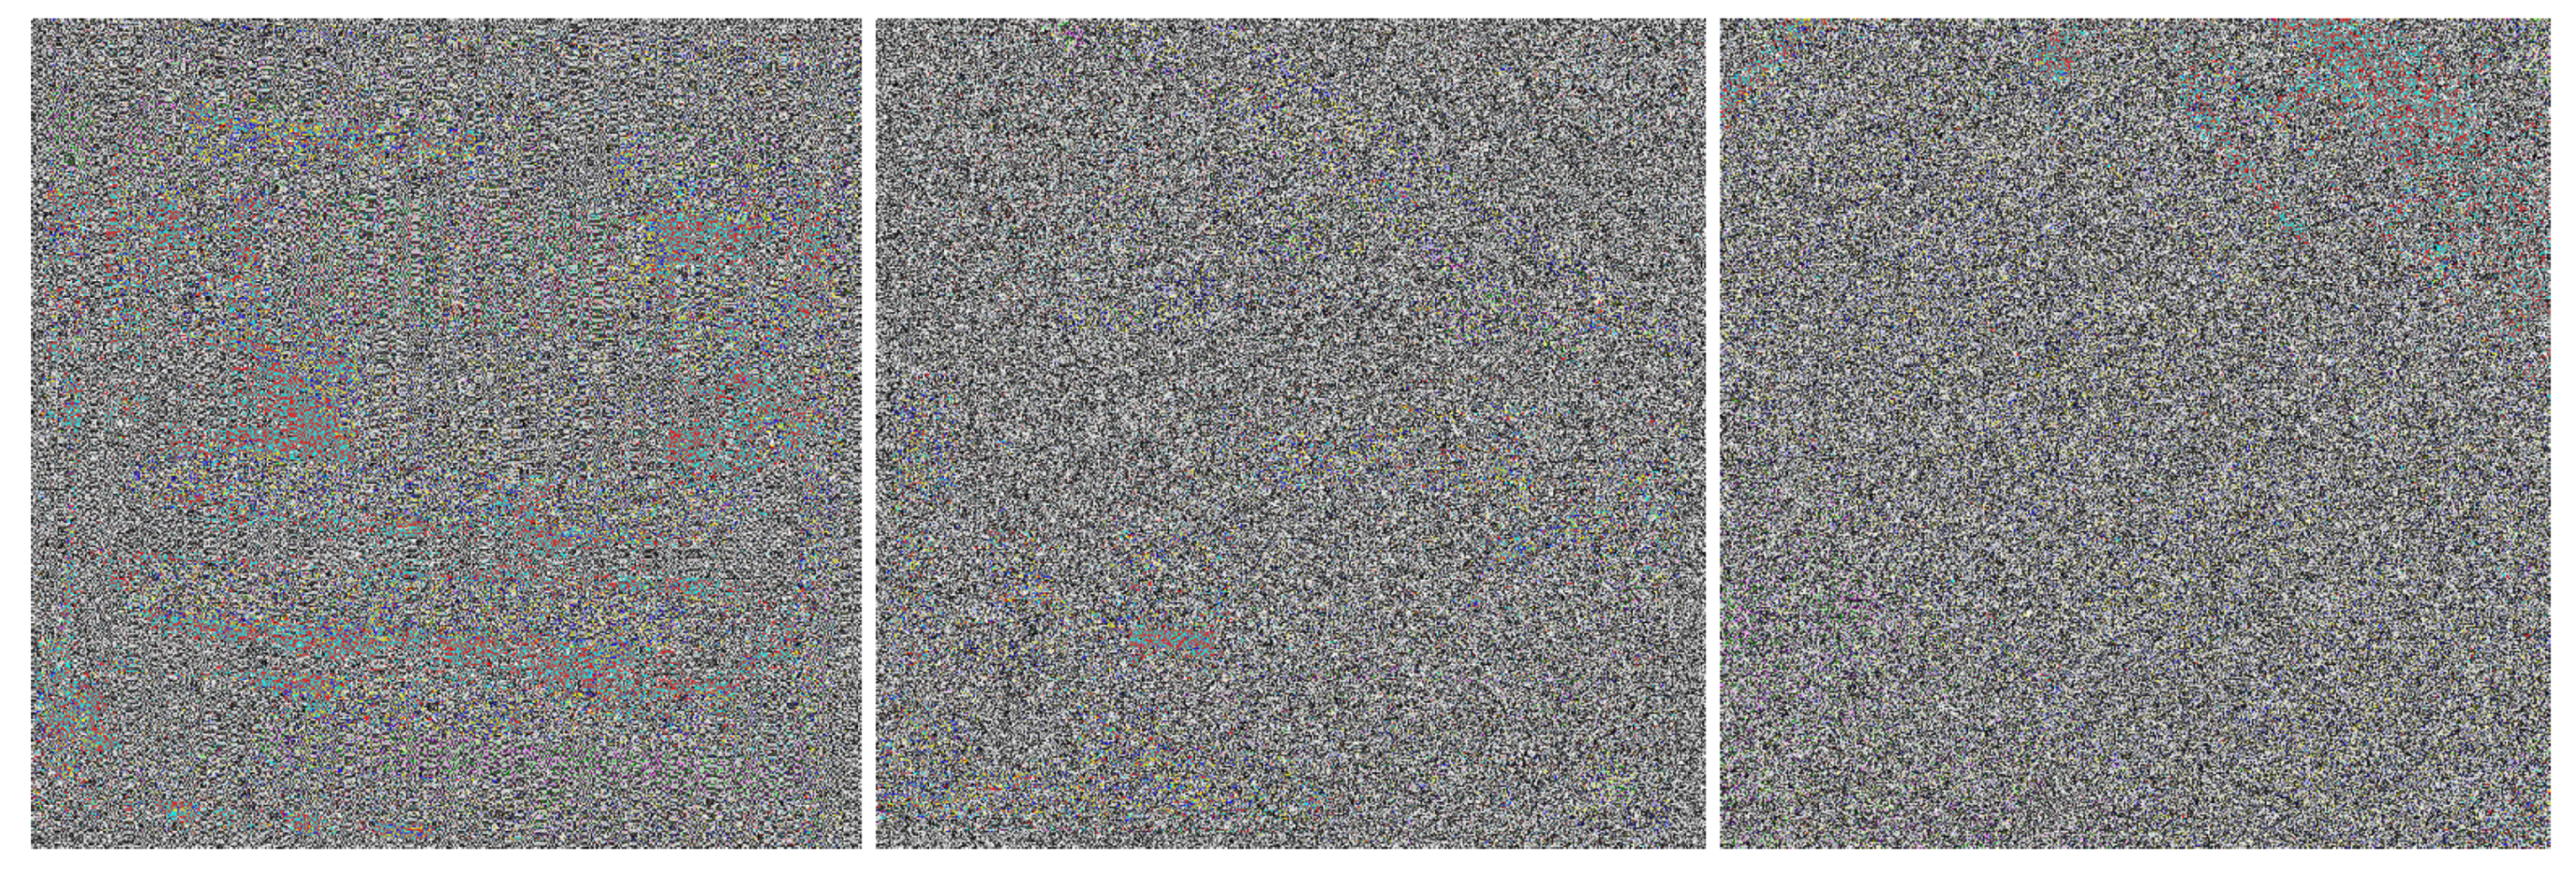
Figure 11.
Aerial view photography 1, encrypted image with three layers (R, G, B) of yellow buses using DNA and Rossler system. Each layer measure .
Figure 11.
Aerial view photography 1, encrypted image with three layers (R, G, B) of yellow buses using DNA and Rossler system. Each layer measure .
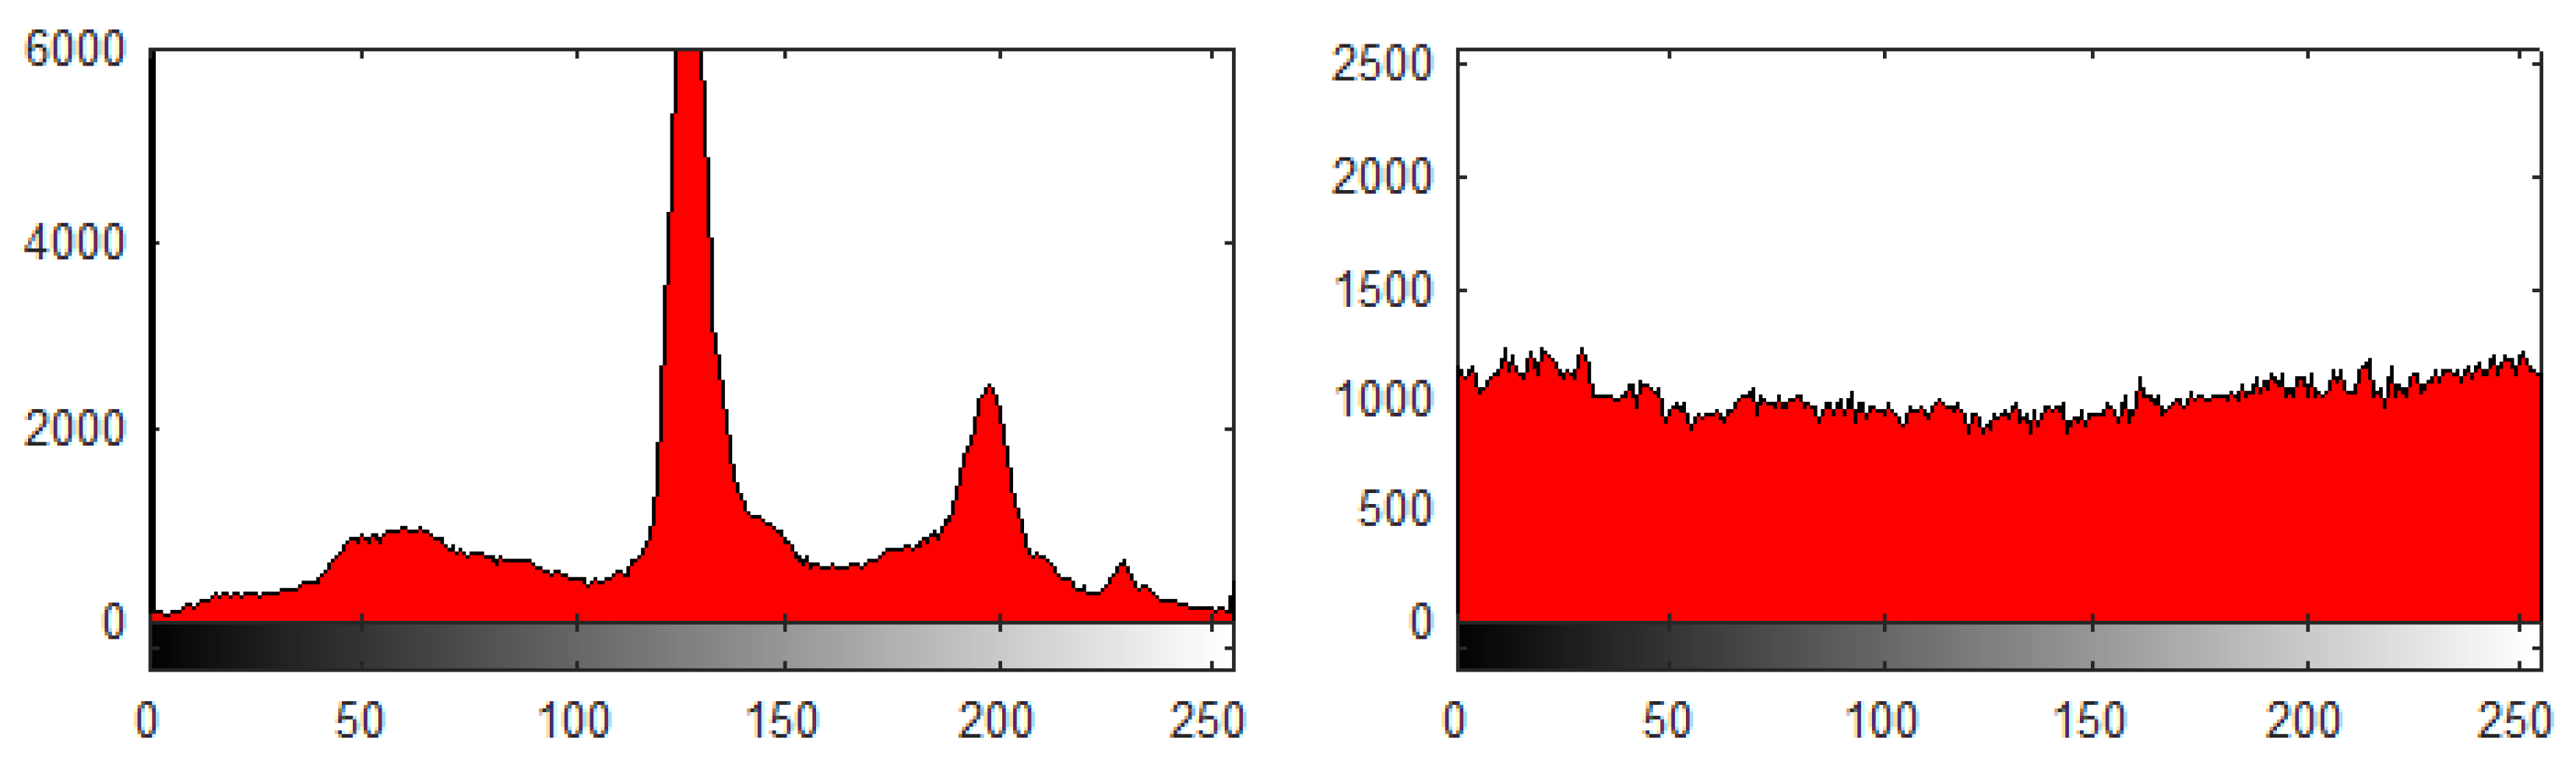
Figure 12.
Red layer using the MT method: plain image (left) and encrypted image (right) histogram.
Figure 12.
Red layer using the MT method: plain image (left) and encrypted image (right) histogram.
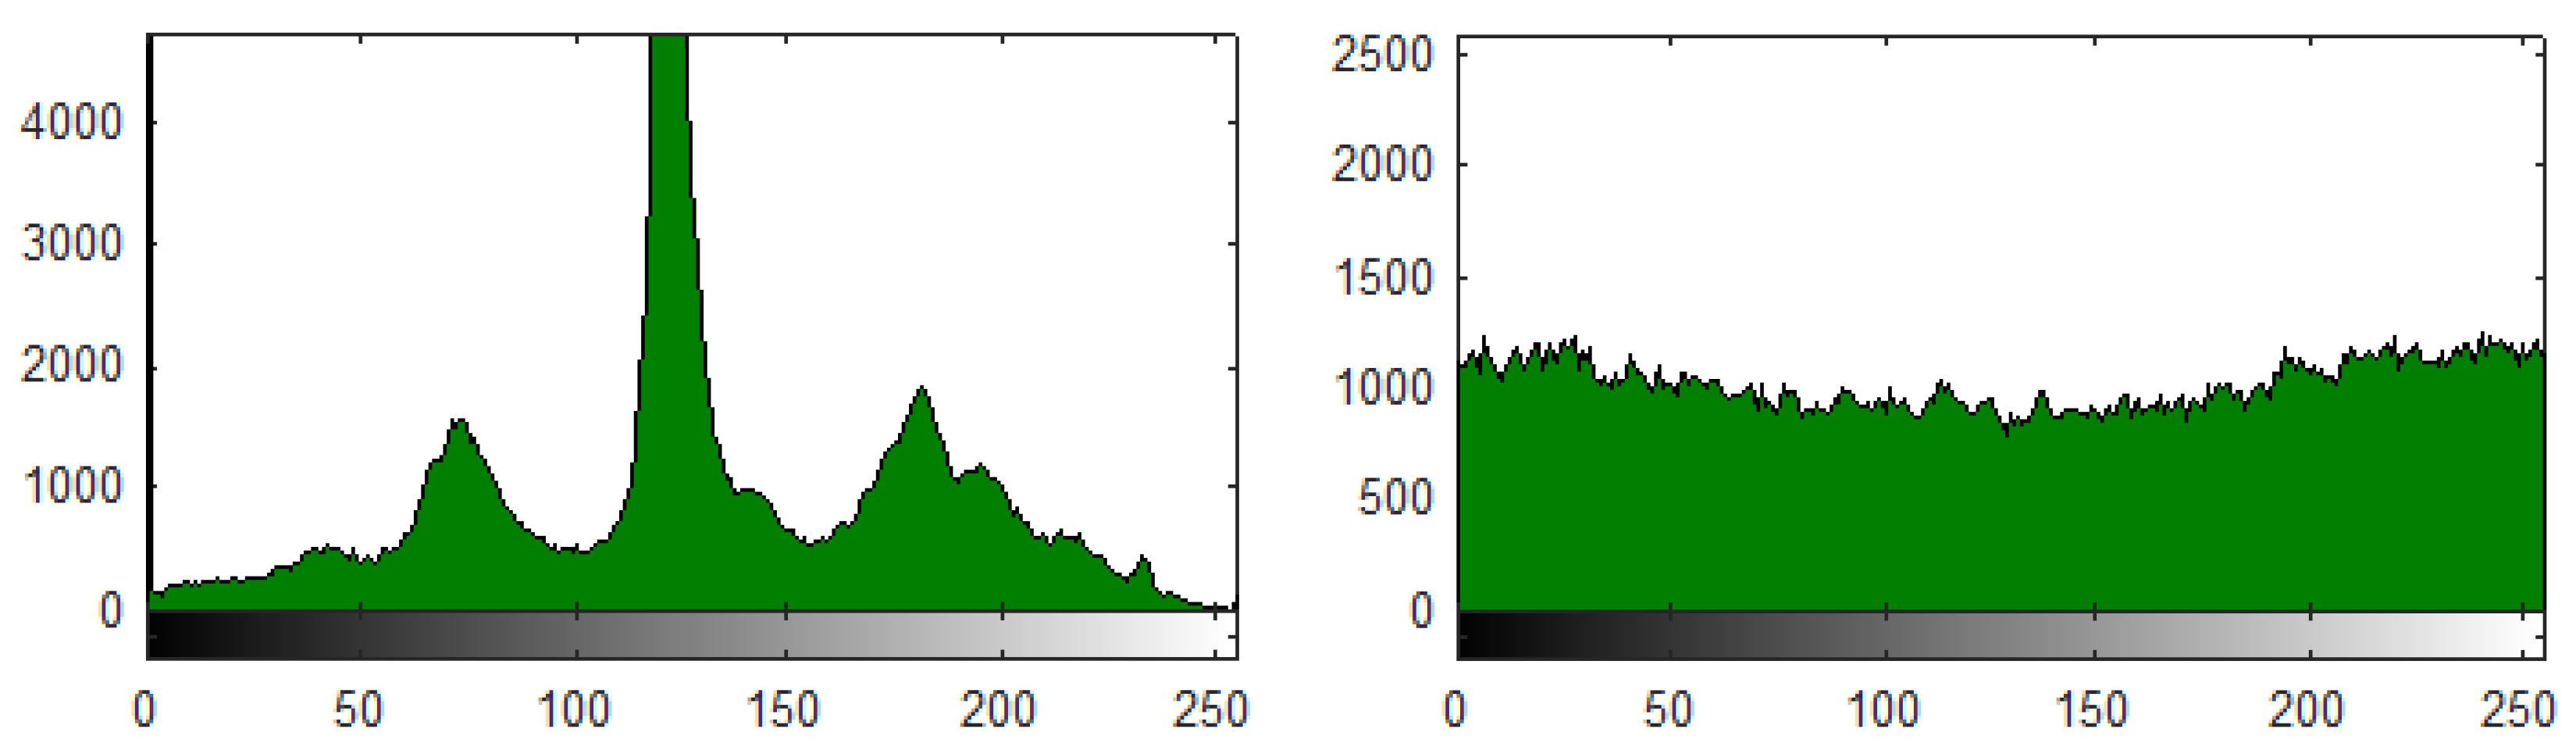
Figure 13.
Green layer using the MT method: plain image (left) and encrypted image (right) histogram.
Figure 13.
Green layer using the MT method: plain image (left) and encrypted image (right) histogram.
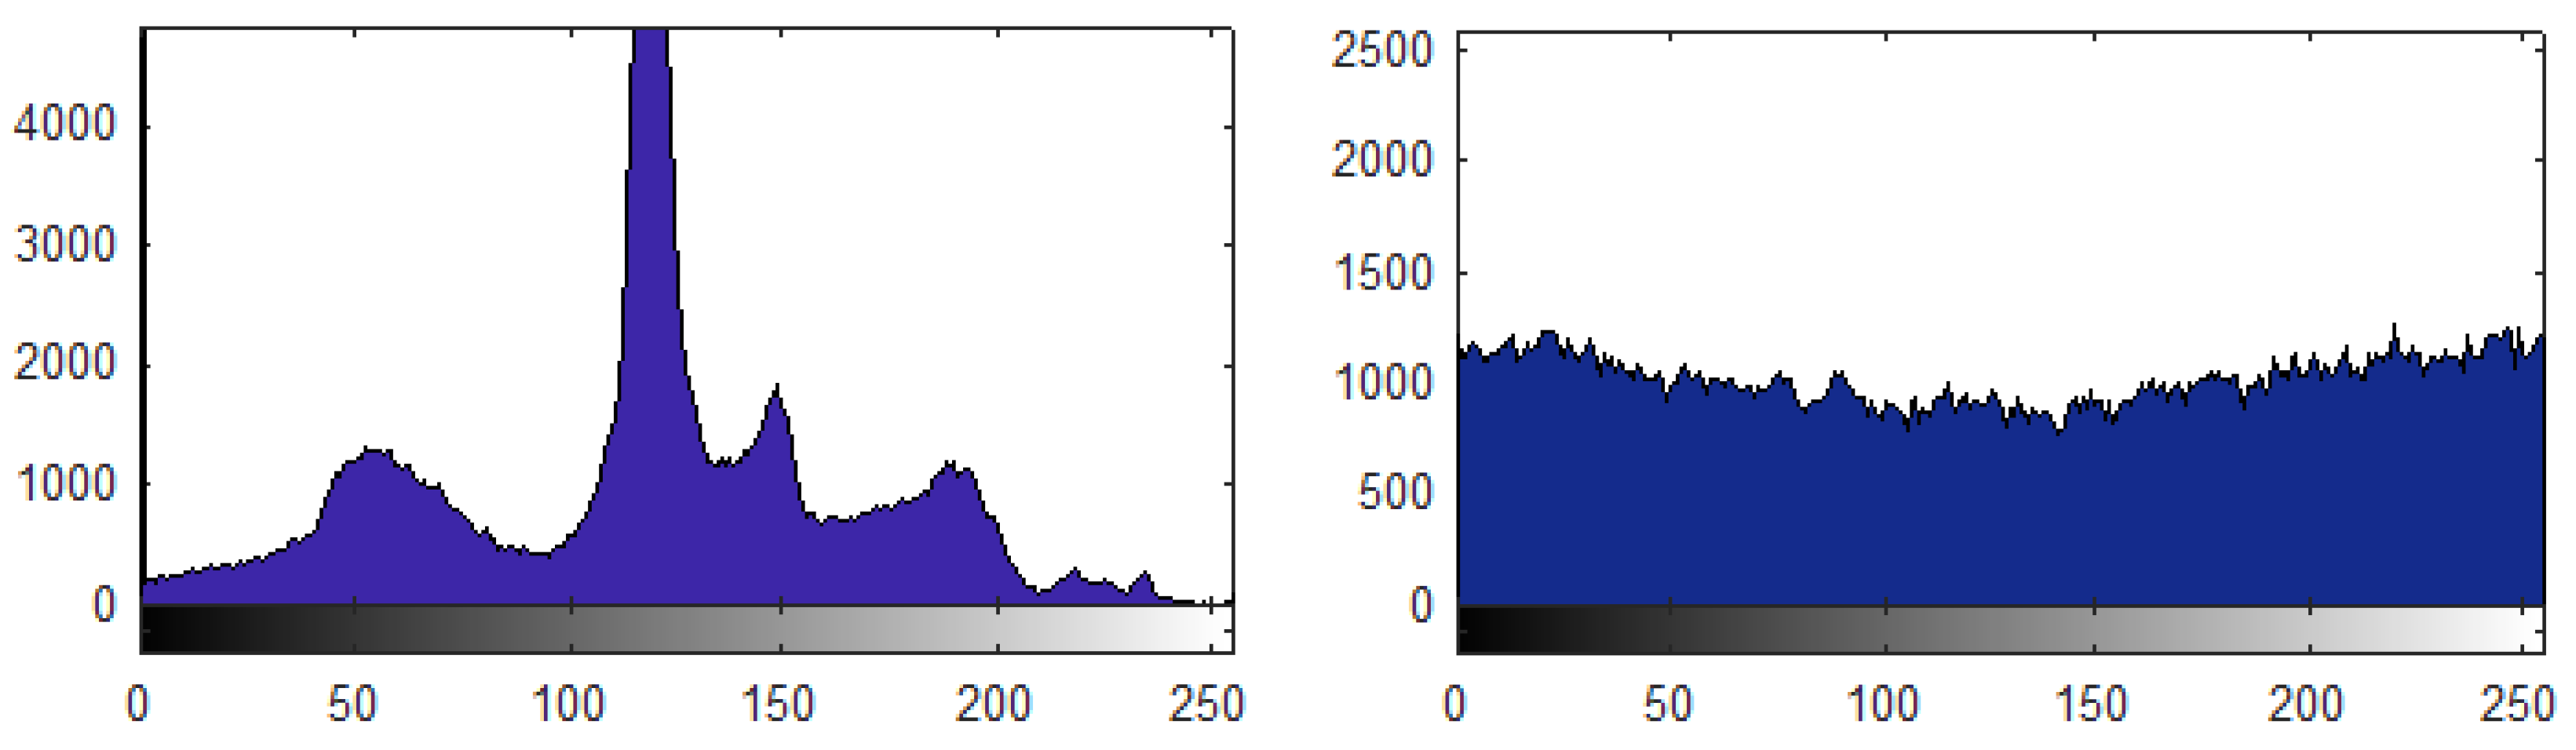
Figure 14.
Blue layer using the MT method: plain image (left) and encrypted image (right) histogram.
Figure 14.
Blue layer using the MT method: plain image (left) and encrypted image (right) histogram.
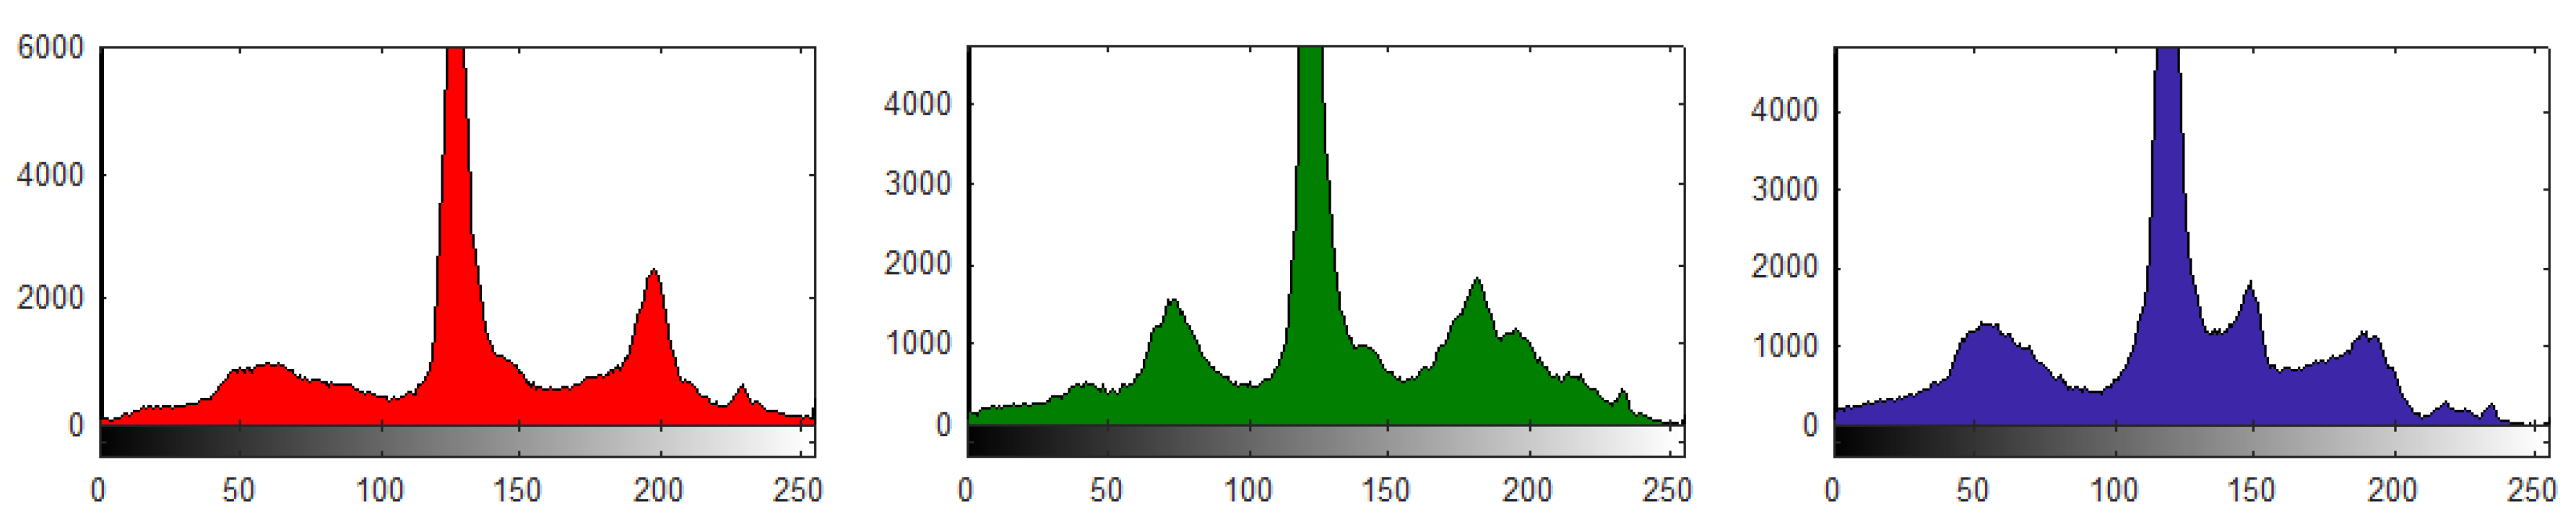
Figure 15.
Aerial view photography 1, plain image three layers (R, G, B) of yellow buses measuring . Each histogram alone measures .
Figure 15.
Aerial view photography 1, plain image three layers (R, G, B) of yellow buses measuring . Each histogram alone measures .
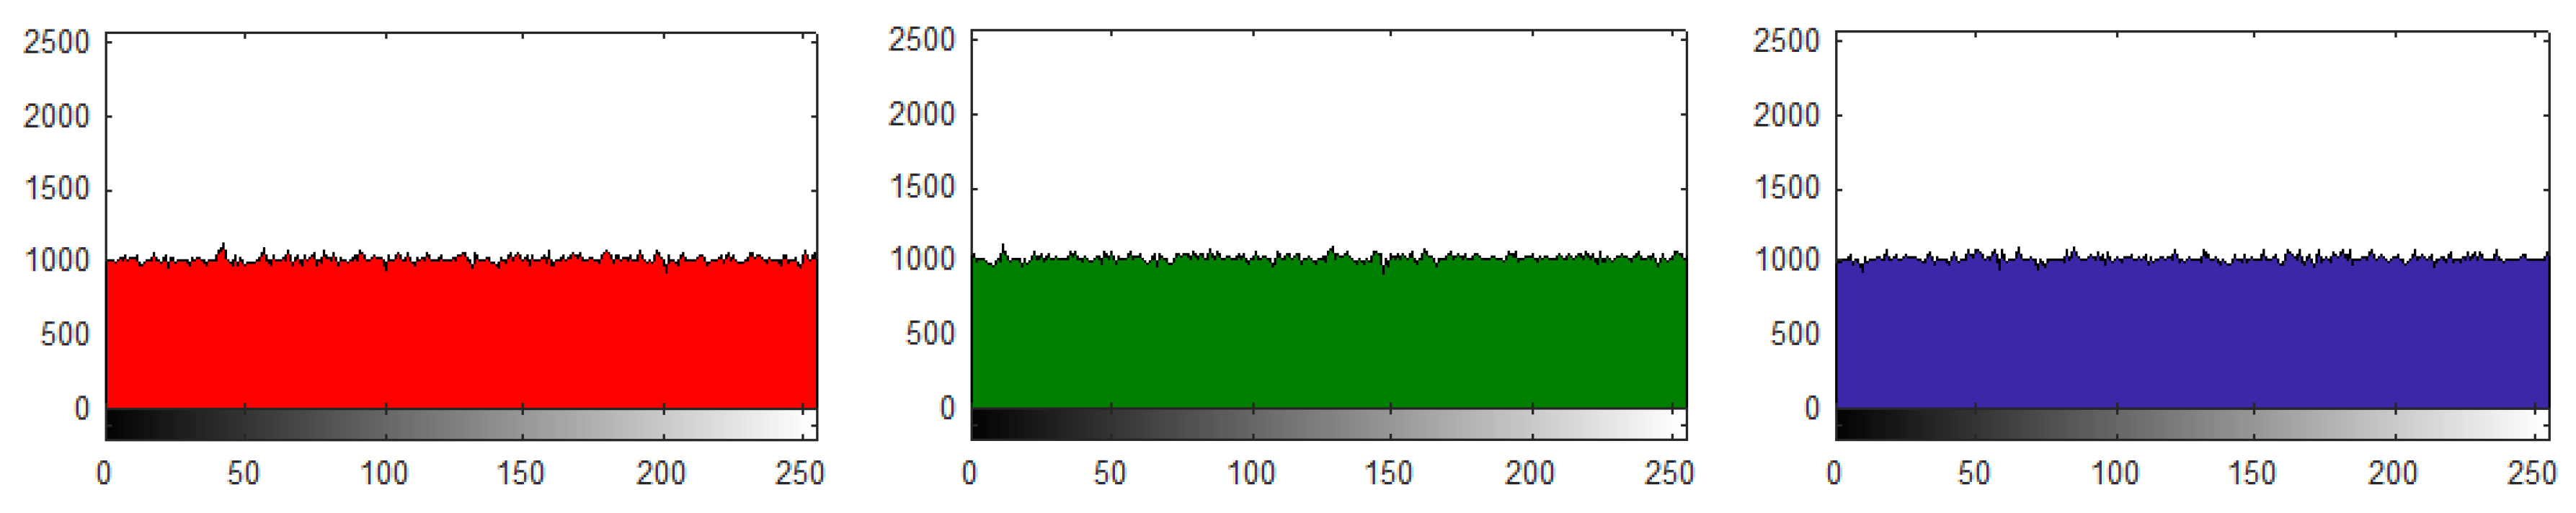
Figure 16.
Aerial view photography 1, encrypted image with three layers (R, G, B) of yellow buses measuring . Each histogram alone measures .
Figure 16.
Aerial view photography 1, encrypted image with three layers (R, G, B) of yellow buses measuring . Each histogram alone measures .
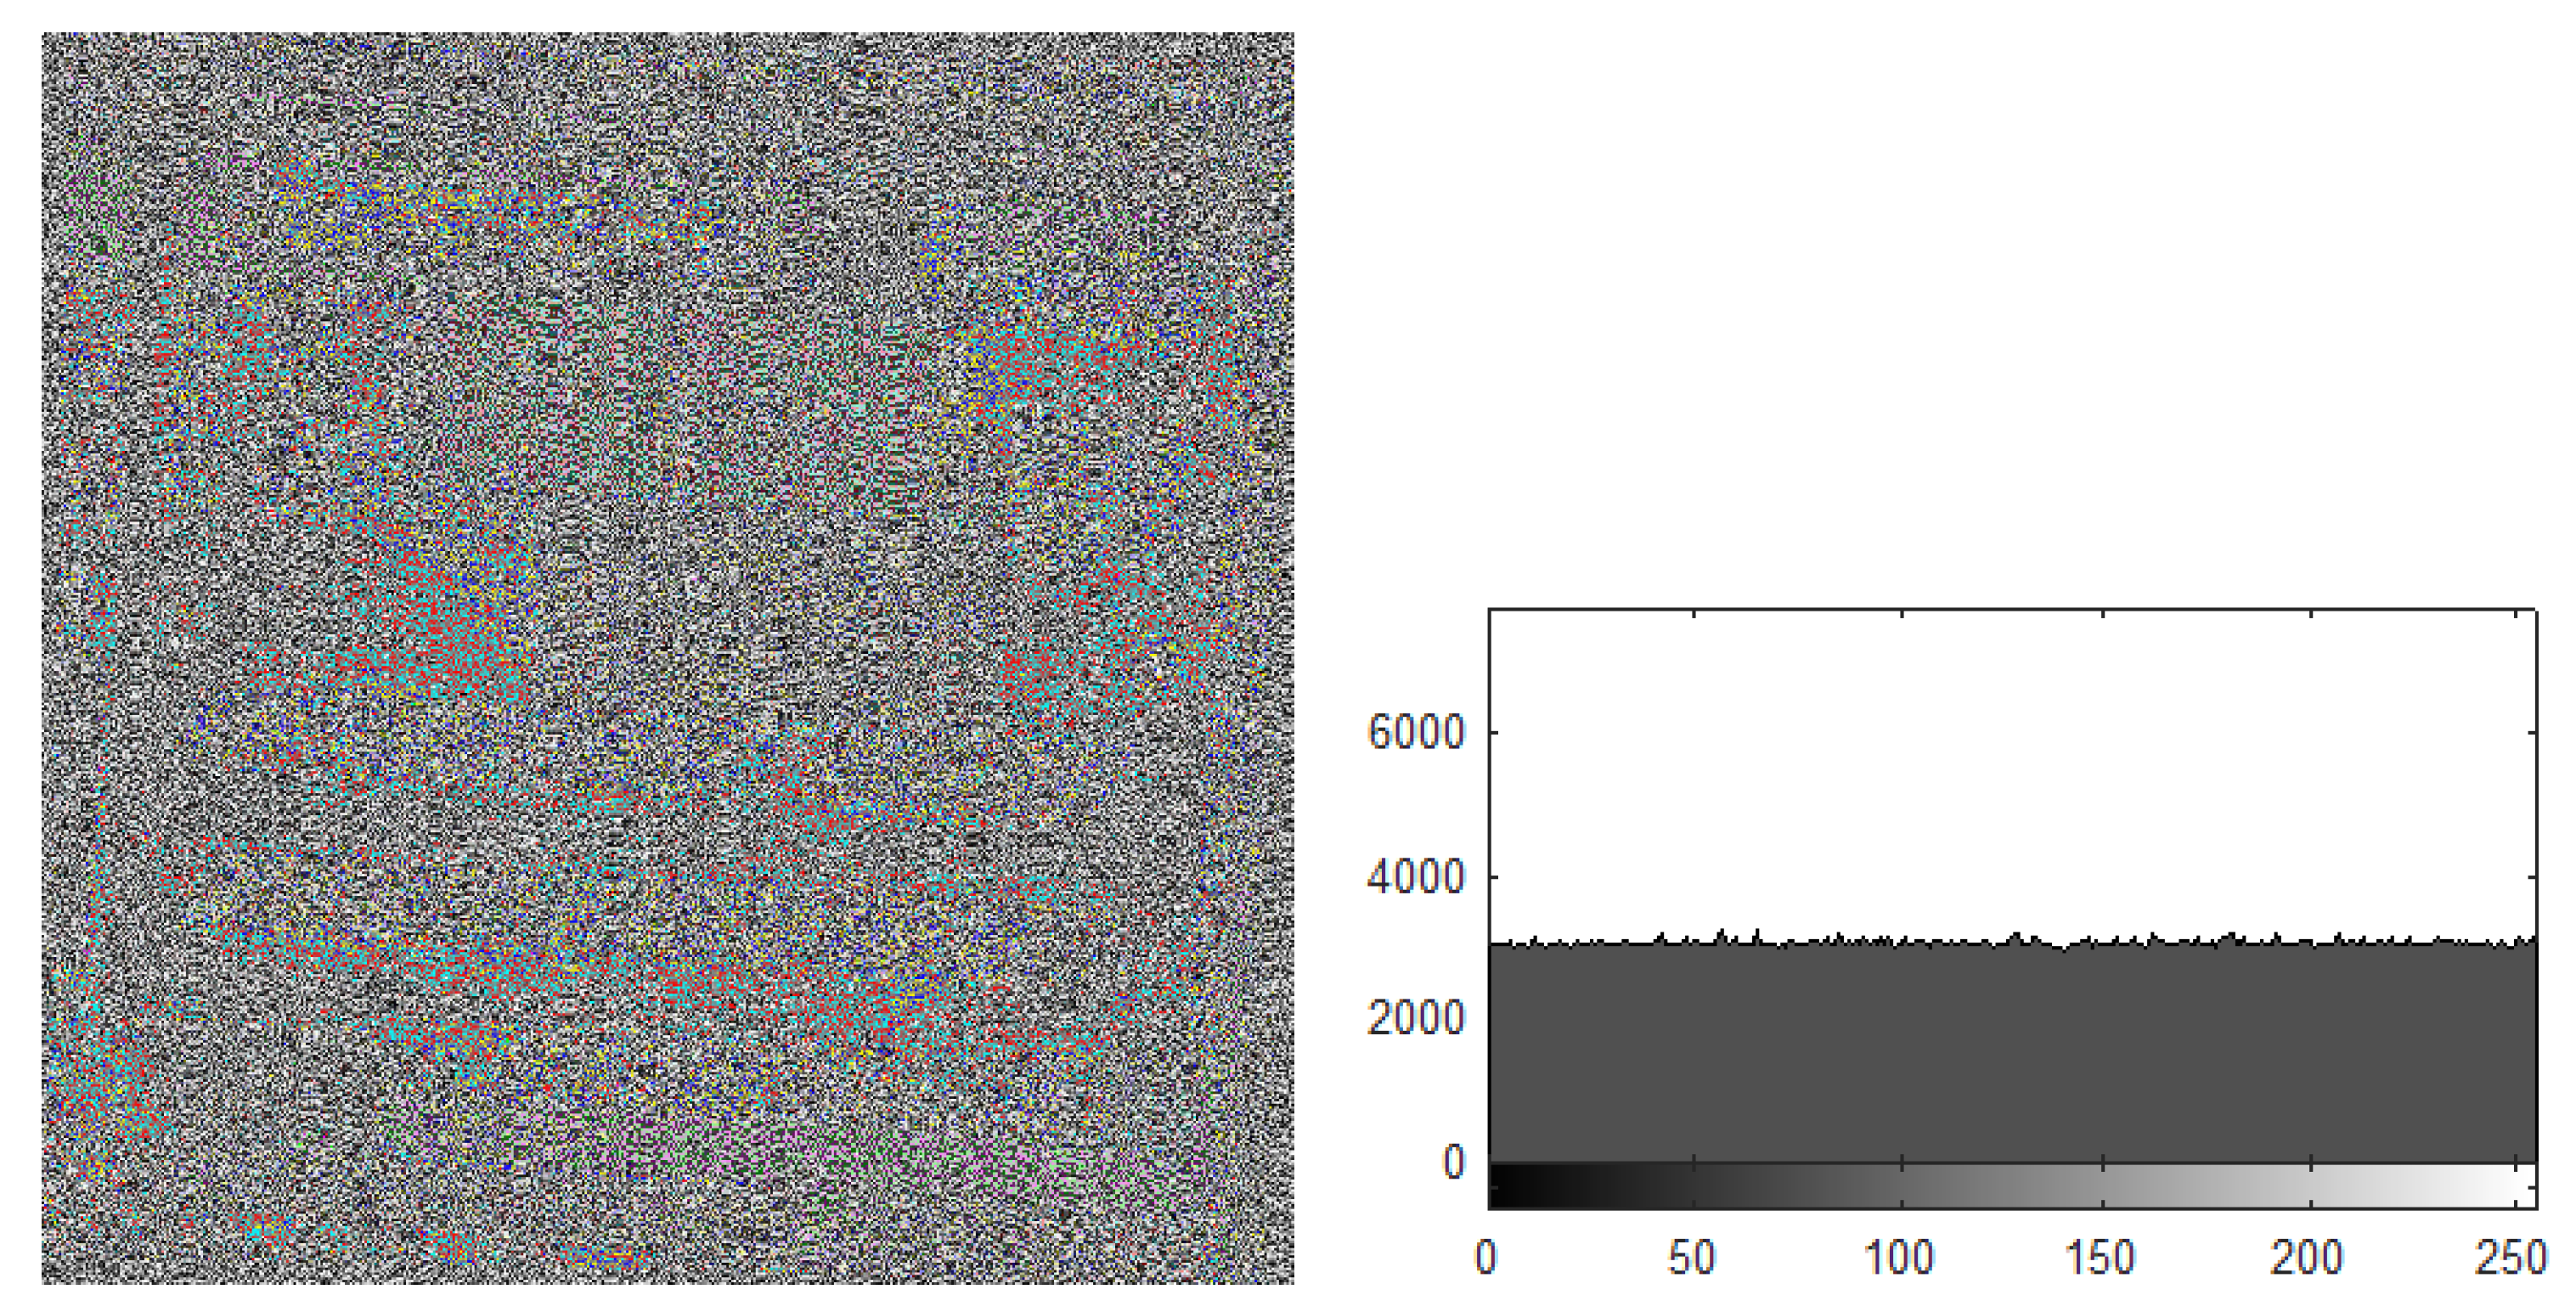
Figure 17.
Aerial view photography 1, colored encrypted image of yellow buses measuring and its respective histogram.
Figure 17.
Aerial view photography 1, colored encrypted image of yellow buses measuring and its respective histogram.
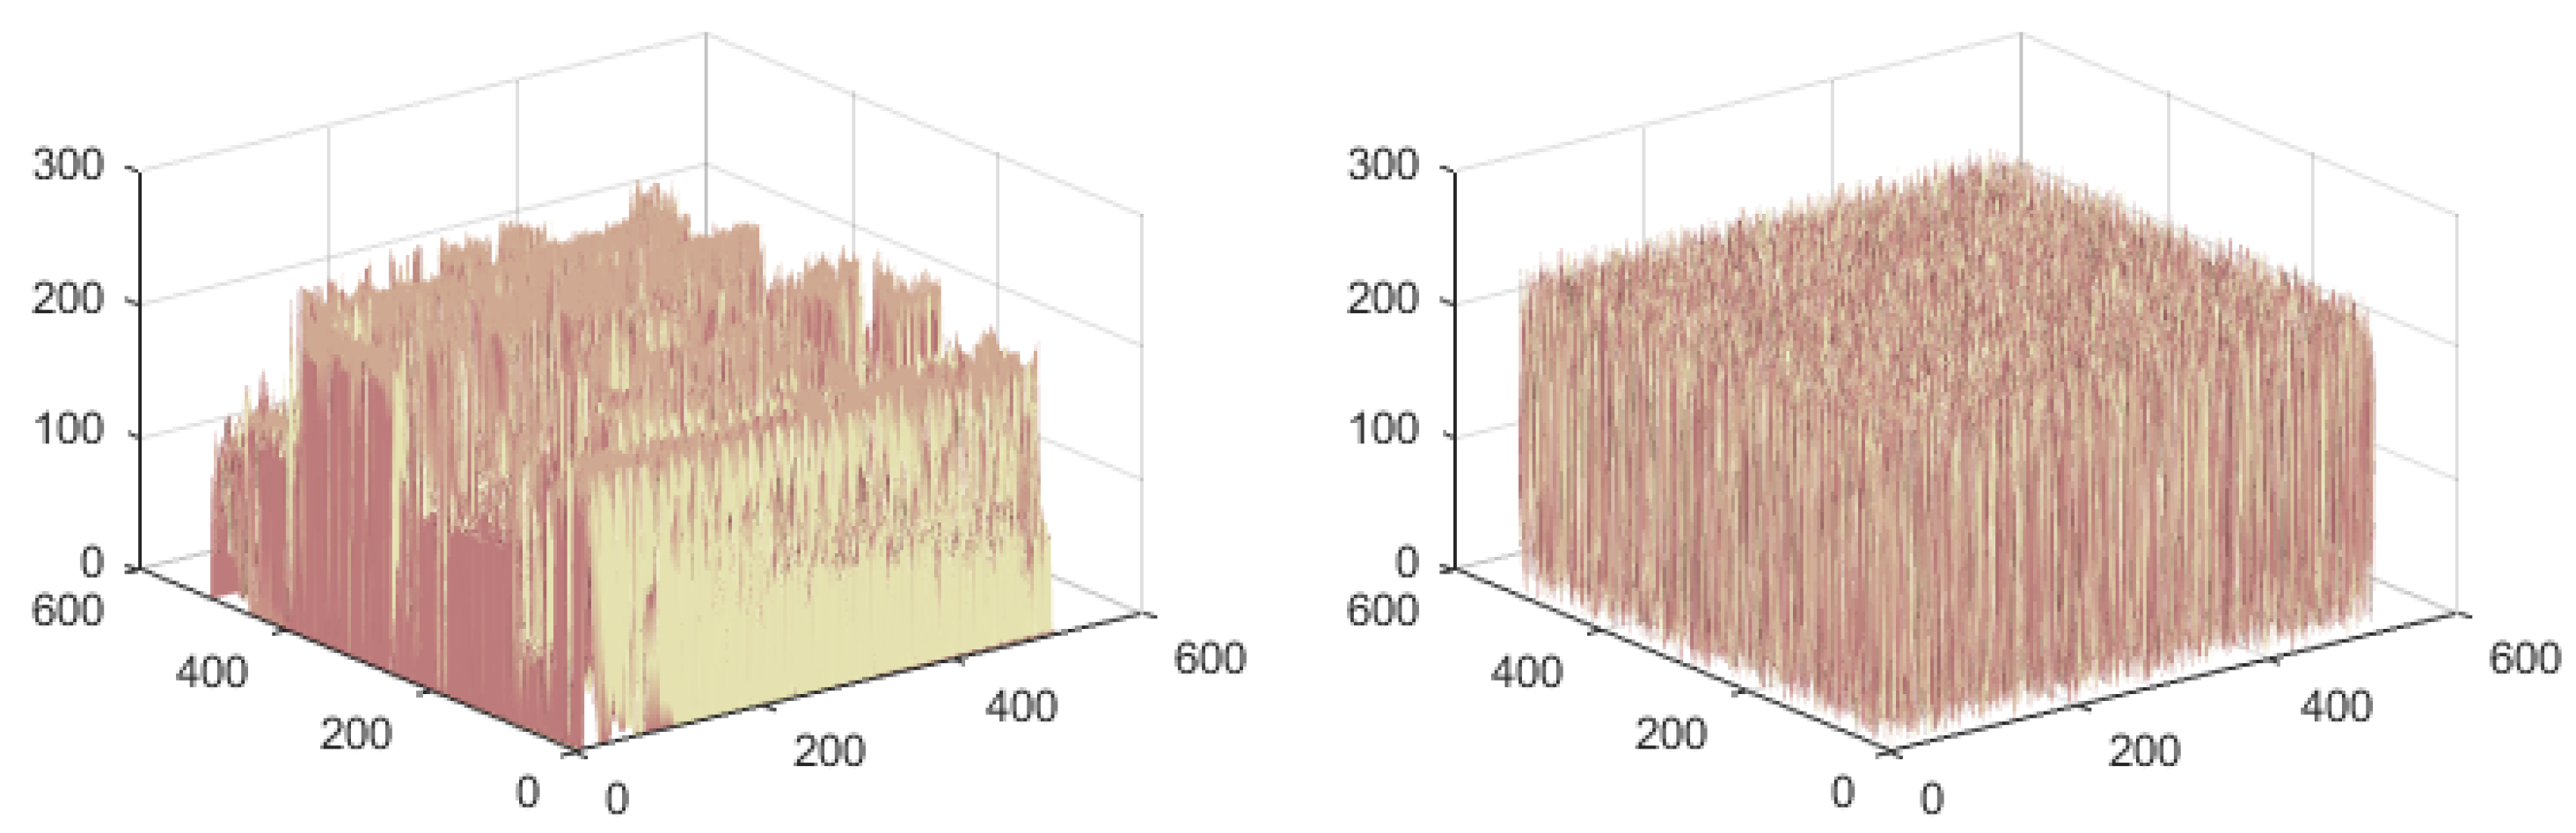
Figure 18.
Aerial view photography 1, red layer 3D surface histogram with plain image (left) and encrypted counterpart (right).
Figure 18.
Aerial view photography 1, red layer 3D surface histogram with plain image (left) and encrypted counterpart (right).
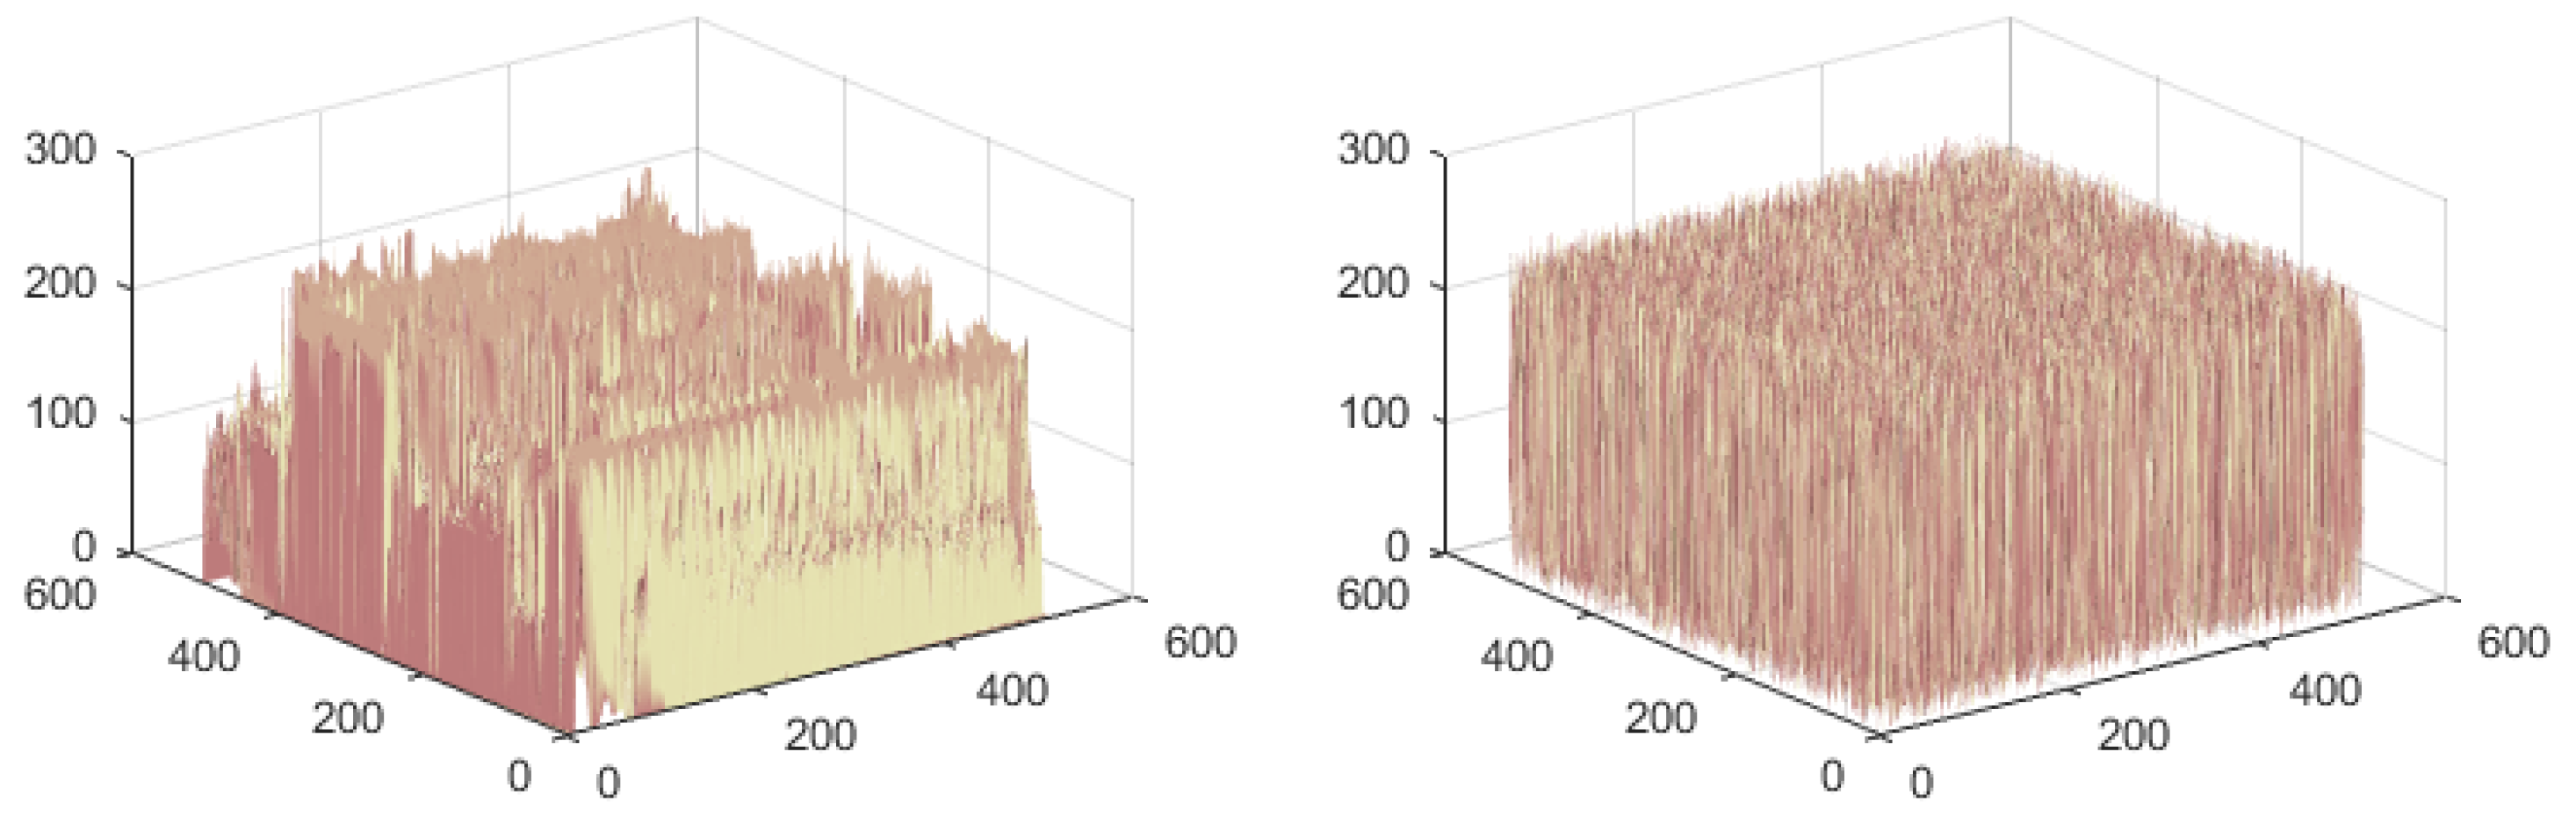
Figure 19.
Aerial view photography 1, green layer 3D surface histogram with plain image (left) and encrypted counterpart (right).
Figure 19.
Aerial view photography 1, green layer 3D surface histogram with plain image (left) and encrypted counterpart (right).
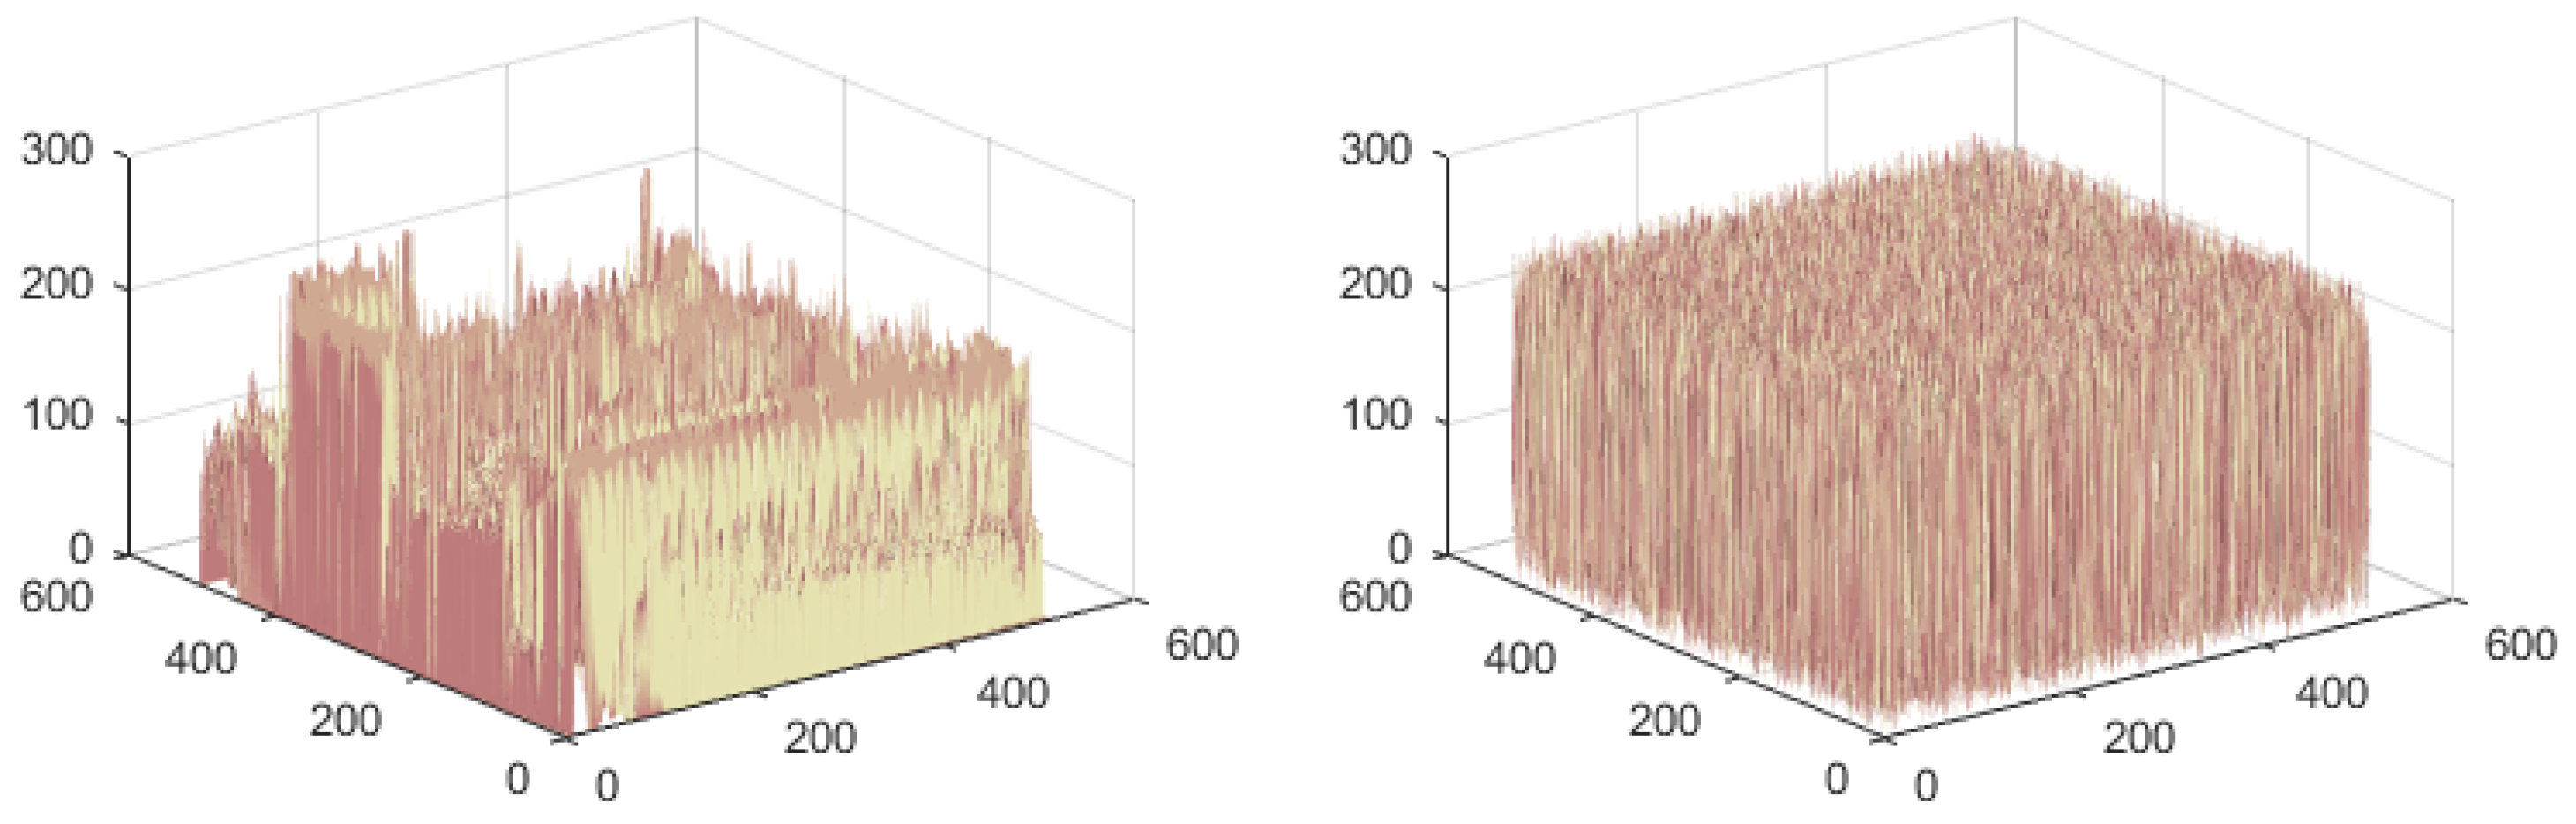
Figure 20.
Aerial view photography 1, blue layer 3D surface histogram with plain image (left) and encrypted counterpart (right).
Figure 20.
Aerial view photography 1, blue layer 3D surface histogram with plain image (left) and encrypted counterpart (right).
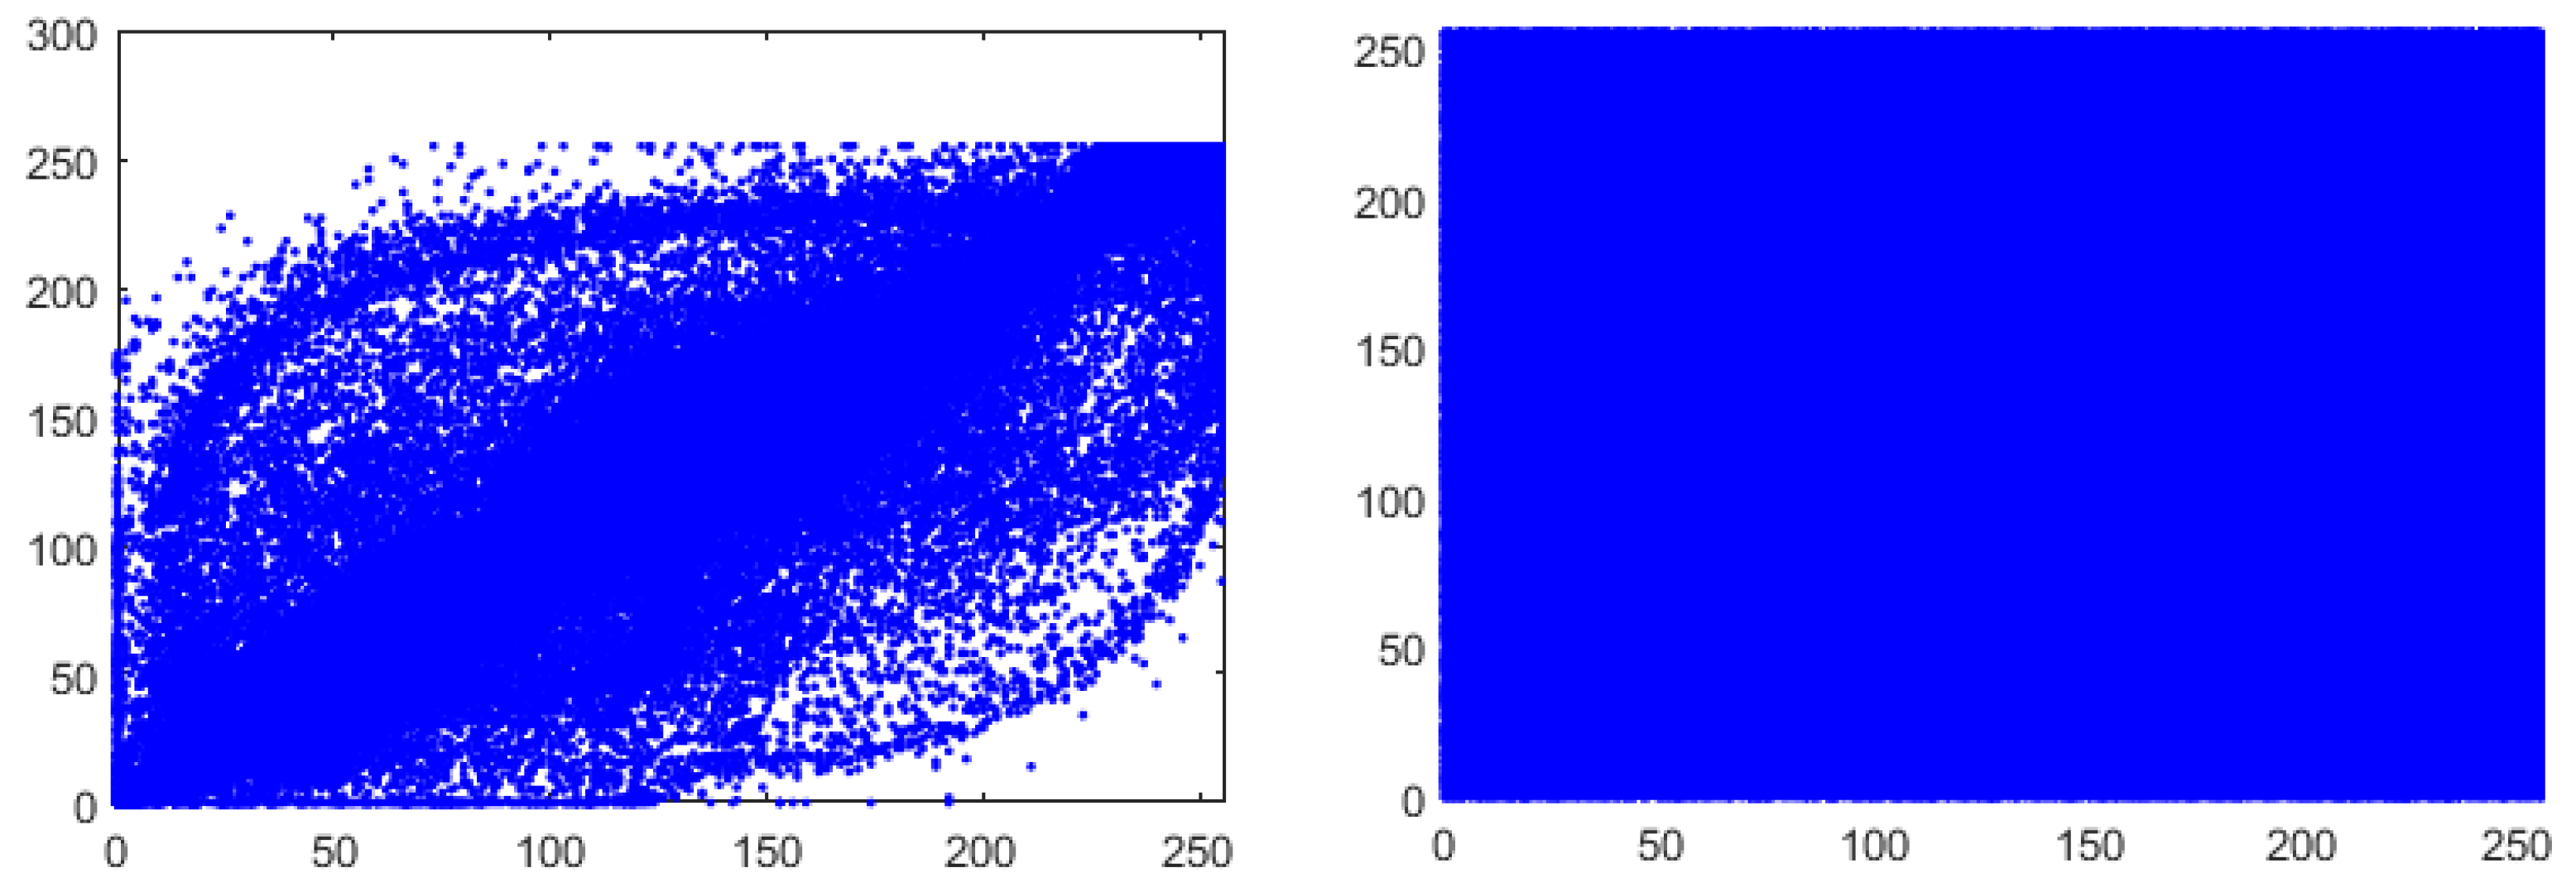
Figure 21.
Correlation coefficient: Aerial view photography 1, plain (left) and encrypted (right) image pixels in horizontal view.
Figure 21.
Correlation coefficient: Aerial view photography 1, plain (left) and encrypted (right) image pixels in horizontal view.
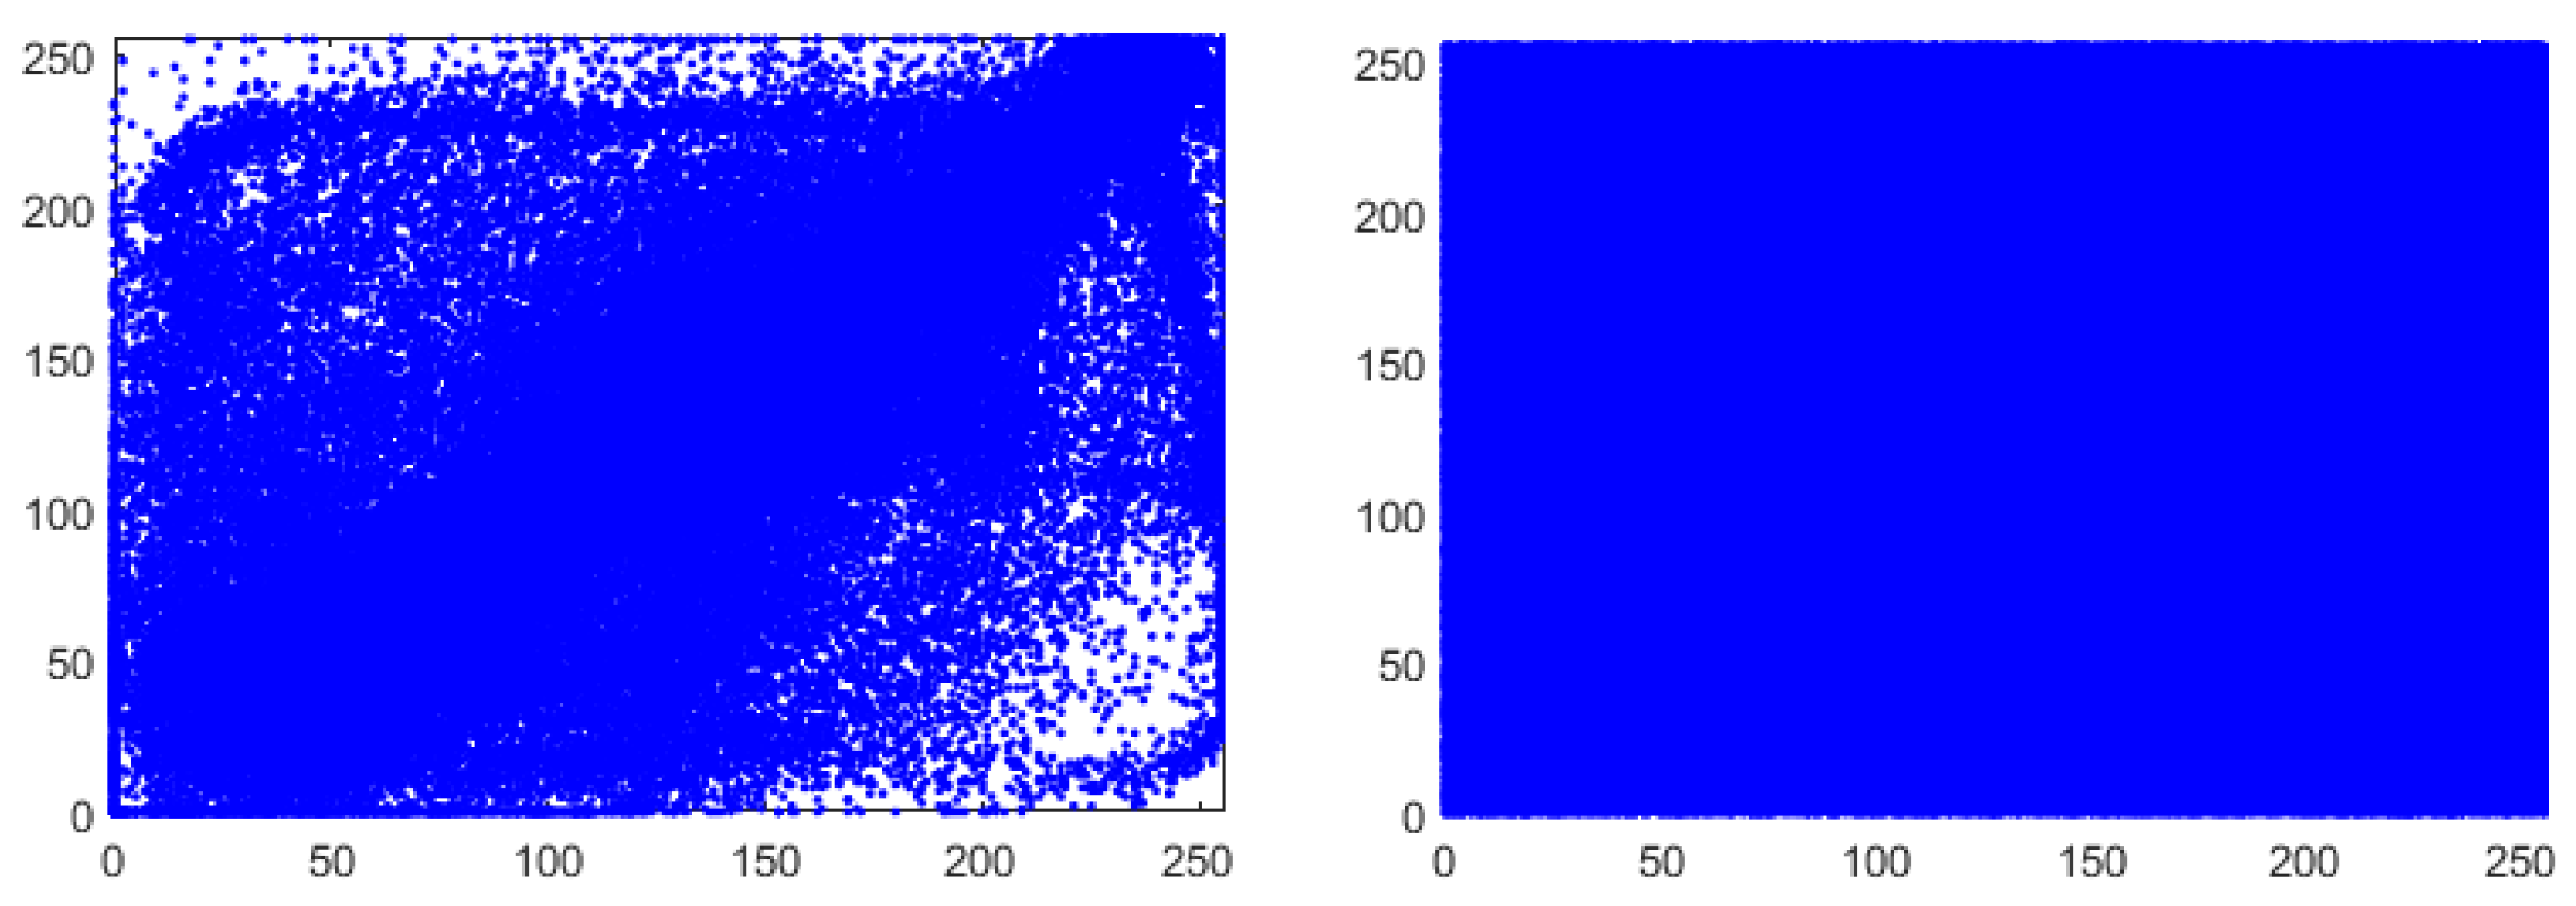
Figure 22.
Correlation coefficient: Aerial view photography 1, plain (left) and encrypted (right) image pixels in diagonal view.
Figure 22.
Correlation coefficient: Aerial view photography 1, plain (left) and encrypted (right) image pixels in diagonal view.
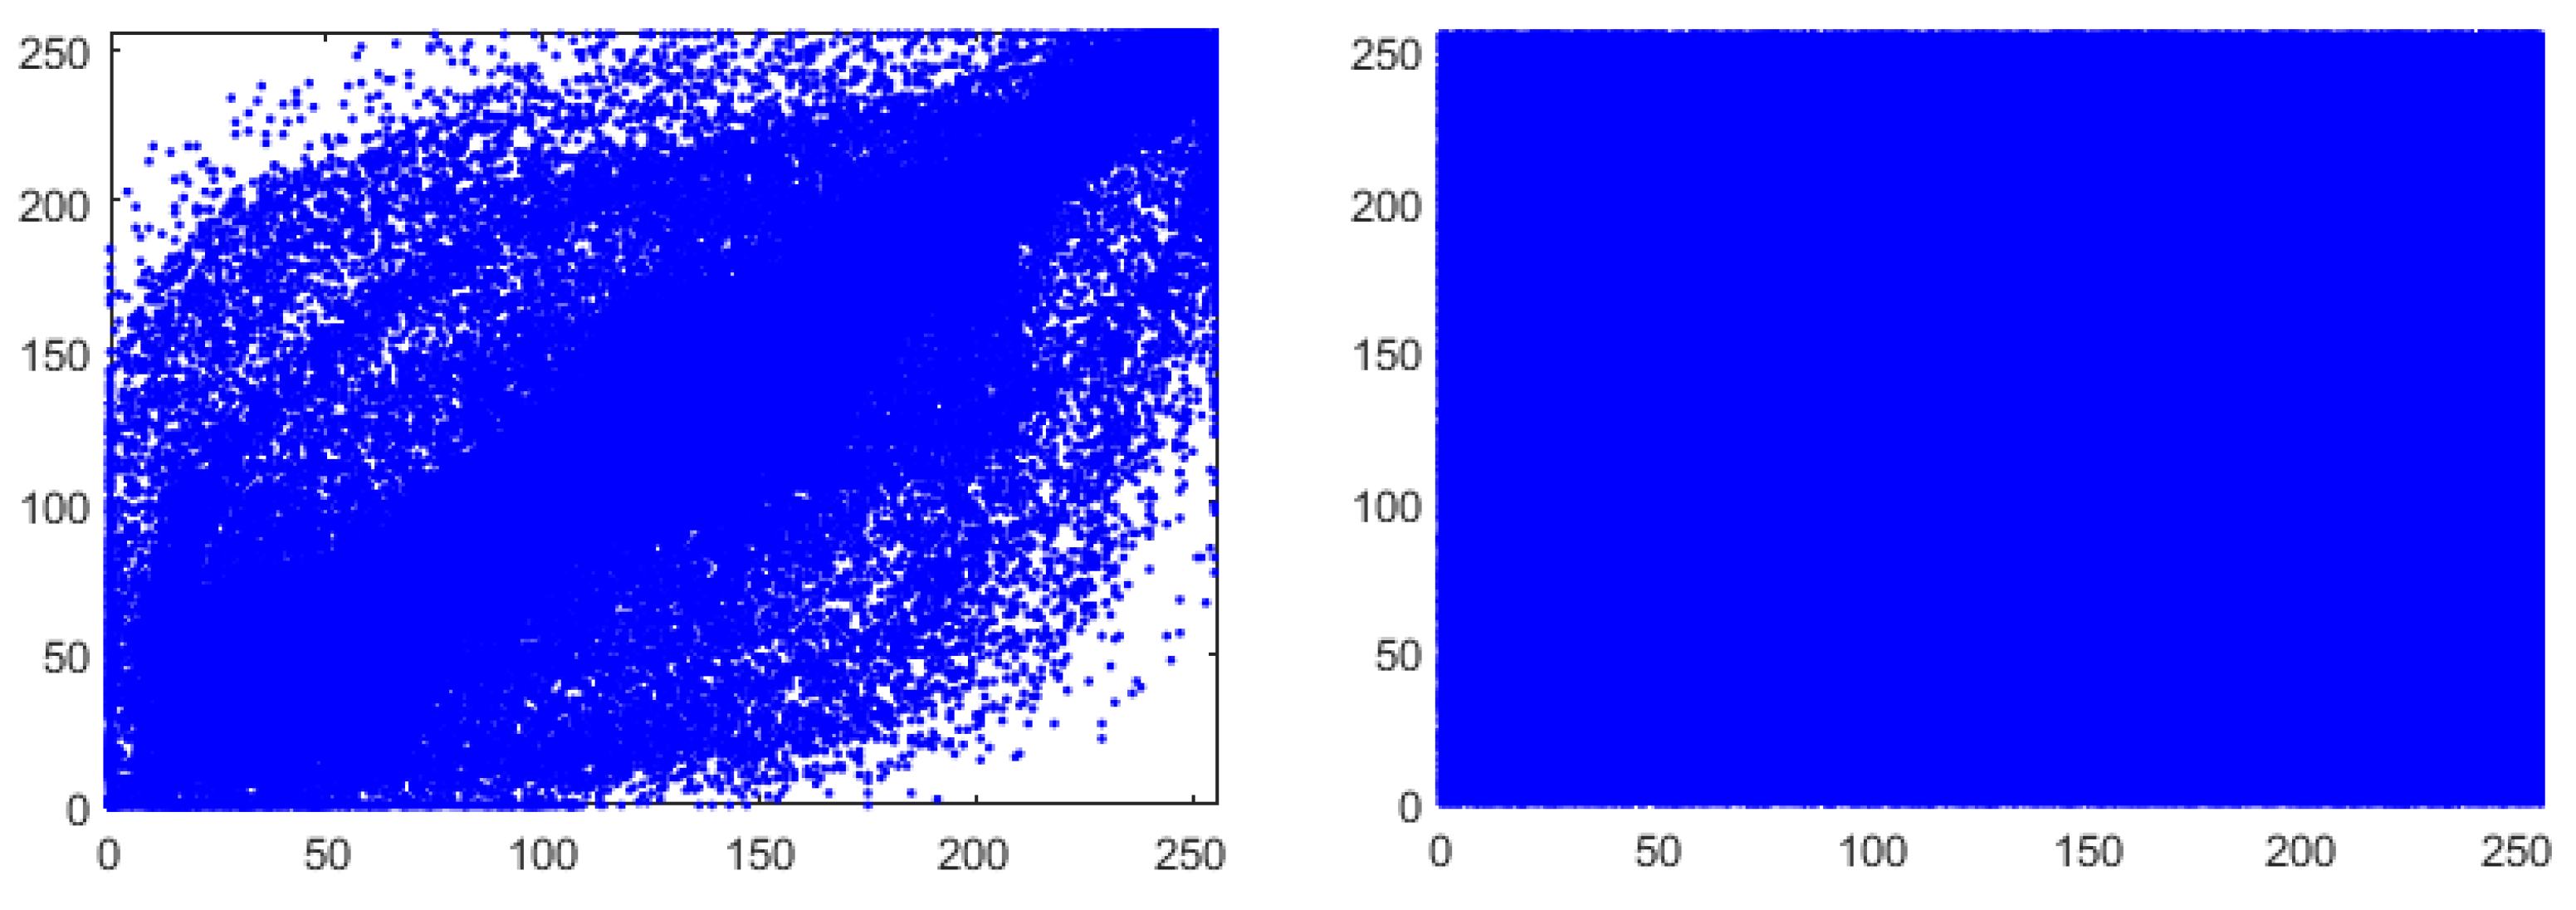
Figure 23.
Correlation coefficient: Aerial view photography 1, plain (left) and encrypted (right) image pixels in vertical view.
Figure 23.
Correlation coefficient: Aerial view photography 1, plain (left) and encrypted (right) image pixels in vertical view.
Figure 24.
Colored aerial images: Yellow buses, Cars, and Airplanes.
Figure 24.
Colored aerial images: Yellow buses, Cars, and Airplanes.
Figure 25.
MSE of aerial images: Yellow buses, cars, and Airplanes.
Figure 25.
MSE of aerial images: Yellow buses, cars, and Airplanes.
Table 1.
Rules of DNA encoding.
Table 1.
Rules of DNA encoding.
| Rule | 1 | 2 | 3 | 4 | 5 | 6 | 7 | 8 |
|---|
| 00 | 00 | 01 | 01 | 10 | 10 | 11 | 11 |
| 11 | 11 | 10 | 10 | 01 | 01 | 00 | 00 |
| 01 | 10 | 00 | 11 | 00 | 11 | 01 | 10 |
| 10 | 01 | 11 | 00 | 11 | 00 | 10 | 01 |
Table 2.
The calculated values of average homogeneity, energy, and contrast analysis.
Table 2.
The calculated values of average homogeneity, energy, and contrast analysis.
| S. No. | Algorithms | Avg. Homogeneity | Avg. Energy | Avg. Contrast |
|---|
| 1 | Proposed | 0.3894 | 0.0156 | 10.5240 |
| 2 | Yellow buses | 0.3901 | 0.0156 | 10.5209 |
| 3 | Airplanes | 0.3899 | 0.0156 | 10.5046 |
| 4 | White buses | 0.3894 | 0.0156 | 10.4931 |
| 5 | Cars | 0.3897 | 0.0156 | 10.5124 |
| 6 | Fadia et al. [43] | 0.5428 | 0.0262 | 6.6862 |
| 7 | Fadia et al. [43] | 0.4653 | 0.0204 | 7.7000 |
| 7 | Fadia et al. [43] | 0.4941 | 0.0251 | 6.7512 |
| 8 | Fadia et al. [43] | 0.4312 | 0.0211 | 7.8101 |
| 9 | Fadia et al. [43] | 0.5389 | 0.0204 | 7.6801 |
| 10 | Fadia et al. [43] | 0.5401 | 0.0258 | 6.6911 |
| 11 | Fadia et al. [43] | 0.4644 | 0.0210 | 7.7123 |
| 12 | Ahmad et al. [30] | 0.9307 | 0.2093 | 0.2307 |
| 13 | Ahmad et al. [30] | 0.9216 | 0.2181 | 0.2388 |
| 14 | Ahmad et al. [30] | 0.9411 | 0.2088 | 0.2403 |
| 15 | Ahmad et al. [30] | 0.9455 | 0.2133 | 0.2219 |
Table 3.
Layer wise homogeneity, energy, and contrast test for yellow white buses image.
Table 3.
Layer wise homogeneity, energy, and contrast test for yellow white buses image.
| S. No. | Images | Tests | Layers | Values |
|---|
| 1 | Yellow white buses | Homogeneity | R-layer | 0.3896 |
| 2 | Yellow white buses | Homogeneity | G-layer | 0.3893 |
| 3 | Yellow white buses | Homogeneity | B-layer | 0.3893 |
| 4 | Yellow white buses | Energy | R-layer | 0.0156 |
| 5 | Yellow white buses | Energy | G-layer | 0.0156 |
| 6 | Yellow white buses | Energy | B-layer | 0.0156 |
| 7 | Yellow white buses | Contrast | R-layer | 10.5433 |
| 8 | Yellow white buses | Contrast | G-layer | 10.5240 |
| 9 | Yellow white buses | Contrast | B-layer | 10.5048 |
Table 4.
Layer wise homogeneity, energy, and contrast test for yellow buses image.
Table 4.
Layer wise homogeneity, energy, and contrast test for yellow buses image.
| S. No. | Images | Tests | Layers | Values |
|---|
| 1 | Yellow buses | Homogeneity | R-layer | 0.3903 |
| 2 | Yellow buses | Homogeneity | G-layer | 0.3901 |
| 3 | Yellow buses | Homogeneity | B-layer | 0.3899 |
| 4 | Yellow buses | Energy | R-layer | 0.0156 |
| 5 | Yellow buses | Energy | G-layer | 0.0156 |
| 6 | Yellow buses | Energy | B-layer | 0.0156 |
| 7 | Yellow buses | Contrast | R-layer | 10.5331 |
| 8 | Yellow buses | Contrast | G-layer | 10.5095 |
| 9 | Yellow buses | Contrast | B-layer | 10.5201 |
Table 5.
Layer wise homogeneity, energy, and contrast test for airplanes image.
Table 5.
Layer wise homogeneity, energy, and contrast test for airplanes image.
| S. No. | Images | Tests | Layers | Values |
|---|
| 1 | Airplanes | Homogeneity | R-layer | 0.3902 |
| 2 | Airplanes | Homogeneity | G-layer | 0.3898 |
| 3 | Airplanes | Homogeneity | B-layer | 0.3899 |
| 4 | Airplanes | Energy | R-layer | 0.0156 |
| 5 | Airplanes | Energy | G-layer | 0.0156 |
| 6 | Airplanes | Energy | B-layer | 0.0156 |
| 7 | Airplanes | Contrast | R-layer | 10.4993 |
| 8 | Airplanes | Contrast | G-layer | 10.5172 |
| 9 | Airplanes | Contrast | B-layer | 10.4975 |
Table 6.
Layer wise homogeneity, energy, and contrast test for white buses image.
Table 6.
Layer wise homogeneity, energy, and contrast test for white buses image.
| S. No. | Images | Tests | Layers | Values |
|---|
| 1 | White buses | Homogeneity | R-layer | 0.3895 |
| 2 | White buses | Homogeneity | G-layer | 0.3895 |
| 3 | White buses | Homogeneity | B-layer | 0.3893 |
| 4 | White buses | Energy | R-layer | 0.0156 |
| 5 | White buses | Energy | G-layer | 0.0156 |
| 6 | White buses | Energy | B-layer | 0.0156 |
| 7 | White buses | Contrast | R-layer | 10.4965 |
| 8 | White buses | Contrast | G-layer | 10.4914 |
| 9 | White buses | Contrast | B-layer | 10.4916 |
Table 7.
Layer wise homogeneity, energy, and contrast test for cars image.
Table 7.
Layer wise homogeneity, energy, and contrast test for cars image.
| S. No. | Images | Tests | Layers | Values |
|---|
| 1 | Cars | Homogeneity | R-layer | 0.3896 |
| 2 | Cars | Homogeneity | G-layer | 0.3900 |
| 3 | Cars | Homogeneity | B-layer | 0.3897 |
| 4 | Cars | Energy | R-layer | 0.0156 |
| 5 | Cars | Energy | G-layer | 0.0156 |
| 6 | Cars | Energy | B-layer | 0.0156 |
| 7 | Cars | Contrast | R-layer | 10.5244 |
| 8 | Cars | Contrast | G-layer | 10.4944 |
| 9 | Cars | Contrast | B-layer | 10.5185 |
Table 8.
Correlation coefficient values for each dimension wherein: H-D = Horizontal dimension, D-D = Diagonal dimension, V-D = Vertical dimension, A-V = Cumulative average value.
Table 8.
Correlation coefficient values for each dimension wherein: H-D = Horizontal dimension, D-D = Diagonal dimension, V-D = Vertical dimension, A-V = Cumulative average value.
| | | Plain Image Dimensions | Encrypted Image Dimensions |
|---|
| | Images | H-D | D-D | V-D | A-V | H-D | D-D | V-D | A-V |
| 1 | Proposed | 0.9066 | 0.7743 | 0.8117 | NA | −0.0014 | 0.0039 | −0.0027 | NA |
| 2 | Yellow buses | 0.9111 | 0.8046 | 0.8896 | NA | −0.0015 | −0.0008 | −0.0385 | NA |
| 3 | Airplanes | 0.9408 | 0.8775 | 0.9210 | NA | −0.0002 | 0.0023 | −0.0017 | NA |
| 4 | White buses | 0.8652 | 0.8507 | 0.9669 | NA | −0.0002 | 0.0011 | −0.0033 | NA |
| 5 | Cars | 0.8468 | 0.7570 | 0.8597 | NA | −0.0025 | 0.0018 | −0.0009 | NA |
| 6 | Ref. [44] | 0.9727 | 0.9204 | 0.9573 | - | −0.0394 | −0.0194 | −0.0223 | - |
| 7 | Ref. [45] | - | - | - | - | 0.0681 | 0.0128 | 0.0049 | - |
| 8 | Ref. [46] | - | - | - | - | 0.0965 | 0.0362 | −0.0581 | - |
| 9 | Ref. [47] | - | - | - | - | 0.1257 | 0.0226 | 0.0581 | - |
Table 9.
Information entropy test for various aerial images.
Table 9.
Information entropy test for various aerial images.
| S. No | Name | Yellow White Buses | Yellow Buses | Airplanes | White Buses | Cars |
|---|
| 1 | Actual Entropy | 7.0899 | 7.2618 | 7.0868 | 6.9841 | 6.9906 |
| 2 | Ideal Entropy | 8.0000 | 8.0000 | 8.0000 | 8.0000 | 8.0000 |
| 3 | Ciphered Entropy | 7.9999 | 7.9997 | 7.9997 | 7.9998 | 7.9998 |
Table 10.
Layer wise entropy test for various standard images.
Table 10.
Layer wise entropy test for various standard images.
| S. No. | Images | Layers | Values |
|---|
| 1 | Yellow white buses | Red | 7.9994 |
| | | Green | 7.9993 |
| | | Blue | 7.9993 |
| 2 | Yellow buses | Red | 7.9994 |
| | | Green | 7.9993 |
| | | Blue | 7.9993 |
| 3 | Airplanes | Red | 7.9993 |
| | | Green | 7.9992 |
| | | Blue | 7.9994 |
| 4 | White buses | Red | 7.9993 |
| | | Green | 7.9994 |
| | | Blue | 7.9994 |
| 5 | Cars | Red | 7.9992 |
| | | Green | 7.9993 |
| | | Blue | 7.9993 |
| 6 | Liu et al. [48] | Red | 7.9791 |
| | | Green | 7.9802 |
| | | Blue | 7.9827 |
| 7 | Wu et al. [49] | Red | 7.9893 |
| | | Green | 7.9898 |
| | | Blue | 7.9894 |
Table 11.
The comparison of entropy values.
Table 11.
The comparison of entropy values.
| S. No. | Algorithms | Entropy Values |
|---|
| 1 | Ideal | 8.0000 |
| 2 | Proposed | 7.9998 |
| 3 | Sun et el. [50] | 7.9965 |
| 4 | Baptisa et al. [50] | 7.9260 |
| 4 | Wong et al. [50] | 7.9690 |
| 5 | Xiang et al. [50] | 7.9950 |
Table 12.
Calculated MSE and PSNR values.
Table 12.
Calculated MSE and PSNR values.
| S. No. | Algorithms | MSE Values | PSNR Values |
|---|
| 1 | Proposed | | 29.0110 (db) |
| 2 | Yellow buses | | 27.8456 (db) |
| 3 | Airplanes | | 28.6258 (db) |
| 4 | White buses | | 28.7089 (db) |
| 5 | Cars | | 29.2284 (db) |
Table 13.
Comparison of MSE and PSNR values.
Table 13.
Comparison of MSE and PSNR values.
| S. No. | Algorithms | MSE Values | PSNR Values |
|---|
| 1 | Proposed | | 29.0110 (db) |
| 2 | Younas et al. [35]-Lena | 4859.03 | 11.30 |
| 3 | Younas et al. [35]-Baboon | 6399.05 | 10.10 |
| 4 | Younas et al. [35]-Pepper | 7274.44 | 9.55 |
Table 14.
Calculated AD and MD values.
Table 14.
Calculated AD and MD values.
| S. No. | Algorithms | AD Values | MD Values |
|---|
| 1 | Proposed | 23.9291 | 255 |
| 2 | Yellow buses | 32.3314 | 255 |
| 3 | Airplanes | 24.0846 | 255 |
| 4 | White buses | 23.1922 | 253 |
| 5 | Cars | 17.6097 | 255 |
Table 15.
Calculated values of NCC, SC, and NAE.
Table 15.
Calculated values of NCC, SC, and NAE.
| S. No. | Images | Test | Calculated Values |
|---|
| 1 | Proposed | NCC | 1 |
| | - | SC | 0.5934 |
| | - | NAE | 0.8404 |
| 2 | Yellow buses | NCC | 1 |
| | - | SC | 0.8759 |
| | - | NAE | 0.5519 |
| 3 | Airplanes | NCC | 1 |
| | - | SC | 0.5950 |
| | - | NAE | 0.7207 |
| 4 | White buses | NCC | 1 |
| | - | SC | 0.5643 |
| | - | NAE | 0.7390 |
| 5 | Proposed | NCC | 1 |
| | - | SC | 0.4511 |
| | - | NAE | 0.7667 |
Table 16.
Comparative values of NCC, SC, and NAE.
Table 16.
Comparative values of NCC, SC, and NAE.
| S. No. | Images | Avg Results (R, G, B) | Calculated Values |
|---|
| 1 | Younas et al. [35]-Lena | NCC | 0.9145 |
| | - | SC | 0.9163 |
| | - | NAE | 0.6456 |
| 2 | Younas et al. [35]-Baboon | NCC | 0.8813 |
| | - | SC | 0.7944 |
| | - | NAE | 0.6527 |
| 3 | Younas et al. [35]-Airplane | NCC | 0.6614 |
| | - | SC | 1.6114 |
| | - | NAE | 0.4600 |
| 4 | Younas et al. [35]-Pepper | NCC | 0.9639 |
| | - | SC | 0.7615 |
| | - | NAE | 0.8420 |
Table 17.
Layer wise time complexity of the proposed scheme.
Table 17.
Layer wise time complexity of the proposed scheme.
| S. No. | Images | Layers | Calculated Time (sec) |
|---|
| 1 | Proposed-Phase 1 | Red | 0.000917 |
| | | Green | 0.000355 |
| | | Blue | 0.000319 |
| 2 | Proposed-Phase 2 | Red | 0.000323 |
| | | Green | 0.000655 |
| | | Blue | 0.000212 |
| 3 | Proposed-Phase 3 | Red | 0.000216 |
| | | Green | 0.000325 |
| | | Blue | 0.000307 |
| 4 | Total Execution Time | All | 0.003629 |
Table 18.
Time complexity of the proposed scheme and its comparison.
Table 18.
Time complexity of the proposed scheme and its comparison.
| S. No. | Images | Calculated Time (sec) |
|---|
| 1 | Proposed Scheme | 0.003 |
| 2 | Ahmad et al. [12]-Pepper | 3.68 |
| 3 | Ahmed et al. [51]-pepper | 2.76 |
| 4 | Khan et al. [16]-pepper | 2.17 |
| 5 | Ahmad et al. [12]-Lena | 3.23 |
| 6 | Ahmed et al. [51]-Lena | 2.25 |
| 7 | Khan et al. [16]-Lena | 2.14 |

 ,
, 


