Spatial ETL for 3D Building Modelling Based on Unmanned Aerial Vehicle Data in Semi-Urban Areas


Faculty of Civil and Geodetic Engineering, University of Ljubljana, Jamova cesta 2, 1000 Ljubljana, Slovenia
*
Author to whom correspondence should be addressed.
Remote Sens. 2020, 12(12), 1972; https://0-doi-org.brum.beds.ac.uk/10.3390/rs12121972
Submission received: 8 May 2020
/
Revised: 12 June 2020
/
Accepted: 18 June 2020
/
Published: 19 June 2020
(This article belongs to the Special Issue 3D Urban Scene Reconstruction Using Photogrammetry and Remote Sensing)
Abstract
:This paper provides the innovative approach of using a spatial extract, transform, load (ETL) solution for 3D building modelling, based on an unmanned aerial vehicle (UAV) photogrammetric point cloud. The main objective of the paper is to present the holistic workflow for 3D building modelling, emphasising the benefits of using spatial ETL solutions for this purpose. Namely, despite the increasing demands for 3D city models and their geospatial applications, the generation of 3D city models is still challenging in the geospatial domain. Advanced geospatial technologies provide various possibilities for the mass acquisition of geospatial data that is further used for 3D city modelling, but there is a huge difference in the cost and quality of input data. While aerial photogrammetry and airborne laser scanning involve high costs, UAV photogrammetry has brought new opportunities, including for small and medium-sized companies, by providing a more flexible and low-cost source of spatial data for 3D modelling. In our data-driven approach, we use a spatial ETL solution to reconstruct a 3D building model from a dense image matching point cloud which was obtained beforehand from UAV imagery. The results are 3D building models in a semantic vector format consistent with the OGC CityGML standard, Level of Detail 2 (LOD2). The approach has been tested on selected buildings in a simple semi-urban area. We conclude that spatial ETL solutions can be efficiently used for 3D building modelling from UAV data, where the data process model developed allows the developer to easily control and manipulate each processing step.
1. Introduction
We are living in the information era, surrounded by a variety of geospatial data from diverse sources. For obtaining useful and reliable information for decision-making, the data must be properly acquired, processed, and analysed. This is a challenging task, particularly in the field of 3D geospatial data modelling [1,2], where the current software support is mostly inadequate. For this purpose, spatial extract, transform, load (ETL) solutions can be used. In computing, ETL has been known since the 1970s, and is often used in data warehousing, i.e., central repositories of integrated data from one or more disparate sources. It is a type of data integration concept referring to the three steps of extract, transform, and load, and is used to integrate data from multiple sources [3]. For processing and integrating various geospatial data, spatial ETL solutions have been developed in the last few decades. A spatial ETL solution supports geospatial data extraction from homogeneous or heterogeneous sources, transforms (processes) the data into a proper storage format/structure, and, finally, loads the data into a target database, such as a topographic database. It is a virtual environment with data manipulation tools that enable better spatial and non-spatial data management. In addition to data transformation tools, spatial ETL solutions also contain various geoprocessing algorithms to process and analyse spatial and non-spatial data, e.g., geometry validation and repair, topology check, or creating and merging attributes [4].
This research addresses the complex workflow of data-driven 3D building modelling using point clouds as a data source. The motivation for the research has been in the current lack of software support for 3D geospatial data manipulation [3,4], that is needed for this purpose. The main objective of this research has been to develop a workflow supported by the selected spatial ETL software for 3D building modelling, based on unmanned aerial vehicle (UAV) data. We hypothesise that the ETL environment and tools enable us to develop a workflow for 3D building modelling based on a geospatial point cloud, where available algorithms for data processing are used. We focus on a data-driven modelling approach, where we use a UAV photogrammetric point cloud to reconstruct a 3D building model in the form of a solid geometry. The surface of a solid is defined by a set of closed polygons with a known orientation; semantic attributes are added to geometric features according to their role in the building model. Our research aimed to cover the entire workflow from the processing of the photogrammetric point cloud to the final 3D semantic building model in the standardised format consistent with the OGC CityGML standard [5], Level of Detail 2 (LOD2). The proposed modelling workflow has been tested on selected buildings in Slovenian semi-urban area.
The paper is structured as follows: this short introduction is followed by Section 2, which provides an overview of related research and publications. Section 3 describes the basic concepts of spatial ETL, data used for 3D building modelling, and the methodology utilised in the proposed workflow for 3D building modelling and quality assessment. In Section 4, the results of the 3D building modelling are presented, with the developed workflow and quality assessment. In Section 5, the main findings and critical evaluation of the proposed workflow, with respect to previous publications, are discussed, while Section 6 provides the main conclusions.
2. Research Related to 3D Building Modelling
2.1. Spatial Data Used for 3D Modelling
In the past two decades, 3D city modelling from various geospatial data sources has been a research topic of great interest. Within city modelling, buildings are the most significant features to which the modelling approaches relate, which is also evident from the published literature reviews [6,7,8,9,10]. In this early stage of 3D building modelling based on aerial laser scanning data or photogrammetric imageries, special attention has also been given to the development of semi-automatic and automatic algorithms for building detection and recognition. The algorithms for building detection and reconstruction from geospatial datasets have been developed, following the progress of different technologies for data acquisition and data processing, its storage, and exchange [6,7,8,9,10,11,12,13,14,15,16,17,18,19,20,21,22,23,24,25,26,27,28,29,30,31,32,33,34,35].
Three-dimensional building modelling algorithms based on geospatial point clouds can be differentiated by data sources used for the modelling. Progress in automating the process of 3D building modelling was accelerated when light detection and ranging (LiDAR) data became available. High-density 3D point cloud data acquired by airborne or terrestrial laser scanning have provided new opportunities and initiated new approaches for building detection and reconstruction. Some algorithms use solely airborne laser scanning (ALS) data, which can be used for building modelling at city or region scale [11], corresponding the Level of Detail 2 (LOD2), as defined by the OGC CityGML standard [5]. In addition to the ALS data, some authors used additional geospatial data for 3D building modelling, such as building outlines from topographic or cadastral databases [12,13], which simplifies the extraction of points from the point cloud that correspond to a building. In the case of using terrestrial laser scanning (TLS) data, building modelling often includes the reconstruction of façades [14], which corresponds to building models of a higher Level of Detail (LOD3). Some further approaches have combined various data types for 3D building modelling, to exploit the advantages of each input data, such as aerial and terrestrial laser scanning data [15] or LiDAR data and aerial imagery [16]. Recently, advances in dense image matching algorithms have made it possible to produce high-density photogrammetric point clouds, which can be used in building reconstruction, i.e., 3D building modelling. Although a photogrammetric point cloud has some disadvantages compared to a point cloud from laser scanning [17], it is very often used for building reconstruction. This can be proven by several 3D building modelling approaches using point clouds from imagery, either captured only in the nadir or combined with oblique views, that can be found in the literature [18,19,20,21,22]. Nadir images can be used for building modelling for the Level of Detail 2 (LOD2), while additional oblique images provide data for building reconstruction at higher levels of detail. Some interesting approaches have also been developed for 3D building modelling using satellite imagery [23], or using a digital elevation model (DEM) obtained from point cloud data or raster imagery [24]. The comprehensive analysis of different spatial data used for building reconstruction is given in [25].
In our research, we focus on 3D building modelling, using imageries acquired by UAV. Due to its flexibility and low cost, UAV is an interesting source of spatial data, because it enables the acquisition of nadir or oblique imagery over the selected area with technology, which is more affordable for small and medium-sized companies than aerial laser scanning or classic airborne photogrammetric acquisition. Since our target level of detail for the reconstructed buildings was LOD2, we used only nadir imageries. Highly overlapping images captured by UAV are processed with structure from motion (SfM) tools and dense image matching (DIM) algorithms, yielding a dense photogrammetric point cloud as a result. This point cloud is a useful source for 3D building modelling, which has also been tested in our research. There are some disadvantages of using UAV, e.g., payload limitations, short flight duration due to limited battery power supply, small area coverage, and legal restrictions of usage in the urban environment. Still, the UAV enables fast and efficient spatial data acquisition [26,27]. In our case, the developed workflow is in particular interesting for large-scale topographic mapping of smaller areas for development projects, such as rural development projects, but can also be used for other purposes, for example, quality control or updating national topographic datasets.
2.2. Building Reconstruction Approach
In general, a building modelling workflow consists of many successive steps, namely building detection, outline extraction, roof shape reconstruction, model generation and regularisation, and quality analysis [11]. Since each step of this workflow depends on initial input data, the available algorithms differ in this aspect. In this part of the paper, approaches for roof shape reconstruction and 3D building model generation (LOD2) are presented, using nadir acquired point cloud as a data source, as is the case in our research. In general, the modelling approaches using point cloud data can be divided into two main categories: model-driven methods and data-driven methods.
The model-driven methods are often referred to as top-down or parametric approaches. Three-dimensional building models are developed by fitting the pre-defined shapes of the model to the input data. For example, an algorithm compares pre-defined roof shapes in the algorithm’s library to the acquired data and selects the roof shape that fits the best. This approach is also applicable when the input point cloud is of a low point density. A drawback of the model-driven methods is that it is hard to predict all possible roof shapes in advance [11]. In principle, the model-driven methods reconstruct building models based on parameters that are calculated in advance, and could be divided into footprint parameters and space parameters. The footprint parameters define a building position, orientation, and dimensions, whereas the space parameters deliver information about the shape of the roof and walls [28].
The data-driven methods, also called bottom-down or non-parametric approaches, reconstruct building models directly from the point cloud, relying on various algorithms of segmentation and classification of input data. A roof is modelled from one or many roof parts without any prior knowledge about the shape of the model. Firstly, the point cloud related to the building is segmented into several parts, where each segment belongs to one part of the roof or other building part. The parts of a building model, defined by segments, are then combined to form a polyhedral building model. In data-driven methods, the segmentation of the initial point cloud for the definition of roof faces is the crucial step in modelling to obtain an accurate model [11]. The algorithms that are most frequently used within data-driven methods for detecting the roof parts in the form of planes are random sample consensus (RANSAC) [29,30], the 3D Hough transform [31,32], and the region growing algorithm [33]. The defined roof planes, together with the extracted outlines of roof parts, are further used to reconstruct a roof in a 3D environment. The data-driven methods can reconstruct even complex roof shapes because roof faces are defined directly based on input data, i.e., point cloud. The problem usually arises in the case of incomplete data with areas without any points, due to occlusions. For overcoming the problem of incorrect geometry and topology of a roof model, methods employ additional constraints, e.g., symmetry, perpendicular and parallel lines of building outlines [34,35].
In our research, the input data is a photogrammetric point cloud acquired by optical sensors mounted on a UAV using a nadir perspective. The selected photogrammetric point cloud has a very high point density compared to the approaches mentioned above. For this reason, we decided to deploy a data-driven workflow for 3D building modelling. The proposed workflow reconstructs a 3D building model based only on UAV data, without any auxiliary spatial data such as building footprint or building outline from the cadastral or topographic database.
2.3. CityGML
A virtual 3D city model can be relatively easily obtained directly by triangulating a point cloud, which results in a mesh model. The geometry of the mesh model is close to the input point cloud, and, by adding textures, it can be very realistic and hence useful for visualisation purposes. Objects in the mesh model can have complex shapes, because no preliminary knowledge about the scene is needed. However, the mesh model does not contain semantic information; hence, it is not useful for complex applications beyond visualisation [36]. Nowadays, 3D city models are used in other applications such as visibility analysis, 3D cadastre, navigation, environmental simulations, emergency response, energy demand and solar potential estimation, urban planning, etc. Therefore, there is a need to store additional attributes and relationships between spatial entities in the model besides geometry [1]. An important advancement in this field was the issuing of the CityGML standard, adopted by the Open Geospatial Consortium (OGC) [37].
CityGML is an open data model and XML-based format for the storage and exchange of virtual 3D city models. It is an application schema for OGC Geography Markup Language (GML3) [38]. Compared to other standards for 3D building/city models, such as DXF, VRML, X3D, and Collada, which support a large variety of geometries, CityGML supports not only geometry but also semantics, which is important for spatial analyses and simulations [39]. The OGC CityGML standard defines the most relevant topographic objects in cities concerning their geometry, topology, semantics, and appearance. The city objects in the model can be represented in five different levels of detail (LOD), from LOD0 to LOD4. The coarsest representation is LOD0, where, for example, buildings are modelled as a 2.5D footprint or roof edge polygons draped on the digital elevation model. Further, LOD1 contains simple prismatic 3D block models, where buildings are without any roof structures. Buildings in LOD2 are 3D models with differentiated roof shapes, and can be represented according to their thematic attributes. LOD3 is the most detailed level of presentation of the outer parts of the city objects. Buildings are represented in a very detailed way with roof and facade installations, such as balconies, dormers, chimneys, windows, and doors. The most detailed model is LOD4, where an LOD3 building model is augmented with a building interior in the form of rooms, doors, stairs, and furniture [5,37].
In this research, we reconstructed building models according to the OGC CityGML standard for the case of LOD2, with positional accuracy (RMSE) ± 1 m, which is compliant with the Slovenian requirements for large-scale topographic mapping.
3. Materials and Methods
The main objective of our study was to develop a holistic workflow for data-driven 3D building modelling. The workflow is based on the UAV photogrammetric point cloud and involves all steps from point cloud processing to the final 3D building model according to the OGC CityGML model LOD2. For this purpose, we have used a spatial ETL solution, aiming to provide a transparent workflow with the possibilities to guide and control each step in the workflow.
3.1. Spatial ETL
The general concept of ETL is data extraction from different sources, data transformation to proper format or structure for later querying and analysis, and data load into the targeting system [40]. A special version of ETL is spatial ETL. Due to its spatial component, it is specialised in dealing both with spatial and non-spatial data. When managing large amounts of data, the ETL solution plays an important role in extracting data from various source systems, maintaining data quality, applying standard rules, and presenting data in different forms to support decision-making [41]. A spatial ETL tool has the functionality to extract data from various sources, transform data to the required format or structure, and load data into the common system to further create, maintain, and analyse geospatial information. A common environment for geospatial data within the ETL solution enables geospatial data and system interoperability across applications and platforms [42]. For our research, we deployed the spatial ETL solution Feature Manipulation Engine (FME) software ver. 2018 by Safe Software Inc. [43].
3.2. Study Area and Dataset
For testing our workflow for 3D building modelling, UAV data in the form of an unstructured photogrammetric point cloud was used. The input data was acquired in the Slovenian countryside, near the village of Vače, with a coverage of approximately 200 × 200 m2. The rural area was selected with respect to legal restrictions of using UAV technology in the urban environment. The data acquisition took place on June 8, 2018, using a Sky Hero X8 octocopter. The RGB images were captured with an Olympus PEN E-PL7 digital camera with a focal length of 17 mm. Table 1 shows the specifications of the digital camera used for data capture.
The flight mission lasted 30 minutes around noontime, acquiring 344 images. The images were captured in the nadir view with high forward and sideward overlap (85%/65%).
The images were geo-referenced using ground control points (GCP). The total number of 9 GCPs were evenly distributed on the perimeter and in the middle of the study area. Each GCP was signalised with an artificial circular target having a diameter of 21 cm, and surveyed with the real-time kinematic (RTK) method, using a Global Navigation Satellite System (GNSS) receiver, Leica Viva. The positions of GCPs were measured within the Slovenian GNSS network, SIGNAL, and determined in the Slovenian national reference system (D96/TM, SVS2010). Detailed parameters of the UAV flight for data acquisition are presented in Table 2.
The first pre-processing was done in order to create an initial photogrammetric point cloud, which was an input to the 3D building modelling. UAV pre-processing was performed with the photogrammetric software package Agisoft PhotoScan Professional ver. 1.4.3 [44]. The UAV images were processed with structure-from-motion (SfM) and dense image matching (DIM) algorithms, which enable the reconstruction of the 3D geometry of the scene, camera positions, and orientation from highly overlapping images and known positions of GCPs in the selected reference system. The result of UAV image pre-processing was a dense photogrammetric point cloud.
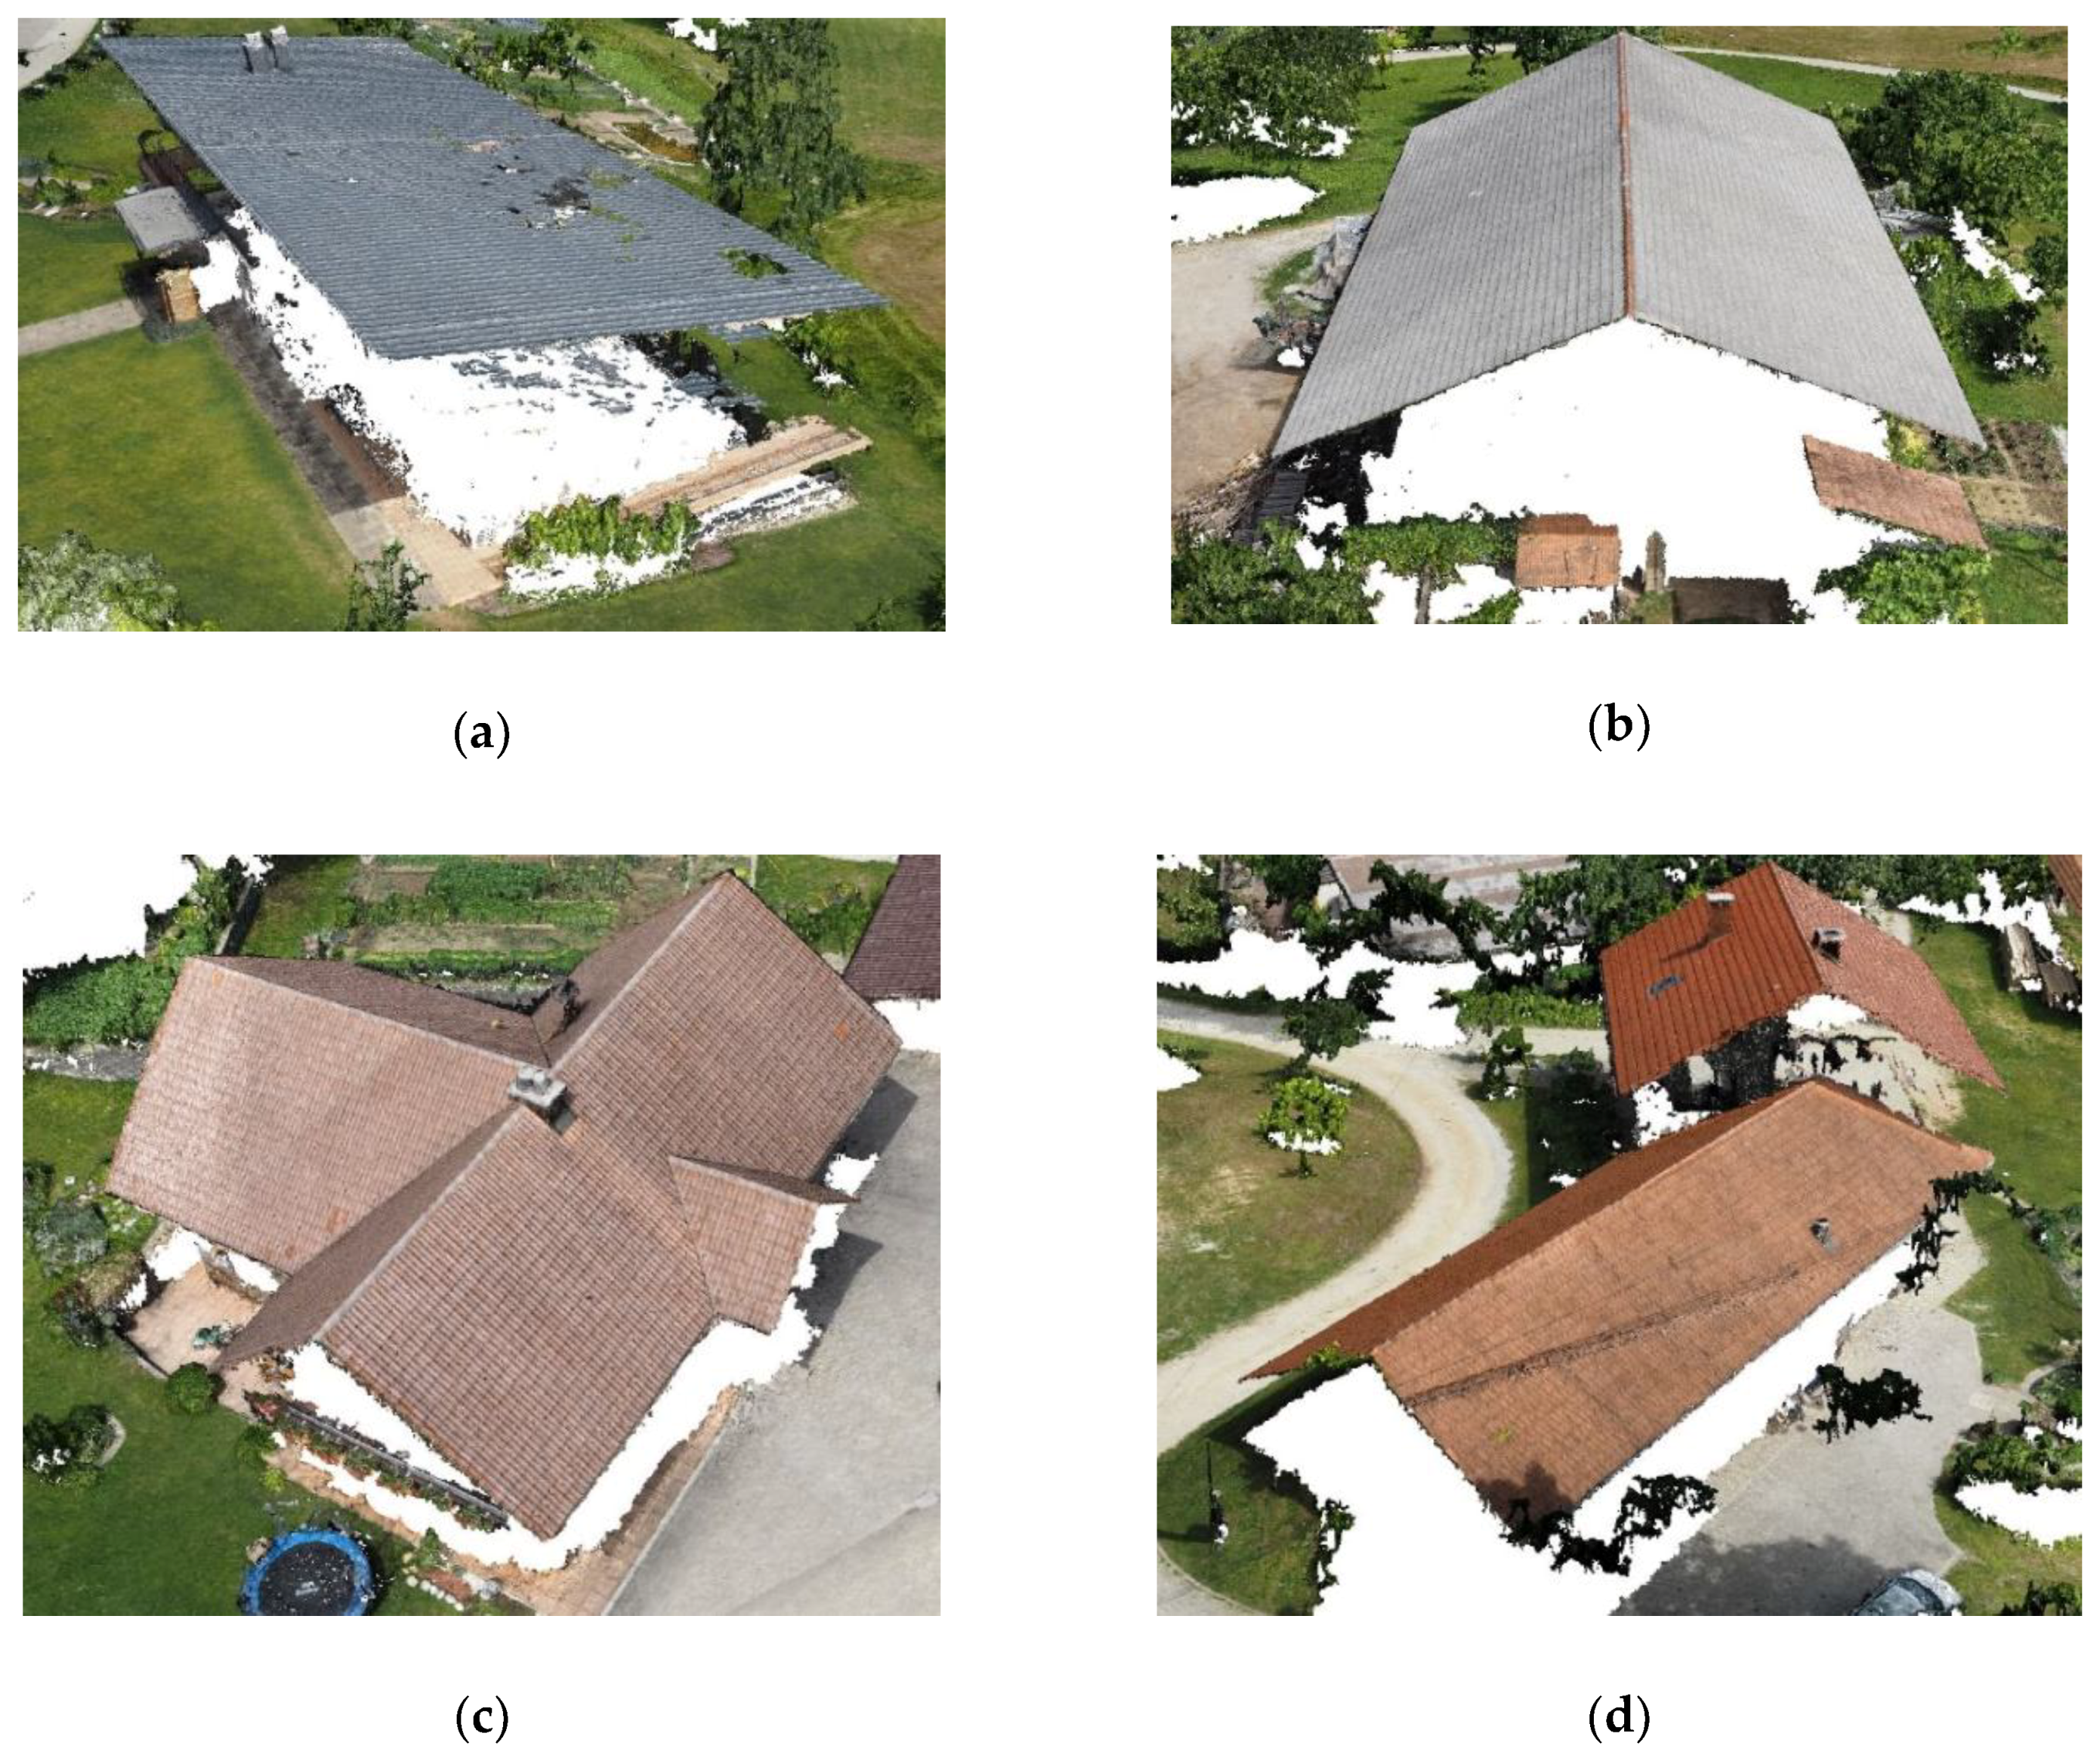
In the study area, there are 13 buildings, mainly family houses and auxiliary farm buildings. For further 3D building modelling, we selected 4 buildings among all built-up objects at the site (Figure 1). This selection was done to test the proposed modelling workflow for different roof types.
3.3. The Proposed Workflow
In this section, the workflow for 3D building modelling based on a UAV photogrammetric point cloud is presented. The developed workflow includes the whole process from the input point cloud processing to the final 3D building model in accordance with the OGC CityGML model (LOD2).
The developed workflow uses a similar assumption to that given in [11], which is that a point cloud that corresponds to one building can be split into segments, which can be approximated with planar patches. For this reason, the workflow focuses on the detection and extraction of planar patches in the point cloud, and then uses these patches to reconstruct a 3D building model. The workflow is divided into three parts. The first and the second part are regarded as data pre-processing, where intermediate results can also be obtained with other tools, or taken from the existing datasets. The third part is the main part of the workflow for 3D building modelling, which is entirely accomplished within the spatial ETL solution.
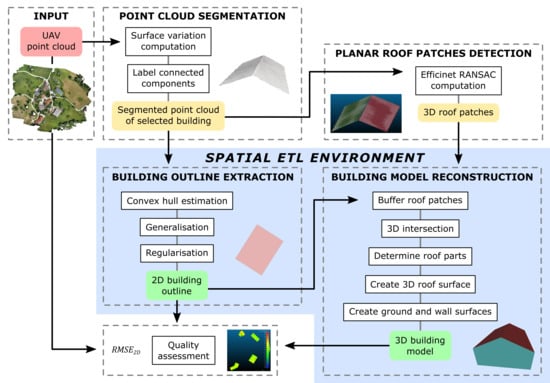
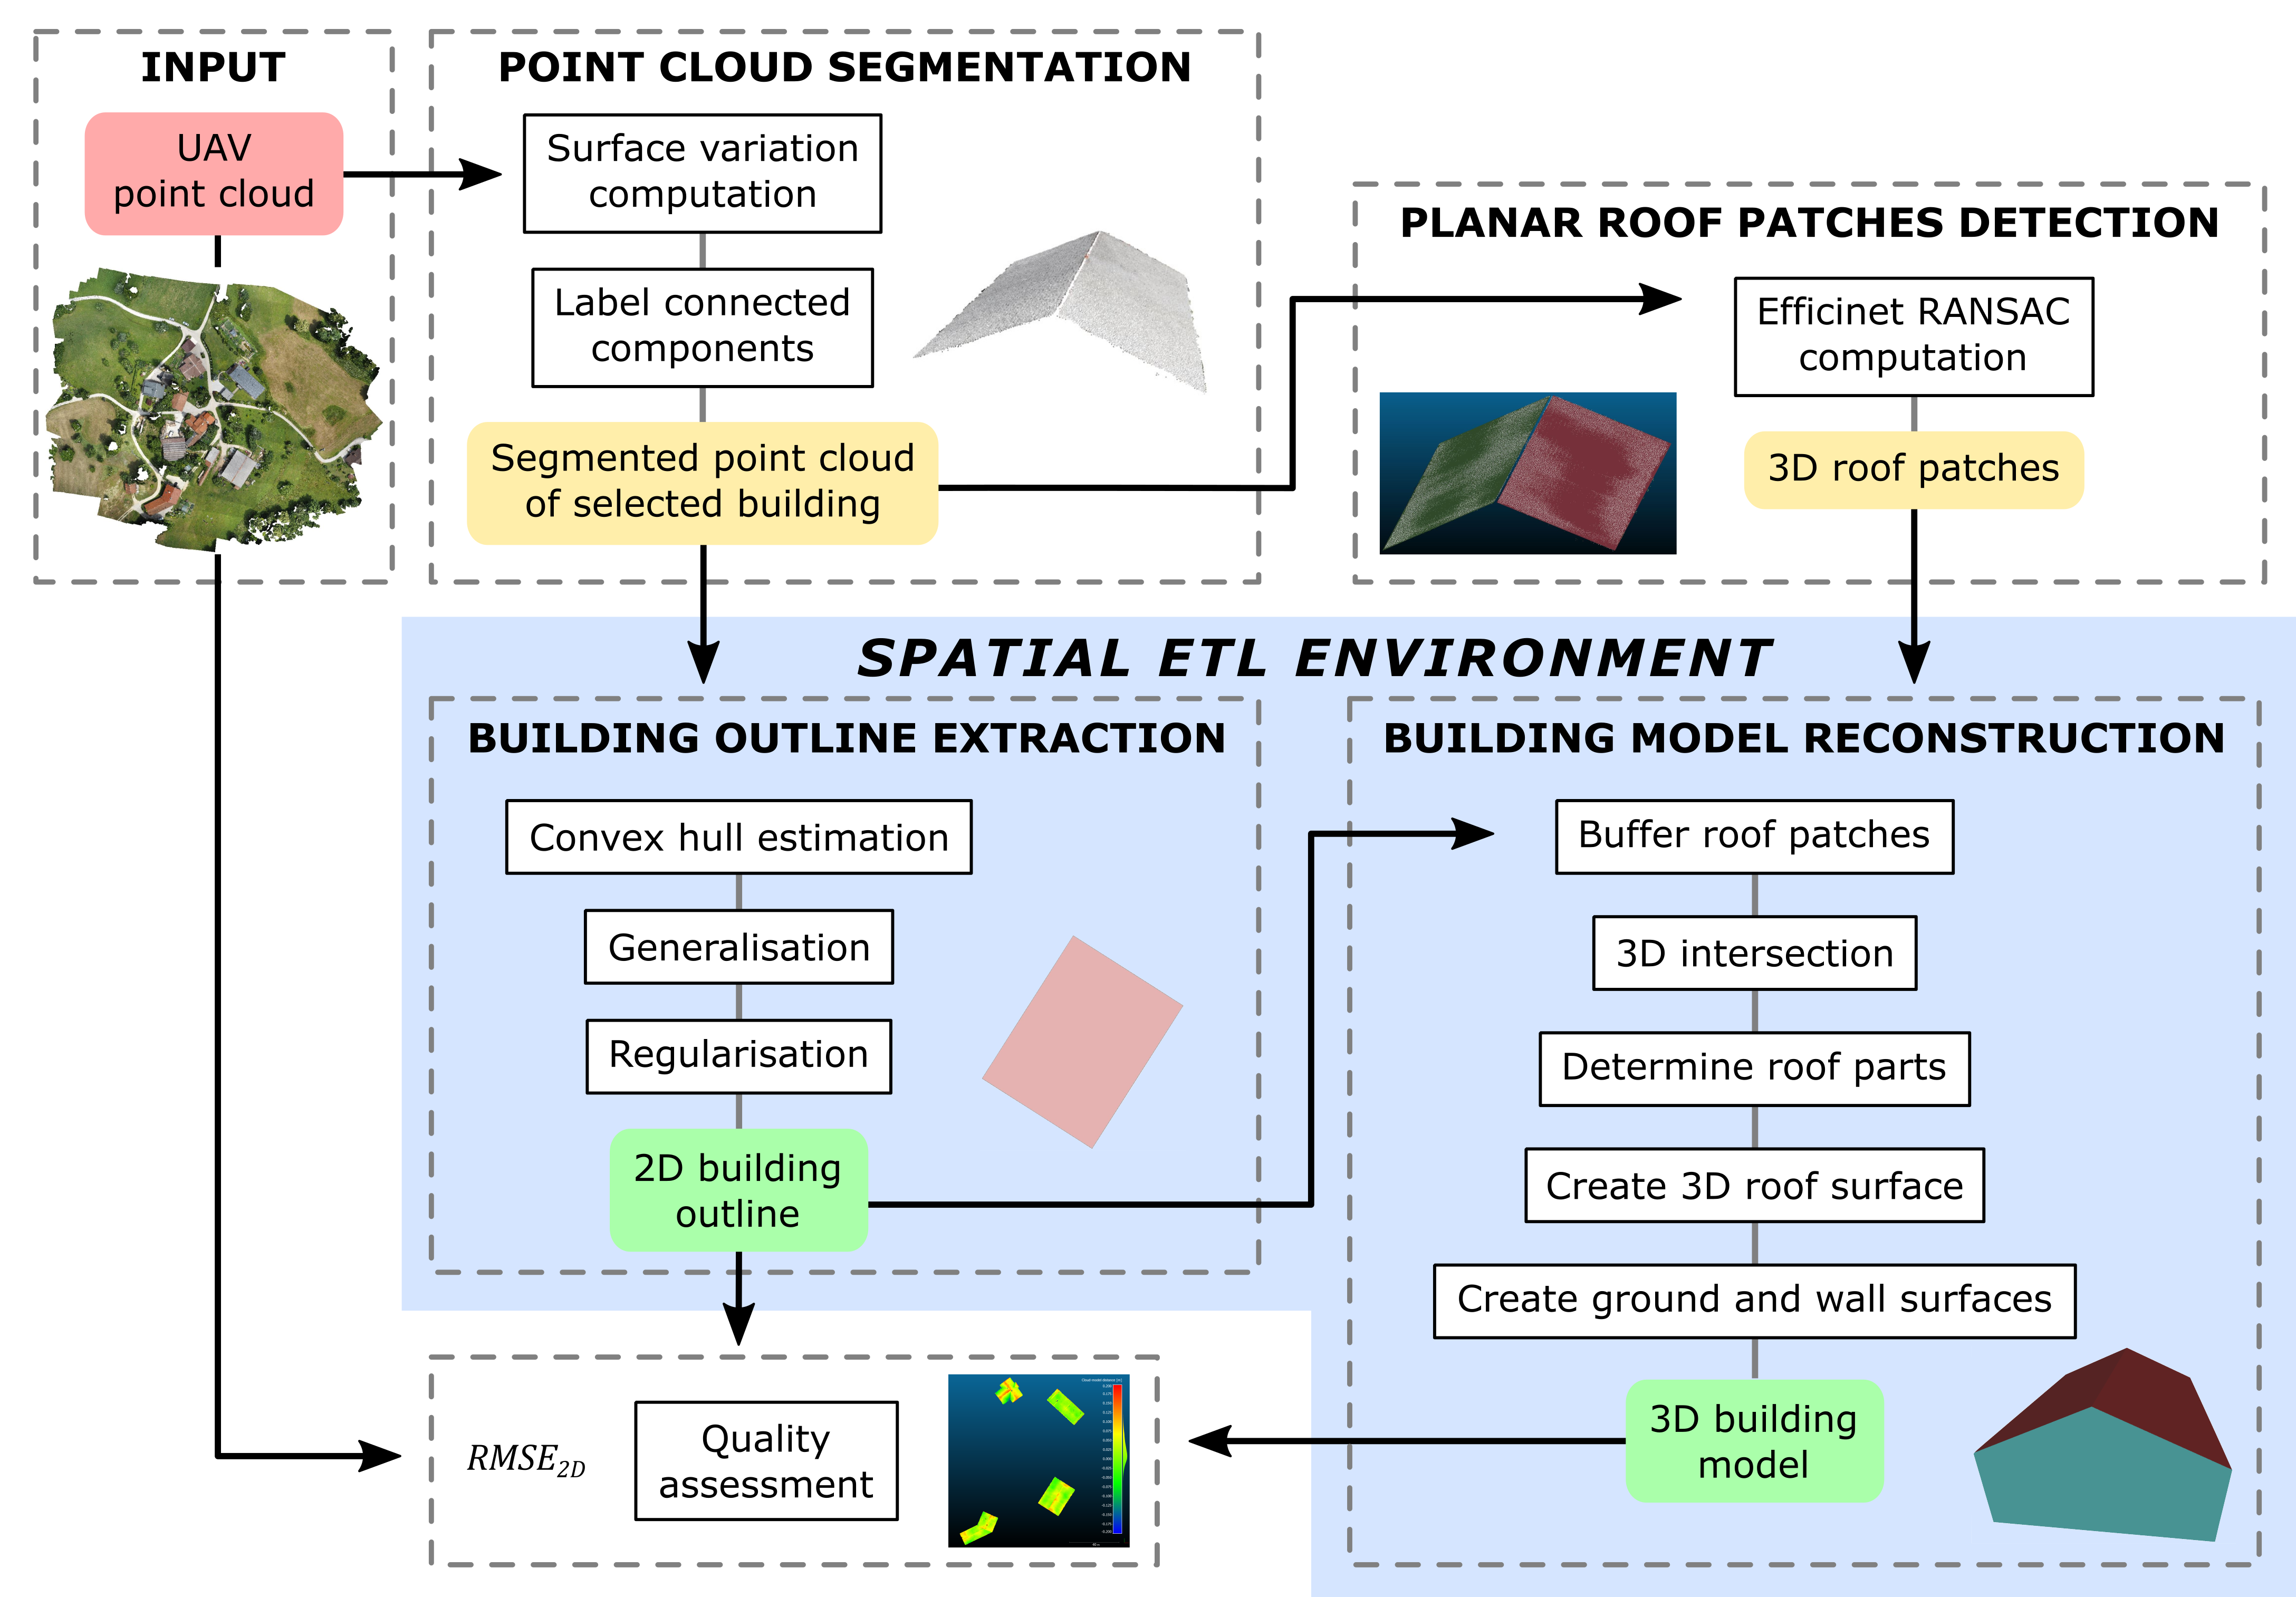
The first part of the workflow focuses on the processing of the UAV photogrammetric point cloud. It includes operations for point cloud segmentation and planar patches detection within the point cloud. All procedures for point cloud processing are done in open source software CloudCompare ver. 2.11 [45]. The second part consists of operations for a building outline generation. The third part includes operations for the building reconstruction in order to obtain a semantic 3D building model. The second and third parts are developed in the spatial ETL environment, using FME software [43]. The whole workflow from the input photogrammetric point cloud to the final 3D building model is schematically presented in Figure 2.
3.3.1. Point Cloud Segmentation
The point cloud segmentation is performed in open-source software CloudCompare ver. 2.14. As an input, we use the unstructured UAV photogrammetric point cloud. The point cloud is resampled with the tool Subsample in the CloudCompare software, aiming to ensure similar point density for the whole study area. The number of points decreases with respect to the specified value of the minimum spacing distance between points, whereas the positions of retained points are unaffected. For our study area, we used the value of 0.10 m as a minimum distance between points in the cloud.
In the next step, we compute geometric properties of the points based on the values of eigenvalues of the covariance matrix of the selected point and its neighbouring points, as listed in [46]. For each point in the cloud, we compute the value of surface variation with respect to the points in its spherical neighbourhood. The surface variation is obtained by Equation (1),
where the values λ1 ≥ λ2 ≥ λ3 ≥ 0 are eigenvalues of the covariance matrix of points in the neighbourhood [46]. Concerning the point cloud density in the study area, the neighbourhood size for each point was set to a fixed radius of 0.30 m. Points with a lower value of surface variation denote planar regions, so we kept in the cloud only points that have surface variation lower than 0.03. The value was set empirically, according to the type of man-made objects in the study area. In this way, points representing terrain and building roofs were retained in the point cloud, whereas the points for vegetation were mainly excluded.
The following step is the extraction of buildings from the point cloud. Since we acquired only nadir UAV imagery, the points on buildings are present only on the planar roof faces. The point cloud segmentation, with the aim of extracting separate buildings, is done by the tool Label Connected Components, in the CloudCompare software. This tool divides the input point cloud with a 3D grid that employs the octree structure. The groups of points defined as connected components are extracted with respect to the minimum distance between components and minimum points per each component. For our case, the gap between components was set to 0.2 m, and the value of the minimum points per component was 1000. The procedure results in a segmented point cloud to several separated groups of points as connected components sorted by the number of points in each component in a descending way. The first component, which is also the largest, is the terrain. The next fourteen components represent buildings or man-made objects with a planar surface, where each component is a separate building or building part. Among detected components, we selected four buildings with distinct roof configurations (Figure 1), which we use in the further building modelling process. Parameters used in the point cloud segmentation, which have been defined based on the review of the literature and empirical experience, are listed in Table 3.
3.3.2. Planar Roof Patches Detection
The next step in our workflow is dedicated to the detection of planar roof patches. The patches as roof primitives are detected with a parametric model fitted to the point cloud. The method used for fitting the geometric model to the point cloud is random sample consensus (RANSAC), which enables the detection of parametric models such as planes, cylinders, and spheres within the scene in the point cloud. We use the efficient RANSAC algorithm, which was developed by [47]. The selected version of the RANSAC algorithm is included in CloudCompare software as a plugin. As an input for the plane detection, we use the connected components of points retrieved in processing from Section 3.3.1. The parameters for RANSAC plane detection were defined for the selected study area, partly based on the findings in [48]. The used RANSAC parameters are listed in Table 4.
The plane fitting with the efficient RANSAC algorithm results in planar roof faces, where each face defines the location and orientation of each roof face, but not an exact size. The proper size of each roof face is defined in the later process of building reconstruction.
3.3.3. Building Outline Generation
The next step in the workflow is done within the spatial ETL solution FME, SafeSoftware. The input for creating a 2D building outline is a connected component of the point cloud representing one building, which is obtained beforehand with the point cloud segmentation (see Section 3.3.1). For each connected component, one building outline is created. First, a concave hull of the input points of a given connected component is created using the alpha shape algorithm with the HullAccumulator transformer [4]. The alpha value for the creation of the hull is empirically set to a value 0.5 to 0.7. After the concave hull is constructed, the 2D polygon for the building outline is generalised using the Douglas-Peucker algorithm within the Generalizer transformer, with a tolerance value of 0.3 [4]. The generalisation procedure removes the vertices of the outline polygon that are within the specified tolerance, while the remaining vertices preserve their location. Finally, the regularisation of the created 2D building outlines is done with the function Regularize Building Footprints. This function was developed for the commercial software package ArcGIS Pro by ESRI, and it can be integrated into the FME processing workflow using a Python script. Building outlines are processed using the Right Angles method with a tolerance value of 0.25 and a precision value of 0.05. The method ensures perpendicular angles of the building outlines by moving the polygon vertices into the desired location within specified tolerances. At the end, the cleaning of small holes within the polygon is performed with the DonutHoleExtractor transformer to exclude gaps in the outline [4]. The processing workflow for building outline extraction is presented in Figure 3, while the parameters used in the building outline generation are given in Table 5.
3.3.4. Building Model Reconstruction
The main part of the proposed modelling workflow is 3D building model reconstruction in the spatial ETL software FME, SafeSoftware. The building model is reconstructed in two steps. The first step is roof modelling and results in the 3D building roof surface. The second step is building modelling, which uses the previously reconstructed roof surface and conducts the reconstruction of walls and ground surface to obtain the complete 3D building model. The processing workflow for building model reconstruction is shown in Figure 4.
The input data for the reconstruction of roof surface are 3D planar roof patches that define the location and orientation of the roof faces and building roof outline as a 2D polygon. The extracted planar patches are firstly rotated (parallel to the XY plane) and projected to the XY plane, enlarged with a buffer size of 1 m, and then back-projected to their initial 3D position. This step is needed to determine the topological relationship between neighbouring roof planes. This is because there are still very limited functionalities of spatial ETL solutions for operations in a 3D space. Topology in 3D space is then defined by intersections between the enlarged planes, which are calculated using the SQL PostGIS function 3D intersection within the spatial ETL environment, using the SQLExecutor transformer. The resulting 3D intersection lines between roof planes divide the pre-prepared building outline polygon into several sections, where each section represents the 2D projection of one roof plane. Outline sections are further used to determine the extent of each roof part, where the area of the roof surface was obtained by clipping the enlarged roof planes to their proper size. This makes it possible to reconstruct a building roof, where each roof part has a determined location, size, and orientation, with respect to the shape of the building outline and position of the roof patches.
Based on these results, the workflow is developed, aiming to reconstruct the 3D building model by using the previously constructed roof surface and data about the minimum elevation of the building acquired from the point cloud. The reconstruction is done with the BRepSolidBoundaryCreator algorithm, which is incorporated into FME software as a custom transformer. The algorithm creates a boundary representation of the building model with surfaces of the roof, walls, and ground.
At the end, the reconstructed 3D building model is transformed into a semantic vector model in the file format, according to the OGC CityGML standard, corresponding the Level of Detail LOD2 [5]. The geometry of the building model is stored as a solid, comprising of multi-surfaces for roof, walls, and ground. The semantic attributes are added to geometric features according to their role in the building model. The whole model is defined by a thematic class Building. Surfaces for roof, wall, and ground are denoted with subclasses RoofSurface, WallSurface, and GroundSurface.
3.4. Quality Analysis
In order to evaluate the proposed building modelling workflow, a quality analysis of the roof outlines and reconstructed building models was conducted. We assessed the relative or internal positional accuracy of the outline and model. In our case, the internal quality describes the properties of the analysed model with respect to input data. This allows us to monitor and control the procedures within the modelling workflow, whereas the quality of input data with respect to absolute accuracy was not of interest in our research.
For analysing the quality of the extracted roof outlines, we compared each extracted outline with the corresponding data in the photogrammetric point cloud, using the root mean square error (RMSE) as a quality measure. The RMSE was determined in the 2D space because extracted building outlines were exported as 2D polygons. As reference data, we used the coordinates of manually selected points in the point cloud representing the corners of the roof; the analysed data were the coordinates of the vertex points of regularised building roof outline. The differences between the reference and outline coordinates were calculated as the difference of the coordinates’ values as follows in Equation (2).
where xcloud and ycloud are coordinates from the input point cloud, whereas xoutline and youtline are coordinates of the regularised building outline.
Equations (3) and (4) were used to calculate the RMSE values:
where n is the number of vertices of the analysed building outline, RMSEx and RMSEy represent the RMSE in the direction of x- and y-axis, respectively, and RMSE2D is the RMSE in the 2D space.
A quality assessment was further performed to evaluate the quality of the reconstructed 3D building models. The analysis was done in CloudCompare software, ver. 2.11, using the Cloud-to-Mesh Distance tool. The quality of 3D building models was evaluated with respect to the input point cloud, which means that the inner accuracy of the models was determined. In this sense, we have focused on the procedures and parameters used within the proposed modelling workflow. For geometric quality analysis, the orthogonal distance between each point in the cloud and the nearest surface of the building model was computed.
For final quality evaluation, we tested geometric correctness of the reconstructed models. The validation was done with open-source tool val3dity [49,50], which validates 3D primitives according to the specifications of the international standard ISO19107 and Geography Markup Language (GML). The validation was performed by using the web application, version v2.2.0.
4. Results
In this section, the results of the developed data-driven 3D building model reconstruction are presented for the study area—the village of Vače, where a UAV photogrammetric point cloud generated from the nadir imageries was used as the input data.
4.1. Segments in the Point Cloud Representing Buildings
After resampling the initial point cloud to ensure even point spacing, the point cloud segmentation was conducted. By calculating the surface variation as one of the geometric features of the points in the cloud, we detected and extracted the planar groups of the points. The values of the surface variations of each point with respect to the points in its neighbourhood are shown in Figure 5. The points in red colour denote points with the value of surface variation higher than 0.03, and are regarded as non-planar regions (Figure 5a), mainly representing vegetation. These points were excluded from the cloud in the following step of the processing. The points coloured in blue, green, and yellow denote points with lower values of the surface variation, and they represent planar regions. These points can be classified as terrain and building roofs, and, thus, retained in the cloud for further processing. Based on empirical tests for the selected study area, we kept in the cloud points that have a value of surface variation higher than 0.03 (Figure 5b).
Although some points that represent vegetation were not excluded from the cloud in this stage (Figure 5), these points were not detected as a connected component in the following step of the point cloud segmentation. Namely, in the next step, the point cloud segmentation for the points retained in the cloud was done to determine groups of points as connected components. For the given point cloud of the study area, the segmentation resulted in 20 connected components. All extracted components were ordered in a descending way with respect to the number of points in the component. The largest component is the terrain (Figure 6a), while the next 14 components represent building roofs (Figure 6b).
4.2. Planar Roof Patches
The segmentation of the point cloud was followed by the detection of planar patches of the roofs for each connected component defined as a building. By applying the efficient RANSAC algorithm for each point cloud representing the building roof, the planar patches for each roof face are obtained (Figure 7).
4.3. Building Outlines
According to the proposed workflow, the extraction of the roof outline for each building in the point cloud was performed using the spatial ETL environment. The input for this procedure is the 3D photogrammetric point cloud representing each building roof (Figure 8a). For each point cloud of the building roof, a concave hull in the form of a 2D polygon is estimated with the alpha shape algorithm (Figure 8b). The concave hull is then generalised with the Douglas-Peucker algorithm (Figure 8c). This enables a smoother and generalised border for the outline polygon. Finally, the generalised polygon is regularised to obtain the shape of the building outline with perpendicular angles (Figure 8d).
For the illustration of the developed workflow, we focused on four selected buildings in the study area with different roof types (Figure 9). Figure 9d shows the result of processing for the building with a two-level gable roof (Figure 1d), where two building outlines were generated and therefore processed separately. The quality analysis of the extracted outlines in terms of relative positional accuracy with respect to the input point cloud is presented in Section 4.5.
4.4. 3D Building Models
The first part of the 3D building modelling workflow consists of roof surface reconstruction. In the ETL environment, we firstly create enlarged roof planes. Each roof patch is transformed to an XY-plane, buffered for 1 m, and then rotated back to its initial position due to the limited tools for 3D spatial data manipulation. Further, the intersection between enlarged roof planes is determined, which enables defining the topological relationship between adjacent roof patches (Figure 10). The intersection lines are then projected to previously extracted 2D roof outline polygons. The intersection divides the outline polygon into separate roof parts (Figure 11). In the case of a simple flat roof, there was no intersection because only one roof plane was present, so this type of roof is not shown in Figure 10 and Figure 11. In Figure 11c, a line between two building parts is also shown.
When separate outline parts are generated, they have the defined shape and extend with respect to the input point cloud for each roof. To obtain the right orientation, the roof planes are draped to the initial roof patches. The result is the 3D roof surface (Figure 12).
Finally, the 3D roof surface with the information about ground surface elevation is used to reconstruct a 3D surface model containing roof surface, wall surface, and ground surface. The ground surface elevation was determined manually from the point cloud related to the terrain surface and provided to the custom transformer for wall and ground surface reconstruction within the spatial ETL environment. The walls are vertical and connect the edge of the roof and the ground part of the model without any roof eaves, which shows the greatest extent of the building in the space and is in accordance with the concept of the LOD2 model defined in OGC CityGML standard. For each model, geometric features obtained semantic attributes according to their role in the model, e.g., RoofSurface, WallSurface, GroundSurface (Figure 13).
The generated 3D model is exported from the ETL environment in the vector file format consistent with the OGC CityGML standard. The surfaces of each model are coloured according to their semantic representation, namely roof, wall, and ground (Figure 14). The resulting building models are presented with differentiated roof shapes. The walls are vertical, modelled from the roof eaves to the ground level of the building, which approximates the maximum extent of the building in the real world. The topology of the model complies with the requirements of the OGC CityGML standard.
4.5. Quality Assessment
For the quality assessment of the extracted building outlines, we compared the position of the input point cloud representing the roof in the cloud and the vertex points of the extracted roof outline. The values of RMSE2D for each selected building in our study area are presented in Table 6. The average value of RMSE in 2D space for all selected buildings was 0.136 m.
As we can see in Table 6, the inner positional accuracy with respect to the input point cloud is below 0.15 m for all selected buildings, except for the building with a flat roof. Since the density of the input point cloud was set to 0.10 m or less, the positional accuracy of the outlines is in line with our expectations. It also satisfies the requirements to reconstruct the building with positional and geometric accuracy better than 0.5 m, which is the accuracy threshold set in Slovenian large-scale topographic data.
To analyse the geometric quality of the reconstructed 3D building models, we compared the models with the input photogrammetric point cloud. The graphical representation of the deviation of the reconstructed roof model from the input point cloud is shown in Figure 15.
If we analyse all computed deviations between the point cloud and 3D building models, the derived mean value is 0.023 m, with a standard deviation of 0.059 m. The distribution of distances is asymmetrical and shifted towards positive values, which means that the points in the cloud are more likely to be above the building models. By analysing the absolute distances between the point cloud and the models, it can be seen that 99% of the points deviate less than 0.130 m from the nearest surface of the model.
As can be seen in Figure 15, if the roof is reconstructed from fewer planar patches, the reconstructed model matches better with the input point cloud, compared to the models that have a more complex roof, where the deviation is larger. The reason is that in the case of a more complex roof shape there is a higher need to generalise and regularise the geometry, to obtain a topologically correct 3D model. Consequently, the generalised 3D model deviates more from the input point cloud data.
The final step of quality assessment was the validation of the models with the open-source application val3dity. According to the results, all reconstructed models are geometrically valid.
5. Discussion
The previously published studies on data-driven 3D building modelling from the point cloud were mainly designed for LiDAR data [11,33]. In our case, we decided to use a UAV photogrammetric point cloud, because it has not yet been widely used for 3D building modelling. Although a laser scanning point cloud and a photogrammetric point cloud seem alike, each of them has its own characteristics, which must be considered when using them as a data source for 3D building modelling.
The developed 3D building modelling workflow includes the complete workflow from the input photogrammetric point cloud processing to the final reconstruction of a 3D building model in the semantic vector format, in accordance with the OGC CityGML standard for LOD2 [5]. In general, the workflow consists of four main steps divided into three parts: the point cloud segmentation and planar roof patches detection (Part 1), roof outline extraction (Part 2), and 3D building model reconstruction (Part 3). Part 2 and Part 3 have been completely performed within the ETL environment, which is a novelty in data-driven 3D building modelling based on a point cloud. The spatial ETL solution has been used to address the challenges related to the manipulation of 3D geospatial data, which is needed for this purpose.
In the proposed 3D building modelling workflow, we start with point cloud segmentation. The first step includes the determination of geometric properties of the point in the point cloud, which are often used in the procedures for point cloud segmentation and classification [46,51,52]. The values of surface variation as a simple geometric feature were computed for each point in the cloud with respect to the fixed neighbourhood. This enables the extractions of planar regions from the scene when retaining only points with a lower surface variation. The advantage of our approach is its simplicity, which made it possible to obtain results in a fast and efficient manner. Since our aim was only to find points of planar regions, the surface variation was a proper parameter to find the groups of points that correspond to the building roofs. The first drawback of this approach is the fact it uses a fixed neighbourhood to compute the surface variation and thus requires knowledge of the scene and point cloud density to define proper values for the size of the neighbourhood, from which the surface variation is computed. We provide a similar density of the point cloud. The size of the fixed neighbourhood was determined following the criteria that at least 95% of all points had at least 15 points in its neighbourhood. When point cloud density varies within the input point cloud, the performance for neighbourhood determination could be improved by applying the adaptive size of the neighbourhood, as proposed in [53]. The second disadvantage of the approach is that, after excluding the points with a higher surface variation from the cloud, we may lose some points on the edges of planar regions, which can further affect modelling accuracy. In our case, the threshold value of surface variation for the selected study area was set empirically based on the characteristics of the scene. Compared to the findings in [53], we used a slightly higher threshold, aiming not to lose the necessary points on the roof ridge and roof edges for further modelling. For better robustness of the point cloud segmentation and its applicability to other case studies, additional geometric features could be computed for each point in the point cloud, based on eigenvalues of the covariance matrix within the point’s local neighbourhood. These features and their combinations can be used in advanced algorithms for point cloud segmentation [51,54]. Additionally, points in the photogrammetric point cloud contain essential information about colour, which can be added in the point cloud segmentation, as suggested in [55].
The second step of point cloud segmentation is the extraction of groups of points as connected components. The method of connected component analysis is well known in the field of image analysis, but also often used in point cloud processing to group points with a similar spatial distribution [34]. In our workflow, the method yields good results for the extraction of the group of points corresponding to the building roof. The advantage of the approach is the fact that no auxiliary data (e.g., building outlines or footprints from the topographic or cadastral database) is needed to extract the groups of points corresponding to the building, which is the case in many previously published studies [8,56]. The weakness of the method is the fact that the operator must consider setting the proper values of the parameters used in the method, in order to obtain accurate results. This means that the method is highly dependent on the dataset used in the workflow. For our study area, the extraction of connected components as a group of points for building roofs worked well, because we used the photogrammetric point cloud obtained from UAV imagery acquired only in nadir view. This resulted in points being present only on the building roof, and not also on facades. If the point cloud is created from the nadir and oblique imagery, the points will be present on the roof and the facades. For further roof surface modelling, the point cloud corresponding to the complete building must be split into several point clouds, one for the roof and others for facades. For further research, it would be interesting to also determine the connected components in the photogrammetric point cloud obtained from oblique imagery, which will make it possible to extend the usability of our developed modelling workflow to diverse datasets.
Our modelling workflow is highly dependent on the planar roof patches detection, because only the planar patches detected in this step are the object of further roof surface modelling. The efficient RANSAC algorithm used for planar patches detection enables detection of the planes in the cloud, which was proven in several previous publications [29,47]. A similar approach to ours was used in [48], with the difference that our approach detects the planes only for the roof surface, because the workflow is developed to reconstruct a building model corresponding LOD2 of the OGC CityGML standard, where detailed façade modelling is not expected. Since we use a data-driven modelling approach, the RANSAC parameters are tailored to the dataset used in the workflow. The essential parameter that a user needs to consider is the minimum points for the definition of a plane, which will allow detection of all roof patches that properly define the roof surface.
The building outline generation in our workflow is important for the determination of building position and orientation in space. In our case, we used the alpha shape algorithm that determines concave 2D polygon for each building or building part detected as one connected component in the point cloud. Further, we performed the generalisation using the Douglas-Peucker algorithm, and the regularisation of extracted polygons. All operations for building outline generation were conducted within the spatial ETL, which is a novelty compared to other studies for building modelling. The use of the spatial ETL is beneficial, because it allows the monitoring of each step in the procedure, including modification of processing parameters, such as tolerance values of generalisation and regularisation parameters. We aimed to reconstruct a building model from UAV point cloud without any additional spatial data. If a building outline is available in the existing databases, it could be integrated into our workflow. However, the proper definition and quality of a building outline are required, as it affects the quality of the building model.
Since our workflow for building outline generation is data-driven and, thus, highly dependent on the completeness of given input point cloud, it is sensitive to gaps or missing parts in the point cloud, which can arise due to occlusions in the scene. Due to the characteristics of a photogrammetric point cloud, the building outline extraction is possible only in the case of a complete point cloud representing a building roof. In our case, it also appeared that points in the cloud were missing, due to shadows caused by other structures in the scene, and the algorithm is not able to extract an accurate shape of the outline. We encounter this issue in our case when there is vegetation near the building, and it covers part of the roof. Since a dense image matching algorithm is not able to produce points in the point cloud below the vegetation, the points in the cloud that correspond to the building roof are missing if it is partly covered by a tree canopy. Consequently, the algorithm for outline extraction is not able to produce an accurate shape of the outline. Figure 16 shows an example of an inaccurate shape of the outline caused by the omission of points that represent the roof. For improving the outline generation for such cases, additional geometric constraints on the shape of the outline should be added. The completeness of outline generation could be improved by integrating additional data sources, such as LiDAR point cloud, which contains also point beneath the vegetation. For accurate results, high LiDAR point cloud density must be ensured.
The quality analysis of generated 2D outlines for selected buildings showed that the procedures of generalisation and regularisation reduce the positional accuracy, compared to input point cloud data. However, in our case study, the proposed workflow still satisfies the requirements for positional accuracy proposed for the CityGML model in LOD2, or given in the Slovenian national standards for large-scale topography.
The final part of the workflow consists of 3D building modelling, which is, again, fully developed within the spatial ETL environment. The planar roof patches and 2D building outlines are used. The developed 3D building models are in compliance with the OGC CityGML standard, LOD2. The average inner positional accuracy for the created building models is 0.023 m. The roof models are simple, and consist of planar surfaces; additional roof details, such as dormers and chimneys, are not modelled. The walls are vertical and connected with the roof on the outer boundary of the roof surface without any eaves. The reconstructed models are generalised; firstly, the generalisation and regularisation are performed within building outline generation; secondly, the generalisation refers to 3D building reconstruction where not all details of a roof are considered. This is more explicit in the model with a complex roof type (e.g., cross gable roof, Figure 1c), where more regularisation was needed to obtain well-ordered topology. In Figure 17, we can see that in some cases the roof surface of the model deviates from the point cloud, due to the regularisation and generalisation of the model (Figure 17a). In other cases, only part of a surface is not aligned with the point cloud, which happens due to the non-planarity and irregularity of the roof in the scene (Figure 17b).
The use of UAV data for 3D building reconstruction was already presented in [48], where the authors focused on point cloud segmentation approach and the planar modelling method to create models of facades, roofs and the grounds based on local normal vectors. In our case, the building model is simplified. The resulting building models are presented with differentiated roof shapes, where the walls are vertical, modelled from the roof eaves to the ground level of the building, which approximates the maximum extent of the building in the real world. The focus of our approach has been on complete workflow from point cloud processing to 3D building modelling, where the final result was a 3D building model in the form of a solid, with a defined and validated geometry and topology in accordance to the OGC CityGML standard. For each building model, geometric features obtain semantic attributes according to their role in the model, e.g., RoofSurface, WallSurface, GroundSurface (Figure 13). The novelty in our approach is in particular in the introduction of the spatial ETL functionalities, which enable a user-friendly environment to process photogrammetric point cloud for 3D building reconstruction.
The developed model (workflow) enables us to execute the whole processing on other datasets, where each step can be modified using different processing parameters considering the desired positional accuracy. The developed workflow for data-driven 3D building modelling could be used for various point cloud data sources and different user applications where building models in 3D are needed. Here we have in mind especially large-scale topographic mapping, 3D city modelling for spatial planning and for various spatial analysis, such as visibility analysis, energy demand assessment, and solar potential estimation. The added value of the proposed workflow is in the holistic and transparent data-driven modelling approach from input point cloud data to the development of a 3D building model consistent with the OGC CityGML standard, LOD2.
6. Conclusions
In this paper, we have presented an approach to data-driven 3D building modelling in the spatial ETL environment, using UAV photogrammetric point cloud as input data. The proposed approach covers the complete modelling workflow, from initial photogrammetric point cloud processing to the final polyhedral building model, developed in accordance with the OGC CityGML standard, LOD2.
While there are software solutions available for the photogrammetric point cloud processing, e.g., segmentation and planar patches detection, the task has been particularly challenging for 3D building model reconstruction, where the current software support is inadequate and individual algorithms are available from different providers, within different software. Aiming to have complete control over 3D building modelling based on a segmented (photogrammetric) point cloud, we decided to test the functionalities of spatial ETL. Within the spatial ETL environment, we used the available algorithms for 3D building modelling, where the final result was a 3D building model in the form of a solid, with a defined geometry and topology. The advantage of using ETL is in its transparent data processing and modelling, which enables the developer to control each step. The use of spatial ETL functionalities has shown many advantages in the modelling process, where complete control can be exercised, each step can be repeated, including the assessment of the results of each step. As already emphasised, the proposed workflow is not completely developed within the spatial ETL environment, as there was no need to pre-process UAV data, i.e., perform point cloud segmentation and planar roof patches extraction, with ETL. Additionally, it has to be outlined that we focused on the processes of 3D building modelling up to the generation of 3D solid geometry, topology validation, and the definition of basic semantics of graphical elements, as suggested by the OGC CityGML standard [5]. However, within a spatial ETL environment, further data processing can be performed, for example loading the data into a target database, such as a topographic database, which is an additional advantage of using a spatial ETL environment.
The developed data-driven modelling workflow was applied to a study area in Slovenia, where a UAV photogrammetric point cloud produced from nadir imageries was available. The approach was tested for four selected buildings with different roof types. The quality assessment of the results showed that it is possible to reconstruct a 3D building model with an inner positional accuracy below 0.15 m, which is in accordance with the requirements of large-scale topographic mapping in Slovenia. Therefore, the developed workflow is in particular interesting for updating national topographic datasets or the large-scale topographic mapping of smaller areas for development projects, such as rural development projects, despite some disadvantages of using UAV, e.g., legal restrictions for flights in an urban environment.
For further research, the developed 3D building modelling approach could be improved in such a way as to allow reconstructing buildings with a more complex roof, containing dormers or a similar constructions on the roof. The workflow was tested only on one UAV dataset from a relatively small scene. To exploit the full potential of the modelling workflow, it could be applied to other photogrammetric and laser scanning datasets, including oblique images, related to different types and shapes of buildings, and to a higher level of details of building models, e.g., LOD3.
Author Contributions
Conceptualisation, U.D. and A.L.; methodology, U.D., A.L. and J.T.; software, U.D. and J.T.; validation, U.D. and J.T.; formal analysis, U.D.; investigation, U.D.; resources, U.D. and A.L.; writing—original draft preparation, U.D., A.L., J.T. and M.K.F.; writing—review and editing, U.D., A.L., J.T. and M.K.F.; visualisation, U.D.; supervision, A.L. All authors have read and agree to the published version of the manuscript.
Funding
This work was funded by the Slovenian Research Agency – ARRS (research core funding No. P2-0406 Earth observation and geoinformatics).
Acknowledgments
The authors acknowledge Marjan Čeh, Klemen Kozmus Trajkovski and Albin Mencin for the UAV data acquisition. The authors are very grateful to three anonymous reviewers and the editor for their constructive and helpful suggestions. A special acknowledgement goes to Ms Jean McCollister for English proofreading.
Conflicts of Interest
The authors declare no conflict of interest.
References
- Biljecki, F.; Stoter, J.; Ledoux, H.; Zlatanova, S.; Çöltekin, A. Applications of 3D city models: State of the art review. ISPRS Int. J. Geo-Inf. 2015, 4, 2842–2889. [Google Scholar] [CrossRef] [Green Version]
- Rahman, A.A. Advances in 3D Geoinformation; Springer: Berlin/Heidelberg, Germany, 2017. [Google Scholar]
- Thomsen, C. ETL. In Encyclopedia of Big Data Technologies; Sakr, S., Zomaya, A., Eds.; Springer: Berlin/Heidelberg, Germany, 2018; pp. 1–5. ISBN 978-3-319-63962-8. [Google Scholar]
- SafeSoftware, Inc., FME (Feature Manipulation Engine), Desktop Documentation. Available online: https://docs.safe.com/fme/html/FME_Desktop_Documentation/FME_Transformers/transformer-index.htm (accessed on 20 March 2020).
- Open Geospatial Consortium. City Geography Markup Language (CityGML) Encoding Standard, Version 2.0 2012. Available online: https://www.ogc.org/standards/citygml (accessed on 14 April 2020).
- Brenner, C. Building reconstruction from images and laser scanning. Int. J. Appl. Earth Obs. Geoinf. 2005, 6, 187–198. [Google Scholar] [CrossRef]
- Kaartinen, H.; Hyyppä, J.; Gülch, E.; Hyyppä, H.; Matikainen, L.; Vosselman, G.; Hofmann, A.D.; Mäder, U.; Persson, Å.; Söderman, U.; et al. EuroSDR Building Extraction Comparison. In Proceedings of the ISPRS Hannover Workshop 2005: High-Resolution Earth Imaging for Geospatial Information, Hannover, Germany, 17–20 May 2005. [Google Scholar]
- Haala, N.; Kada, M. An update on automatic 3D building reconstruction. ISPRS J. Photogramm. Remote Sens. 2010, 65, 570–580. [Google Scholar] [CrossRef]
- Rottensteiner, F.; Sohn, G.; Gerke, M.; Wegner, J.D.; Breitkopf, U.; Jung, J. Results of the ISPRS benchmark on urban object detection and 3D building reconstruction. ISPRS J. Photogramm. Remote Sens. 2014, 93, 256–271. [Google Scholar] [CrossRef]
- Tomljenovic, I.; Höfle, B.; Tiede, D.; Blaschke, T. Building extraction from Airborne Laser Scanning data: An analysis of the state of the art. Remote Sens. 2015, 7, 3826–3862. [Google Scholar] [CrossRef] [Green Version]
- Dorninger, P.; Pfeifer, N. A comprehensive automated 3D approach for building extraction, reconstruction, and regularization from airborne laser scanning point clouds. Sensors 2008, 8, 7323–7343. [Google Scholar] [CrossRef] [Green Version]
- Oude Elberink, S.; Vosselman, G. Building reconstruction by target based graph matching on incomplete laser data: Analysis and limitations. Sensors 2009, 9, 6101–6118. [Google Scholar] [CrossRef]
- Kada, M.; McKinley, L. 3D building reconstruction from LiDAR based on a cell decomposition approach. In Proceedings of the CMRT09: Object Extraction for 3D City Models, Road Databases and Traffic Monitoring-Concepts, Algorithms and Evaluation, Paris, France, 3–4 September 2009; pp. 47–52. [Google Scholar]
- Pu, S.; Vosselman, G. Knowledge based reconstruction of building models from terrestrial laser scanning data. ISPRS J. Photogramm. Remote Sens. 2009, 64, 575–584. [Google Scholar] [CrossRef]
- Kedzierski, M.; Fryskowska, A. Methods of laser scanning point clouds integration in precise 3D building modelling. Measurement 2015, 74, 221–232. [Google Scholar] [CrossRef]
- Wang, H.; Zhang, W.; Chen, Y.; Chen, M.; Yan, K. Semantic decomposition and reconstruction of compound buildings with symmetric roofs from LiDAR data and aerial imagery. Remote Sens. 2015, 7, 13945–13974. [Google Scholar] [CrossRef] [Green Version]
- Zhang, Z.; Gerke, M.; Vosselman, G.; Yang, M.Y. A patch-based method for the evaluation of dense image matching quality. Int. J. Appl. Earth Obs. Geoinf. 2018, 70, 25–34. [Google Scholar] [CrossRef]
- Xiao, J.; Gerke, M.; Vosselman, G. Building extraction from oblique airborne imagery based on robust façade detection. ISPRS J. Photogramm. Remote Sens. 2012, 68, 56–68. [Google Scholar] [CrossRef]
- Bulatov, D.; Häufel, G.; Meidow, J.; Pohl, M.; Solbrig, P.; Wernerus, P. Context-based automatic reconstruction and texturing of 3D urban terrain for quick-response tasks. ISPRS J. Photogramm. Remote Sens. 2014, 93, 157–170. [Google Scholar] [CrossRef]
- Li, M.; Nan, L.; Smith, N.; Wonka, P. Reconstructing building mass models from UAV images. Comput. Graph. 2016, 54, 84–93. [Google Scholar] [CrossRef] [Green Version]
- Toschi, I.; Nocerino, E.; Remondino, F.; Revolti, A.; Soria, G.; Piffer, S. Geospatial data processing for 3D city model generation, management and visualization. Int. Arch. Photogramm. Remote Sens. Spat. Inf. Sci. 2017, XLII-1/W1, 527–534. [Google Scholar] [CrossRef] [Green Version]
- Wen, X.; Xie, H.; Liu, H.; Yan, L. Accurate Reconstruction of the LoD3 Building Model by Integrating Multi-Source Point Clouds and Oblique Remote Sensing Imagery. ISPRS Int. J. Geo-Inf. 2019, 8, 135. [Google Scholar] [CrossRef] [Green Version]
- Tack, F.; Buyuksalih, G.; Goossens, R. 3D building reconstruction based on given ground plan information and surface models extracted from spaceborne imagery. ISPRS J. Photogramm. Remote Sens. 2012, 67, 52–64. [Google Scholar] [CrossRef] [Green Version]
- Lafarge, F.; Descombes, X.; Zerubia, J.; Pierrot-Deseilligny, M. Automatic building extraction from DEMs using an object approach and application to the 3D-city modeling. ISPRS J. Photogramm. Remote Sens. 2008, 63, 365–381. [Google Scholar] [CrossRef] [Green Version]
- Musialski, P.; Wonka, P.; Aliaga, D.G.; Wimmer, M.; Van Gool, L.; Purgathofer, W. A survey of urban reconstruction. Comput. Graph. Forum 2013, 32, 146–177. [Google Scholar] [CrossRef]
- Tahar, K.N.; Ahmad, A. An Evaluation on Fixed Wing and Multi-Rotor UAV Images using Photogrammetric Image Processing. Int. J. Comput. Electr. Autom. Control Inf. Eng. 2013, 7, 48–52. [Google Scholar]
- Crommelinck, S.; Bennett, R.; Gerke, M.; Nex, F.; Yang, M.Y.; Vosselman, G. Review of automatic feature extraction from high-resolution optical sensor data for UAV-based cadastral mapping. Remote Sens. 2016, 8, 689. [Google Scholar] [CrossRef] [Green Version]
- Tarsha-Kurdi, F.; Landes, T.; Grussenmeyer, P.; Koehl, M. Model-driven and data-driven approaches using LIDAR data: Analysis and comparison. Int. Arch. Photogramm. Remote Sens. Spat. Inf. Sci. 2007, XXXVI-3/W4, 87–92. [Google Scholar]
- Tarsha-Kurdi, F.; Landes, T.; Grussenmeyer, P. Extended RANSAC Algorithm for Automatic Detection of Building Roof Planes From Lidar Data. Photogramm. J. Finl. 2008, 21, 97–109. [Google Scholar]
- Brenner, C. Towards fully automatic generation of city models. Int. Arch. Photogramm. Remote Sens. 2000, XXXIII-B3/, 84–92. [Google Scholar]
- Vosselman, G. Building reconstruction using planar faces in very high density height data. Int. Arch. Photogramm. Remote Sens. 1999, XXXII-3/2W, 87–92. [Google Scholar]
- Satari, M.; Samadzadegan, F.; Azizi, A.; Maas, H.G. A Multi-Resolution Hybrid Approach for Building Model Reconstruction from Lidar Data. Photogramm. Rec. 2012, 27, 330–359. [Google Scholar] [CrossRef]
- Rottensteiner, F. Automatic generation of high-quality building models from LiDAR data. IEEE Comput. Graph. Appl. 2003, 23, 42–50. [Google Scholar] [CrossRef] [Green Version]
- Sohn, G.; Huang, X.; Tao, V. Using a Binary Space Partitioning Tree for Reconstructing Polyhedral Building Models from Airborne Lidar Data. Photogramm. Eng. Remote Sens. 2008, 74, 1425–1438. [Google Scholar] [CrossRef] [Green Version]
- Xiong, B.; Jancosek, M.; Oude Elberink, S.; Vosselman, G. Flexible building primitives for 3D building modeling. ISPRS J. Photogramm. Remote Sens. 2015, 101, 275–290. [Google Scholar] [CrossRef]
- Xiong, B.; Oude Elberink, S.; Vosselman, G. A graph edit dictionary for correcting errors in roof topology graphs reconstructed from point clouds. ISPRS J. Photogramm. Remote Sens. 2014, 93, 227–242. [Google Scholar] [CrossRef]
- Gröger, G.; Plümer, L. CityGML- Interoperable semantic 3D city models. ISPRS J. Photogramm. Remote Sens. 2012, 71, 12–33. [Google Scholar] [CrossRef]
- Kolbe, T.H. Representing and exchanging 3D city models with CityGML. In 3D Geo-Information Sciences; Lee, J., Zlatanova, S., Eds.; Springer: Berlin/Heidelberg, Germany, 2009; pp. 15–31. ISBN 978-3-540-87395-2. [Google Scholar]
- van den Brink, L.; Stoter, J.; Zlatanova, S. Establishing a national standard for 3D topographic data compliant to CityGML. Int. J. Geogr. Inf. Sci. 2013, 27, 92–113. [Google Scholar] [CrossRef]
- Vassiliadis, P. A Survey of Extract-Transform-Load A Survey of Extract–Transform–Load Technology. Int. J. Data Warehous. Min. 2009, 5, 1–27. [Google Scholar] [CrossRef] [Green Version]
- Astriani, W.; Trisminingsih, R. Extraction, Transformation, and Loading (ETL) Module for Hotspot Spatial Data Warehouse Using Geokettle. Procedia Environ. Sci. 2016, 33, 626–634. [Google Scholar] [CrossRef] [Green Version]
- Šušteršič, K.; Podobnikar, T. Prostorski ETL za boljšo medopravilnost v GIS. Geod. Vestn. 2013, 57, 719–733. [Google Scholar] [CrossRef]
- Safe Software Inc. FME (Feature Manipulation Engine). Available online: https://www.safe.com/ (accessed on 21 December 2019).
- Agisoft Photoscan. Available online: https://www.agisoft.com/ (accessed on 24 May 2020).
- CloudCompare. Available online: https://www.cloudcompare.org/ (accessed on 2 January 2020).
- Hackel, T.; Wegner, J.D.; Schindler, K. Contour detection in unstructured 3D point clouds. In Proceedings of the IEEE Computer Society Conference on Computer Vision and Pattern Recognition, Las Vegas, NV, USA, 27–30 June 2016; pp. 1610–1618. [Google Scholar] [CrossRef]
- Schnabel, R.; Wahl, R.; Klein, R. Efficient RANSAC for Point-Cloud Shape Detection. Comput. Graph. Forum 2007, 26, 214–226. [Google Scholar] [CrossRef]
- Malihi, S.; Zoej, M.J.V.; Hahn, M. Large-scale accurate reconstruction of buildings employing point clouds generated from UAV imagery. Remote Sens. 2018, 10, 1148. [Google Scholar] [CrossRef] [Green Version]
- Ledoux, H. On the validation of solids represented with the international standards for geographic information. Comput. Civ. Infrastruct. Eng. 2013, 28, 693–706. [Google Scholar] [CrossRef] [Green Version]
- Ledoux, H. val3dity: Validation of 3D GIS primitives according to the international standards. Open Geospatial Data Softw. Stand. 2018, 3, 1–12. [Google Scholar] [CrossRef]
- Weinmann, M.; Jutzi, B.; Hinz, S.; Mallet, C. Semantic point cloud interpretation based on optimal neighborhoods, relevant features and efficient classifiers. ISPRS J. Photogramm. Remote Sens. 2015, 105, 286–304. [Google Scholar] [CrossRef]
- Sampath, A.; Shan, J. Segmentation and reconstruction of polyhedral building roofs from aerial lidar point clouds. IEEE Trans. Geosci. Remote Sens. 2010, 48, 1554–1567. [Google Scholar] [CrossRef]
- He, Y.; Zhang, C.; Awrangjeb, M.; Fraser, C.S. Automated Reconstruction of Walls From Airborne Lidar Data for Complete 3D Building Modelling. Int. Arch. Photogramm. Remote Sens. Spat. Inf. Sci. 2012, XXXIX-B3, 115–120. [Google Scholar] [CrossRef] [Green Version]
- Gevaert, C.M.; Persello, C.; Vosselman, G. Optimizing multiple kernel learning for the classification of UAV data. Remote Sens. 2016, 8. [Google Scholar] [CrossRef] [Green Version]
- Dai, Y.; Gong, J.; Li, Y.; Feng, Q. Building segmentation and outline extraction from UAV image-derived point clouds by a line growing algorithm. Int. J. Digit. Earth 2017, 10, 1077–1097. [Google Scholar] [CrossRef]
- Henn, A.; Gröger, G.; Stroh, V.; Plümer, L. Model driven reconstruction of roofs from sparse LIDAR point clouds. ISPRS J. Photogramm. Remote Sens. 2013, 76, 17–29. [Google Scholar] [CrossRef]
Figure 1.
Selected building roof types for 3D building modelling shown in the photogrammetric point cloud: (a) flat roof; (b) gable roof; (c) cross gable roof; (d) two-level gable roof.
Figure 1.
Selected building roof types for 3D building modelling shown in the photogrammetric point cloud: (a) flat roof; (b) gable roof; (c) cross gable roof; (d) two-level gable roof.

Figure 2.
The proposed workflow for 3D building modelling based on the unstructured UAV photogrammetric point cloud.
Figure 2.
The proposed workflow for 3D building modelling based on the unstructured UAV photogrammetric point cloud.

Figure 3.
The processing workflow for building outline extraction in the spatial extract, transform, load (ETL).
Figure 3.
The processing workflow for building outline extraction in the spatial extract, transform, load (ETL).

Figure 4.
The processing workflow for building model reconstruction in the spatial ETL.

Figure 5.
The values of the surface variation for each point the cloud: (a) the values of surface variation for the whole cloud; (b) the points in the cloud that have the value of surface variation lower than 0.03, and were retained in the cloud for further planar roof patches detection.
Figure 5.
The values of the surface variation for each point the cloud: (a) the values of surface variation for the whole cloud; (b) the points in the cloud that have the value of surface variation lower than 0.03, and were retained in the cloud for further planar roof patches detection.

Figure 6.
The connected components of the point cloud: (a) the largest component represents the terrain; (b) the next 14 connected components represent building roofs.
Figure 6.
The connected components of the point cloud: (a) the largest component represents the terrain; (b) the next 14 connected components represent building roofs.

Figure 7.
(a) The input point cloud for planar roof patches detection; (b) The detected roof patches for gabled roof type by using the efficient random sample consensus (RANSAC) algorithm.
Figure 7.
(a) The input point cloud for planar roof patches detection; (b) The detected roof patches for gabled roof type by using the efficient random sample consensus (RANSAC) algorithm.

Figure 8.
The results of the building outline extraction: (a) the input photogrammetric point cloud for a selected building in nadir view; (b) the estimated concave hull with the alpha algorithm; (c) the generalised building outline with the Douglas-Peucker algorithm; (d) the regularised building outline with perpendicular angles.

Figure 9.
The extracted building outlines for each selected building in the study area: (a) flat roof; (b) gable roof; (c) cross gable roof; (d) two-level gable roof.
Figure 9.
The extracted building outlines for each selected building in the study area: (a) flat roof; (b) gable roof; (c) cross gable roof; (d) two-level gable roof.

Figure 10.
The intersection between adjacent enlarged roof planes; (a) gable roof; (b) cross gable roof; (c) two-level gable roof.
Figure 10.
The intersection between adjacent enlarged roof planes; (a) gable roof; (b) cross gable roof; (c) two-level gable roof.

Figure 11.
The intersection lines are projected to an XY-plane to divide the roof outline polygon to create separate roof parts: (a) gable roof; (b) cross gable roof; (c) two-level gable roof.
Figure 11.
The intersection lines are projected to an XY-plane to divide the roof outline polygon to create separate roof parts: (a) gable roof; (b) cross gable roof; (c) two-level gable roof.

Figure 12.
The 3D roof surface: (a) flat roof; (b) gable roof (c) cross gable roof; (d) two-level gable roof.
Figure 12.
The 3D roof surface: (a) flat roof; (b) gable roof (c) cross gable roof; (d) two-level gable roof.

Figure 13.
The features of CityGML model: (a) GroundSurface; (b) WallSurface (c) RoofSurafce; (d) complete building model.
Figure 13.
The features of CityGML model: (a) GroundSurface; (b) WallSurface (c) RoofSurafce; (d) complete building model.

Figure 14.
The final 3D building models (Level of Detail 2 (LOD2)) with different roof types: (a) flat roof; (b) gable roof (c) cross gable roof; (d) two-level gable roof.
Figure 14.
The final 3D building models (Level of Detail 2 (LOD2)) with different roof types: (a) flat roof; (b) gable roof (c) cross gable roof; (d) two-level gable roof.

Figure 15.
The deviation of reconstructed 3D building models (roofs) from the input point cloud.

Figure 16.
The inaccurate shape of the extracted roof outline due to the missing points in the cloud that correspond to the roof: (a) the input point cloud; (b) the points in cloud representing the roof; (c) the extracted roof outline.
Figure 16.
The inaccurate shape of the extracted roof outline due to the missing points in the cloud that correspond to the roof: (a) the input point cloud; (b) the points in cloud representing the roof; (c) the extracted roof outline.

Figure 17.
The deviations of the input point cloud with respect to the reconstructed 3D model (green colour indicates small deviations, blue and red colour show larger deviations): (a) the roof surface deviates from the point cloud, due to regularisation of the model; (b) only part of the surface is not aligned with the cloud, because the real roof surface in the scene is not planar.


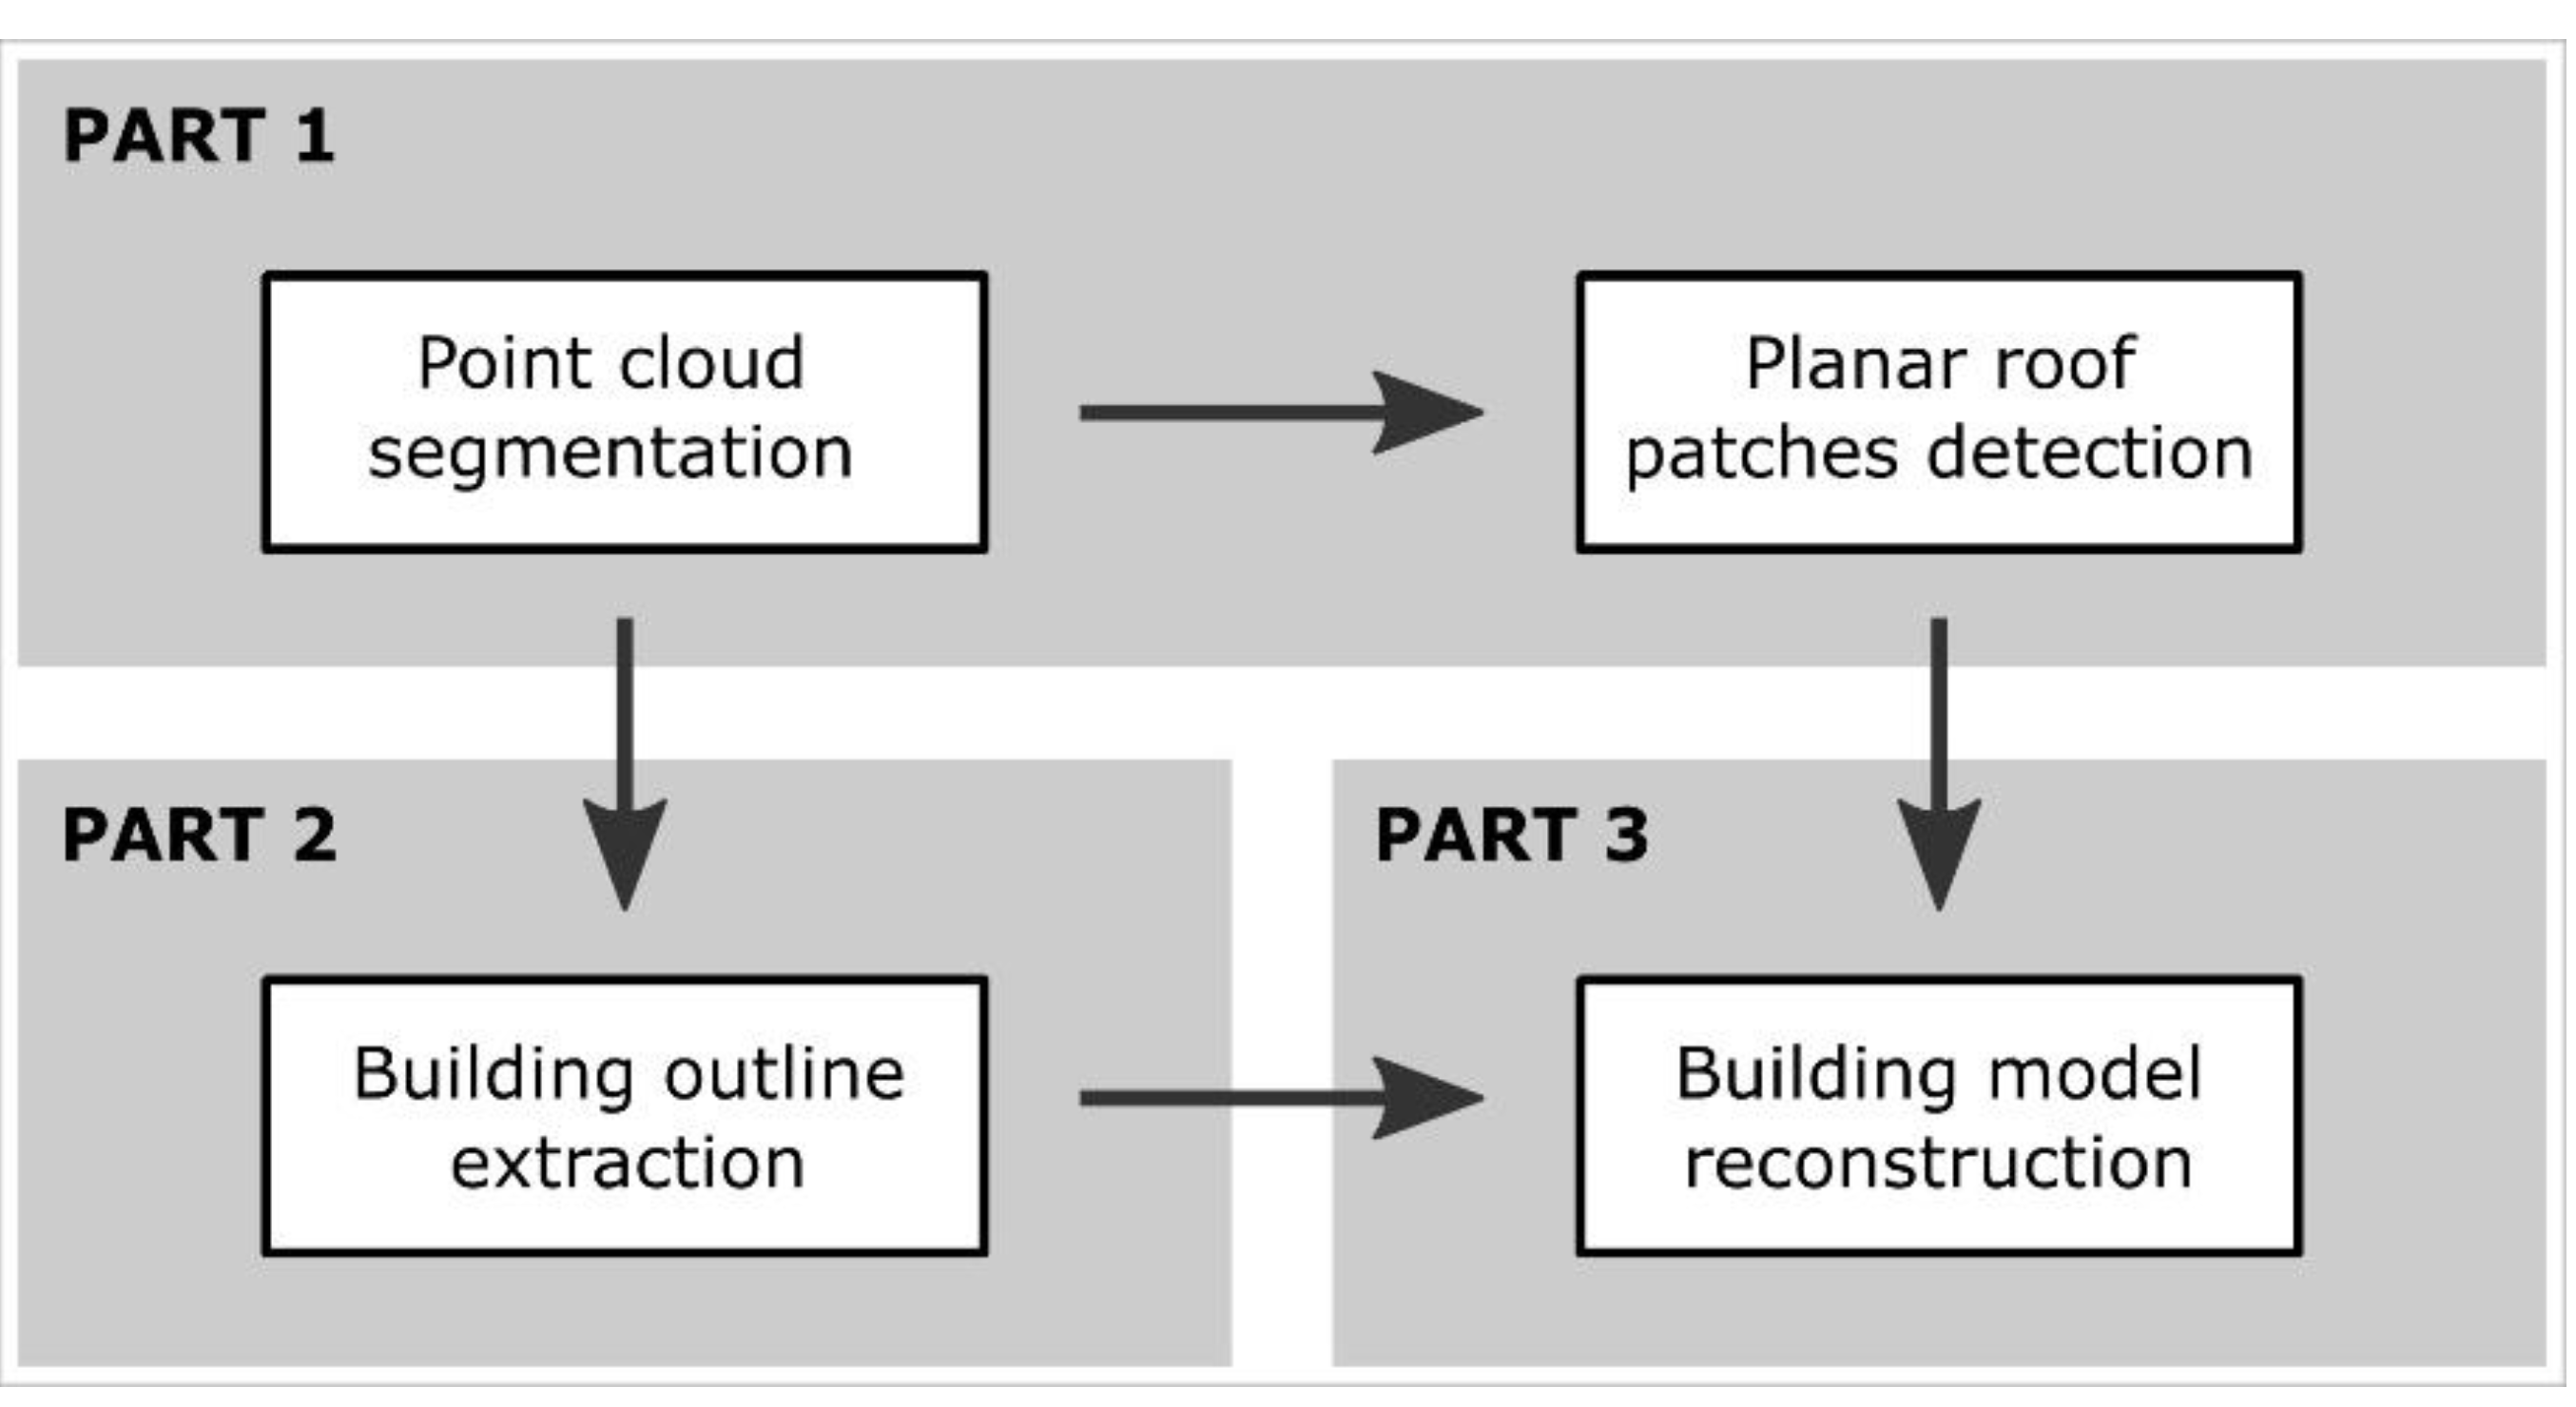
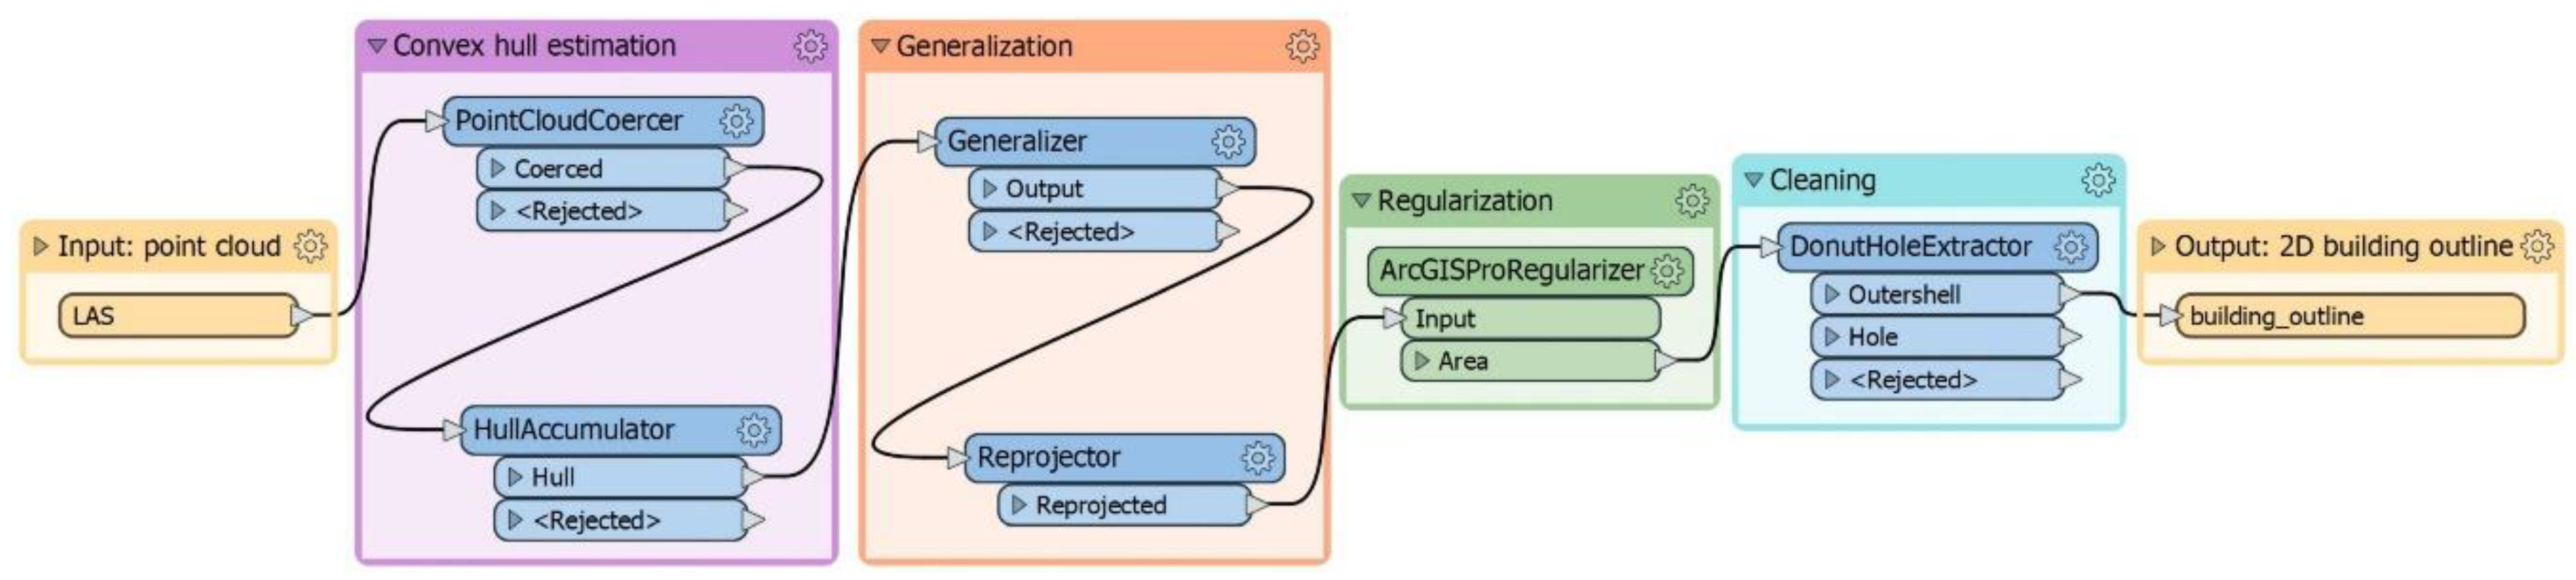
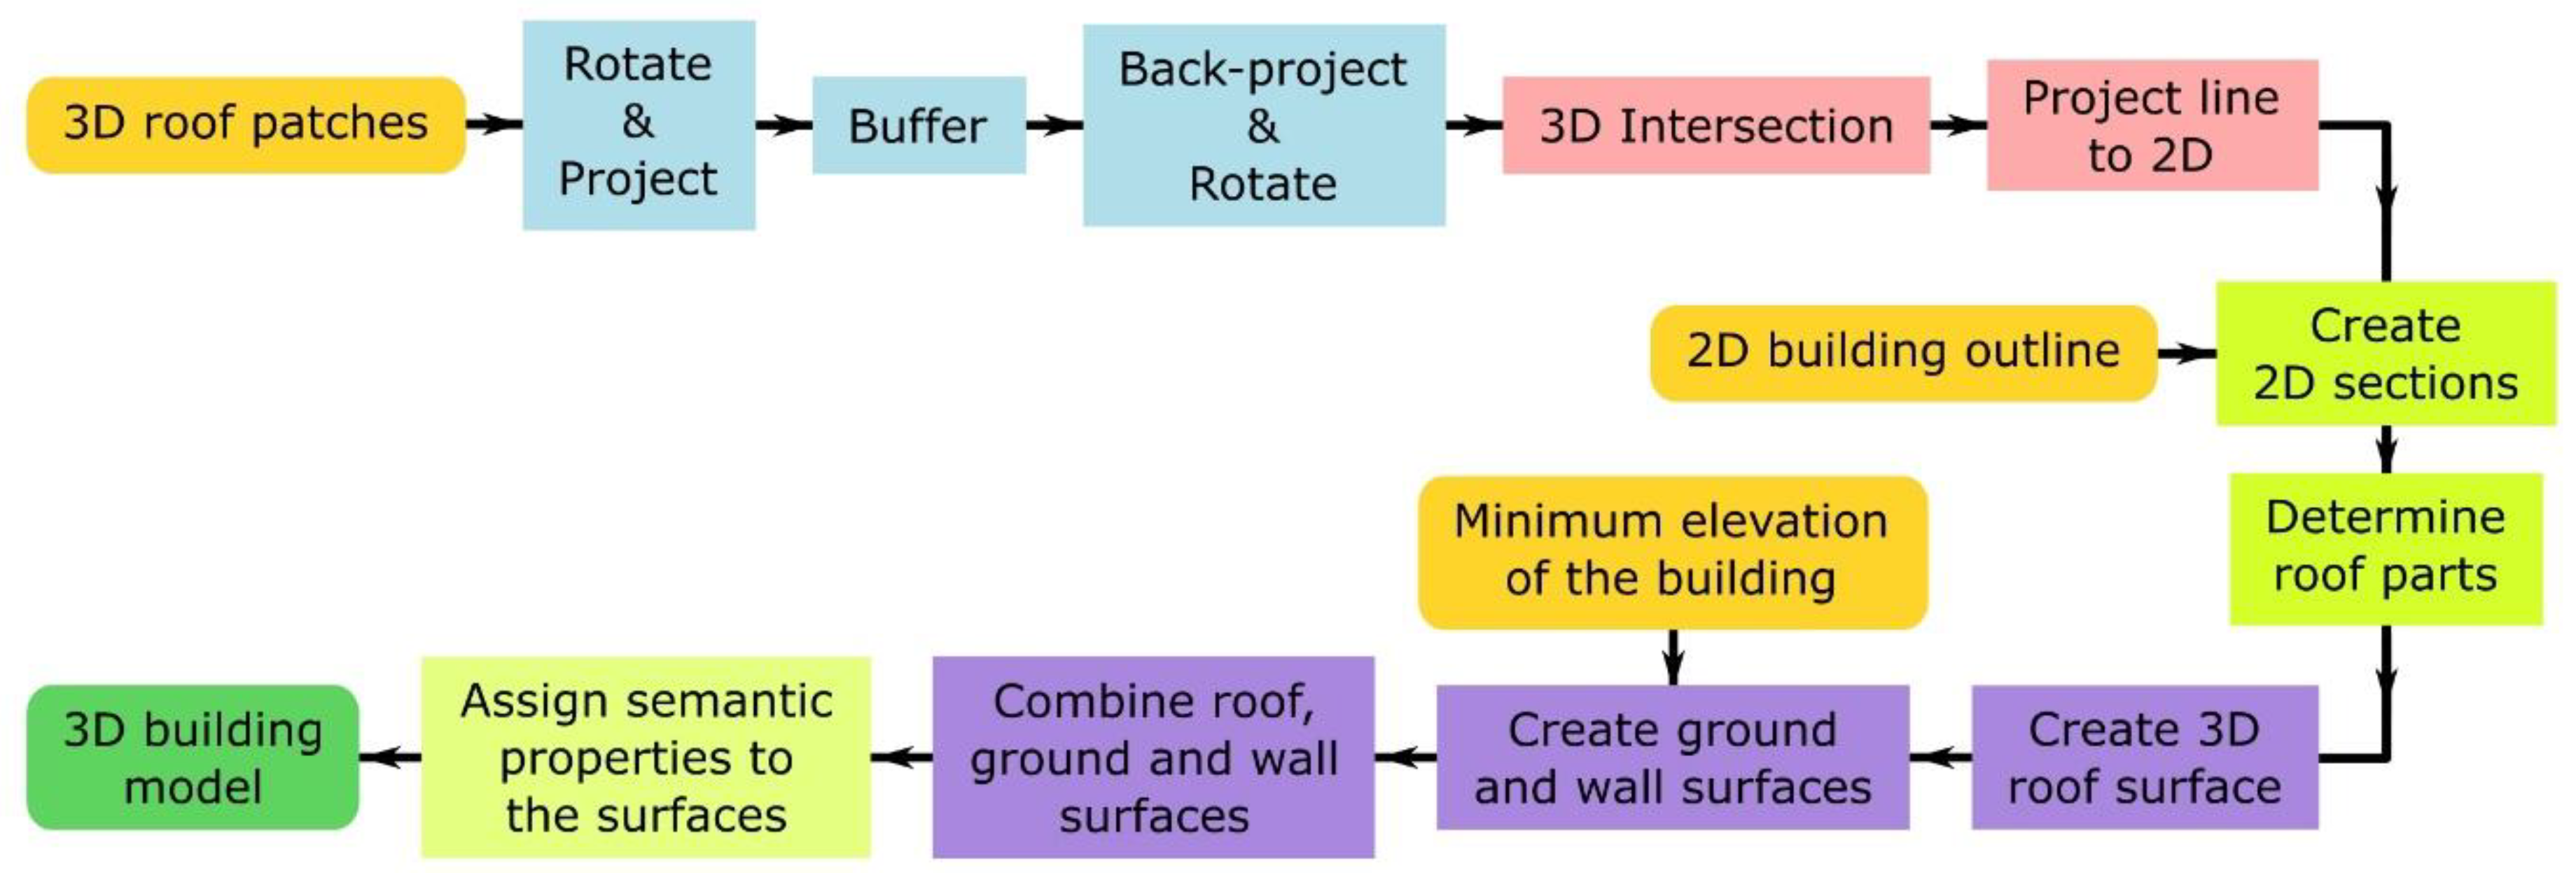
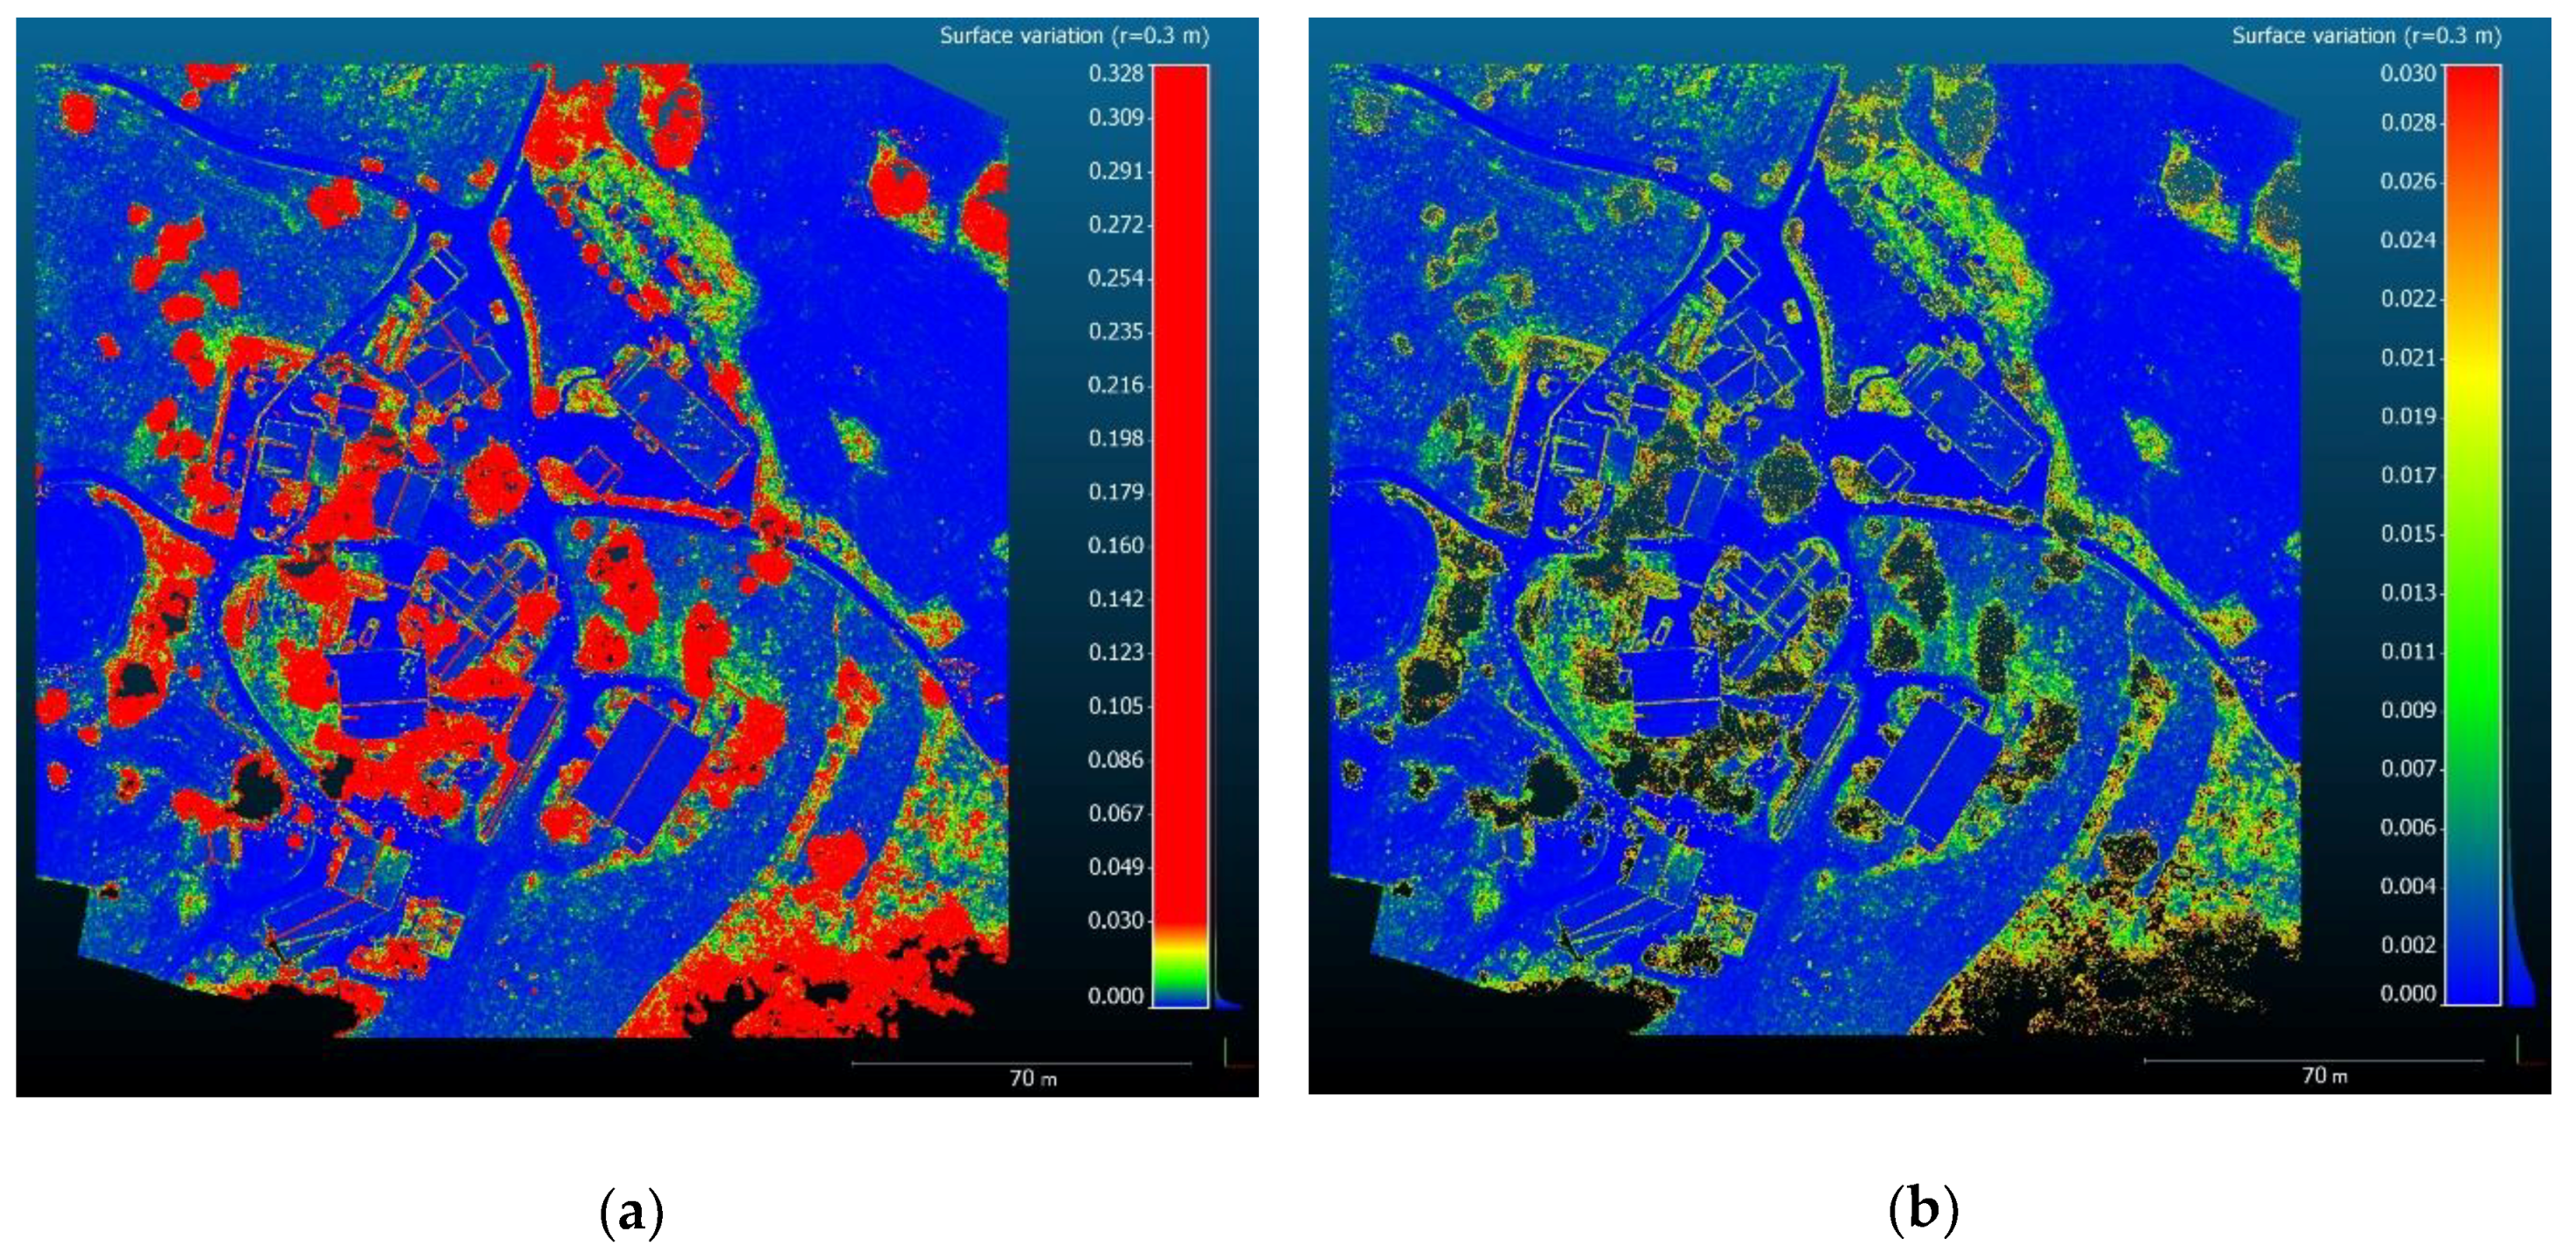
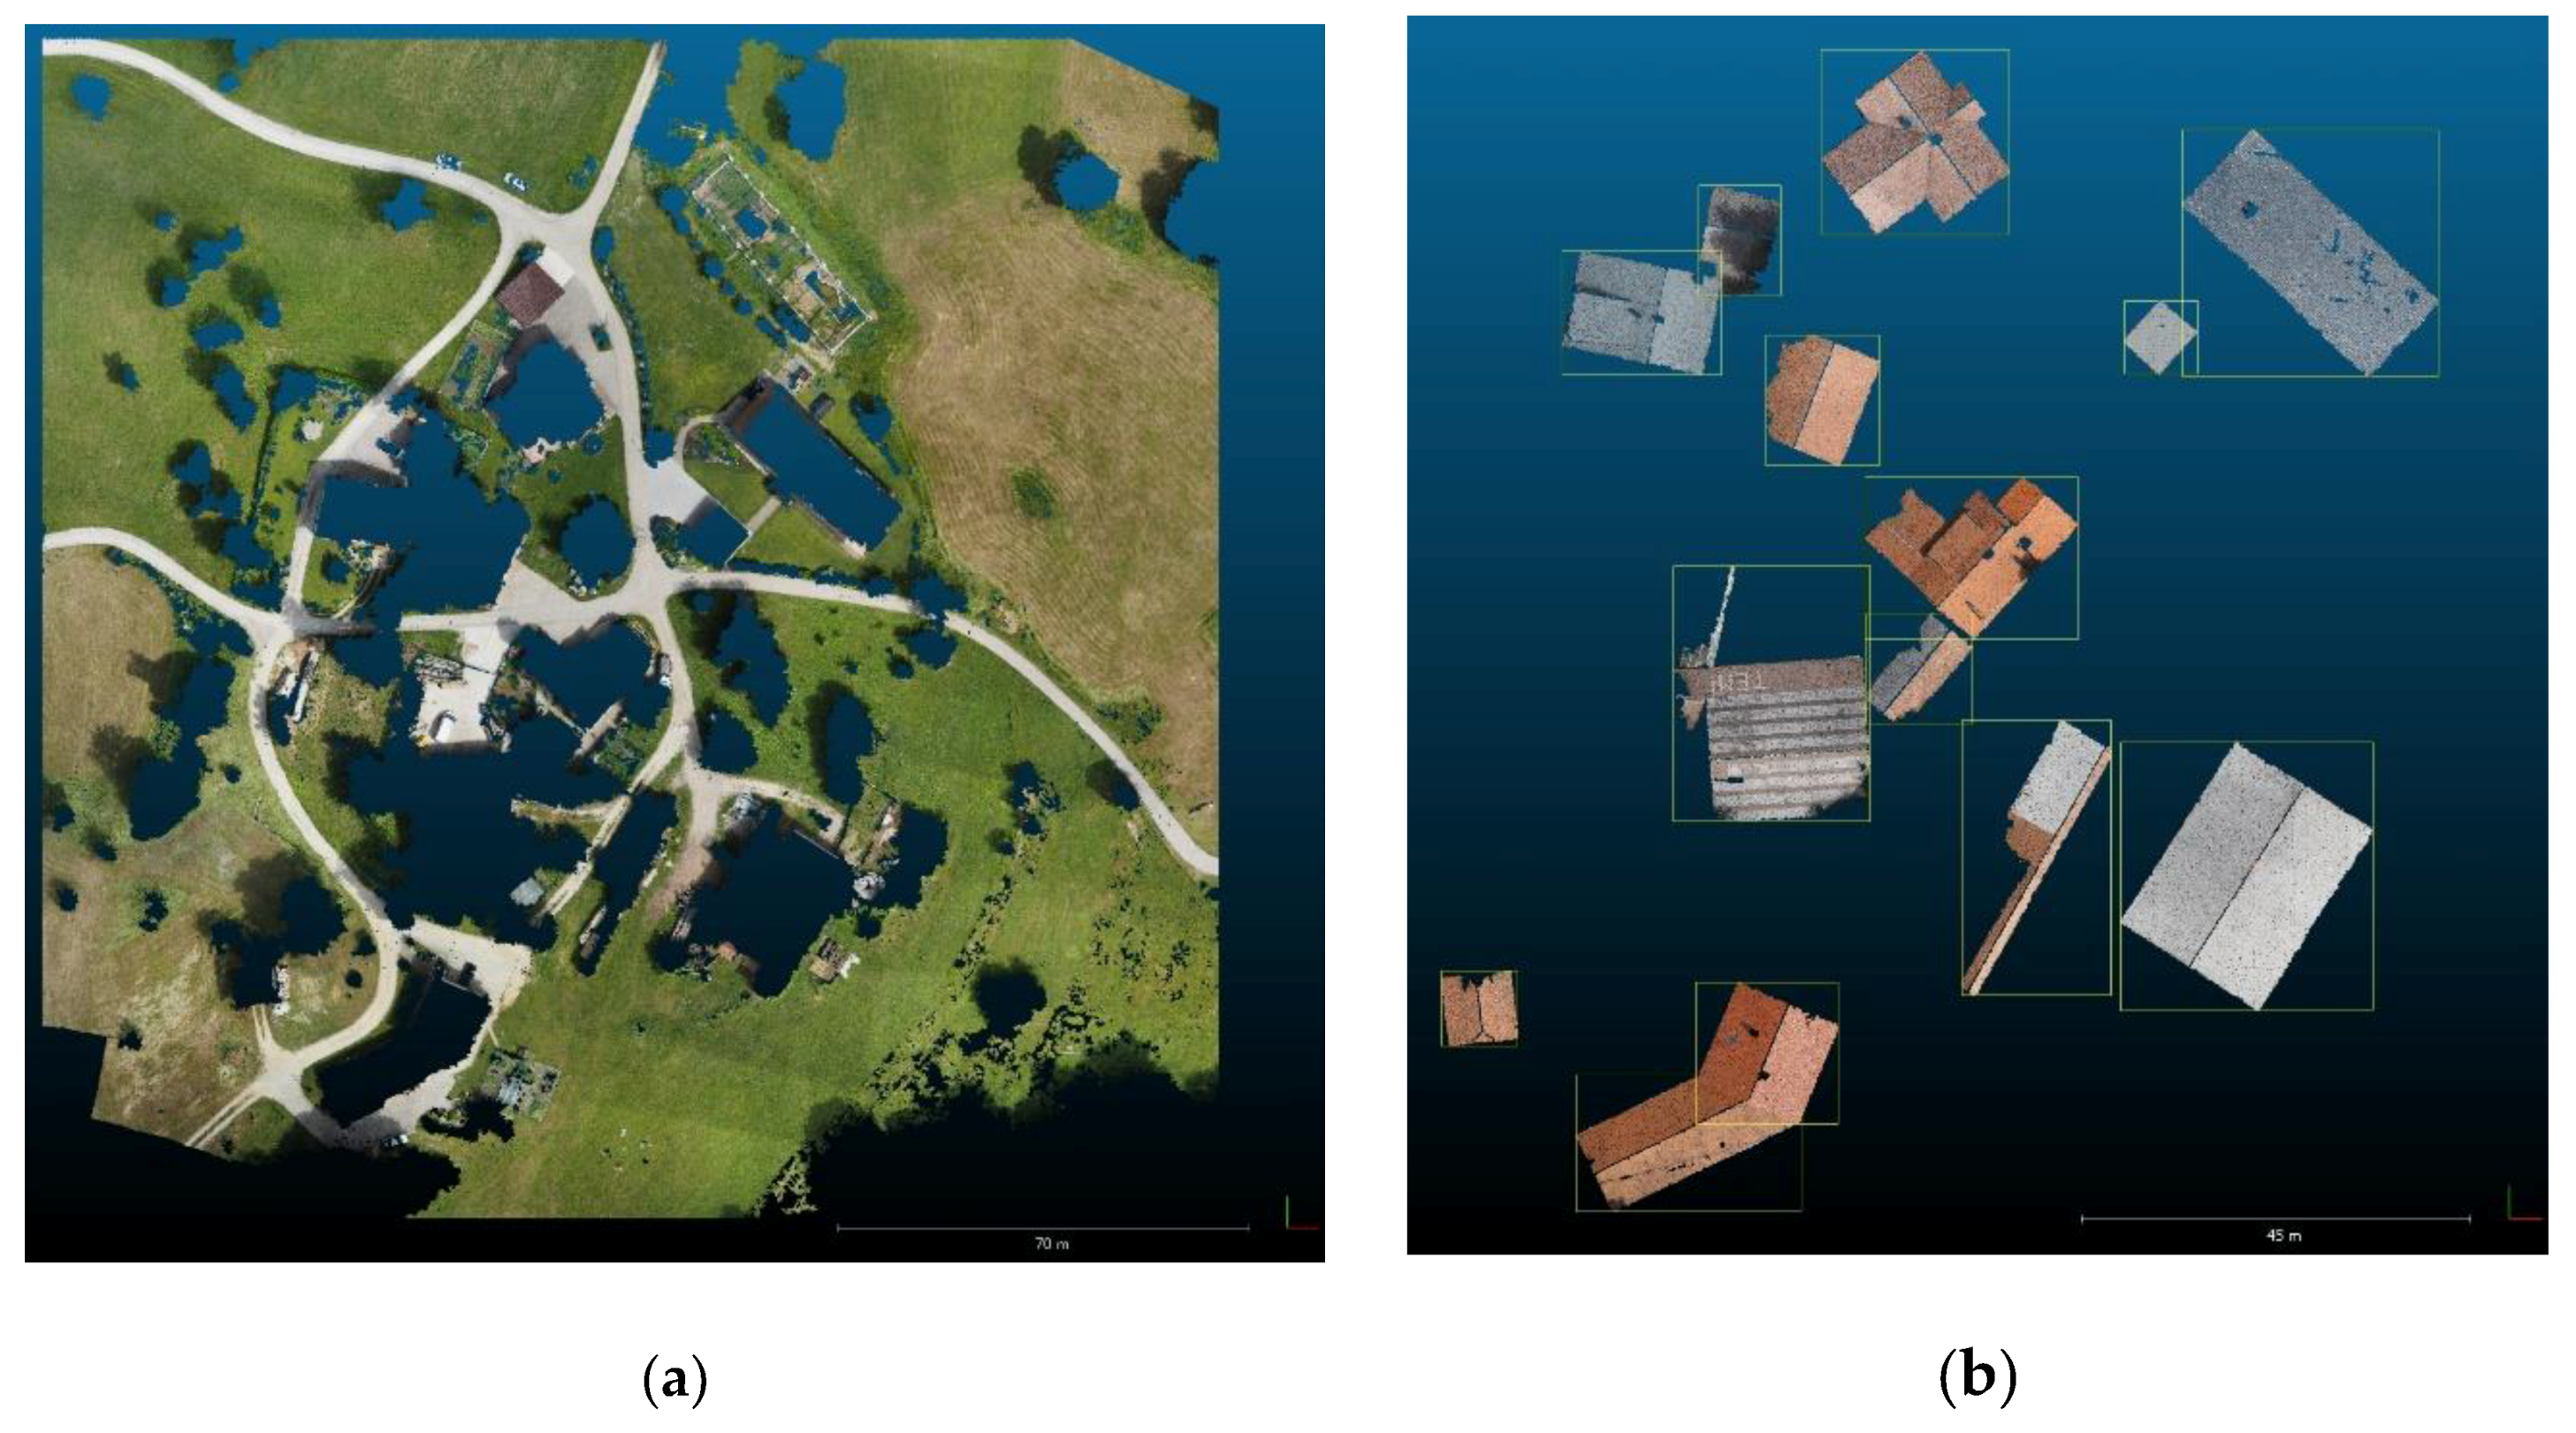
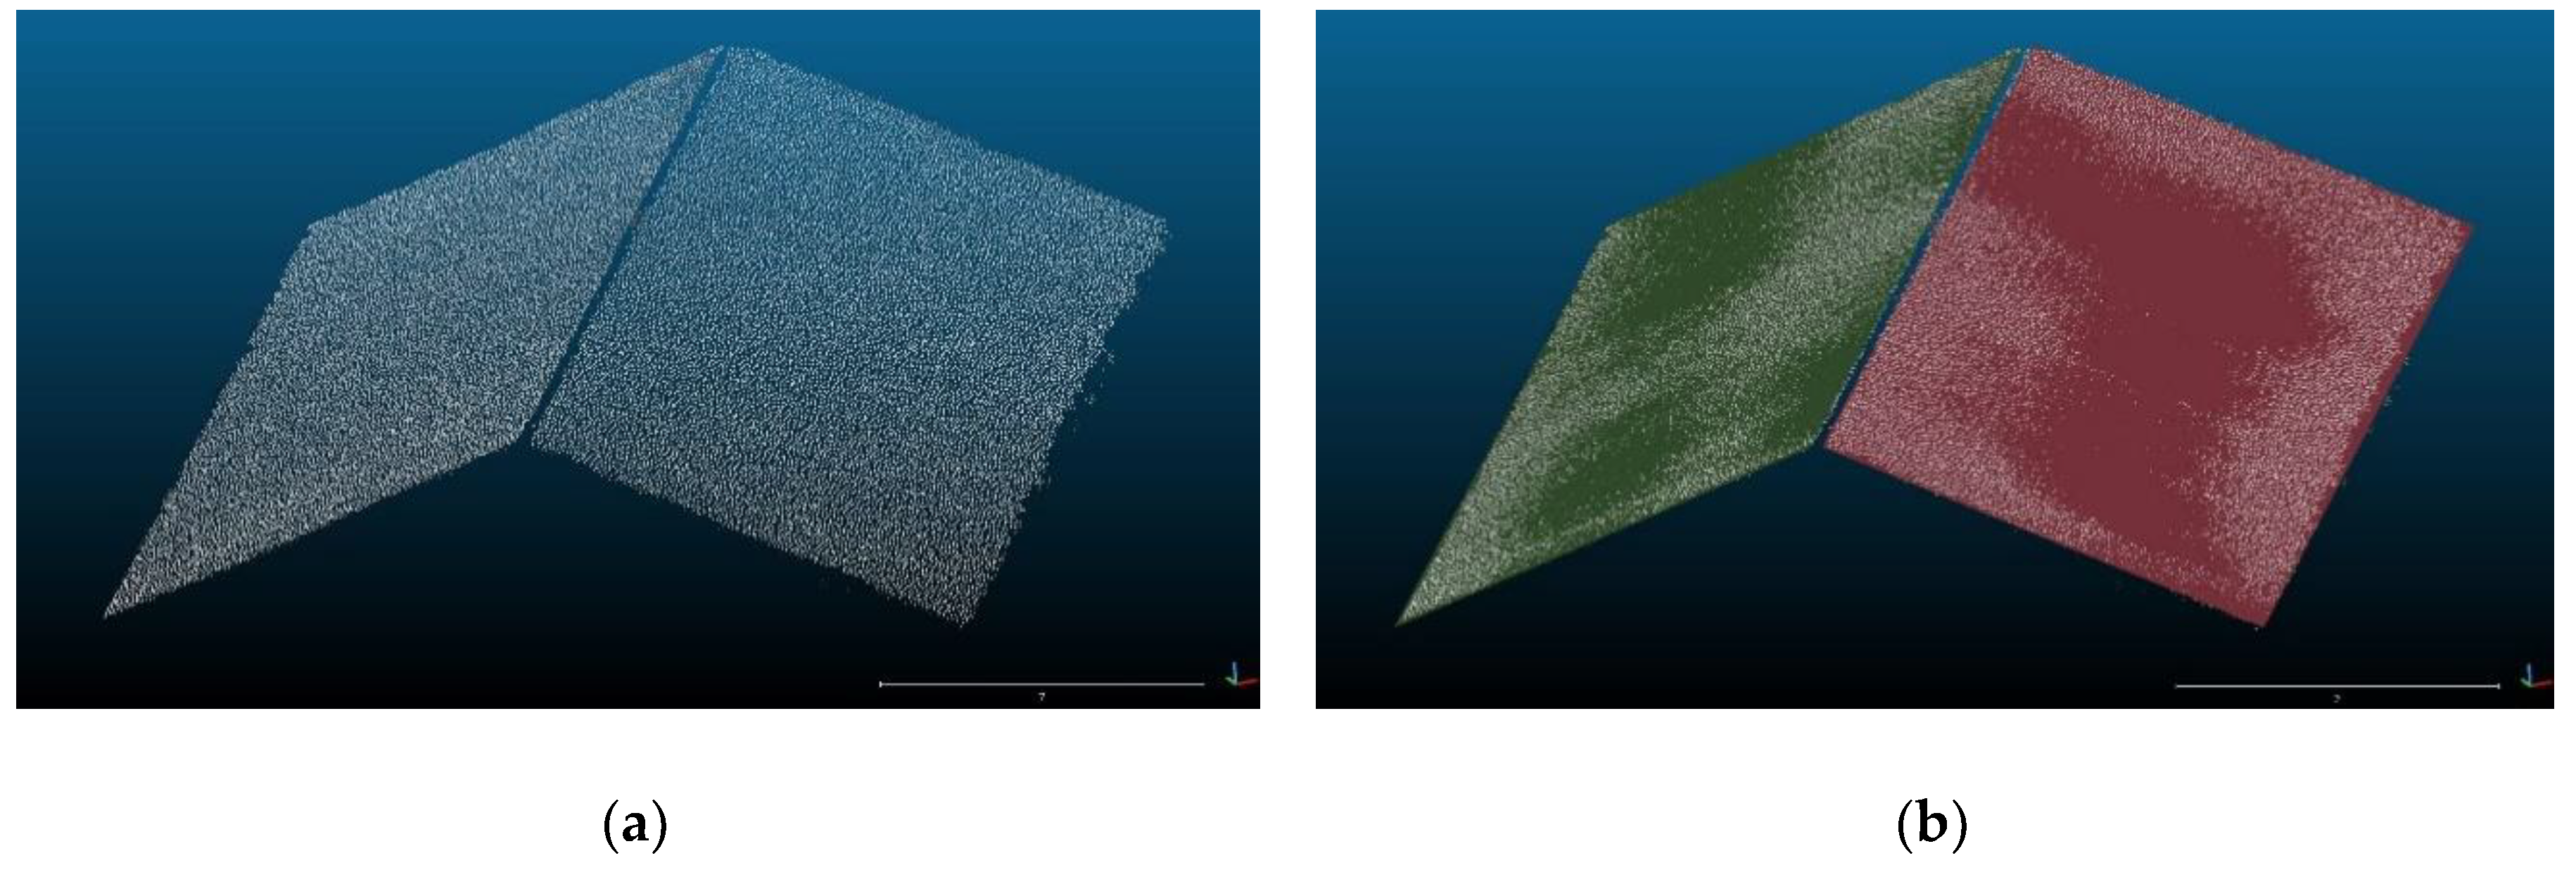
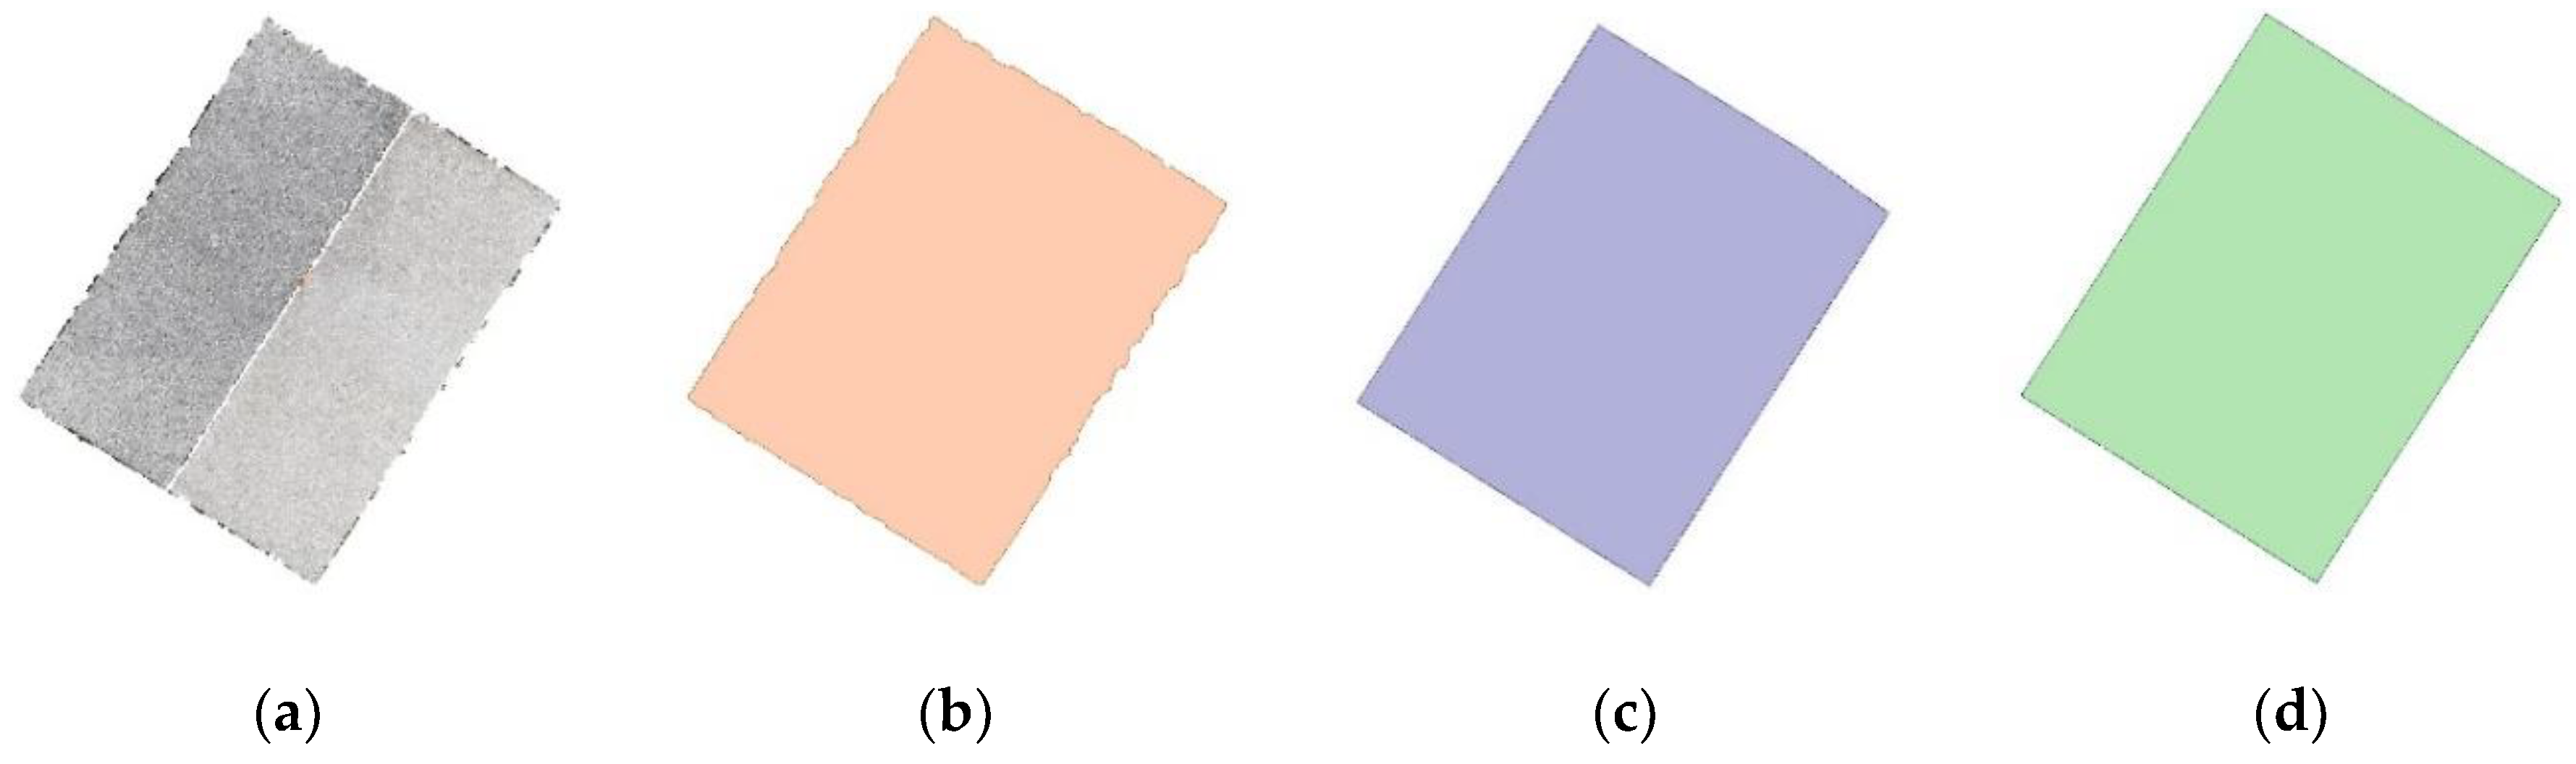
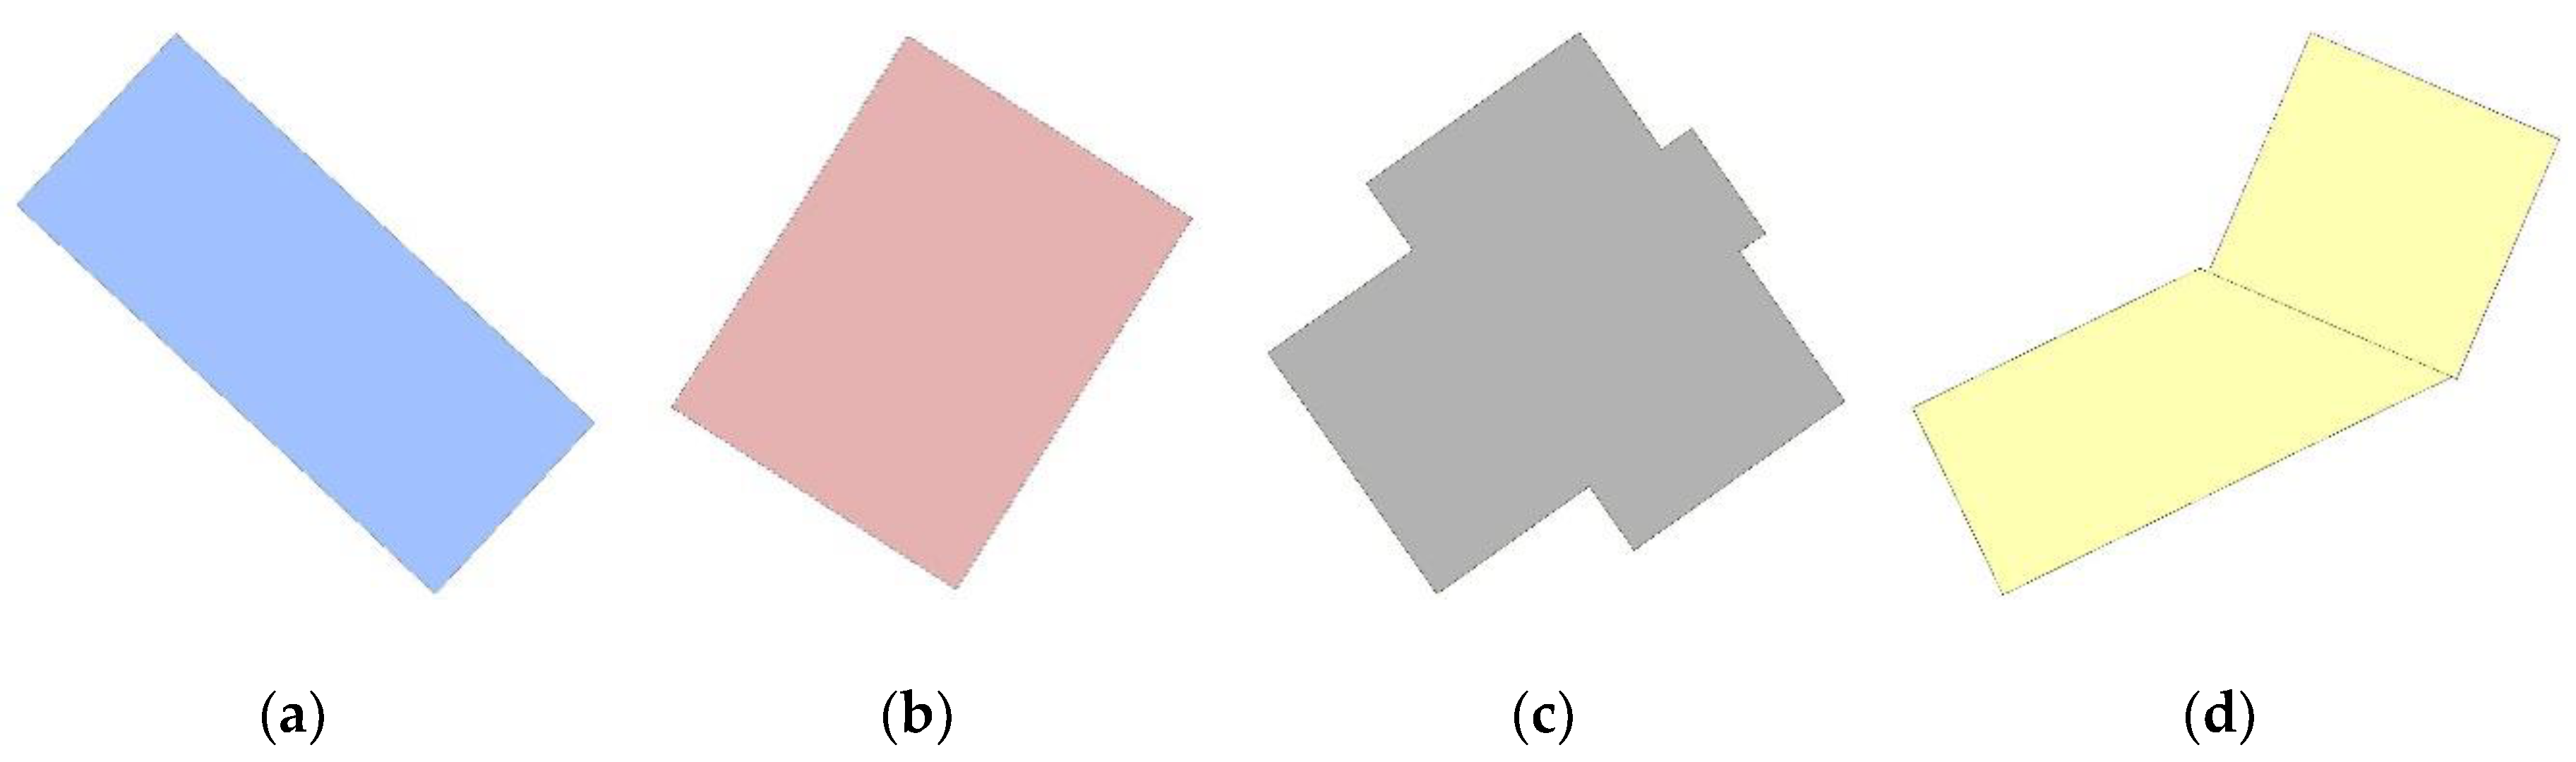
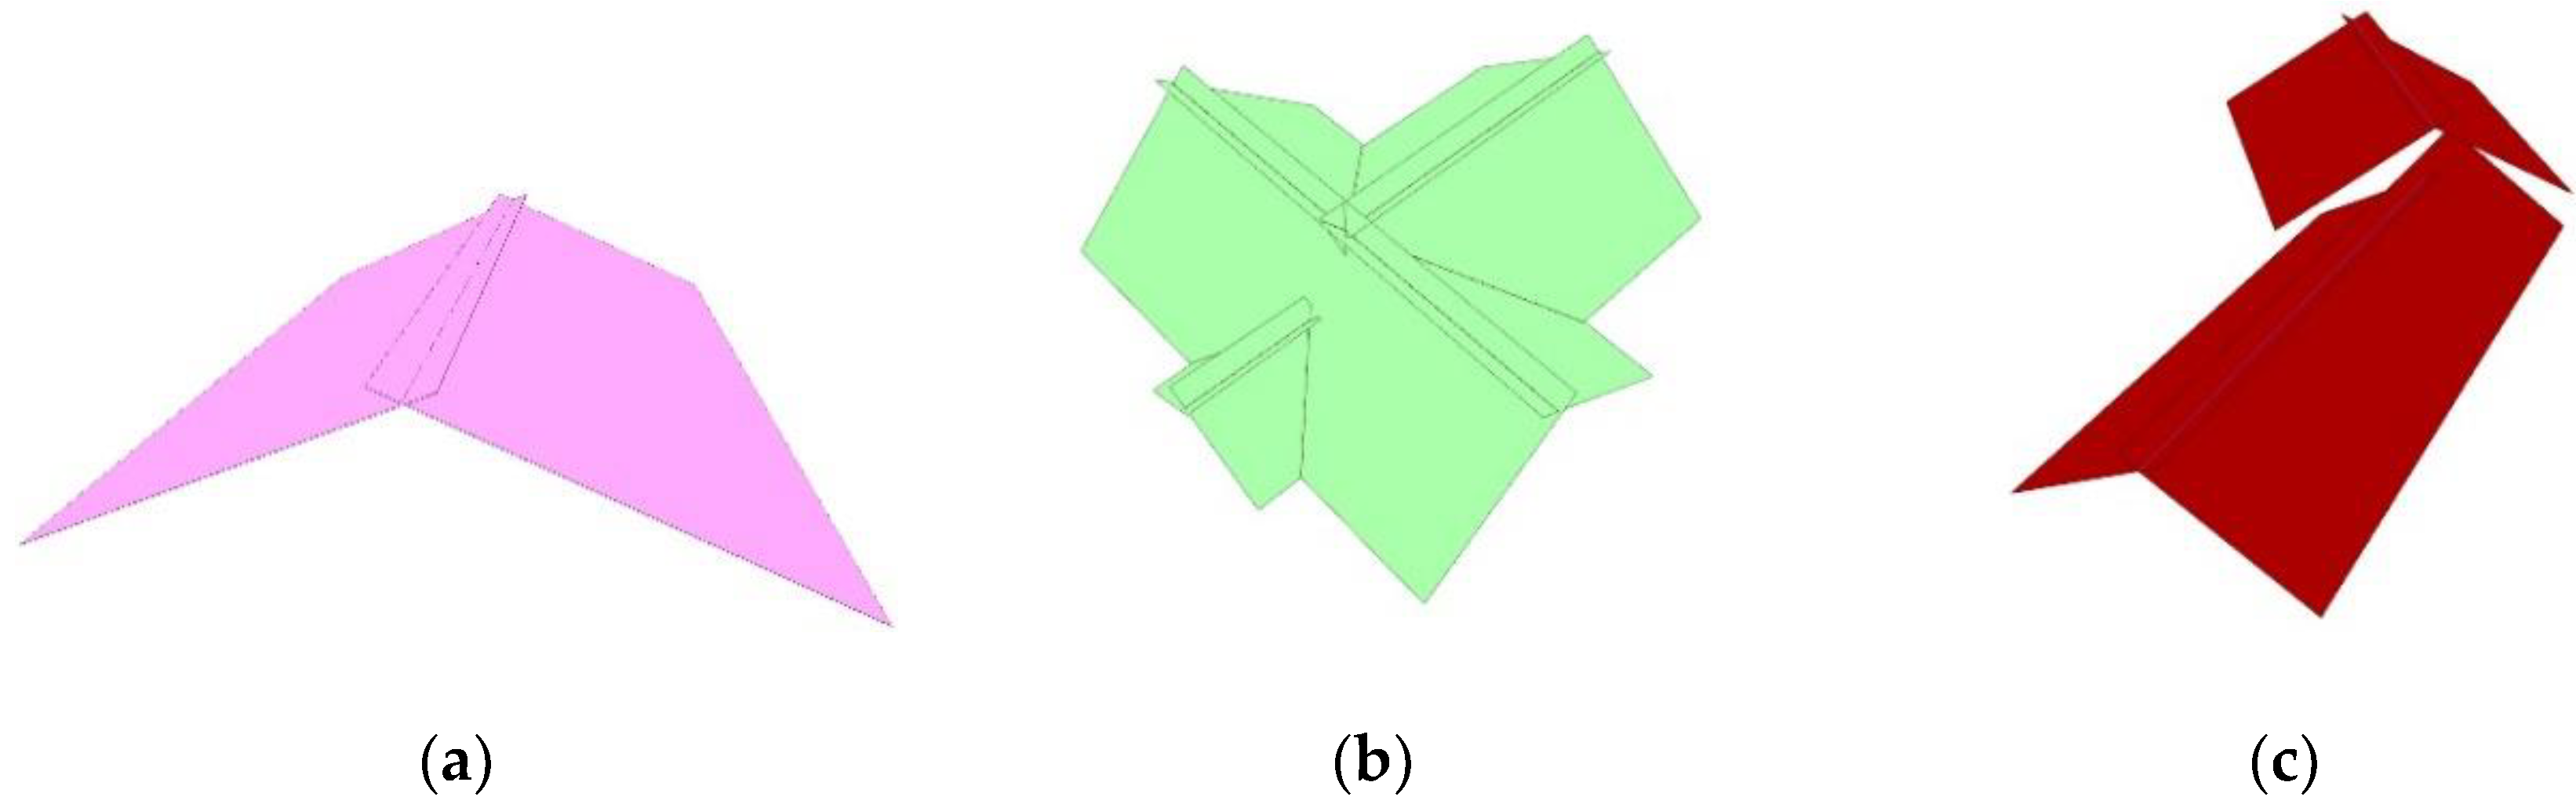
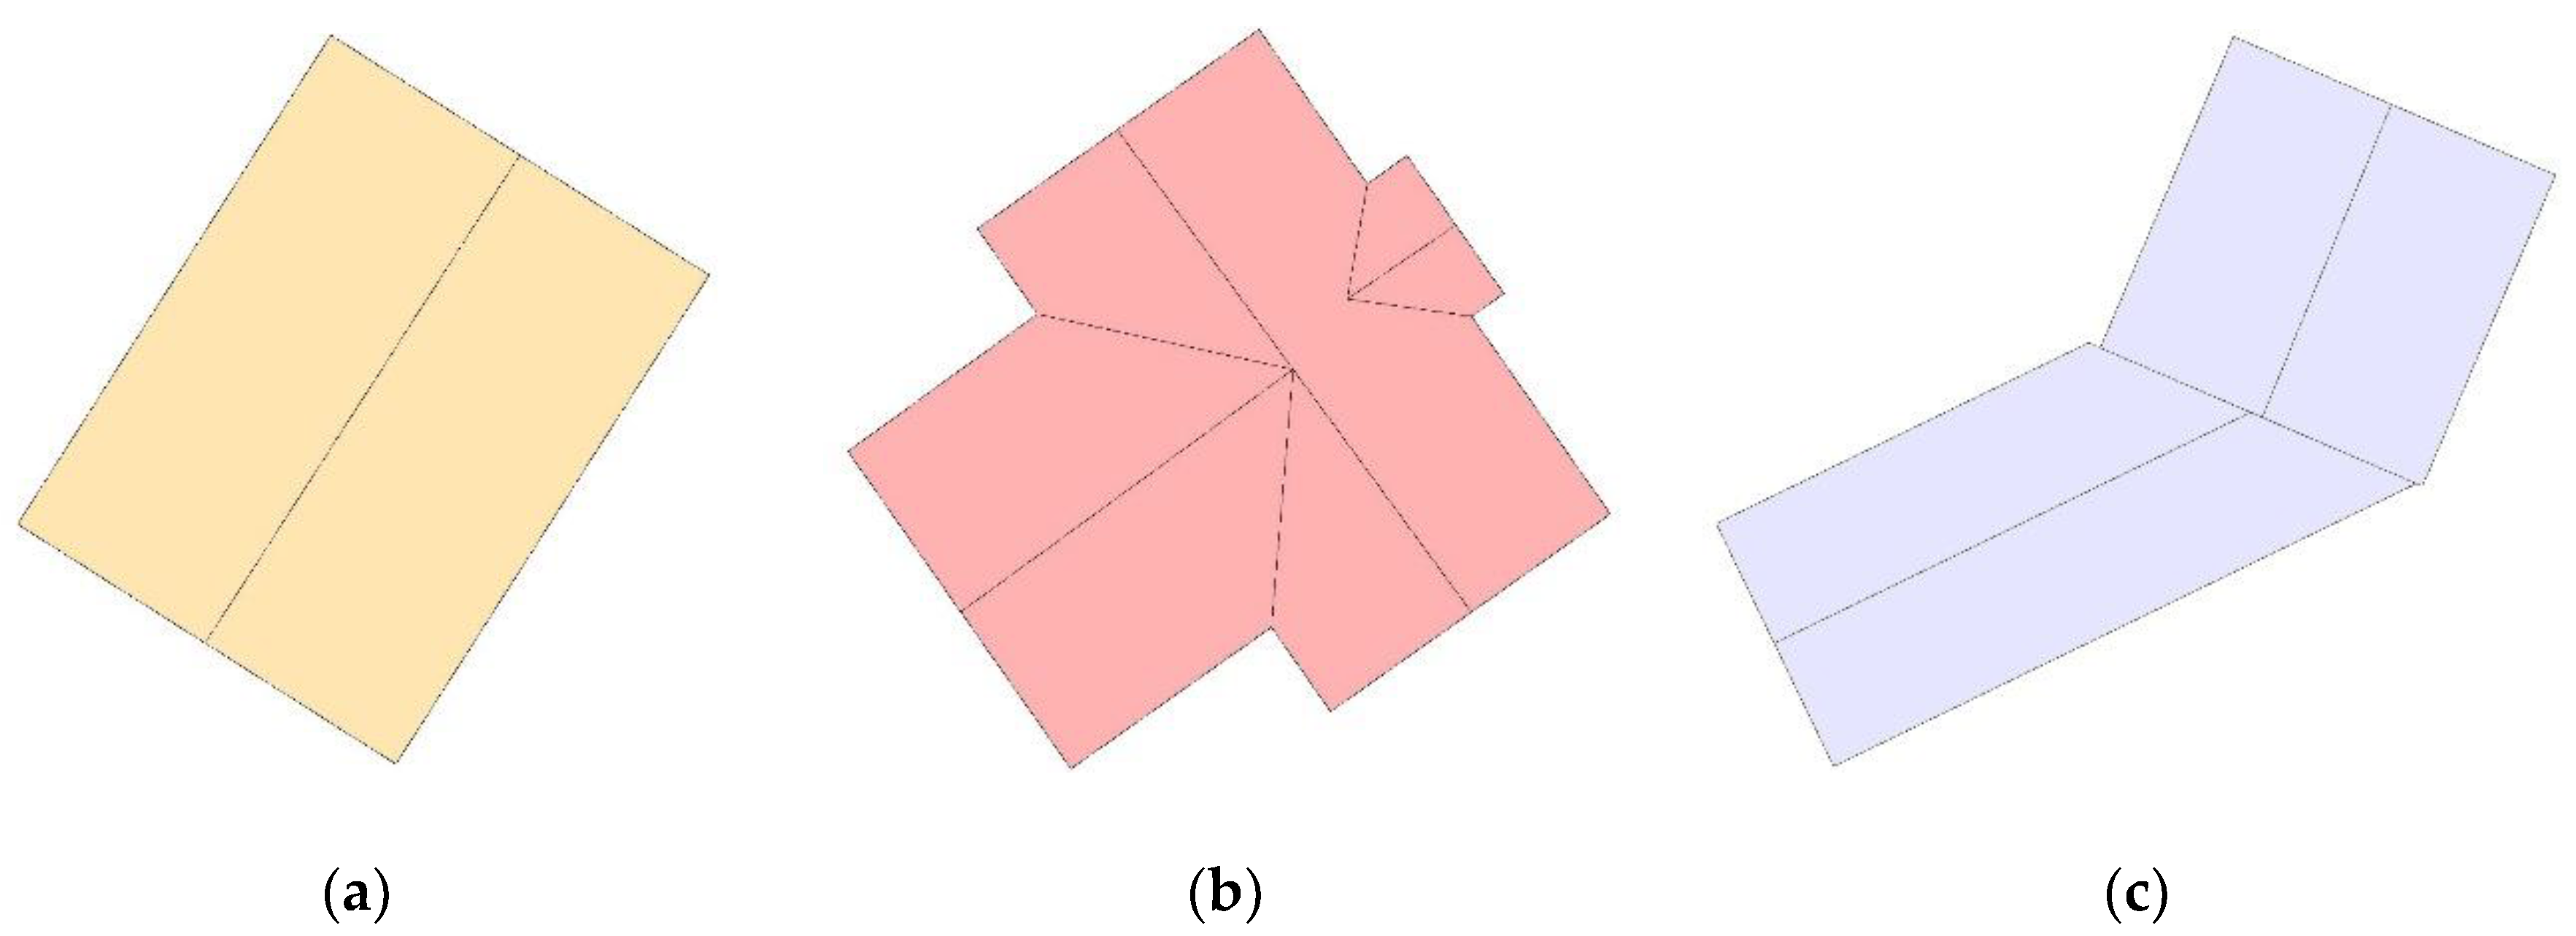
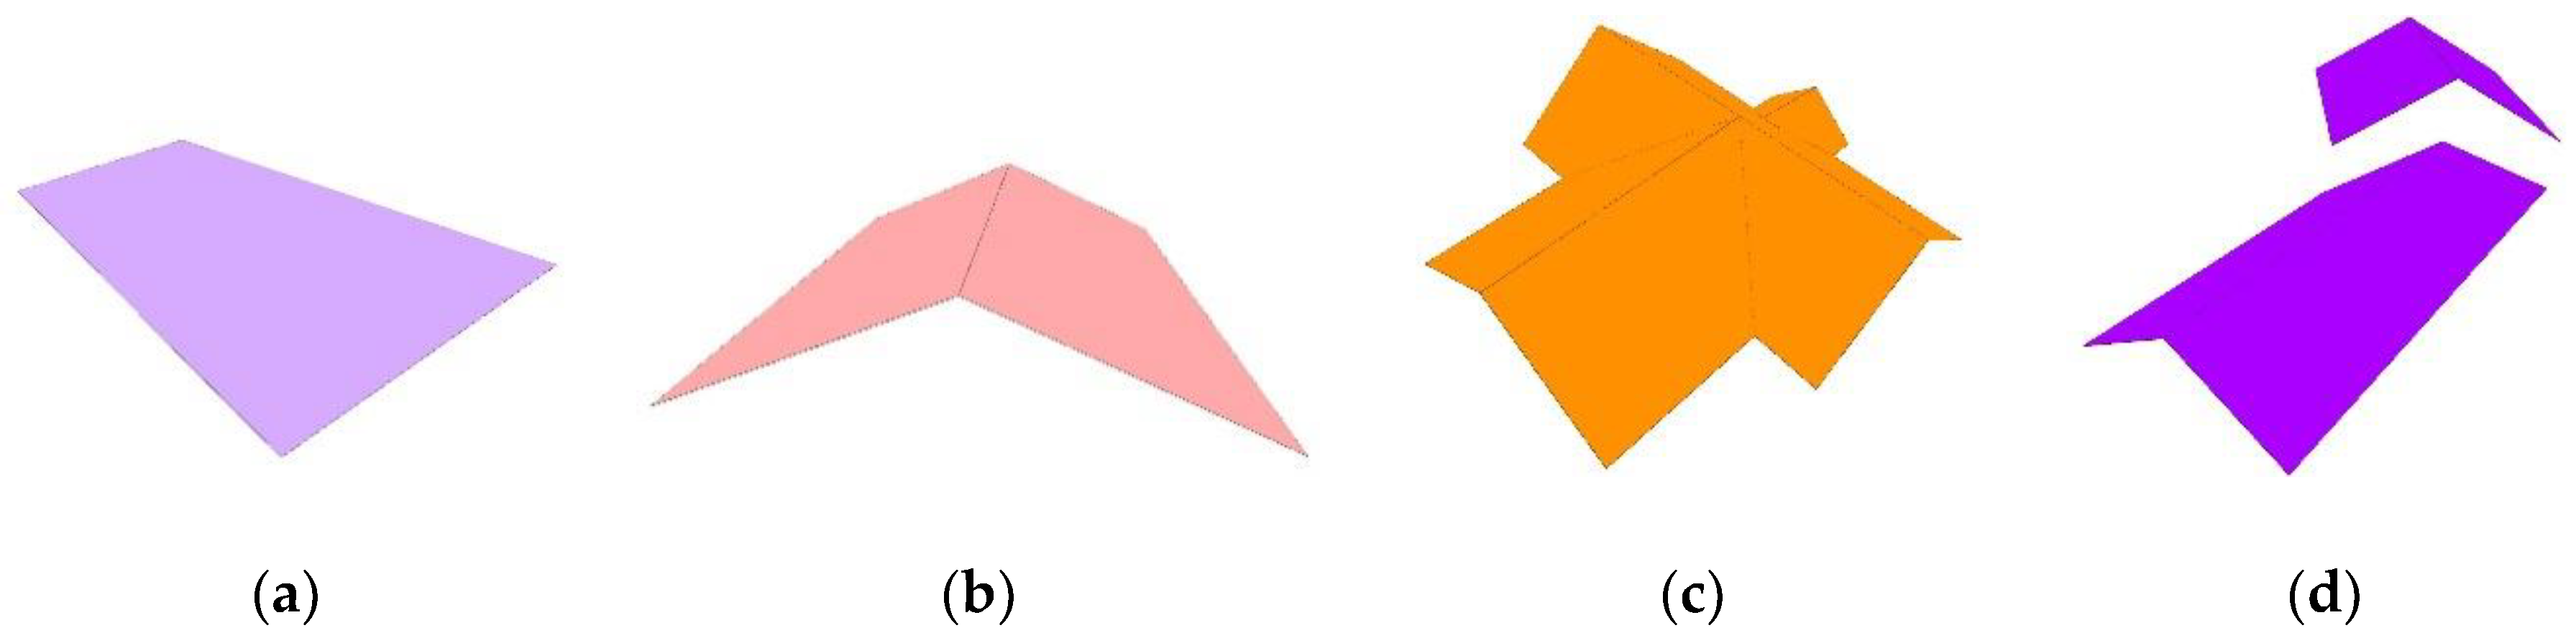
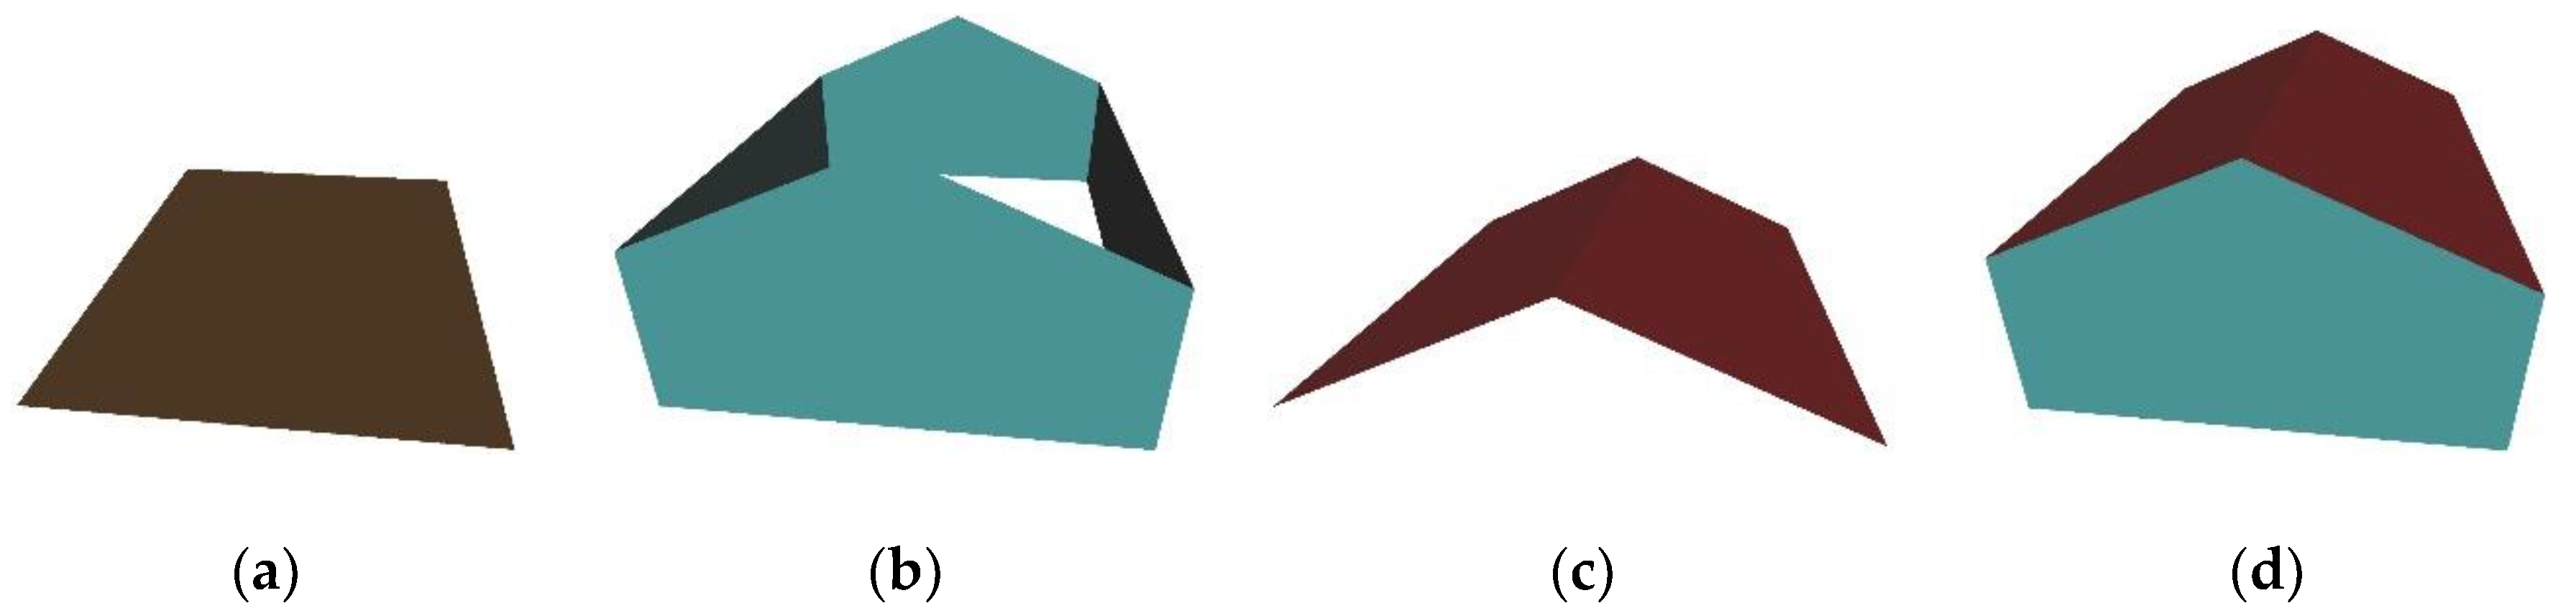
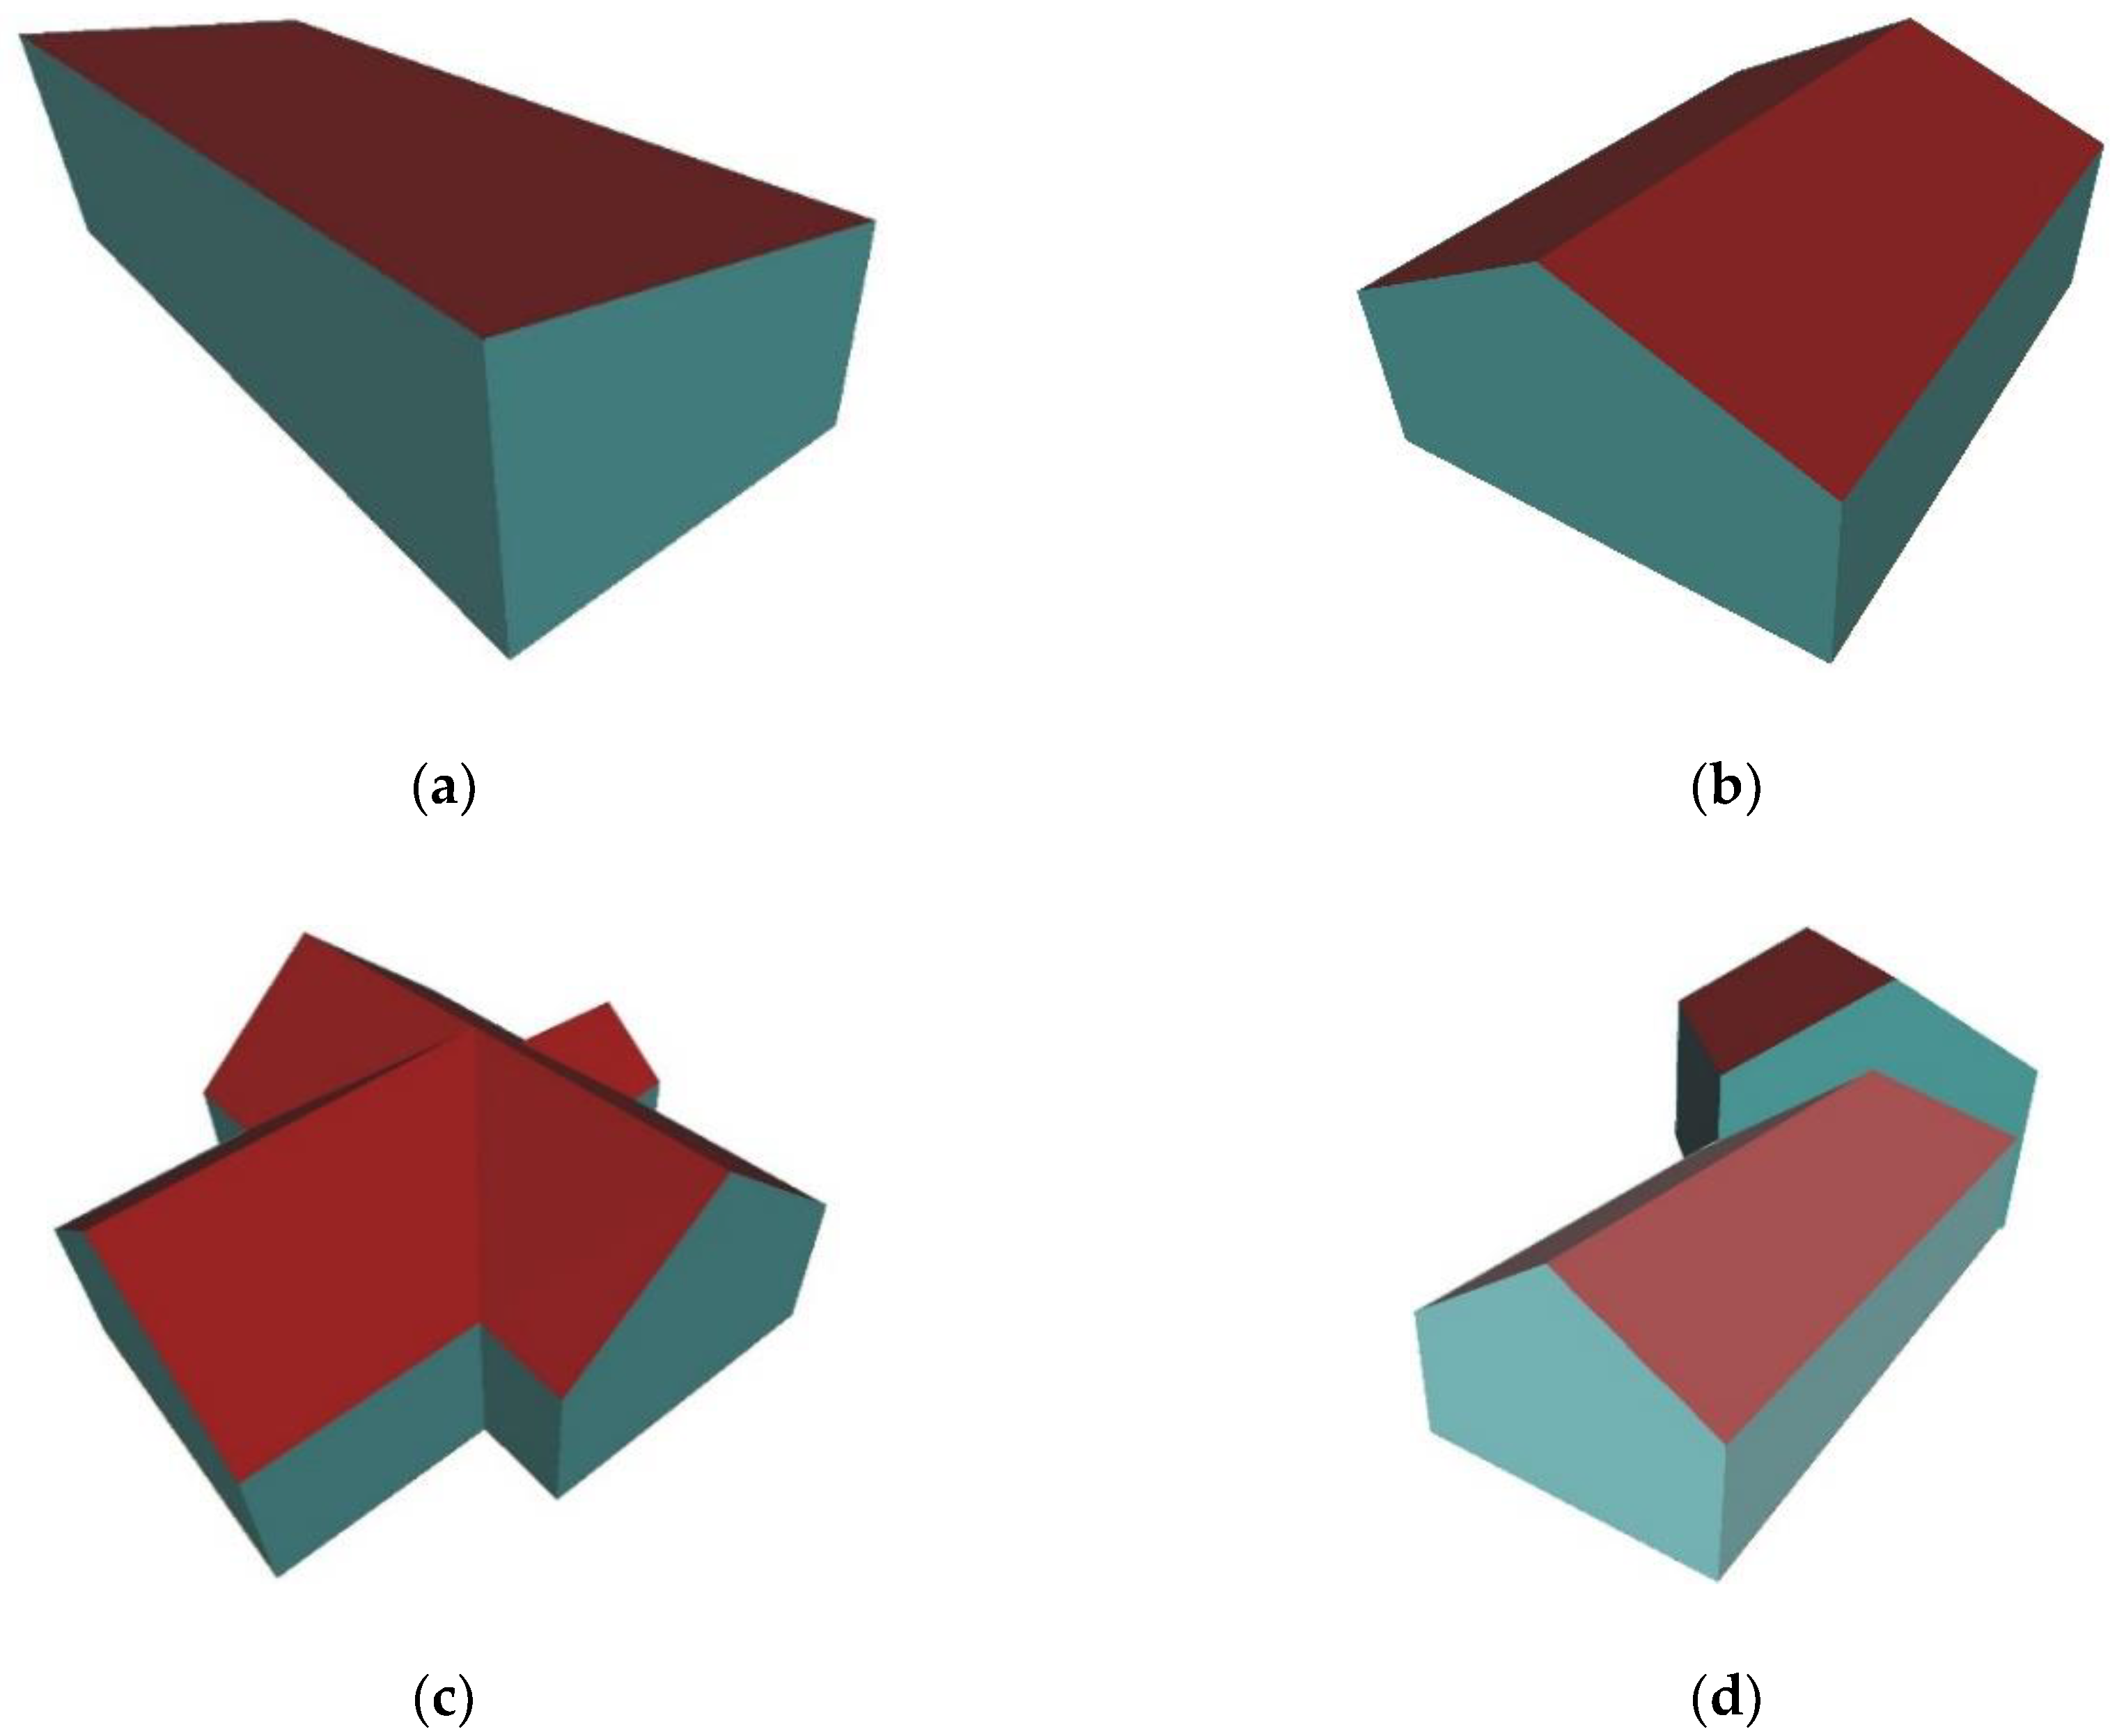
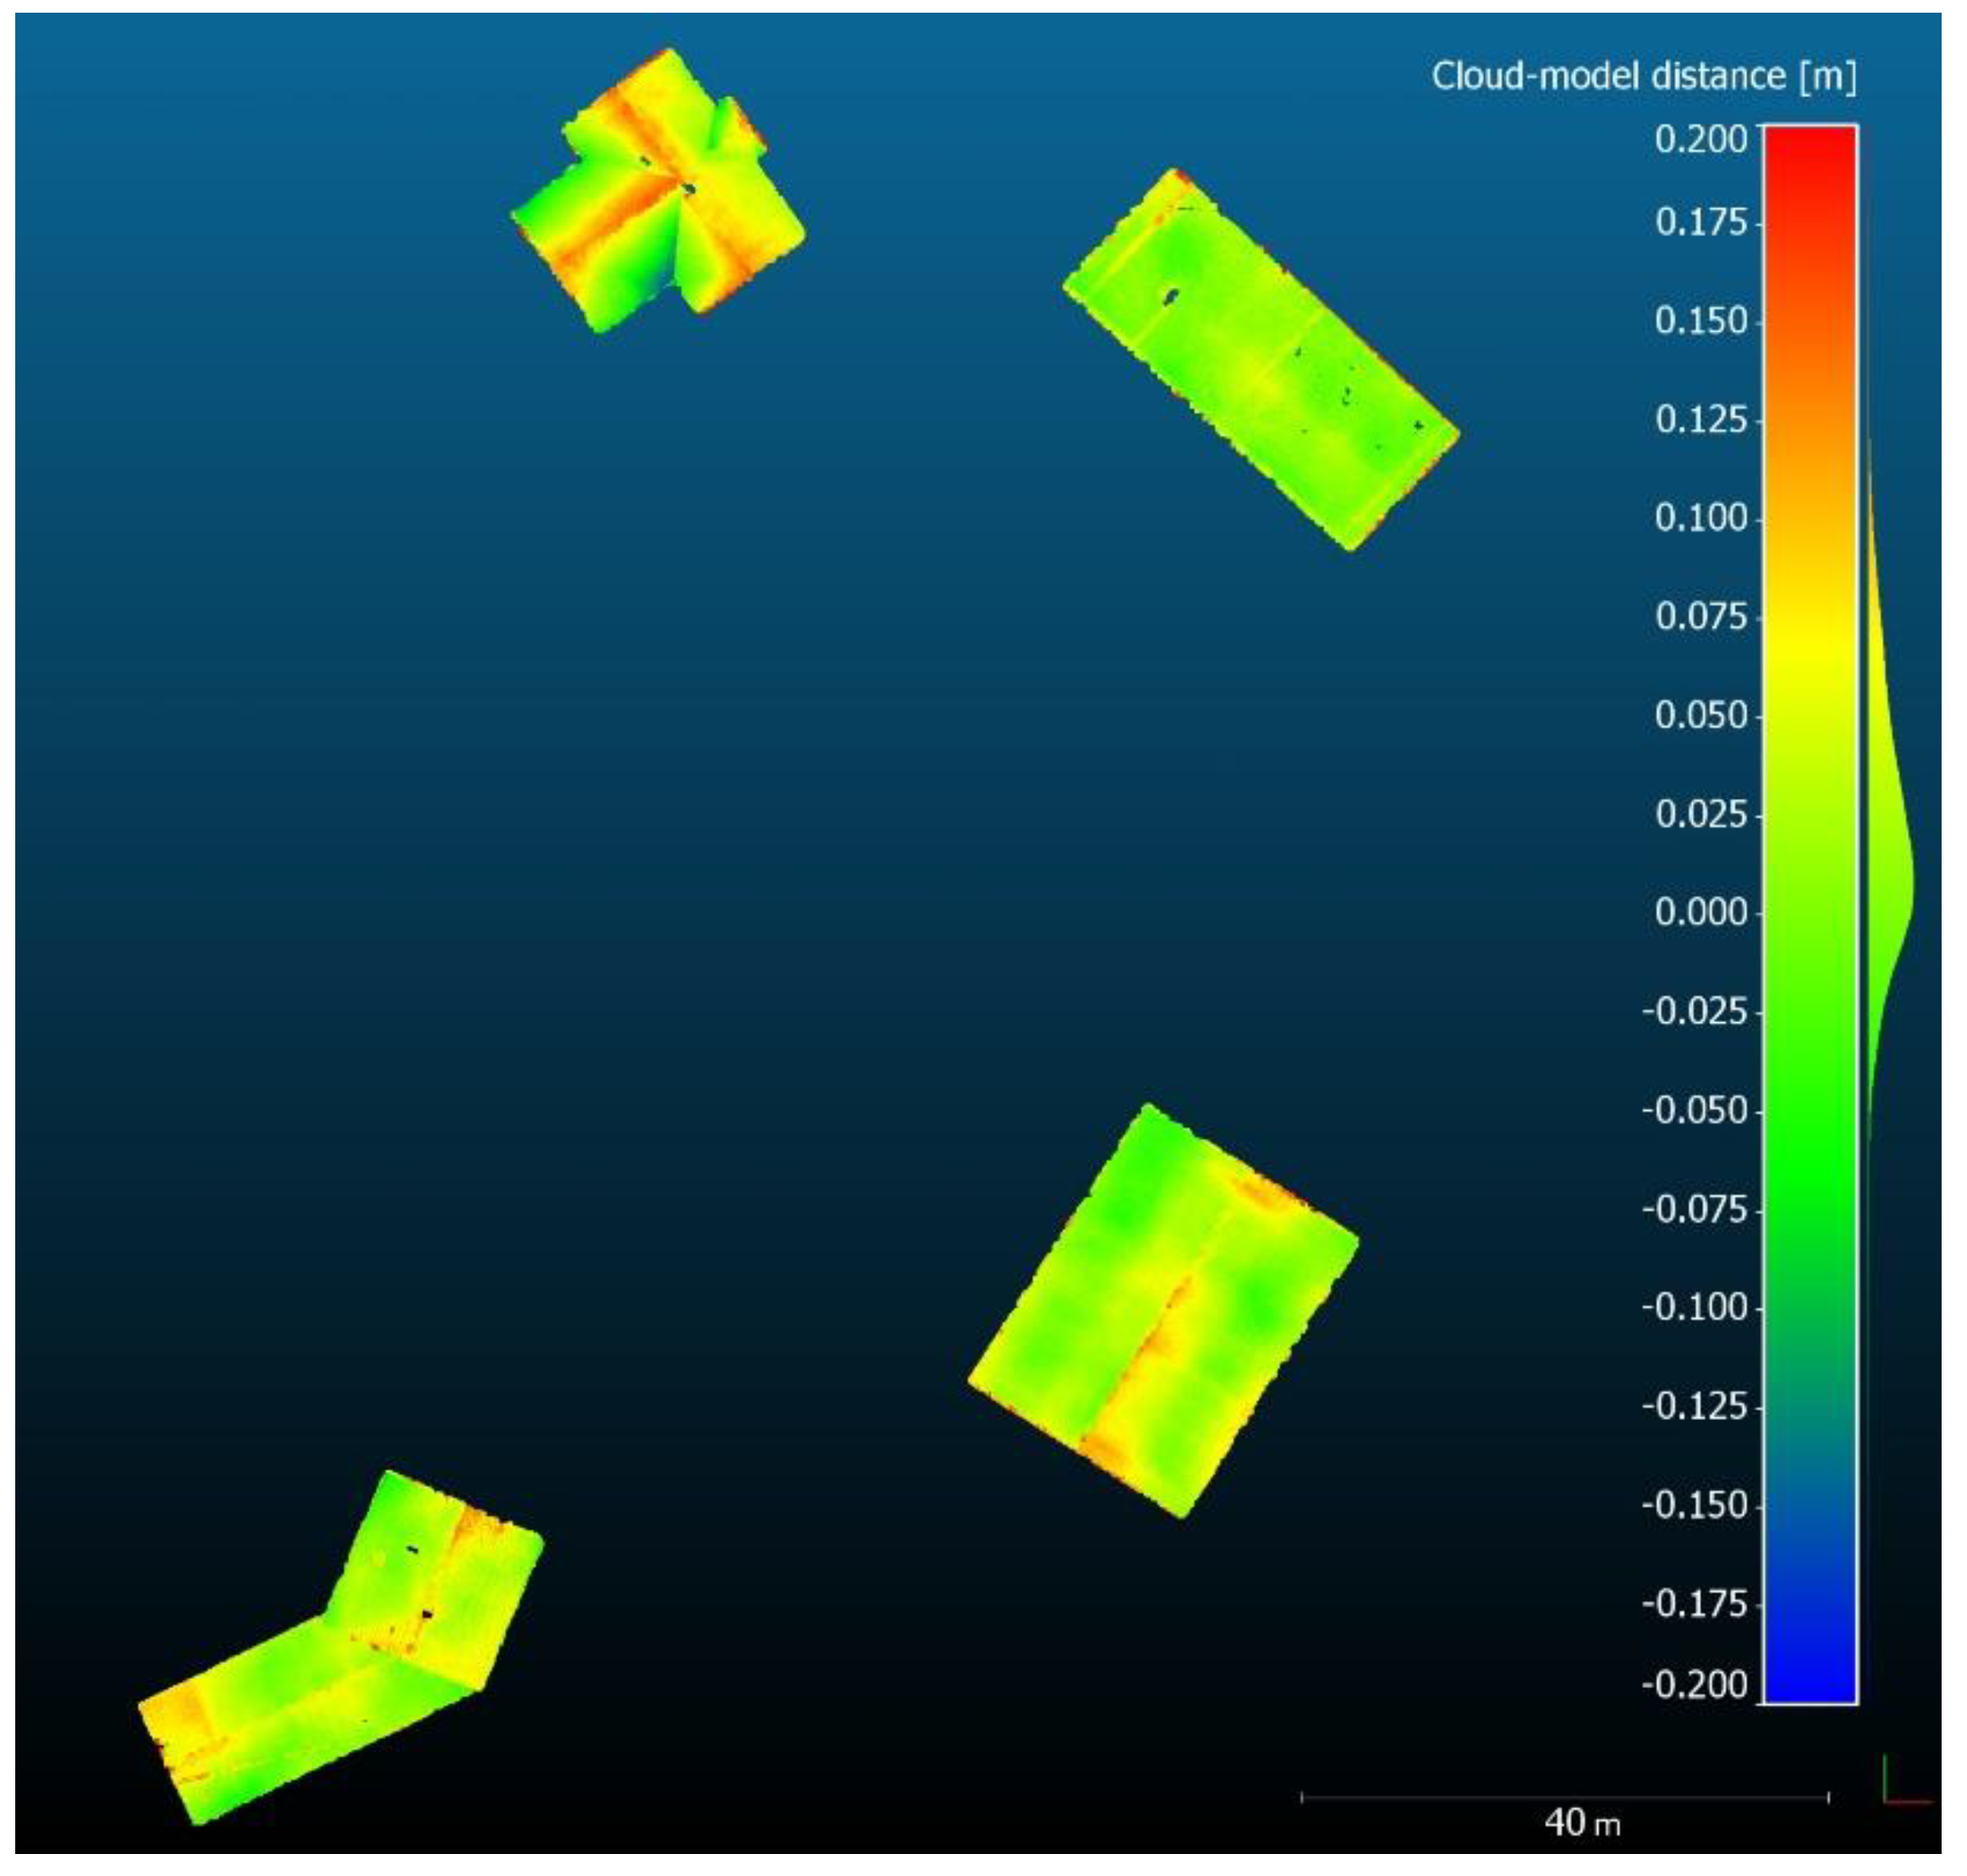
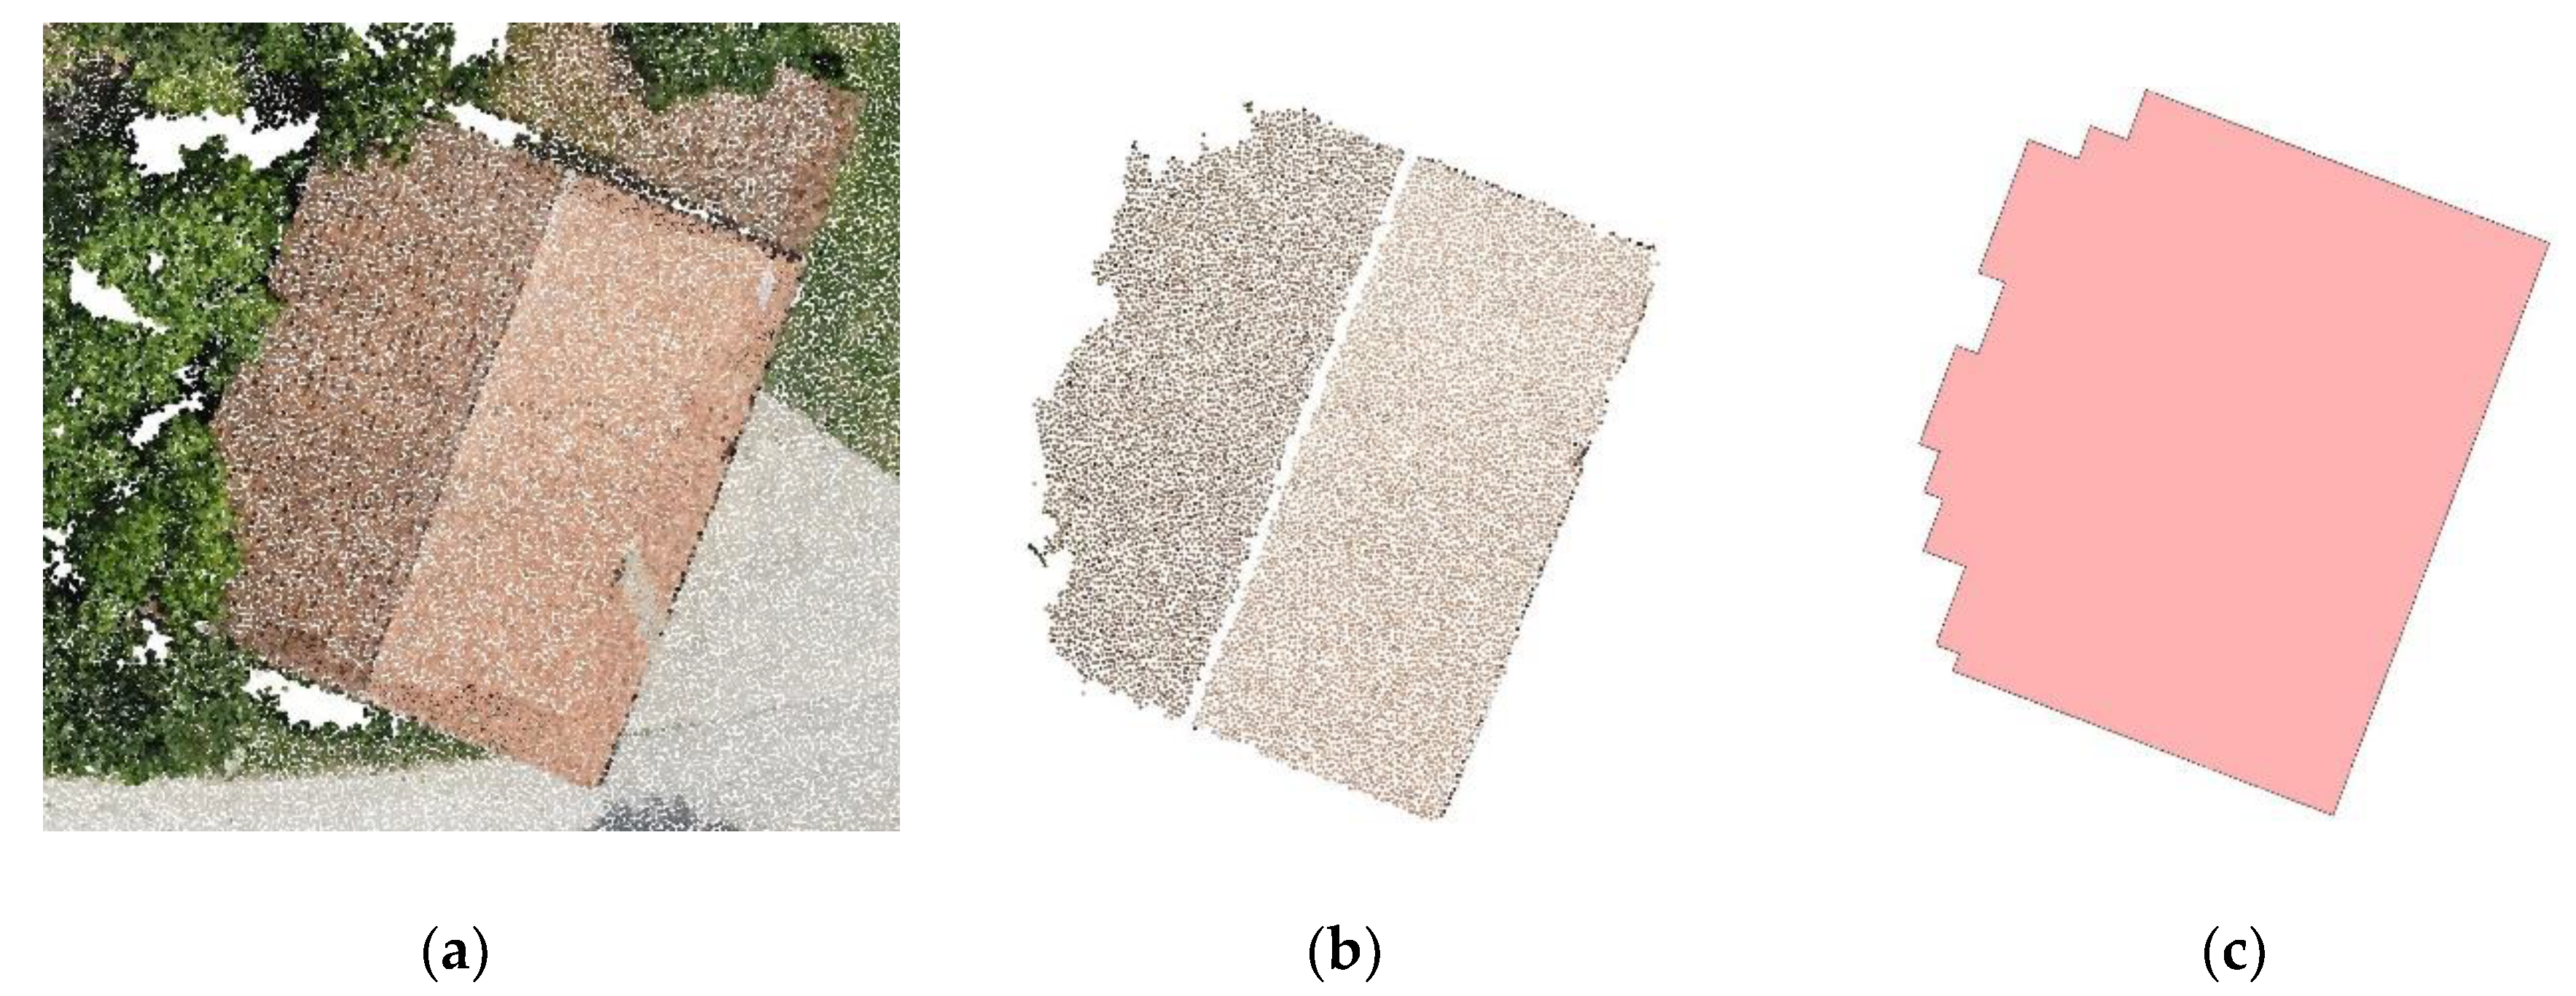
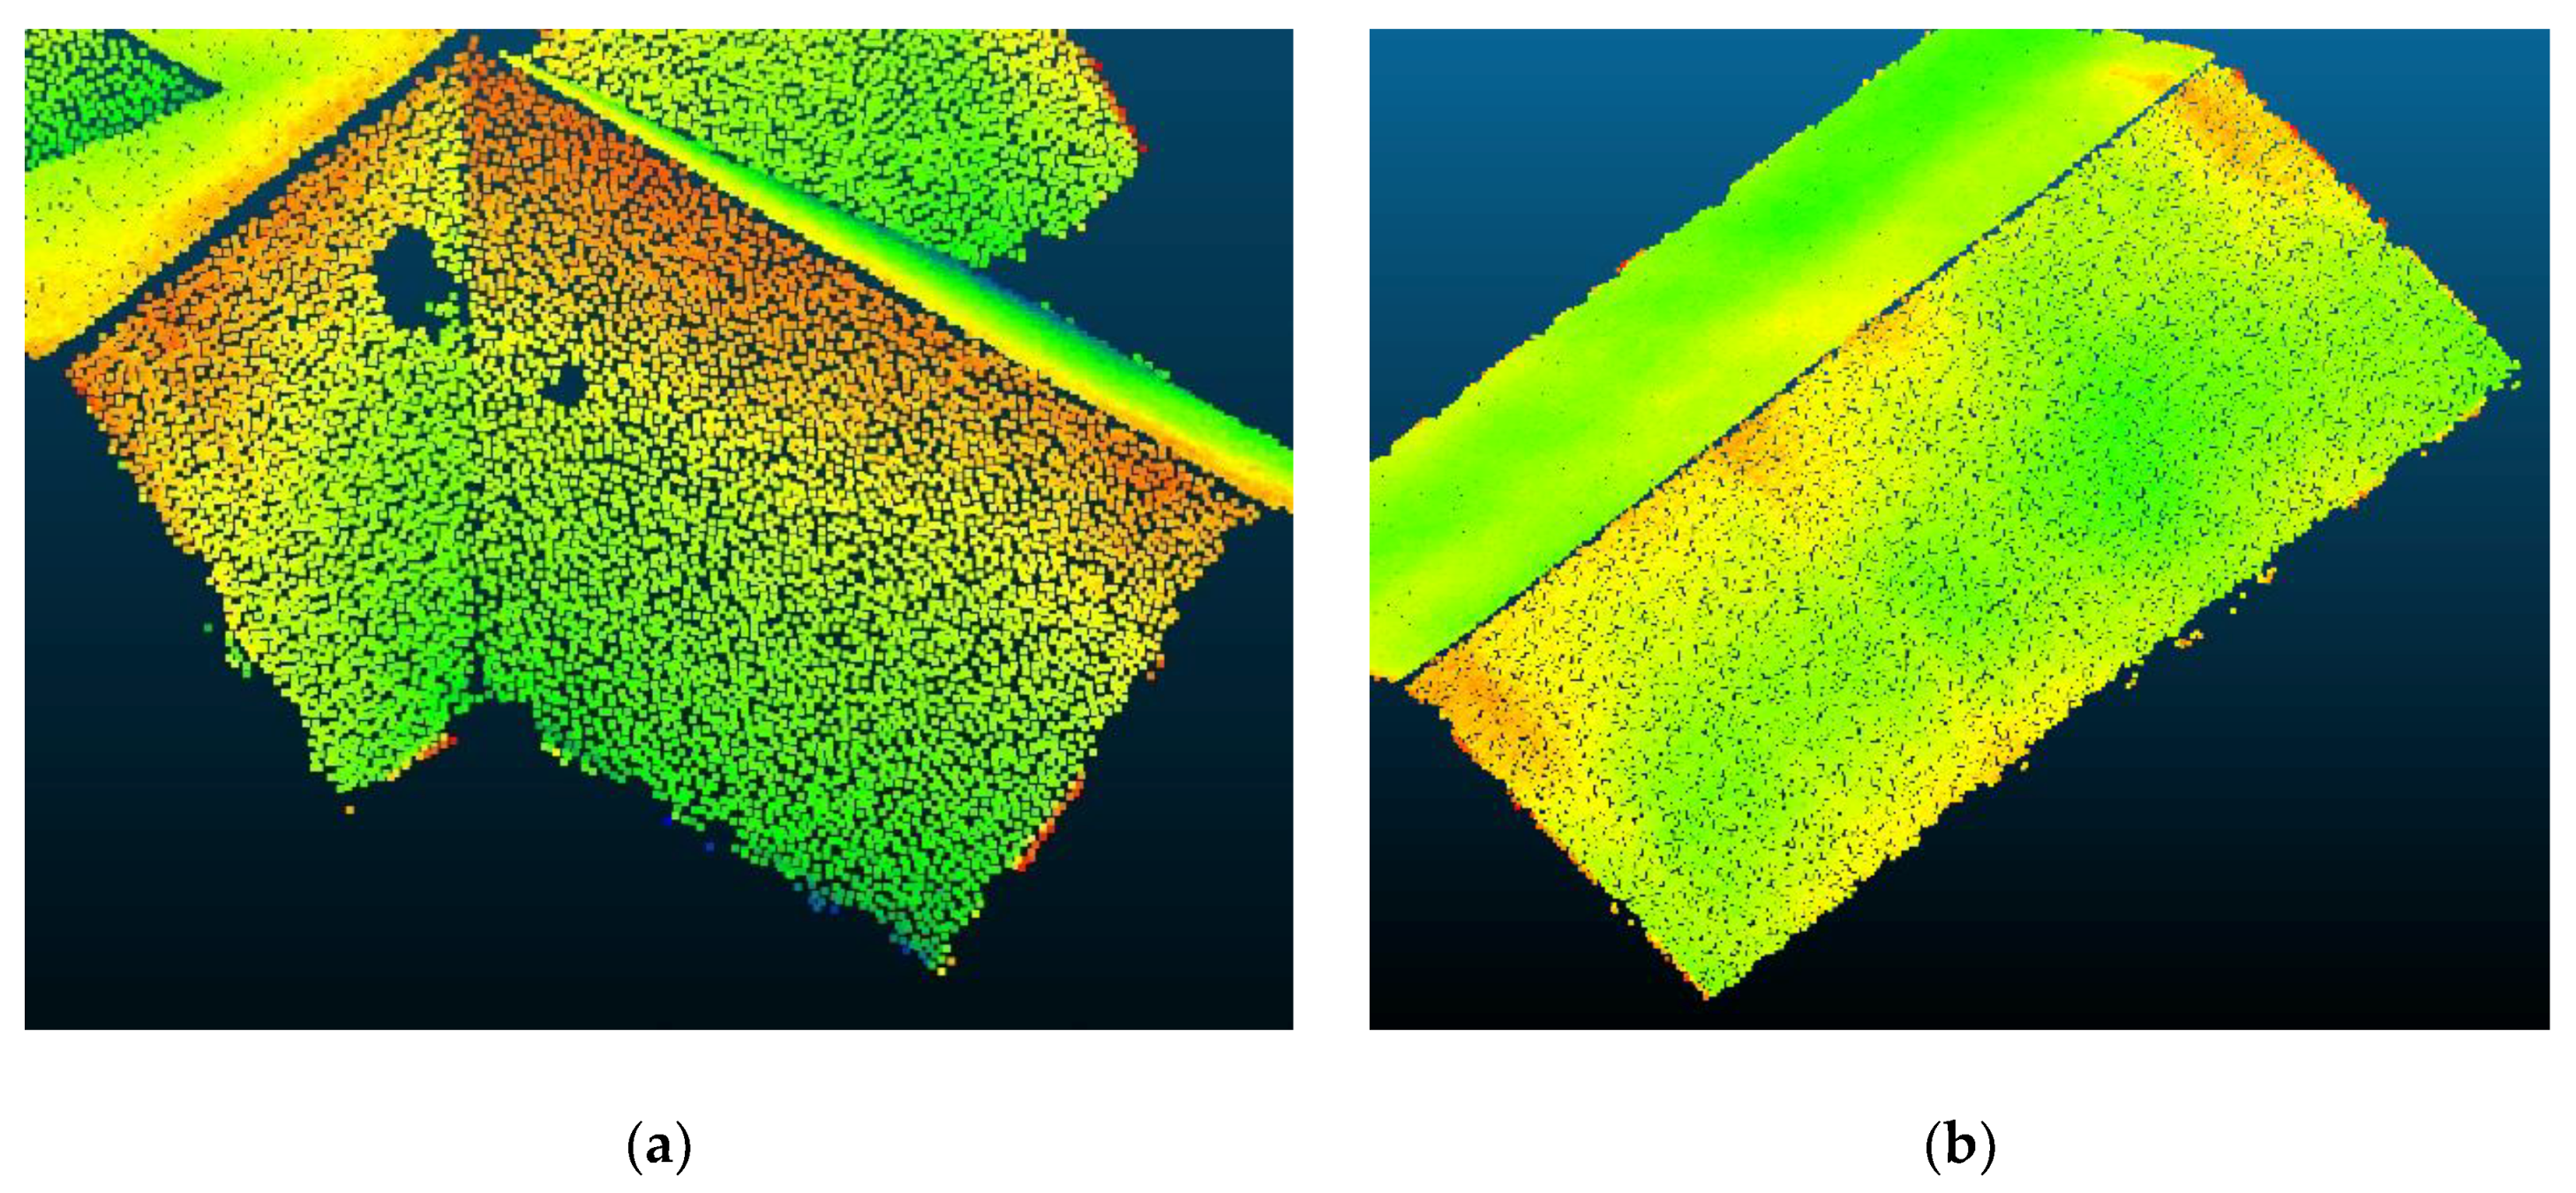
Table 1.
The specifications of the digital camera used for data acquisition.
| Parameter | Value |
|---|---|
| Focal length | 17 mm |
| Shutter speed | 1/1000 s |
| Camera resolution | 16.1 Mpx |
| Sensor type | CMOS |
| Sensor size | 4608 x 3456 px |
| Pixel size | 3.74 µm |
Table 2.
Parameters of the unmanned aerial vehicle (UAV) flight for the case study area Vače, Slovenia.
Table 2.
Parameters of the unmanned aerial vehicle (UAV) flight for the case study area Vače, Slovenia.
| Parameter | Value |
|---|---|
| Overlap (forward/sideward) | 85%/65% |
| Flight altitude (above ground level) | 50 m |
| Average Ground Sampling Distance (GSD) | 1.1 cm/px |
| Number of images | 344 |
| Number of Ground Control Points (GCPs) | 9 |
Table 3.
The parameters of point cloud segmentation for the selected study area.
| Algorithm | Parameter | Value |
|---|---|---|
| Surface variation computation | Neighbourhood radius | 0.30 m |
| Surface variation threshold | 0.03 | |
| Label connected components | Minimum points per component | 1000 |
| Minimum distance between components | 0.20 m |
Table 4.
The parameters of the efficient RANSAC algorithm for the selected study area.
| Parameter | Value |
|---|---|
| Minimum support points per primitive | 300 |
| Primitive | Plane |
| Maximum distance to primitive | e = 0.05 m |
| Sampling resolution | b = 0.10 m |
| Maximum normal deviation | a = 5° |
| Overlooking probability | 0.90 |
Table 5.
The parameters for building outline generation.
| Parameter | Value [m] |
|---|---|
| Alpha value | 0.5–0.7 |
| Douglas-Peucker tolerance | 0.3 |
| Regularisation tolerance | 0.25 |
| Regularisation precision | 0.05 |
Table 6.
The positional accuracy of the extracted roof outlines with respect to the input point cloud.
Table 6.
The positional accuracy of the extracted roof outlines with respect to the input point cloud.
| The Roof Type of 3D Building Model | RMSE2D [m] |
|---|---|
| Flat roof | 0.165 |
| Gable roof | 0.109 |
| Cross gable roof | 0.140 |
| Two-level gable roof | 0.131 |
| Average | 0.136 |
© 2020 by the authors. Licensee MDPI, Basel, Switzerland. This article is an open access article distributed under the terms and conditions of the Creative Commons Attribution (CC BY) license (http://creativecommons.org/licenses/by/4.0/).
Share and Cite
MDPI and ACS Style
Drešček, U.; Kosmatin Fras, M.; Tekavec, J.; Lisec, A. Spatial ETL for 3D Building Modelling Based on Unmanned Aerial Vehicle Data in Semi-Urban Areas. Remote Sens. 2020, 12, 1972. https://0-doi-org.brum.beds.ac.uk/10.3390/rs12121972
AMA Style
Drešček U, Kosmatin Fras M, Tekavec J, Lisec A. Spatial ETL for 3D Building Modelling Based on Unmanned Aerial Vehicle Data in Semi-Urban Areas. Remote Sensing. 2020; 12(12):1972. https://0-doi-org.brum.beds.ac.uk/10.3390/rs12121972
Chicago/Turabian StyleDrešček, Urška, Mojca Kosmatin Fras, Jernej Tekavec, and Anka Lisec. 2020. "Spatial ETL for 3D Building Modelling Based on Unmanned Aerial Vehicle Data in Semi-Urban Areas" Remote Sensing 12, no. 12: 1972. https://0-doi-org.brum.beds.ac.uk/10.3390/rs12121972
Note that from the first issue of 2016, this journal uses article numbers instead of page numbers. See further details here.