Article

Results from Verification of Reference Irradiance and Radiance Sources Laboratory Calibration Experiment Campaign

by
Agnieszka Białek
1,*,
Teresa Goodman
1,
Emma Woolliams
1,
Johannes F. S. Brachmann
2,
Thomas Schwarzmaier
2,
Joel Kuusk
3,
Ilmar Ansko
3,
Viktor Vabson
3,
Ian C. Lau
4,
Christopher MacLellan
5,
Sabine Marty
6,
Michael Ondrusek
7,
William Servantes
1,
Sarah Taylor
1,
Ronnie Van Dommelen
8,
Andrew Barnard
8,
Vincenzo Vellucci
9,
Andrew C. Banks
1,
Nigel Fox
1,
Riho Vendt
3,
Craig Donlon
10 and
Tânia Casal
10
add Show full author list remove Hide full author list
1
National Physical Laboratory, Teddington TW11 0LW, UK
2
Deutsches Zentrum für Luft- und Raumfahrt, 82234 Wessling, Germany
3
Tartu Observatory, University of Tartu, 61602 Tõravere, Estonia
4
Commonwealth Scientific and Industrial Research Organisation, Kensington, WA 6151, Australia
5
Natural Environment Research Council’s Field Spectroscopy Facility, Edinburgh EH9 3FE, UK
6
Oceanography Group, Norwegian Institute for Water Research, Gaustadalleen 21, 0349 Oslo, Norway
7
Center for Satellite Applications and Research, National Oceanic and Atmospheric Administration, College Park, MD 20740, USA
8
Sea-Bird Scientific, Bellevue, WA 98005, USA
9
Sorbonne Université, CNRS, Institut de la Mer de Villefranche IMEV, F-06230 Villefranche-sur-Mer, France
10
European Space Agency, 2201 AZ Noordwijk, The Netherlands
*
Author to whom correspondence should be addressed.
Remote Sens. 2020, 12(14), 2220; https://0-doi-org.brum.beds.ac.uk/10.3390/rs12142220
Submission received: 12 June 2020 / Revised: 26 June 2020 / Accepted: 1 July 2020 / Published: 10 July 2020
(This article belongs to the Special Issue Fiducial Reference Measurements for Satellite Ocean Colour)

Abstract

:
We present the results from Verification of Reference Irradiance and Radiance Sources Laboratory Calibration Experiment Campaign. Ten international laboratories took part in the measurements. The spectral irradiance comparison included the measurements of the 1000 W tungsten halogen filament lamps in the spectral range of 350 nm–900 nm in the pilot laboratory. The radiance comparison took a form of round robin where each participant in turn received two transfer radiometers and did the radiance calibration in their own laboratory. The transfer radiometers have seven spectral bands covering the wavelength range from 400 nm–700 nm. The irradiance comparison results showed an agreement between all lamps within ±1.5%. The radiance comparison results presented higher than expected discrepancies at the level of ±4%. Additional investigation to determine the causes for these discrepancies identified them as a combination of the size-of-source effect and instrument effective field of view that affected some of the results.

Graphical Abstract

1. Introduction

The National Metrology Institutes (NMIs) are responsible for the International System of Units (SI) which provides the foundation for measurement around seven base units and a system of coherent derived units. There are three key concepts underpinning how the desired multi-century stability and world-wide consistency of these units is achieved: uncertainty analysis, traceability and comparisons [1].
Uncertainty analysis is the systematic review of all sources of uncertainty associated with a particular measurement and the formal propagation of uncertainties through methods defined by the Guide to the Expression of Uncertainty in Measurement (GUM) [2]. Metrological traceability to a measurement unit of the International System of Units [3] is the concept that links all metrological measurements to the SI through a series of calibrations or comparisons. Each step in this traceability chain has rigorous uncertainty analysis, usually peer reviewed or audited and always documented. Comparisons [4] are the process of validating an uncertainty analysis by comparing the measurement of artefacts by different laboratories.
NMIs must participate in regular (usually every 10 years) formal comparisons. Each technical discipline defines a limited number of “key comparisons” and these provide evidence to support uncertainty analysis for a certain number of related quantities in a “Calibration and Measurement Capability Database”. For example, the Consultative Committee for Photometry and Radiometry (CCPR) has defined a key comparison for six key measurands (spectral irradiance, spectral responsivity, luminous intensity, luminous flux, spectral diffuse transmittance and spectral regular reflectance). There is no key comparison for spectral radiance, as it is assumed that reliable results (results that are consistent with declared uncertainties) in the spectral irradiance comparison together with results for the comparison of reflectance provide sufficient evidence for spectral radiance measurements as well.
In 2008, the Committee on Earth Observation Satellites (CEOS) established and endorsed the Quality Assurance Framework for Earth Observation (QA4EO) [5] which set general principles for Earth Observation (EO) data quality assurance and which follows the same metrological principles of the NMIs. Although QA4EO does not explicitly require traceability to SI and allows “or [to] a community-agreed reference”, it does state “preferably [to] SI”. To apply these principles in practice a concept of Fiducial Reference Measurements (FRM) was established and defined as [6]:
Fiducial Reference Measurements (FRM) are a suite of independent, fully characterized, and traceable ground measurements that follow the guidelines outlined by the Group on Earth Observations (GEO)/CEOS Quality Assurance framework for Earth Observation (QA4EO). These FRM provide the maximum Return On Investment (ROI) for a satellite mission by delivering, to users, the required confidence in data products, in the form of independent validation results and satellite measurement uncertainty estimation, over the entire end-to-end duration of a satellite mission [7].
The Fiducial Reference Measurements for Satellite Ocean Colour (FRM4SOC) project was established and funded by the European Space Agency (ESA) to provide support for evaluating and improving the state of the art in satellite ocean colour validation through a series of comparisons under the auspices of the CEOS. The project makes a fundamental contribution to the Copernicus Earth Observation system, led by the European Commission, in partnership with ESA, by ensuring high quality ground-based measurements for ocean colour radiometry (OCR) for use in validation of ocean colour products from missions like Sentinel-3 Ocean Colour and Land Instrument (OLCI) [8] and Sentinel-2 Multi Spectral Imager (MSI) [9].
In the past, a dedicated program to support the quality of Sea-viewing Wide Field-of-view Sensor (SeaWIFS) [10] products was conducted. The Seventh SeaWiFS Intercalibration Round-Robin Experiment (SIRREX) [11] and the Second Intercomparison and Merger for Interdisciplinary Ocean Studies (SIMBIOS) [12,13,14] included comparisons of irradiance and radiance sources as well as radiometers by the teams participating in validation activities of the SeaWIFS. For the Medium Resolution Imaging Spectrometer (MERIS) [15] a comparison of in situ measurements was performed at the Acqua Alta Oceanographic Tower (AAOT) [16] and showed the discrepancies between the measurements mostly explained by the combined uncertainties of the compared measurements with a few exceptions.
From the metrological point of view, it is important to repeat such comparison exercises at regular time frames; firstly to achieve the measurements agreement, then to ensure that the consistency between the organisations is held stable and, finally, to enable new participants to verify their measurements capability.
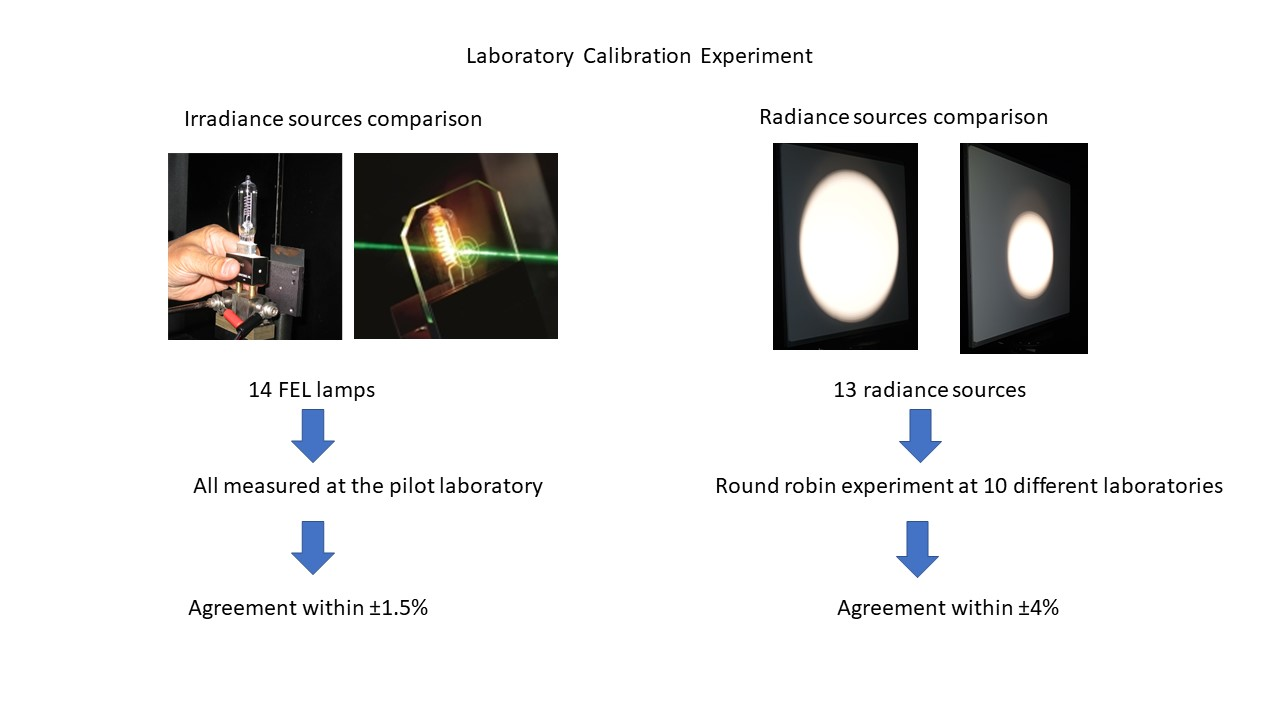
This paper presents results from the first step in the OCR measurement chain and includes a comparison intended to verify the performance of the irradiance and radiance sources used to calibrate ocean colour radiometers.

2. Methods

2.1. Layout and Organisation of the Comparisons

Public announcements were made to invite all laboratories involved in the satellite Ocean Colour (OC) validation activities. To participate, laboratories had to hold working standards with spectral irradiance and radiance values traceable to SI. Irradiance and radiance measurements comparisons were addressed separately.
First National Physical Laboratory (NPL), the UK NMI, conducted a laboratory comparison of the irradiance sources involving measurements of all participating lamps at NPL in April 2017. Participants were encouraged to attend this comparison in person to hand carry the lamps to and from the comparison and to attend a training course in absolute radiometric calibration and uncertainty evaluation that was given at the same time. Remote participation in irradiance comparison was allowed, however the training course was given only to seven persons present at NPL at the time.
Then, a round-robin of each participant’s radiance sources using ocean colour transfer radiometers was performed between May 2017 and October 2018. This involved two calibrated transfer radiometers sent back and forth in turn to each participant to perform radiance measurements. NPL served as pilot and was responsible for inviting participants, circulating the transfer radiometers and for the analysis of data, following appropriate processing by individual participants. The experiment was conducted anonymously. NPL was the only organisation to have access to and was able to view all data from participants.
The list of ten international laboratories that took part in this comparison exercise is shown in Table 1. Note that three of the institutes, Remote Sensing Technology Institute, Deutsches Zentrum für Luft und Raumfahrt (DLR-IMF), Joint Research Centre (JRC) and Norsk Institutt for Vannforskning (NIVA) participated in the radiance round robin only.

2.1.1. Irradiance Comparison

In this comparison 1000 W quartz tungsten halogen (QTH) lamps, so-called FEL lamps (not acronym) according to American National Standard Institute (ANSI) designation, are considered as irradiance sources and were used at the standard calibration distance of 500 mm measured from their reference plane. Absolute spectral irradiance values were determined by reference to the NPL 2010 spectral irradiance scale; that is the scale that was realised in 2010 and validated in international comparisons, after a major upgrade to its facility prior to 2010. The measurements were made using the NPL Spectral Radiance and Irradiance Primary Scales (SRIPS) [17] or secondary Reference Spectroradiometer (RefSpec) facility. The two facilities are very similar and allowed the comparison of participants’ lamps to reference lamps that had been themselves calibrated on SRIPS by reference to a high temperature, high-emissivity blackbody source operated at a temperature of approximately 3050 K. Spectral irradiance measurements were made from 350 nm to 900 nm at 10 nm steps with an instrument bandwidth of approximately 2.8 nm full width at half maximum (FWHM). Ambient temperature during measurements was 22 ° C ± 2 ° C. The results of the comparison were expressed in terms of the difference between the spectral irradiance values measured by each participant and the mean spectral irradiance values measured by all participants. Since the participants all measured different lamps (i.e., their own lamps), the required differences between them were determined via measurements at NPL of all lamps. The mean ratio between the participants’ measurements and those made at NPL was calculated and results for each lamp were then expressed relative to this mean ratio, so showing the degree to which the individual measurements agree with one another. This approach was taken because:
  • the participants had various different SI-traceability routes for their lamps, i.e., a number of different NMIs providing their calibration. If all results were shown relative to the NPL values, then this might give the impression that traceability to NPL is ’correct’ or ’best’ whereas traceability to any NMI should be regarded as equally acceptable.
  • A few of the lamps were recently calibrated at NPL and using a simple ratio to the NPL scale would have shown them to be performing almost ’perfectly’ and thus give a misleading and biased comparison.
  • Presenting the results in terms of the agreement between each lamp and the mean of all of the lamps shows how well measurements of the different participants agree with each other, regardless of the traceability route. This was the key aim of the comparison and this form of presentation gives the clearest indication of that.
  • the ratio between the NPL scale and the mean of all the participants’ lamps is also included, which gives the confidence that the linkage to SI is sound in all cases.
The FEL lamps used in the comparison were sourced from four different commercially available sources: Gooch and Housego (now Optronic Laboratories Inc., Orlando, USA) OL FEL 1000 W, Gigahertz BN-9101 FEL 1000 W, Gamma Scientific Model 5000 FEL 1000 W and L.O.T.-Oriel 63350 FEL 1000 W. In addition, one participant had a modified general purpose Osram Sylvania 1000 W FEL lamp. In total, 14 lamps from the participants and two of the NPL standards were measured. According to the manufacturer’s specification and original calibration certification, these lamps were run using their nominal current values and these varied from lamp to lamp between 8.0 A, 8.1 A and 8.2 A. All lamps were within the 50 h of burn time since the last calibration. There were three different traceability chains for the participants. The most common traceability was to the National Institute of Standards and Technology (NIST) scale via Gooch & Housego (now called Optronics Laboratories). The lamps were calibrated by a direct comparison method to the NIST traceable calibration standards. These calibration standards are directly traceable to the NIST irradiance standard. The second group of lamps was traceable to NPL via a direct comparison method to NPL working irradiance standard. Two lamps were calibrated by the Metrology Research Institute (MRI) of Aalto University, Finland. One lamp was calibrated by Tartu Observatory with traceability to MRI. Depending on the lamp type, the appropriate alignment procedure was used following the lamp manufacturer’s instructions. The reference plane for a distance measurement of each lamp type was defined by the manufacturer and was followed.
The Gamma Scientific lamps have a dedicated lamp housing enclosure to reduce the stray light in the room during the measurements. During this comparison, one participant provided a lamp with this housing (and the lamp was measured with the housing at NPL), and another participant provided the lamp without the housing and was measured as it was provided. We did not notice a difference in the irradiance measurements performed on NPL facilities (which appropriately shielded stray light) between them, but, of course, the irradiance of an individual lamp will be sensitive to whether or not that lamp housing was included.
Each lamp was ramped up and run for 30 min before measurements commenced. The voltage was monitored during measurement and is given for checking purposes only.

2.1.2. Radiance Comparison

For this comparison, the radiance source was an FEL lamp (the organisations who took part in the irradiance comparison used the same lamps) and a reference reflectance panel (such as Spectralon) set in the 0 ° :45 ° (0 ° incidence angle and 45 ° viewing angle) setup presented in Figure 1. The recommended distance between the lamp and the panel was 500 mm as this is the default distance for the irradiance calibration. However, it was recognised that some participants could not perform their measurements with a 500 mm lamp-diffuser distance due to laboratory constraints and therefore other distances were allowed as well (as long as the uncertainties were accounted for). Due to the varying source calibration distances or other instrumental constraints, measurements were acquired at lamp-panel distances 500 mm, 750 mm, 1000 mm and 1300 mm by different participants, some participants obtaining measurements at more than one distance. The recommended minimum distance for the radiometer was defined at approximately 250 mm from the panel. A maximum distance was not set as the panel radiance as measured by a radiometer should, within the constraints of source uniformity, be insensitive to the radiometer distance.
Different types and sizes of reflectance standards were allowed, so as not to exclude any of the participants due to the type of the standard used. However, we requested the technical details and calibration history of the artefacts along with SI-traceable calibration certificates. Table 2 contains the details of the lamp-panel distance for each participant/calibration set-up and information about reflectance standard used.
The vast majority of the reflectance standards used by the participants was calibrated for 8 ° :hemispherical reflectance by Labsphere laboratory with the NIST traceability using a dual beam spectrophotometer with an integrating sphere accessory. Only two had 0 ° :45 ° reflectance factor calibration traceable to NPL.
To enable a complete radiance source comparison between laboratories, we proposed using a transfer standard radiometer to compare the participant’s in-house radiance calibration performance. As NPL does not own an OCR instrument one of the participants, Joint Research Centre of the European Commission (JRC), kindly agreed to provide two of their stable OC multispectral filter radiometers as the transfer radiometers.
On completion of the radiance measurements, each participant sent their results (radiometer readings and spectral radiance data) to the pilot. The pilot calculated radiometer calibration factors using Equation (1) and these data.
C L cal ( λ ) = L ( λ ) D N l ( λ ) D N d ( λ ) ,
where C L cal is absolute radiance calibration coefficient, D N l and D N d are radiometer readings during the radiance calibration, with the l and d indicating light and dark readings, respectively, L is the radiance value and λ indicates the radiometer spectral channel. Radiance values per each spectral channel are given by Equation (2)
L ( λ ) = E ( λ ) π 500 d 2 R 0 : 45 ( λ ) ,
where E is the lamp irradiance value from the calibration certificate, d is the lamp-panel distance used during the measurement and R 0 : 45 is the reflectance panel 0 ° :45 ° reflectance factor from the calibration certificate.
For these participants who did not have their reference reflectance panels calibrated at 0 ° :45 ° reflectance factor geometry, the most common calibration for the 8 ° :hemispherical reflectance was allowed. A correction factor of 1.024 was applied to the diffuse reflectance calibration values to correct it for the proper measurement geometry. The value of that correction factor was established based on NPL internal data combined with published data by NIST, the USA National Metrology Institute, [18].
The central wavelength was used to derive the spectral band radiance value. The radiometers used in this comparison have narrow (10 nm) spectral bands, in addition the radiance source does not have any distinct spectral features and is monotonically increasing in the spectral region of interest for this study. All the participants used spectrally similar radiance sources. Therefore, the difference between the spectral band integration values and the central wavelengths are small. The same conclusion was found in SIMBIOS comparisons [13].
Each participant was asked to evaluate uncertainties associated with their radiance source operating in their own laboratory for these measurements. This included all the additional uncertainty components related to the alignment of the lamp, panel and radiometer, distance measurements and other relevant laboratory specific factors such as power supply stability and accuracy. The results of the comparisons are expressed as the percentage difference to the mean calibration coefficients obtained by taking an average of all participants results.
Two Satlantic ocean colour radiometers (OCR-200) were used as transfer radiometers. These are 7 channel multispectral instruments with general technical characteristics of these type of radiometers shown in Figure 2, although the two particular instruments used for FRM4SOC had been customised by Satlantic for JRC in terms of their spatial characteristics to provide a narrower (3 ° ) field of view in air. Initial characterisation measurements to confirm this field of view (FOV) were carried out by NPL in air, and found to be 2.5 ° ± 0.3 ° at FWHM, with a close to Gaussian profile (see Figure 3) for both radiometers (serial numbers 051 and 110) used in this comparison.

3. Results

This section presents the results of the comparisons. The irradiance values are reported at the following wavelengths (350, 360, 370, 380, 390, 400, 450, 500, 600, 700, 800, 900) nm. This selection of wavelengths was dictated by the wavelengths reported in the calibration certificates from the participants. Although currently there are no OC missions that provide data below 400 nm, we wanted to include the ultraviolet spectral region in the comparison. There is a scientific interest to cover shorter wavelengths and this is indeed planned for the Plankton Aerosol Cloud ocean Ecosystem (PACE) [19] EO mission.
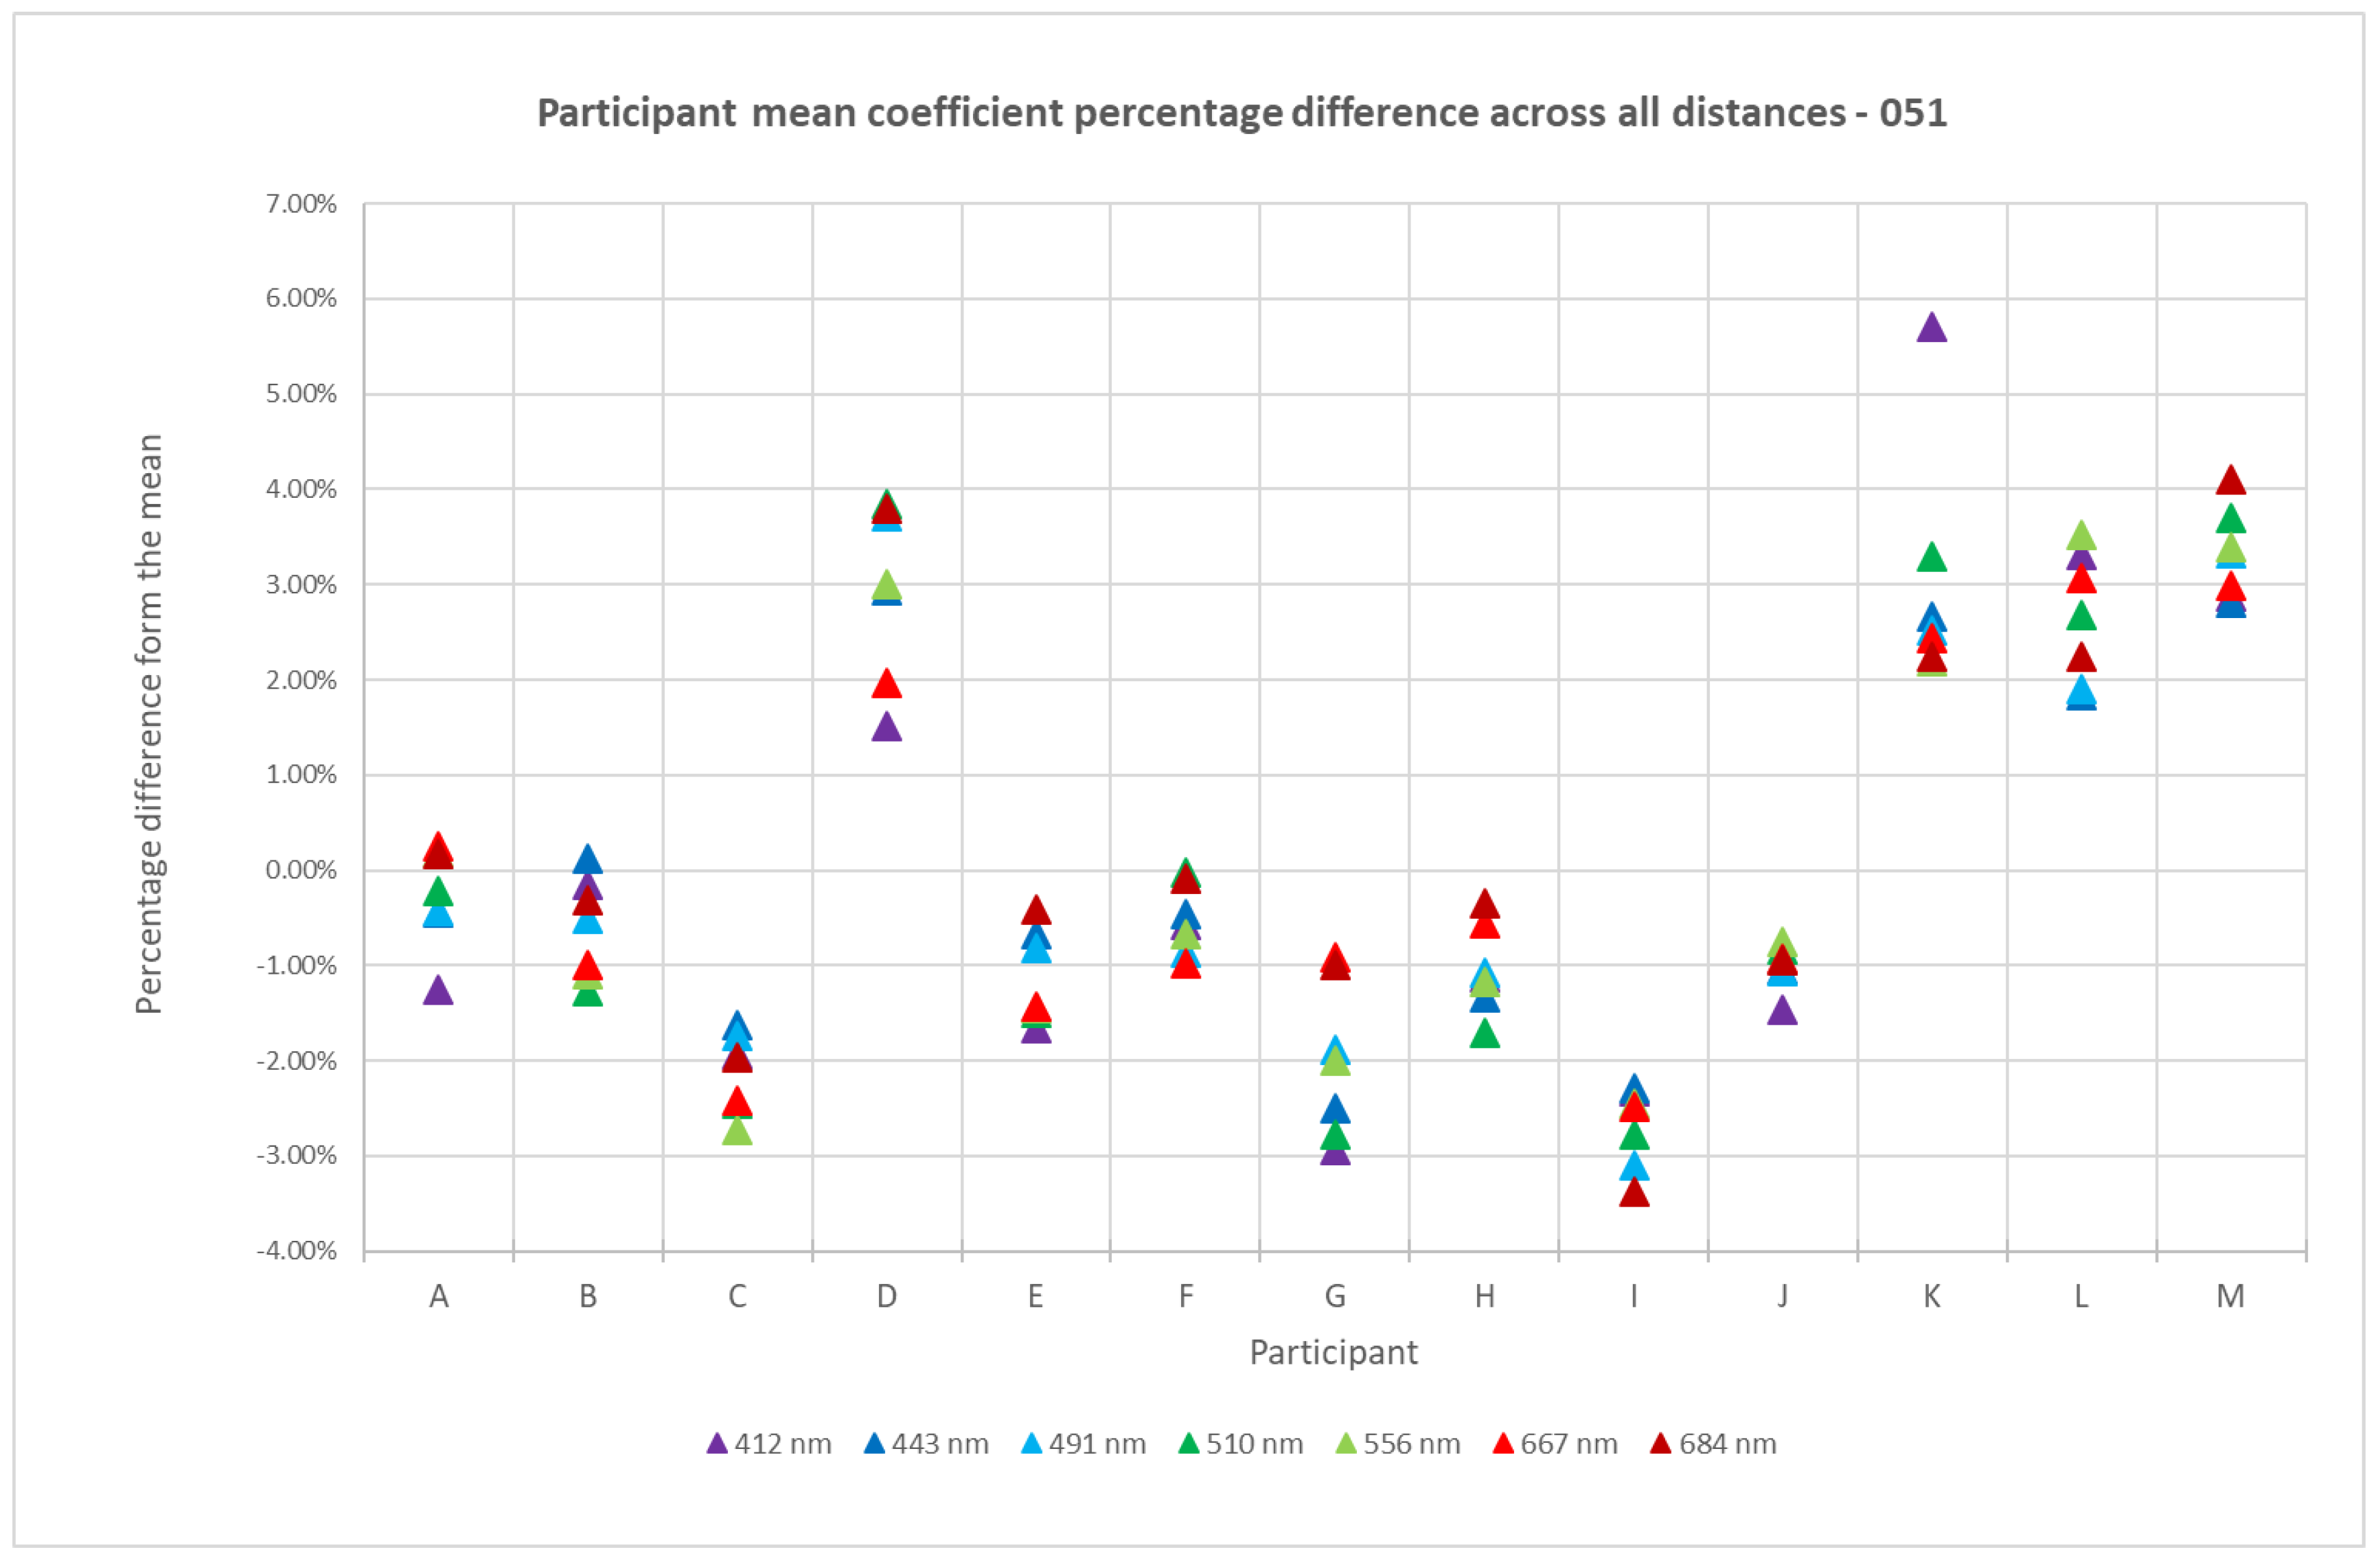
The radiance values are reported at the transfer radiometer spectral bands values (412, 443, 491, 510, 560, 667, 684) nm. We have chosen to present results anonymously to keep focus on community consistencies, rather than individual laboratory. Participants were informed which laboratory they were.

3.1. Irradiance

The overall summary result of the irradiance comparison is presented in Figure 4. The data series for each lamp used in the comparison are marked as Lamp A to Lamp N. The black dotted line indicates the mean ratio to NPL.
The results show an agreement between all measured lamps as all data series above 400 nm lay within the 0.99–1.013 range. The spread in the results is higher for shorter wavelengths as expected due to the higher measurements uncertainty presented in the absolute radiometric calibration for this spectral range.
The uncertainty for the individual lamp ratio is expressed by Equation (3) and was calculated by combining several uncertainty components. All components are relative, thus expressed in percentage form.
u ( E r ) = ( u 2 c cer 2 + u 2 ( s NPL ) + u 2 ( c n ) + u 2 ( c λ ) + u 2 ( c sl ) + u 2 ( c cur ) + u 2 ( c age ) + u 2 ( c alig ) ,
where the u ( E r ) is the uncertainty in the ratio of the irradiance values from the lamp calibration certificate to measurements performed at NPL, the u c cer 2 is uncertainty from the lamp calibration certificate, note that uncertainty value is divided by two to convert it to a standard uncertainty from a coverage factor k = 2 used in the certificate. The u ( s NPL ) is the NPL scale uncertainty and the additional components related to the measurements performed at NPL which included noise u ( c n ) , and the uncertainty contributions to the irradiance value caused by: wavelength setting accuracy u ( c λ ) , room stray light u ( c sl ) , the lamp current uncertainty u ( c cur ) , ageing of the lamp u ( c age ) and the lamp alignment u ( c alig ) . The typical values for the ratio uncertainty expressed in percent are given in Table 3.

3.2. Radiance

The overall summary result of the radiance comparison is presented in Figure 5 for the radiometer with serial number 051 and in Figure 6 for the radiometer with serial number 110. The colour triangles represent the seven spectral bands of the radiometers and the participants/set-ups are marked as letters from A to M. Please note that we present here 13 entries to the summary results that came from 10 participating institutes. The number of entries is higher because some organisations provided results at two different distance settings between the lamp and the reflectance panel, or two different measurements set-up like radiometers alignment to the central channel versus alignment to each channel in turn.
The results for both instruments show the same trends. The difference for any individual participant/set-up from the mean value is up to 4%, which is slightly higher than expected. A clear split into two groups can be seen. The majority of the results forms a group with radiance calibration coefficient values below the mean value and a second group of 4 participants has radiance calibration coefficient values around 3% above the mean value.
Each participant was asked to provide an uncertainty budget for their calibration of the radiance calibration coefficient values of the radiometers. The uncertainty of radiance measurements is calculated according to Equations (4) and (5). The wavelength dependence is not included in the following equations, but all the values were derived for the central wavelength of each of the radiometer spectral channels and take a similar form for all spectral channels.
u rel ( L cal ) = u 2 ( D N l ) + u 2 ( D N d ) ( D N l D N d ) 2 + u 2 ( c sl ) + u 2 ( L rel ) ,
where u rel ( L cal ) is the relative combined uncertainty of radiance calibration coefficient, u ( D N l ) and u ( D N d ) are the uncertainty of the radiometer reading during the radiance calibration, with the l and d indicating light and dark readings, respectively, u ( c sl ) is the uncertainty contributor due to the room stray light, expressed as percentage of the radiometer signal after the dark reading subtraction and u ( L rel ) is the relative uncertainty of the radiance source. The radiance source uncertainty components are listed in Equation (5).
u rel ( L ) = ( u rel 2 ( E ) + 2 2 u rel 2 ( d ) + u rel 2 ( R 0 : 45 ) + u 2 ( c cur ) + u 2 ( c age ) + u 2 ( c alig ) + u 2 ( c unif ) ,
where u rel ( E ) is lamp irradiance absolute calibration uncertainty converted to k = 1 from the certificate values, u rel ( d ) is the relative uncertainty associated with the distance setting, note that this component has a sensitivity coefficient equal to 2 (from the inverse square law) and, hence, in Equation (5) there is a term 2 2 just before it. In addition, for all measurements at distances different to the 500 mm, the participants were requested to include a filament-offset uncertainty component to account for the difference in the plane of the distance setting and actual lamp filament position. The u rel ( R 0 : 45 ) is the relative uncertainty of the reflectance standard calibration. Please note we use the uncertainty of the reflectance factor calibration at 0 ° :45 ° geometry at k = 1 ; for the case where a diffuse reflectance calibration value is corrected to 0 ° :45 ° geometry, an additional uncertainty of that correction has to be included in the equation, NPL recommends a 0.5% value. The remaining terms provide the relative uncertainty associated with radiance due to lamp current uncertainty u ( c cur ) , due to lamp ageing uncertainty, u ( c age ) , due to alignment u ( c alig ) of the lamp and the reflectance panel at 0 ° :45 ° configuration and due to target illumination non-uniformity within the FOV u ( c unif ) .
A few examples of participants’ radiance measurements uncertainty expressed in percent are presented in Table 4.

4. Discussion

The irradiance comparison results showed a good agreement within the expected uncertainty range. The observed differences are at a similar level to those reported in SIRREX-7 exercise [11], that states 1.3% for the comparisons on the FEL lamps irradiance calibration. However, the comparison presented here included more lamps with different designs and traceability routes. The SIRREX irradiance comparison was expressed as relative percent difference between the NIST and Optronic calibration of the same lamp. Higher differences were observed for wavelengths below 400 nm as this is a more challenging spectral region for radiometric measurements. This indicates that, for future satellite missions the absolute calibration will have higher uncertainty for these new wavelengths.
It is important to note that the same lamps (irradiance standards) used elsewhere in a different laboratory environment, using different power supply or being aligned less carefully, could produce different results. It is also important to note that the spread of results for irradiance lamps would be expected to be higher if the lamps are operated outside the controlled environmental and stray light conditions of a high-quality radiometric laboratory or operated with power supplies that are not as stable as those used at NPL. Therefore, for any measurement using the lamp as the transfer standard for the spectral irradiance it is essential to consider all the uncertainty components given in Equation (3), and not just those quoted on the calibration certificate.
The radiance comparison result, showing a lower level of agreement as compared to the irradiance comparison, led NPL to perform further investigations to explain the cause of the observed difference. The similarly-structured SIMBIOS comparison had results with the absolute value for each participant typically higher than expected by 2% [13,14], but the results were generally within the expected uncertainty range, with few exceptions. The SIMBIOS comparison used a radiometer as a reference and determined the difference in radiance measured by the radiometer and that calculated by each participating laboratory. In our comparison we tried to identify common features for the smaller group of the results that agree well with each other, but are around 3% higher than the top of the “main group”. The first common feature for the small group is that those results correspond to a lamp-panel distance of 500 mm; although some of the results in the main group were also made at that lamp-diffuser distance. Thus, the distance setting is not the only cause of the difference. The second common feature was the size of the illuminated patch on the reflectance target from the lamp. This size was influenced by the choice of light shields and other baffles in a particular laboratory setup. For the laboratories that use a lamp in a housing enclosure, the illumination patch size changes with the distance between the lamp and the diffuser.
NPL repeated a set of measurements to accommodate various conditions that participants may have in their own labs. The additional investigation was performed using an 18" Spectralon panel that was illuminated by the lamp at a distance of 500 mm and 1300 mm. The second distance was chosen as this was the longest distance used by a participant during the comparison. The size of the illuminated patch on the panel was varied from the fully illuminated panel, via a patch size with the diameter of around 23 cm to the small patch size of around 15 cm. The top panel in Figure 7a presents the photographs taken for the three different illumination patch sizes. The bottom panel in Figure 7b presents the percentage difference in the calibration coefficients obtained from five scenarios plotted as the data series from A to E. The series A, B and C represent the measurements at 500 mm distance for the fully illuminated panel, patch size 23 cm and the patch size 15 cm, respectively. The series D and E were done at 1300 mm distance for the fully illuminated and 23 cm patch size. The series A is set as the reference in this data set, therefore the percentage difference for this series is 0%.
A clearly visible positive bias can be seen for the measurements performed at 500 mm with a smaller size of the source. In addition, a negative bias can be seen for the measurements performed at the larger distance. All participants from the small group had their measurements done at the 500 mm source-panel distance with a relatively small size of their radiance source.
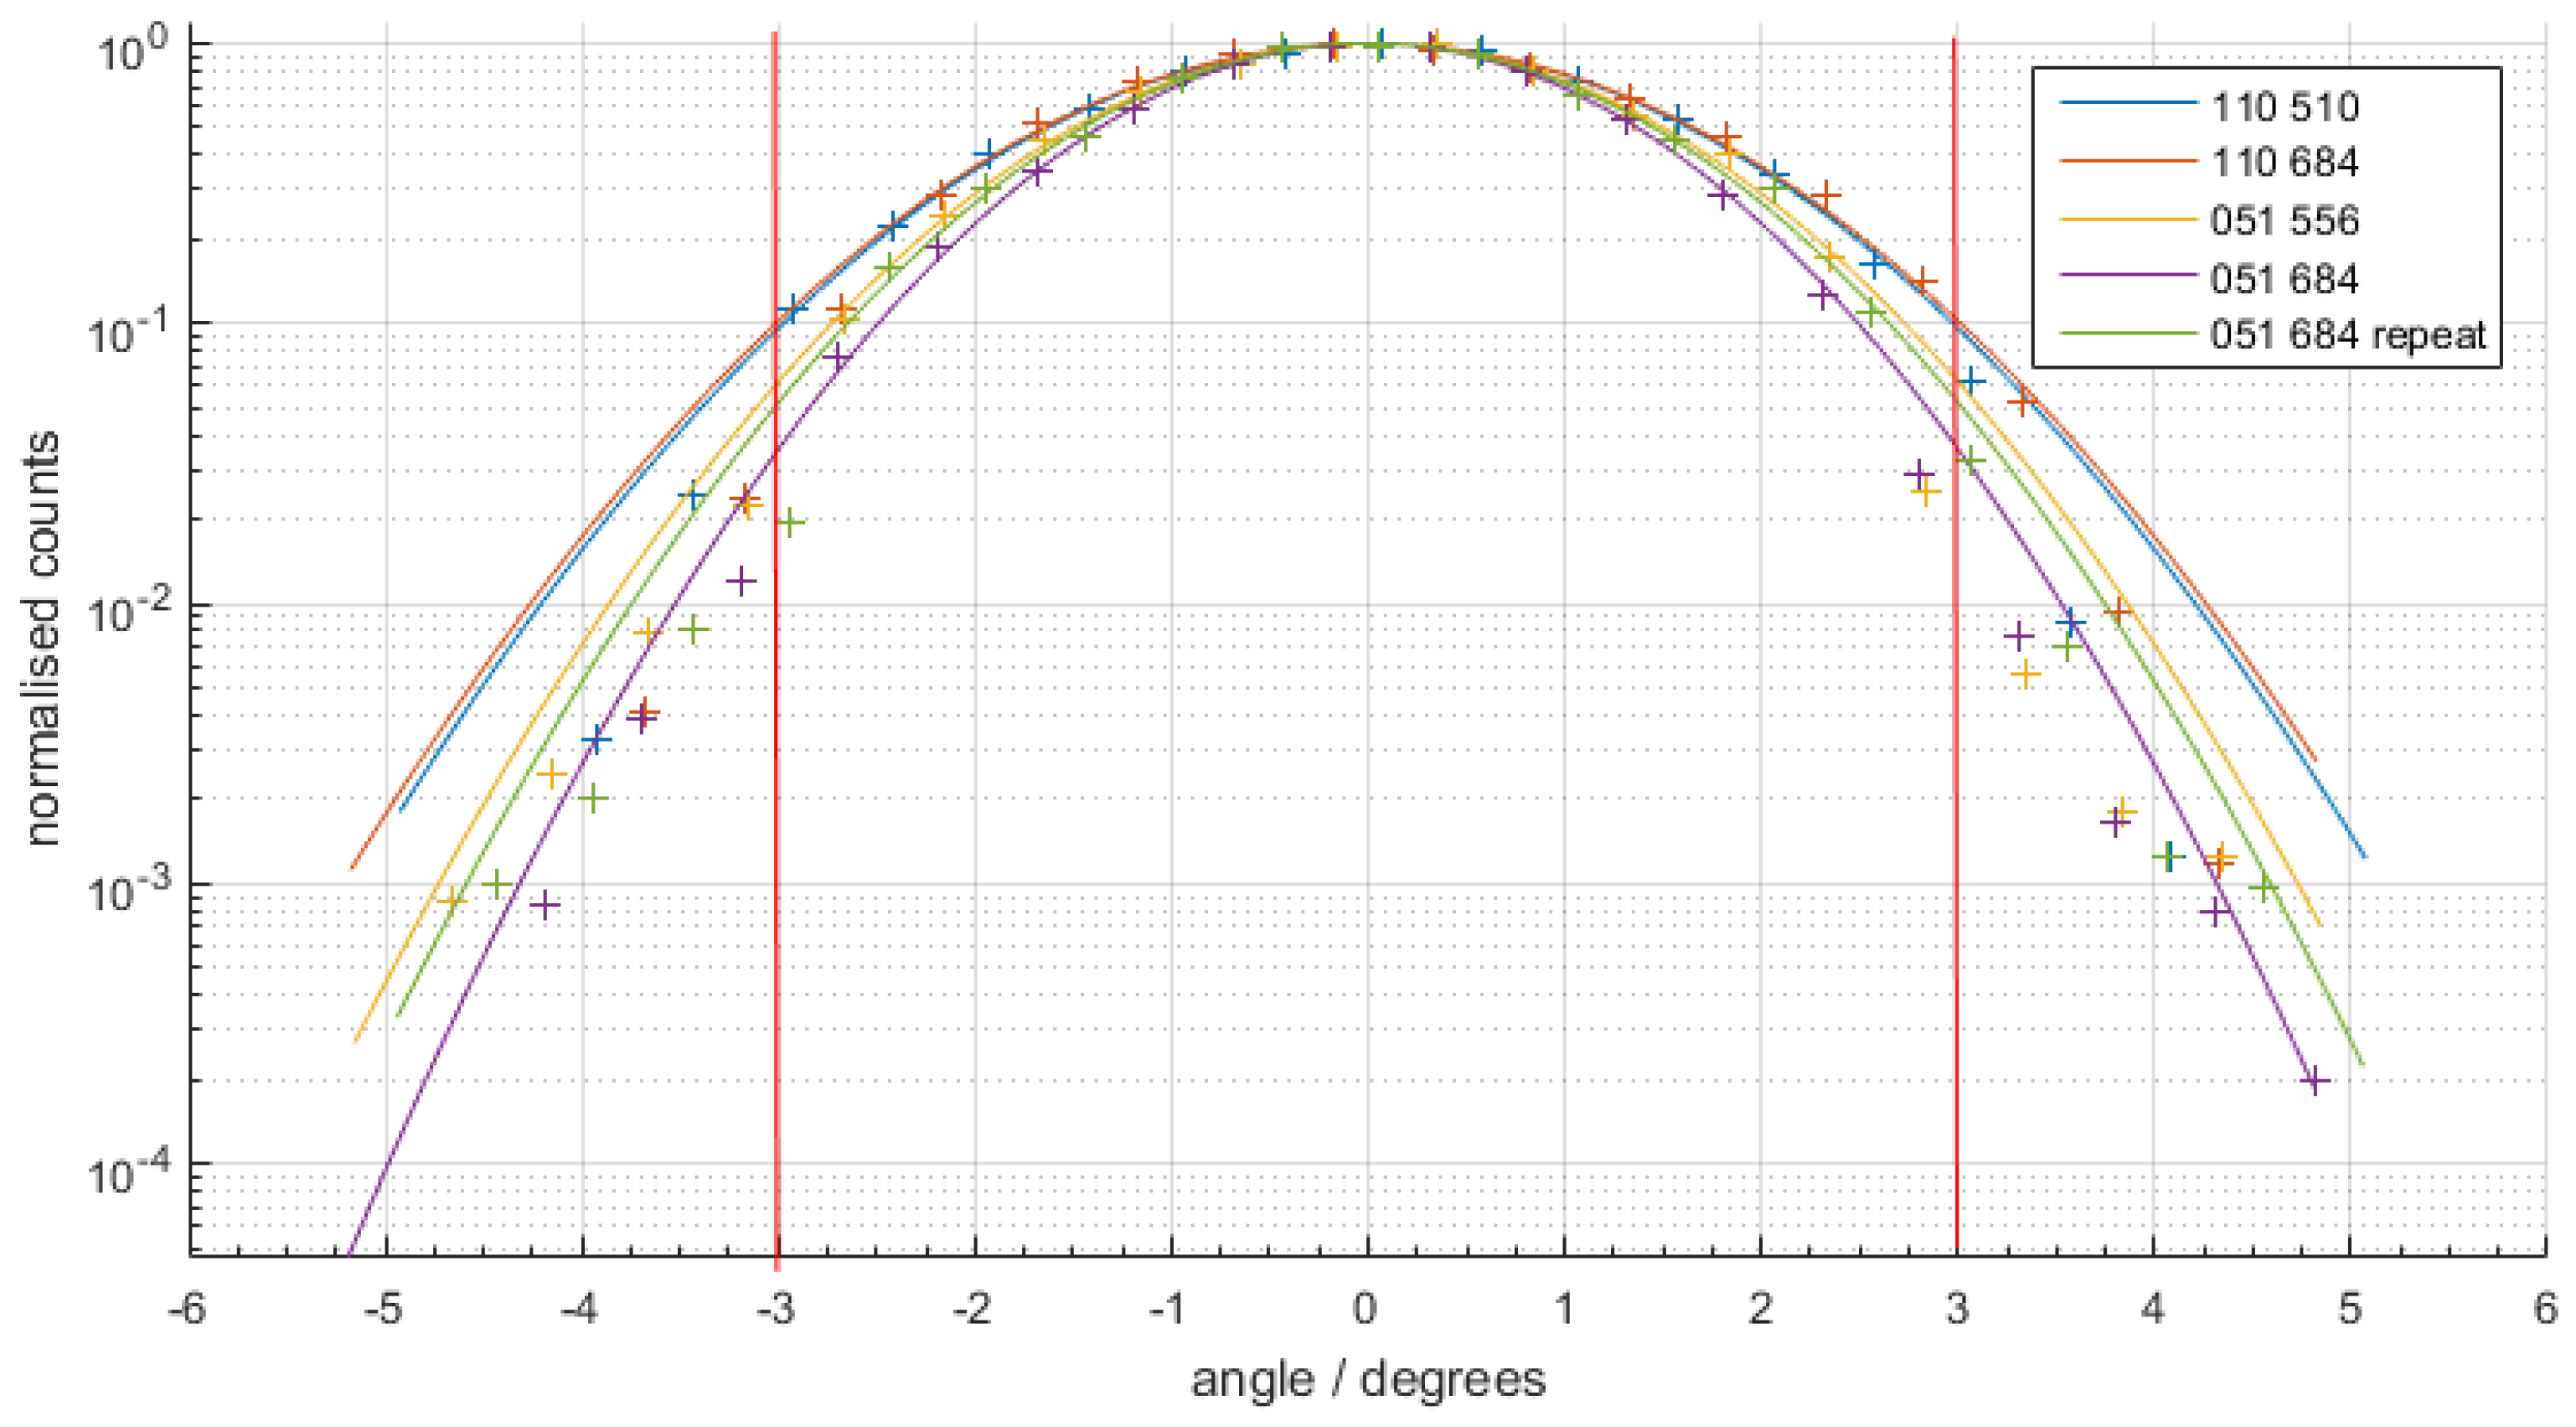
The most likely explanation for this is a combination of the instrument FOV and the size-of-source effect. These will also be influenced, to a small extent, by the distance from the panel to the radiometer, though we believe this is a minor consideration compared to the lamp-panel distance and the baffling that defined the source size Although the radiometers have a FOV defined as 3 ° , this is a FHWM value and with a Gaussian shape to the FOV, rather than a top-hat. That 3 ° FOV, when plotted on a logarithmic scale rather than linear, (see Figure 8) shows that there is still light detected at the level of 10 3 at 5 ° and this means that the instrument will see a wider area than expected, and perhaps, therefore, see a less uniform patch. The instrument was not viewing a non-illuminated patch, even for a 5 ° FOV, but was seeing a less uniform patch, and this would particularly be the case for a 500 mm lamp-panel distance. In addition, scattering on imperfections in the lens will lead to light “lost” from the central field of view and “regained” from the outer parts of the source. With a smaller source, less energy is regained and this can reduce the measured signal. This is known as the “size-of-source effect” [20,21].
Thus, the smaller size of the source leads to a reduced measured signal because of the size-of-source effect and a 500 mm lamp-diffuser distance leads to a smaller signal because of the reduced uniformity of the source across the FOV (the source is less bright away from the centre of the filament). When both effects are present, the measured signal is lower and therefore, from Equation (1), the radiance calibration coefficient is higher, as seen in the comparison results. To confirm this hypothesis, we also analysed the data for all participants considering the sensitivity to distance. This effect is not as strong at longer distances, as can be seen in Figure 7, series E, that has a smaller patch size but did not show a positive bias. Thus, here the effect of the size of the source is compensated by a negative bias introduced by the distance setting. We analysed the data of all participants according to their sensitivity to distance. The results of this analysis are presented in Figure 9.
The four data series represent the averaged comparison results for different distances of 500 mm, 750 mm, 1000 mm and 1300 mm, where the 500 mm distance is set as a reference, thus the percentage difference for the 500 mm series is equal to zero. Please note that 750 mm and 1300 mm had one entry to the comparison thus these are not averaged. The 500 mm series contains only the results from the main group and was set as the reference distance for that exercise, thus this data series has 0% difference. A negative bias can be observed with the distance increase for the 1000 mm and 1300 mm distance. For the 750 mm this is not so obvious, however this might be due to the fact that this particular participant has the radiance calibration values provided in radiance units for the whole system, rather than calculated from a lamp irradiance calibrated at 500 nm and a reflectance factor.
The protocol for the comparison encouraged participants to add an uncertainty component to account for set-ups where the source-diffuser distance is different from the 500 mm distance at which the lamps were originally calibrated for spectral irradiance. However, participants did not include an explicit correction for a different lamp-diffuser distance. It is possible that some of the observed differences between the main group and the other group are due to a bias from the filament offset. We would recommend in the future for the filament offset to be evaluated and corrected for [22]. This may also help to reduce the spread within the main group.

5. Conclusions

We presented here the results of the international irradiance and radiance sources comparisons that were run as a part of the ESA FRM4SOC study activities. Ten international organisations participated in that exercise.
The irradiance comparison was run at NPL, where all participating lamps were measured against NPL standards. The results of that comparison were reported as the difference between the spectral irradiance values measured by each participant and the mean spectral irradiance values measured by all participants to show the degree to which the individual measurements agree with one another, without introducing a bias toward NPL scale. The irradiance comparison values showed good agreements between all lamps.
The radiance comparison took a form of a round robin where two radiometers were sent in turn to each participant to obtain radiance calibration coefficients for the radiometer using their in-house facilities. The results were analysed to compare the calibration coefficients of each participant to that of the mean value of all participants. The results showed the discrepancies between the participants at the level of ±4% and two separate groups with the measurements agreement (see Figure 5 and Figure 6). Additional investigation showed that the reason for this difference was caused by a sensitivity to the size of the illuminated patch (instrument size-of-source effect) and partly because the instrument-effective FOV brought in non-uniform parts of the illumination for a shorter lamp-diffuser distance which affected the results of the smaller group. If these effects could be corrected for or the measurements repeated at different settings we would expect to see all measurements agreeing within ±2.5%, as this is the level of agreement in the results from the majority group. These results were obtained with a modified Satlantic OCR-200 that had a reduced FOV. The sensitivity to size-of-source would be expected to be larger for an unmodified instrument with a larger FOV.
The secondary objective of the comparison exercise was to increase the community awareness of measurement uncertainty evaluation using the GUM methodology. This was achieved via the training course that was provided for the participants being present at NPL during the irradiance comparison exercise week. The participants were given instruction on how to derive the uncertainty components related to their radiance measurements in-house and all the round robin radiance results were reported accompanied by the uncertainty budgets. The results have shown a discrepancy that is larger than the declared uncertainty. In part, this is due to uncorrected sensitivities (e.g., to lamp-panel distance and illuminated-source size) and in part due to the fact that some uncertainty components were not fully investigated. Had the measurements all been made at the same distance, the comparison may not have shown up this sensitivity to the size of the source, and source uniformity. The experience of this comparison provides an opportunity for all participants to improve their thinking of uncertainty analysis and shows the value of a systematic review of all effects during the development of an uncertainty budget.
Space Agencies continue to evolve the OCR constellation. For the first time, a fleet of European Copernicus Earth Observation satellites is now sustained in an operational manner. In the next few years two new Sentinel-2 and two new Sentinel-3 satellites will be launched and commissioned. As Copernicus evolves, the tools, methodology and collaboration developed by FRM4SOC will be applied and further refined to ensure that the best possible OCR measurements are available from space to the user community.

Author Contributions

Conceptualisation, A.B. (Agnieszka Białek), T.G., E.W., N.F.; methodology, A.B. (Agnieszka Białek), T.G., E.W., N.F.; validation, A.B. (Agnieszka Białek); data curation, J.F.S.B., T.S., J.K., I.A., V.V. (Viktor Vabson), I.C.L., C.M., S.M., M.O., W.S., S.T., R.V.D., A.B. (Andrew Barnard), V.V. (Vincenzo Vellucci); writing—original draft preparation, A.B. (Agnieszka Białek); T.G.; A.C.B; writing—review and editing, all; visualisation, A.B. (Agnieszka Białek), S.T.; project administration, R.V., A.C.B., C.D. and T.C. All authors have read and agreed to the published version of the manuscript.

Funding

This work was funded by European Space Agency project Fiducial Reference Measurements for Satellite Ocean Colour (FRM4SOC), contract no. 4000117454/16/I-Sbo.

Acknowledgments

Authors would like to thank Giuseppe Zibordi from JRC for provision of two transfer radiometers used in this comparison and acknowledge his contribution as a radiance comparison participant and data provider. We would like to thank the reviewers for their comments that helped to improve the readability of this paper.

Conflicts of Interest

The authors declare no conflict of interest.

References

  1. Mittaz, J.; Merchant, C.J.; Woolliams, E.R. Applying principles of metrology to historical Earth observations from satellites. Metrologia 2019, 56, 032002. [Google Scholar] [CrossRef]
  2. JCGM100:2008. Evaluation of Measurement Data—Guide to the Expression of Uncertainty in Measurement; Guidance Document; BIPM. Available online: https://www.bipm.org/utils/common/documents/jcgm/JCGM_100_2008_E.pdf (accessed on 1 March 2019).
  3. JCGM200:2012. International Vocabulary of Metrology—Basic and General Concepts and Associated Terms (VIM); Guidance Document; BIPM. Available online: https://www.bipm.org/utils/common/documents/jcgm/JCGM_200_2012.pdf (accessed on 1 March 2019).
  4. CIPM. Mutual Recognition of National Measurement Standards and of Calibration and Measurement Certificates Issued by National Metrology Institutes; Guidance Document, BIPM. Available online: https://www.bipm.org/utils/en/pdf/CIPM-MRA-2003.pdf (accessed on 15 October 2019).
  5. Quality Assurance Framework for Earth Observation. Available online: www.qa4eo.org (accessed on 10 November 2019).
  6. Donlon, C.; Minnett, P.; Fox, N.; Wimmer, W. Strategies for the Laboratory and Field Deployment of Ship-Borne Fiducial Reference Thermal Infrared Radiometers in Support of Satellite-Derived Sea Surface Temperature Climate Data Records. Exp. Methods Phys. Sci. 2015, 47, 697. [Google Scholar]
  7. Fiducial Reference Measurements. Available online: https://earth.esa.int/web/sppa/activities/frm (accessed on 15 November 2019).
  8. Donlon, C.; Berruti, B.; Buongiorno, A.; Ferreira, M.H.; Féménias, P.; Frerick, J.; Goryl, P.; Klein, U.; Laur, H.; Mavrocordatos, C.; et al. The Global Monitoring for Environment and Security (GMES) Sentinel-3 mission. Remote Sens. Environ. 2012, 120, 37–57. [Google Scholar] [CrossRef]
  9. Drusch, M.; Bello, U.D.; Carlier, S.; Colin, O.; Fernandez, V.; Gascon, F.; Hoersch, B.; Isola, C.; Laberinti, P.; Martimort, P.; et al. Sentinel-2: ESA’s Optical High-Resolution Mission for GMES Operational Services. Remote Sens. Environ. 2012, 120, 25–36. [Google Scholar] [CrossRef]
  10. Hooker, S.B.; Esaias, W.E.; Feldman, G.C.; Gregg, W.W.; Mc Clain, C.R. An Overview of SeaWiFS and Ocean Colour in SeaWiFS Technical Report Series; NASA Tech. Memo 104566; NASA Goddard Space Flight Centre: Greenbelt, MD, USA, 1992.
  11. Hooker, S.B.; McLean, S.; Sherman, J.; Small, M.; Lazin, G.; Zibordi, G.; Brown, J. The Seventh SeaWiFS Intercalibration Round-Robin Experiment (SIRREX-7); NASA Tech. Memo 2002-206892; NASA Goddard Space Flight Center: Greenbelt, MD, USA, 2002; Volume 17.
  12. McClain, C.R. SIMBIOS Background; NASA Tech. Memo TM-1999-208645,1–2; NASA Goddard Space Flight Center: Greenbelt, MD, USA, 1998.
  13. Meister, G.; Abel, P.; Barnes, R.; Cooper, J.; Davis, C.; Godin, M.; Goebel, D.; Fargion, G.; Frouin, R.; Korwan, D.; et al. The First SIMBIOS Radiometric Intercomparison (SIMRIC-1), April–September 2001; Technical Report NASA/ TM-2002-210006; NASA Goddard Space Flight Center: Greenbelt, MD, USA, 2002.
  14. Meister, G.; Abel, P.; Carder, K.; Chapin, A.; Clark, D.; Cooper, J.; Davis, C.; English, D.; Fargion, G.; Feinholz, M.; et al. The Second SIMBIOS Radiometric Intercomparison (SIMRIC-1), March–November 2002; Technical Report NASA/TM-2002-210006; NASA Goddard Space Flight Center: Greenbelt, MD, USA, 2003; Volume 2.
  15. Rast, M.; Bezy, J.L.; Bruzzi, S. The ESA Medium Resolution Imaging Spectrometer MERIS a review of the instrument and its mission. Int. J. Remote Sens. 1999, 20, 1681–1702. [Google Scholar] [CrossRef]
  16. Zibordi, G.; Ruddick, K.; Ansko, I.; Moore, G.; Kratzer, S.; Icely, J.; Reinart, A. In situ determination of the remote sensing reflectance: An inter-comparison. Ocean Sci. 2012, 8, 567–586. [Google Scholar] [CrossRef] [Green Version]
  17. Woolliams, E.R.; Fox, N.P.; Cox, M.G.; Harris, P.M.; Harrison, N.J. The CCPR K1—A key comparison of spectral irradiance from 250 nm to 2500 nm: Measurements, analysis and results. Metrologia 2006, 43, S98–S104. [Google Scholar] [CrossRef]
  18. Yoon, H.W.; Allen, D.W.; Eppeldauer, G.P.; Tsai, B.K. The extension of the NIST BRDF scale from 1100 nm to 2500 nm. Proc. SPIE 2009, 7452, 745204–745204–12. [Google Scholar] [CrossRef]
  19. Cetinić, I.; McClain, C.; Werdell, P. PACE Technical Report Series, Volume 6: Data Product Requirements and Error Budgets; NASA Tech. Memo; NASA Goddard Space Flight Space Center: Greenbelt, MD, USA, 2018.
  20. Solorio-Leyva, J.C.; Suarez-Romero, J.G.; Hurtado-Ramos, J.B.; Rodriguez, E.T.; Cortes-Reynoso, J.G.R. The size-of-source effect in practical measurements of radiance. Proc. SPIE 2004, 5622, 1243–1248. [Google Scholar] [CrossRef]
  21. Yoon, H.W.; Proctor, J.E.; Gibson, C.E. FASCAL 2: A new NIST facility for the calibration of the spectral irradiance of sources. Metrologia 2003, 40, S30–S34. [Google Scholar] [CrossRef] [Green Version]
  22. Manninen, P.; Hovila, J.; Seppälä, L.; Kärhä, P.; Ylianttila, L.; Ikonen, E. Determination of distance offsets of diffusers for accurate radiometric measurements. Metrologia 2006, 43, S120–S124. [Google Scholar] [CrossRef] [Green Version]
Figure 1. Radiance mode diagram of setup (top), OC filter radiometer (bottom).
Remotesensing 12 02220 g001
Figure 2. General specifications of the Satlantic ocean colour radiometers (OCR-200).
Remotesensing 12 02220 g002
Figure 3. Measurement results to confirm the field of view (FOV) of the transfer radiometers being used in the FRM4SOC radiance round robin. The numbers in plot legend refer to the radiometer serial number and the spectral band (in nm) measured.
Remotesensing 12 02220 g003
Figure 4. The results of the lamp irradiance comparison. Coloured lines represent the results of each lamp compared to the mean of all lamps. The dotted line compares the mean of all lamps to National Physical Laboratory’s (NPL) SI-traceable scale.
Remotesensing 12 02220 g004
Figure 5. Results of the radiance comparison for radiometer 051. Radiance calibration coefficient compared to mean calibration coefficient for each participant/set-up at each wavelength.
Remotesensing 12 02220 g005
Figure 6. Results of the radiance comparison for radiometer 110. Radiance calibration coefficient compared to mean calibration coefficient for each participant/set-up at each wavelength.
Remotesensing 12 02220 g006
Figure 7. Difference in the radiance measurement due to the distance setting and the size of the source. (a) Photographs of illumination patch sizes.The photograph on the left presents cases A and D, the middle one cases B and E, and the right hand side case C. (b) Plot with percentage difference between measurements for different patch size and lamp-panel distance setting.
Remotesensing 12 02220 g007
Figure 8. Measurement results to confirm the FOV of the transfer radiometers being used in the FRM4SOC radiance round robin presented on logarithmic scale. The vertical bars indicate ±3 ° . The numbers in the plot legend refer to the radiometer serial number and the spectral band (in nm) measured.
Remotesensing 12 02220 g008
Figure 9. Difference in the radiance calibration coefficient obtained by averaging results from different participants for each lamp-panel distance.
Remotesensing 12 02220 g009
Table 1. Laboratories that participated in the measurements (Alphabetic Order).
Organisation
CSIROCommonwealth Scientific and Industrial Research Organisation, Australia
DLR-IMFRemote Sensing Technology Institute, Deutsches Zentrum für Luft und Raumfahrt, Germany
JRCEuropean Commission—DG Joint Research Centre
LOV-IMEVLaboratoire d’Océanographie de Villefranche, France
NERC-FSFNatural Environment Research Council’s Field Spectroscopy Facility, UK
NIVANorsk Institutt for Vannforskning, Norway
NOAANational Oceanic and Atmospheric Administration, USA
NPLNational Physical Laboratory, UK
TOTartu Observatory, Estonia
SatlanticSatlantic Sea Bird Scientific, Canada
Table 2. Detailed information about each participant (A through M) lamp-panel distance setting and type and size of the reflectance standard.
Participant/Lamp-Panel Distance Reflectance Standard
Calibration Set-Upin mmTypeReflectance in %Size in Inches
A500Spectralon9910 × 10
B750Spectralon9910 × 10
C1000Spectralon9918 × 18
D500Spectralon9918 × 18
E1000Spectralon9918 × 18
F500Spectralon9910 × 10
G1300Spectralon9918 × 18
H500Zenith Lite95200 mm × 200 mm
I500Spectralon9910 × 10
J1000Spectralon9910 × 10
K500Spectralon9912 × 12
L500Spectralon9910 × 10
M500Gigahertz-Optik9812 × 12
Table 3. Example of an FEL comparison uncertainty values.
Wavelength (nm)Example of a Lamp Ratio
Uncertainty ( k = 1 )
3501.6%
3601.7%
3701.7%
3801.7%
3901.5%
4001.5%
4501.1%
5001.1%
6001.0%
7001.0%
8001.0%
9000.9%
Table 4. Examples of participants’ radiance calibration relative uncertainty, k = 2 .
Band (nm)ParticipantParticipantParticipant
with Low uwith Middle uwith High u Value
4122.0%2.4%3.1%
4431.8%2.4%2.9%
4911.8%2.2%2.7%
5101.8%2.3%2.7%
5561.8%2.2%2.5%
6671.8%2.1%2.5%
6841.8%2.1%2.5%

