Sentinel-1 Change Detection Analysis for Cyclone Damage Assessment in Urban Environments


1
Department of Applied Mathematics and Computer Science, Technical University of Denmark, 2800 Kongens Lyngby, Denmark
2
The World Bank, Washington, DC 20433, USA
3
Department of Economics, Development Economics Research Group, University of Copenhagen, DK-1353 Copenhagen, Denmark
*
Author to whom correspondence should be addressed.
Remote Sens. 2020, 12(15), 2409; https://0-doi-org.brum.beds.ac.uk/10.3390/rs12152409
Submission received: 31 May 2020
/
Revised: 10 July 2020
/
Accepted: 20 July 2020
/
Published: 27 July 2020
(This article belongs to the Special Issue Feature Paper Special Issue: Large Spatial Scale Analysis and Intensive Data Use in Urban Social, Ecological, Economic, or Environmental System)
Abstract
:For disaster emergency response, timely information is critical and satellite data is a potential source for such information. High-resolution optical satellite images are often the most informative, but these are only available on cloud-free days. For some extreme weather disasters, like cyclones, access to cloud-free images is unlikely for days both before and after the main impact. In this situation, Synthetic Aperture Radar (SAR) data is a unique first source of information, as it works irrespective of weather and sunlight conditions. This paper shows, in the context of the cyclone Idai that hit Mozambique in March 2019, that Change Detection between pairs of SAR data is a perfect match with weather data, and therefore captures impact from the severe cyclone. For emergency operations, the filtering of Change Detections by external data on the location of houses prior to an event allows assessment of the impact on houses as opposed to impact on the surrounding natural environment. The free availability of SAR data from Sentinel-1, with further automated processing of it, means that this analysis is a cost-effective and quick potential first indication of cyclone destruction.
1. Introduction
Monitoring and assessing impact from natural disasters continues to be a difficult task. The lack of timely information is especially problematic vis-a-vis quick and efficient emergency responses, mitigating the human losses and other costs. Despite progress on automated identification of disaster damages based on optical images, the emergency response for the cyclone Idai in Beira was guided by trained operators that manually tagged optical images, similar to the method presented in Reference [1]. There are at least three alternative remote sensing methods to use combined with automatic processing—(i) images from unmanned aerial vehicles (UAVs), (ii) optical satellite images, and (iii) Synthetic Aperture Radar (SAR), each with different advantages and disadvantages. The technology for each method is evolving quickly and, therefore, as well their relative advantages and disadvantages. The main advantage of SAR data, compared to optical images and UAVs, is that it is available irrespective of any weather condition and acquisitions are possible day and night. Optical images from satellites are only available during daytime and for days without cloud cover. Similarly, UAVs can be challenged by bad weather such as strong winds and rain. Finally, most applications of disaster response based on optical satellite images rely on substantial human processes, involving trained operators, that can be time consuming and costly. Further, UAVs require presence of both trained personnel as well as specialized equipment. SAR data on the other hand is freely available and does not rely on weather or local human and physical resources.
According to, Pinglan Ge et al. [2], SAR analysis for damage assessment can be classified into four overall groups—(1) Intensity-based Change Detection,(2) Coherence-based Change Detection, (3) Polarimetry-based Analysis, and (4) Integrated approaches. This paper utilizes a method under the Intensity-based Change Detection, similar to the approach in Reference [3]. According to Reference [2], Intensity-based approaches include using metrics such as difference, correlation, texture features, and other statistical measures. The Change Detection technique applied in this work is specifically well-suited for man-made targets, such as houses.
“The method is specifically well suited for situations where man-made targets appear or disappear against a natural background, an important application of Change Detection in satellite data”[3]
There is an expanding literature on the use of SAR for rapid damage assessment in urban areas, in part driven by the increasing availability of SAR data of higher resolution and development of various methods where raw data is turned into meaningful analysis [2,4,5]. Flooding is commonly detected by SAR [6], even in urban areas ([7]), while most urban damage assessment focuses on earthquakes [2,8,9,10]. Urban growth, as well as civil war, major fires and hurricanes are also assessed by SAR data [11].
In this paper, the Change Detection method developed by Nielsen, Conradsen and Skriver [12] is used for damage assessment after a cyclone. The method, along with the further development [13], has been applied to various other challenges such as flood and wetlands monitoring, deforestation, arrivals and departures of large sea vessels as well as aircraft, and arms control [3].
This paper adds to the literature by applying a method proven successful in other settings, to a disaster situation. Further, a cyclone leads to changes in both houses and the natural environment, while only the former can be linked to a socio-economic impact [14]. To focus the analysis, a novel method of filtering the Change Detections with auxiliary data on the presence of houses. Similar filtering for important infrastructure, such as schools, hospitals, roads and bridges would also provide critical information in a disaster situation. Here, statistical analysis is performed by aligning assessed damages on a grid from which the worst hit areas can be highlighted. The Loewner measure for the direction of Change Detection is also explored allowing for an interpretation of the intensity changes.
The analysis is based on the tropical Cyclone Idai that formed off the east coast of Mozambique on 4 March 2019, and made landfall on 14 March, close to the city of Beira. The city was therefore heavily hit by the cyclone with both strong winds and heavy rains, resulting in severe damage. As is often the case, optical satellites’ view of the city was covered by clouds for days before as well as days after the landfall, making it difficult to assess the damage severity. The last cloud-free image was on 2 March, while the first cloud-free images of the city after the cyclone were available on 26 March, almost two weeks after the main damages to the city. A full assessment of the city based on optical satellite images was not available until 4 April, three weeks after the cyclone hit Beira. Data from Sentinel-1 was available 12 h after first impact. Data for new assessments could have been done every 6 days after that, providing four assessments over time before the the full analysis from optical images was available. Sentinel-1 data has also proved its use for weather-related parameters in relation to cyclones [15] as in the case of Idai in Beira.
2. Data
2.1. Sentinel-1
The input data for the Change Detection analysis is from the European Space Agency’s Sentinel-1 SAR satellite. As this sensor is operated under the Copernicus program which images the Earth according to a regular scheme and provides data for free [16], it is an obvious choice due to easy accessibility. Generally, Sentinel-1 plans for 6 days interval between imagery of land within Europe and 12 day intervals outside Europe [16]. However, 6 day intervals are also occasionally available outside Europe as in this case of the cyclone Idai.
Sentinel-1 is a C-band (5.405 GHz) SAR sensor technology with dual polarimetric capabilities. The dual polarimetric capabilities of the sensor means that richer information is obtained per pixel than with single polarisation. Sentinel-1 operates over land by emitting vertical polarised signal and recording the horizontal and vertical components of the reflected signal. The two components of a dual-polarised signal will give some information on the observed geometry although not nearly as descriptive as data from a fully polarimetric system where the sensor alternates between emitting vertical and horizontal polarised signals and recording reflections in both polarisations.
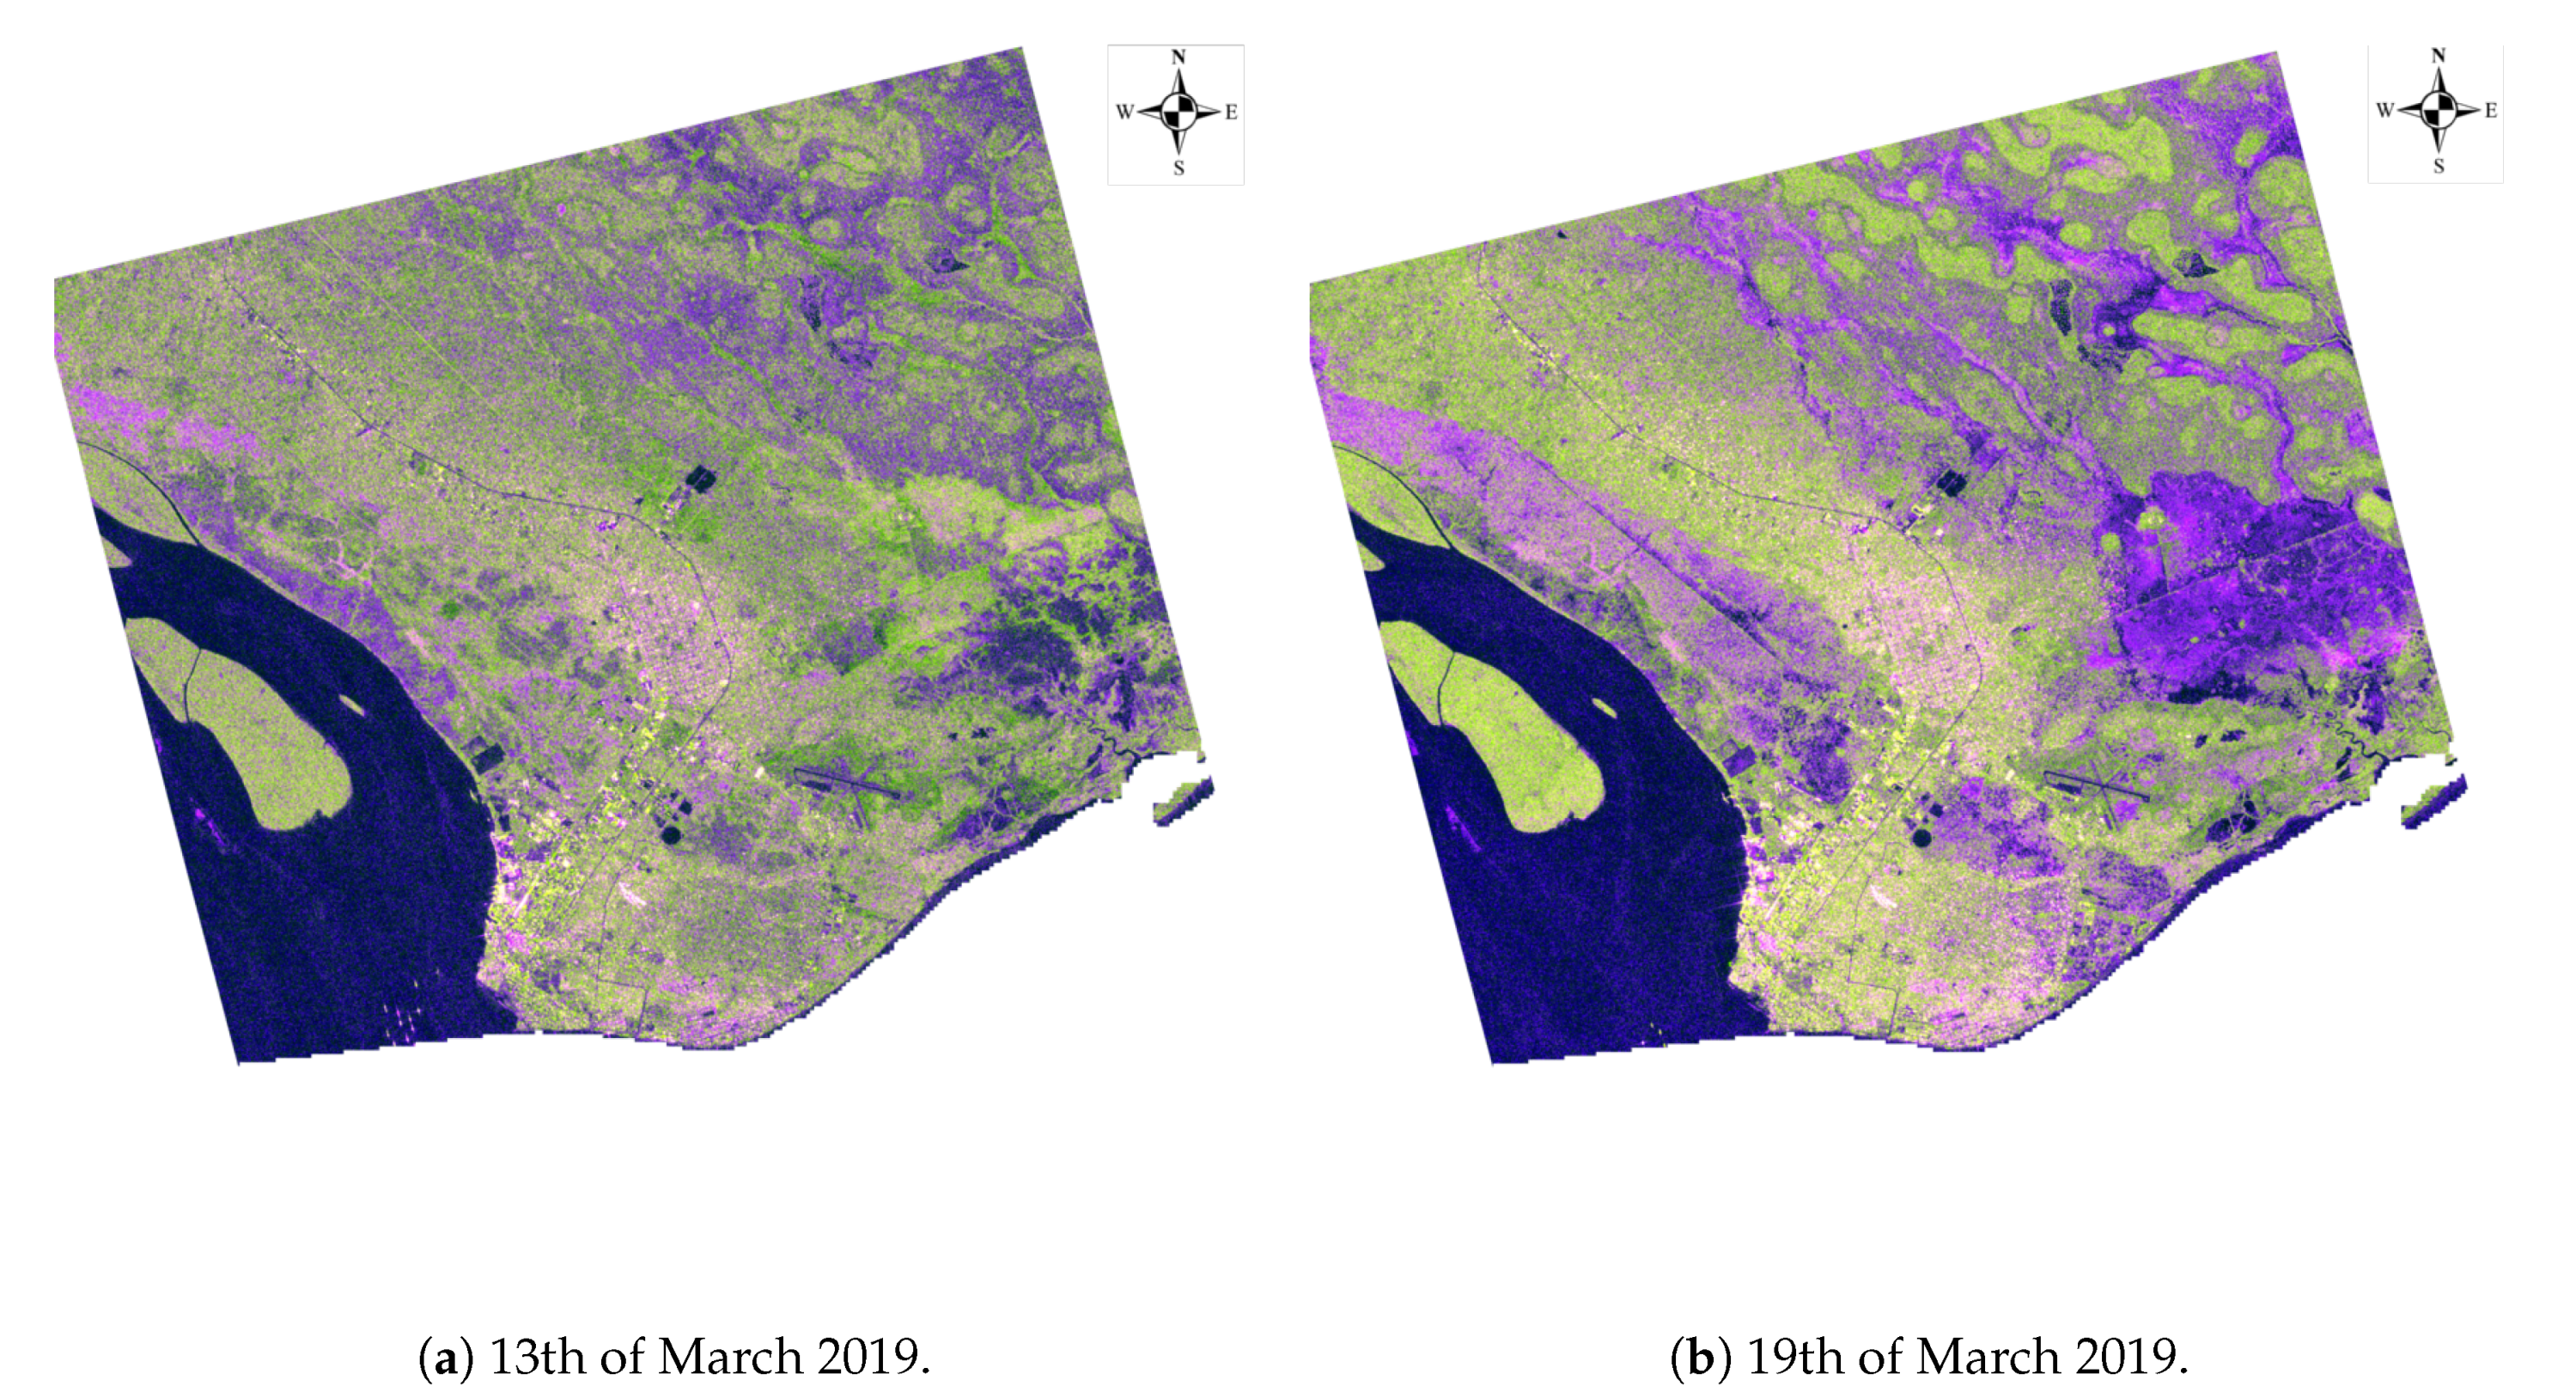
The resolution of Sentinel-1’s Ground Range Detection (GRD) products is 20 m × 22 m (range × azimuth), operated in its default Interferometric Wide swath (IW) mode over land, which has an Equivalent Number of Looks (ENL) equals 4.4 [17]. Figure 1 shows an RGB color composite of the SAR data used in this paper. The channels have been encoded by, R: , G: and B: , for two time points. The color shift towards purple colors in the upper right are lowlands that have been flooded. The changes in the city Beira, our area of interest, mainly located on the southern tip, are more subtle changes and need the temporal information extracted when doing Change Detection in order to highlight the cyclone impact.
The region of interest is defined as a rectangular area of interest (AOI) around the city of Beira, Mozambique, (coordinates given in Appendix A). With these search specifications 19 Sentinel-1 scenes, covering the AOI, are obtained within three relative orbits. All data points were downloaded over the period of 1 February 2019 to 30 April 2019. All orbits, as well as documentation on the processing steps, are found in Appendix B.
2.2. Manually Tagged Damage
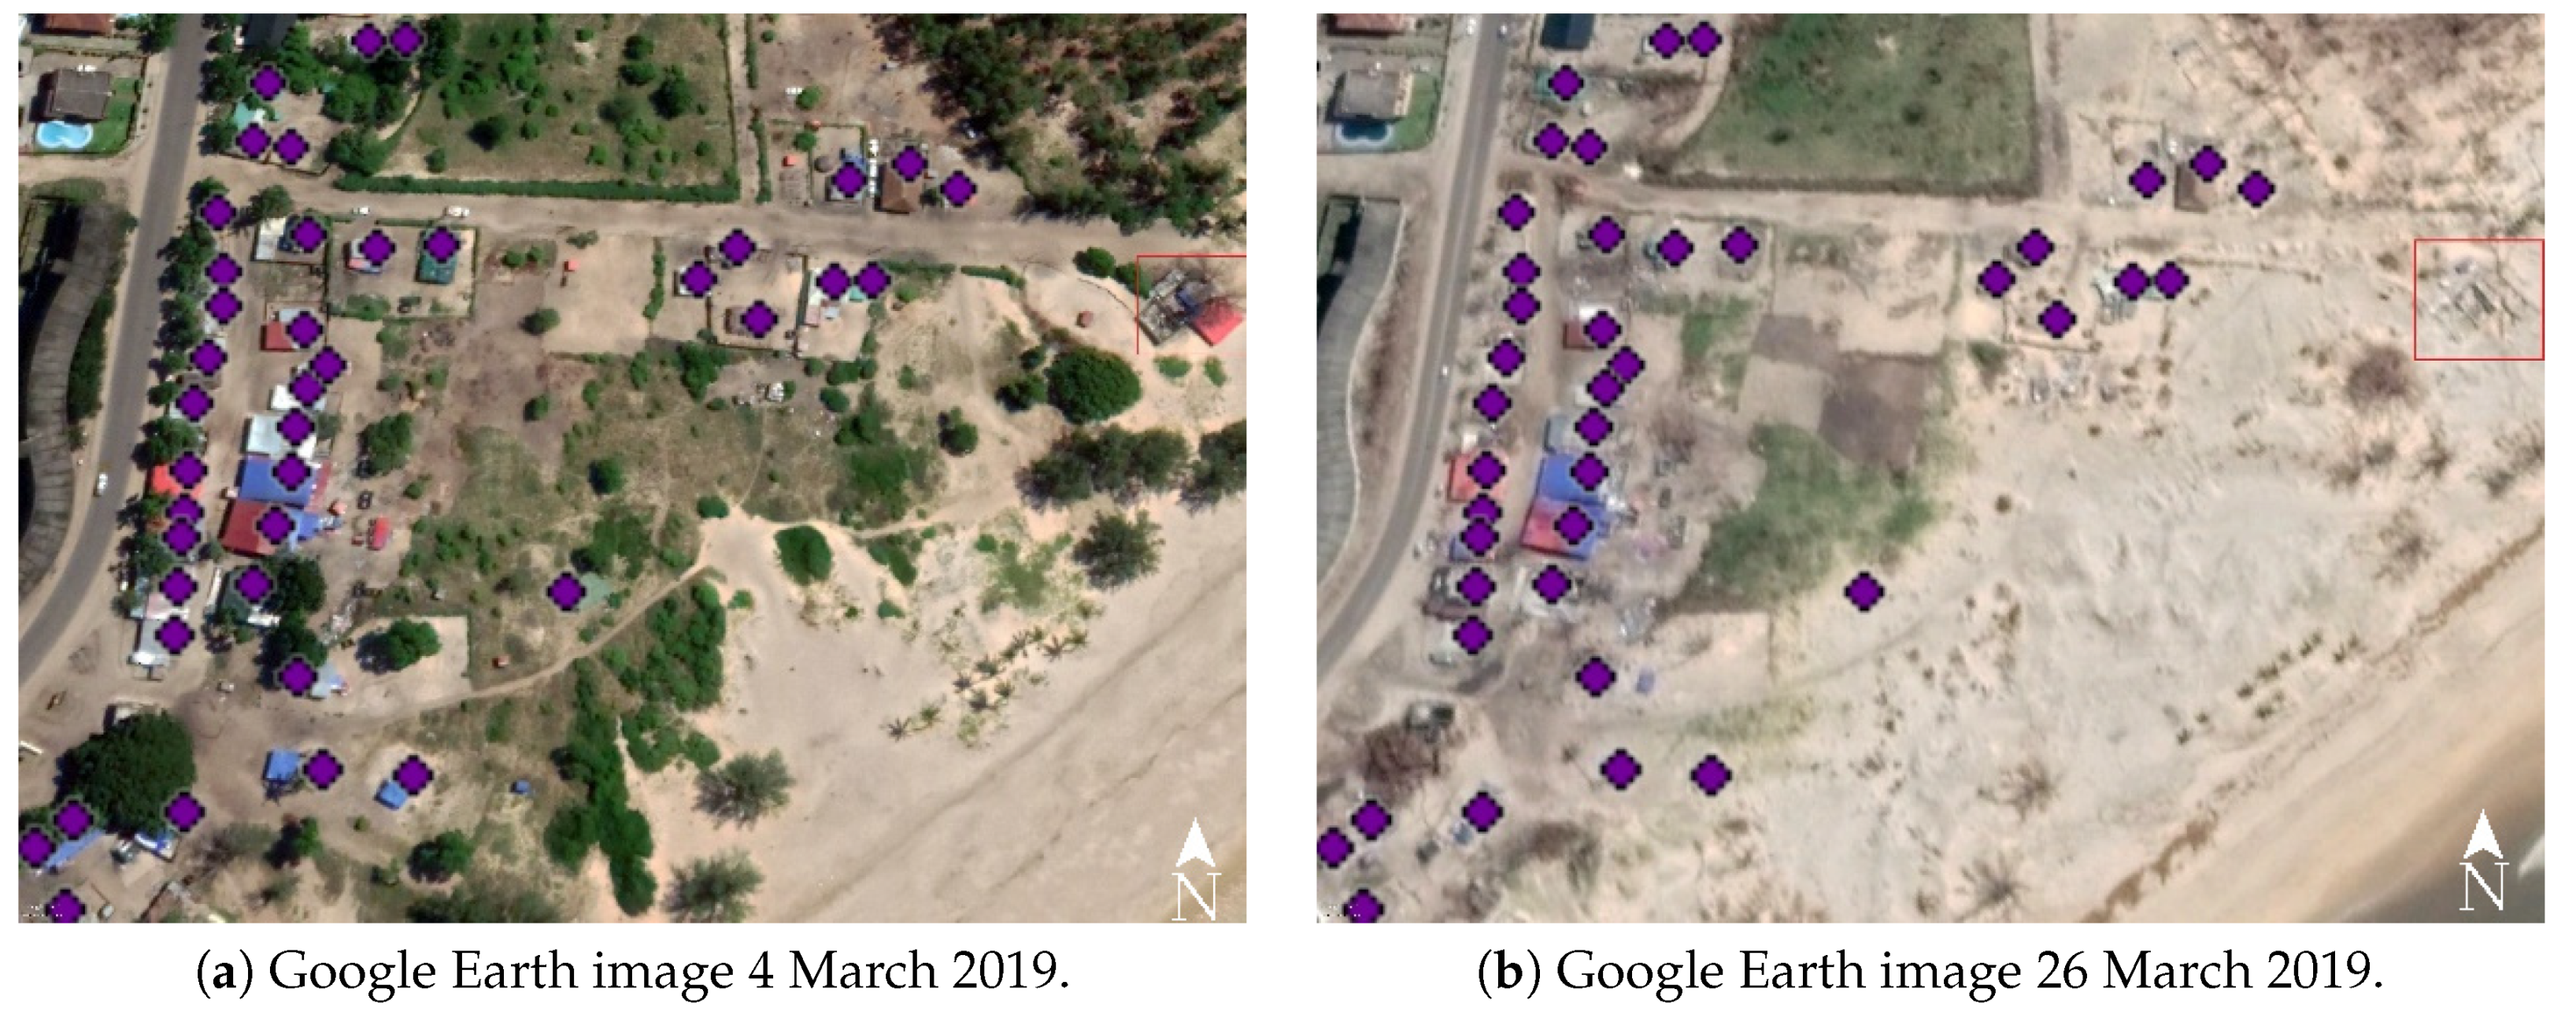
The response to Idai in Beira was guided by manually tagged damage on houses. Houses were tagged by a partnership between UNOSAT, an operational unit under UNITAR, and REACH, a humanitarian initiative specializing in analysis around crisis, disaster, and displacement. These damage maps consist of manually assessed structures with visual damage, comparing optical satellite images from before and after the cyclone. The image data for the manual tagging of houses with visual damage from Idai in Beira is based on before-images from March 13 from GeoEye at a 46 cm resolution and after-images from March 26 from WorldView-2 at a 46 cm resolution. The tagged damage maps became available for various sections of the Beira from March 28th to April 4th. Hence, the full damage tagging for the entire city was completed 21 days after the cyclone made landfall upon Beira. Such a full tagging of a city like Beira can take 3–7 analysts approximately ten working days to perform and cost in the order of $20,000–$30,000 in total labor costs. An example of the tagged data can be seen in Figure 2. The damage maps are generally very thoroughly tagged, with all—large as well as very small damage—being tagged. It is also a human process, and in Figure 2a demolished house is likely missed, as illustrated by the red square in the image on Figure 2b, right side. Throughout this paper, this dataset will be referred to as manual tags.
2.3. Auxiliary Data
2.3.1. Spatial Characteristics of Beira
For spatial analysis of the cyclone’s impact, a grid of square cells is used, which is referred to as Unit-of-Analysis (UA). The grid was adopted from Reference [18], and consists of 115 m × 115 m cells covering residential areas of the city. This means that non-residential areas of the city, like industry and airport are filtered out. Each cell is associated with geographical and demographic parameters, such as distance to the coast in direction of the cyclone, poverty, and construction density. The latter two data variables are extracted from a previous study on local poverty [18]. This UA grid allows for alignment of the different variables/parameters to which statistical analysis of their dependence can be applied.
2.3.2. OpenStreetMap—Buildings
Building damage, in particular, is closely related to saving lives in emergency response [14]. To focus the analysis on this critical element, results are filtered by prior knowledge of the location of houses. The building polygons from OpenStreetMap (OSM) [19] are used for this. OSM is a global open database of map information built by a community of mappers. Most urban cities across the world are covered by the OSM database. The building footprints can be extracted from an OSM file by selecting the building-feature. Other alternatives, like the Global Urban Footprint [20,21], were also explored, but visual inspection found that OSM had the best coverage and the highest accuracy. Subsequent analysis evaluates and considers potential bias from any imperfections in the OSM data.
2.3.3. World Weather Online
Weather data on the cyclone was downloaded from the World Weather Online database [22]. The weather data used is the precipitation, the wind and gust speed, all measured as daily daytime averages (between 6 AM–6 PM).
3. SAR Methodology
The methodology presented here for cyclone damage assessment is based on SAR Change Detection following the complex Wishart Change Detection statistic [12,23]. The complex Wishart test statistic has the advantage of being able to test for differences in mean values on polarimetric covariance matrices from SAR sensors with polarimetric capabilities. For cyclone urban damage assessment, it can be applied over two SAR images, one prior to the peak impact, , and one after, . In this way, the changes caused by the cyclone are the majority of the changes observed, which is shown in Section 4.
In Reference [12], the test was derived for fully polarimetric SAR systems where each pixel in the image has the nine values in the complex covariance matrix,
with the diagonal elements being real numbers, while the off diagonal are complex. is the signal measured by the radar with the k transmitting polarisation and l receiving polarisation. The is a spatial average typically applied in SAR data to reduce the inherent speckle noise in the images. For a dual polarimetric sensor such as Sentinel-1, keeping only the diagonal values, our covariance matrix will be,
with being the backscatter value of our copolarised part and the crosspolarised backscatter. The Wishart test stastistic, Q, is defined,
with n being the number of looks for the two images in a Change Detection pair with the same spatial averaging factor, preferably estimated as the equivalent number of looks (ENL). For Sentinel-1, . denotes the determinant of the covariance matrix in a pixel from the first image (pre-cyclone) and likewise is the determinant of a pixel in the second image (post-cyclone). The dimensionality p equals 2 for dual polarimetric diagonal data as Sentinel-1 GRD products are. The probability for change can be found by,
which can be thresholded according to the decided significance level. For dual-polarimetry, diagonal only cases, as here with Sentinel-1 GRD products, Q is not wishart distributed, but still given by Equation(3). In this case, the optimal values for , p and can be found according to the details in Reference [23].
The Change Detection approach above is advantageous to simpler techniques as the test statistic provides a probability for change at each pixel position, allowing for thresholding according to a certain rate of false-positive detections (significance level). Additionally, the method offers a statistical way of combining the information in all channels from a given polarimetric SAR sensor into a single variable. In the case of the Sentinel-1 (VV, VH), a dual polarimetric sensor, a simple ratio Change Detection would lead to two change metrics for each pixel. It should be noted that in the case of polarimetric information not being present, the method in Reference [12] reduces to the simpler ratio technique.
Additionally to a change probability, one might be interested in the direction of the change, as an indication of whether a decrease or increase in radar intensity was observed from an image at time 1 to the image at time 2. The Loewner measure for the direction of change was suggested in Reference [24], which is given by:
A dual polarimetric diagonal covariance matrix, , has two non-zero elements. The measure, therefore, reduces to positive semidefinite for Equation (3) if both elements are positive; similarly, negative semidefinite for both values being negative, or otherwise indefinite. Throughout the paper, positive semidefinite will be referred to as decreased reflection, negative semidefinite as increased reflection, and indefinite as ambiguous reflection.
As the appearance of objects imaged by a SAR sensor changes depending on the viewing direction of the sensor, Change Detections are only calculated based on images within the same relative orbit (RO) of the Sentinel-1. To filter off low probability changes; and to turn data into a binary variable of change or no change, one often chooses a significance value at a certain level. The results presented in the analysis utilize a significance level of 5%.
With this presented methodology we wish to investigate to what extent Sentinel-1 SAR data can be used to assess damage after a cyclone. It is clear that with a resolution of 20 m × 22 m, and with Beira generally containing many small houses, we are not able to pinpoint individual houses that are damaged to the same extent as the manual tags based on high resolution images. The aim is to get a general overview of disaster impact that can guide emergency response. This could for example be done by producing count of changes over larger blocks, such as the UA grid cells presented in the previous section. In the following section, results from such an approach is presented along with a validation study.
4. Results
4.1. Weather and Change Detection
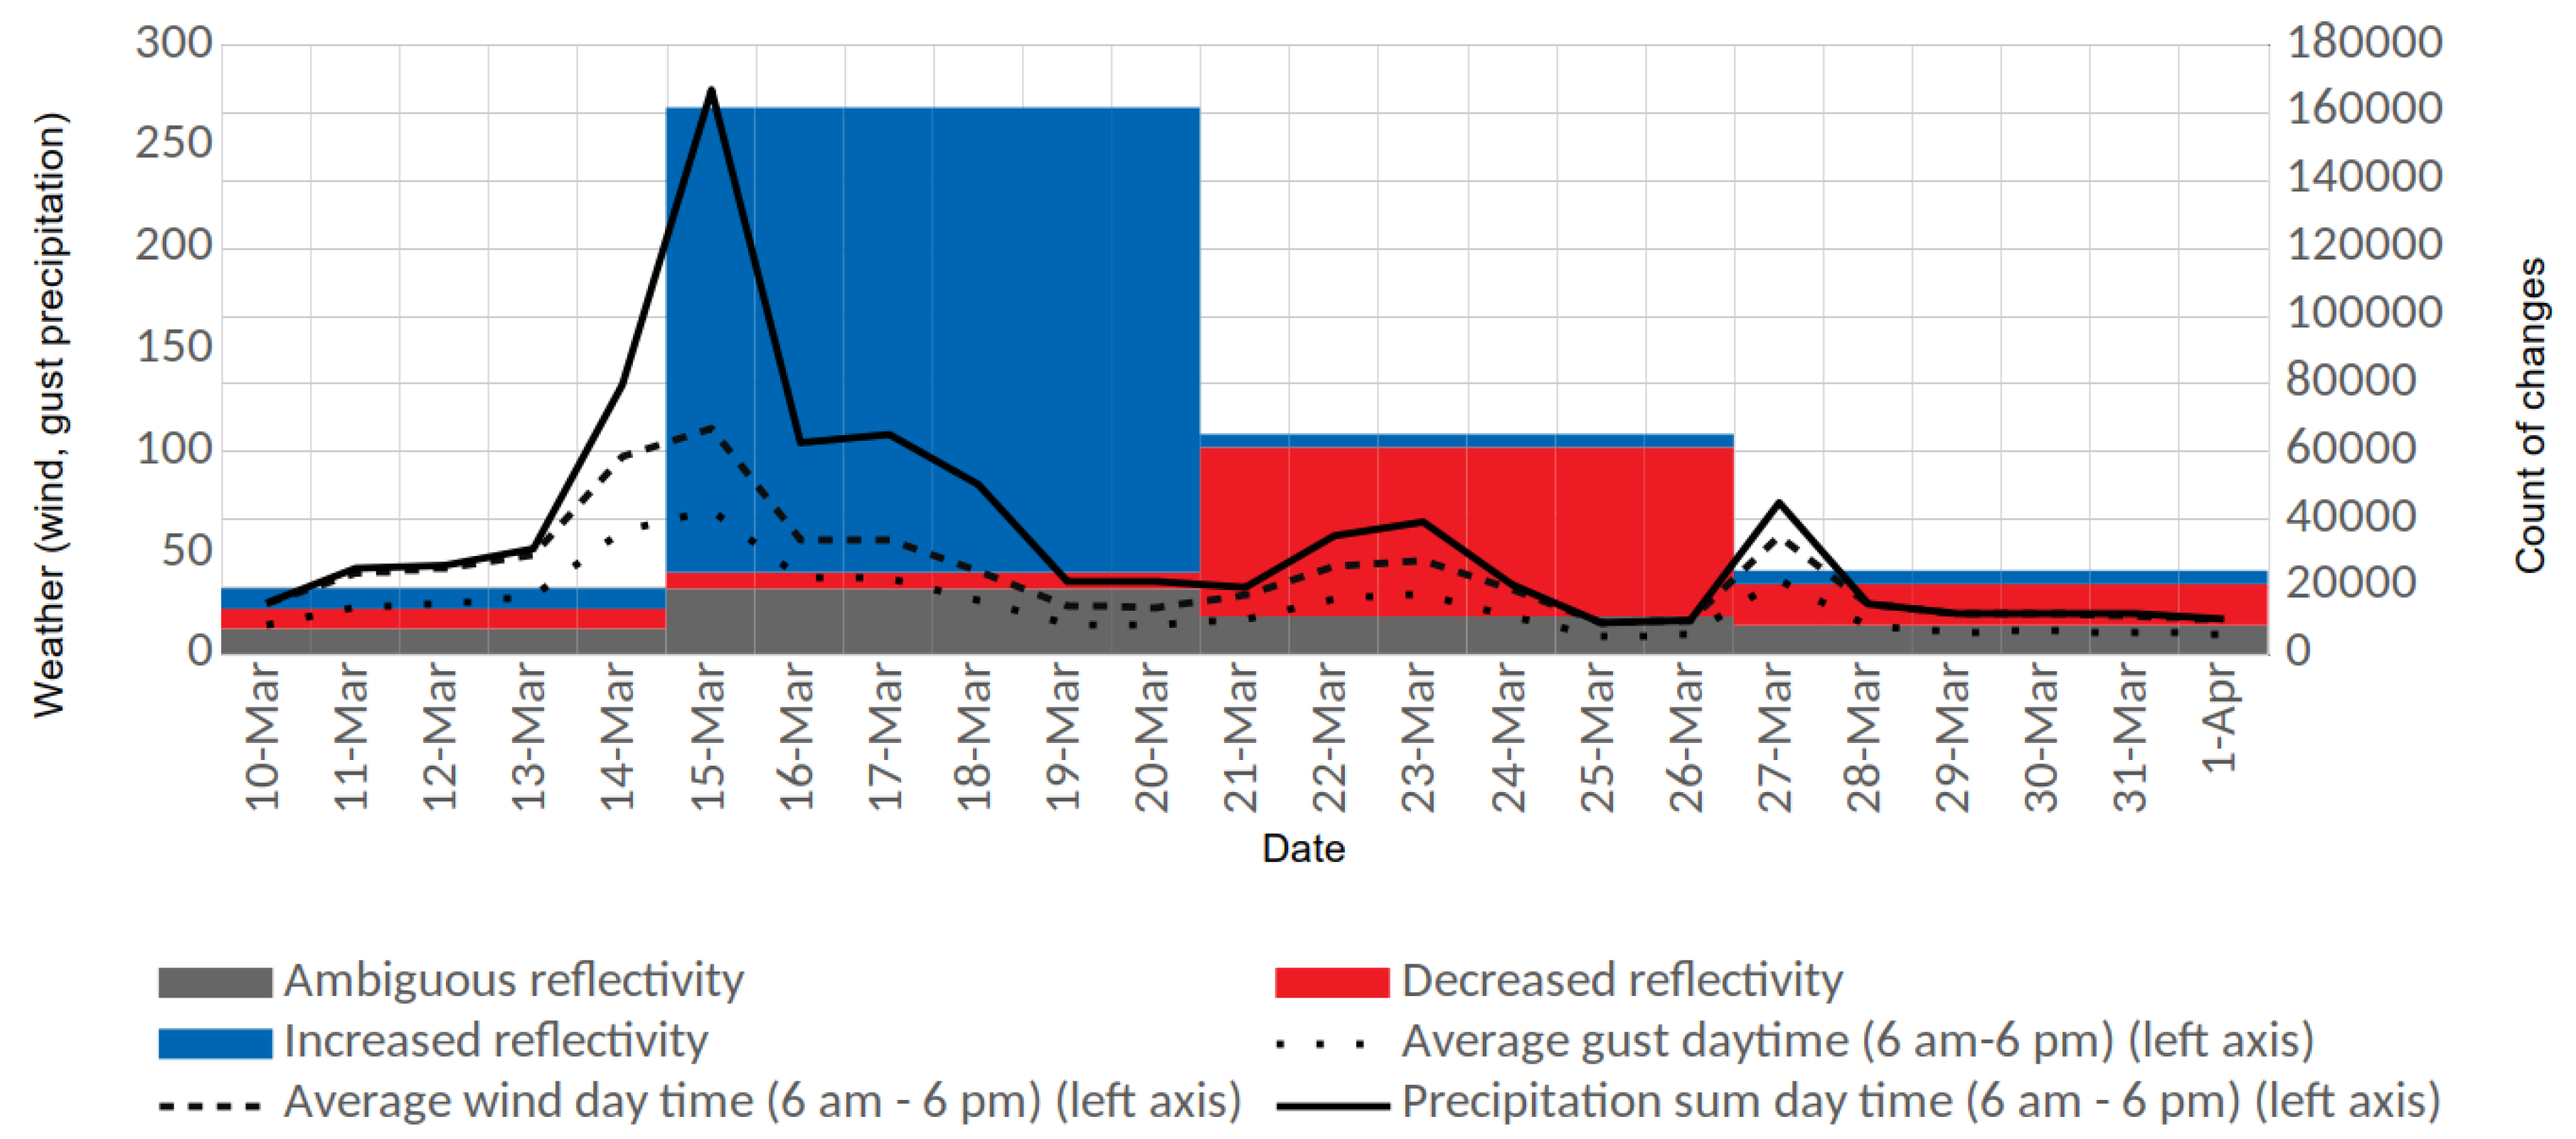
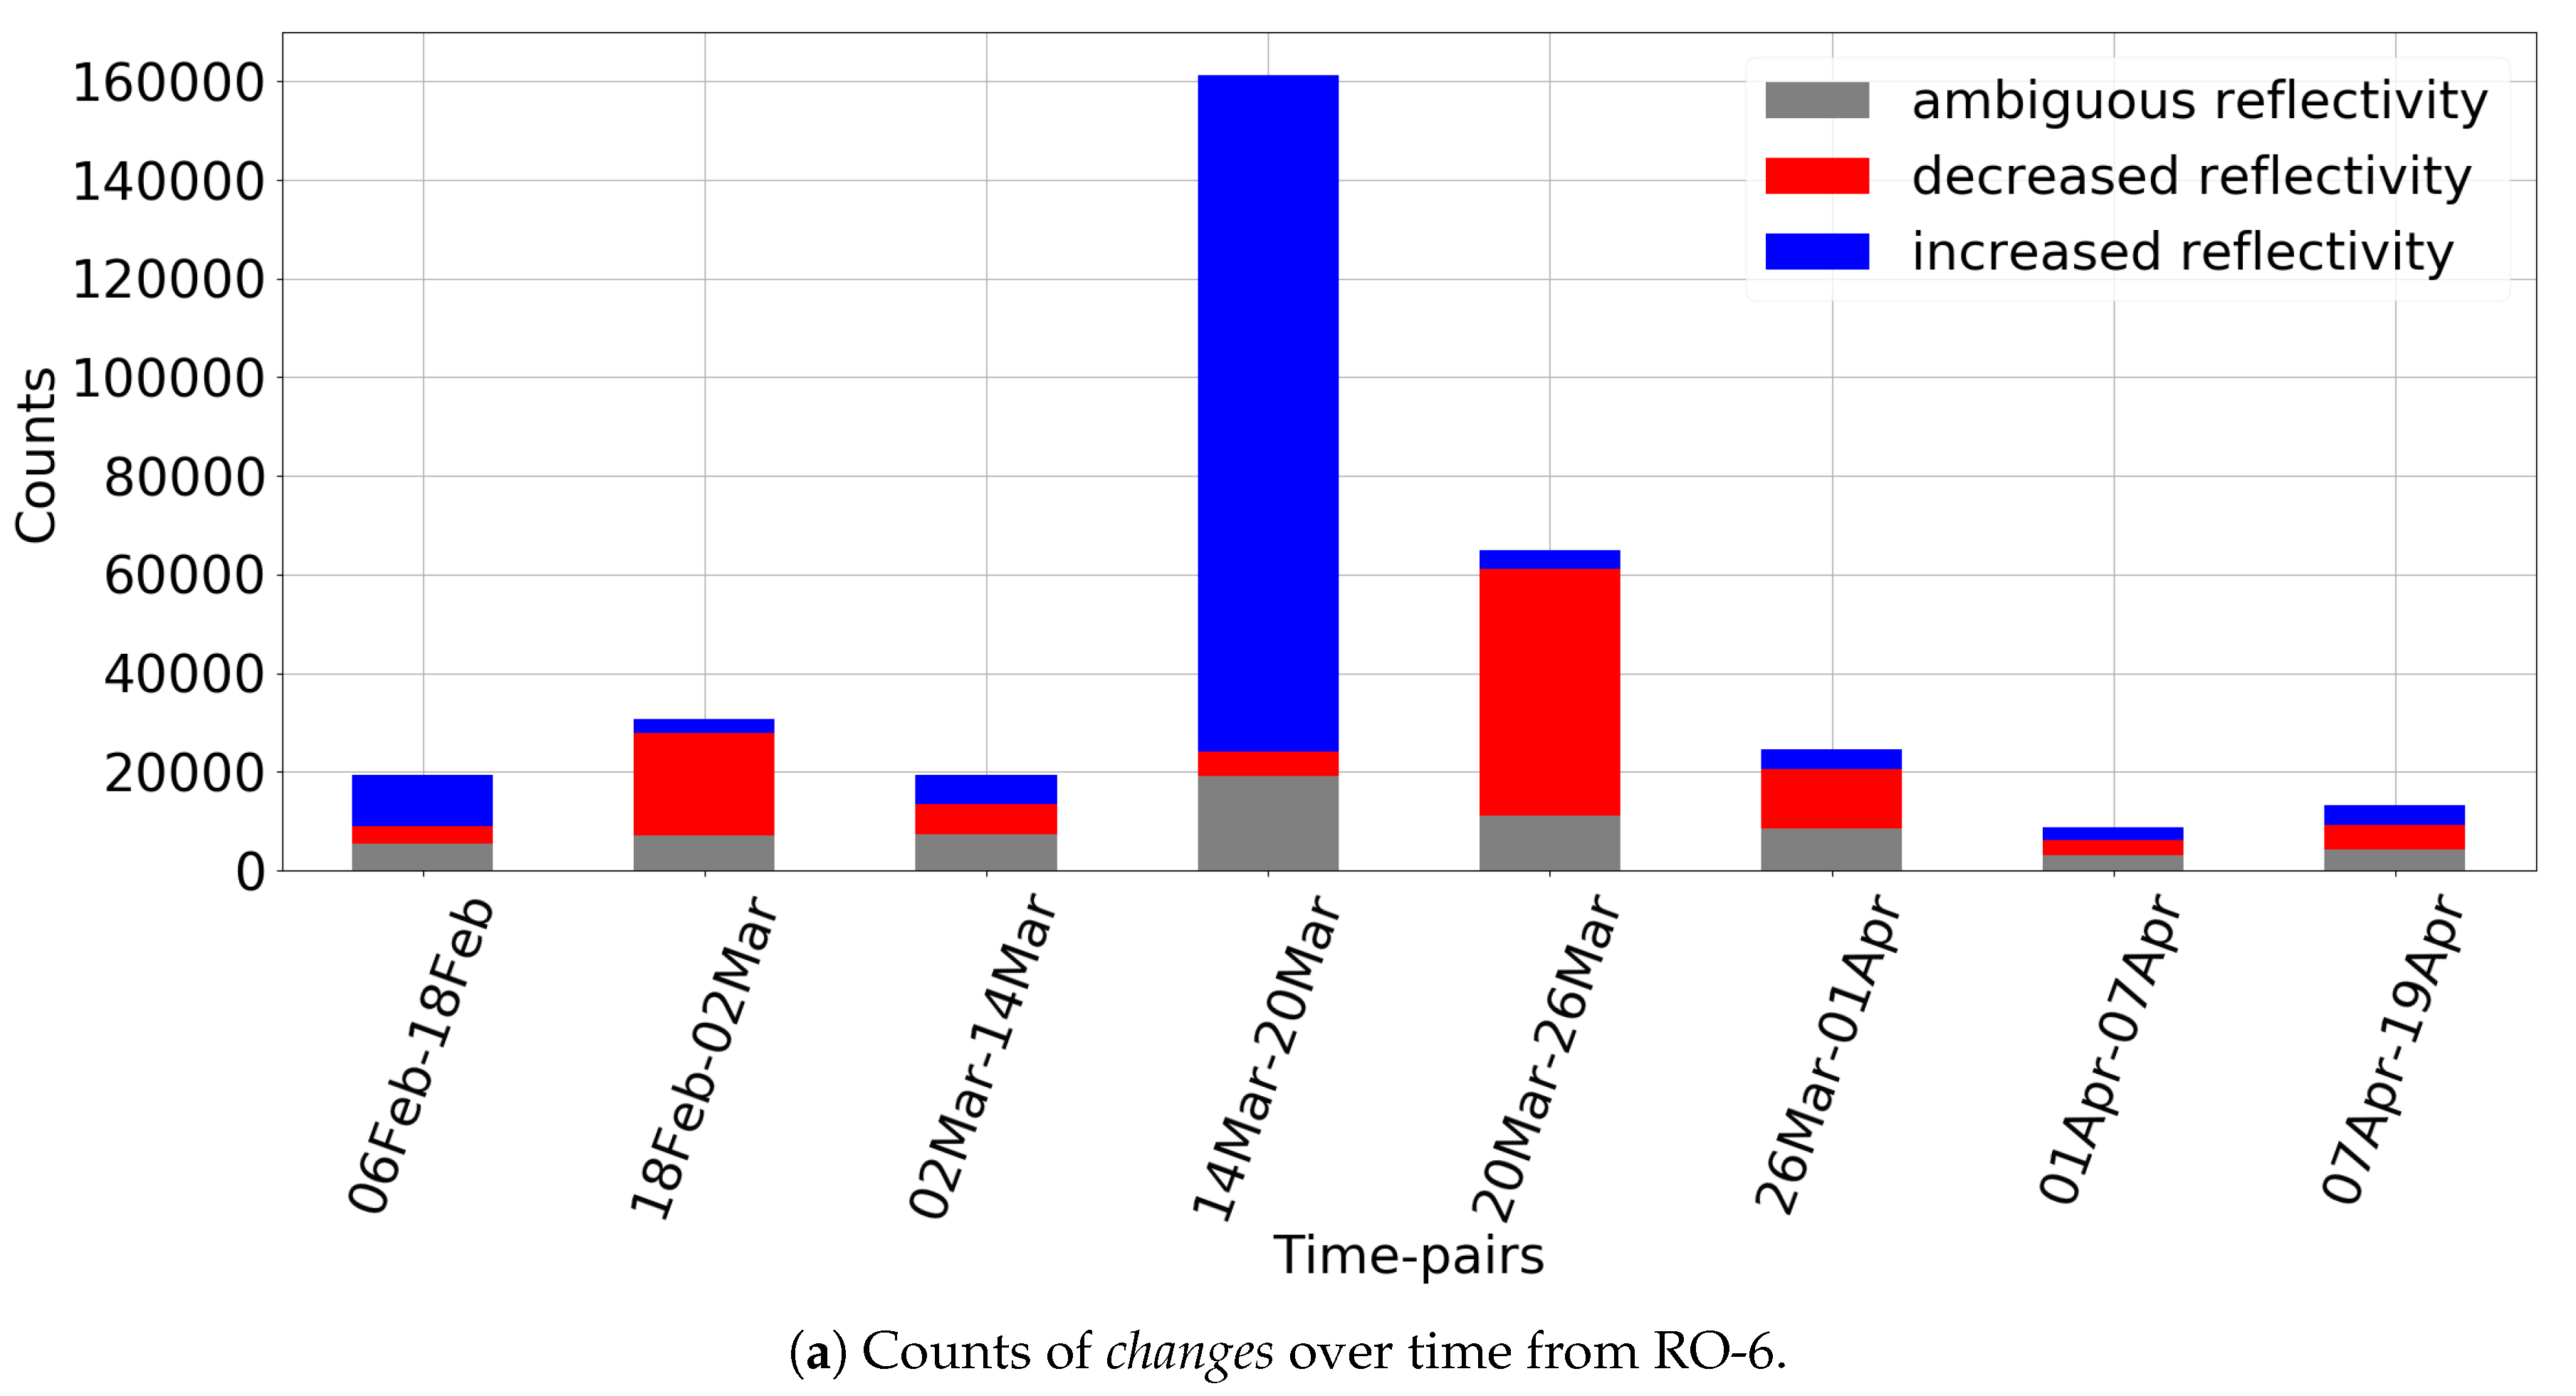
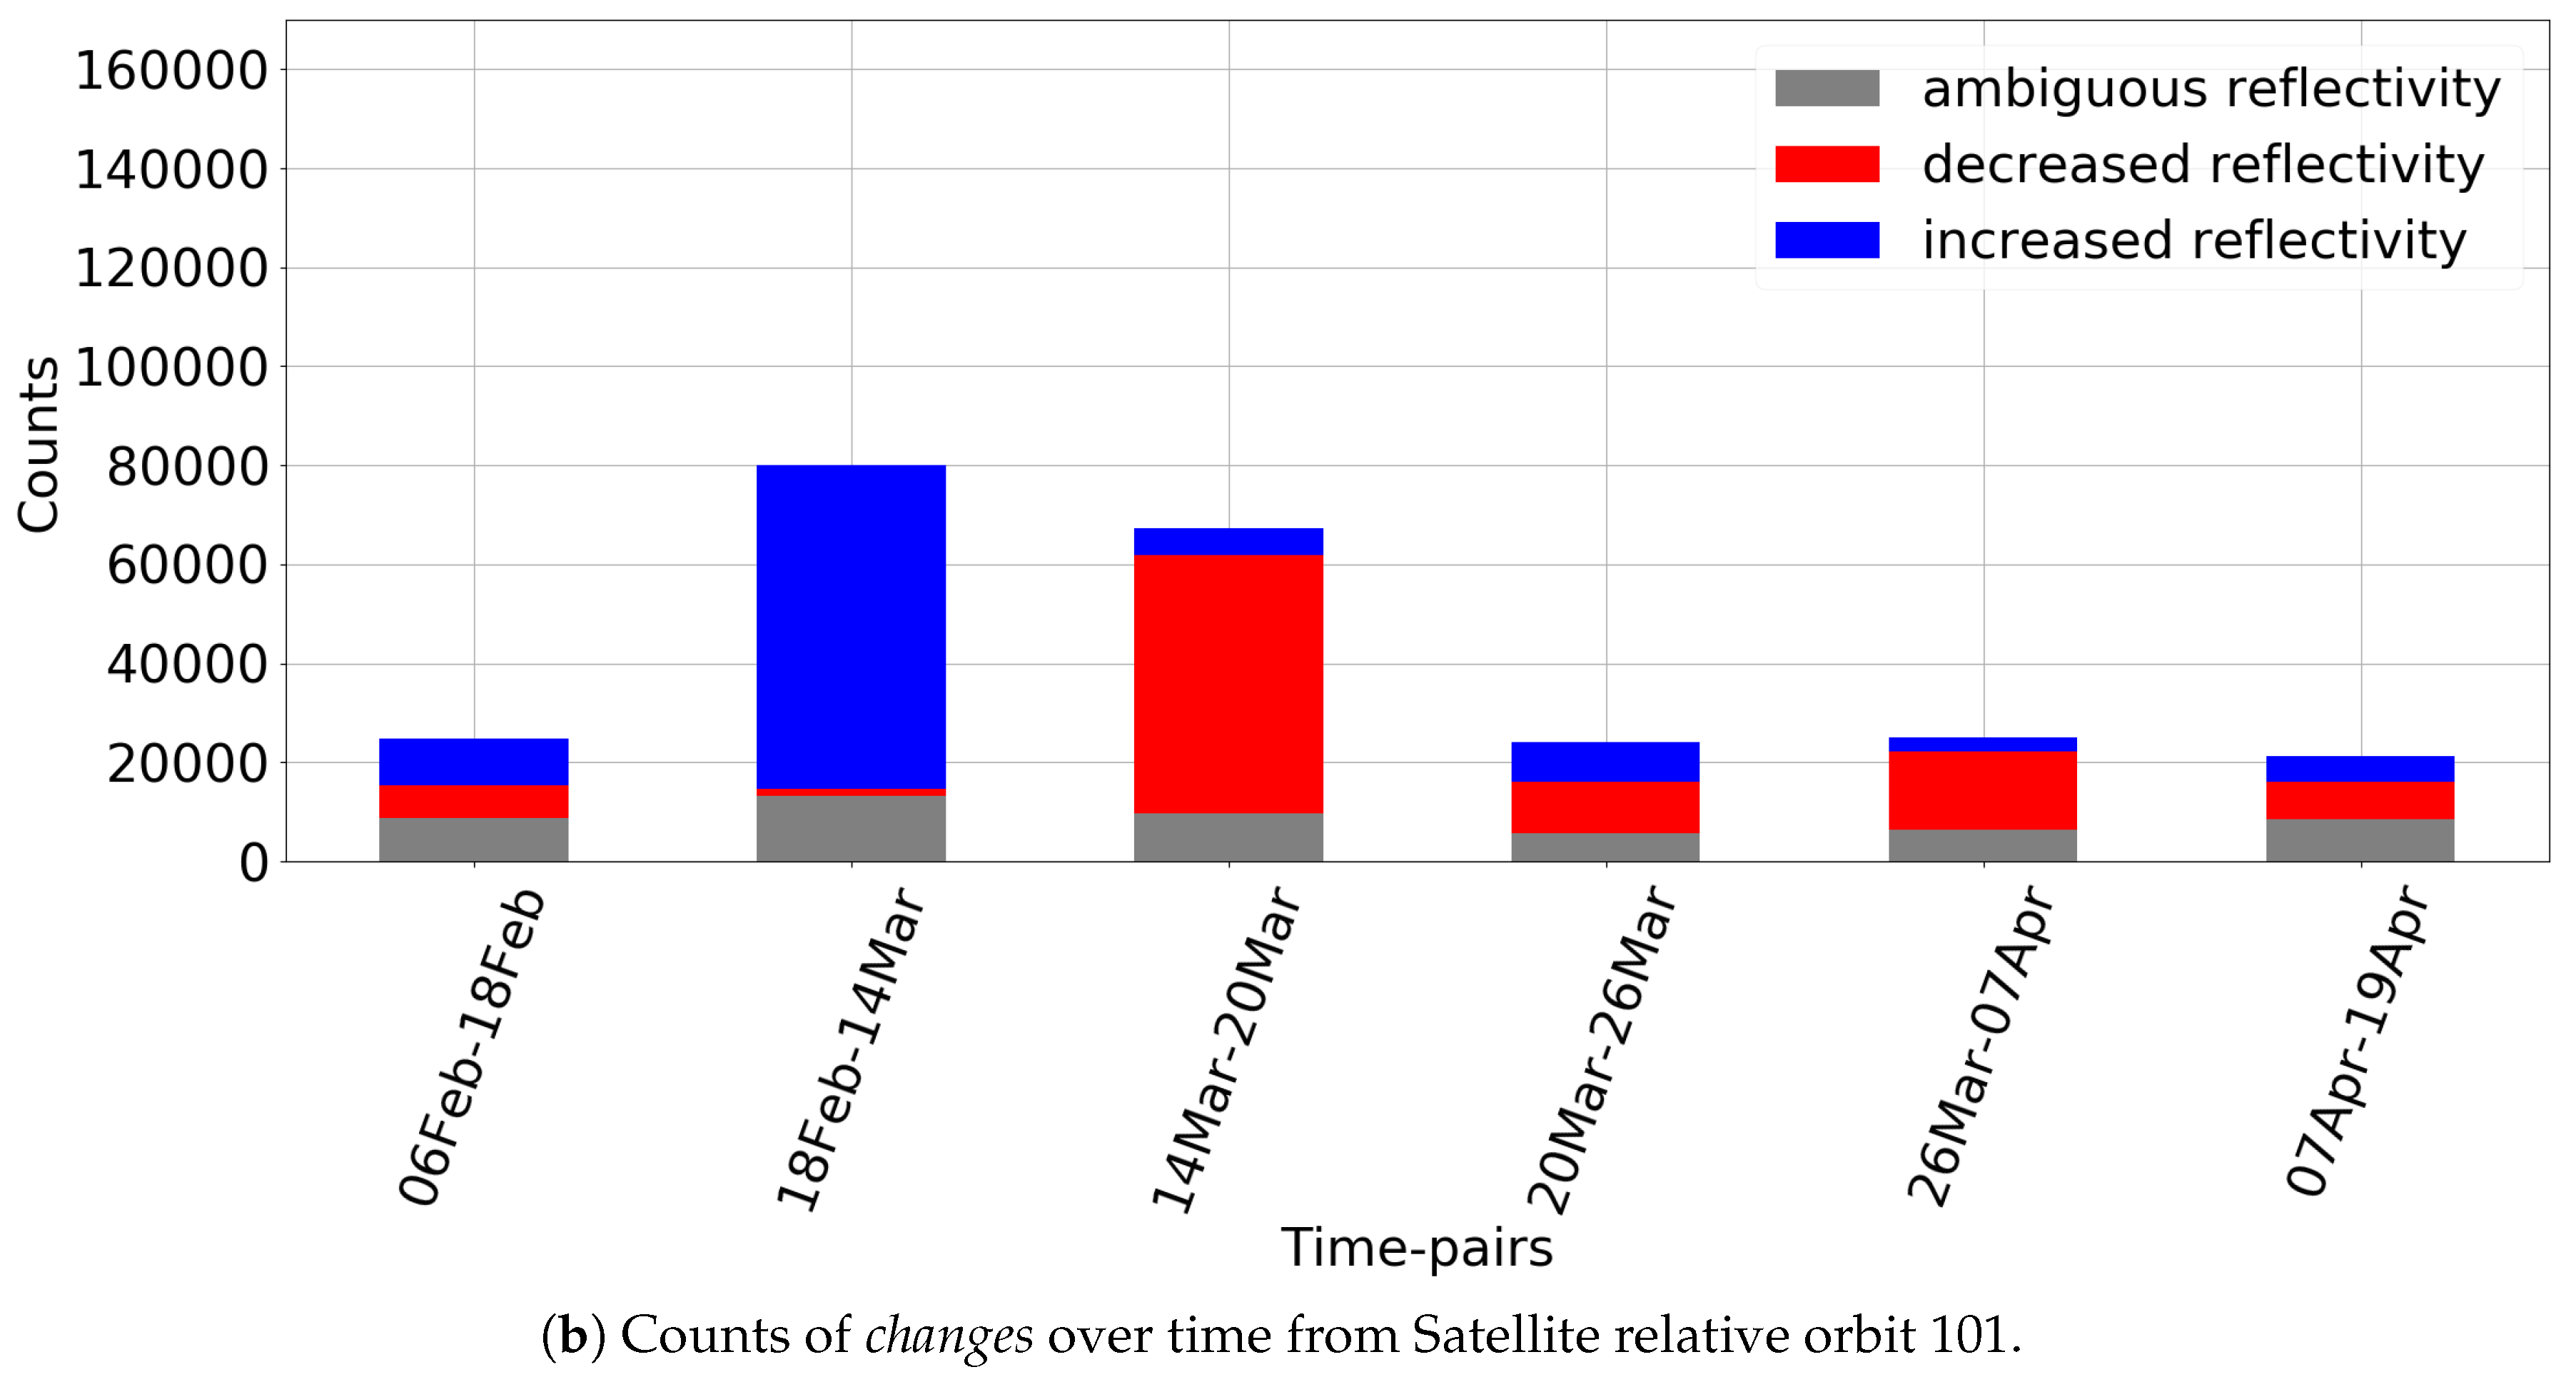
A prerequisite for the relevance of SAR data is that the Change Detection picks up changes that can be clearly related to Idai. Idai hit Beira on 14 March, with both high winds and heavy rains lasting for days until 18 March. The peak of the cyclone was registered on 15 March. The weather associated with the cyclone in Beira is shown as lines in Figure 3, while the impact assessed by changes are shown as columns. The changes clearly reflect the weather data, with many detections between 14 March and 20 March. The number of detected changes between 14 March and 20 March are almost 10 times larger than the observed change in a “normal” period (2 to 14 March) prior to the arrival of Idai. The passing over Beira of both Sentinel-1 A and B satellites at two different times during 14 March provides further evidence that the SAR data is reflecting Idai. The very high wind speeds of the cyclone Idai started on the 14 of March 2019. On this day, the A-satellite passed Beira at 3.09 AM, within relative orbit (RO) 6, and the B-satellite passed at 4.06 PM, within RO-101. This time difference means that RO-6 did not capture many changes between 2 March and 14 March, but a large difference between 14 and 20 March, as there had been limited change at 3 AM on 14 March. RO-101 on the other hand, captured a large number of changes between 18 February and 14 March, as weather had turned worse as this satellite passed at 4 PM, though the cyclone had still not reached its peak. Figure 4 shows that the largest amount of change is detected earlier in RO-101 because of the late passing of the satellite in this orbit. This also means that the very first data on the impact from Idai was available in RO-101 within 12 h of the onset of the cyclone. Receiving and processing the data for change maps can be done in hours. This highlights the advantage of the SAR data, as opposed to the analysis based on optical images or UAVs, that were not available until much later.
4.2. Different Types of Change Detections
By nature it is difficult to interpret the type of event that leads to a change in a SAR Change Detection analysis. The change in itself is a result of a change in the reflection strength of the emitted radar wave. An increased strength of the reflection, for example, is not unambiguously decided by one type of event, but when narrowing a change analysis down to a time interval in which a cyclone has its peak impact, the majority of change can be associated with effects from this event. In the analysis of the cyclone Idai, large changes are both observed in the days covering the peak of the cyclone (14 to 20 March) as well in the period immediately after (20 to 26 March). In the period with extreme weather (14 to 20 March), the radar shows increased reflections, while in the period immediately following the peak (20 to 26 March) is characterized by decreased reflections. Several phenomena could lead to this pattern, though it is difficult to exactly interpret the polarimetric scattering mechanism in a complex urban environment with multiple reflectors. For example, houses that lose their roofs could change from a plane reflector to a trihedral from the inner corners of the house, causing an increased reflection. When the roof is repaired, either temporarily or more permanently, the reflection would decrease relatively again. Multiple reflections are also likely to happen in an urban environment causing high peak intensities, that changes when houses are demolished by the cyclone. The decreased reflections, could be due to a clean-up, with the removal of building debris and rebuilding of roofs/temporary roofs. Despite filtering by location of houses, it cannot be ruled out that some change in reflection might also be due to change in saturation of water in the soil.
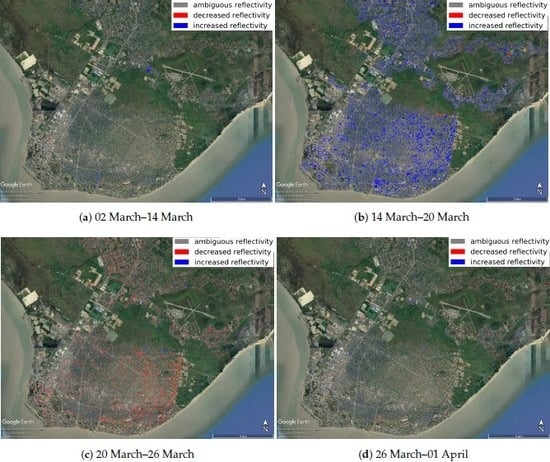
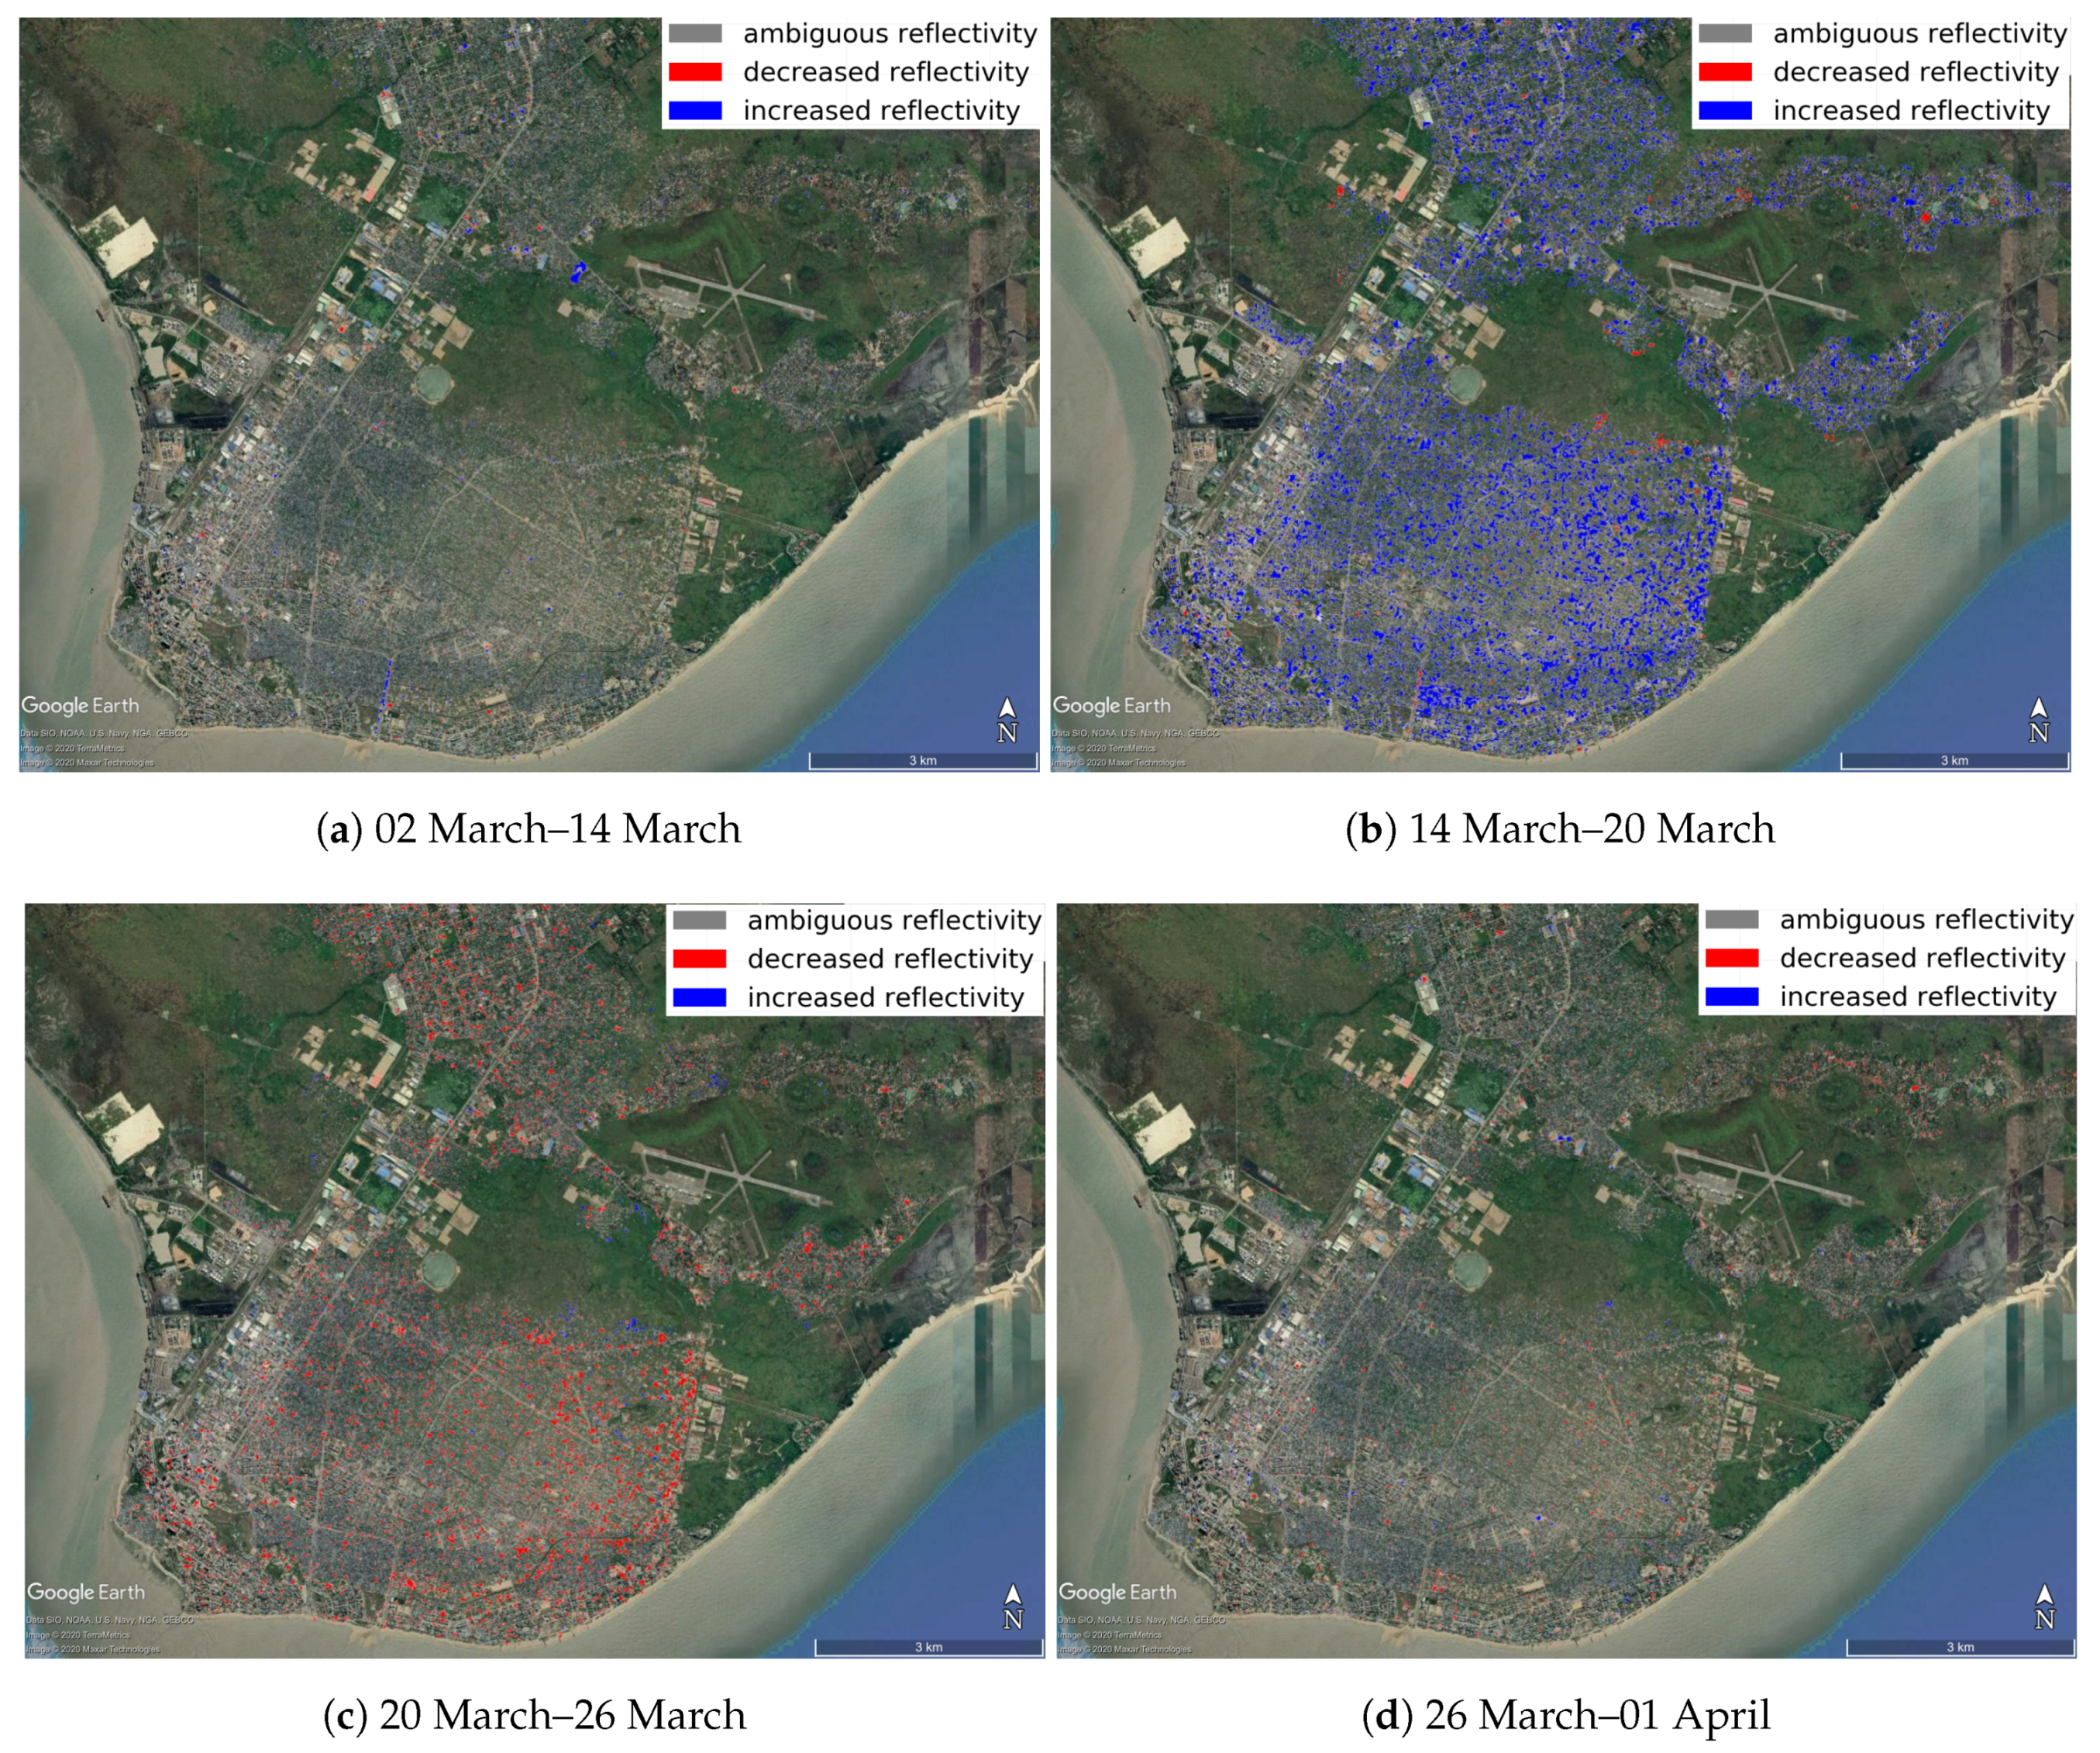
Figure 5 shows the output from the Change Detection analysis on a zoom of central Beira at different times before, over, and after the cyclone impact. Changes are colored according to Equation (3).
Figure 5 shows that there are few significant changes in the period before the cyclone (Figure 5a) as well as after the cyclone (Figure 5d). A close inspection of Figure 5a shows two areas of the city with a concentration of significant changes. A thin blue line at the center of the city, comes from a water channel that exhibit changes likely due to changing water levels. Further, a spot just west of the airport (three crossing roads north east in the city) exhibit changes prior to the cyclone. This is a large parking area for trucks, which in Google Earth are observed as either largely full or almost empty. The rest of the city is largely void of any significant changes prior to the arrival of Idai. Following the arrival of Idai on 14 March, there are a large number of changes detected between 14 March and 20 March (Figure 5b). Further, there are a substantial number of changes detected between 20 March and 26 March. As also observed in Figure, the changes exhibit increased reflections over the period of the highest cyclone impact (14 to 20 March) and decreased reflections in the period immediately following (20 to 26 March). Unlike Figure, Figure 5 is not filtered by location of houses; hence the change in reflections with opposite signs in the two time periods, can also be due to the large amounts of water that follow a cyclone which might retreat 6–10 days after, as well as cleaning up of debris. The SAR sensor is also sensitive to water, both as a result of water-saturated soil due to a change in the dielectric property and also to water-covered surfaces that will exhibit a different scattering pattern.
4.3. Change Detection Compared to Manually Tagged Damages
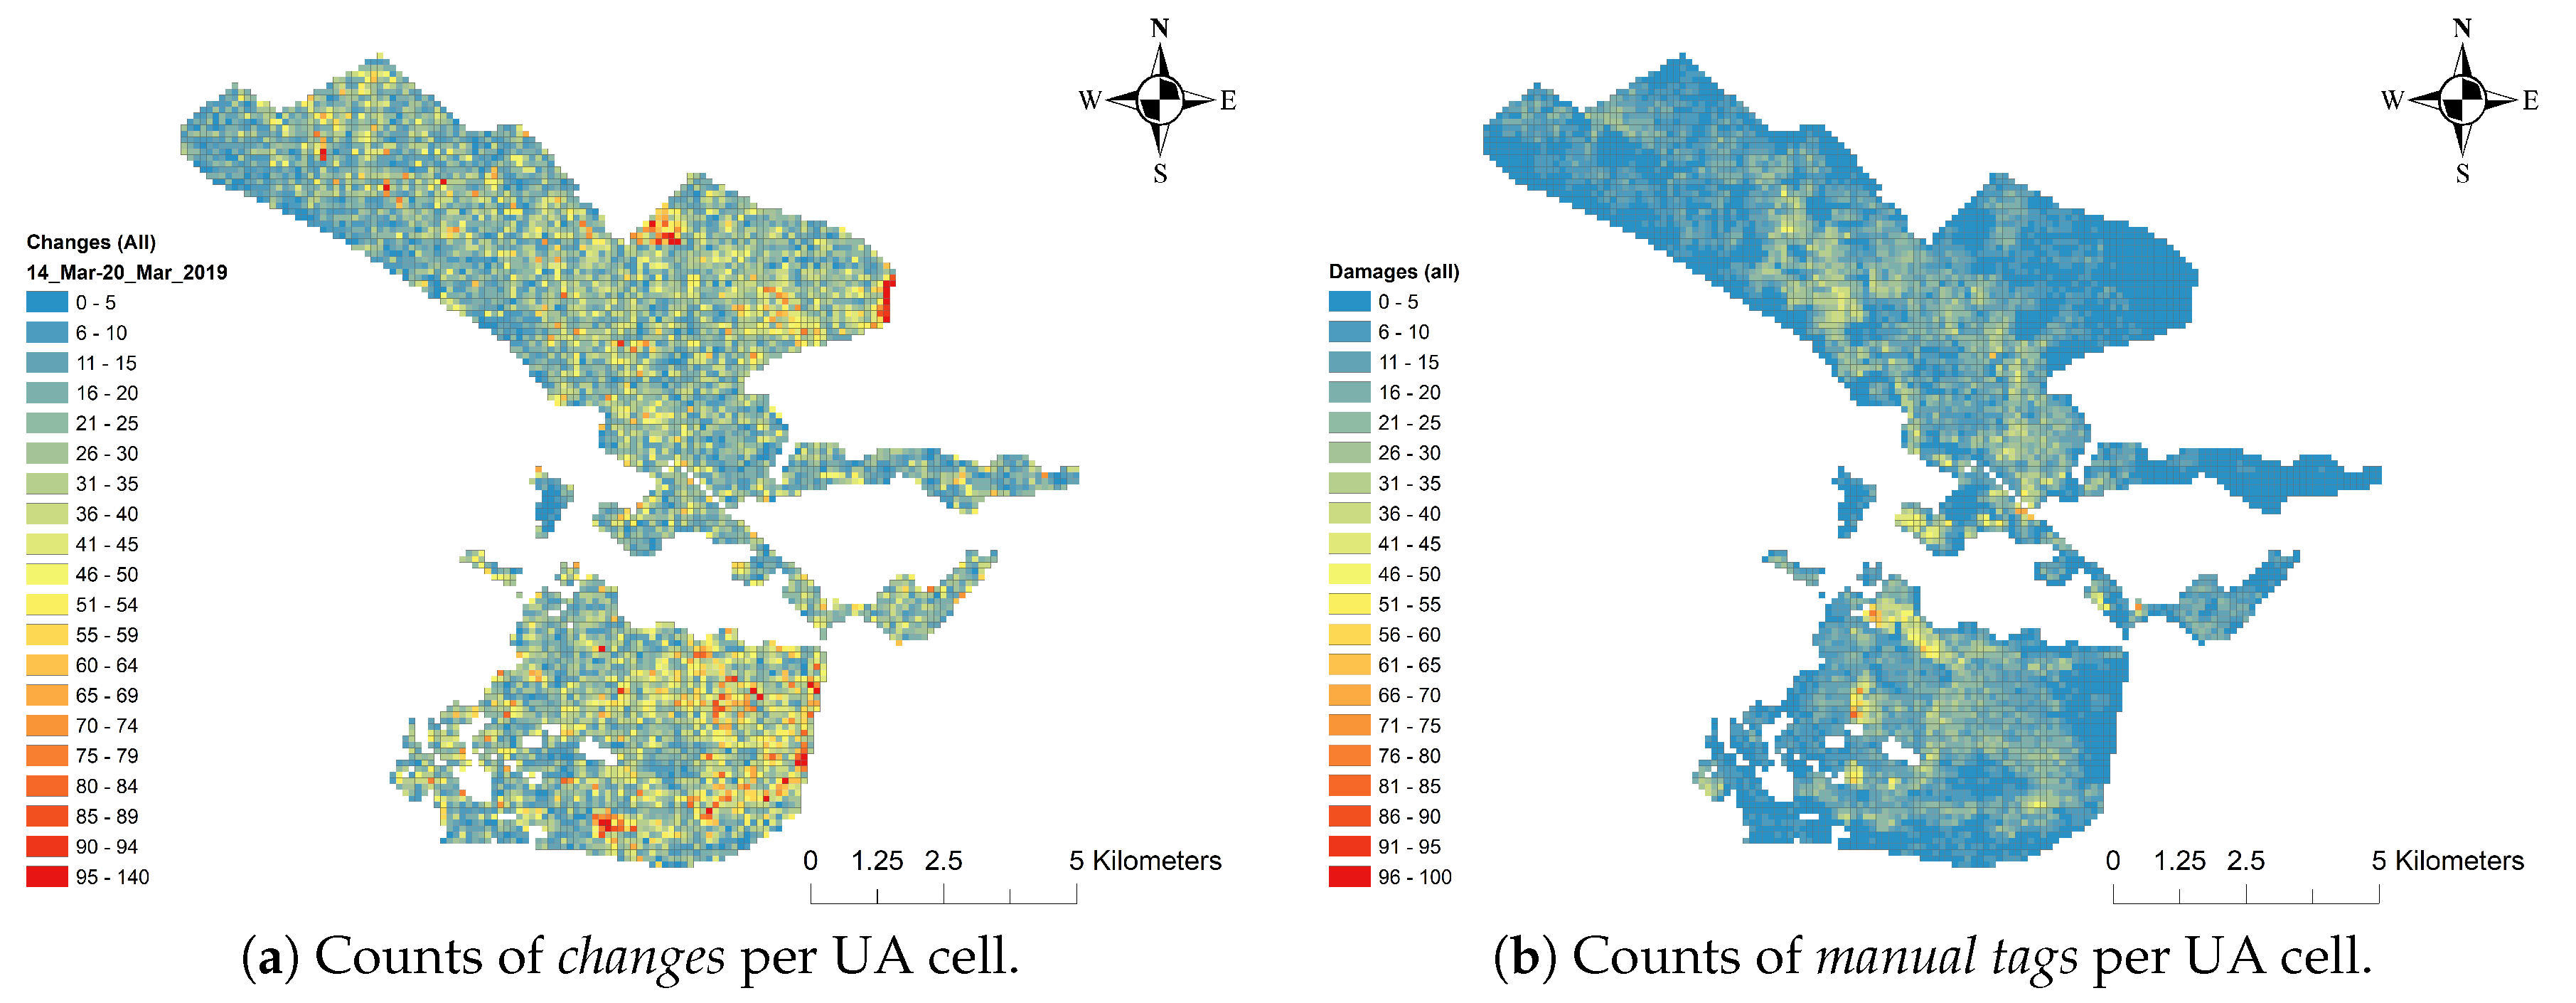
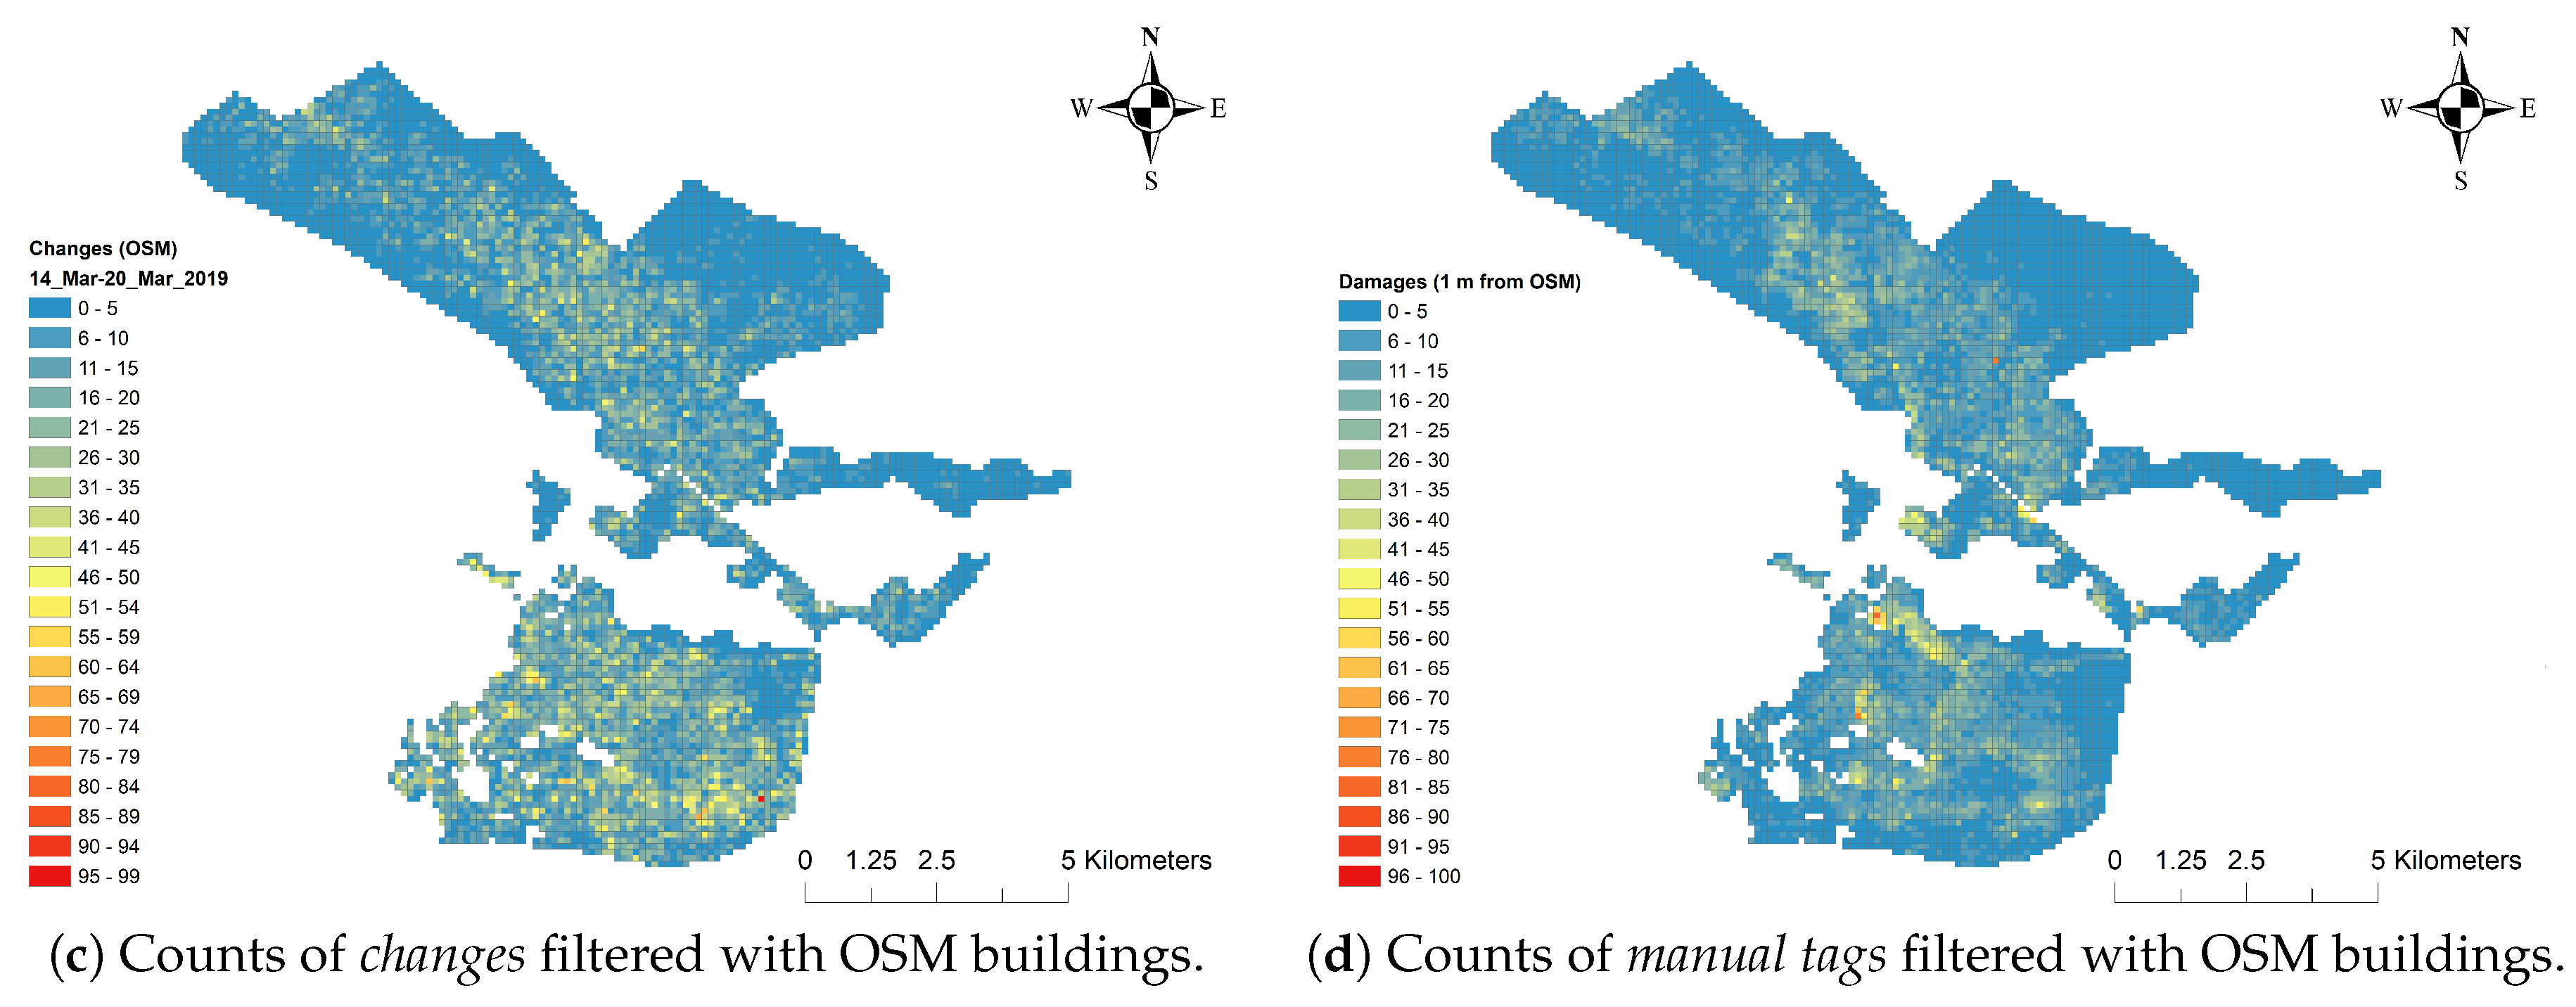
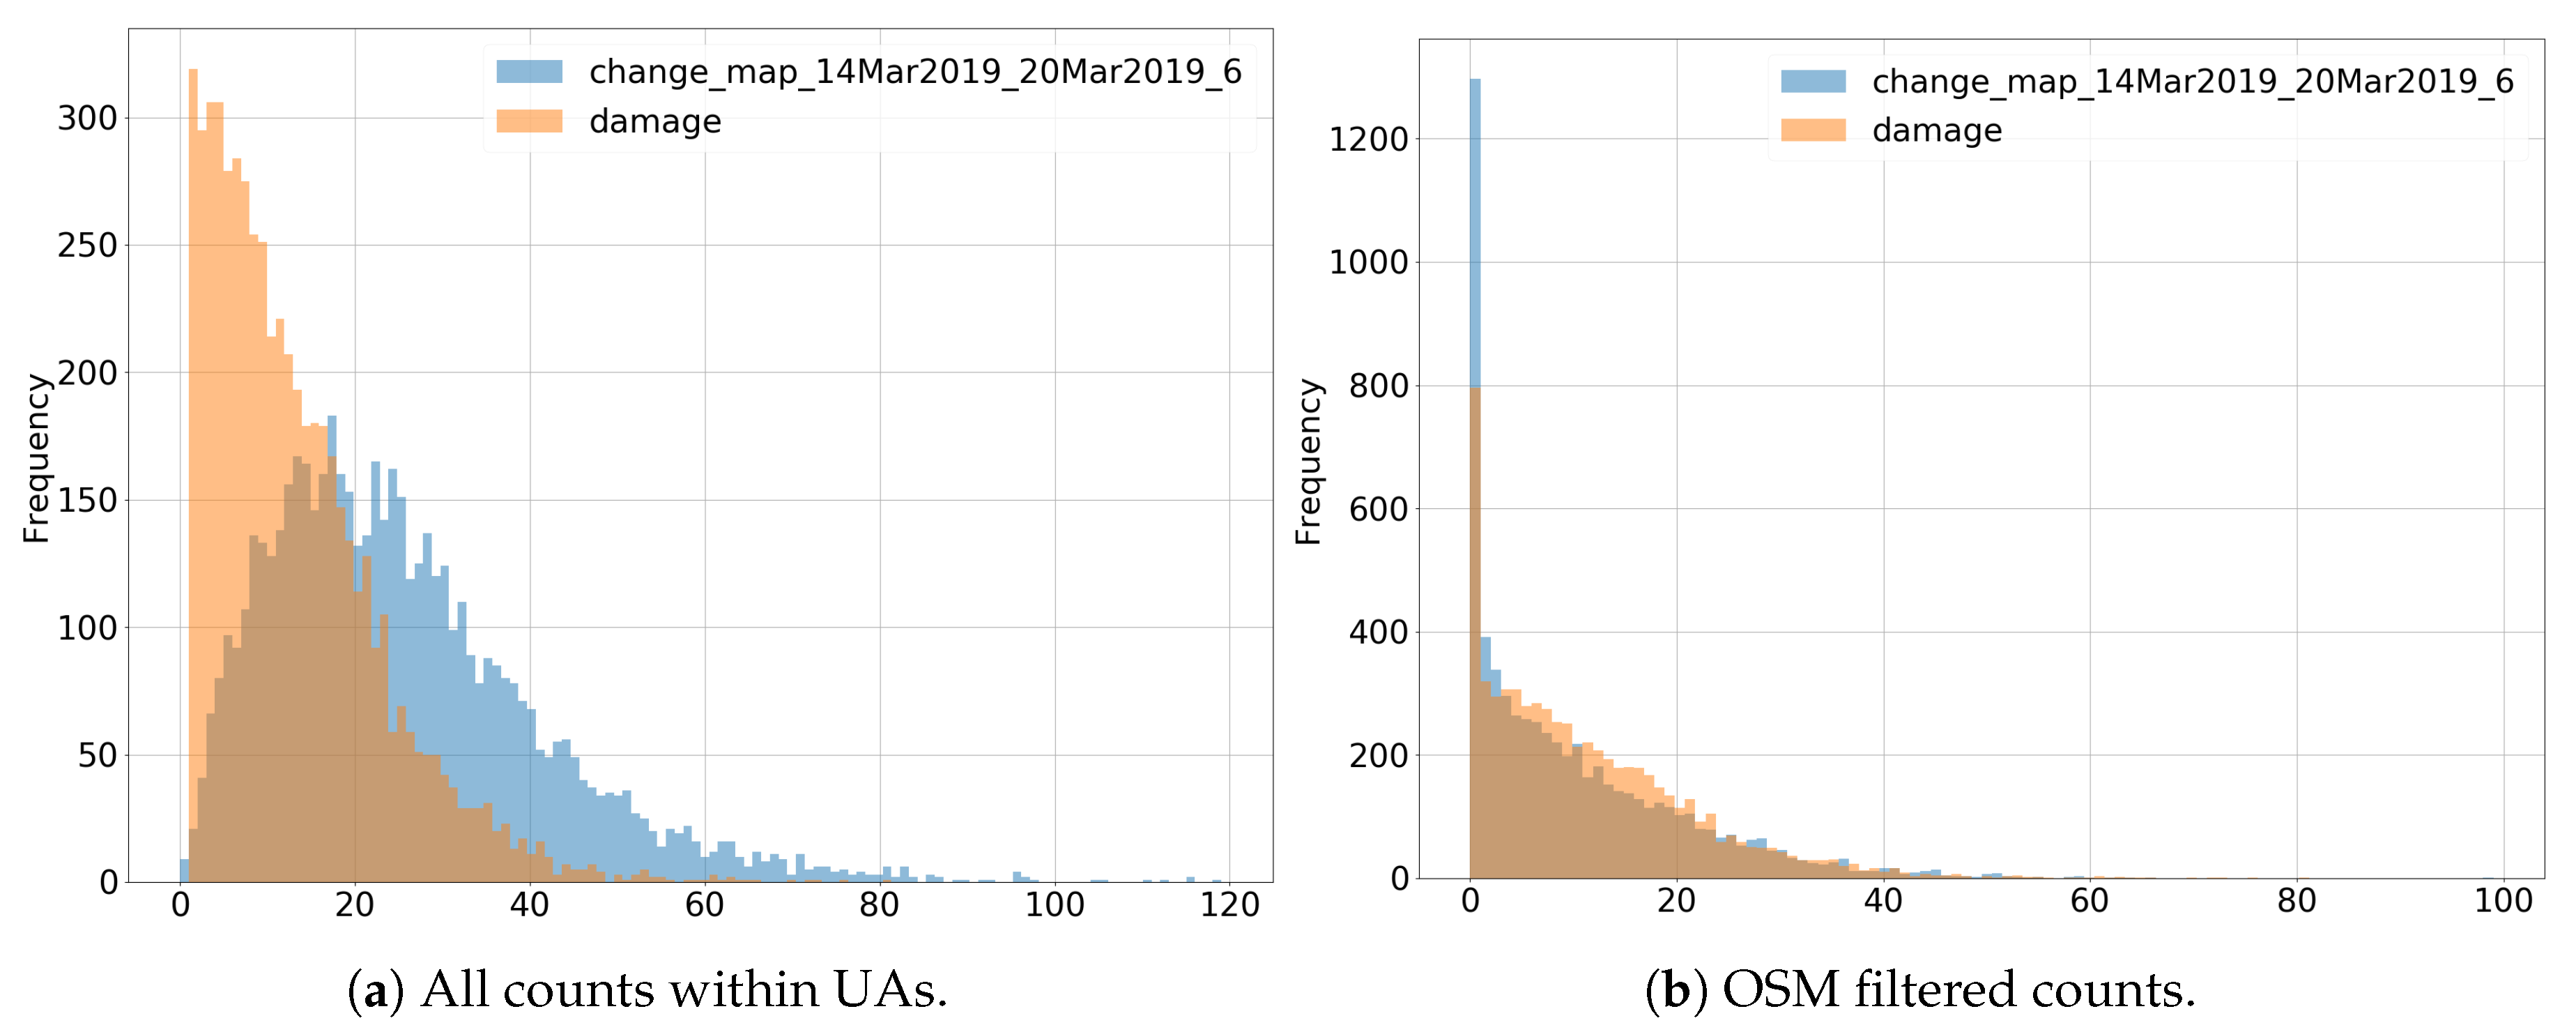
Manually tagged damage (manual tags) and Change Detections (changes) from SAR data are two very different processes, each with its advantages and disadvantages, and their similarities in operational inputs are of interest. Here, one should note, that although both measures are based on satellite data, the manual tags are tags of house damage of any severity, while the changes are more likely only to capture damage that is rather severe or a reflection of the damage to several houses. This partly reflects the method, but also the higher resolution in the optical data used for manual tagging. To make comparisons across damage datasets and other spatial characteristics, the analysis is done at the level of the UA grid cells. The severity of the cyclone impact can be assessed by counting the number of tags within each cell, as illustrated in the heat maps in Figure 6. Figure 6a shows that the most changes are found to the east, which is also the coastline, and the direction from which the cyclone came. Figure 6c shows Change Detections after filtering by OSM house locations. This shows that many changes are filtered out, which are likely changes related of natural vegetation and moisture in the ground. The method is not completely independent of these unwanted changes but drastically reduces their influence on the results. More Change Detections are still found along the eastern shore, but changes are generally found throughout the city. Figure 6b shows the count of manual tags. As with Change Detections, manually tagged damage is found throughout the city; but unlike Change Detections, the concentration of damage according to this measure is higher in the western part of the city, further away from the coast. The higher concentration in those parts could be a reflection of more densely populated areas leading to more individual tags. As noted earlier, the OSM filter is not perfect as not all houses are mapped. This can be seen by comparing Figure 6b with Figure 6d in Figure 6, showing the manually tagged damage with and without filtering by OSM. Beira is fairly well-covered by OSM buildings, but the filtering does seem to have some impact on the analysis, as for instance seen by the area towards the north that has notably less manually tagged damage after filtering by OSM (Figure 6d). The manually tagged damage is filtered with a 1m radius to line within a OSM building footprint. The filtering by OSM also turns the two impact assessments into very similar distributions (Figure 7). Manual tags and changes have a Spearman rank correlation of 0.55 (Figure 9). When applying a square root transformation of the count values, the Pearson correlation goes from 0.41 to 0.54 after the transformation, corresponding to an explained variance score . This must be considered a low and shows, not surprisingly, that the manual tags and changes are two different sources of information on the cyclone’s impact. We should, therefore, not expect to detect the same damage, such as a crack in a roof, which is marked in the manual tags dataset. Further, the manual tags are assessed on 26 March, 11 days after the peak of the cyclone, while changes are assessed on 20 March, 5 days after the peak of the cyclone.
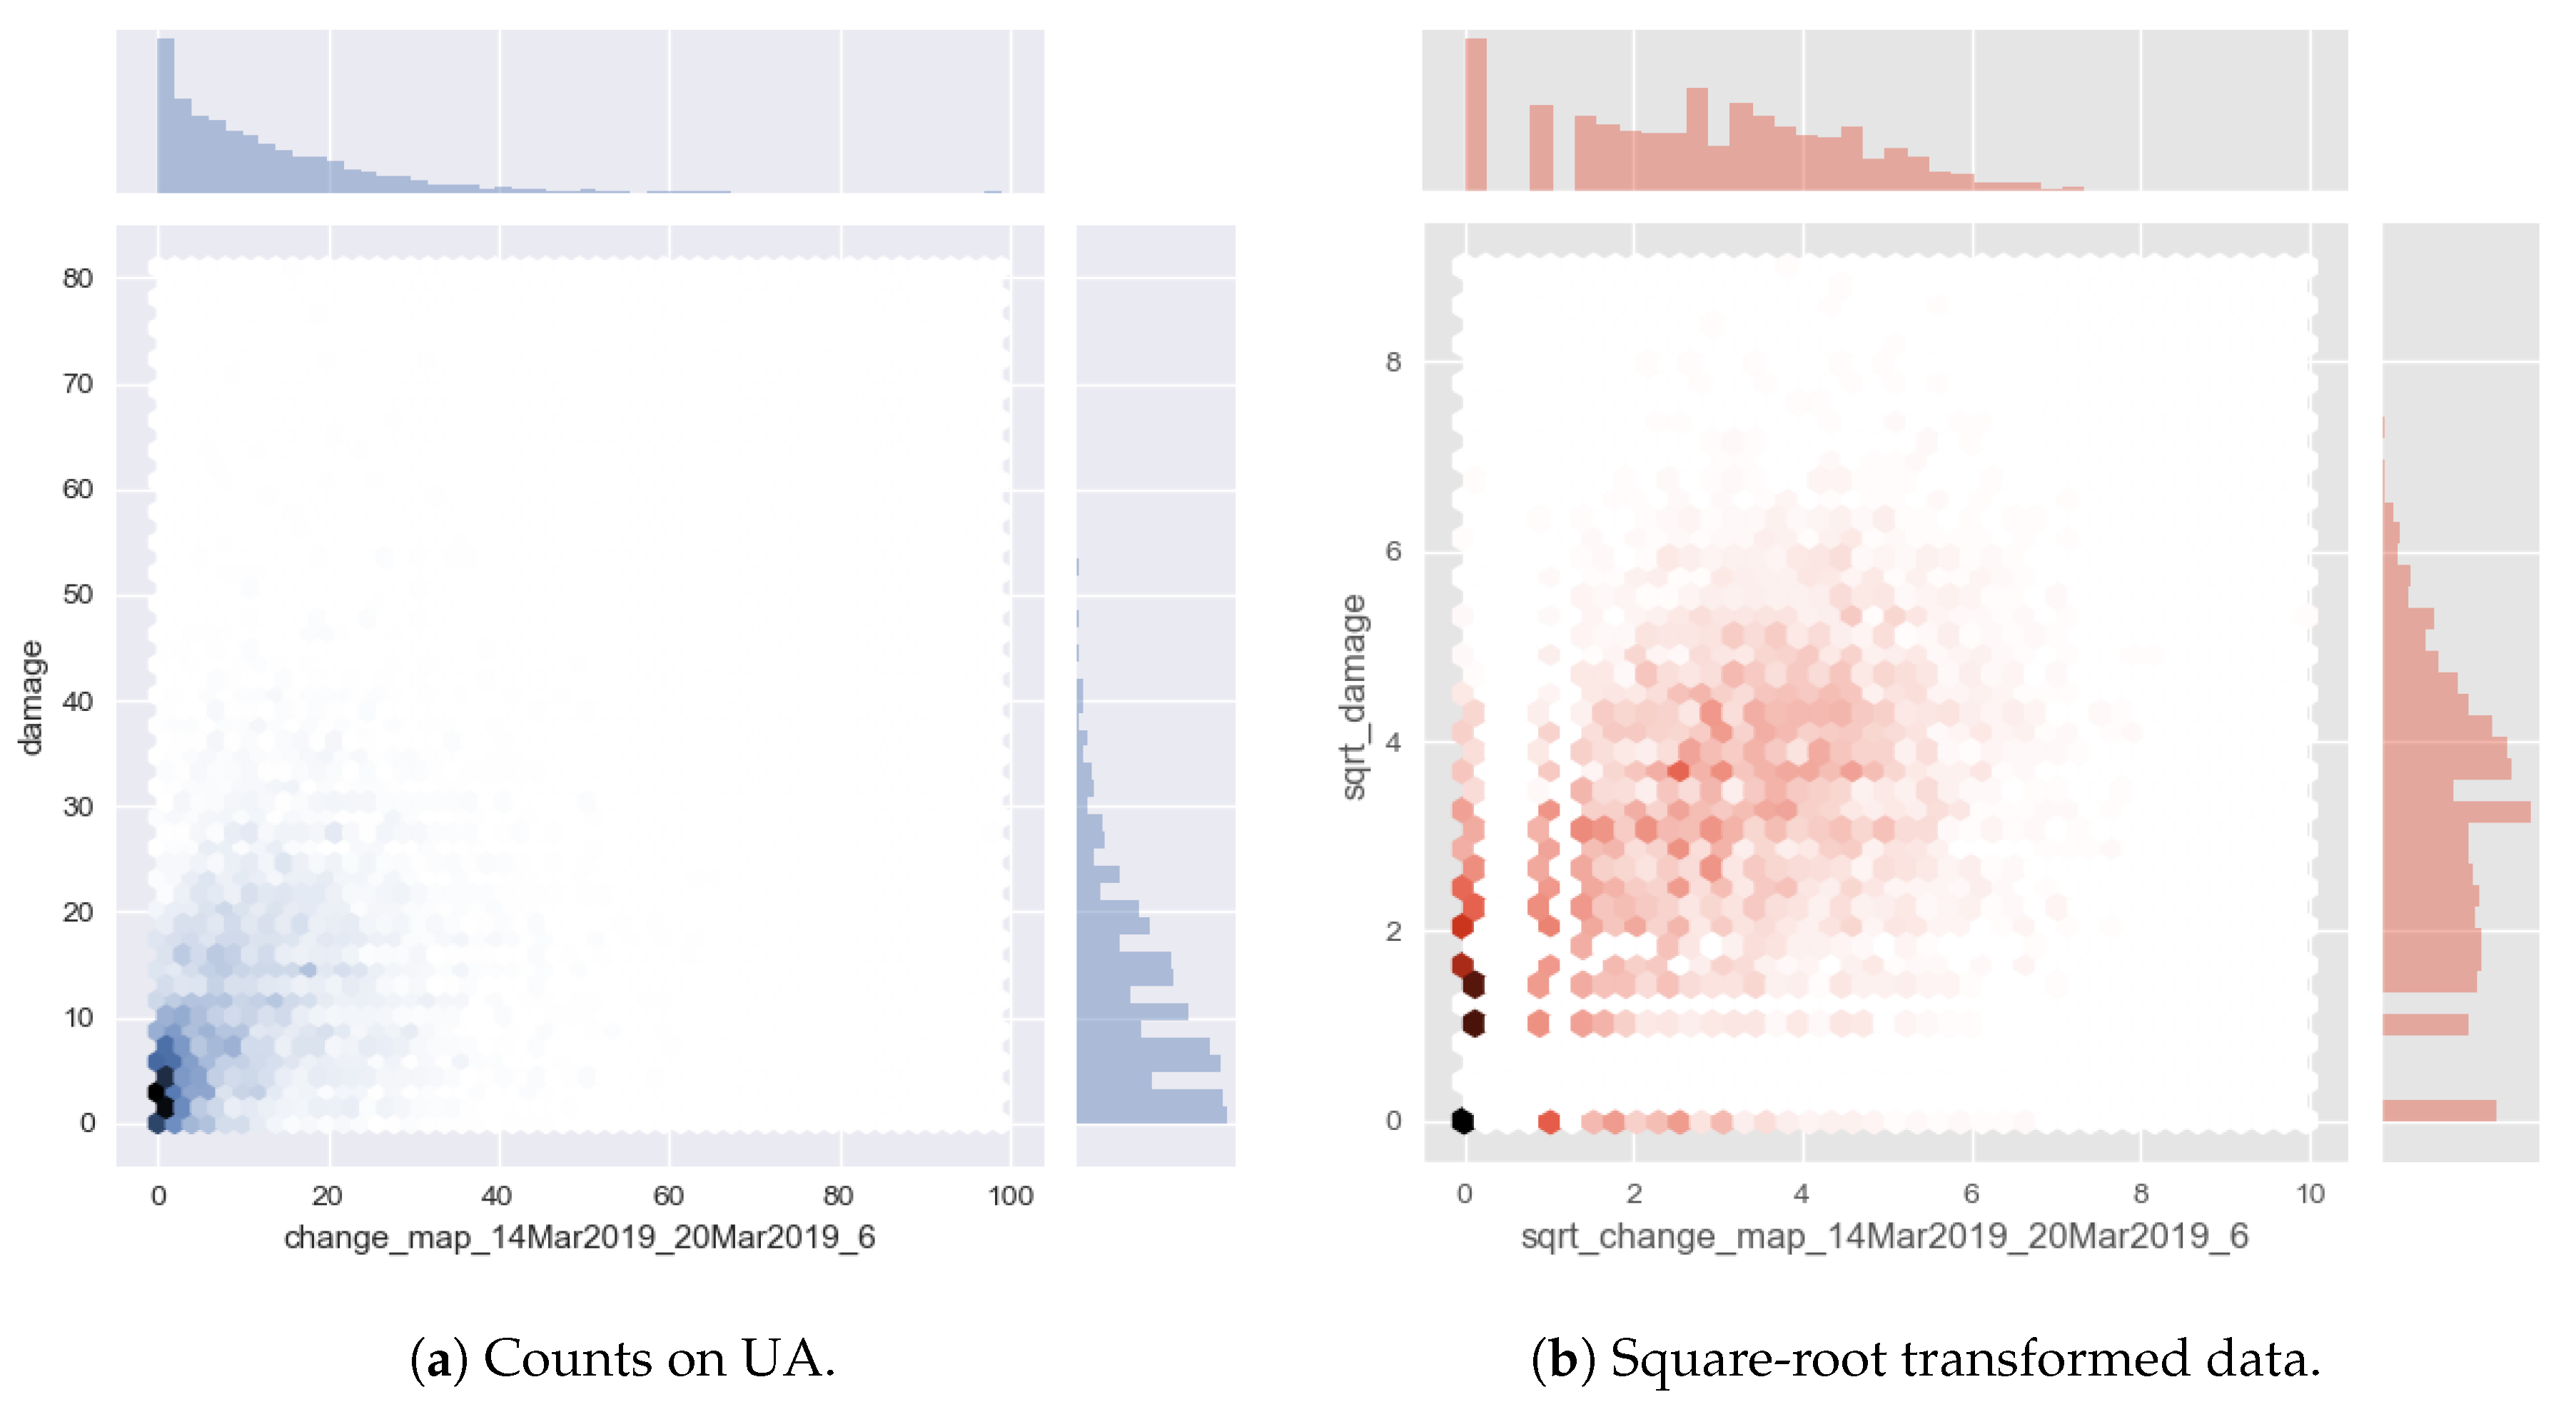
As already illustrated in Figure 6, the correlation between manual tags and changes is not very strong. There is, however, a weak trend, as can be observed in Figure 8, which shows a 2-dimensional density plot of the two distributions. Due to the long tail on the distributions, higher counts are scarce as seen in Figure 8a. A square root transformation can be applied to make the distribution somewhat closer to a normal distribution, as seen in Figure 8b.
4.4. Socio-Economic Characteristics of Impact
From an emergency response point of view, and maybe even more from a rebuilding point of view, other aspects of the city than the damage itself can be of interest. For instance, medium-level damage in a high population density area could be allocated more resources than a severe-level damage in a low population density area, simply because more people are affected and in need of assistance. This section assesses the correlation between manual tags, changes and aspects of the city as distance to coast, structure density, and average poverty of the people in each location. To avoid scale effects, the analysis of damage intensity and location characteristics are done based on Spearman rank correlations. Spearman rank correlations show how much two variables correlate in rankings without being biased by scales and are valid irrespective of the underlying distributions each variable might have.
The correlation analysis reveals that both manual tags and changes show more impact from Idai in areas with a higher density of buildings, closer to the coast (the direction the cyclone came from), as well as larger impact in wealthier areas of the city. The Change Detections are generally more correlated with all characteristics, but the correlation to poverty and distance to the coast is low for both. The highest rank correlation coefficient is observed for the density of buildings 0.71 and 0.76, Table 1, for manual tags and changes, respectively. There are no statistical guidelines on how high a rank correlation is meaningful, but some suggest a Spearman rank correlation under 0.4 is negligible [25].
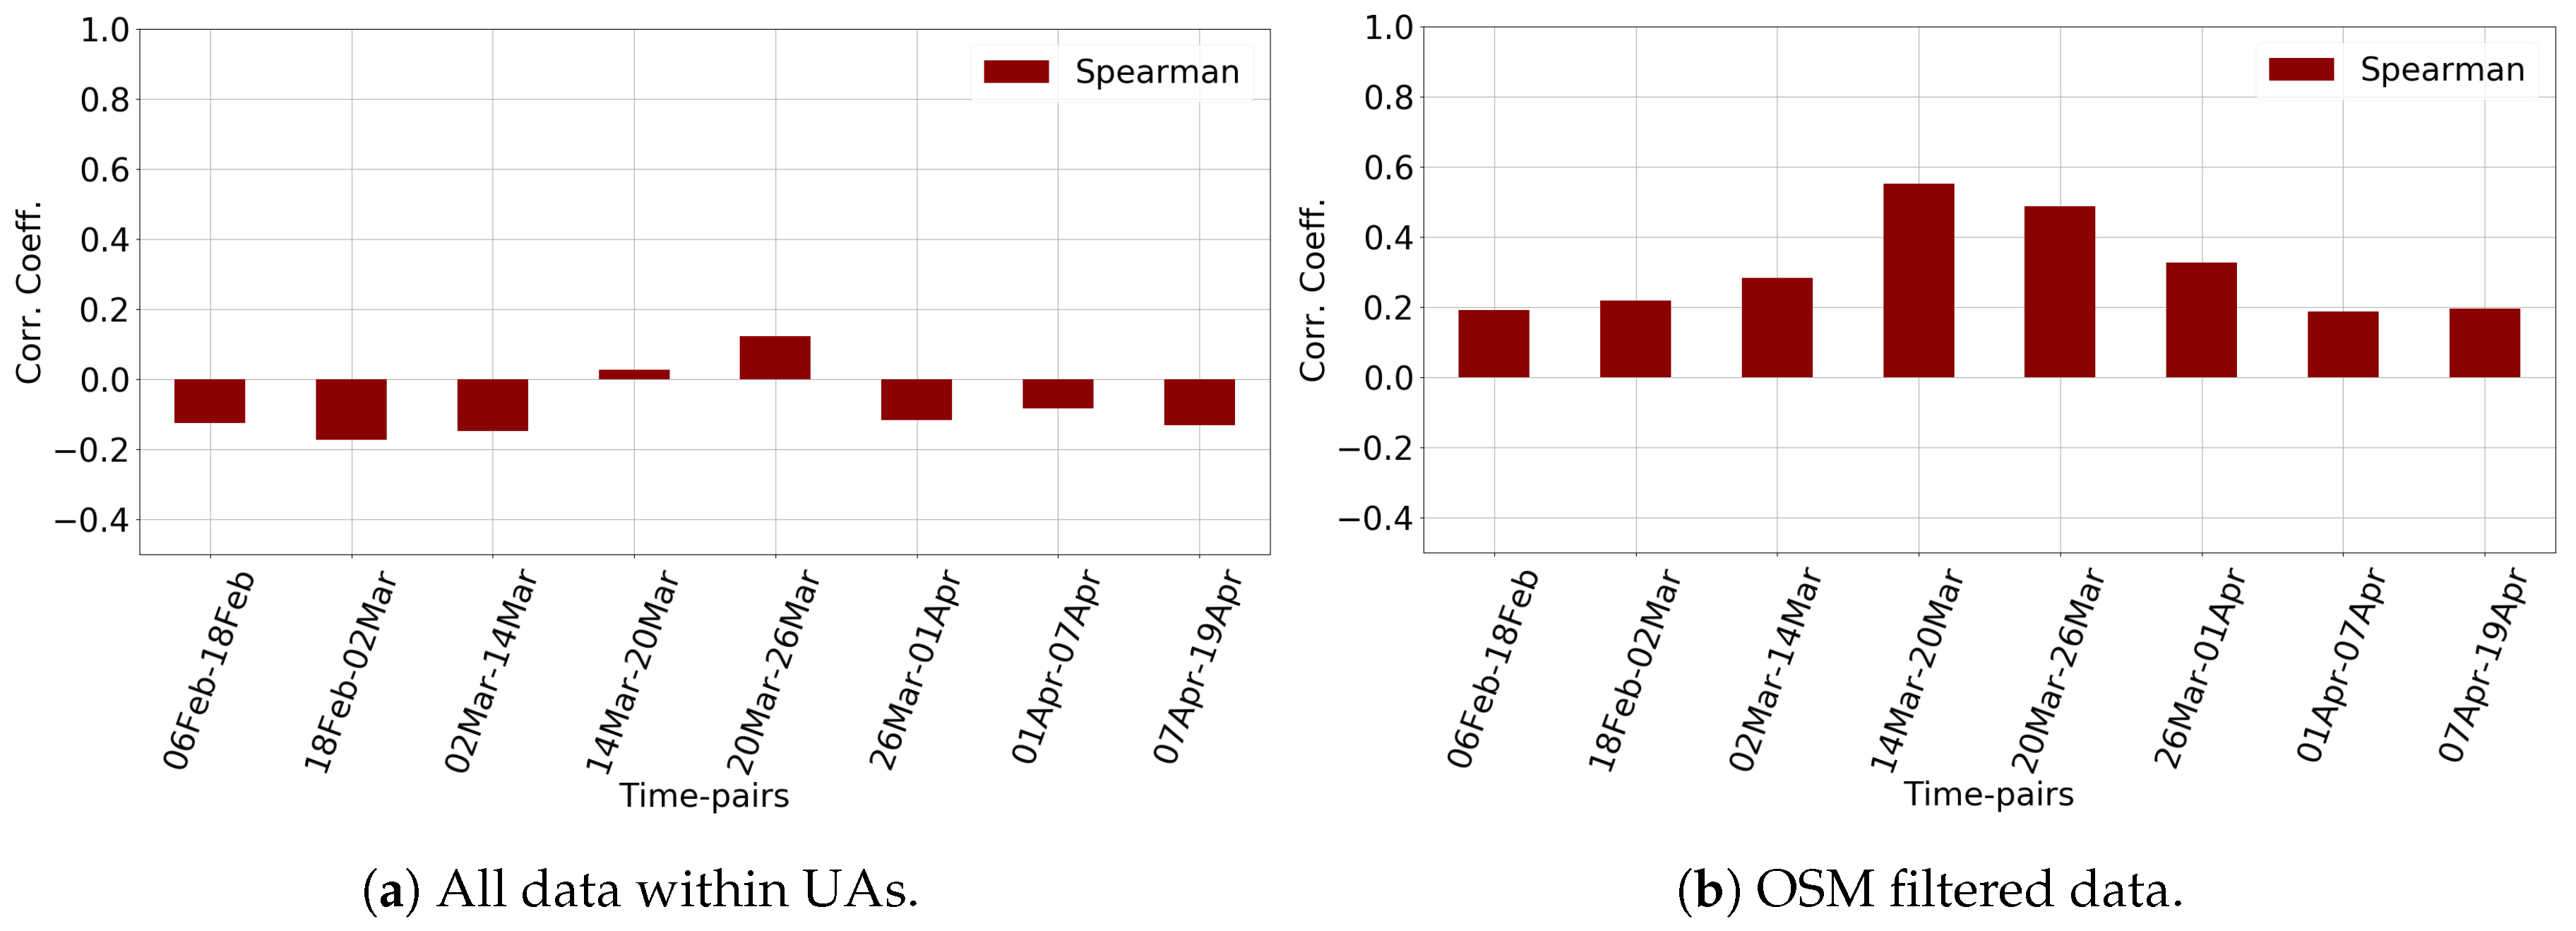
To gain a sense of the validity of correlation as a measure of the impact caused by the cyclone, correlation with count of changes at times where no damage was supposed to happen can be done as well, Figure 9.
We can see that the highest correlations take place simultaneously with the largest counts of changes when Idai struck and the immediate period after.
5. Discussion
This paper contributes by showing that the method developed by Nielsen, Conradsen and Skriver [12] also has relevance for application as cyclone damage assessment. This application has relevance for emergency response, especially in circumstances where optical images or UAVs cannot contribute or as a supplement to them. The approach’s validity is established by the clear response in Change Detections to observed weather data. Though this is an argument for the method’s accuracy, a stronger argument would be a comparison of SAR Change Detections and ground truth. In particular, a ground-truthing that would include measures of types and severity of damages would be interesting. However, a ground-truthing of the SAR data’s strength—a first assessment irrespective of weather—can be difficult to do, as ground access is almost by definition difficult due to the inclement weather and that drives the need for assessments via SAR data. Recall data could be used, though this also potentially comes with challenges of its own. A realistic validation scenario for the proposed method, and all other methods for the same problem, would be to provide these maps during a cyclone disaster for the emergency personnel and evaluate on the use.
The clear pattern of increase and decrease in reflections is an interesting result that suggests an interpretation of data, where increases in reflection are a proxy for damage or demolition, and decrease in reflection a proxy for reconstruction. Further work is needed to establish if such an interpretation is valid and can be generalized.
The need for filtering of results, to separate impact on the natural environment and changes in human behavior, from the impact on houses, is an additional challenge. In this case, OSM provided a valid mask to filter by, but this is not the case in many cities, especially in developing countries. For such data, convolutional neural network applied to optical images provides much promise. The field is moving rapidly, and more and more algorithms and results are publicly available, providing access to automated assessments of building footprints, as well as types of buildings. Such examples also exist for Mozambique [18,20,21,26]. For convolutional neural networks to provide valid building masks, high resolution satellite image data would be necessary, which might come with an extra cost. Additional filtering could also provide more selected operational support, by filtering specific locations with critical infrastructure, such as health facilities, power facilities, bridges, and roads, and so forth.
6. Conclusions
Though not supported by ground truth, the perfect match with weather data provides evidence that the this SAR Change Detection method captures ground changes due to cyclones. Further testing, especially analysing the differences in increased and decreased reflection, which might reflect destruction and reconstruction, is an especially interesting aspect for further research. The filtering of results with data on house locations, focuses the assessment of damage to houses, thereby limiting the results to a better proxy for impact on human life. For operational purposes, filtering by specific locations with critical infrastructure, such as health facilities, power facilities, bridges, and roads, and so forth, would be natural extensions. The proposed method, despite not being compared to ground truth is promising and already mature to be used as a supplement to other damage assessment sources or as a early guidance of where to collect more data after a cyclone.
In the case of weather related disasters like cyclones, SAR data will usually be available before optical images or data from UAVs, as its recording is not prevented by weather conditions or time of day. For cyclone Idai, the first SAR data was available 12 h after first impact, while the final analysis based on optical images was not available until 21 days later. Provision of early stage information is clearly an advantage that allows improved emergency response planning and action. Using the SAR results as a sampling frame for further assessment using optical images and/or UAVs when possible, would also be an interesting application.
The utilized SAR data is freely available, and the method applied here can easily be replicated in other settings with minimal changes to execution files. Hence, application in future settings can be done both quickly and at low cost.
Author Contributions
Conceptualization, D.M.-H., T.S. and P.F.; Data curation, D.M.-H. and P.F.; Funding acquisition, J.B.; Methodology, T.S.; Validation, J.B.; Writing—original draft, D.M.-H., T.S., P.F. and J.B. All authors have read and agreed to the published version of the manuscript.
Funding
This research was funded by the World Bank.
Acknowledgments
Map data copyrighted OpenStreetMap contributors and available from https://www.openstreetmap.org. The authors would like to thank UNOSAT and REACH for providing the tagged damages used in work and for taking their time to answer our questions regarding the tagging procedure. The authors would like to thank Allan Aasbjerg Nielsen for his valuable discussions and guidance in connection with applying the Wishart Change Detection methods on the problem presented in this paper. Thanks to Phyllis Ronek and Christina Könnecke for editorial assistance.
Conflicts of Interest
The authors declare no conflict of interest.
Appendix A
GeoJSON definition of Beira AOI:
{
‘‘type’’: ‘‘FeatureCollection’’,
‘‘name’’: ‘‘beira_AOI’’,
‘‘crs’’: { ‘‘type’’: ‘‘name’’, ‘‘properties’’: { ‘‘name’’: ‘‘urn:ogc:def:crs:OGC:1.3:CRS84’’ } },
‘‘features’’: [
{ ‘‘type’’: ‘‘Feature’’, ‘‘properties’’: { ‘‘id’’: 0 }, ‘‘geometry’’: { ‘‘type’’: ‘‘MultiPolygon’’, ‘‘coordinates":
[ [ [ [ 34.788023325231983, -19.767838371946027 ],
[ 34.790501868084881, -19.861628429308738 ],
[ 34.957390420179806, -19.862923484517118 ],
[ 34.958973933669157, -19.680864861890122 ],
[ 34.785475933966502, -19.68138347304939 ],
[ 34.788023325231983, -19.767838371946027 ] ] ] ] } }
]
}
Appendix B
Sentinel-1 GRD Image Processing Steps:
The processing steps applied to the GRD Sentinel-1 file is performed with the Sentinel-1 Toolbox in ESAs Sentinel Application Platform (SNAP) and is as follows,
- Apply-Orbit-File
- Subset
- Remove-GRD-Border-Noise
- Thermal-Noise-Removal
- Calibration
- Terrain-Correction
Dates of Sentinel-1 scene recording for each relative orbit:
relative orbit: 101
2019-04-19 T16:06:54
2019-04-07 T16:06:54
2019-03-26 T16:06:53
2019-03-20 T16:07:24
2019-03-14 T16:06:46
2019-02-18 T16:06:53
2019-02-06 T16:06:53
relative orbit: 6
2019-04-19 T03:09:06
2019-04-07 T03:09:05
2019-04-01 T03:08:23
2019-03-26 T03:09:05
2019-03-20 T03:08:13
2019-03-14 T03:09:05
2019-03-02 T03:09:05
2019-02-18 T03:09:05
2019-02-06 T03:09:05
relative orbit: 174
2019-03-31 T16:14:54
2019-03-25 T16:15:48
2019-03-19 T16:14:51
2019-03-13 T16:15:22
References
- Saito, K.; Spence, R.J.; Going, C.; Markus, M. Using high-resolution satellite images for post-earthquake building damage assessment: A study following the 26 January 2001 Gujarat earthquake. Earthq. Spectra 2004, 20, 145–169. [Google Scholar] [CrossRef]
- Ge, P.; Gokon, H.; Meguro, K. A review on synthetic aperture radar-based building damage assessment in disasters. Remote Sens. Environ. 2020, 240, 111693. [Google Scholar] [CrossRef]
- Canty, M.J.; Nielsen, A.A.; Conradsen, K.; Skriver, H. Statistical Analysis of Changes in Sentinel-1 Time Series on the Google Earth Engine. Remote Sens. 2019, 12, 46. [Google Scholar] [CrossRef] [Green Version]
- Plank, S. Rapid damage assessment by means of multi-temporal SAR—A comprehensive review and outlook to Sentinel-1. Remote Sens. 2014, 6, 4870–4906. [Google Scholar] [CrossRef] [Green Version]
- Washaya, P.; Balz, T.; Mohamadi, B. Coherence change-detection with sentinel-1 for natural and anthropogenic disaster monitoring in urban areas. Remote Sens. 2018, 10, 1026. [Google Scholar] [CrossRef] [Green Version]
- Morelli, S.; Del Soldato, M.; Bianchini, S.; Pazzi, V.; Krymbi, E.; Shpori, E.; Casagli, N. Detection of Seasonal Inundations by Satellite Data at Shkoder Urban Area, North Albania for Sustainable Management. Sustainability 2019, 11, 4454. [Google Scholar] [CrossRef] [Green Version]
- Li, Y.; Martinis, S.; Wieland, M.; Schlaffer, S.; Natsuaki, R. Urban flood mapping using SAR intensity and interferometric coherence via Bayesian network fusion. Remote Sens. 2019, 11, 2231. [Google Scholar] [CrossRef] [Green Version]
- Trianni, G.; Gamba, P. Damage detection from SAR imagery: Application to the 2003 Algeria and 2007 Peru earthquakes. Int. J. Navig. Obs. 2008, 2008. [Google Scholar] [CrossRef] [Green Version]
- Dong, L.; Shan, J. A comprehensive review of earthquake-induced building damage detection with remote sensing techniques. ISPRS J. Photogramm. Remote Sens. 2013, 84, 85–99. [Google Scholar] [CrossRef]
- Bignami, C.; Chini, M.; Pierdicca, N.; Stramondo, S. Comparing and combining the capability of detecting earthquake damages in urban areas using SAR and optical data. In Proceedings of the IEEE International Geoscience and Remote Sensing Symposium, Anchorage, AK, USA, 20–24 September 2004; IEEE: Piscataway, NJ, USA, 2004; Volume 1. [Google Scholar]
- Grey, W.; Luckman, A.; Holland, D. Mapping urban change in the UK using satellite radar interferometry. Remote Sens. Environ. 2003, 87, 16–22. [Google Scholar] [CrossRef]
- Conradsen, K.; Nielsen, A.A.; Schou, J.; Skriver, H. A test statistic in the complex Wishart distribution and its application to change detection in polarimetric SAR data. IEEE Trans. Geosci. Remote Sens. 2003, 41, 4–19. [Google Scholar] [CrossRef] [Green Version]
- Conradsen, K.; Nielsen, A.A.; Skriver, H. Determining the points of change in time series of polarimetric SAR data. IEEE Trans. Geosci. Remote Sens. 2016, 54, 3007–3024. [Google Scholar] [CrossRef] [Green Version]
- Xie, S.; Duan, J.; Liu, S.; Dai, Q.; Liu, W.; Ma, Y.; Guo, R.; Ma, C. Crowdsourcing rapid assessment of collapsed buildings early after the earthquake based on aerial remote sensing image: A case study of yushu earthquake. Remote Sens. 2016, 8, 759. [Google Scholar] [CrossRef] [Green Version]
- Shao, W.; Hu, Y.; Yang, J.; Nunziata, F.; Sun, J.; Li, H.; Zuo, J. An empirical algorithm to retrieve significant wave height from Sentinel-1 synthetic aperture radar imagery collected under cyclonic conditions. Remote Sens. 2018, 10, 1367. [Google Scholar] [CrossRef] [Green Version]
- ESA. Sentinel-1 Observation Scenario. Available online: https://sentinel.esa.int/web/sentinel/missions/sentinel-1/observation-scenario (accessed on 1 May 2020).
- ESA. User Guides—Sentinel-1 SAR—Level-1 Ground Range Detected—Sentinel Online. Available online: https://sentinel.esa.int/web/sentinel/user-guides/sentinel-1-sar/resolutions/level-1-ground-range-detected (accessed on 1 May 2020).
- Sohnesen, T.P.; Fisker, P.; Malmgren-Hansen, D. Using Satellite Data to Guide Urban Poverty Reduction. In Proceedings of the IARIW-World Bank Conference: New Approaches to Defining and Measuring Poverty in a Growing World, Washington, DC, USA, 7–8 November 2019. [Google Scholar]
- OpenStreetMap Contributors. 2017. Available online: https://www.openstreetmap.org (accessed on 22 April 2020).
- Esch, T.; Taubenböck, H.; Roth, A.; Heldens, W.; Felbier, A.; Schmidt, M.; Mueller, A.A.; Thiel, M.; Dech, S.W. TanDEM-X mission-new perspectives for the inventory and monitoring of global settlement patterns. J. Appl. Remote Sens. 2012, 6, 061702. [Google Scholar] [CrossRef]
- Esch, T.; Marconcini, M.; Felbier, A.; Roth, A.; Heldens, W.; Huber, M.; Schwinger, M.; Taubenböck, H.; Müller, A.; Dech, S. Urban footprint processor—Fully automated processing chain generating settlement masks from global data of the TanDEM-X mission. IEEE Geosci. Remote Sens. Lett. 2013, 10, 1617–1621. [Google Scholar] [CrossRef] [Green Version]
- Weather Data Retrieved from WORLD WEATHER ONLINE. 2017. Available online: https://www.worldweatheronline.com/ (accessed on 25 March 2020).
- Conradsen, K.; Nielsen, A.A.; Skriver, H. Omnibus Change Detection in Block Diagonal Covariance Matrix PolSAR Data from Sentinel-1 and Radarsat-2. 2019. in preparation. [Google Scholar]
- Nielsen, A.A.; Skriver, H.; Conradsen, K. The Loewner Order and Direction of Detected Change in Sentinel-1 and Radarsat-2 Data. IEEE Geosci. Remote Sens. Lett. 2019, 17, 242–246. [Google Scholar] [CrossRef] [Green Version]
- Schober, P.; Boer, C.; Schwarte, L.A. Correlation coefficients: Appropriate use and interpretation. Anesth. Analg. 2018, 126, 1763–1768. [Google Scholar] [CrossRef] [PubMed]
- Facebook Connectivity Lab, Center for International Earth Science Information Network, Columbia University. High Resolution Settlement Layer (HRSL); Data Source: 2016 DigitalGlobe; Colombia University: New York, NY, USA, 2016; Available online: https://www.ciesin.columbia.edu/data/hrsl/ (accessed on 26 July 2020).
Figure 1.
Sentinel-1 color composite before and after Idai. Channels encoded by, R: , G: and B: . Channels were normalized with respective means and 2 times the standard deviation. The same normalization coefficients were used for both images.
Figure 1.
Sentinel-1 color composite before and after Idai. Channels encoded by, R: , G: and B: . Channels were normalized with respective means and 2 times the standard deviation. The same normalization coefficients were used for both images.

Figure 2.
Purple dots on the Google Earth images shows a sample of the manual tags performed by UNITAR analysts. The house in the right side of the images, marked by a red square, was missed in the tagging process.
Figure 2.
Purple dots on the Google Earth images shows a sample of the manual tags performed by UNITAR analysts. The house in the right side of the images, marked by a red square, was missed in the tagging process.

Figure 3.
Changes and weather data (wind-speed, gust and precipitation) around the peak of Idai’s intensity. The counted changes are over the entire over urban area.
Figure 3.
Changes and weather data (wind-speed, gust and precipitation) around the peak of Idai’s intensity. The counted changes are over the entire over urban area.

Figure 4.
The two subplots show the counts of changes at each different time pair in RO-6 and RO-101. Counts are colored according to the Loewner measure which shows the direction of change. As there are less recordings in RO-101 there are fewer time pairs to calculate change on compared to RO-6.
Figure 4.
The two subplots show the counts of changes at each different time pair in RO-6 and RO-101. Counts are colored according to the Loewner measure which shows the direction of change. As there are less recordings in RO-101 there are fewer time pairs to calculate change on compared to RO-6.


Figure 5.
Change maps over Beira within defined residential areas according to the Unit-of-Analysis (UA) dataset at 8 different time pairs . Blue pixels means that the radar reflection increased from for both the VV, VH channels, red pixels means it decreased and in grey pixels, VV and VH showed opposite of each other. The changes shown are at a 5% significance level. Non-residential areas, like industry and the airport, are filtered out using the UA filter.

Figure 6.
When changes and manual tags are accumulated to UA grid cells, heatmaps can be produced showing the area-wise assessment of cyclones impact.
Figure 6.
When changes and manual tags are accumulated to UA grid cells, heatmaps can be produced showing the area-wise assessment of cyclones impact.


Figure 7.
Histogram of counts per UA. (a) is all changes and manual tags within UAs, (b) only changes and manual tags that intercept with a house according to OpenStreetMap (OSM).
Figure 7.
Histogram of counts per UA. (a) is all changes and manual tags within UAs, (b) only changes and manual tags that intercept with a house according to OpenStreetMap (OSM).

Figure 8.
Distribution plots of the data counts at UA level. The long-tailed distributions in (a) make it useful to Square-root transform data (b) to analyze their dependence.
Figure 8.
Distribution plots of the data counts at UA level. The long-tailed distributions in (a) make it useful to Square-root transform data (b) to analyze their dependence.

Figure 9.
Timeline of correlation between manual tags and changes. The figures show that higher correlations are observed when filtering with building footprints and that a higher correlation is achieved during the cyclone impact.
Figure 9.
Timeline of correlation between manual tags and changes. The figures show that higher correlations are observed when filtering with building footprints and that a higher correlation is achieved during the cyclone impact.


Table 1.
Spearman correlation between damages, changes, PMT-poverty score (Proxy Mean Test, from Reference [18]) and Distance to the south-east coast where Idai struck first.
Table 1.
Spearman correlation between damages, changes, PMT-poverty score (Proxy Mean Test, from Reference [18]) and Distance to the south-east coast where Idai struck first.
| Manual Tags | Changes | Poverty | Dist. to Coast | Construction Density | |
|---|---|---|---|---|---|
| Manual tags | 1.00 | 0.55 | 0.20 | −0.02 | 0.71 |
| Changes | 1.00 | 0.41 | −0.30 | 0.76 | |
| Poverty | 1.00 | −0.51 | 0.54 | ||
| Dist. to coast | 1.00 | −0.33 | |||
| Construction density | 1.00 |
© 2020 by the authors. Licensee MDPI, Basel, Switzerland. This article is an open access article distributed under the terms and conditions of the Creative Commons Attribution (CC BY) license (http://creativecommons.org/licenses/by/4.0/).
Share and Cite
MDPI and ACS Style
Malmgren-Hansen, D.; Sohnesen, T.; Fisker, P.; Baez, J. Sentinel-1 Change Detection Analysis for Cyclone Damage Assessment in Urban Environments. Remote Sens. 2020, 12, 2409. https://0-doi-org.brum.beds.ac.uk/10.3390/rs12152409
AMA Style
Malmgren-Hansen D, Sohnesen T, Fisker P, Baez J. Sentinel-1 Change Detection Analysis for Cyclone Damage Assessment in Urban Environments. Remote Sensing. 2020; 12(15):2409. https://0-doi-org.brum.beds.ac.uk/10.3390/rs12152409
Chicago/Turabian StyleMalmgren-Hansen, David, Thomas Sohnesen, Peter Fisker, and Javier Baez. 2020. "Sentinel-1 Change Detection Analysis for Cyclone Damage Assessment in Urban Environments" Remote Sensing 12, no. 15: 2409. https://0-doi-org.brum.beds.ac.uk/10.3390/rs12152409
Note that from the first issue of 2016, this journal uses article numbers instead of page numbers. See further details here.