Generating Anchor Boxes Based on Attention Mechanism for Object Detection in Remote Sensing Images

 ,
,
Abstract
:
1. Introduction
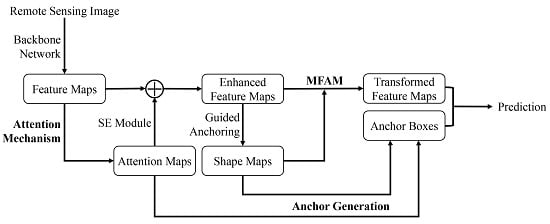
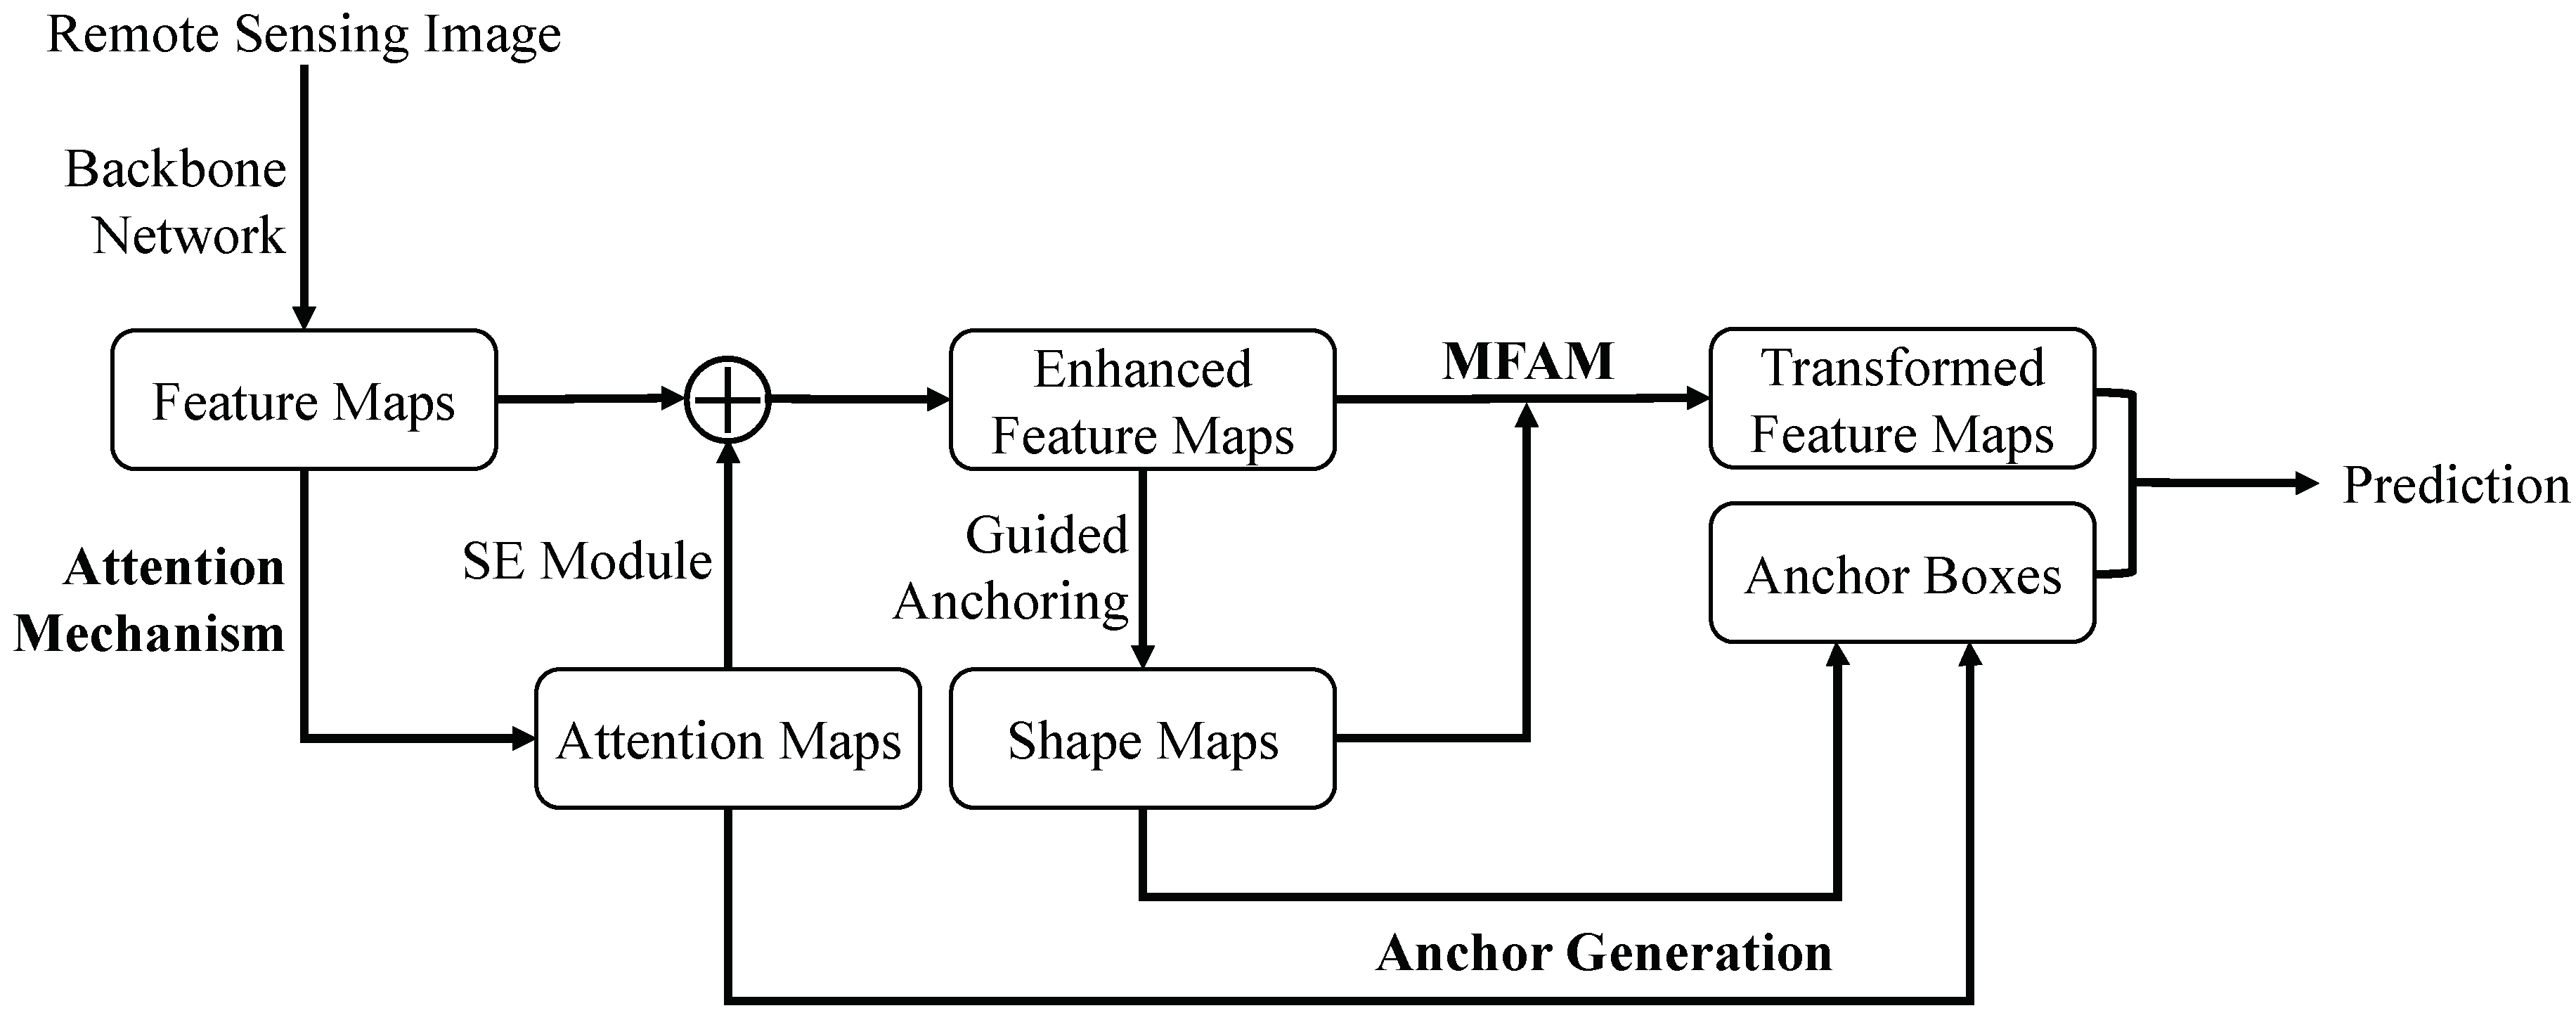
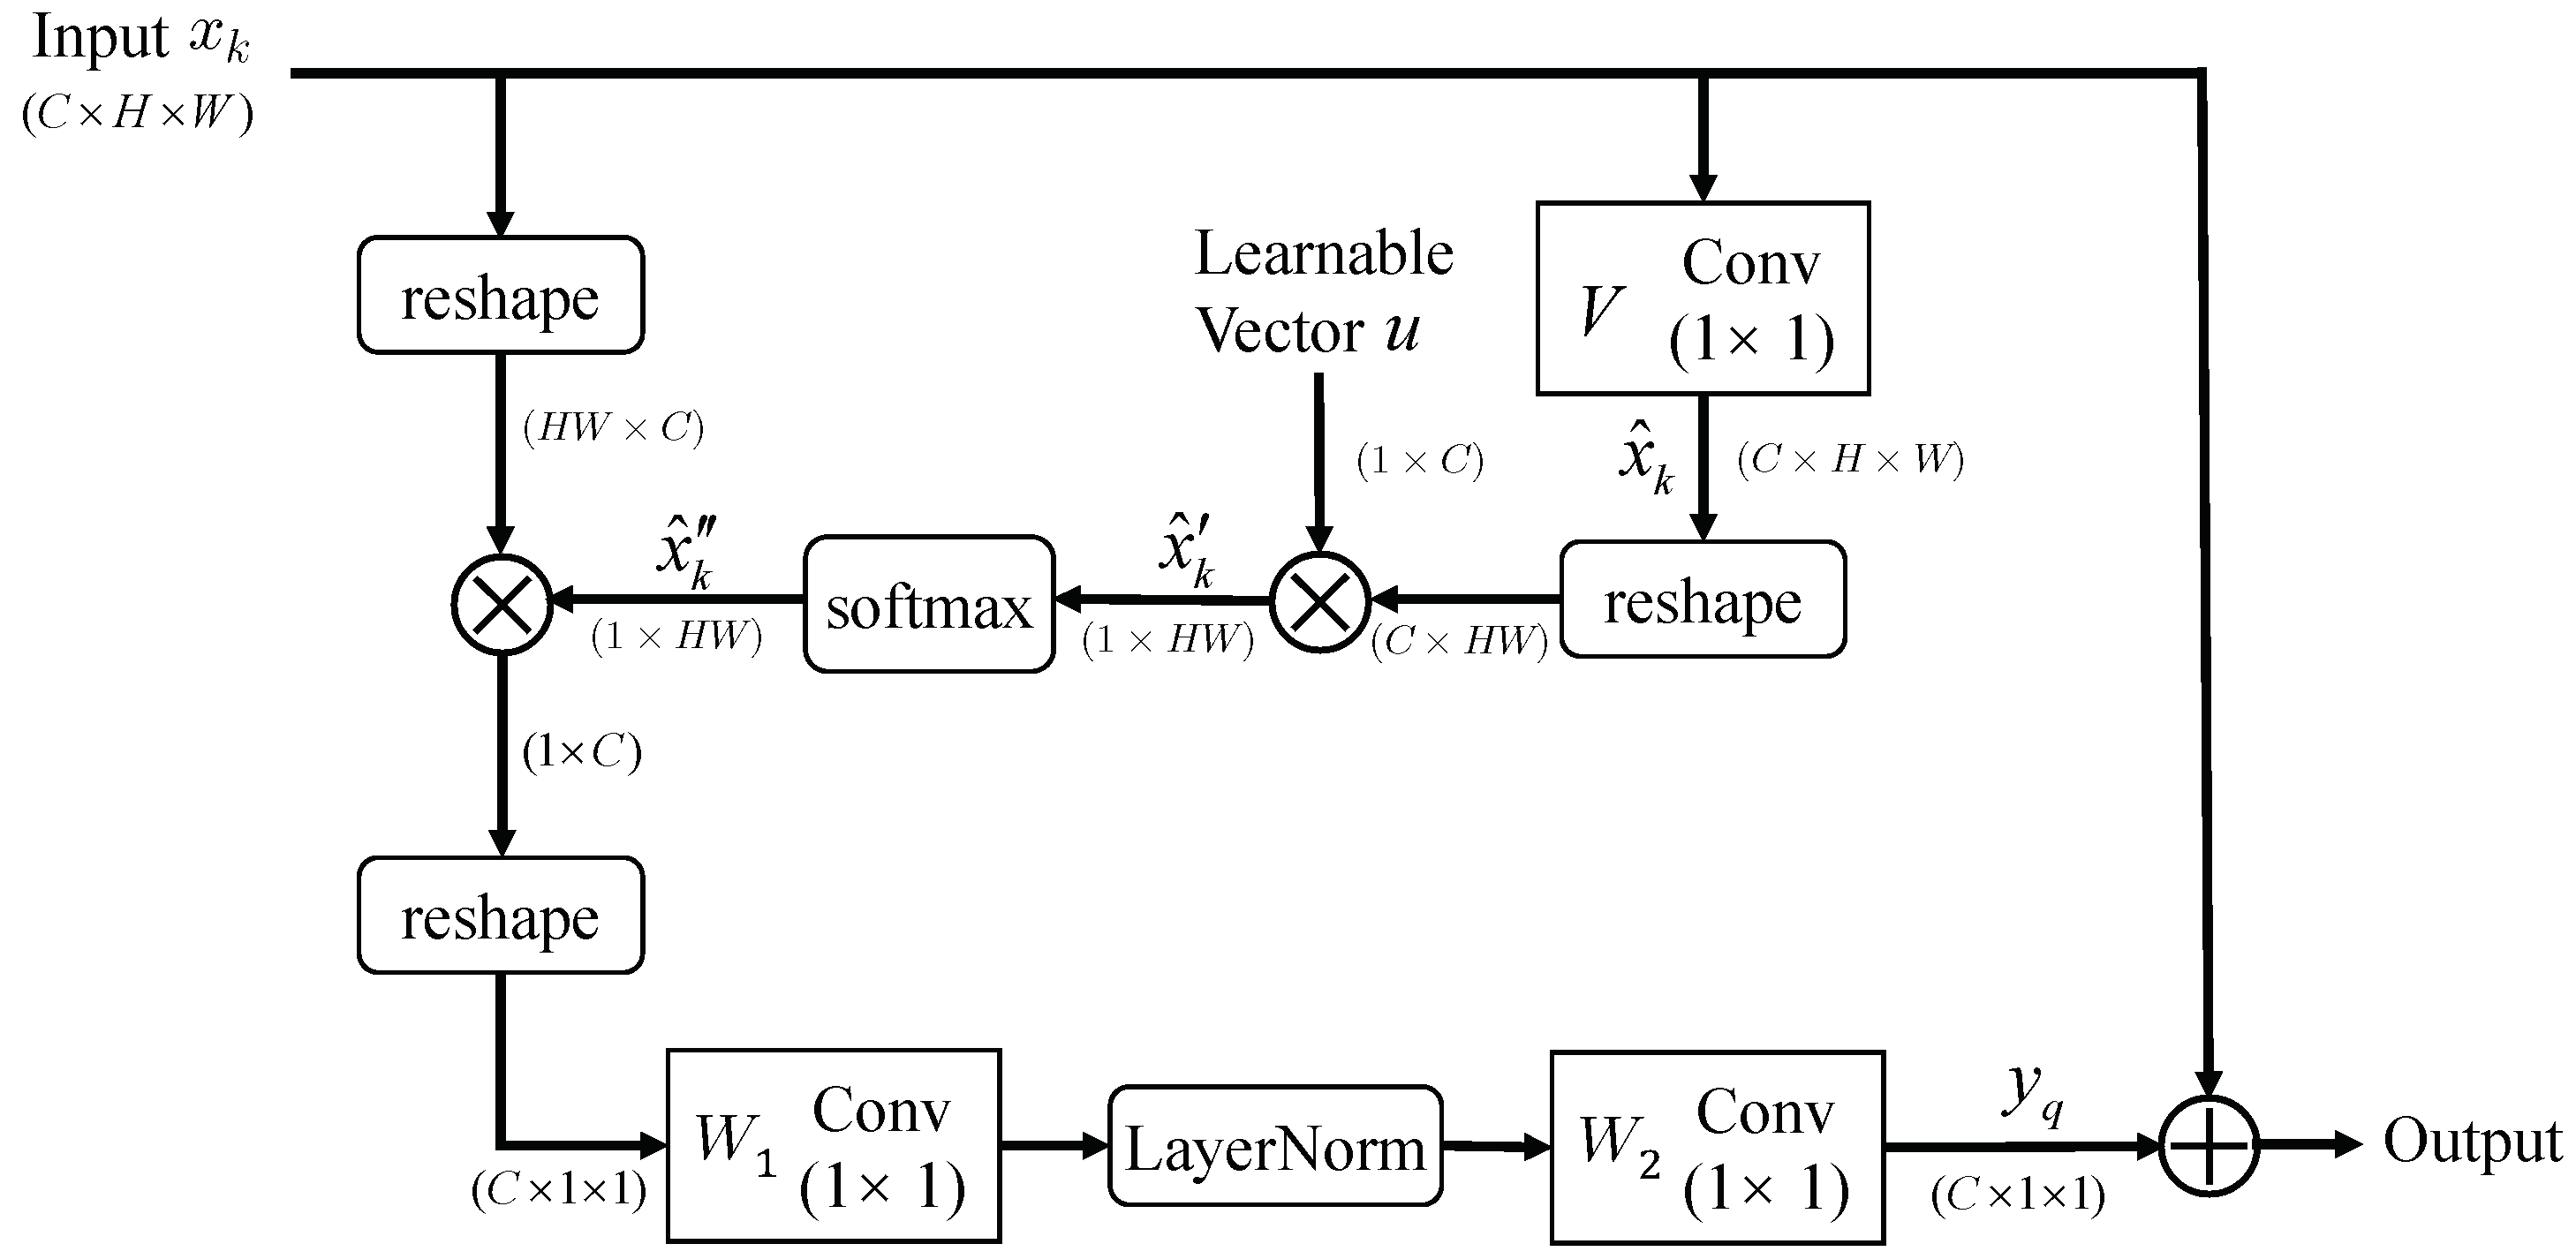
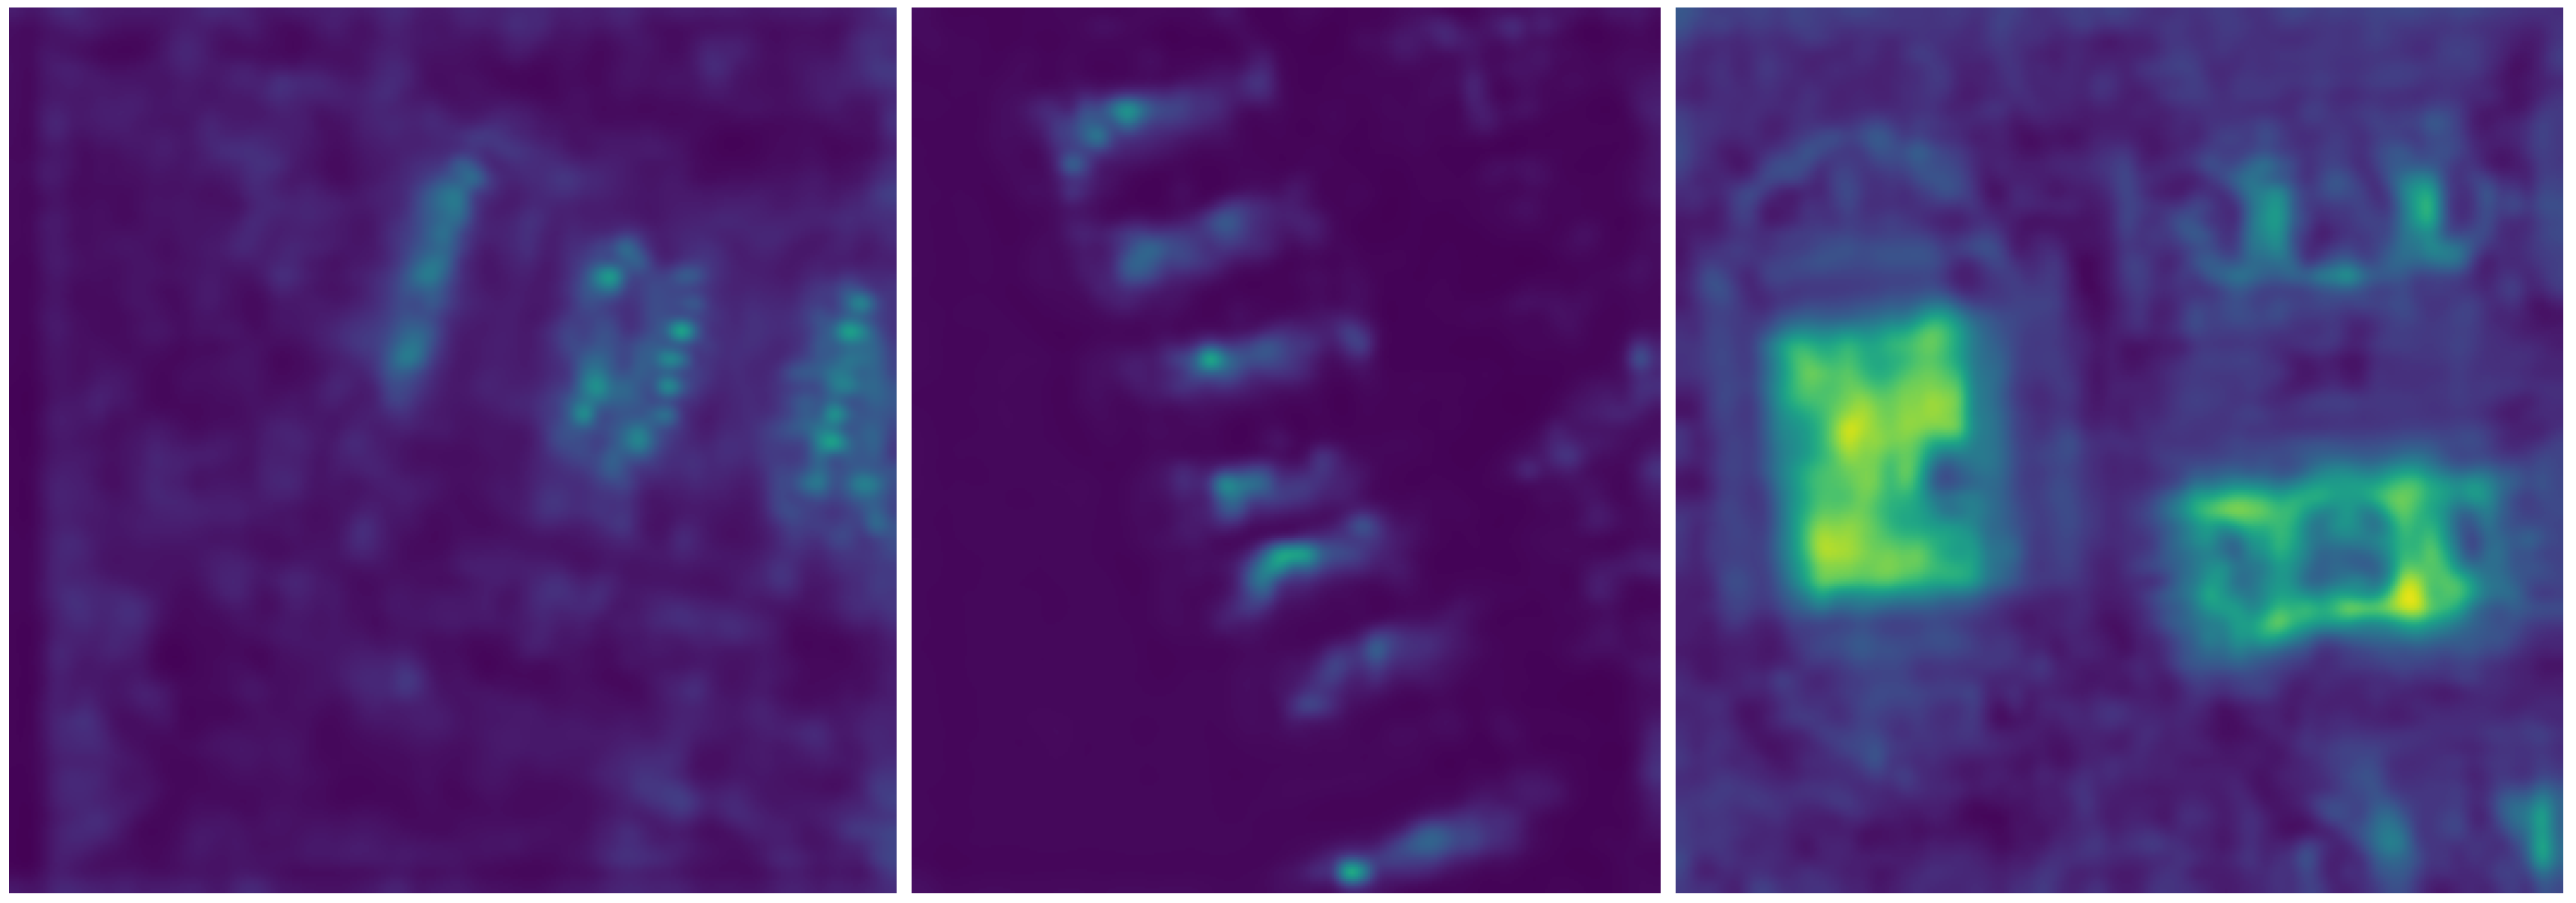
- In general, remote sensing images contain large scenes and sparse objects. In the CNN for feature extraction, the weights of different positional features are the same and the network pays uniform attention to them. However, there are many background areas in the scene, which may interfere with object detection and lead to false predictions. Therefore, we apply the attention mechanism into the proposed method to adjust the weights of the features. The generated attention map can be regarded as the spatial weights of different positions on feature maps. It can make the network pay more attention to the object area rather than the background area. The weighted feature maps are used to model the channel-wise dependencies, which can selectively enhance the informative feature channels, thereby improving the feature maps.
- In most RCNN-based methods, the anchor boxes used to generate proposal boxes are preset with sliding windows and fixed shapes. However, the fixed shapes can not fit the diverse objects in remote sensing images. In this paper, we think that the generated attention map can also reflect the location of the object, and use the attention map to predict the positions of the anchor boxes. The guided anchoring method is incorporated into the proposed detection framework to predict the corresponding shapes of the anchor boxes.
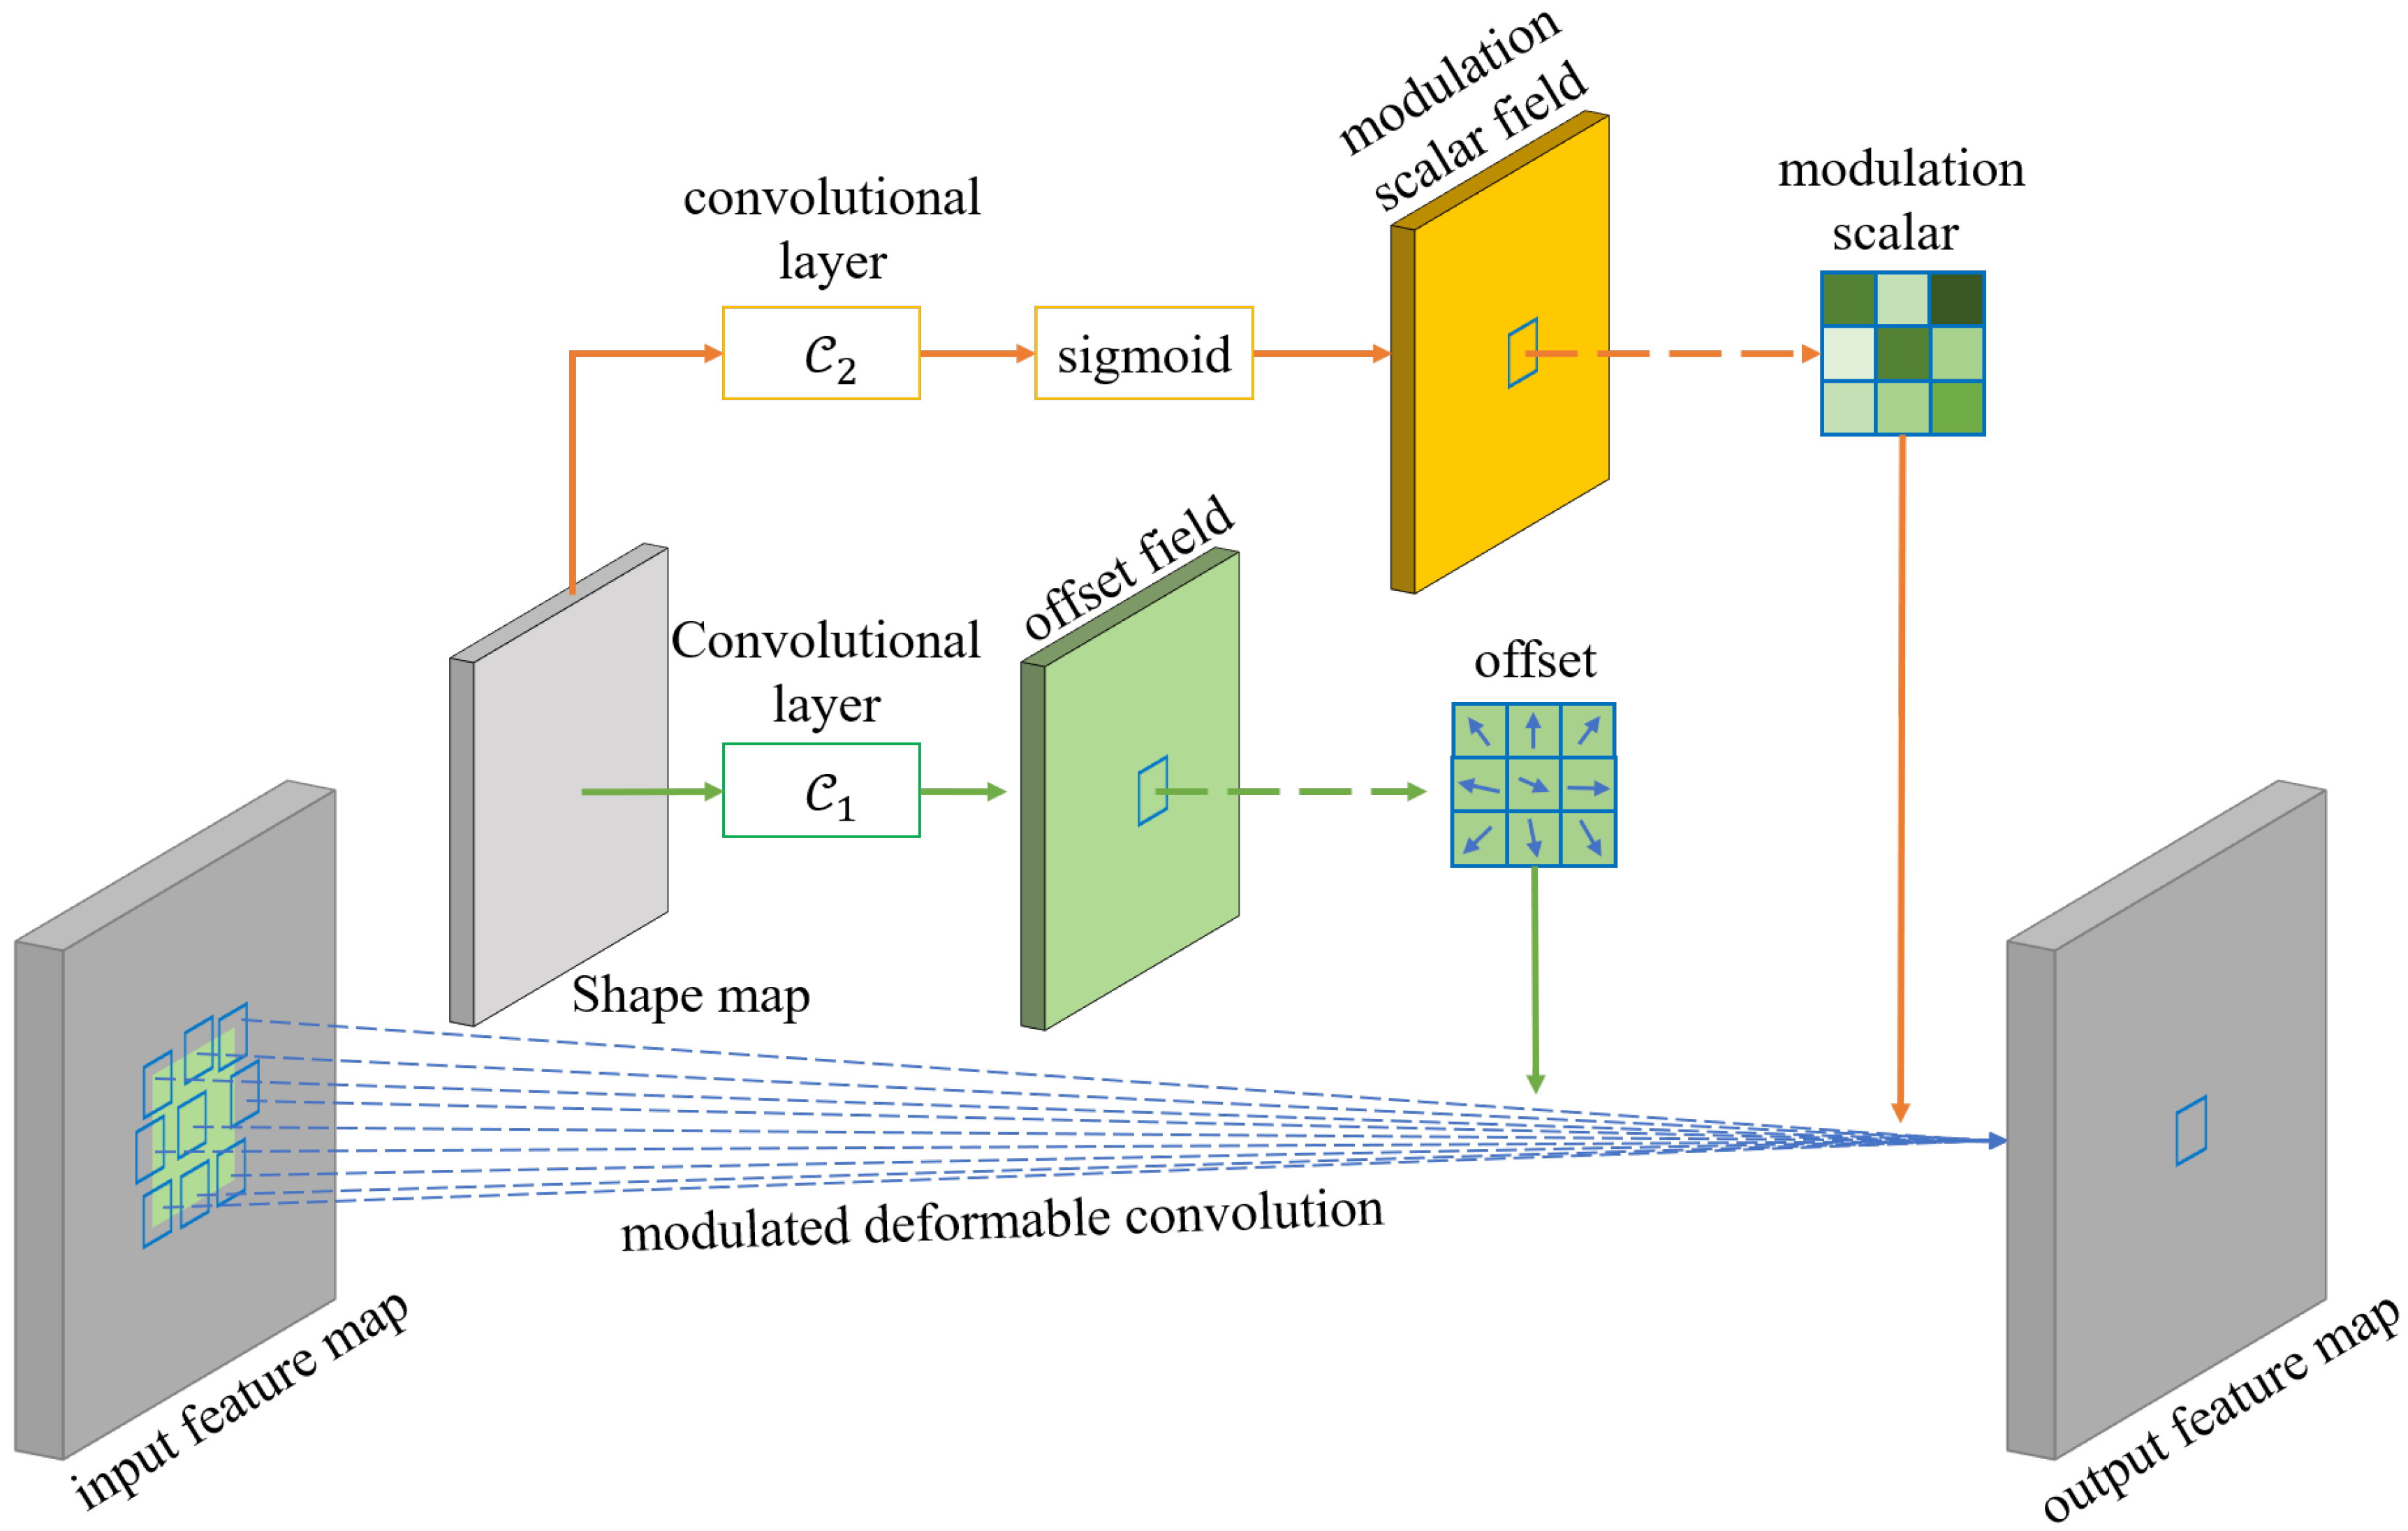
- In order to make the feature maps match better with the generated anchor boxes, as well as get more effective regional features, we adopt a modulated feature adaptation module (MFAM) to transform the feature maps. The module first calculates the offset and modulation scalar according to the predicted shape maps of anchor boxes. The modulated deformable convolutional layer [17] is used to produce the transformed feature maps, which are more matched with the anchor boxes.
2. Related Work
2.1. Attention Mechanism
2.2. Generation Methods of Proposal Box
3. Method
3.1. Overall Detection Framework
3.2. Attention Mechanism
3.3. Anchor Generation
3.4. Modulated Feature Adaptation Module
4. Experiments and Results
4.1. Data Preparation
4.2. Evaluation Metrics
4.3. Implementation Details
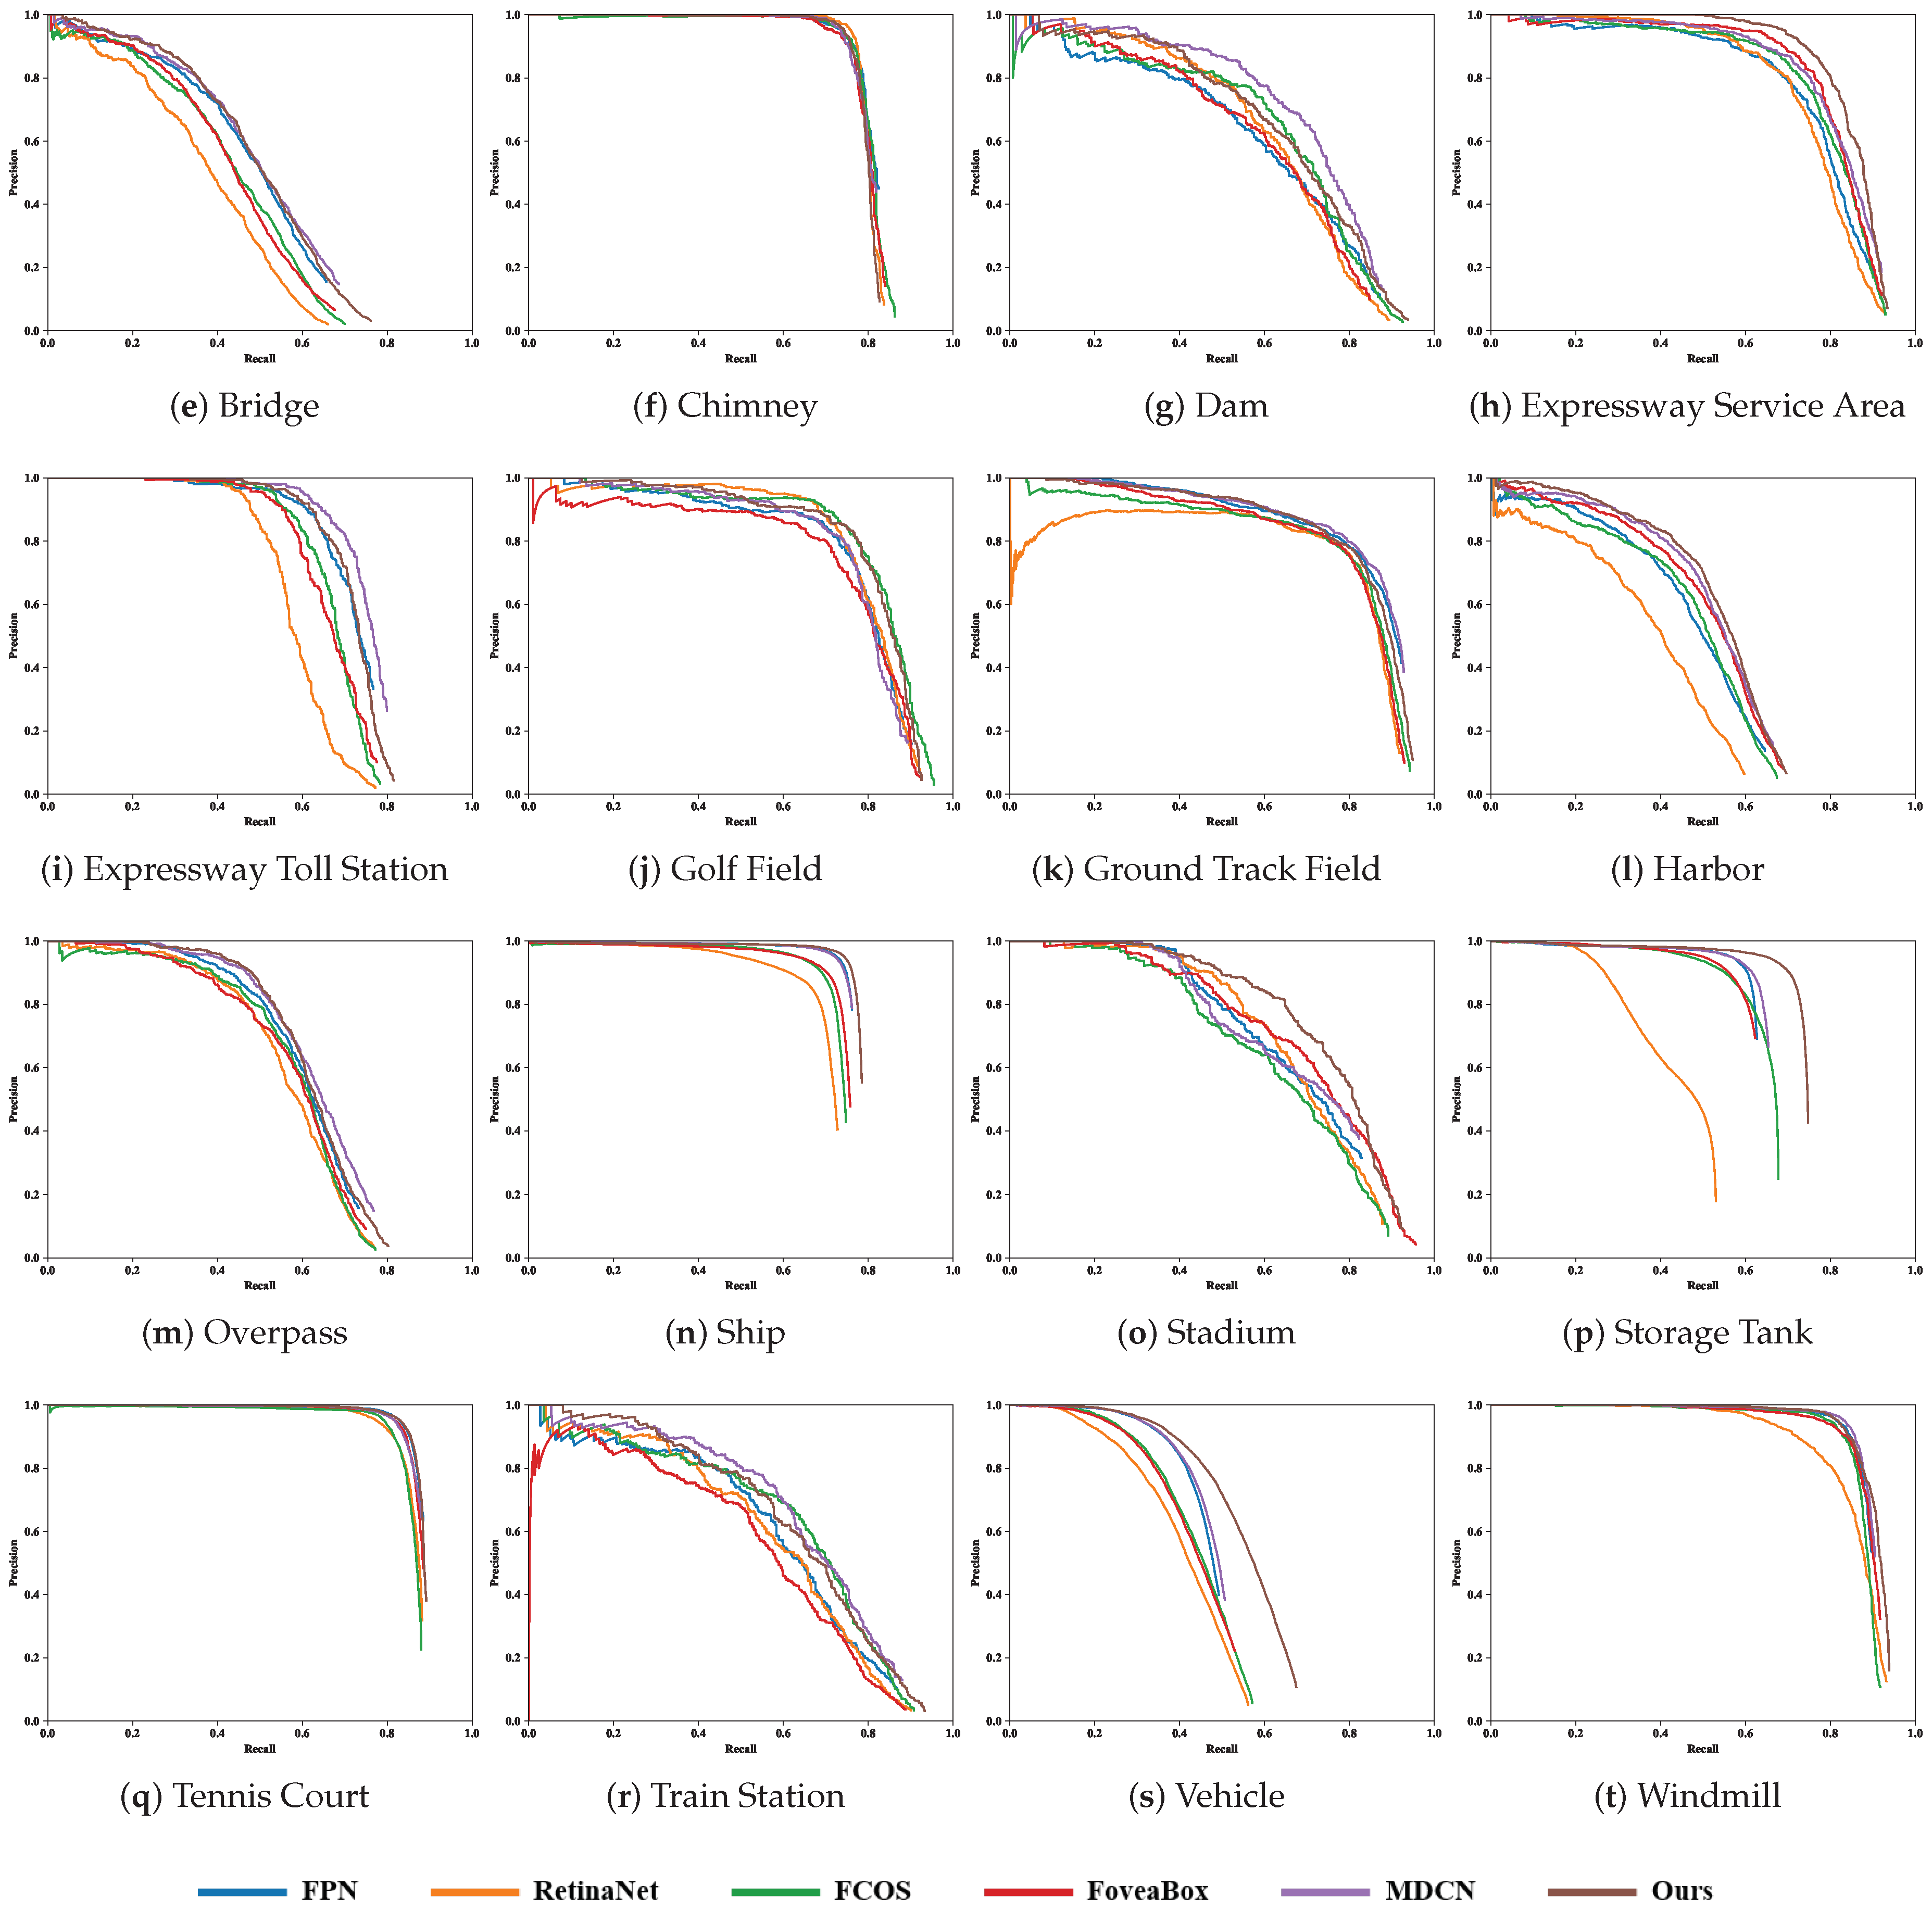
4.4. Comparison with the State-of-the-Art
- FPN. As the foundation of the proposed method, FPN is the baseline for comparison. Therefore, except for the improved parts, all the settings of FPN are the same as the proposed method. As for the generation of the proposal boxes, RPN is adopted in FPN.
- RetinaNet. RetinaNet is a one-stage method based on FPN, and the backbone network is ResNet-50. The backbone network attaches two subnetworks, which are used to classify and regress anchor boxes, respectively. The anchor scales are and the aspect ratios are . The main contribution of RetinaNet is that focal loss is proposed to ease the imbalance between positive and negative samples.
- FCOS. FCOS is an anchor-free method, which directly regresses the target bounding box for each location. FCOS detects different sizes of objects on different levels of feature maps following FPN. In addition, it also adds a single-layer branch to predict the center-ness of the location to suppress the low-quality detected bounding boxes. The backbone network is ResNet-50.
- FoveaBox. FoveaBox is also an anchor-free method. It directly learns the objects by predicting category-sensitive semantic maps for the object existing possibility and producing a category-agnostic bounding box for each position that potentially contains an object. FoveaBox divides the scales of objects into several bins according to the number of feature pyramid levels, and every feature pyramid learns to be responsive to objects of particular scales.
- MDCN. Modulated deformable convolutional layer is an important component of the proposed method, and plays a key role in the transformation of the feature map. For this reason, we use MDCN [17], which proposes a modulated deformable convolutional layer as one of the comparison methods. It is worth noting that although modulated deformable convolutional layers are used in both the proposed method and MDCN, their locations and purposes are different. MDCN mainly applies the deformable convolution in the backbone network to make the extracted feature focus on pertinent image regions. However, the proposed method adopts the deformable convolution in the guided anchoring block to make the feature match better with the generated anchor boxes.
- SSD. SSD is a one-stage method, which extracts the feature maps of different scales from the images for detection. The proposal boxes are obtained by densely sampling on the feature map. There are multiple anchor boxes of different scales and aspect ratios in each sampled position. The features of the anchor boxes are classified and regressed by CNN. In this experiment, SSD uses VGG-16 [45] as the backbone network.
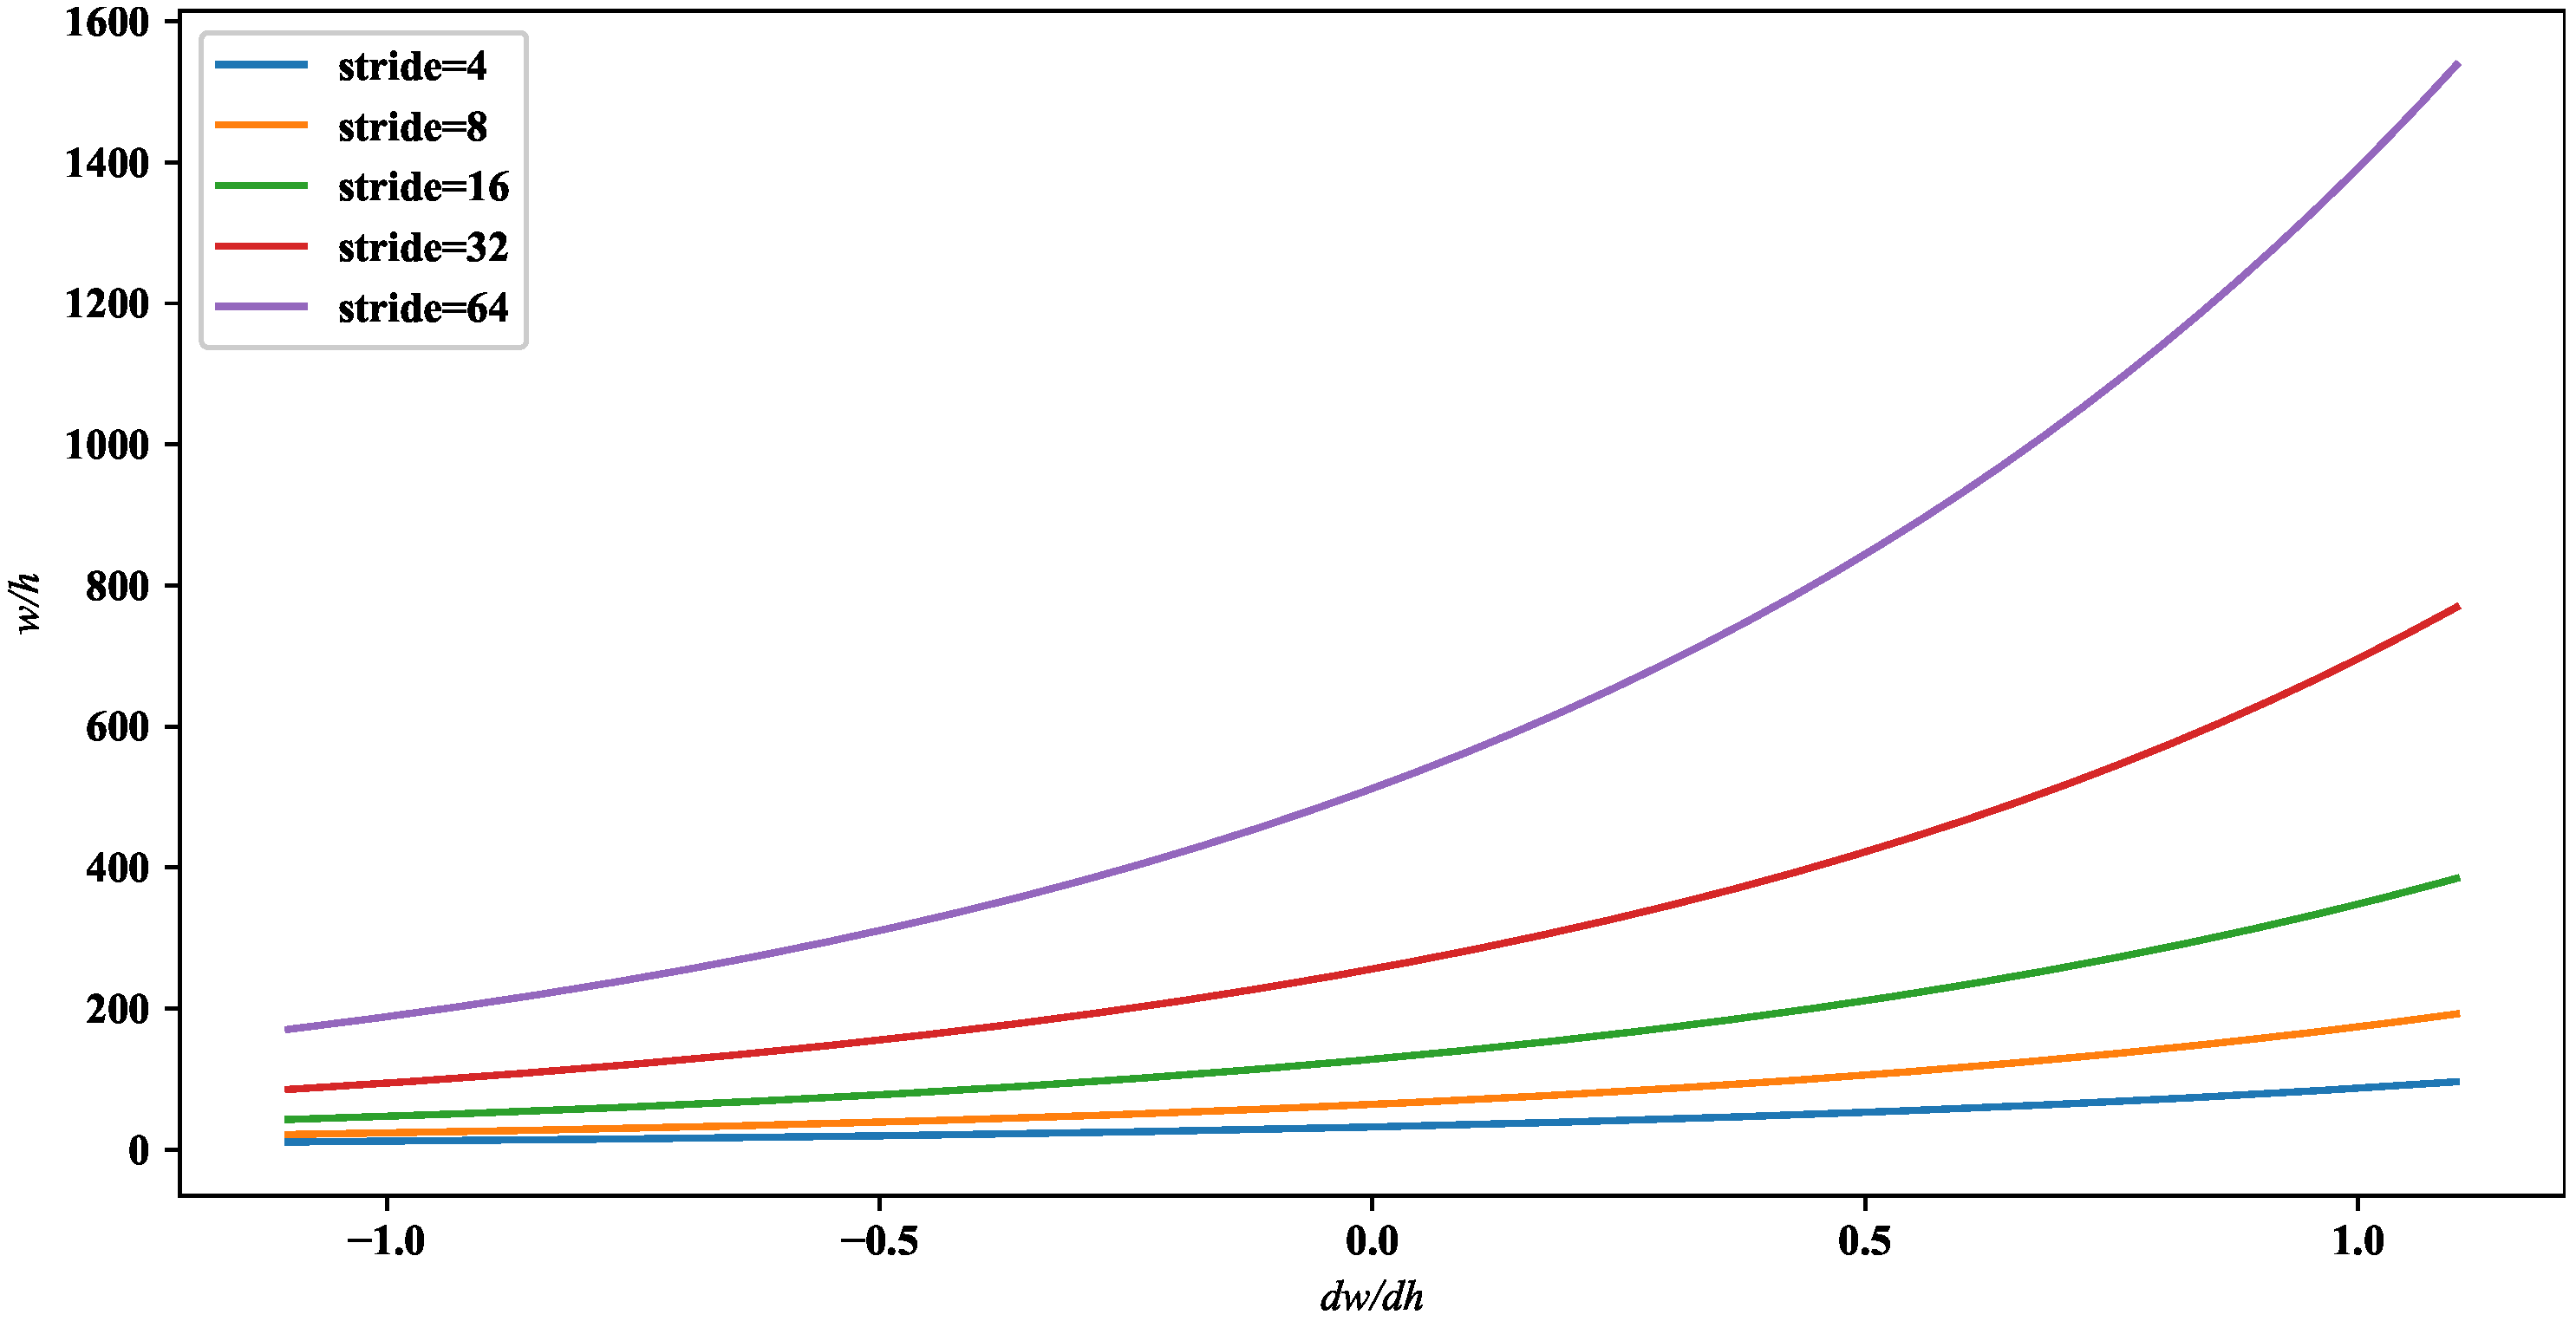
- YOLOv3. YOLOv3 is an improved version of YOLO and it has a higher mAP than the original one. It predicts the width and height of the box as offsets from cluster centroids, and then predicts the center coordinates of the box relative to the location of filter application using a sigmoid function. After obtaining the predicted boxes, YOLOv3 also predicts the corresponding classes for the bounding boxes by a softmax classifier. YOLOv3 uses Darknet-53 as the backbone network.
- CornerNet. CornerNet detects an object bounding box as a pair of key points, namely the top-left corner and the bottom-right corner. This method does not need to design anchor boxes commonly used in deep-learning-based object detection methods, but it is required to group the corners based on the predicted embedding vectors.
5. Discussion
6. Conclusions
Author Contributions
Funding
Conflicts of Interest
References
- Shi, Z.; Yu, X.; Jiang, Z.; Li, B. Ship Detection in High-Resolution Optical Imagery Based on Anomaly Detector and Local Shape Feature. IEEE Trans. Geosci. Remote Sens. 2014, 52, 4511–4523. [Google Scholar]
- Zhang, W.; Sun, X.; Wang, H.; Fu, K. A generic discriminative part-based model for geospatial object detection in optical remote sensing images. ISPRS J. Photogramm. Remote Sens. 2015, 99, 30–44. [Google Scholar] [CrossRef]
- Bai, X.; Zhang, H.; Zhou, J. VHR Object Detection Based on Structural Feature Extraction and Query Expansion. IEEE Trans. Geosci. Remote Sens. 2014, 52, 6508–6520. [Google Scholar]
- Cheng, G.; Han, J.; Zhou, P.; Guo, L. Scalable multi-class geospatial object detection in high-spatial-resolution remote sensing images. In Proceedings of the 2014 IEEE Geoscience and Remote Sensing Symposium, Quebec City, QC, Canada, 13–18 July 2014; pp. 2479–2482. [Google Scholar]
- Cheng, G.; Zhou, P.; Han, J. Learning Rotation-Invariant Convolutional Neural Networks for Object Detection in VHR Optical Remote Sensing Images. IEEE Trans. Geosci. Remote Sens. 2016, 54, 7405–7415. [Google Scholar] [CrossRef]
- Li, Q.; Mou, L.; Liu, Q.; Wang, Y.; Zhu, X.X. HSF-Net: Multiscale Deep Feature Embedding for Ship Detection in Optical Remote Sensing Imagery. IEEE Trans. Geosci. Remote Sens. 2018, 56, 7147–7161. [Google Scholar] [CrossRef]
- Ding, J.; Xue, N.; Long, Y.; Xia, G.S.; Lu, Q. Learning RoI Transformer for Oriented Object Detection in Aerial Images. In Proceedings of the IEEE Conference on Computer Vision and Pattern Recognition (CVPR), Long Beach, CA, USA, 15–20 June 2019. [Google Scholar]
- Li, S.; Xu, Y.; Zhu, M.; Ma, S.; Tang, H. Remote Sensing Airport Detection Based on End-to-End Deep Transferable Convolutional Neural Networks. IEEE Geosci. Remote Sens. Lett. 2019, 16, 1640–1644. [Google Scholar] [CrossRef]
- Redmon, J.; Divvala, S.; Girshick, R.; Farhadi, A. You Only Look Once: Unified, Real-Time Object Detection. In Proceedings of the IEEE Conference on Computer Vision and Pattern Recognition (CVPR), Las Vegas, NV, USA, 27–30 June 2016. [Google Scholar]
- Redmon, J.; Farhadi, A. YOLO9000: Better, Faster, Stronger. In Proceedings of the IEEE Conference on Computer Vision and Pattern Recognition (CVPR), Honolulu, HI, USA, 21–26 July 2017. [Google Scholar]
- Joseph, R.; Ali, F. YOLOv3: An Incremental Improvement. arXiv 2018, arXiv:cs.CV/1804.02767. [Google Scholar]
- Liu, W.; Anguelov, D.; Erhan, D.; Szegedy, C.; Reed, S.; Fu, C.Y.; Berg, A.C. SSD: Single Shot MultiBox Detector. In Computer Vision—ECCV 2016; Leibe, B., Matas, J., Sebe, N., Welling, M., Eds.; Springer International Publishing: Cham, Switzerland, 2016; pp. 21–37. [Google Scholar]
- Lin, T.; Goyal, P.; Girshick, R.; He, K.; Dollár, P. Focal Loss for Dense Object Detection. In Proceedings of the 2017 IEEE International Conference on Computer Vision (ICCV), Venice, Italy, 22–29 October 2017; pp. 2999–3007. [Google Scholar] [CrossRef] [Green Version]
- Girshick, R.; Donahue, J.; Darrell, T.; Malik, J. Rich Feature Hierarchies for Accurate Object Detection and Semantic Segmentation. In Proceedings of the 2014 IEEE Conference on Computer Vision and Pattern Recognition, Columbus, OH, USA, 23–28 June 2014; pp. 580–587. [Google Scholar] [CrossRef] [Green Version]
- Uijlings, J.R.R.; van de Sande, K.E.A.; Gevers, T.; Smeulders, A.W.M. Selective Search for Object Recognition. Int. J. Comput. Vis. 2013, 104, 154–171. [Google Scholar] [CrossRef] [Green Version]
- Ren, S.; He, K.; Girshick, R.; Sun, J. Faster R-CNN: Towards Real-Time Object Detection with Region Proposal Networks. In Advances in Neural Information Processing Systems 28; Cortes, C., Lawrence, N.D., Lee, D.D., Sugiyama, M., Garnett, R., Eds.; Curran Associates, Inc.: Red Hook, NY, USA, 2015; pp. 91–99. [Google Scholar]
- Zhu, X.; Hu, H.; Lin, S.; Dai, J. Deformable ConvNets v2: More Deformable, Better Results. arXiv 2018, arXiv:cs.CV/1811.11168. [Google Scholar]
- Cheng, G.; Han, J. A survey on object detection in optical remote sensing images. ISPRS J. Photogramm. Remote Sens. 2016, 117, 11–28. [Google Scholar] [CrossRef] [Green Version]
- Grabner, H.; Nguyen, T.T.; Gruber, B.; Bischof, H. On-line boosting-based car detection from aerial images. ISPRS J. Photogramm. Remote Sens. 2008, 63, 382–396. [Google Scholar] [CrossRef]
- Yang, J.; Yu, P.; Kuo, B. A Nonparametric Feature Extraction and Its Application to Nearest Neighbor Classification for Hyperspectral Image Data. IEEE Trans. Geosci. Remote Sens. 2010, 48, 1279–1293. [Google Scholar] [CrossRef]
- Lang, F.; Yang, J.; Yan, S.; Qin, F. Superpixel Segmentation of Polarimetric Synthetic Aperture Radar (SAR) Images Based on Generalized Mean Shift. Remote Sens. 2018, 10, 1592. [Google Scholar] [CrossRef] [Green Version]
- Ciecholewski, M. River Channel Segmentation in Polarimetric SAR Images. Expert Syst. Appl. 2017, 82, 196–215. [Google Scholar] [CrossRef]
- Braga, A.M.; Marques, R.C.P.; Rodrigues, F.A.A.; Medeiros, F.N.S. A Median Regularized Level Set for Hierarchical Segmentation of SAR Images. IEEE Geosci. Remote Sens. Lett. 2017, 14, 1171–1175. [Google Scholar] [CrossRef]
- Jin, R.; Yin, J.; Zhou, W.; Yang, J. Level Set Segmentation Algorithm for High-Resolution Polarimetric SAR Images Based on a Heterogeneous Clutter Model. IEEE J. Sel. Top. Appl. Earth Obs. Remote Sens. 2017, 10, 4565–4579. [Google Scholar] [CrossRef]
- Pang, J.; Li, C.; Shi, J.; Xu, Z.; Feng, H. -CNN: Fast Tiny Object Detection in Large-Scale Remote Sensing Images. IEEE Trans. Geosci. Remote Sens. 2019, 57, 5512–5524. [Google Scholar] [CrossRef] [Green Version]
- Wang, X.; Girshick, R.; Gupta, A.; He, K. Non-local Neural Networks. In Proceedings of the 2018 IEEE/CVF Conference on Computer Vision and Pattern Recognition, Salt Lake City, UT, USA, 18–23 June 2018; pp. 7794–7803. [Google Scholar] [CrossRef] [Green Version]
- Huang, Z.; Wang, X.; Huang, L.; Huang, C.; Wei, Y.; Liu, W. CCNet: Criss-Cross Attention for Semantic Segmentation. arXiv 2018, arXiv:cs.CV/1811.11721v1. [Google Scholar]
- Cao, Y.; Xu, J.; Lin, S.; Wei, F.; Hu, H. GCNet: Non-local Networks Meet Squeeze-Excitation Networks and Beyond. arXiv 2019, arXiv:cs.CV/1904.11492. [Google Scholar]
- Hu, J.; Shen, L.; Sun, G. Squeeze-and-Excitation Networks. In Proceedings of the 2018 IEEE/CVF Conference on Computer Vision and Pattern Recognition, Salt Lake City, UT, USA, 18–23 June 2018; pp. 7132–7141. [Google Scholar] [CrossRef] [Green Version]
- Sermanet, P.; Eigen, D.; Zhang, X.; Mathieu, M.; Fergus, R.; LeCun, Y. OverFeat: Integrated Recognition, Localization and Detection using Convolutional Networks. arXiv 2013, arXiv:cs.CV/1312.6229v4. [Google Scholar]
- Felzenszwalb, P.F.; Huttenlocher, D.P. Efficient Graph-Based Image Segmentation. Int. J. Comput. Vis. 2004, 59, 167–181. [Google Scholar] [CrossRef]
- Law, H.; Deng, J. CornerNet: Detecting Objects as Paired Keypoints. In Computer Vision—ECCV 2018; Ferrari, V., Hebert, M., Sminchisescu, C., Weiss, Y., Eds.; Springer International Publishing: Cham, Switzerland, 2018; pp. 765–781. [Google Scholar]
- Duan, K.; Bai, S.; Xie, L.; Qi, H.; Huang, Q.; Tian, Q. CenterNet: Keypoint Triplets for Object Detection. arXiv 2019, arXiv:cs.CV/1904.08189v3. [Google Scholar]
- Zhou, X.; Zhuo, J.; Krahenbuhl, P. Bottom-Up Object Detection by Grouping Extreme and Center Points. In Proceedings of the IEEE Conference on Computer Vision and Pattern Recognition (CVPR), Long Beach, CA, USA, 16–20 June 2019. [Google Scholar]
- Zhu, X.; Cheng, D.; Zhang, Z.; Lin, S.; Dai, J. An Empirical Study of Spatial Attention Mechanisms in Deep Networks. arXiv 2019, arXiv:cs.CV/1904.05873. [Google Scholar]
- Ba, J.L.; Kiros, J.R.; Hinton, G.E. Layer Normalization. arXiv 2016, arXiv:stat.ML/1607.06450. [Google Scholar]
- Wang, J.; Chen, K.; Yang, S.; Loy, C.C.; Lin, D. Region Proposal by Guided Anchoring. In Proceedings of the IEEE Conference on Computer Vision and Pattern Recognition (CVPR), Long Beach, CA, USA, 16–20 June 2019. [Google Scholar]
- Li, K.; Wan, G.; Cheng, G.; Meng, L.; Han, J. Object detection in optical remote sensing images: A survey and a new benchmark. ISPRS J. Photogramm. Remote Sens. 2020, 159, 296–307. [Google Scholar] [CrossRef]
- Chen, K.; Wang, J.; Pang, J.; Cao, Y.; Xiong, Y.; Li, X.; Sun, S.; Feng, W.; Liu, Z.; Xu, J.; et al. MMDetection: Open MMLab Detection Toolbox and Benchmark. arXiv 2019, arXiv:cs.CV/1906.07155. [Google Scholar]
- He, K.; Zhang, X.; Ren, S.; Sun, J. Deep Residual Learning for Image Recognition. In Proceedings of the 2016 IEEE Conference on Computer Vision and Pattern Recognition (CVPR), Las Vegas, NV, USA, 27–30 June 2016; pp. 770–778. [Google Scholar] [CrossRef] [Green Version]
- Lin, T.; Dollár, P.; Girshick, R.; He, K.; Hariharan, B.; Belongie, S. Feature Pyramid Networks for Object Detection. In Proceedings of the 2017 IEEE Conference on Computer Vision and Pattern Recognition (CVPR), Honolulu, HI, USA, 21–26 July 2017; pp. 936–944. [Google Scholar] [CrossRef] [Green Version]
- He, K.; Gkioxari, G.; Dollar, P.; Girshick, R. Mask R-CNN. In Proceedings of the IEEE International Conference on Computer Vision (ICCV), Venice, Italy, 22–29 October 2017. [Google Scholar]
- Tian, Z.; Shen, C.; Chen, H.; He, T. FCOS: Fully Convolutional One-Stage Object Detection. Available online: https://arxiv.org/abs/1904.01355v5 (accessed on 2 April 2019).
- Kong, T.; Sun, F.; Liu, H.; Jiang, Y.; Shi, J. FoveaBox: Beyond Anchor-based Object Detector. Available online: https://arxiv.org/abs/1904.03797v1 (accessed on 8 April 2019).
- Simonyan, K.; Zisserman, A. Very Deep Convolutional Networks for Large-Scale Image Recognition 2014. Available online: https://arxiv.org/abs/1409.1556 (accessed on 4 September 2014).


| Categories | FPN | RetinaNet | FCOS | FoveaBox | MDCN | CornerNet | SSD | YOLOv3 | Ours |
|---|---|---|---|---|---|---|---|---|---|
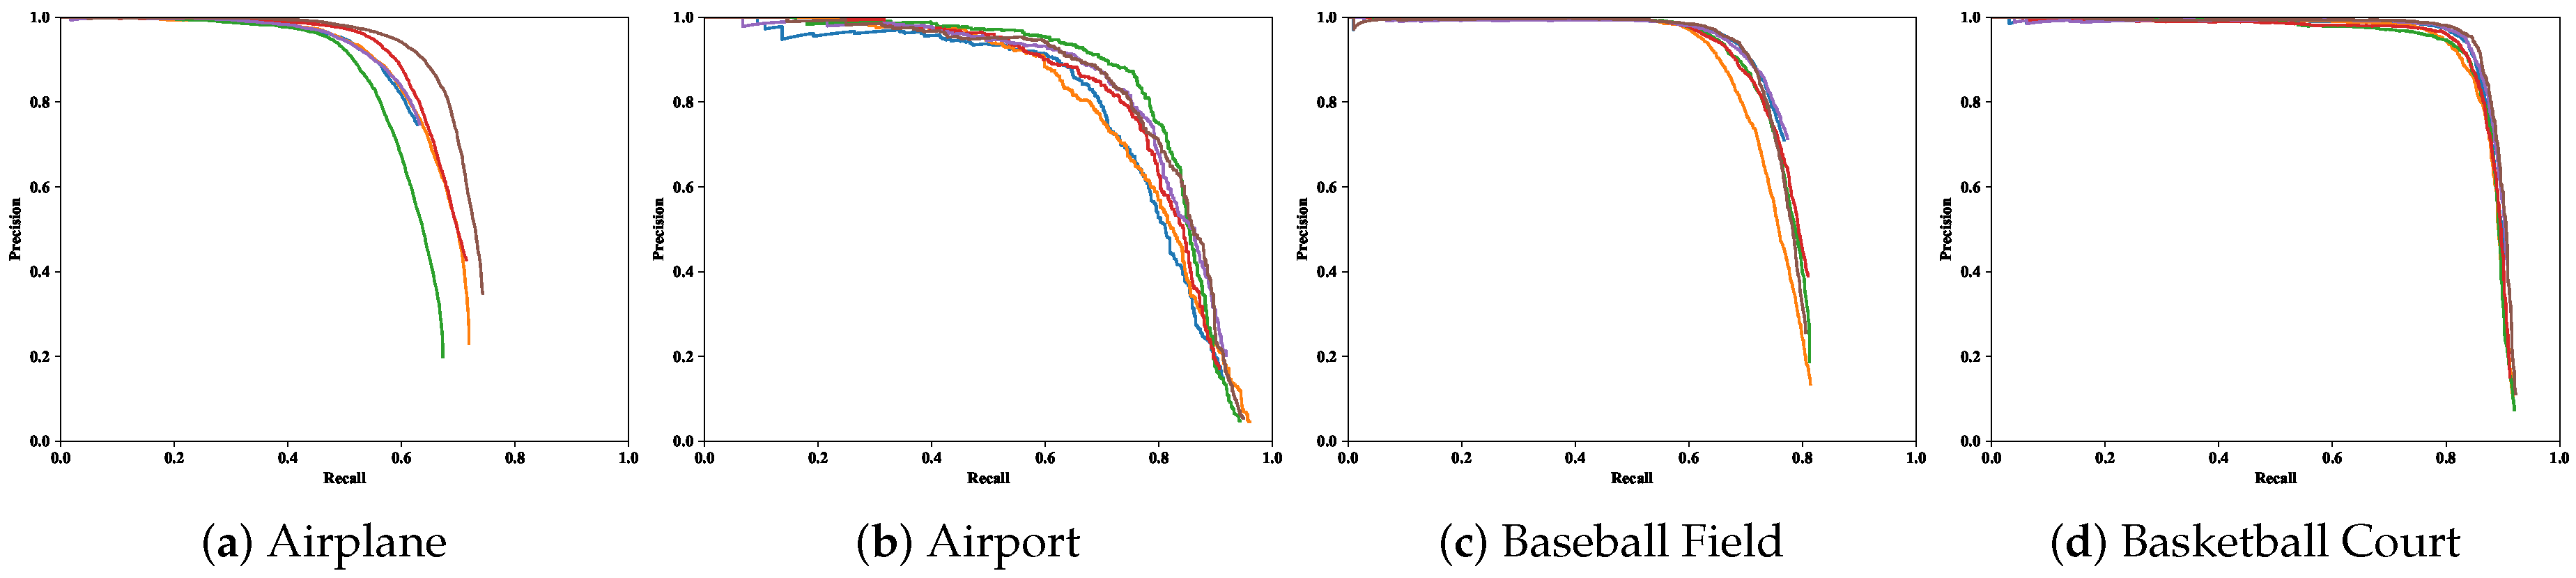
| Airplane | 60.7 | 66.1 | 61.1 | 66.9 | 61.1 | 58.8 | 59.5 | 72.2 | 70.5 |
| Airport | 77.0 | 78.4 | 82.6 | 79.6 | 81.2 | 84.2 | 72.7 | 29.2 | 81.9 |
| Baseball Field | 74.9 | 74.4 | 76.6 | 76.7 | 75.3 | 72.0 | 72.4 | 74 | 76.5 |
| BC | 87.9 | 87.8 | 87.6 | 87.6 | 88.6 | 80.8 | 75.7 | 78.6 | 89.3 |
| Bridge | 46.4 | 37.2 | 42.8 | 42.7 | 48.5 | 46.4 | 29.7 | 31.2 | 49.0 |
| Chimney | 80.2 | 80.2 | 80.6 | 79.8 | 79.6 | 75.3 | 65.8 | 69.7 | 79.5 |
| Dam | 60.0 | 63.1 | 64.1 | 60.6 | 70.1 | 64.3 | 56.6 | 26.9 | 66.0 |
| ESA | 76.7 | 76.7 | 79.1 | 81.1 | 81.1 | 81.6 | 63.5 | 48.6 | 85.2 |
| ETS | 70.6 | 58.8 | 67.2 | 66.4 | 74.4 | 76.3 | 53.1 | 54.4 | 71.9 |
| Golf Course | 77.3 | 79.9 | 82.0 | 74.5 | 77.4 | 79.5 | 65.3 | 31.1 | 81.2 |
| GTF | 83.2 | 76.4 | 79.6 | 80.3 | 84.0 | 79.5 | 68.6 | 61.1 | 83.3 |
| Harbor | 46.0 | 36.6 | 46.4 | 50.0 | 51.0 | 26.1 | 49.4 | 44.9 | 52.8 |
| Overpass | 60.0 | 56.6 | 57.8 | 57.6 | 62.7 | 60.6 | 48.1 | 49.7 | 62.2 |
| Ship | 75.1 | 68.7 | 72.1 | 73.1 | 75.1 | 37.6 | 59.2 | 87.4 | 77.1 |
| Stadium | 67.4 | 69.0 | 64.8 | 71.5 | 67.0 | 70.7 | 61.0 | 70.6 | 76.0 |
| Storage Tank | 61.1 | 43.1 | 63.4 | 60.0 | 63.5 | 45.2 | 46.6 | 68.7 | 72.4 |
| Tennis Court | 87.3 | 85.7 | 85.2 | 86.9 | 86.8 | 84.0 | 76.3 | 87.3 | 87.7 |
| Train Station | 58.8 | 58.4 | 62.8 | 54.5 | 65.2 | 57.1 | 55.1 | 29.4 | 64.1 |
| Vehicle | 45.0 | 40.7 | 43.8 | 42.7 | 46.1 | 43.0 | 27.4 | 48.3 | 55.0 |
| Windmill | 87.9 | 85.1 | 87.5 | 88.3 | 88.7 | 75.9 | 65.7 | 78.7 | 90.3 |
| mAP | 69.2 | 66.1 | 69.4 | 69.0 | 71.4 | 64.9 | 58.6 | 57.1 | 73.6 |
| Method | Attention | The Prediction Way | Deformable | mAP (%) |
|---|---|---|---|---|
| Mechanism | for Anchor Position | Convolution | ||
| FPN | - | Sliding Window | - | 69.1 (baseline) |
| FPN with Attention | √ | Sliding Window | - | 71.9 (+2.8) |
| Guided Anchoring | - | Independent Subnetwork | DC | 72.1 (+3.0) |
| Ours without MDC | √ | Attention Map | DC | 73.3 (+4.2) |
| Ours | √ | Attention Map | MDC | 73.6 (+4.5) |
© 2020 by the authors. Licensee MDPI, Basel, Switzerland. This article is an open access article distributed under the terms and conditions of the Creative Commons Attribution (CC BY) license (http://creativecommons.org/licenses/by/4.0/).
Share and Cite
Tian, Z.; Zhan, R.; Hu, J.; Wang, W.; He, Z.; Zhuang, Z. Generating Anchor Boxes Based on Attention Mechanism for Object Detection in Remote Sensing Images. Remote Sens. 2020, 12, 2416. https://0-doi-org.brum.beds.ac.uk/10.3390/rs12152416
Tian Z, Zhan R, Hu J, Wang W, He Z, Zhuang Z. Generating Anchor Boxes Based on Attention Mechanism for Object Detection in Remote Sensing Images. Remote Sensing. 2020; 12(15):2416. https://0-doi-org.brum.beds.ac.uk/10.3390/rs12152416
Chicago/Turabian StyleTian, Zhuangzhuang, Ronghui Zhan, Jiemin Hu, Wei Wang, Zhiqiang He, and Zhaowen Zhuang. 2020. "Generating Anchor Boxes Based on Attention Mechanism for Object Detection in Remote Sensing Images" Remote Sensing 12, no. 15: 2416. https://0-doi-org.brum.beds.ac.uk/10.3390/rs12152416