Evaluation of the Spatiotemporal Variations in the Eco-environmental Quality in China Based on the Remote Sensing Ecological Index


1
College of Mathematics and Information Science, Guangxi University, Nanning 530004, China
2
State Key Laboratory of Remote Sensing Science, Faculty of Geographical Science, Beijing Normal University, Beijing 100875, China
*
Author to whom correspondence should be addressed.
Remote Sens. 2020, 12(15), 2462; https://0-doi-org.brum.beds.ac.uk/10.3390/rs12152462
Submission received: 30 June 2020
/
Revised: 22 July 2020
/
Accepted: 28 July 2020
/
Published: 31 July 2020
(This article belongs to the Section Environmental Remote Sensing)
Abstract
:The eco-environment is dynamic and shows a continuous process of long-term change. It is helpful for policymakers to know the status of the regional eco-environment through accurate evaluations of the history and current situation of the regional eco-environment. The remote sensing ecological index (RSEI) model of China was established in this study by using four indexes: wetness, greenness, dryness, and heat. Knowledge granulation of the RSEIs were carried out, and a method to determine the weights of the knowledge granulation entropy of the indexes based on their characteristics was proposed. This study used Moderate Resolution Image Spectroradiometer (MODIS) data from the Google Cloud Computing Platform to study and calculate the eco-environmental quality of China from 2000–2017. The overall eco-environmental quality in China tended to improve from 2000–2017, although there were large areas of ecological degradation from 2009–2014. The eco-environment of eastern China was better than that of western China. Most of the national ecological areas were third-level ecological areas, which had moderate environmental quality. Dryness was the most important factor affecting the quality of the eco-environment, followed by greenness, which reflected the increasing environmental damage caused by human activities in China in recent years.
1. Introduction
With the continuous enhancement of global change and human activities, the problems of the eco-environment seriously threaten regional ecological security and the sustainable development of the economy and society [1]. The overall layout of a measure promoting the five factors of economic construction, political construction, cultural construction, social construction and ecological civilization construction in the new era was comprehensively deployed at the 19th Congress of the Communist Party of China. Strengthening protections for the eco-environment and containing the destruction of the eco-environment are very important for maintaining the security of the national eco-environment and ensuring the sustainable development of the national economy and society. Therefore, it is very important to establish the ecological evaluation model and quantitative expression and put forward the technical standards and norms of ecological comprehensive evaluation on this basis [2].
Eco-environment refers to the general term of environment composed of living and non-living [3,4]. The evaluation of eco-environmental quality is based on the multiple indexes of selection and uses the comprehensive evaluation method to quantify the quality of regional eco-environment [5]. The researchers studied the relationship among the soil [6], biodiversity [7], forest management [8], population [9], geology [10] and environment. There are many studies that have evaluated the eco-environment evaluation at both the macro and micro scales, which shows the importance of eco-environmental quality evaluation for regional management, so rapid and accurate assessments of eco-environmental quality are more conducive to regional eco-environment management and evaluation.
Remote sensing can provide real-time data and large-scale monitoring. It is widely used in the field of the eco-environment and has become an effective method for evaluating regional eco-environments [11]. In 2006, the Ministry of Environmental Protection of China issued the technical criterion for eco-environmental status evaluation as an industry standard [12] and launched an eco-environment index (EI) that was mainly based on remote sensing technology, which aimed to provide an annual comprehensive standard for the evaluation of the eco-environment above the county level in China. In the past, a single ecological factor was used to evaluate the eco-environment, such as the vegetation index [13,14], land surface temperature [15], and drought index [16]. Xu [17] proposed monitoring and evaluating the eco-environment by obtaining ecological indicators based on remote sensing technology in 2013, and it is remote sensing ecological index (RSEI). Many scholars currently use the RSEI index to evaluate the eco-environments of different regions. Researchers have also used sharpened surface temperature images to improve the newly proposed remote sensing-based ecological index and then used the improved index to generate a time series of images of the ecological state. Based on the image sequence, change vector analysis (CVA) was used to detect the ecological changes in Fujian Province, China, from 2002 to 2017, and the RSEI was considered to be able to process MODIS data well [18]. The researchers used the RSEI to monitor the ecological quality changes of 35 major cities in China and believed that the use of the RSEI could characterize regional ecosystems [19]. The ecological quality of Xiong’an New Area from 1995 to 2015 was evaluated based on the new RSEI [20].
In the current study, we hypothesized that: (1) there are obvious regional differences in the spatial distribution of China’s eco-environment, and the quality of overall eco-environment presents a certain trend; and (2) the establishment of index weight method of RSEI in large area is not conducive to calculation and decision-making cognition. To test the hypotheses, we investigated the long-term evaluation of the eco-environment with remote sensing data in 2000–2017 in China, which is been attaching great importance to ecological environment management. Our objectives were to: (1) use the MODIS data on the Google Earth Engine (GEE) platform to obtain the normalized difference vegetation index (NDVI), normalized difference water index (NDWI), land surface temperature (LST) and normalized difference bare soil-building index (NDBI) data to establish a remote sensing eco-environmental quality assessment model for China; (2) establish a method for determining RSEI based on knowledge granulation entropy to improve the current weight evaluation method based on numerical value; and (3) explain the mechanism of long-term change of ecological environment in China.
2. Study Area and Data
2.1. Study Area
China is in East Asia on the western shore of the Pacific Ocean. It extends from the center of the Heilongjiang River near the Mohe River in the north to the Zengmusiansha of the Nansha Islands in the south to the Pamirs Plateau in the west and to the confluence of the Heilongjiang and Wusuli Rivers in the east. The land area is 9.6 million square kilometers, and the land boundary is more than 20,000 km. The study area includes the whole China including Taiwan.
2.2. Data Resources and Preprocessing
The remote sensing data of this study were the MODIS data for China, all of which were sourced from the GEE Cloud Computing Platform (https://code.earthngine.google.com/); the acquisition time was 1 January 2000–31 December 2017. In these data, the NDVI is generated from the near-infra-red (IR) and red bands of each scene with the following formula: Near Infra-Red−Red (NIR−Red)/Near Infra-Red+Red (NIR + Red) and ranges in value from −1.0 to 1.0. The NDWI is sensitive to changes in the liquid water content of vegetation canopies. It was derived from the near-IR band and a second IR band at ≈1.24 μm when available; otherwise, the nearest available IR band was used. The NDVI and NDWI were generated from the MODIS/MOD09GA surface reflectance composites. The LSTs were sourced from the quality indicator day (QC_Day) band of the MOD11A2.006 Terra Land Surface Temperature and Emissivity 8-Day Global 1 km dataset. The NDVI, NDWI, and LST are mature products in the MODIS data that can be downloaded and used directly. The remote sensing index data were resampled with GEE, which transformed the image set of each index into an image by averaging each pixel list for every year. The boundary data of the administrative divisions in China come from the China National Basic Geographic Information Center website.
3. Methods
3.1. Indexes Used in the RSEI
The RSEI was used to extract the four indexes of wetness, greenness, dryness, and heat from the remote sensing images to create a rapid and objective evaluation of the regional ecological quality [21,22], where the greenness, wetness, and heat were represented by the NDVI, the wetness index and LST, respectively. The NDVI is closely related to plant biomass, leaf area index, and vegetation coverage. The wetness index reflects the humidity of the vegetation, water, and soil, which is closely related to changes in the eco-environment; the NDWI was used to represent wetness in this study. With disturbances from improper human activities and urbanization, bare land and building impervious surfaces gradually replace the original natural ecosystem on the surface, resulting in the “drying” of the earth’s surface. Dryness was expressed by the NDBI index, which is composed of the building index (BI) and bare soil index (BSI) [23,24], which are written as follows:
where , , , , and are the reflectance of the blue, green, red, near infra-red, and short infra-red band 1, respectively.
NDBI = (BI + BSI)/2
Therefore, the RSEI can be expressed as follows:
3.2. Weight Generation for the RSEI
The weight is a value used to measure the role of an index in the eco-environmental quality evaluation index system, and it indicates the importance of an index item in the EI system. There are currently many methods for determining the index weight. According to the different sources of the original data, these methods can be divided into three categories: the subjective weight method, objective weight method, and combined weight method. The existing weighting method is too dependent on the subjective judgment of human beings for practical application and requires, large, complex calculations, and is limited by sample size [25]. In the existing studies on the regional environmental quality evaluation of the RSEI, the principal component analysis method is mostly used to determine the weights [17,18,19]. The interpretation of the weighting method of principal component analysis is unclear, but principal component analysis can be superior for evaluation of multidimensional indexes. The entropy weight method was used to determine the index weight in this study. The entropy weight method is a subjective and objective combination weight method, and its basic premise is to determine the objective weight according to the size of the index variability. It can be calculated by the following formula:
where Er is the information entropy of the indexes, n is the number of different values in each index, and is the probability of each value in all indexes. However, the ecological indexes are all continuous values in the actual environmental evaluation calculations, and the number of values in tends toward infinity, so the actual calculation of Er is not easy to operate. Granulation is a process in which a large amount of complex information is divided into several simple blocks, classes, and groups according to their respective characteristics in the process of cognition, reasoning, and decision-making. Each index in the RSEI has certain distribution characteristics in the index values, and each value is the embodiment of a certain pixel in the spatial distribution. Different combinations of numerical intervals reflect the clustering of the blocks in the index space. Therefore, the concepts of knowledge granulation and knowledge granulation entropy were introduced to improve the entropy weight method for evaluation of the eco-EI. Different evaluation indexes were subdivided into different levels and zones for the evaluation of the RSEI. The measurement of this kind of zone differentiation can be defined as knowledge granulation, which can be measured by the following formula [26]:
where Gk represents knowledge granulation, n represents the number of interval values of each index in a region, represents the total number of samples in the region, and represents the number of samples in each interval. The smaller the knowledge granulation is, the finer the partition of the indexes in the region and the stronger the resolution; otherwise, the larger the knowledge granulation is, the rougher the partition of the index in the region and the weaker the resolution. The following knowledge granulation entropy based on knowledge granulation is defined:
where is the knowledge granulation entropy, which is written as follows: The smaller the knowledge granulation entropy of the general index knowledge is, the finer it divides the objects, the stronger its resolution, and the greater its contribution to the index system. According to the knowledge granulation entropy of each index and the principle of the entropy weight method, the weight formula of each index is defined as follows:
where is the weight of each index, and m is the number of eco-environmental quality evaluation indexes.
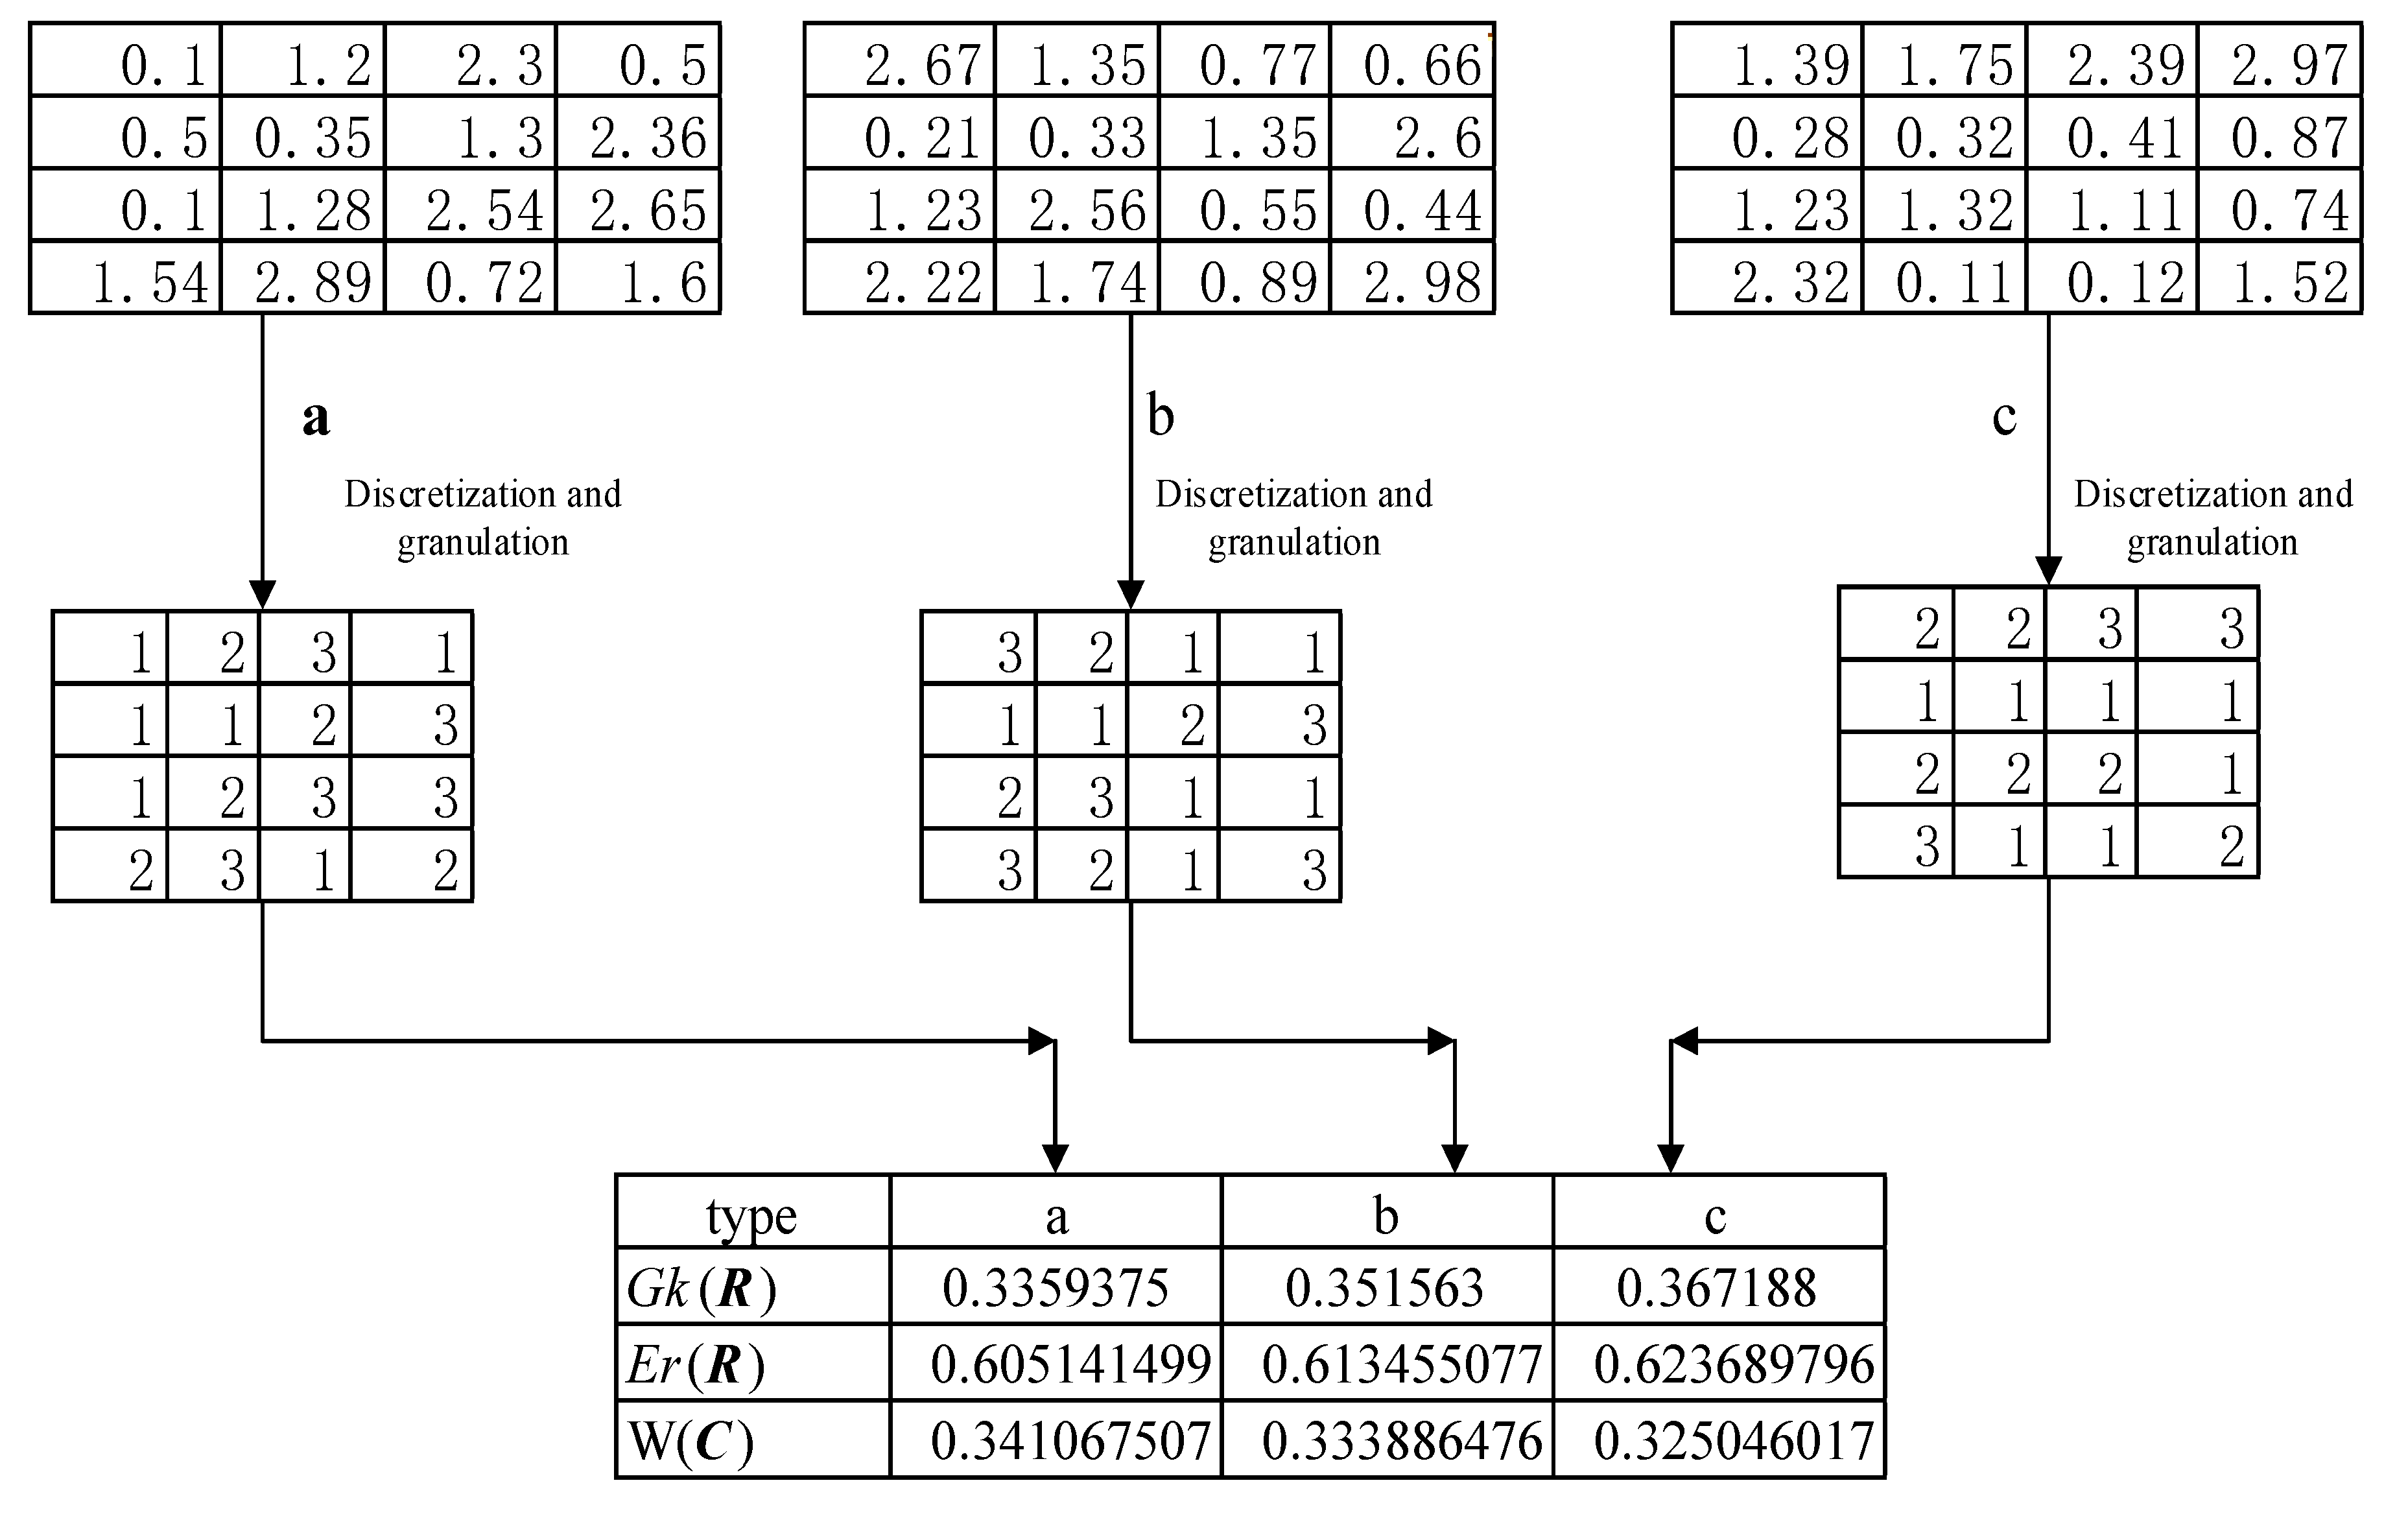
To explain the process of using knowledge granulation entropy to determine weight, an example of the process is defined in Figure 1. There is an area with 16 grid units in Figure 1. It is assumed that there are three eco-environmental quality evaluation indexes {a, b, c}, and the value of each index is a continuous. For such a continuous value, the knowledge granulation with different indexes can be discretized first according to certain standards. We set the grid element value of the 0–1 interval to 1, the 1–2 interval to 2, and the 2–3 interval to 3, as shown in Figure 1. Through the calculation of Formulas (6)–(8), the weight of each index can be obtained so that the evaluation equation of eco-environmental quality in this area is . The numerical distribution of index {a} tends to be closer to the average, and the numerical distribution of index c tends to be more dispersed. For the contribution of the RSEI evaluation, the order of the contributions of the indexes is a > b > c. It shows that if an ecological index tends to be near the average in each interval, its contribution to the ecological quality will be greater in the actual evaluation. In contrast, if an ecological index is widely distributed in a certain range, its contribution to ecological quality will be smaller. It should be pointed out that in the actual calculation, because the dimensions of each index are inconsistent, the index should be normalized according to the forward index and the reverse index as follows:
Here, is the normalized index value, and are the original value, maximum value, and minimum value of the index, respectively. Formula (9) is the positive index, and Formula (10) is the negative index.
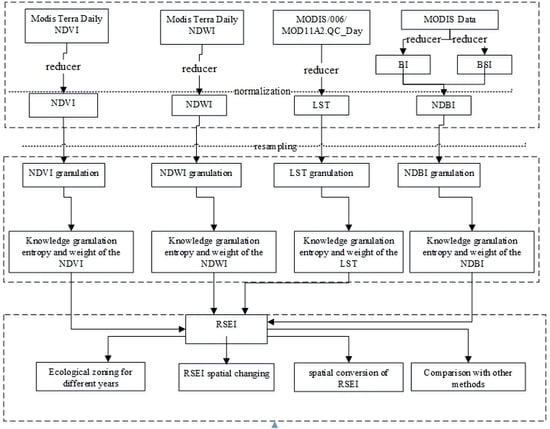
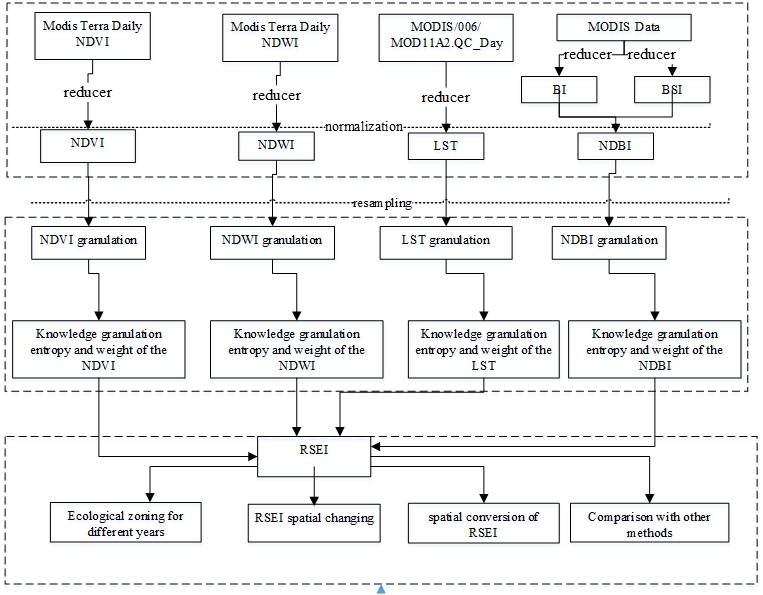
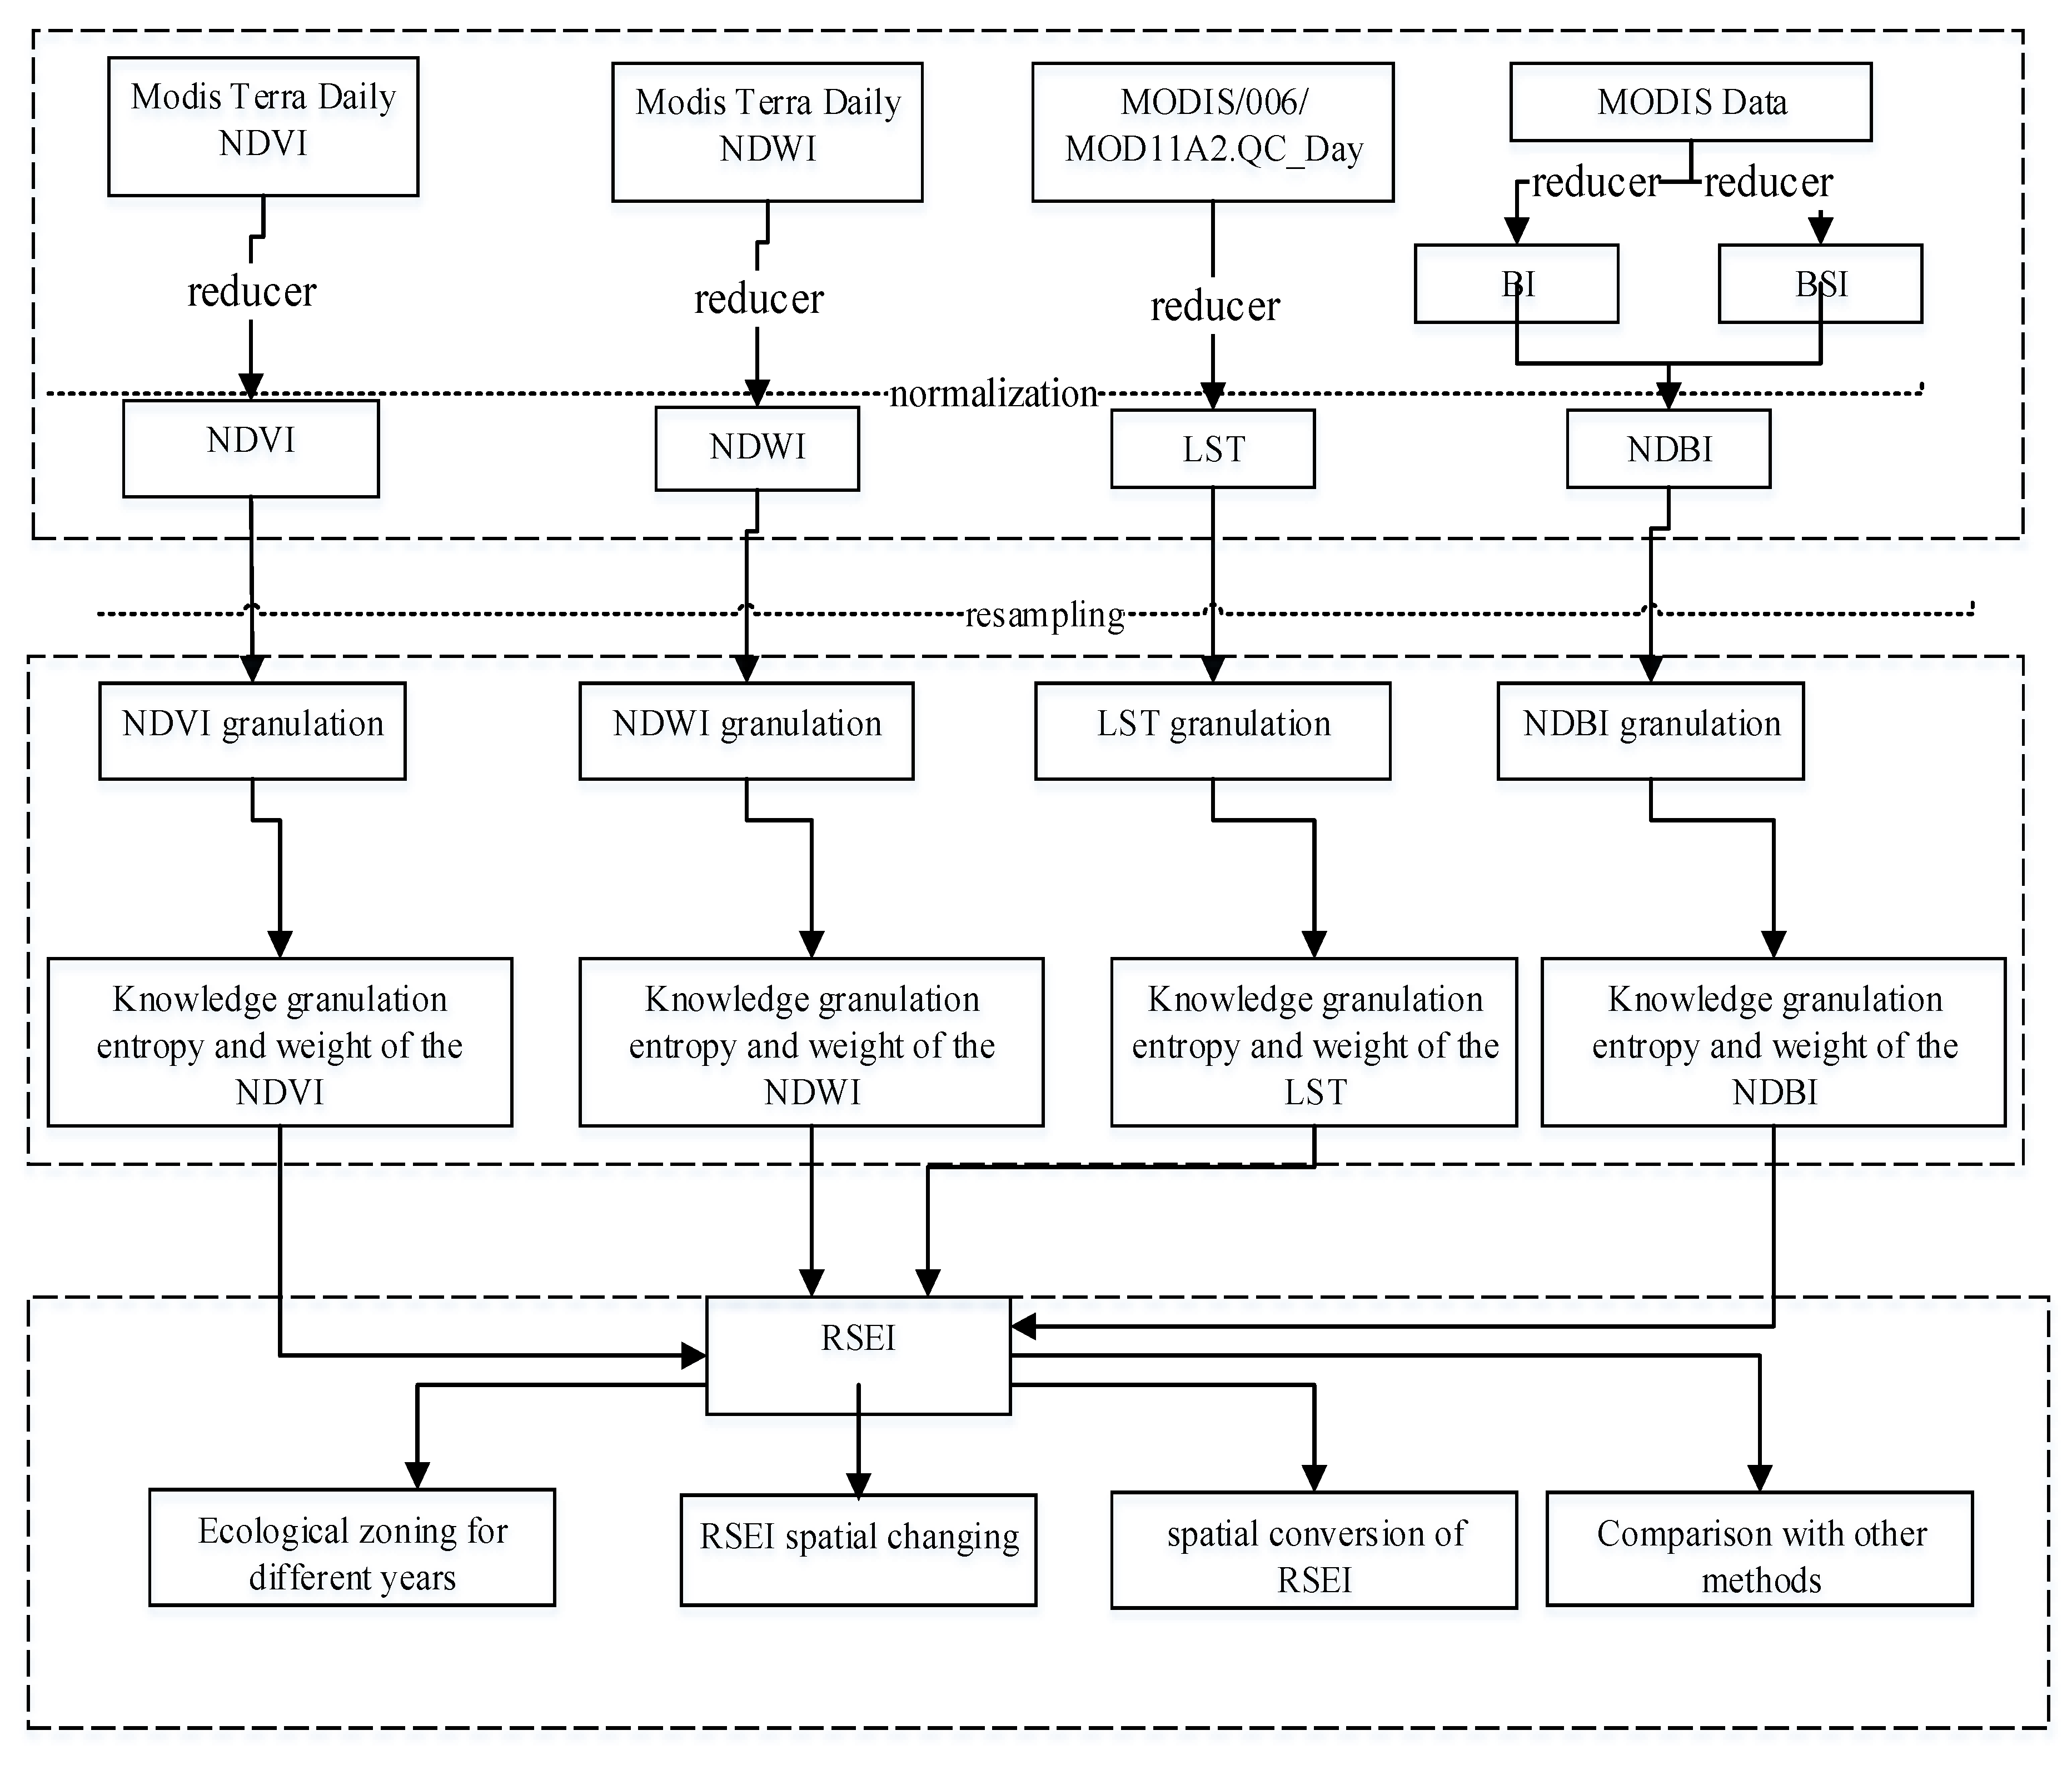
3.3. Analysis Framework of the RSEI in China
Using the above data preprocessing and weight determination method, this study proposed a framework for the calculation and analysis of the RSEI in China in Figure 2. We carried out this evaluation framework from three parts.
- 1.
- Remote sensing data of NDVI, NDWI, and LST images of each year were respectively obtained by using MODIS Terra daily NDVI, MODIS Terra daily NDWI, the QC _ Day band data of MOD11A2.006 Terra Land Surface Temperature and Emissivity 8-Day Global 1km from GEE platform. The indexes of NDVI, NDWI, and LST were respectively reduced to one image by mean. The corresponding Short Wave Infra-Red SWIR1, NIR, Red, Green, Blue band data of MODIS were extracted, and the NDBI of each year were calculated by using Formulas (1)–(3) and reducer technology. All index values were unified into the range of 0–1 by normalization at last.
- 2.
- According to the spatial differentiation of each index in each year, all indexes were equally divided into 15 intervals in this study. The total numbers of pixels for each index and the number of pixels for each interval in China were counted, and the knowledge granulation entropy and index weight of each index of RSEI in each year were calculated respectively. Then, according to the weight of each index, the annual RSEI of China is generated. The results of RSEI base on knowledge granulation weight method proposed in this study were compared with the results of principal component analysis and analytic hierarchy process (AHP).
- 3.
- This study calculated the annual RSEI of China from 2000 to 2017. Due to limited space, this paper only discussed the RSEI values for 2000, 2005, 2009, 2014, and 2017. According to the five-year calculation results of RSEI, the eco-environmental quality of the whole country was divided into 5 different regions. The spatial distribution of the RSEI in China was obtained through the calculation, and each pixel value of this result was continuous. By subtracting the spatial distribution of the RSEI in adjacent years, the change in the RSEI in each pixel was obtained. Because of the fluctuation in the results of the calculation, this study considered the range of change in the RSEI values to be between [−0.05, 0.05], which was the area included the unchanged area, the area with a change in value of greater than 0.05, which was the area where the eco-environment improved, and the area with a change in value of less than −0.05, which was the eco-environmental degradation area. This study calculated the transformation matrix of the ecological zones between two adjacent years based on the results of the RSEI zoning for each period to judge the specific area of conversion between them.
4. Results
4.1. Weight and Ecological Zoning
The NDBI is a negative index, and had the lowest value of knowledge granulation entropy for three years and the second lowest value for two periods among the five years. Even when it was the second lowest value, it was only slightly higher than the most recent lowest value. The results showed that the numerical NDBI values in most regions of China tended to be more evenly distributed than those of the other indexes and that the anthropogenic surface activities were increasing in China. There was no significant difference in spatial distribution between the other three indexes, and the contribution of the NDBI to China’s RSEI was also the largest. The knowledge granulation entropy of the NDWI was the highest for four years and was only the second highest in 2017. This showed that the NDWI values in most regions of China tended to be more numerically concentrated than other. The knowledge granulation of the NDVI was large, as was the knowledge granulation entropy, which indicated that its contribution to the RSEI was smaller than that of NDBI and LST. The knowledge granulation and knowledge granulation entropy of LST were smaller, which showed that the differences in the spatial distribution of the temperature index in China as not as large as that of the NDVI, and it had a greater contribution to the RSEI. The specific values of knowledge granulation entropy (KGE) and weight of each index in 2000–2017 are listed in Table 1.
The minimum value was 0.1279, which occurred in 2009, and the maximum value was 0.7227, which also appeared in 2009 out of the five years of listed RSEI values (details are shown in Table 2). To unify the division of the RSEI, this study unified the five-year RSEI into one standard, which was divided into five intervals according to the maximum and minimum values of all five years. The standardized division intervals were [0.1279, 0.2469], [0.2469, 0.3658], [0.3658, 0.4848], [0.4848, 0.6037], and [0.6037, 0.7227]. Each section corresponded to the first-, second-, third-, fourth-, and fifth-level ecological areas of RSEI, which in turn represented the improvement of eco-environmental quality. In the five periods between 2000 and 2017, the average values of the RSEI in China were 0.2482, 0.2601, 0.2605, 0.2591, and 0.2842, respectively. Even in 2014, the average value of the RSEI in China was greater than that in 2000.
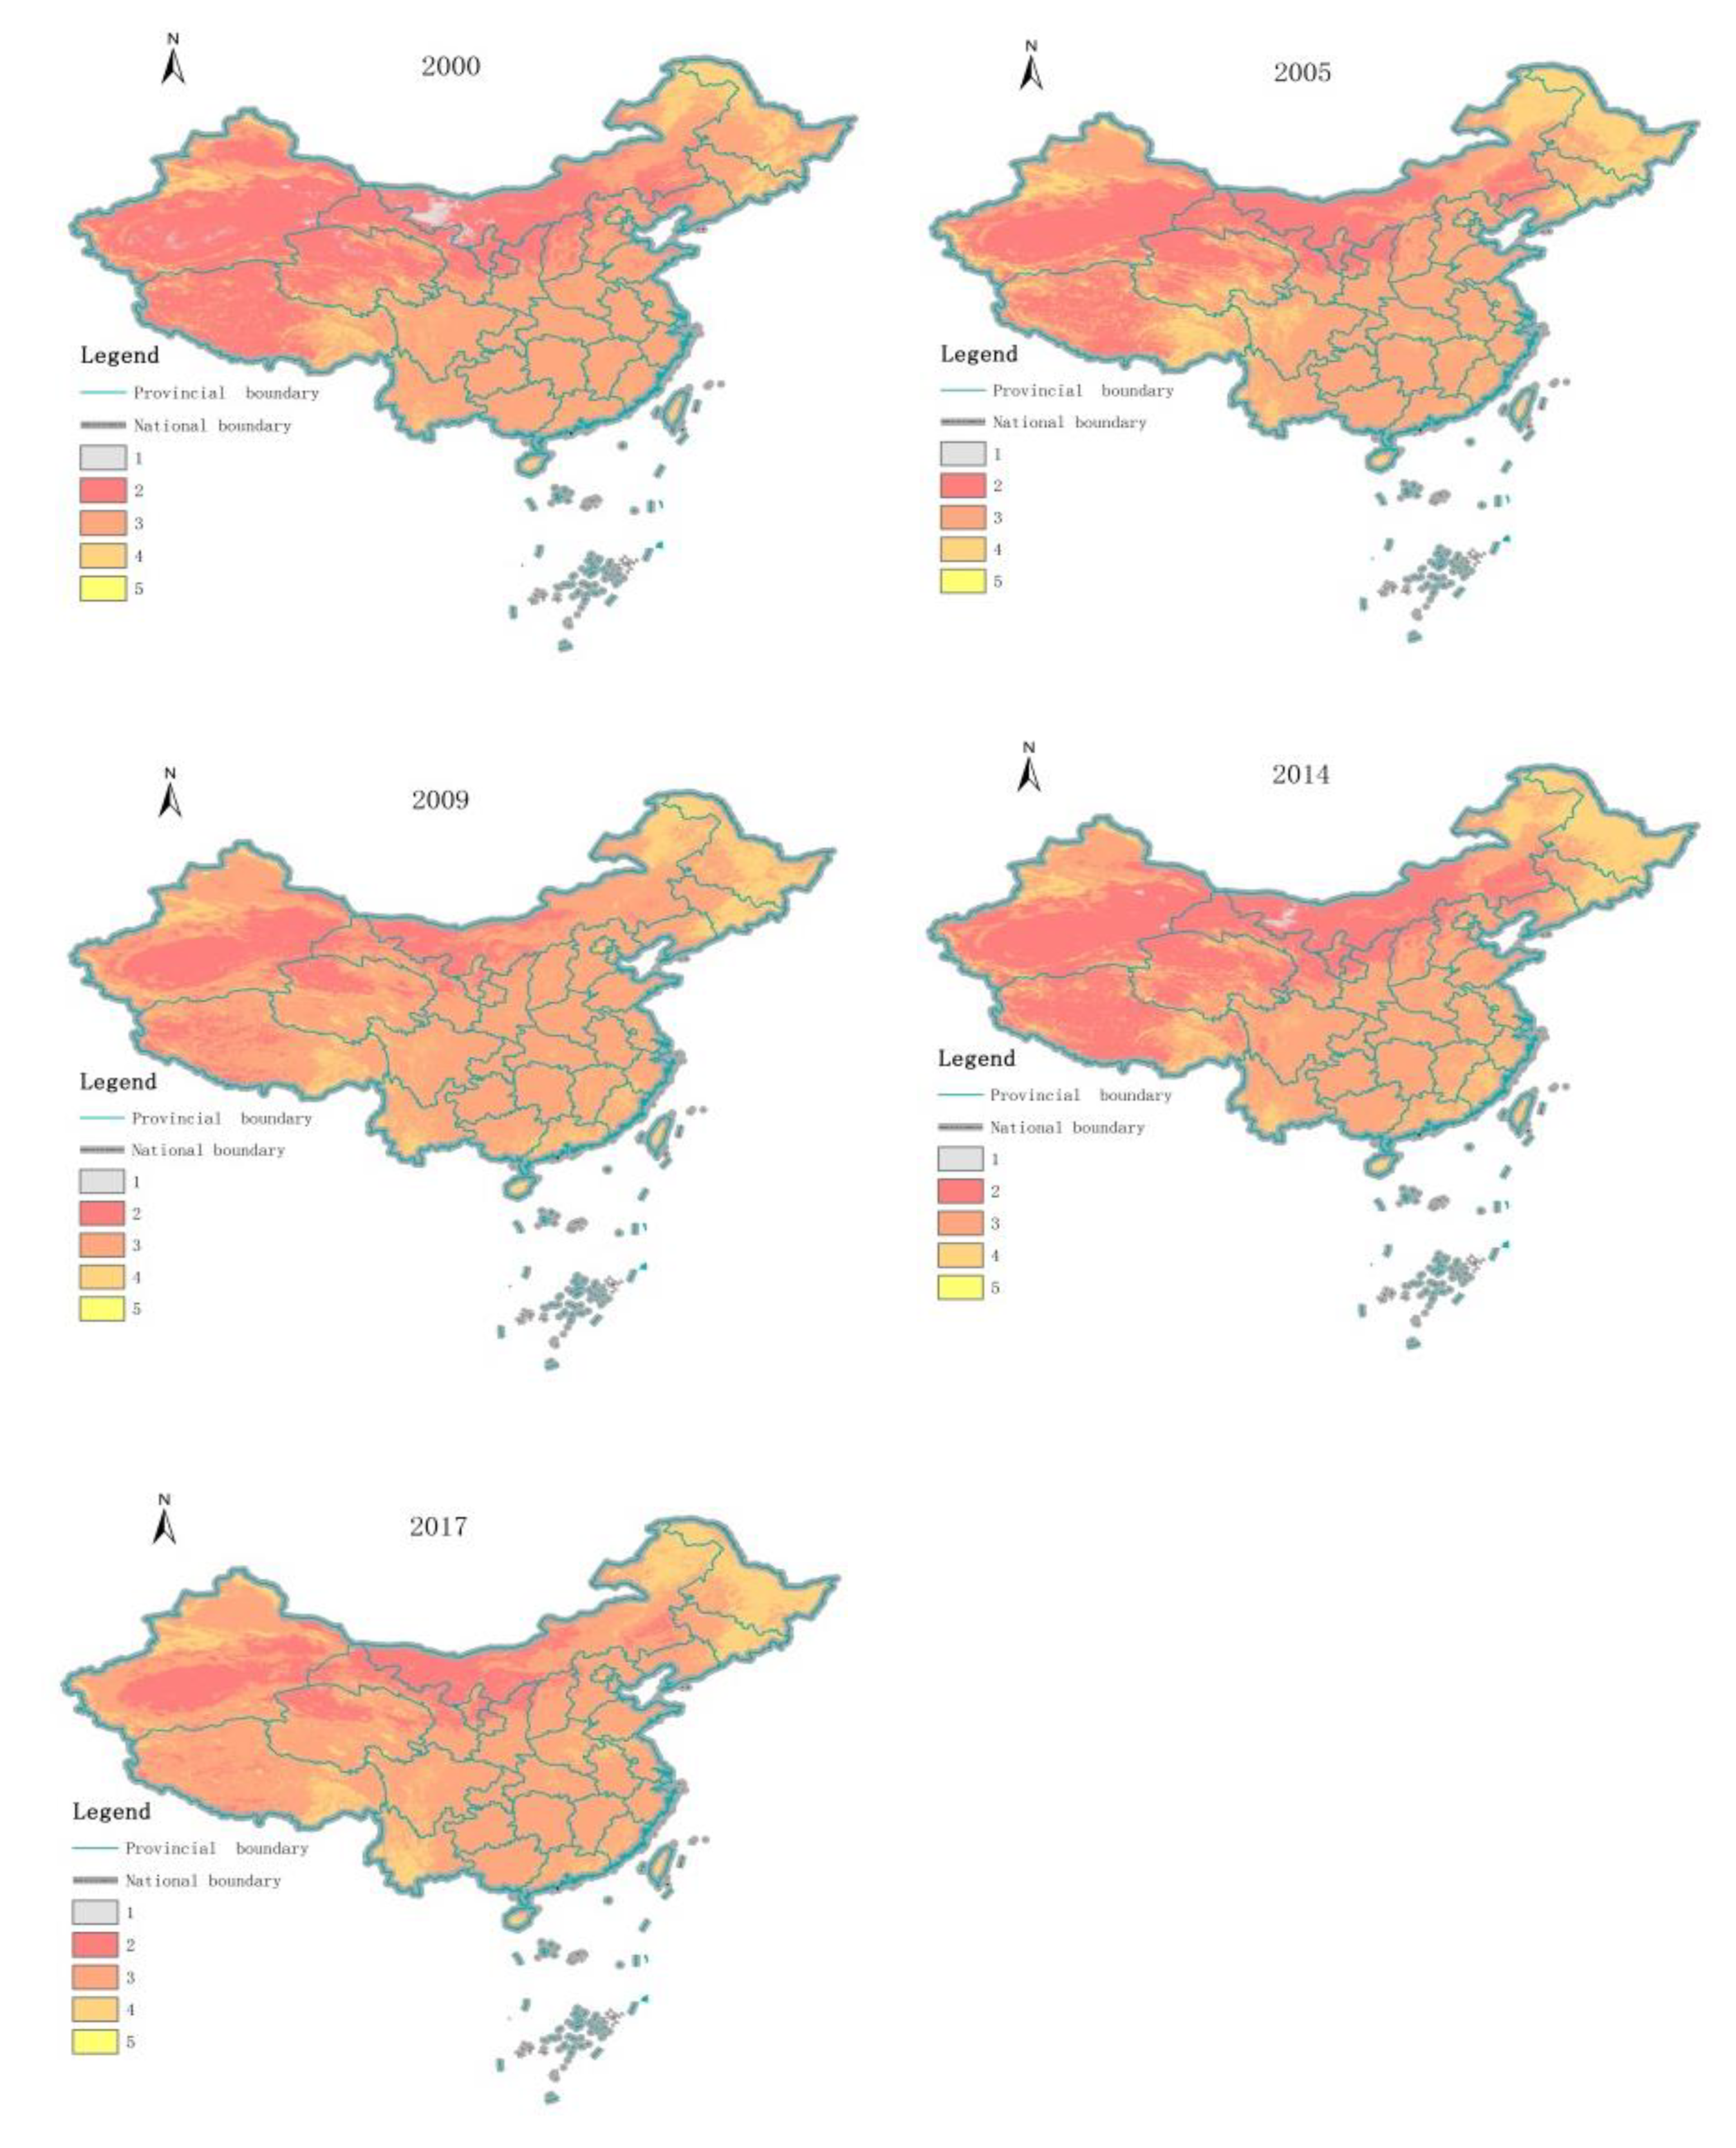
According to the calculation results in Table 3, the eco-environmental quality of China is mainly distributed in the Level 3 regions, which accounted for 52.291% of the land area in 2000, 54.115% in 2005, 67.460% in 2009, 49.111% in 2014 and 66.382% in 2017. The proportions of first-level regions with particularly poor eco-environmental quality and fifth-level regions with particularly good eco-environmental quality were very low. The proportion of the area of each eco-environment level showed that the overall environmental quality of China tended to be moderate, and the proportions of areas with particularly good eco-environmental quality or particularly bad eco-environmental quality were not large. The specific proportions are shown in Table 3. From a spatial perspective, the eco-environmental quality of the eastern region was better than that of the western region. The first-level regions were mainly distributed in some of the desert areas in the west, and the third-level regions were generally widely distributed. The eco-environment in the east was better than that in the west, and the second-level regions with poor eco-environments in the west were more common than those in the east. The specific annual spatial distributions of eco-environmental quality are shown in Figure 3.
4.2. Spatial Changing
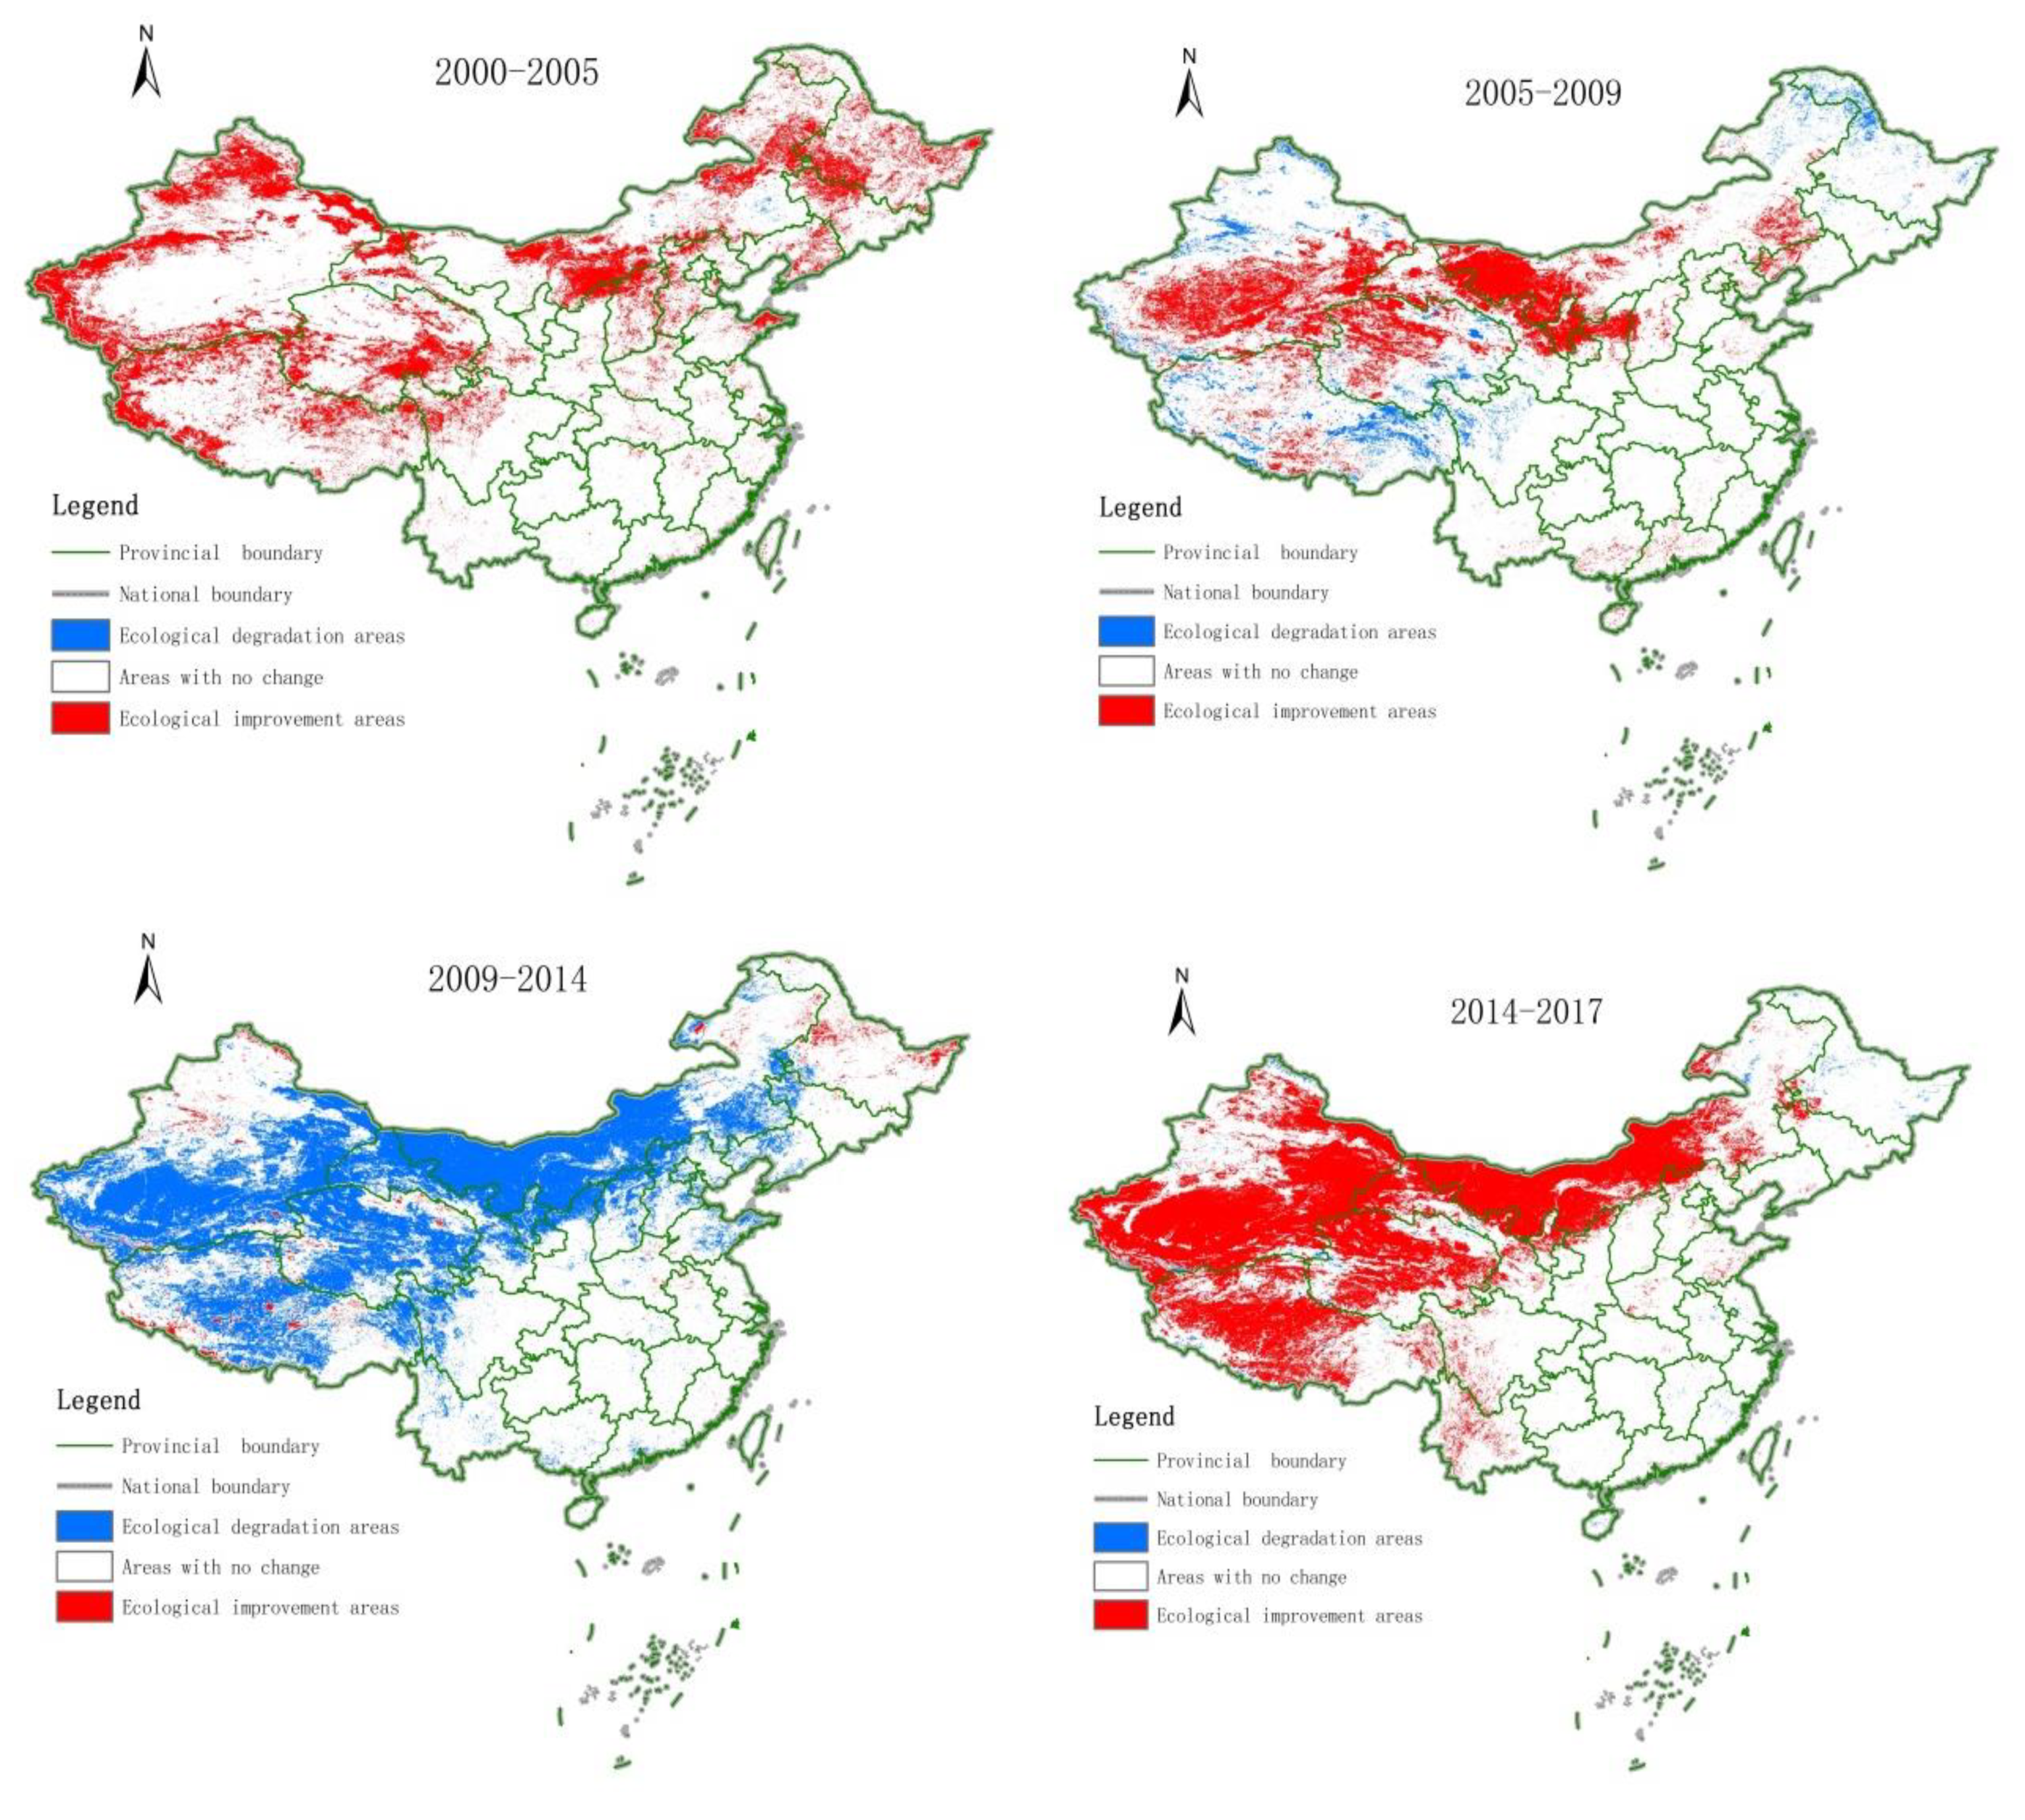
The ecology in most areas of China was improving. The areas of regional ecological improvement comprised 18.26% of the country in 2000–2005 and, 31.88% of the country in 2014–2017, and the proportion of ecological degradation areas in China was relatively small. In 2009–2014, 32.93% of the area of China showed ecological degradation. Due to the high temperatures during all four seasons of 2014, the national average temperature is 0.5 °C higher than that of the average year, and it was the sixth warmest year since 1961, along with 1999. As the temperature increased, the temperature index value and its own weight increased, and at the same time, the surface natural ecology changed, and the bare soil index value increased. The specific proportion of ecological improvement and degradation area in each period is shown in Table 4. From the perspective of spatial distribution, no matter the ecological improvement area or the ecological degradation area, it mainly appears in the western region and the area to the west of “Heihe–Tengchong Line”. The administrative divisions of these areas are in Xinjiang, Inner Mongolia, Qinghai, Tibet, Ningxia, Gansu, Sichuan, and Western Yunnan. The spatial changing distributions between different years are shown in Figure 4.
4.3. Spatial Transfer
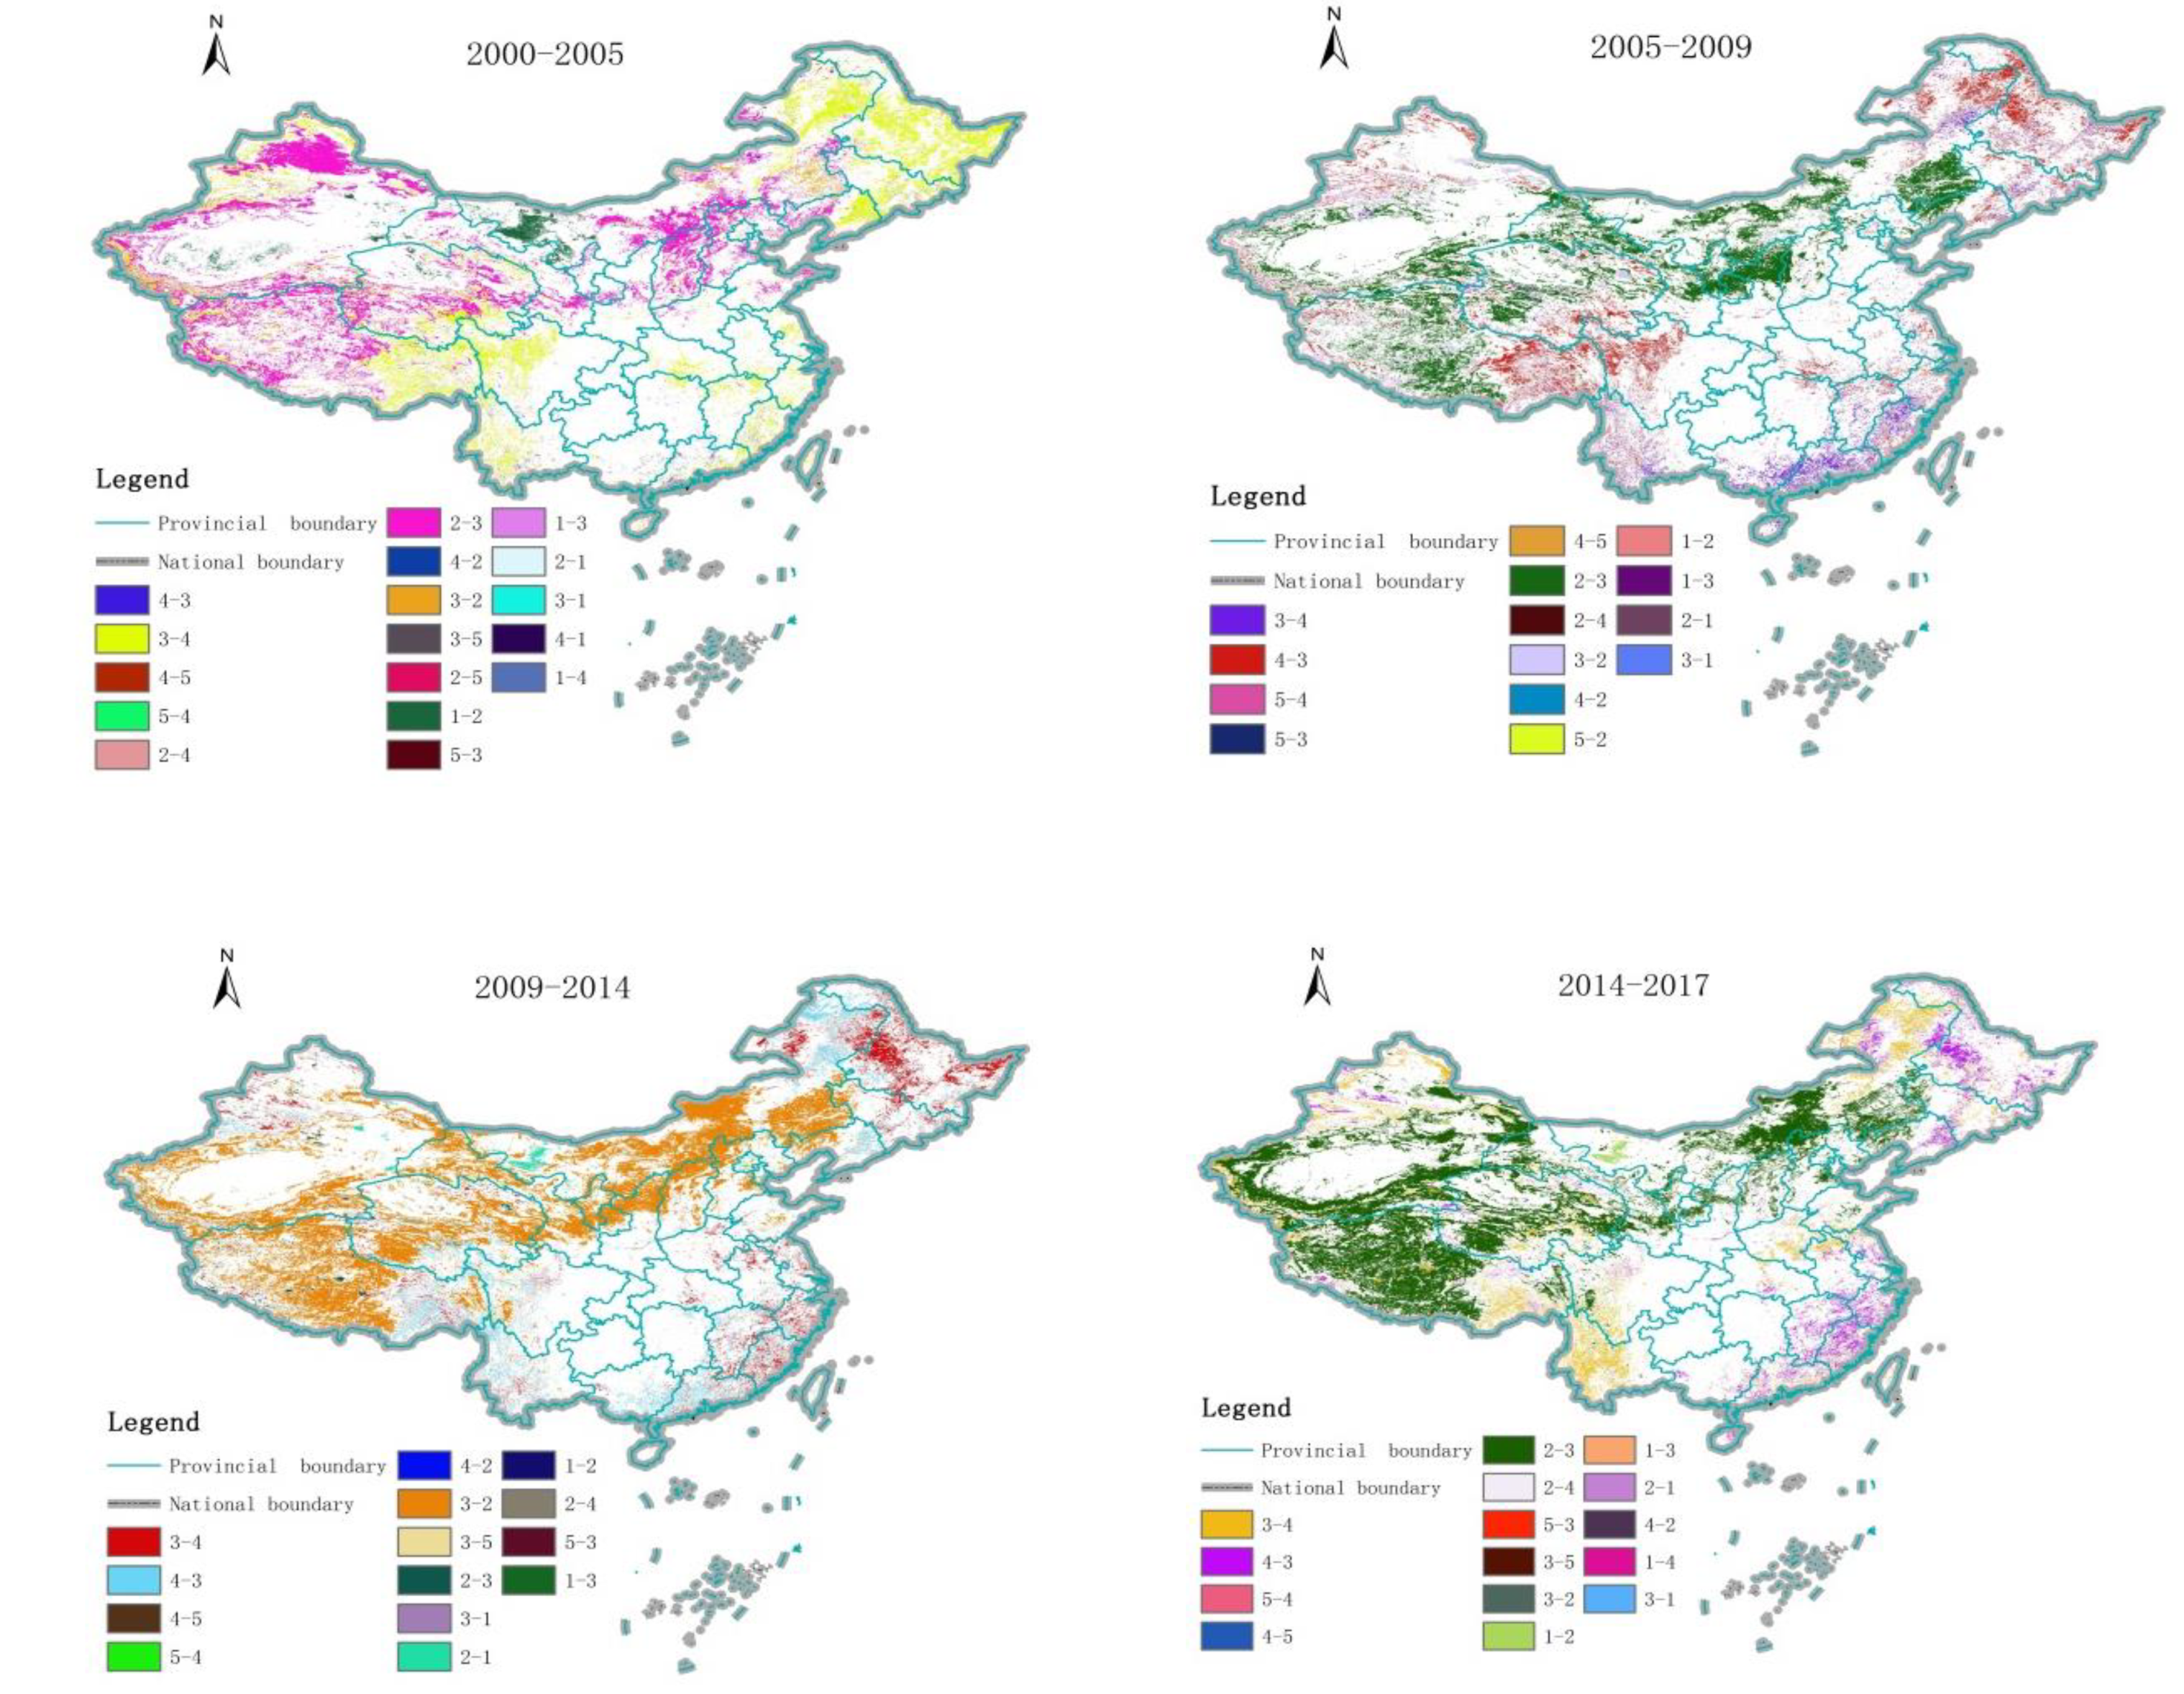
There were many eco-environment improvement areas from 2000 to 2005. The change in areas from the second-level ecological area to the third-level ecological area was 1,050,800 square kilometers, and the change in area from the third-level ecological areas to the fourth-level ecological areas was 8,743,900 square kilometers. There was a change of 108,924 square kilometers from second-level areas to the third-level areas and 30,772 square kilometers from third-level areas to the fourth-level areas from 2005 to 2009. There were 178,065 square kilometers from the third level to the second level and 42,151 square kilometers from the fourth level to the third level from 2009 to 2014. There was a change of 1.82416 million square kilometers from second-level areas to the third-level areas and 495.01 million square kilometers from third-level areas to the fourth-level areas from 2014 to 2017. From the perspective of the sources and destinations of the transformation matrix, the areas that showed ecological improvement largely changed from second-level ecological areas to the third-level ecological areas, followed by the transformation from third-level ecological areas to the fourth-level ecological areas. The areas that showed ecological degradation were predominantly transformed from third-level ecological areas to second-level ecological areas, followed by fourth-level ecological areas to third-level ecological areas. The fifth-level ecological areas, which had high ecological quality, and the first-level ecological areas, which had poor ecological quality, exhibited less change. The spatial transfer distributions between different years are shown in Figure 5, where the legend shows the transformation of ecological zones. For example, 4–3 represents the transformation from level 4 ecological zones in 2000 to level 3 ecological zones in 2005 in the 2000–2005 part of Figure 5. The specific values of transfer matrix in 2000–2017 are listed in Table 5.
5. Discussion
5.1. Advantages of Evaluation Framework
The Ministry of Environmental Protection of the People’s Republic of China issued the technical criterion for eco-environmental status evaluation in the form of industrial standards in 2006 and launched the EI mainly based on remote sensing technology [12]. The obtained EI index is an numerical value that can describe the ecological situation of a region only in a general way and cannot be visualized and cannot describe the spatial distribution of the different eco-environment conditions in the region, nor can it analyze the spatial changes in the eco-environment in different periods. The RSEI evaluation model was established based on remote sensing information and natural factors and on the on indexes of greenness, wetness, heat, and dryness. The RSEI can quickly and simply evaluate the long-term ecological quality of a region and can compare and analyze the evaluation results for different years, determine the changes in the ecological quality of the region, and analyze the changes in ecological quality, and visual specific direction of the transformation of the ecological zones. The RSEI is a remote sensing-based eco-environmental index evaluation model; the indicators are easy to access, and the results can be visualized. The RSEI conforms to the most commonly used conceptual framework, which is the stress-state-response model for the eco-environment [17,27].
5.2. Methods Evaluation
Different weighting methods have different characteristics. The subjective weighting method evaluate the importance of attributes subjectively, and it will change with the mood of decision makers or the change of reference standards, such as Delphi method [28], AHP method [29]. The objective weighting method only uses the decision matrix to establish a certain mathematical model to calculate the attribute weight. The form of the objective weighting method is rigorous, but it takes “numerical value” as the center, and it will increase the amount of data calculation and is not easy for decision-making cognition, such as the method of maximizing deviation [30,31], the method of variation coefficient [32]. The weighting methods based on KGE, which combines subjective and objective knowledge, can not only reflect the decision-maker’s subjective consciousness, but also combine the actual remote sensing index data, so it is easier to make decision and reduce the amount of calculation.
Principal component analysis is widely used in the evaluation of the RSEI [17,19,20]. To ensure that the cumulative contribution rate of the top several principal components extracted reach a good level, principal component analysis must be able to give an explanation that aligns with the actual background and significance. The advantage of the principal component analysis method lies in the reduction in dimensionality in multidimensional data. The number of principal components extracted by principal component analysis should be significantly smaller than the number of original indicators to be advantageous for the analysis. There are only four indexes in the RSEI. In the existing research, there are three indexes after the reduction in dimensions in many studies that do not show an obvious effect of the reduced number of dimensions. It is a very time consuming for all pixels to be included in the calculation for large-scale data. We tried to use principal component analysis to calculate the RSEI for 2017 in this study, which took two days. The concept of knowledge granulation is used to partition the knowledge of the RSEI indexes in this study. The knowledge granulation of each index reflects the spatial distribution of itself, which is the degree of dispersion of the regional indexes. The KGE weighting method is an improvement on the entropy weighting method, which is a combined weighting method. It can reflect the degree of variation of the indexes, and the calculation is quick and simple. We used principal component analysis (see Figure 6b), AHP (see Figure 6c) and the method of this paper (see Figure 6a) to compare RSEI in 2017. To reflect the spatial differentiation and RSEI value of each pixel, there is no ecological division of the results. There are some differences between the results proposed in this paper and the principal component analysis method in the pixel values, but the results in the spatial distribution are basically the same. The result is quite different from the AHP result, and it respects the law of index data itself and effectively overcomes the subjectivity of experts in AHP method. The detailed results are shown in Figure 6.
5.3. Research Scale and Validation Analysis
National scale of spatiotemporal research on the RSEI was carried out in China in this study, but other studies have been carried out on the urban scale, river basin-scale and other small and medium-sized regional scales [17,19]. The spatiotemporal evaluation of China’s ecological quality is concentrated in some key protected areas of ecologically fragile areas, the spatiotemporal evolution of drought vulnerability in the ecotone between agriculture and animal husbandry in the north of China [33,34], Northwest desert oasis [35,36], Qinghai-Tibet Plateau [37]. In these studies, the quality of ecological environment in most of the national key protected areas tends to be better. The RSEI value of each year was unified into five intervals of the same standard according to the maximum and minimum values in this study, and then the spatial division of eco-environmental quality is carried out. First-level areas with poor eco-environmental quality and fifth-level areas with good eco-environmental quality were uncommon in China. The quality of the eco-environment in China from 2000–2017 tended to improve, which as related to the Chinese government’s attention to eco-environment protection and restoration. Because of the different evaluation indexes and methods, this result differed from the conclusion [38]. Satellite data from 2000 to 2017 show that due to the land use management methods of China and India, the two countries have made great contributions to the expansion of the earth’s vegetation area and ecological restoration [39], and the conclusion of this paper is basically consistent with this study. The spatial distribution of eco-environmental quality in the five years listed in this paper is basically consistent with the bulletin of China’s eco-environmental situation in that year.
5.4. Limitations and Recommendations for Future Research
Due to the limitations of cloud platform data, the evaluation of the ecological quality in China for a relatively long time period was not achieved. Although the RSEI model evaluated the spatiotemporal change of China’s eco-environmental quality, it still has some shortcomings. The four indexes of RSEI are the driving force of environmental change, but can the four indexes well reflect all aspects of environmental quality? The weight of the four indexes reflects their respective contribution to the quality of eco-environment, so what is the relationship between these indexes, especially after information granulation? Whether the quality of eco-environment is directly driven by these indexes or by other driving factors? Such as policy, industrial development, etc. Different data normalization methods will produce different results. We choose the linear normalization method in this paper, which is not involved in the comparison with different results of additional normalization, logarithmic normalization, and other normalization methods. The range of change in the RSEI values is set to [−0.05, 0.05], and it is subjective. The weighting method based on KGE is a combination of subjective and objective methods. How to reduce the subjective randomness of this method more scientifically, especially the knowledge granulation method, this paper adopted a simple discretization method, different knowledge granulation methods will have different effect on the evaluation results. In the future work, we will analyze the spatial correlation among the four indexes of RSEI by granular computing, and use granular computing to measure the relationship between RSEI and land use change, so as to better expand the application of granular computing in the field of ecological remote sensing computing.
6. Conclusions
The main findings of this study can be summarized as follows:
- The RSEI evaluation model for national scale was established, which was based on the indexes of greenness, humidity, heat, and dryness. It was completely based on remote sensing information and natural factors and can quickly and simply evaluate regional eco-environment quality. It can accurately realize real-time spatial evaluations for a long time series.
- The overall quality of the eco-environment in China was moderate, and most areas were third-level ecological areas. The overall quality of the eco-environment in China tended to improve from 2000–2017, although a large area of ecological degradation occurred from 2009–2014. The NDBI had the greatest impact on the quality of the eco-environment, which reflects the increasing human activities of environmental damage in China in recent years.
- The weighting method of the indexes for the remote sensing ecological quality evaluation model based on KGE was proposed. It can reflect the distribution characteristics of the RSEIs themselves and can easily and quickly calculate the weight of each index in an easily explained manner.
Author Contributions
Conceptualization, W.L. and W.J.; methodology, W.J.; software, W.L.; validation, W.L.; formal analysis, W.L.; investigation, W.L.; resources, W.L.; data curation, W.L.; writing—original draft preparation, W.L.; writing—review and editing, W.L.; funding acquisition, W.J. All authors have read and agreed to the published version of the manuscript.
Funding
This research was funded by the National Key Research and Development Program of China (grant No. 2016YFC0503002), the Guangxi Science and Technology Project (grant No. AD19245089), and the National Natural Science Foundation of China (Grant No. 41571077, U1901219).
Conflicts of Interest
The authors declare no conflict of interest.
References
- Gibbs, D. Ecological modernisation, regional economic development and regional development agencies. Geoforum 2000, 31, 9–19. [Google Scholar] [CrossRef]
- Wu, Y.J.; Zhao, X.S.; Xi, Y.; Liu, H.; Li, C. Comprehensive evaluation and spatial-temporal changes of eco-environmental quality based on MODIS in Tibet during 2006–2016. Acta Geogr. Sin. 2019, 74, 1438–1449. [Google Scholar] [CrossRef]
- Sun, R.Y. Basic Ecology; Higher Education Press: Beijing, China, 2002. [Google Scholar]
- Xu, Y.; Zhou, H.R. A preliminary study on advances in assessment of eco-environmental quality in China. Arid Land Geogr. 2003, 26, 166–172. [Google Scholar] [CrossRef]
- Zhou, H.R. Study on ecological environmental quality as assessment index system of Xinjiang. China Environ. Sci. 2000, 20, 150–153. [Google Scholar]
- Lin, H.; Wheeler, D.; Bell, J.; Wilding, L. Assessment of soil spatial variability at multiple scales. Ecol. Model. 2005, 182, 271–290. [Google Scholar] [CrossRef]
- Mandelik, Y.; Dayan, T.; Feitelson, E. Planning for Biodiversity: The Role of Ecological Impact Assessment. Conserv. Biol. 2005, 19, 1254–1261. [Google Scholar] [CrossRef]
- Rodrigues, R.R.; Gandolfi, S.; Nave, A.G.; Aronson, J.; Barreto, T.E.; Vidal, C.Y.; Brancalion, P.H.S. Large-scale ecological restoration of high-diversity tropical forests in SE Brazil. For. Ecol. Manag. 2011, 261, 1605–1613. [Google Scholar] [CrossRef]
- Mubareka, S.; Ehrlich, D. Identifying and modelling environmental indicators for assessing population vulnerability to conflict using ground and satellite data. Ecol. Indic. 2010, 10, 493–503. [Google Scholar] [CrossRef]
- He, F.; Gu, L.; Wang, T.; Zhang, Z. The synthetic geo-ecological environmental evaluation of a coastal coal-mining city using spatiotemporal big data: A case study in Longkou, China. J. Clean. Prod. 2017, 142, 854–866. [Google Scholar] [CrossRef]
- Sánchez-Azofeifa, G.A.; Castro-Esau, K.L.; Kurz, W.A.; Joyce, A. Monitoring carbon stocks in the tropics and the remote sensing operational limitations: From local to regional projects. Ecol. Appl. 2009, 19, 480–494. [Google Scholar] [CrossRef]
- State Environmental Protection Administration of China. Technical Criterion for Eco-Environmental Status Evaluation; China Environmental Science Press: Beijing, China, 2006; pp. 1–6.
- Yuan, F.; Bauer, M.E. Comparison of impervious surface area and normalized difference vegetation index as indicators of surface urban heat island effect ts in Landsat imagery. Remote Sens. Environ. 2007, 106, 375–386. [Google Scholar] [CrossRef]
- Wright, C.K.; De Beurs, K.M.; Henebry, G. Combined analysis of land cover change and NDVI trends in the Northern Eurasian grain belt. Front. Earth Sci. 2012, 6, 177–187. [Google Scholar] [CrossRef]
- Imhoff, M.L.; Zhang, P.; Wolfe, R.E.; Bounoua, L. Remote sensing of the urban heat island effect across biomes in the continental USA. Remote Sens. Environ. 2010, 114, 504–513. [Google Scholar] [CrossRef] [Green Version]
- Sandholt, I.; Rasmussen, K.; Andersen, J. A simple interpretation of the surface temperature/vegetation index space for assessment of surface moisture status. Remote Sens. Environ. 2002, 79, 213–224. [Google Scholar] [CrossRef]
- Xu, H.Q. A remote sensing urban ecological index and its application. Acta Ecol. Sin. 2013, 33, 7853–7862. [Google Scholar]
- Xu, H.; Wang, Y.; Guan, H.; Shi, T.; Hu, X. Detecting Ecological Changes with a Remote Sensing Based Ecological Index (RSEI) Produced Time Series and Change Vector Analysis. Remote Sens. 2019, 11, 2345. [Google Scholar] [CrossRef] [Green Version]
- Yue, H.; Liu, Y.; Li, Y.; Lu, Y. Eco-Environmental Quality Assessment in China’s 35 Major Cities Based on Remote Sensing Ecological Index. IEEE Access 2019, 7, 51295–51311. [Google Scholar] [CrossRef]
- Yang, J.Y.; Wu, T.; Pan, X.Y.; Du, H.T.; Li, J.L.; Zhang, L.; Men, M.X.; Chen, Y. Ecological quality assessment of Xiongan New Area based on remote sensing ecological index. Ying Yong Sheng Tai Xue Bao J. Appl. Ecol. 2019, 30, 277–284. [Google Scholar]
- Xu, H.; Wang, M.; Shi, T.; Guan, H.; Fang, C.; Lin, Z. Prediction of ecological effects of potential population and impervious surface increases using a remote sensing based ecological index (RSEI). Ecol. Indic. 2018, 93, 730–740. [Google Scholar] [CrossRef]
- Hu, X.; Xu, H. A new remote sensing index for assessing the spatial heterogeneity in urban ecological quality: A case from Fuzhou City, China. Ecol. Indic. 2018, 89, 11–21. [Google Scholar] [CrossRef]
- Rikimaru, A.; Roy, P.S.; Miyatake, S. Tropical forest cover density mapping. Trop. Ecol. 2002, 43, 39–47. [Google Scholar]
- Xu, H. A new index for delineating built-up land features in satellite imagery. Int. J. Remote Sens. 2008, 29, 4269–4276. [Google Scholar] [CrossRef]
- Dikshit-Ratnaparkhi, A.; Bormane, D.; Ghongade, R.A. Framework for Optimal Attribute Evaluation and Selection in Hesitant Fuzzy Environment Based on Enhanced Ordered Weighted Entropy Approach for Medical Dataset. J. Biomed. Phys. Eng. 2019, 9, 327–334. [Google Scholar] [CrossRef] [PubMed]
- Liang, J.; Shi, Z. The Information Entropy, Rough Entropy and Knowledge Granulation in Rough Set Theory. Int. J. Uncertain. Fuzziness Knowl.-Based Syst. 2004, 12, 37–46. [Google Scholar] [CrossRef]
- Niemeijer, D.; De Groot, R.S. A conceptual framework for selecting environmental indicator sets. Ecol. Indic. 2008, 8, 14–25. [Google Scholar] [CrossRef]
- Wang, X.; Cao, Y.; Zhong, X.; Gao, P. A New Method of Regional Eco-environmental Quality Assessment and Its Application. J. Environ. Qual. 2012, 41, 1393–1401. [Google Scholar] [CrossRef] [Green Version]
- Kang, H.; Xuxiang, L.; Wang, J.; Zhang, J. Evaluating Ecological Vulnerability Using the GIS and Analytic Hierarchy Process (AHP) Method in Yan’an, China. Pol. J. Environ. Stud. 2016, 25, 599–605. [Google Scholar] [CrossRef]
- Wang, Y.-M.; Luo, Y. Integration of correlations with standard deviations for determining attribute weights in multiple attribute decision making. Math. Comput. Model. 2010, 51, 1–12. [Google Scholar] [CrossRef]
- Wu, Z.; Chen, Y. The maximizing deviation method for group multiple attribute decision making under linguistic environment. Fuzzy Sets Syst. 2007, 158, 1608–1617. [Google Scholar] [CrossRef]
- Pomerol, J.-C.; Barba-Romero, S. Multicriterion Decision in Management; Springer Science and Business Media LLC: Berlin, Germany, 2000; Volume 25. [Google Scholar]
- Liu, Q.; Wu, T.H. The Spatio-temporal Evolution of Drought Vulnerability in the Ecotone between Agriculture and Animal Husbandry in the North of China. J. Nat. Res. 2018, 33, 1599–1612. [Google Scholar] [CrossRef] [Green Version]
- Wang, X.; Li, Y.; Chen, Y.; Lian, J.; Luo, Y.; Niu, Y.; Gong, X.; Yu, P. Temporal and spatial variation of extreme temperatures in an agro-pastoral ecotone of northern China from 1960 to 2016. Sci. Rep. 2018, 8, 1–14. [Google Scholar] [CrossRef] [PubMed] [Green Version]
- Abliz, A.; Tiyip, T.; Ghulam, A.; Halik, U.; Ding, J.-L.; Sawut, M.; Zhang, F.; Abliz, A.; Nurmemet, I. Effects of shallow groundwater table and salinity on soil salt dynamics in the Keriya Oasis, Northwestern China. Environ. Earth Sci. 2016, 75, 260. [Google Scholar] [CrossRef]
- Yang, X.; Liu, S.; Yang, T.-B.; Xu, X.; Kang, C.; Tang, J.; Wei, H.; Ghebrezgabher, M.; Li, Z.; Kang, Q. Spatial-temporal dynamics of desert vegetation and its responses to climatic variations over the last three decades: A case study of Hexi region in Northwest China. J. Arid. Land 2016, 8, 556–568. [Google Scholar] [CrossRef] [Green Version]
- Xu, X.; Chen, H.; Levy, J.K. Spatiotemporal vegetation cover variations in the Qinghai-Tibet Plateau under global climate change. Sci. Bull. 2008, 53, 915–922. [Google Scholar] [CrossRef] [Green Version]
- Sun, D.; Zhang, J.; Hu, Y.; Jiang, J.; Zhou, L. Spatial analysis of China’s eco-environmental quality: 1990–2010. J. Geogr. Sci. 2013, 23, 695–709. [Google Scholar] [CrossRef]
- Chen, C.; Park, T.; Wang, X.; Piao, S.; Xu, B.; Chaturvedi, R.K.; Fuchs, R.; Brovkin, V.; Ciais, P.; Fensholt, R.; et al. China and India lead in greening of the world through land-use management. Nat. Sustain. 2019, 2, 122–129. [Google Scholar] [CrossRef]
Figure 1.
Calculation process of the eco-environment factor weight based on knowledge granulation entropy.
Figure 1.
Calculation process of the eco-environment factor weight based on knowledge granulation entropy.

Figure 2.
RSEI analysis framework of China.

Figure 3.
Regional spatial distributions of the RSEI in China in 2000–2017.

Figure 4.
Spatial changing distributions of RSEI in China in 2000–2017.

Figure 5.
Spatial transfer distributions of the ecological levels of the RSEI in China in 2000–2017.
Figure 5.
Spatial transfer distributions of the ecological levels of the RSEI in China in 2000–2017.

Figure 6.
2017 results from different method. We used the method of this paper (a) principal component analysis (b), and AHP (c) to compare RSEI in 2017.
Figure 6.
2017 results from different method. We used the method of this paper (a) principal component analysis (b), and AHP (c) to compare RSEI in 2017.


Table 1.
Knowledge granulation entropy and weight of the RSEI in China in 2000–2017.
| Index | 2000 | 2005 | 2009 | 2014 | 2017 | |||||
|---|---|---|---|---|---|---|---|---|---|---|
| KGE | Weight | KGE | Weight | KGE | Weight | KGE | Weight | KGE | Weight | |
| NDBI | 0.8815 | 0.3274 | 0.8837 | 0.3189 | 0.9184 | 0.2536 | 0.8785 | 0.3246 | 0.9096 | 0.2617 |
| NDVI | 0.9185 | 0.2252 | 0.9149 | 0.2334 | 0.9152 | 0.2636 | 0.9091 | 0.2428 | 0.9202 | 0.2309 |
| NDWI | 0.9303 | 0.1925 | 0.9419 | 0.1593 | 0.9410 | 0.1833 | 0.9323 | 0.1807 | 0.9167 | 0.2410 |
| LST | 0.9078 | 0.2548 | 0.8948 | 0.2883 | 0.9037 | 0.2994 | 0.9057 | 0.2519 | 0.9079 | 0.2665 |
Table 2.
Statistical information about the RSEI in China in 2000–2017.
| Year | Min | Max | Mean |
|---|---|---|---|
| 2000 | 0.1367 | 0.6855 | 0.2482 |
| 2005 | 0.1363 | 0.7046 | 0.2601 |
| 2009 | 0.1279 | 0.7227 | 0.2605 |
| 2014 | 0.1478 | 0.7075 | 0.2591 |
| 2017 | 0.1696 | 0.6993 | 0.2842 |
Table 3.
Percentage of areas of the types of ecological regions according to the RSEI of China from 2000–2017.
Table 3.
Percentage of areas of the types of ecological regions according to the RSEI of China from 2000–2017.
| Type | 2000 | 2005 | 2009 | 2014 | 2017 |
|---|---|---|---|---|---|
| 1 | 1.182% | 0.008% | 0.002% | 0.316% | 0.000% |
| 2 | 36.293% | 27.119% | 16.654% | 34.583% | 15.923% |
| 3 | 52.291% | 54.115% | 67.460% | 49.111% | 66.382% |
| 4 | 10.168% | 18.339% | 15.832% | 15.832% | 17.682% |
| 5 | 0.066% | 0.418% | 0.053% | 0.157% | 0.012% |
Table 4.
Percentage of ecological change in the regions of China in 2000–2017.
| Type | 2000–2005 | 2005–2009 | 2009–2014 | 2014–2017 |
|---|---|---|---|---|
| Improvement Area | 18.26% | 13.95% | 1.67% | 31.88% |
| Degradation Area | 0.22% | 4.20% | 32.93% | 0.84% |
Table 5.
Transfer matrix of the RSEI in China in 2000–2017 (million km2).
| 2000–2005 | ||||||
| 1 | 2 | 3 | 4 | 5 | Area | |
| 1 | 0.057 | 11.236 | 0.062 | 0.001 | 0.000 | 11.357 |
| 2 | 0.018 | 242.970 | 105.082 | 0.486 | 0.004 | 348.561 |
| 3 | 0.000 | 6.241 | 408.520 | 87.439 | 0.008 | 502.208 |
| 4 | 0.000 | 0.010 | 6.068 | 88.153 | 3.427 | 97.658 |
| 5 | 0.000 | 0.000 | 0.000 | 0.054 | 0.575 | 0.629 |
| 2005–2009 | ||||||
| 1 | 0.006 | 0.069 | 0.000 | 0.000 | 0.000 | 0.076 |
| 2 | 0.005 | 151.524 | 108.924 | 0.004 | 0.000 | 260.457 |
| 3 | 0.006 | 8.315 | 480.640 | 30.772 | 0.000 | 519.732 |
| 4 | 0.000 | 0.034 | 58.309 | 117.439 | 0.352 | 176.133 |
| 5 | 0.000 | 0.001 | 0.018 | 3.836 | 0.161 | 4.015 |
| 2009–2014 | ||||||
| 1 | 0.006 | 0.004 | 0.007 | 0.000 | 0.000 | 0.017 |
| 2 | 2.985 | 153.962 | 2.964 | 0.032 | 0.000 | 159.943 |
| 3 | 0.044 | 178.065 | 426.549 | 43.229 | 0.004 | 647.891 |
| 4 | 0.000 | 0.113 | 42.151 | 108.327 | 1.459 | 152.050 |
| 5 | 0.000 | 0.000 | 0.000 | 0.468 | 0.044 | 0.513 |
| 2014–2017 | ||||||
| 1 | 0.003 | 2.998 | 0.033 | 0.000 | 0.000 | 3.035 |
| 2 | 0.000 | 149.385 | 182.416 | 0.343 | 0.000 | 332.144 |
| 3 | 0.000 | 0.541 | 421.629 | 49.501 | 0.000 | 471.671 |
| 4 | 0.000 | 0.000 | 33.465 | 118.511 | 0.080 | 152.056 |
| 5 | 0.000 | 0.000 | 0.002 | 1.467 | 0.038 | 1.508 |
© 2020 by the authors. Licensee MDPI, Basel, Switzerland. This article is an open access article distributed under the terms and conditions of the Creative Commons Attribution (CC BY) license (http://creativecommons.org/licenses/by/4.0/).
Share and Cite
MDPI and ACS Style
Liao, W.; Jiang, W. Evaluation of the Spatiotemporal Variations in the Eco-environmental Quality in China Based on the Remote Sensing Ecological Index. Remote Sens. 2020, 12, 2462. https://0-doi-org.brum.beds.ac.uk/10.3390/rs12152462
AMA Style
Liao W, Jiang W. Evaluation of the Spatiotemporal Variations in the Eco-environmental Quality in China Based on the Remote Sensing Ecological Index. Remote Sensing. 2020; 12(15):2462. https://0-doi-org.brum.beds.ac.uk/10.3390/rs12152462
Chicago/Turabian StyleLiao, Weihua, and Weiguo Jiang. 2020. "Evaluation of the Spatiotemporal Variations in the Eco-environmental Quality in China Based on the Remote Sensing Ecological Index" Remote Sensing 12, no. 15: 2462. https://0-doi-org.brum.beds.ac.uk/10.3390/rs12152462
Note that from the first issue of 2016, this journal uses article numbers instead of page numbers. See further details here.