Misperceptions of Predominant Slum Locations? Spatial Analysis of Slum Locations in Terms of Topography Based on Earth Observation Data


Abstract
:
1. Introduction
2. Conceptual Foundation
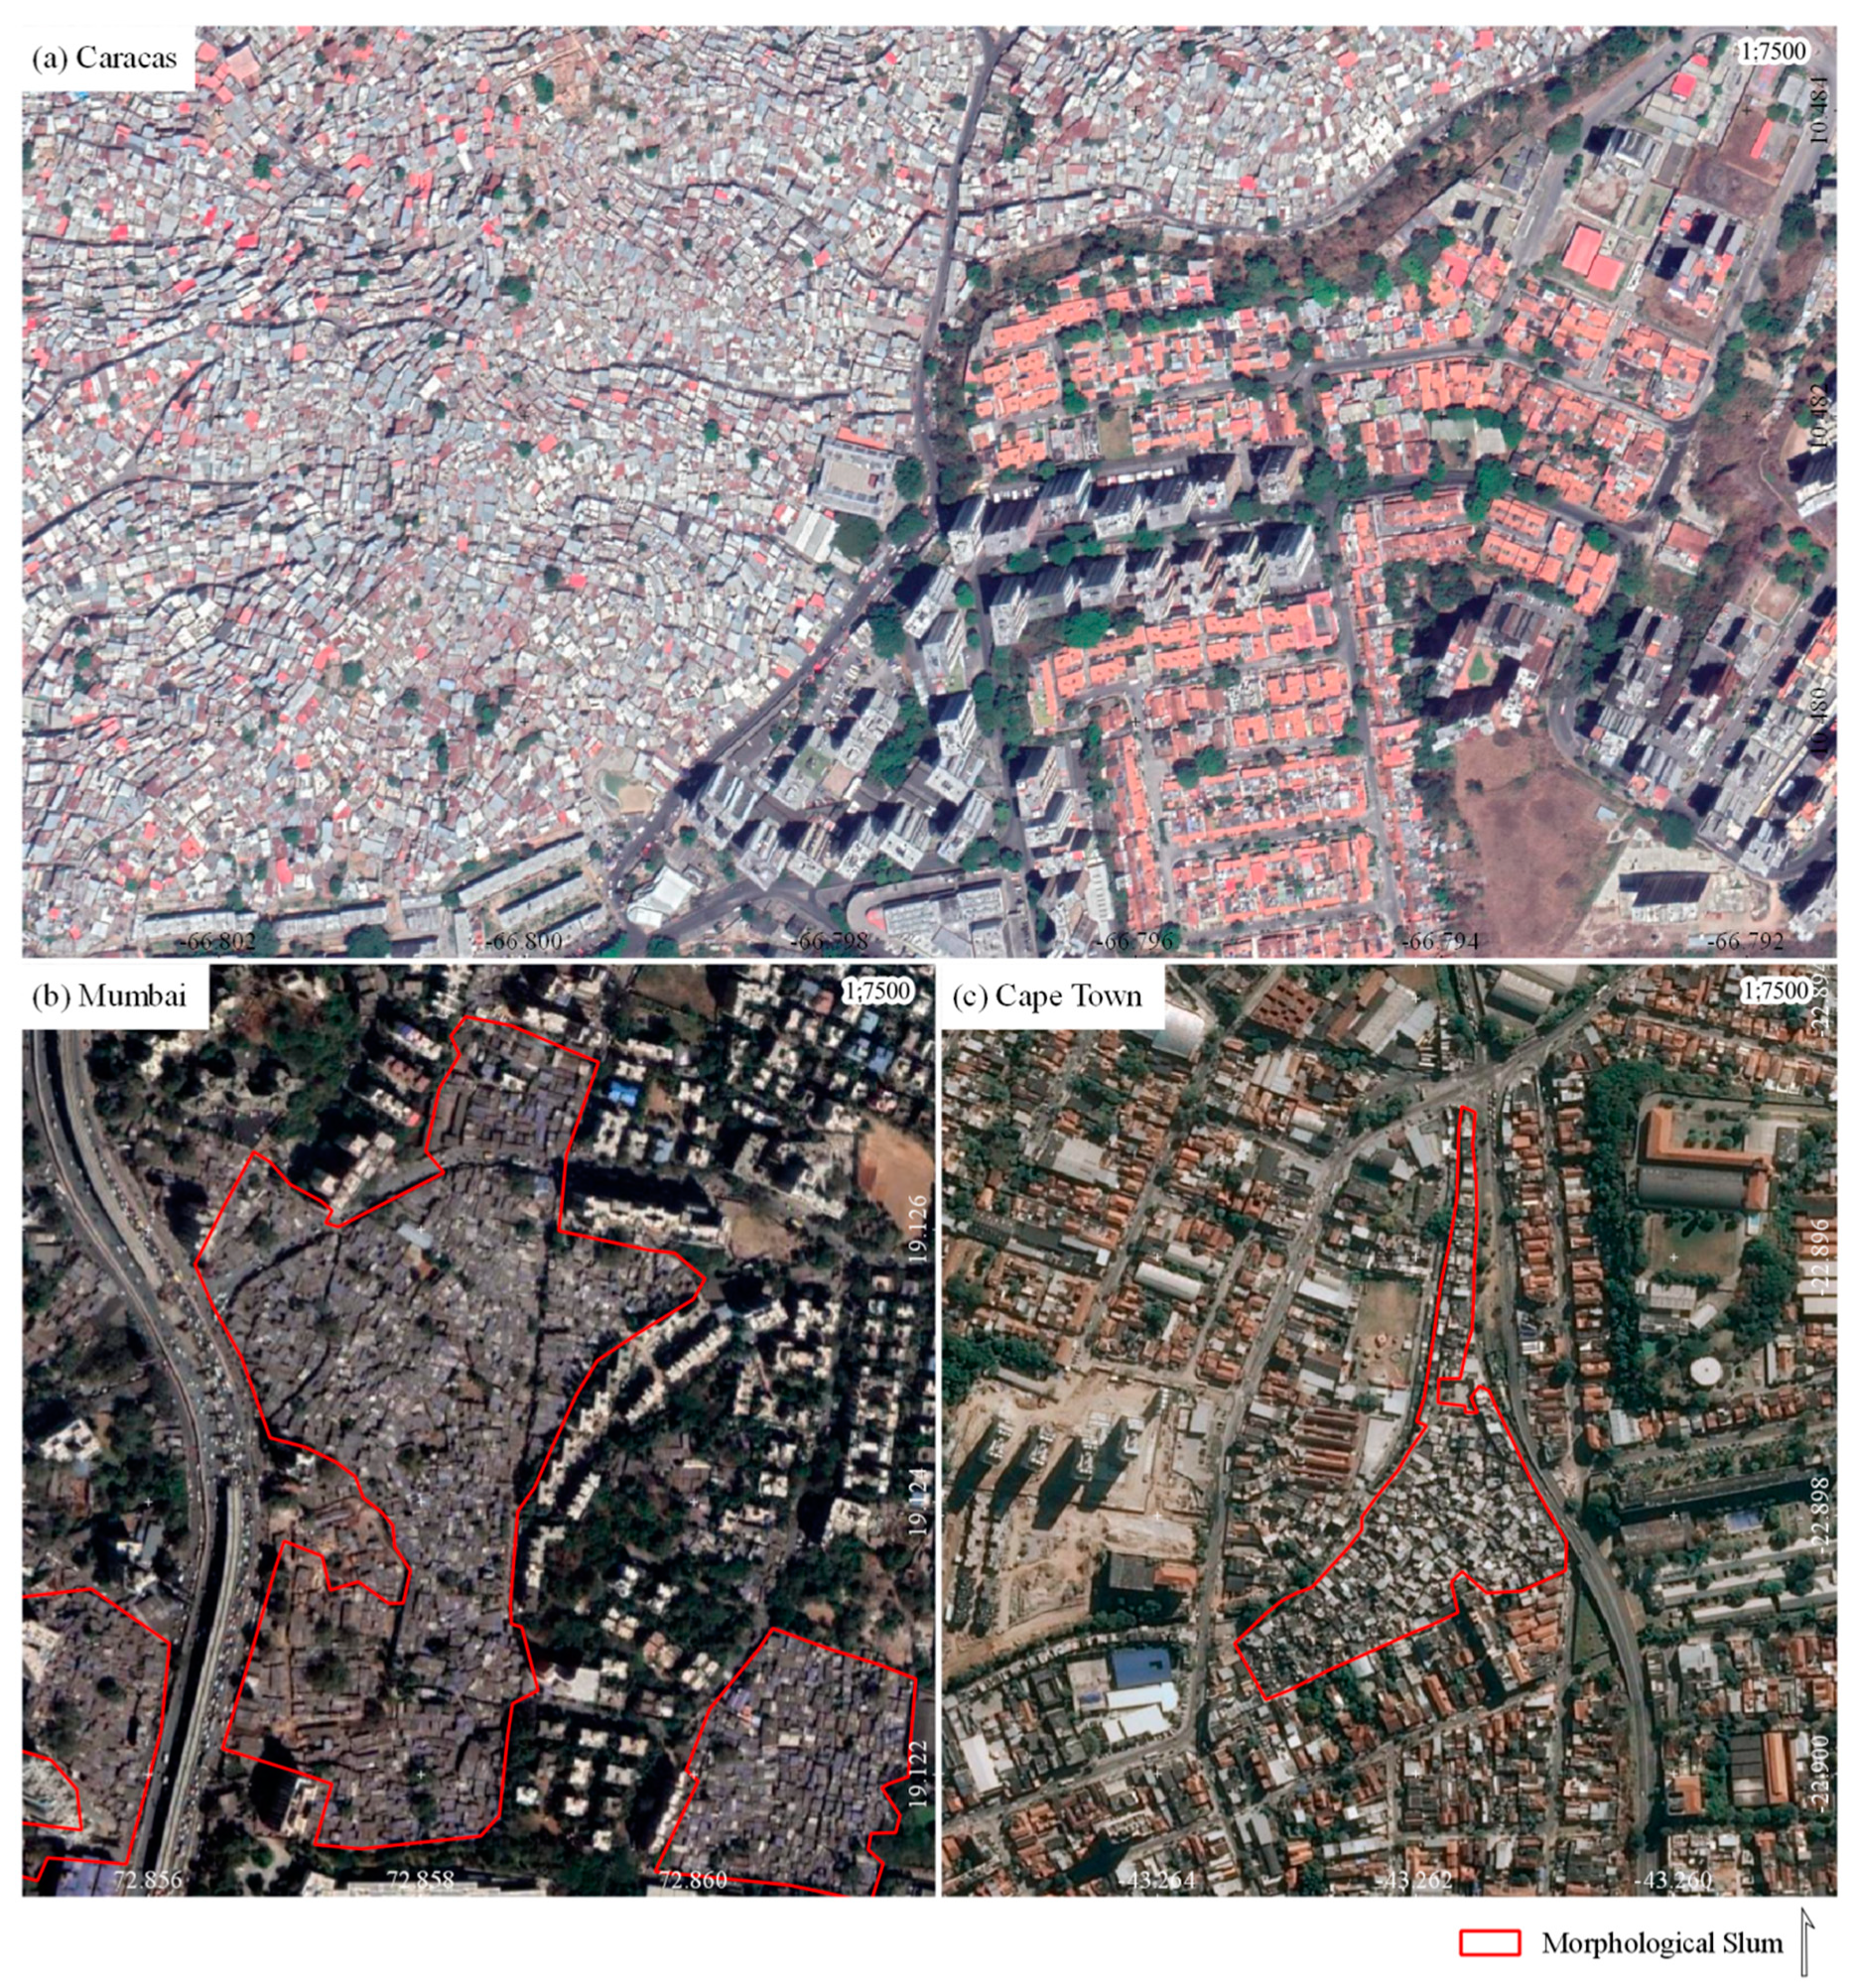
2.1. The Concept of Morphological Slums
2.2. The Concept of Landslide Suspectibility
3. Workflow, Materials, and Methods
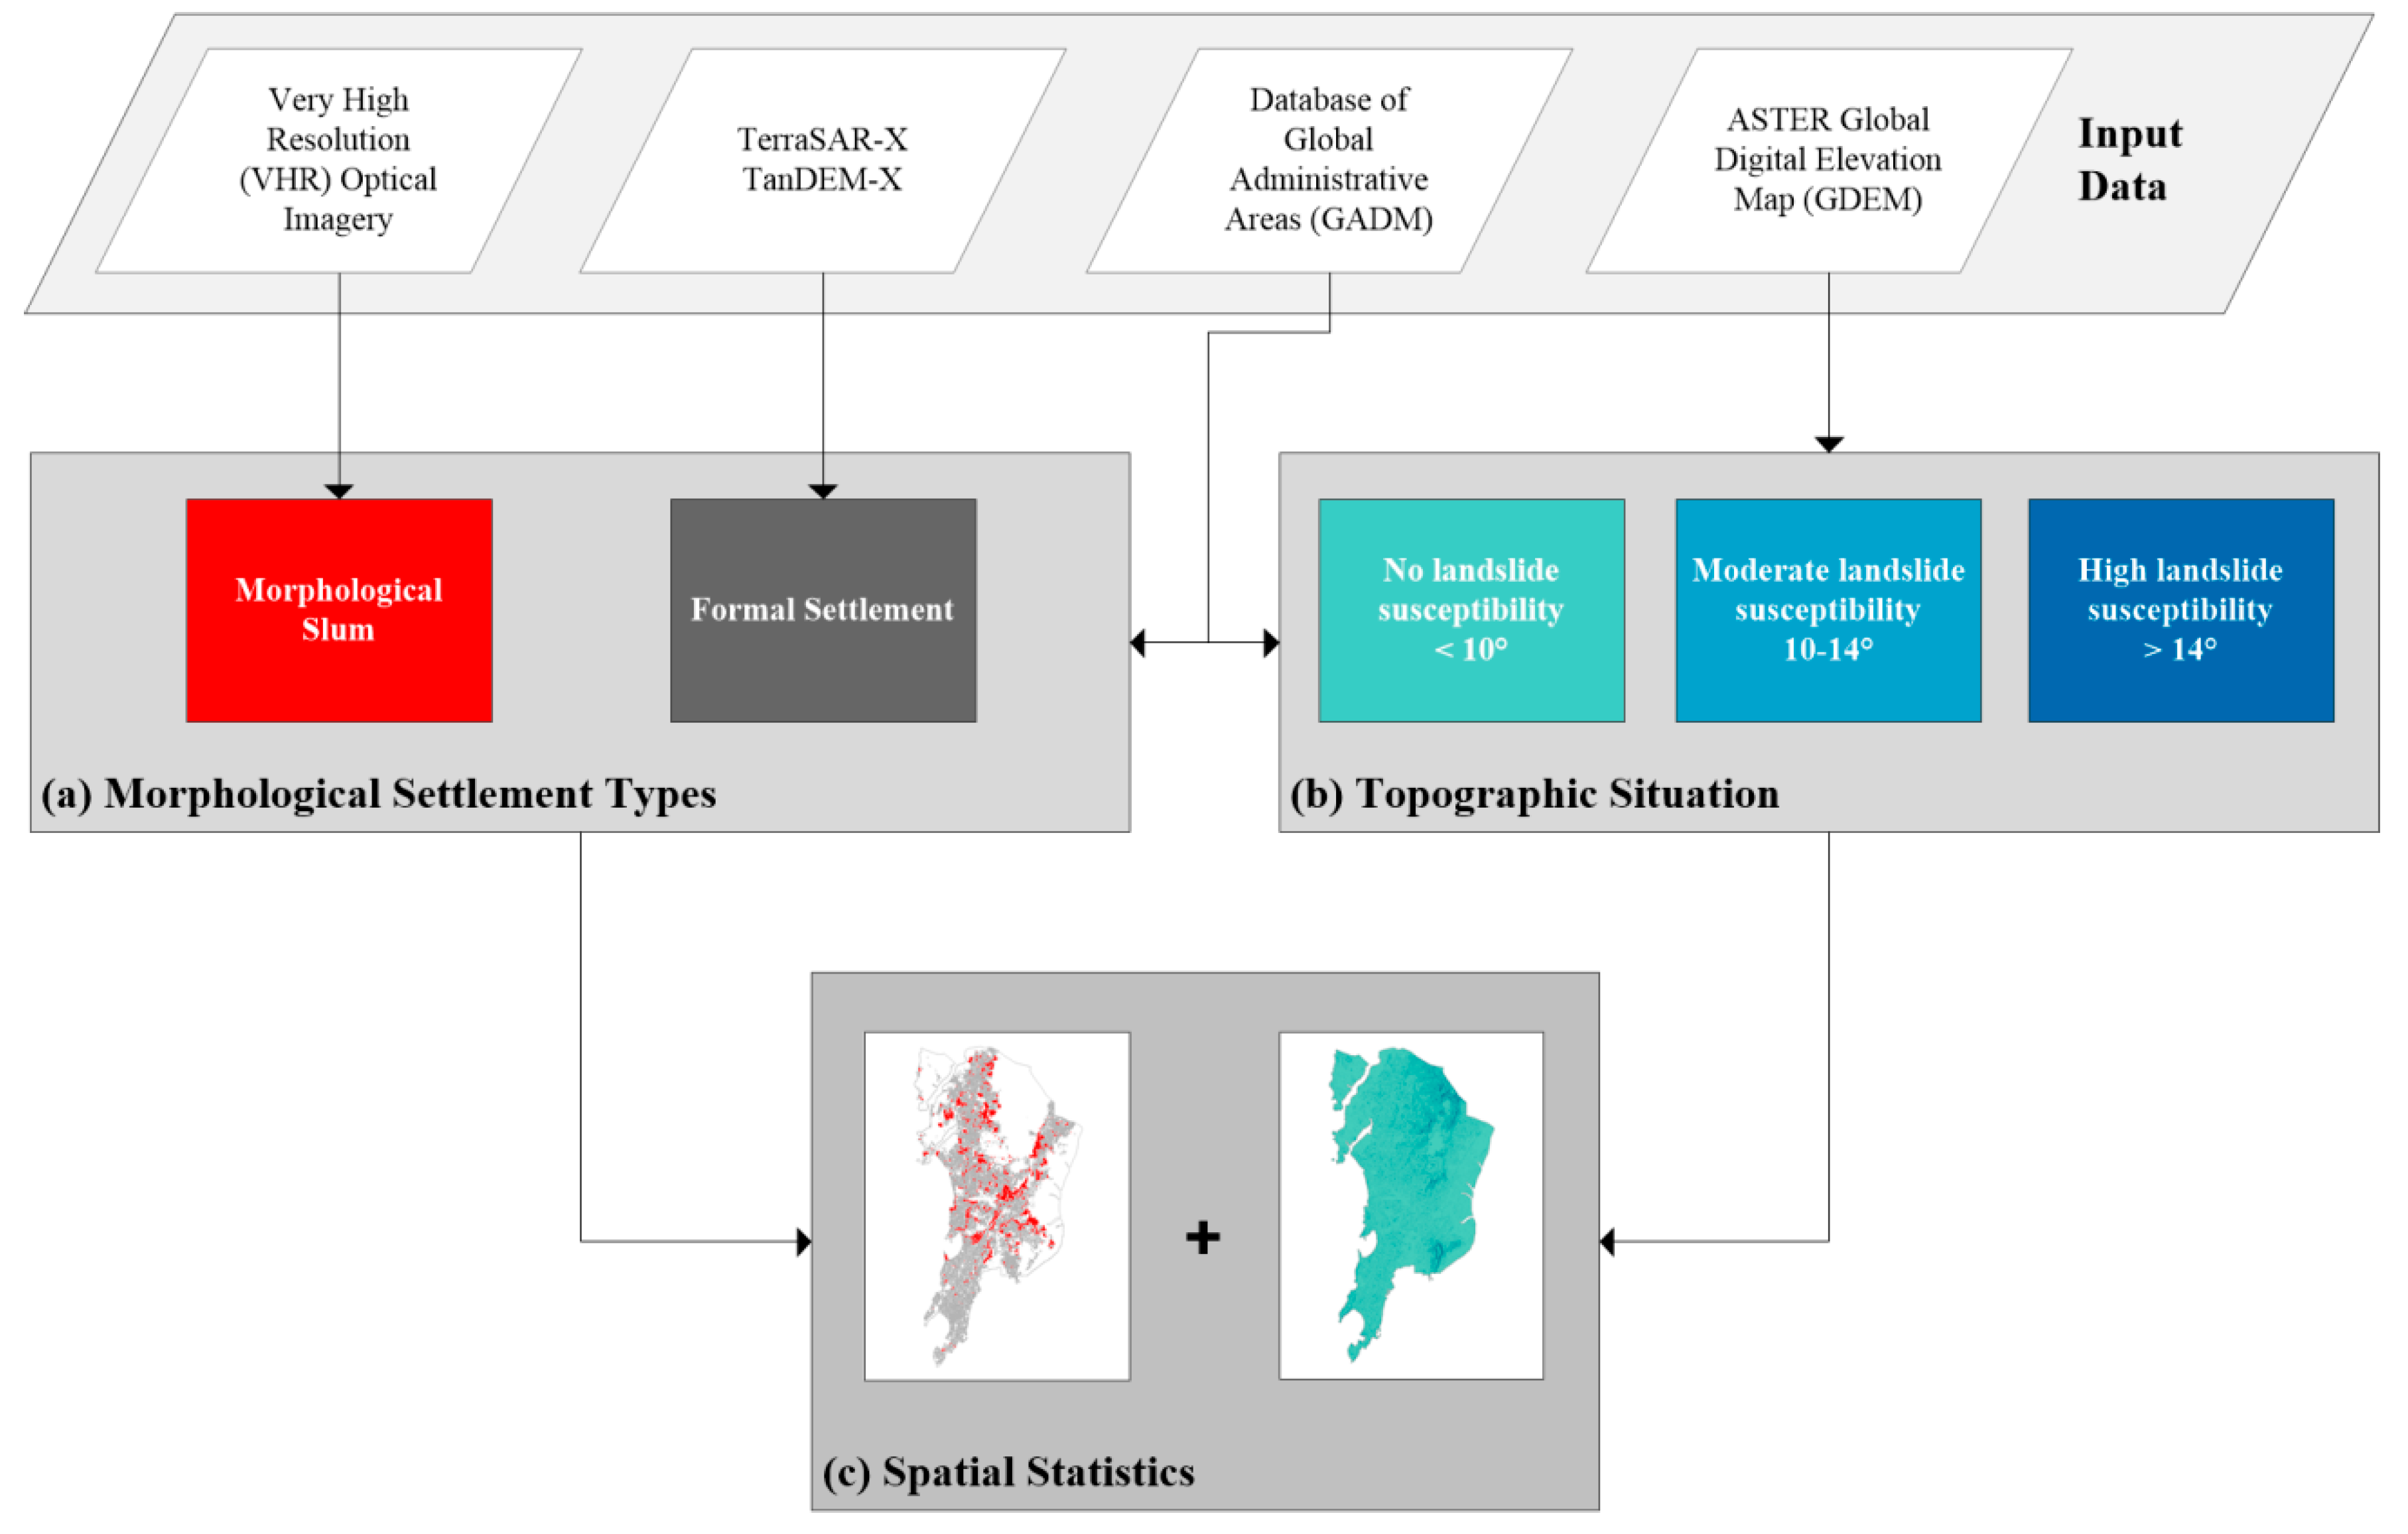
3.1. Study Workflow
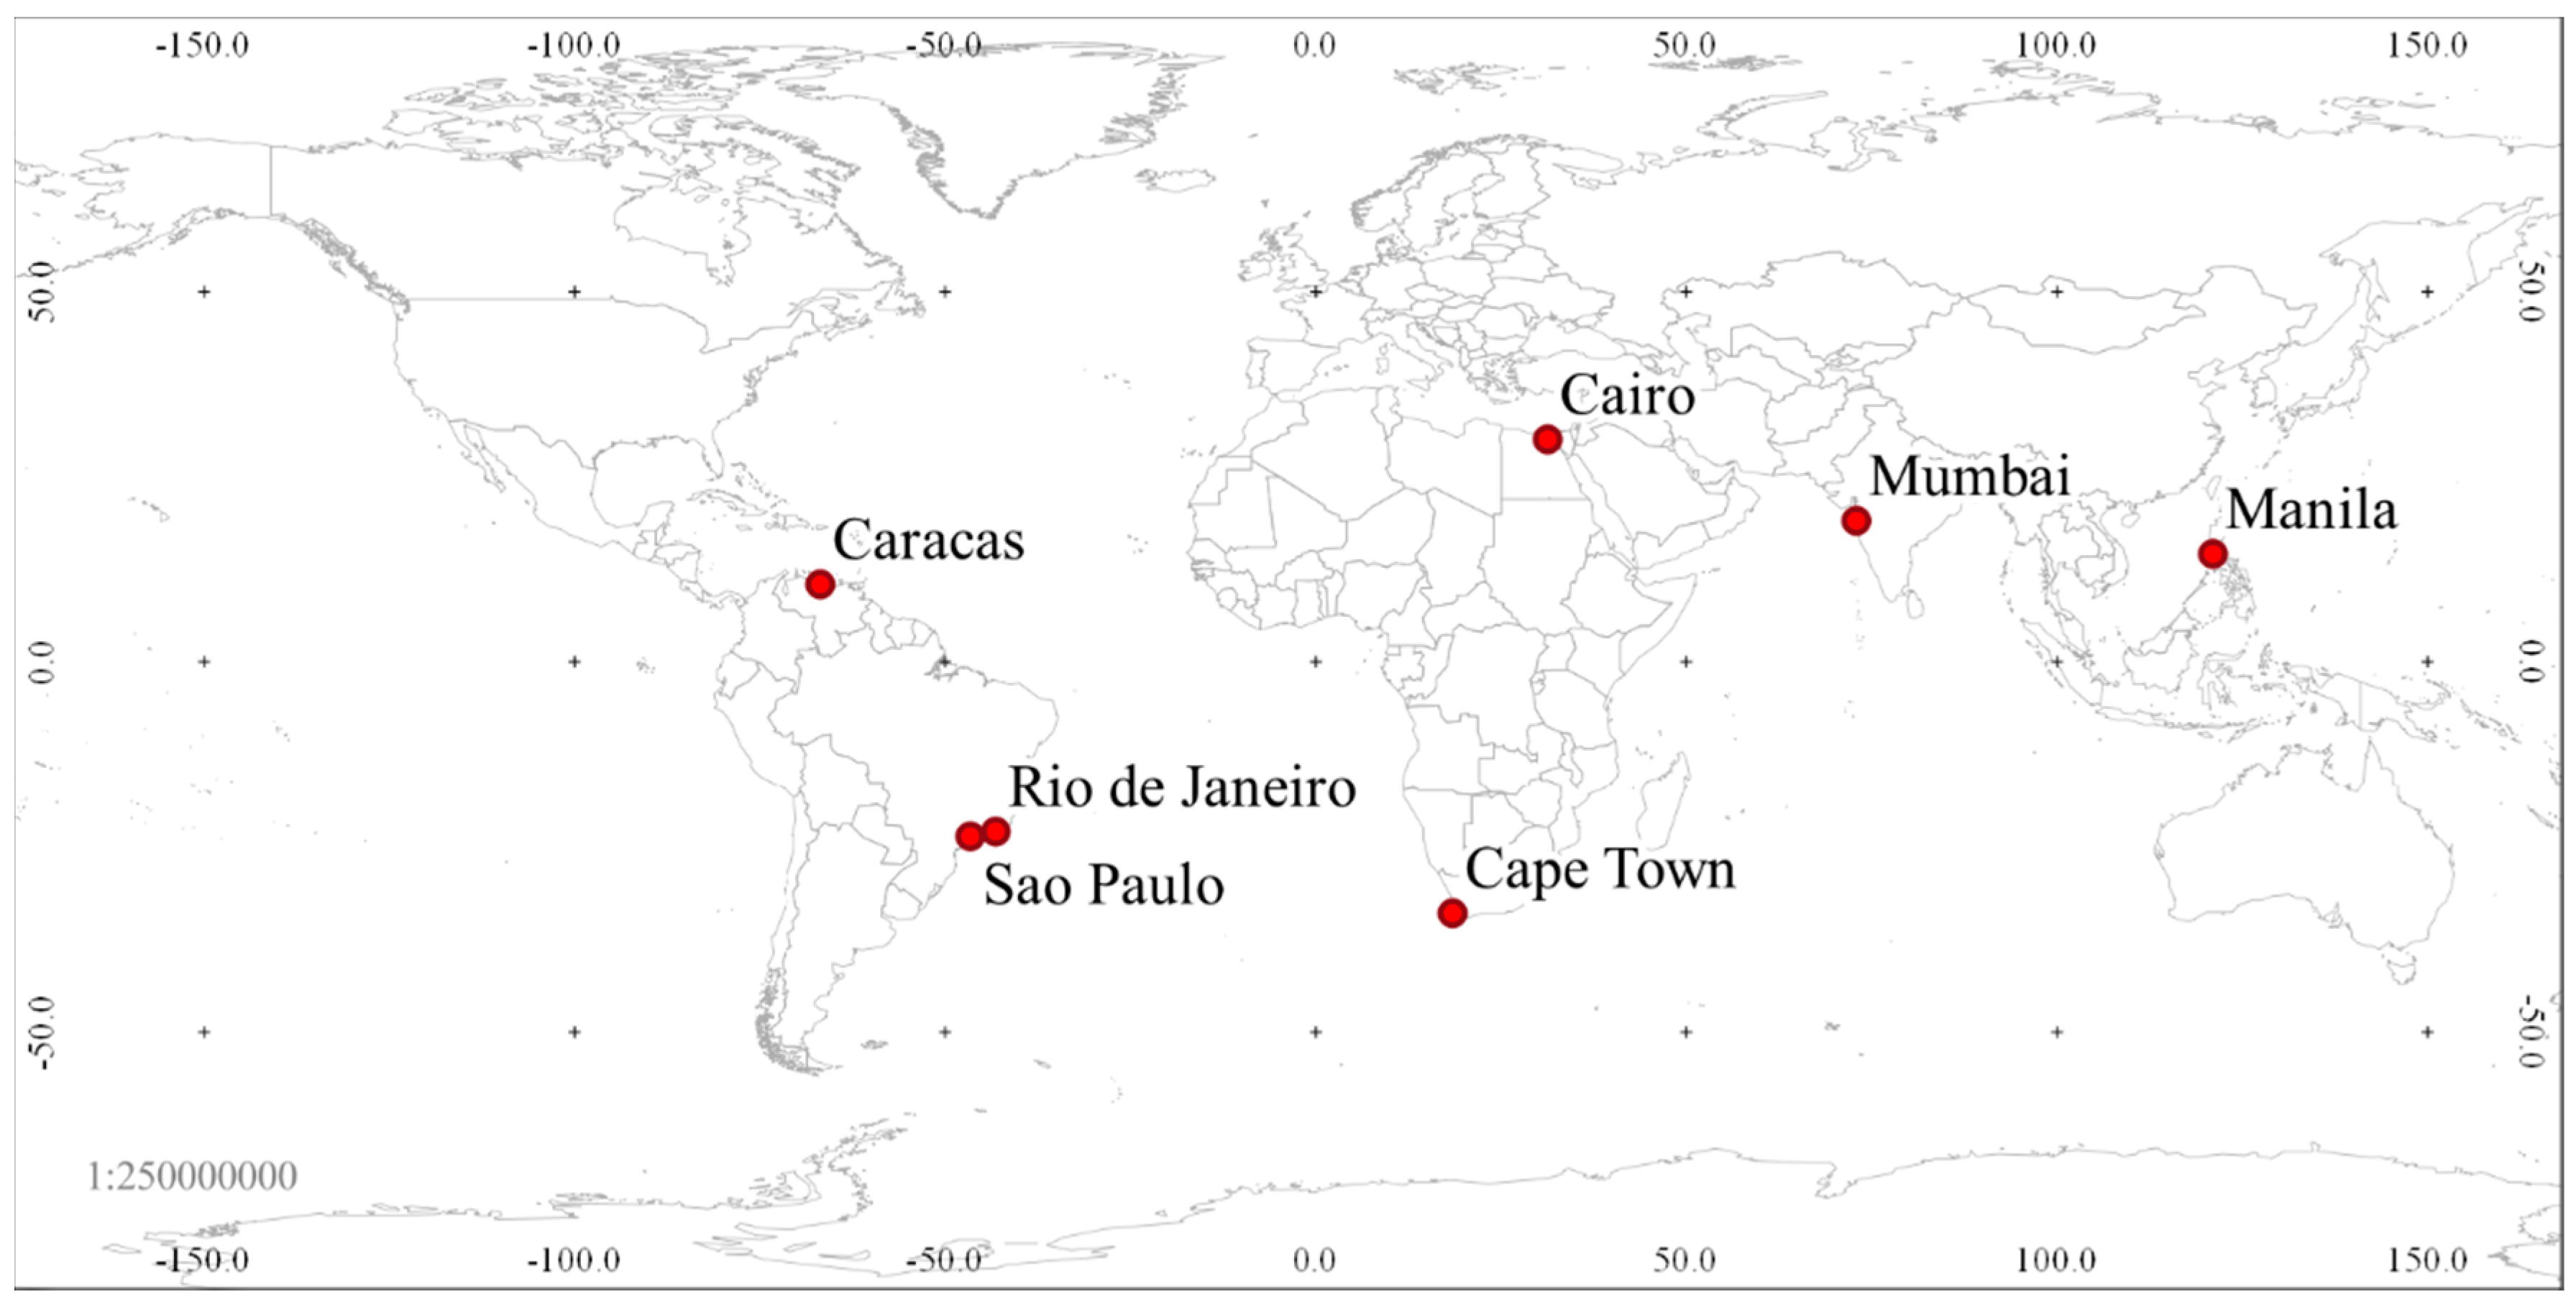
3.2. Study Area
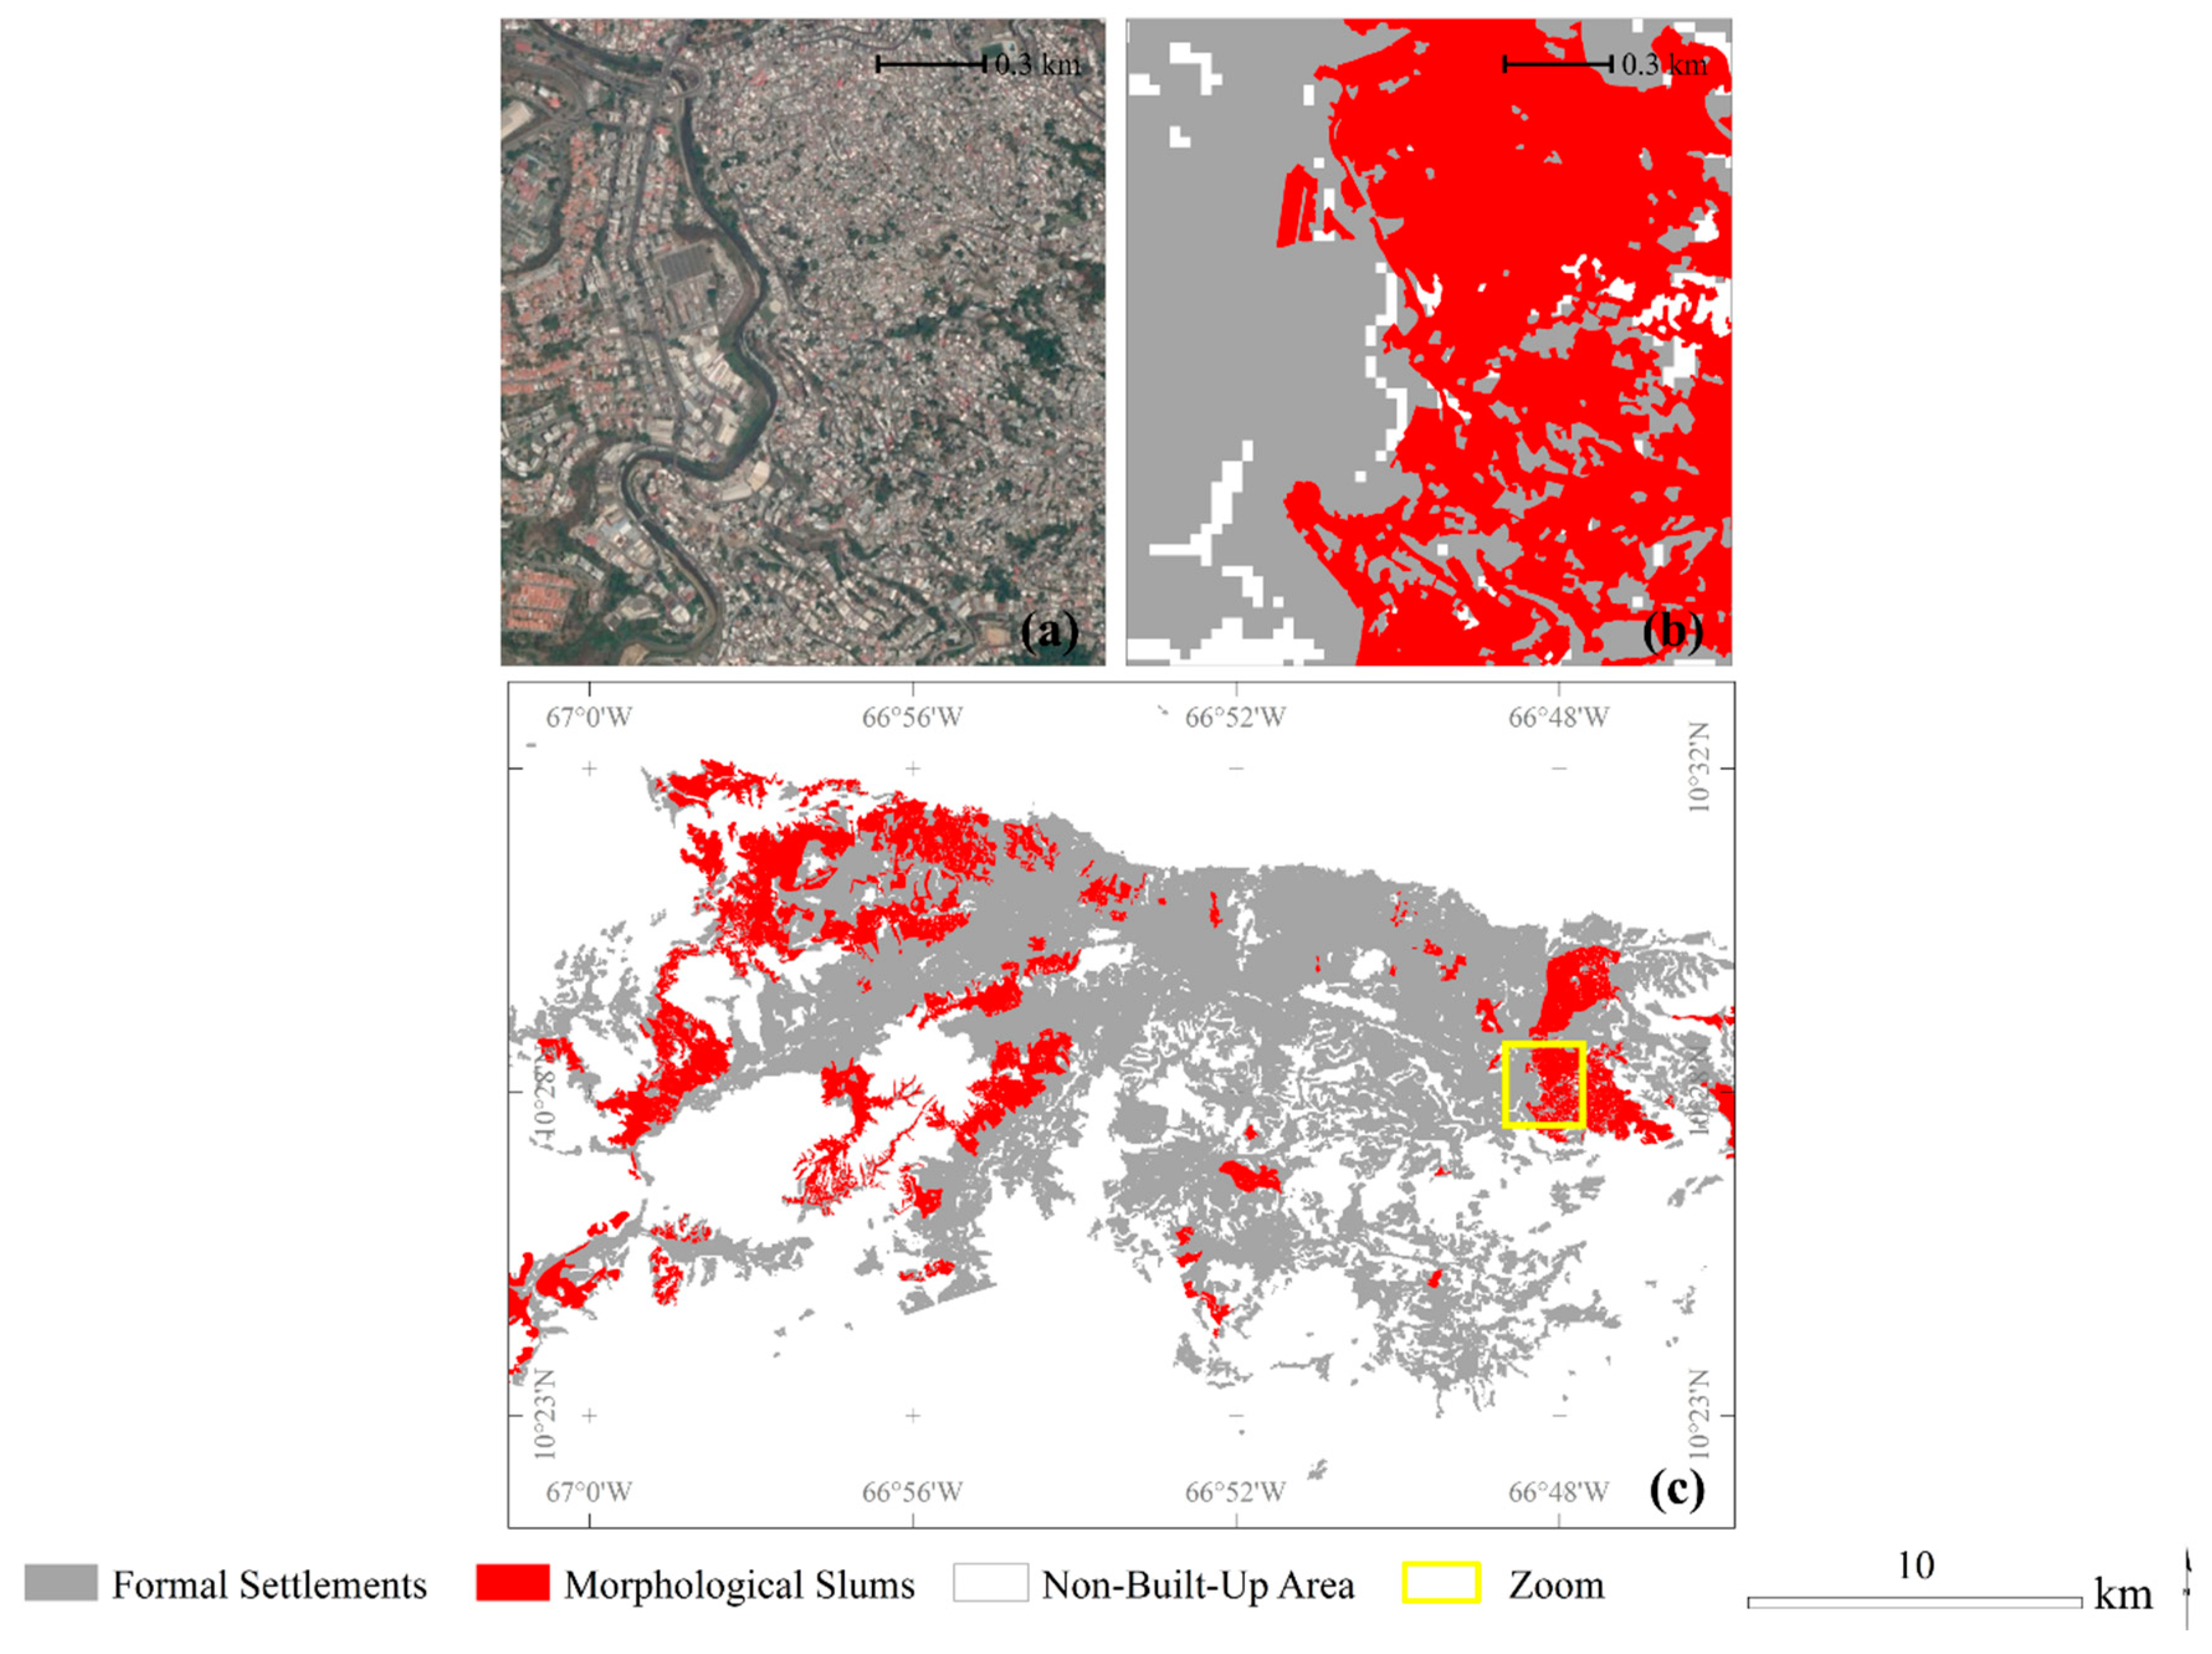
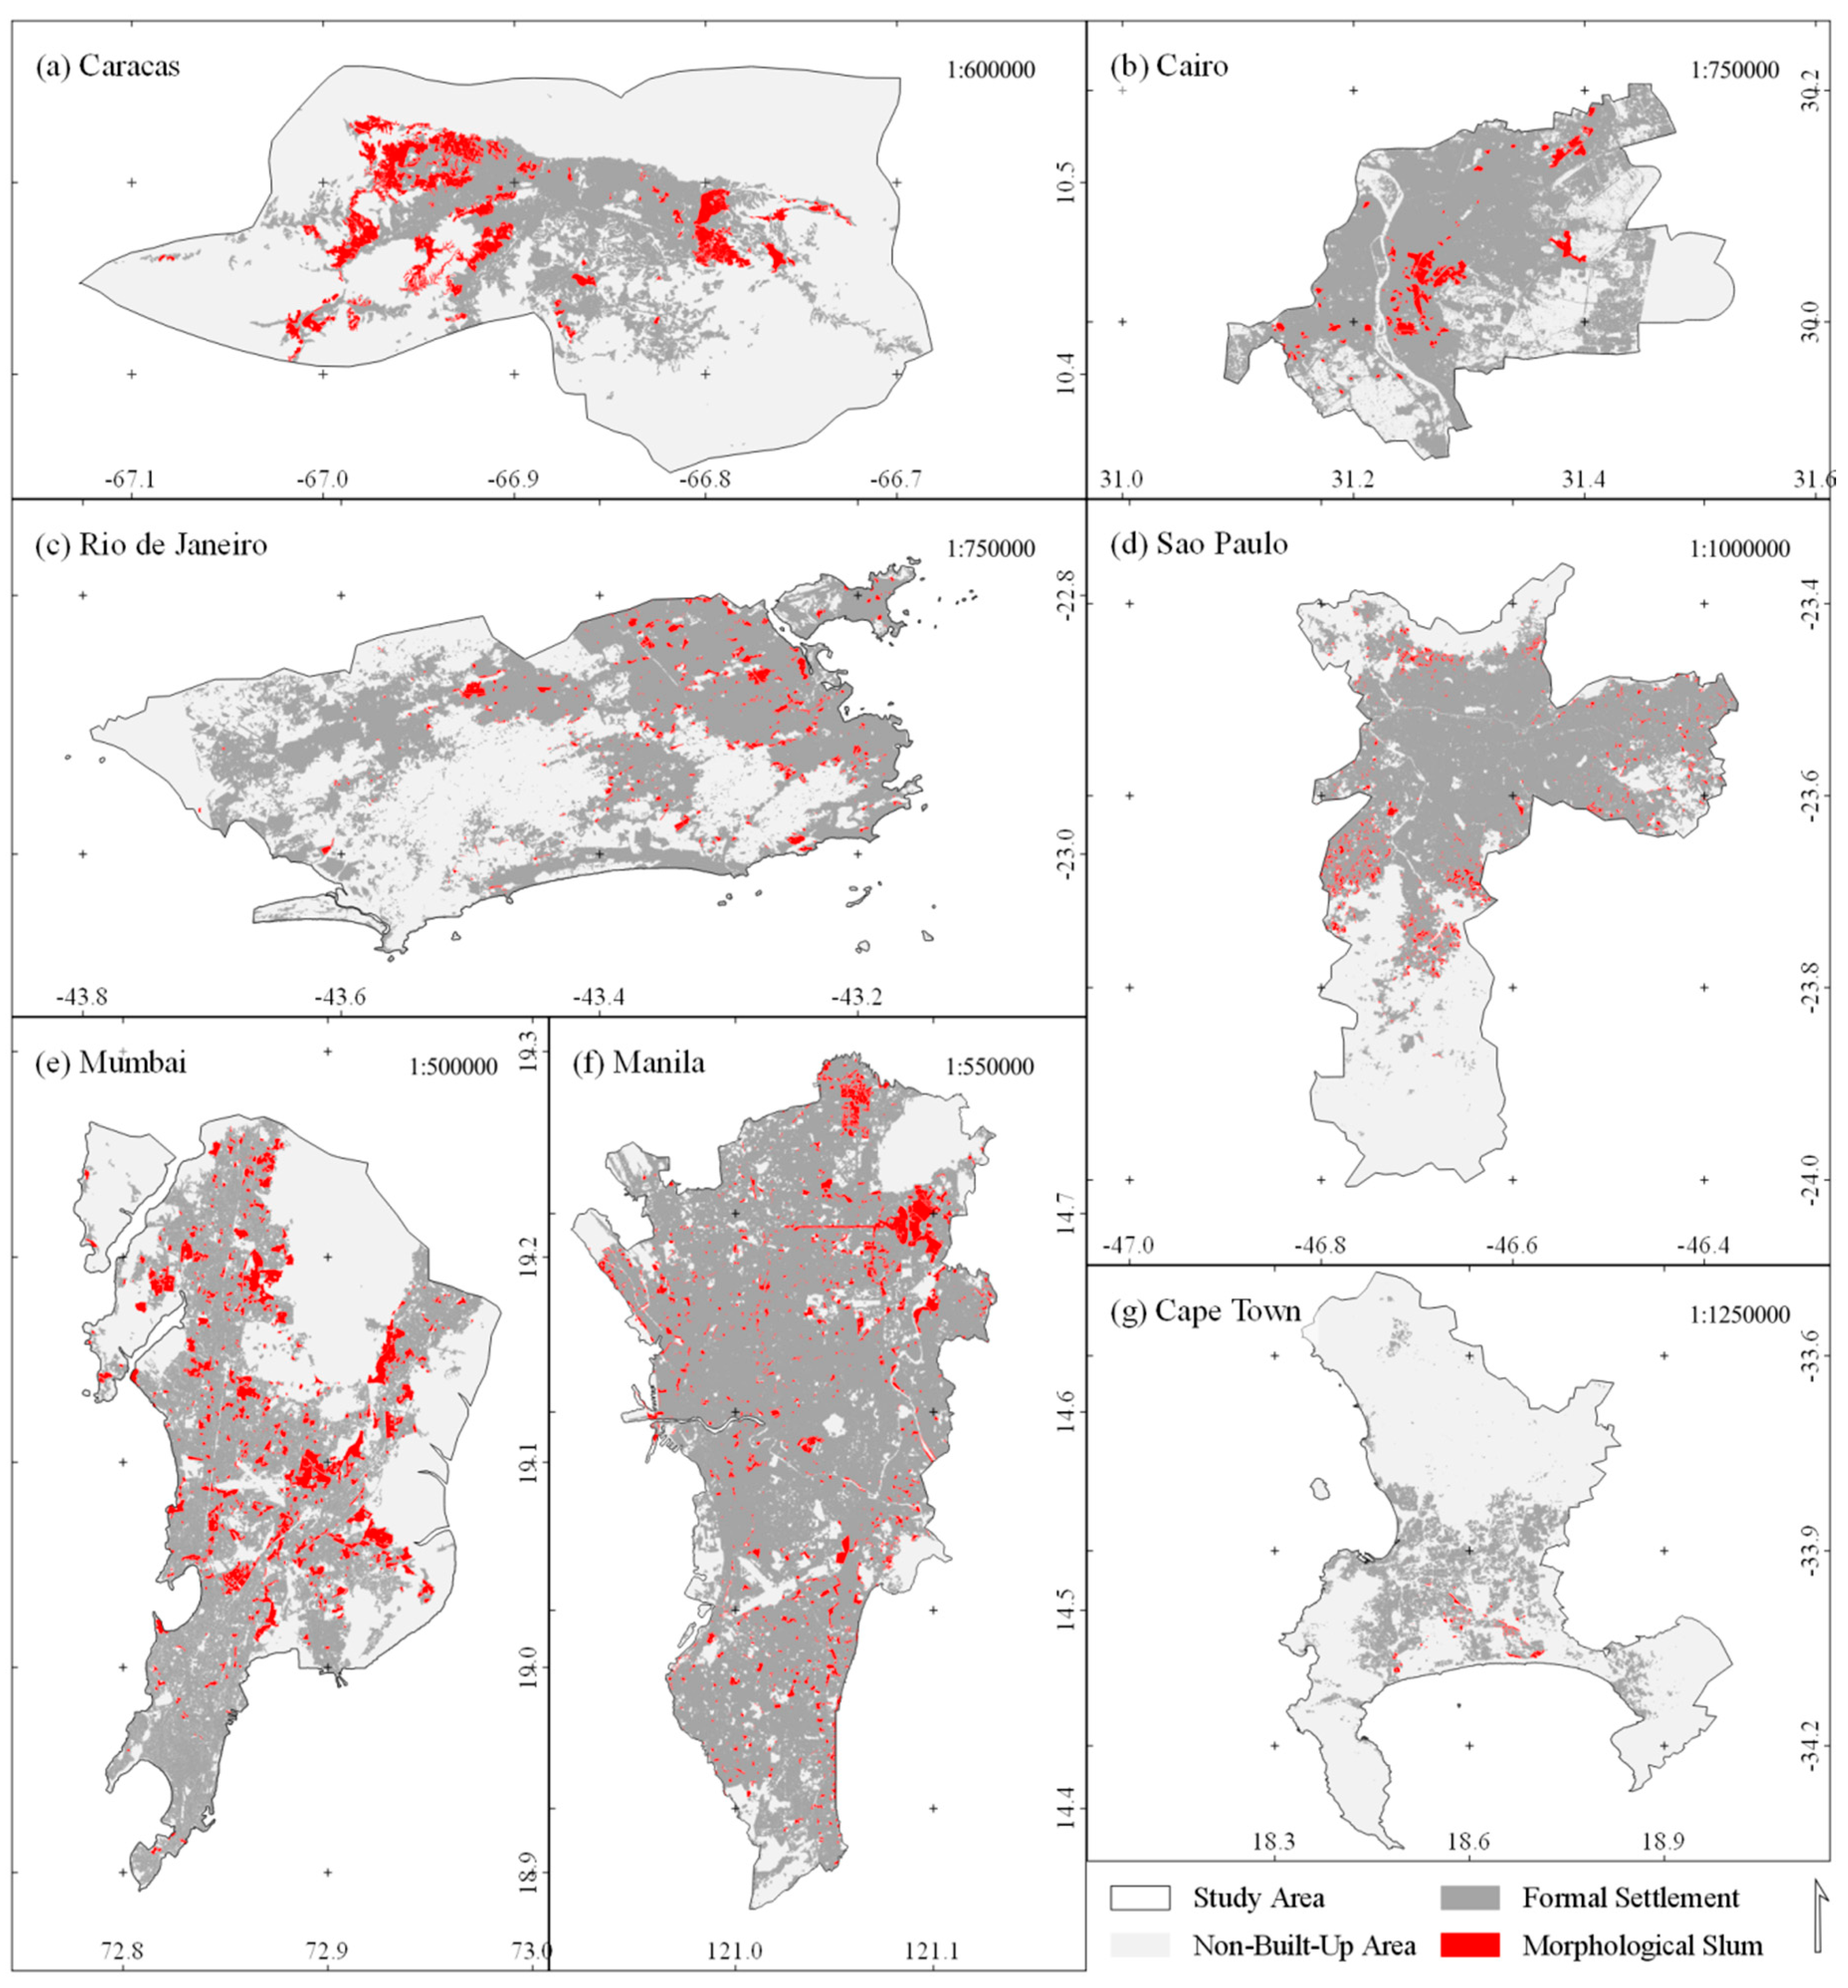
3.3. Morphological Settlement Types
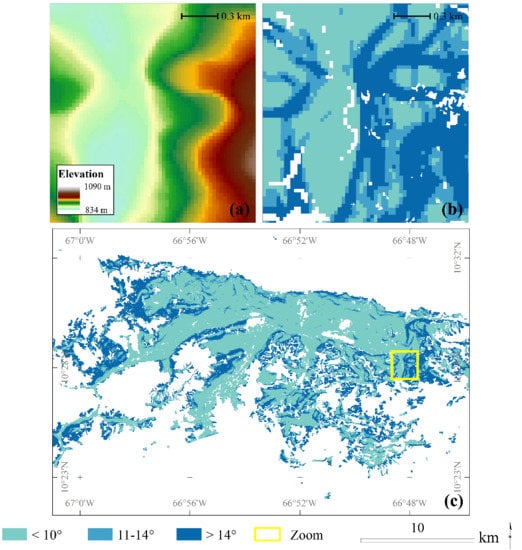
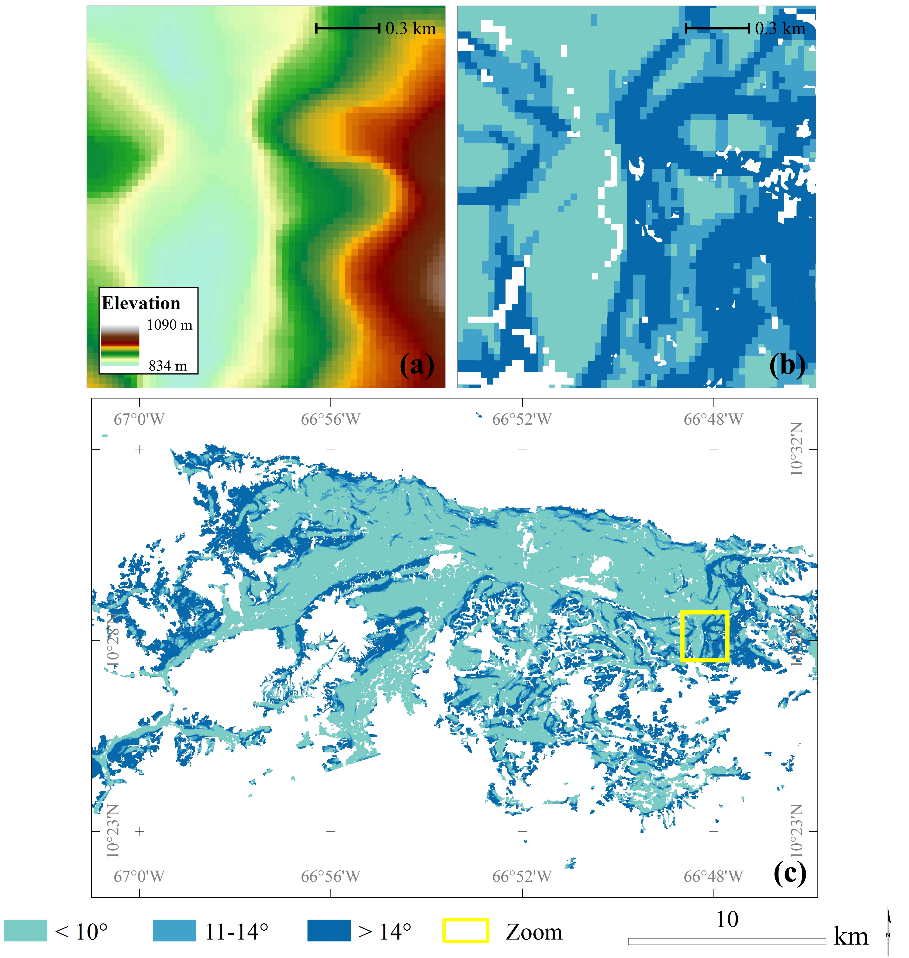
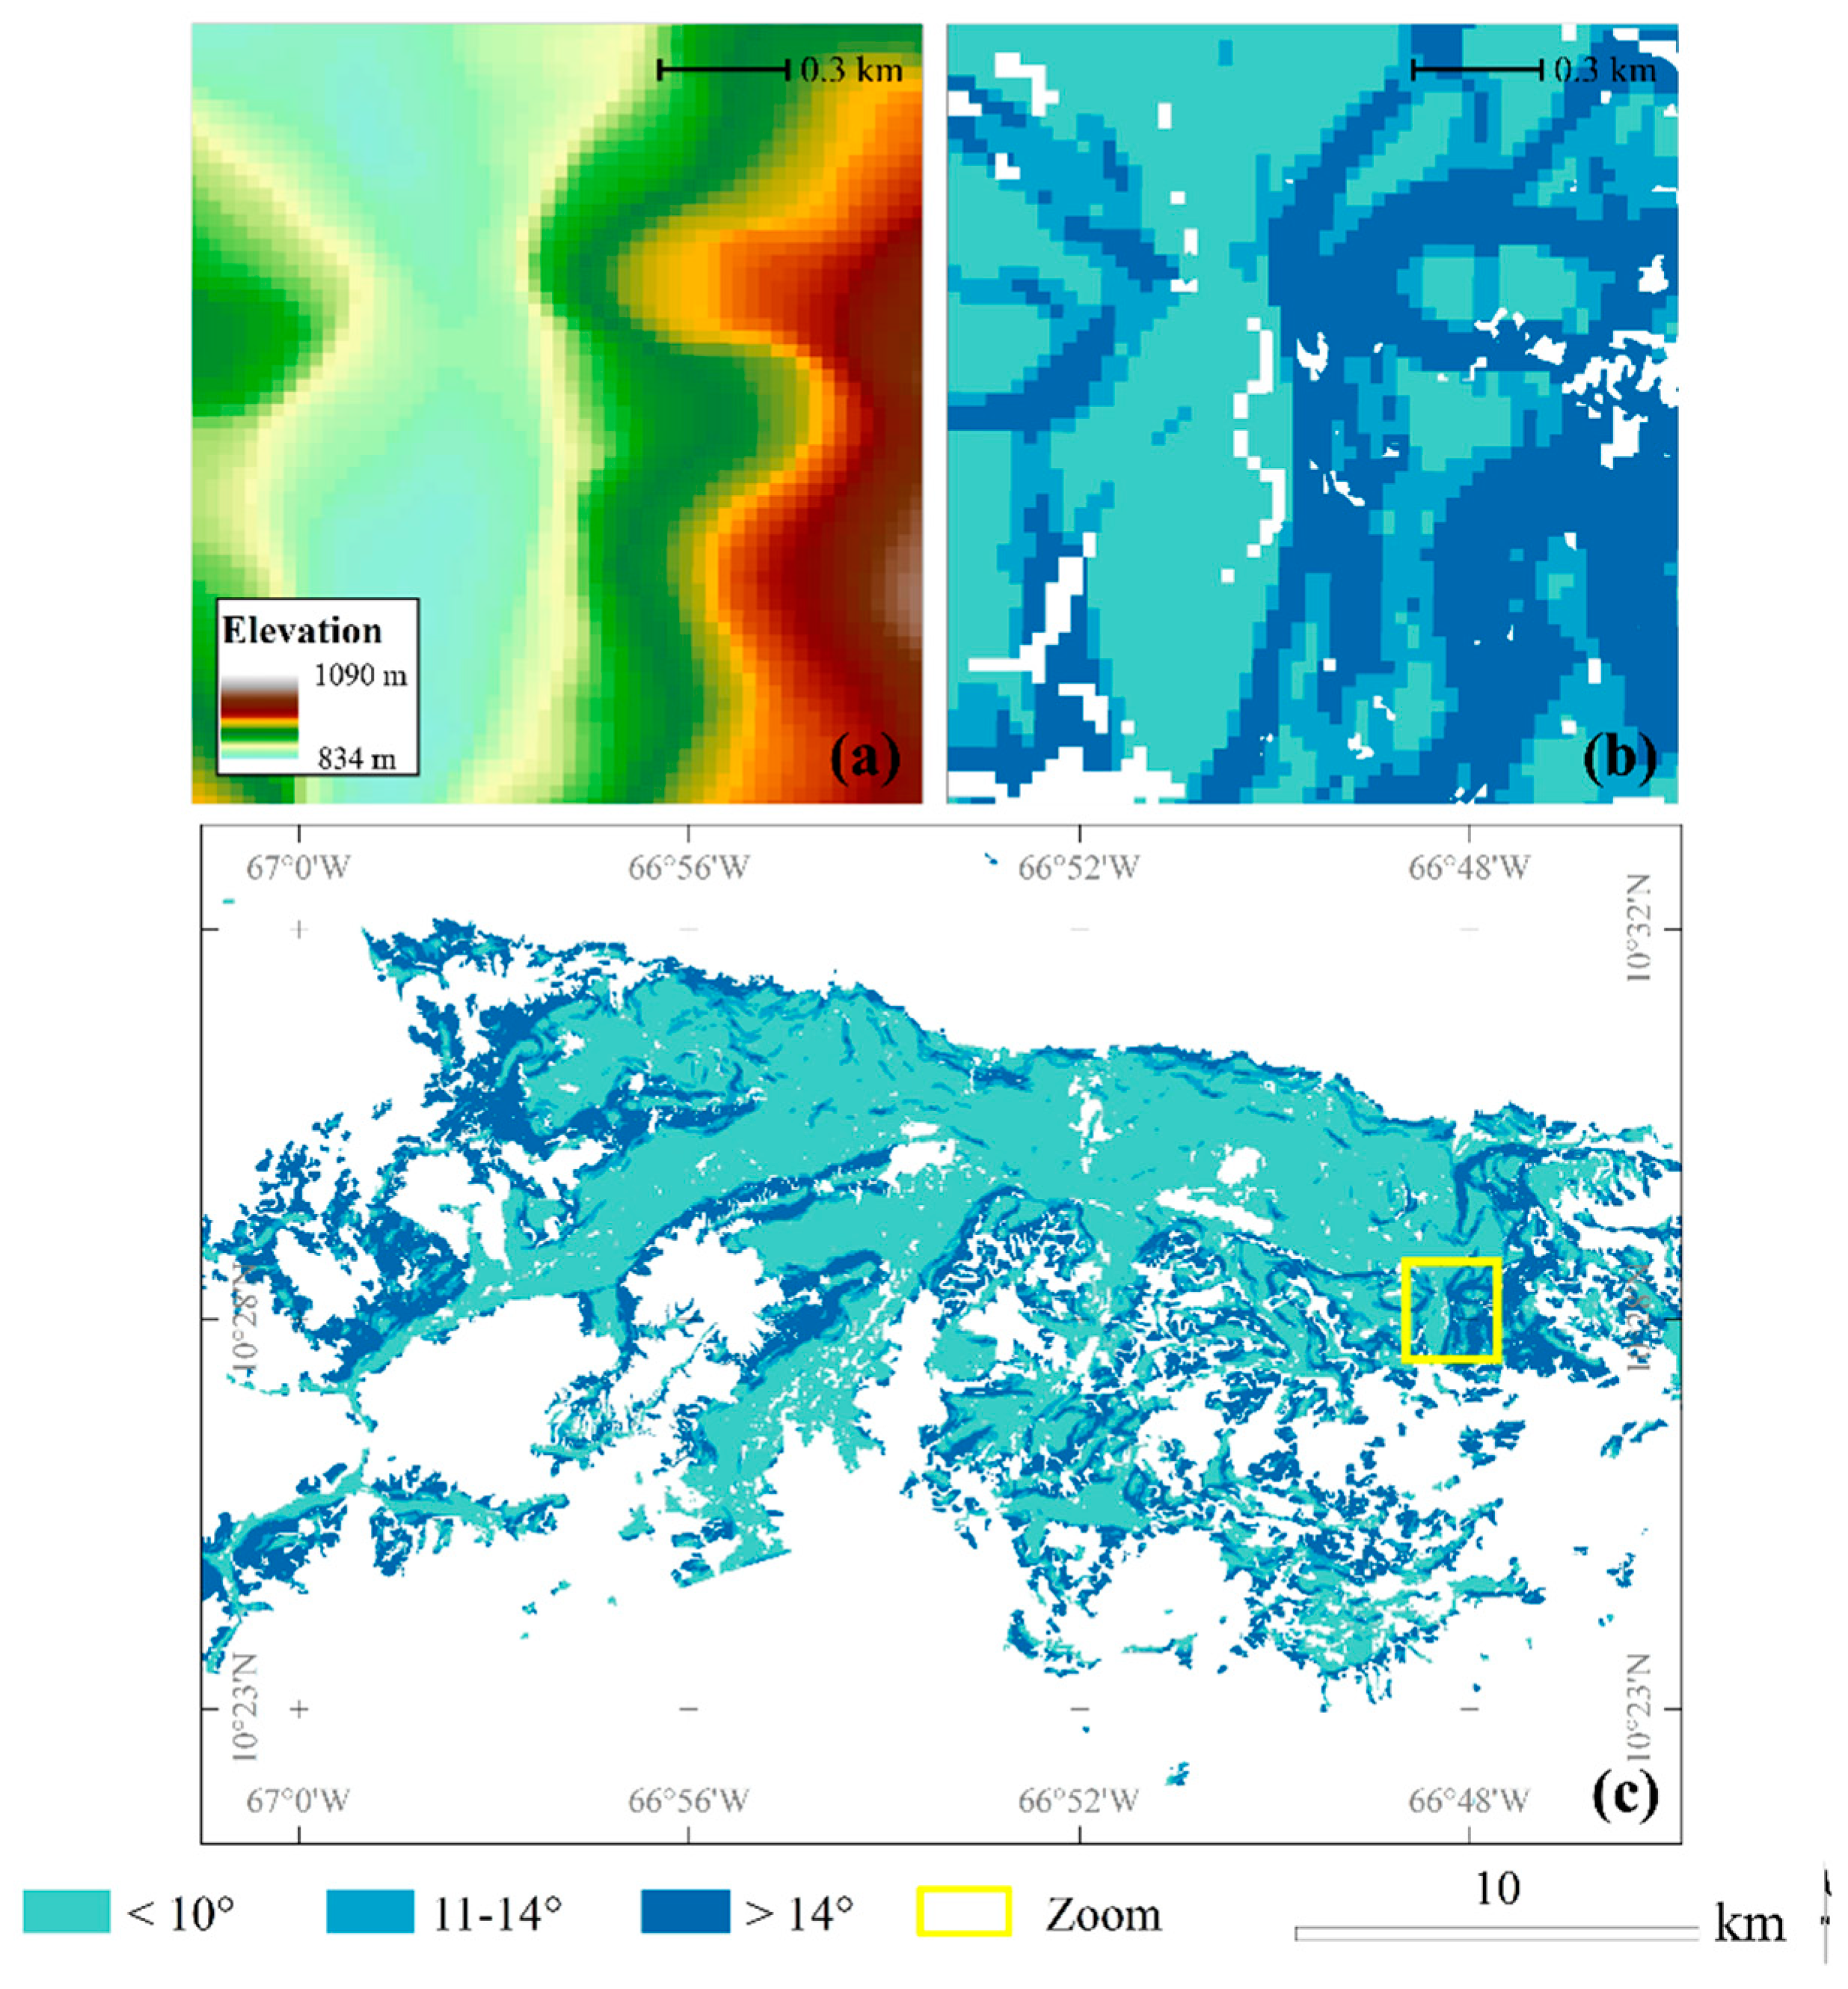
3.4. Topographic Situation
3.5. Spatial Analysis for Assessing Landslide Susceptibility
4. Results
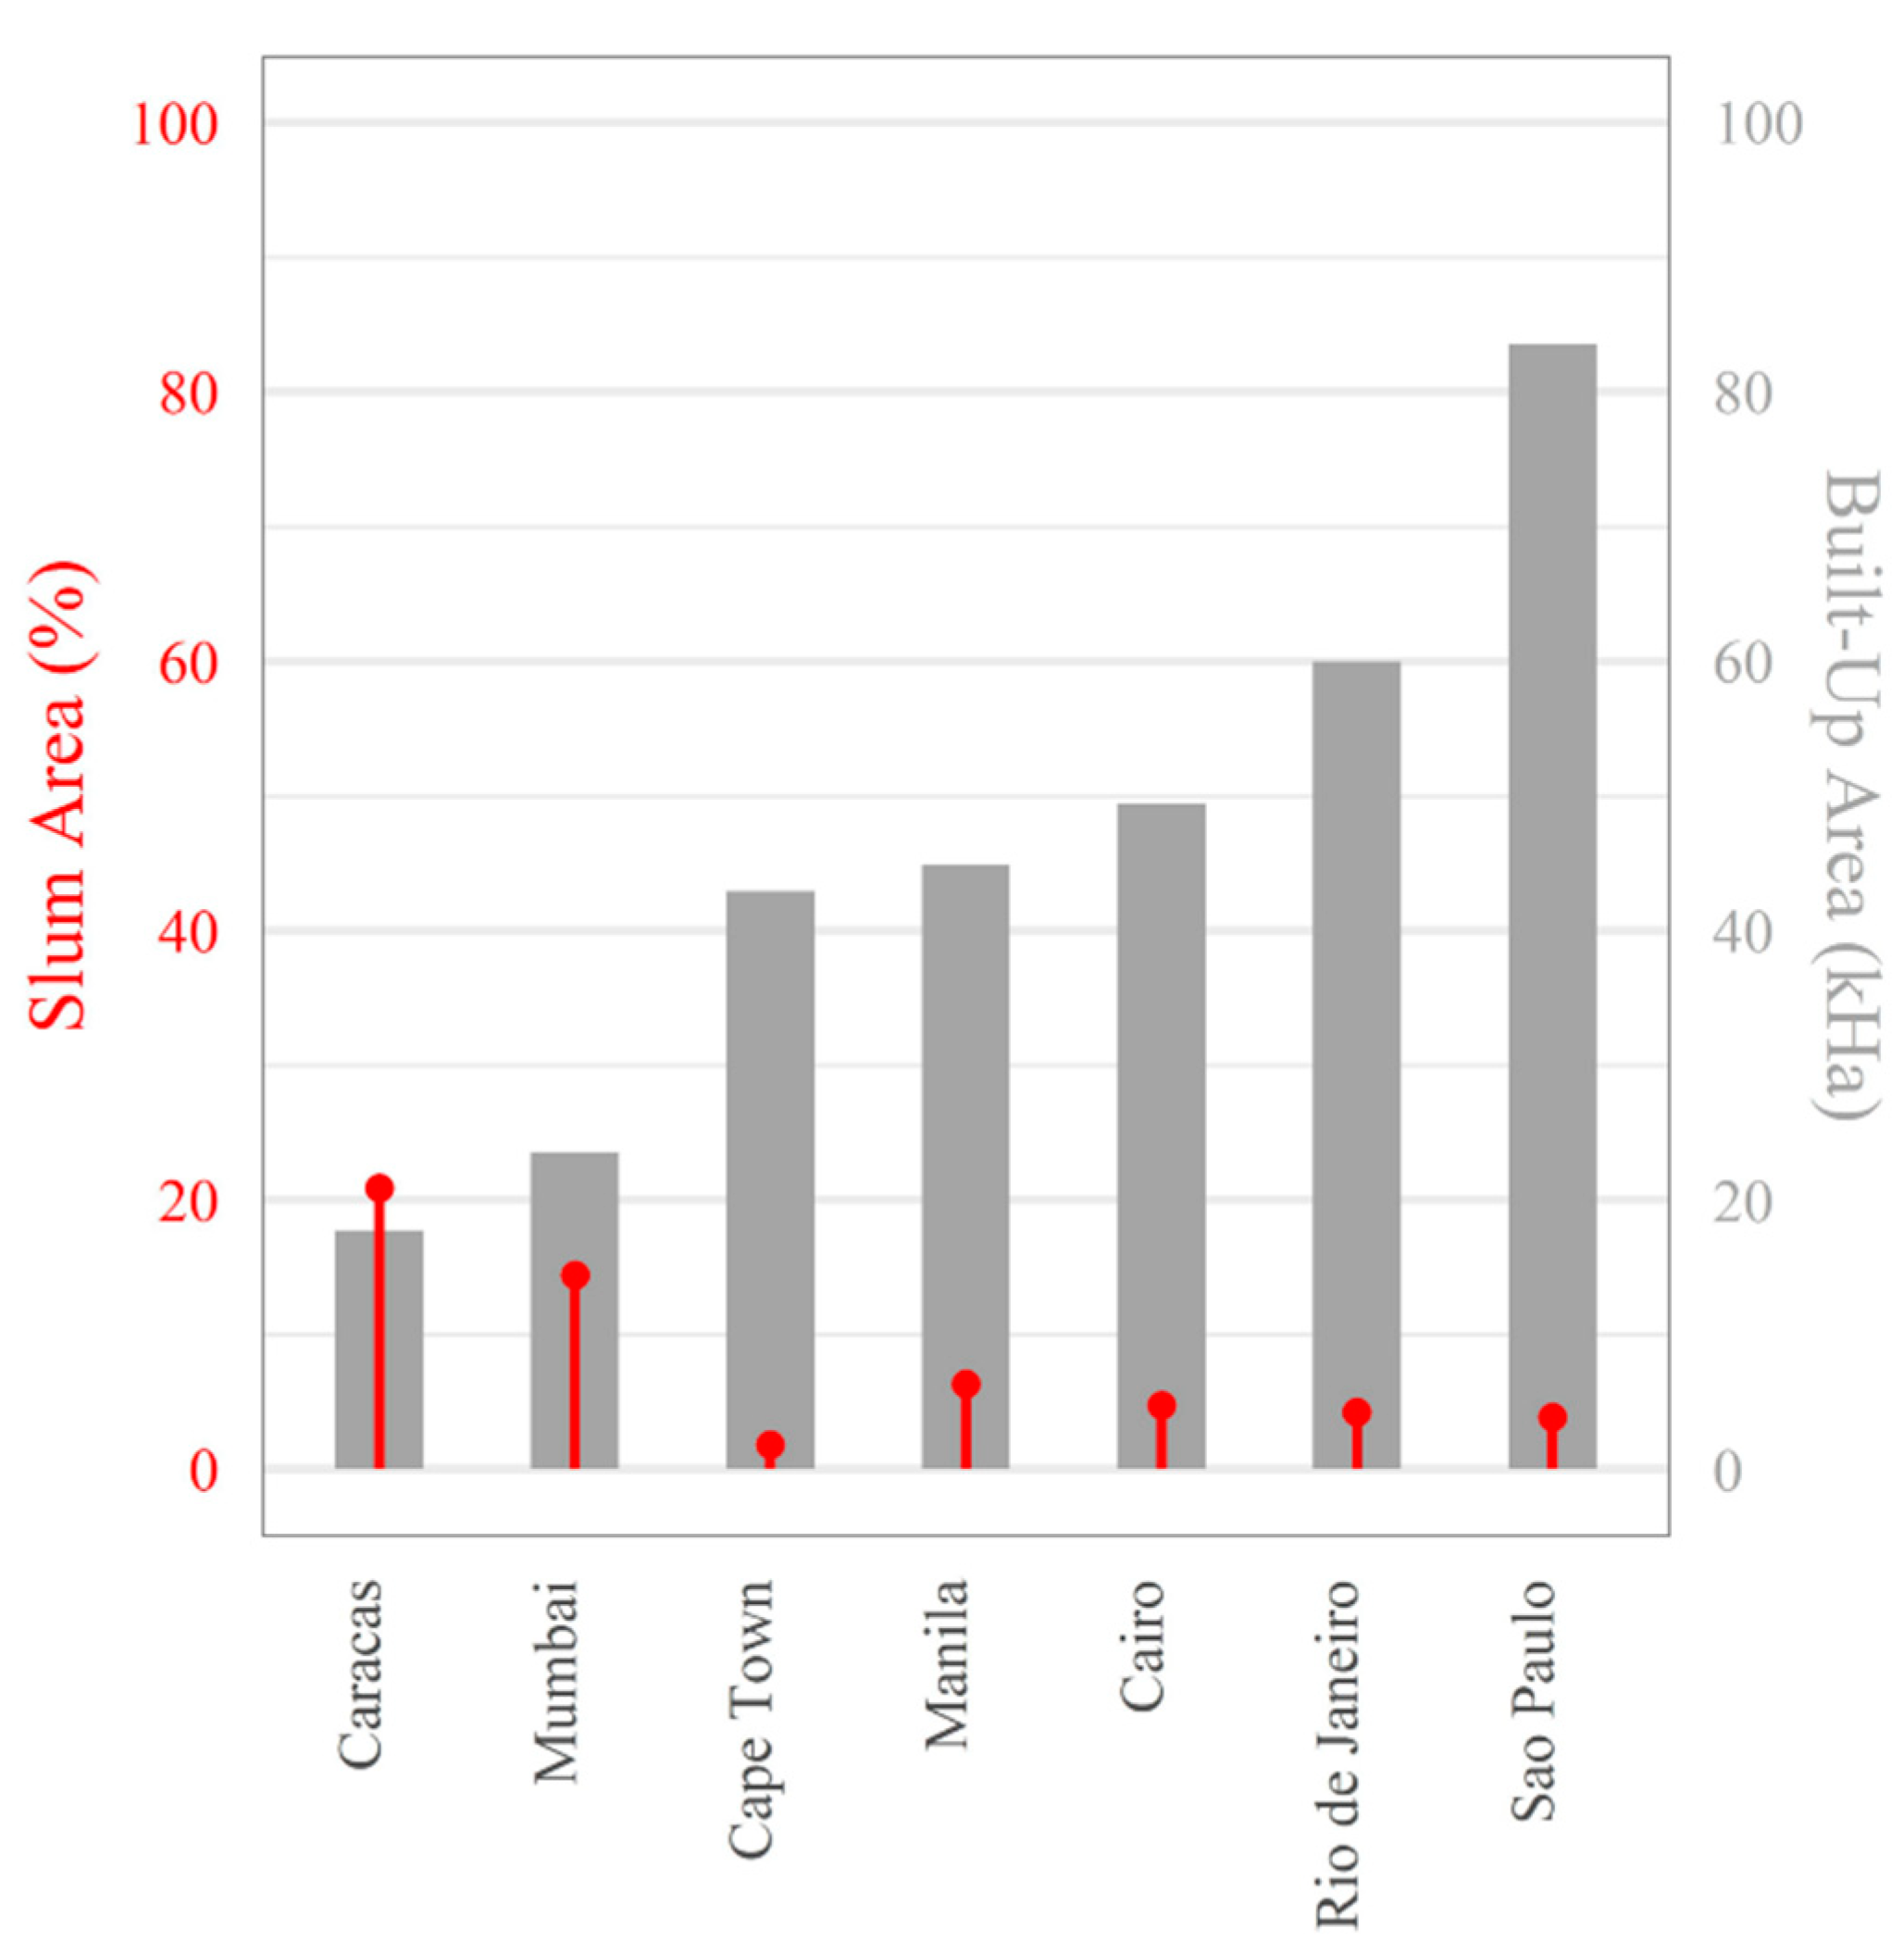
4.1. Morphological Slums
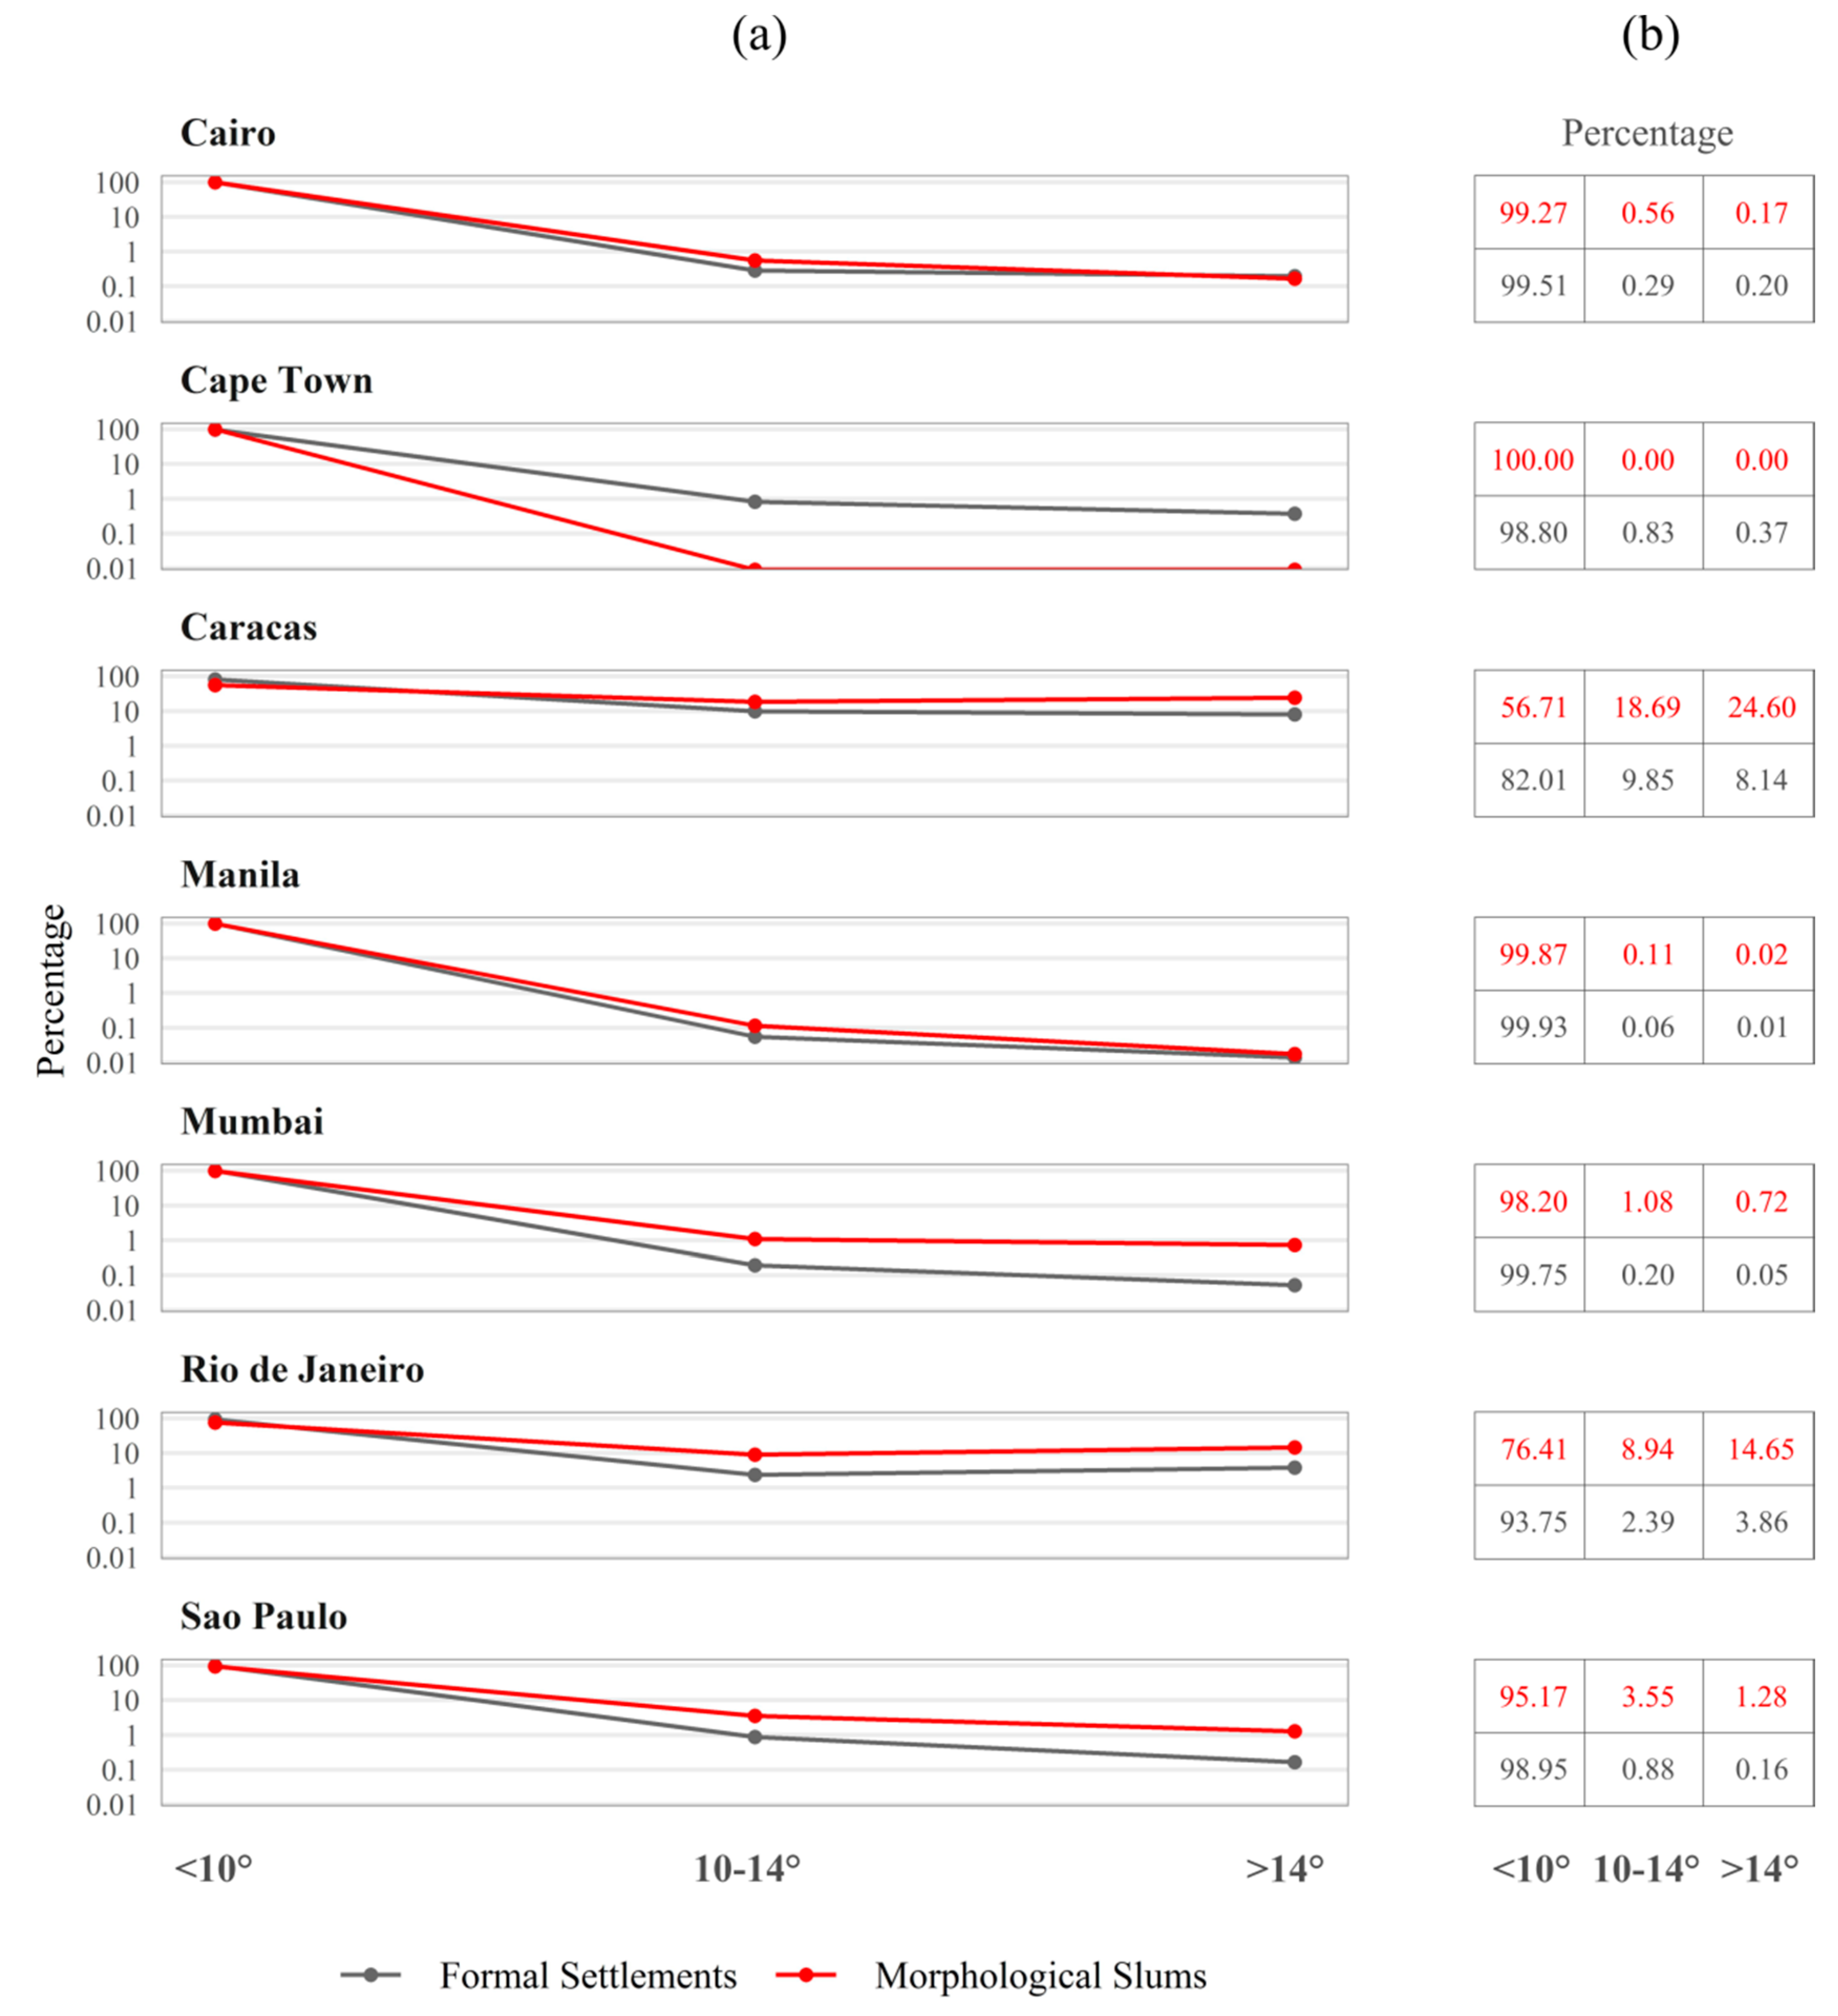
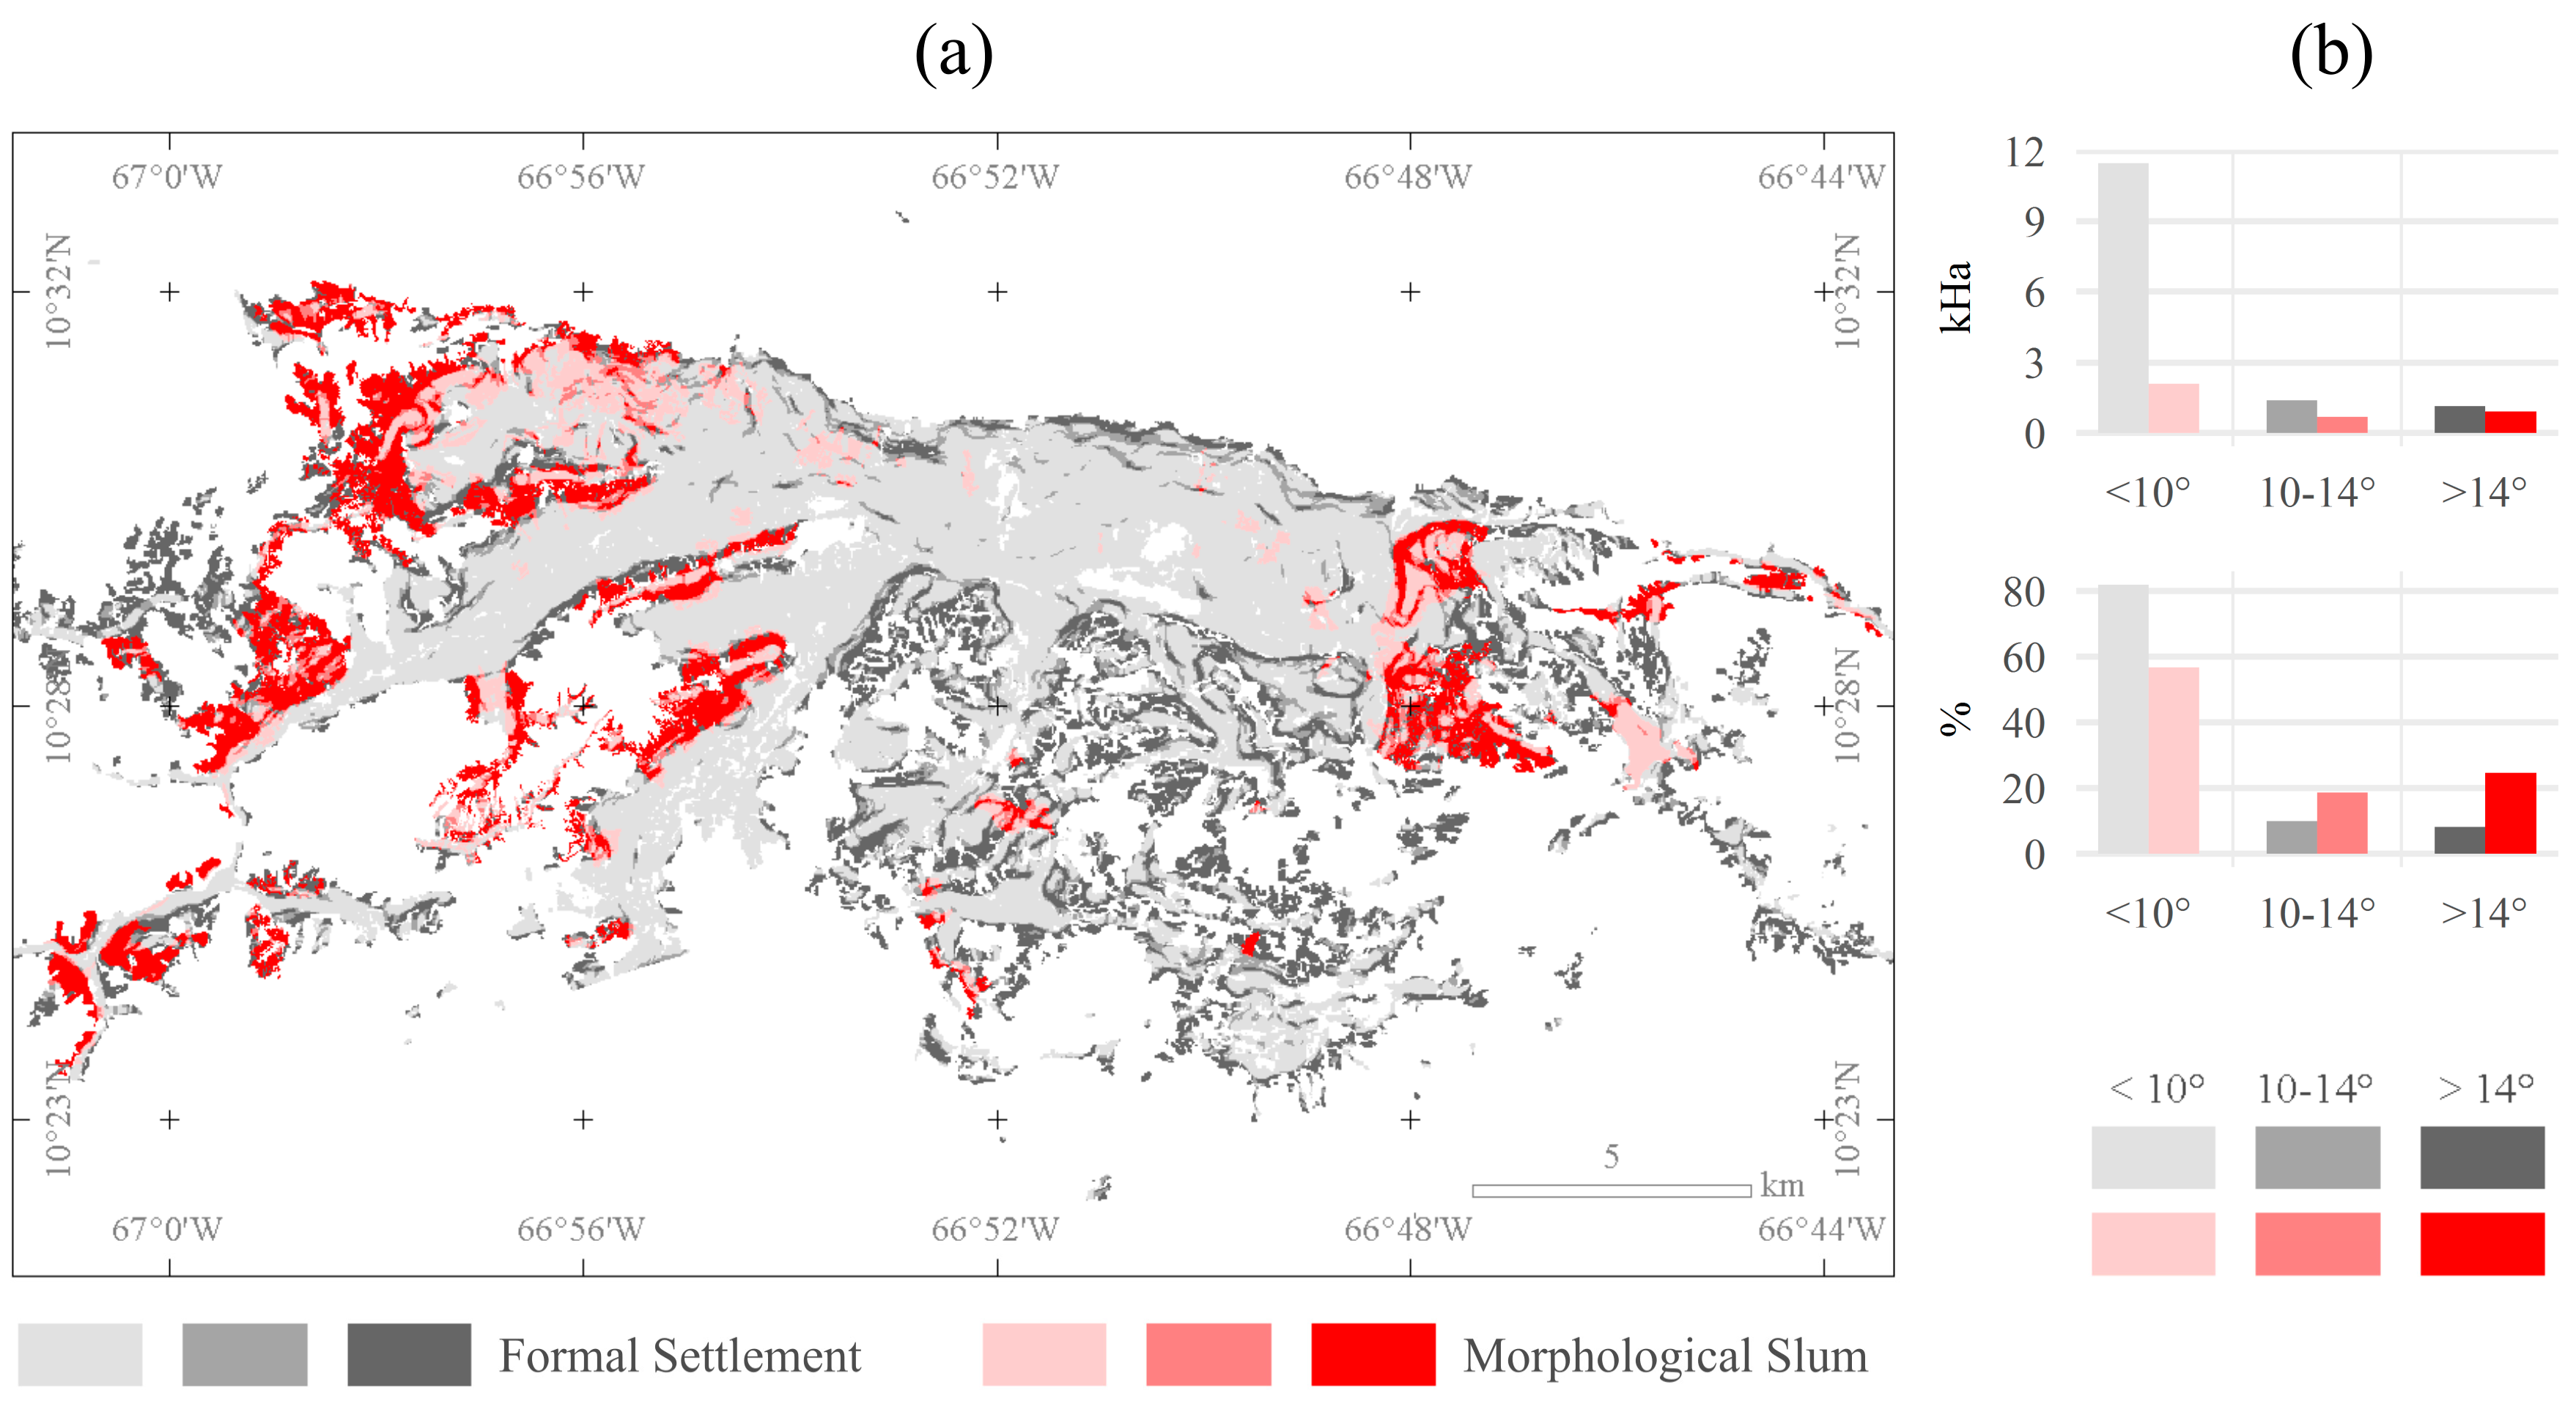
4.2. Topographic Situation
4.3. Spatial Analysis for Assessing Landslide Susceptibility
5. Discussion
6. Conclusions
Author Contributions
Funding
Acknowledgments
Conflicts of Interest
References
- Organization of American States Managing Natural Hazard Risk: Issues and Challenges. Available online: https://www.oas.org/dsd/policy_series/4_eng.pdf (accessed on 20 July 2020).
- Tim, N.; Bravo de Guenni, L. Oceanic influence on the precipitation in Venezuela under current and future climate. Clim. Dyn. 2016, 47, 211–234. [Google Scholar] [CrossRef] [Green Version]
- Anderson, M.G.; Holocombe, E. Community-Based Landslide Risk Reduction; The World Bank: Washington, DC, USA, 2013; ISBN 978-0-8213-9456-4. [Google Scholar] [CrossRef]
- UN-Habitat. World Cities Report 2016: Urbanization and Development—Emerging Futures; World Cities Report; UN: Nairobi, Kenya, 2016; ISBN 978-92-1-058281-0. [Google Scholar] [CrossRef]
- Feng, Z.; Yang, Y.; Zhang, D.; Tang, Y. Natural environment suitability for human settlements in China based on GIS. J. Geogr. Sci. 2009, 19, 437–446. [Google Scholar] [CrossRef]
- Glaeser, E. Triumph of the City: How Our Greatest Invention Makes Us Richer, Smarter, Greener, Healthier, and Happier; Reprint; Penguin Books: New York, NY, USA, 2012; ISBN 978-0-14-312054-4. [Google Scholar]
- Davis, M. Planet of Slums; Verso: London, UK; New York, NY, USA, 2007; ISBN 978-1-78168-368-2. [Google Scholar]
- Mendes, R.M.; de Andrade, M.R.M.; Tomasella, J.; de Moraes, M.A.E.; Scofield, G.B. Understanding shallow landslides in Campos do Jordão municipality—Brazil: Disentangling the anthropic effects from natural causes in the disaster of 2000. Nat. Hazards Earth Syst. Sci. 2018, 18, 15–30. [Google Scholar] [CrossRef] [Green Version]
- Mukhija, V. Upgrading Housing Settlements in Developing Countries: The Impact of Existing Physical Conditions. Cities 2001, 18, 213–222. [Google Scholar] [CrossRef]
- Geiß, C.; Aravena Pelizari, P.; Marconcini, M.; Sengara, W.; Edwards, M.; Lakes, T.; Taubenböck, H. Estimation of seismic building structural types using multi-sensor remote sensing and machine learning techniques. ISPRS J. Photogramm. Remote Sens. 2015, 104, 175–188. [Google Scholar] [CrossRef]
- GFDRR. The Making of A Riskier Future: How our Decisions are Shaping Future Disaster Risk; The World Bank: Washington, DC, USA, 2016. [Google Scholar]
- Glade, T. Landslide occurrence as a response to land use change: A review of evidence from New Zealand. CATENA 2003, 51, 297–314. [Google Scholar] [CrossRef] [Green Version]
- Petley, D.N.; Hearn, G.J.; Hart, A.; Rosser, N.J.; Dunning, S.A.; Oven, K.; Mitchell, W.A. Trends in landslide occurrence in Nepal. Nat. Hazards 2007, 43, 23–44. [Google Scholar] [CrossRef]
- Reichenbach, P.; Busca, C.; Mondini, A.C.; Rossi, M. The Influence of Land Use Change on Landslide Susceptibility Zonation: The Briga Catchment Test Site (Messina, Italy). Environ. Manag. 2014, 54, 1372–1384. [Google Scholar] [CrossRef] [PubMed] [Green Version]
- Kuffer, M.; Pfeffer, K.; Sliuzas, R. Slums from Space—15 Years of Slum Mapping Using Remote Sensing. Remote Sens. 2016, 8, 455. [Google Scholar] [CrossRef] [Green Version]
- Taubenböck, H. Ohne Limit? Die Expansion von Megacities. In Globale Urbanisierung: Perspektive aus dem All; Taubenböck, H., Wurm, M., Esch, T., Dech, S., Eds.; Springer: Berlin/Heidelberg, Germany, 2015; pp. 49–58. ISBN 978-3-662-44841-0. [Google Scholar] [CrossRef]
- Roy, A.K.; Sharma, S. Perceptions and Adaptations of the Coastal Community to the Challenges of Climate Change: A Case of Jamnagar City Region, Gujarat, India. Environ. Urban. ASIA 2015, 6, 71–91. [Google Scholar] [CrossRef]
- Rumbach, A.; Shirgaokar, M. Predictors of household exposure to monsoon rain hazards in informal settlements. Nat. Hazards 2017, 85, 709–728. [Google Scholar] [CrossRef]
- Van Voorst, R. Natural Hazards, Risk and Vulnerability: Floods and Slum Life in Indonesia; Routledge: New York, NY, USA, 2017; ISBN 978-1-138-86053-7. [Google Scholar]
- Fernandez, R.A.F.; D’Aragon, J. Understanding slums’ vulnerability to disaster risks through their spatial configuration. Reg. Dev. Dialogue 2013, 34, 63–82. [Google Scholar]
- Baud, I.S.A.; Pfeffer, K.; Sridharan, N.; Nainan, N. Matching deprivation mapping to urban governance in three Indian mega-cities. Habitat Int. 2009, 33, 365–377. [Google Scholar] [CrossRef]
- World Bank. Monitoring Global Poverty: Report of the Commission on Global Poverty; The World Bank: Washington, DC, USA, 2017; ISBN 978-1-4648-0961-3. [Google Scholar] [CrossRef]
- UNDP. Human Development Report 2016: Human Development for Everyone; UNDP: New York, NY, USA, 2017; ISBN 978-92-1-126413-5. [Google Scholar]
- Keeley, B. What are income and wealth? In Income Inequality: The Gap between Rich and Poor; OECD Insights; OECD Publishing: Paris, France, 2015; pp. 17–29. [Google Scholar] [CrossRef]
- Lucci, P.; Bhatkal, T.; Khan, A. Are we underestimating urban poverty? World Dev. 2018, 103, 297–310. [Google Scholar] [CrossRef]
- Kohli, D.; Sliuzas, R.; Kerle, N.; Stein, A. An ontology of slums for image-based classification. Comput. Environ. Urban Syst. 2012, 36, 154–163. [Google Scholar] [CrossRef]
- Kuffer, M.; Pfeffer, K.; Sliuzas, R.; Baud, I. Extraction of Slum Areas from VHR Imagery Using GLCM Variance. IEEE J. Sel. Top. Appl. Earth Obs. Remote Sens. 2016, 9, 1830–1840. [Google Scholar] [CrossRef]
- Taubenböck, H.; Kraff, N.J. The physical face of slums: A structural comparison of slums in Mumbai, India, based on remotely sensed data. J. Hous. Built Environ. 2014, 29, 15–38. [Google Scholar] [CrossRef]
- Owen, K.K.; Wong, D.W. An approach to differentiate informal settlements using spectral, texture, geomorphology and road accessibility metrics. Appl. Geogr. 2013, 38, 107–118. [Google Scholar] [CrossRef]
- Kit, O.; Lüdeke, M. Automated detection of slum area change in Hyderabad, India using multitemporal satellite imagery. ISPRS J. Photogramm. Remote Sens. 2013, 83, 130–137. [Google Scholar] [CrossRef] [Green Version]
- Wurm, M.; Stark, T.; Zhu, X.X.; Weigand, M.; Taubenböck, H. Semantic segmentation of slums in satellite images using transfer learning on fully convolutional neural networks. ISPRS J. Photogramm. Remote Sens. 2019, 150, 59–69. [Google Scholar] [CrossRef]
- Barros Filho, M.; Sobreira, F. Assessing Texture Pattern in Slum Across Scales—An Unsupervised Approach; CASA Working Papers Series; Centre for Advanced Spatial Analysis (UCL): London, UK, 2005. [Google Scholar]
- Ebert, A.; Kerle, N.; Stein, A. Urban social vulnerability assessment with physical proxies and spatial metrics derived from air—and spaceborne imagery and GIS data. Nat. Hazards 2009, 48, 275–294. [Google Scholar] [CrossRef]
- Kohli, D.; Warwadekar, P.; Kerle, N.; Sliuzas, R.; Stein, A. Transferability of Object-Oriented Image Analysis Methods for Slum Identification. Remote Sens. 2013, 5, 4209–4228. [Google Scholar] [CrossRef] [Green Version]
- Wurm, M.; Taubenböck, H.; Weigand, M.; Schmitt, A. Slum mapping in polarimetric SAR data using spatial features. Remote Sens. Environ. 2017, 194, 190–204. [Google Scholar] [CrossRef]
- Weeks, J.R.; Hill, A.; Stow, D.; Getis, A.; Fugate, D. Can We Spot a Neighborhood from the Air? Defining Neighborhood Structure in Accra, Ghana. GeoJournal 2007, 69, 9–22. [Google Scholar] [CrossRef] [PubMed] [Green Version]
- Schmitt, A.; Sieg, T.; Wurm, M.; Taubenböck, H. Investigation on the separability of slums by multi-aspect TerraSAR-X dual-co-polarized high resolution spotlight images based on the multi-scale evaluation of local distributions. Int. J. Appl. Earth Obs. Geoinf. 2018, 64, 181–198. [Google Scholar] [CrossRef] [Green Version]
- Engstrom, R.; Hersh, J.S.; Newhouse, D.L. Poverty from Space: Using High-Resolution Satellite Imagery for Estimating Economic Well-Being; Word Bank Group: Washington, DC, USA, 2017. [Google Scholar]
- Wurm, M.; Taubenböck, H. Detecting social groups from space—Assessment of remote sensing-based mapped morphological slums using income data. Remote Sens. Lett. 2018, 9, 41–50. [Google Scholar] [CrossRef]
- Taubenböck, H.; Kraff, N.; Wurm, M. The morphology of the Arrival City—A global categorization based on literature surveys and remotely sensed data. Appl. Geogr. 2018, 92, 150–167. [Google Scholar] [CrossRef]
- Kotadiya, R.; Kuffer, M.; Sliuzas, R.; Patel, S. Post-Resettlement Socio-Economic Dynamics. In GIS in Sustainable Urban Planning and Management; van Maarseveen, M., Martinez, J., Flacke, J., Eds.; CRC Press: London, UK, 2019; pp. 245–265. [Google Scholar] [CrossRef]
- Cruden, D.M.; Varnes, D.J. Landslides Types and Processes. In Landslides: Investigation and Mitigation; Transportation Research Board Special Report; Transportation Research Board: Washington, DC, USA, 1996; pp. 36–57. [Google Scholar]
- Fell, R.; Corominas, J.; Bonnard, C.; Cascini, L.; Leroi, E.; Savage, W.Z. Guidelines for landslide susceptibility, hazard and risk zoning for land use planning. Eng. Geol. 2008, 102, 85–98. [Google Scholar] [CrossRef] [Green Version]
- Reichenbach, P.; Rossi, M.; Malamud, B.D.; Mihir, M.; Guzzetti, F. A review of statistically-based landslide susceptibility models. Earth-Sci. Rev. 2018, 180, 60–91. [Google Scholar] [CrossRef]
- Brabb, E.E. Innovative Approaches to Landslide Hazard and Risk Mapping; Japan Landslide Society: Tokyo, Japan, 1985; Volume 1, pp. 17–22. [Google Scholar]
- Guzzetti, F.; Reichenbach, P.; Cardinali, M.; Galli, M.; Ardizzone, F. Probabilistic landslide hazard assessment at the basin scale. Geomorphology 2005, 72, 272–299. [Google Scholar] [CrossRef]
- Listo, F.D.; Vieira, B.C. Mapping of risk and susceptibility of shallow-landslide in the city of São Paulo, Brazil. Geomorphology 2012, 169–170, 30–44. [Google Scholar] [CrossRef]
- Global Administrative Areas. Available online: www.gadm.org (accessed on 23 March 2020).
- NASA/METI/AIST/Japan Spacesystems ASTER Global Digital Elevation Model Version 2; NASA: Washington, DC, USA, 2009.
- Esch, T.; Marconcini, M.; Felbier, A.; Roth, A.; Heldens, W.; Huber, M.; Schwinger, M.; Taubenböck, H.; Müller, A.; Dech, S. Urban Footprint Processor—Fully Automated Processing Chain Generating Settlement Masks From Global Data of the TanDEM-X Mission. IEEE Geosci. Remote Sens. Lett. 2013, 10, 1617–1621. [Google Scholar] [CrossRef] [Green Version]
- Global Urban Footprint; DLR: Cologne, Germany, 2016.
- Esch, T.; Taubenböck, H.; Roth, A.; Heldens, W.; Felbier, A.; Schmidt, M.; Mueller, A.A.; Thiel, M.; Dech, S.W. TanDEM-X mission-new perspectives for the inventory and monitoring of global settlement patterns. JARS 2012, 6, 061702. [Google Scholar] [CrossRef]
- Esch, T.; Felbier, A.; Taubenböck, H.; Wurm, M. Die globale Vielfalt urbaner Siedlungsmuster. In Globale Urbanisierung—Perspektive aus dem All; Taubenböck, H., Wurm, M., Esch, T., Dech, S., Eds.; Springer Spektrum: Berlin/Heidelberg, Germany, 2015; pp. 41–48. ISBN 978-3-662-44840-3. [Google Scholar] [CrossRef]
- Klotz, M.; Kemper, T.; Geiß, C.; Esch, T.; Taubenböck, H. How good is the map? A multi-scale cross-comparison framework for global settlement layers: Evidence from Central Europe. Remote Sens. Environ. 2016, 178, 191–212. [Google Scholar] [CrossRef] [Green Version]
- Sliuzas, R.; Kuffer, M. Analysing the spatial heterogeneity of poverty using remote sensing: Typology of poverty areas using selected RS based indicators. In Proceedings of the Remote Sensing—New Challenges of High Resolution, Bochum, Germany, 5–7 March 2008; Jürgens, C., Ed.; 2008; pp. 158–167. [Google Scholar]
- NASA/METI/AIST/Japan Space Systems, and U.S./Japan ASTER Science Team. ASTER Global Digital Elevation Model V002; Distributed by NASA EOSDIS Land Processes DAAC; NASA: Washington, DC, USA, 2018. [Google Scholar] [CrossRef]
- Schuster, R.; Highland, L. The Third Hans Cloos Lecture. Urban landslides: Socioeconomic impacts and overview of mitigative strategies. Bull. Eng. Geol. Environ. 2007, 66, 1–27. [Google Scholar] [CrossRef]
- Olthuis, K.; Benni, J.; Eichwede, K.; Zevenbergen, C. Slum Upgrading: Assessing the importance of location and a plea for a spatial approach. Habitat Int. 2015, 50, 270–288. [Google Scholar] [CrossRef]
- UN-HABITAT. The Challenge of Slums: Global Report on Human Settlements, 2003; Earthscan Publications: London, UK/Sterling, VA, USA, 2003; ISBN 978-1-84407-037-4. [Google Scholar]
- Mahabir, R.; Croitoru, A.; Crooks, A.T.; Agouris, P.; Stefanidis, A. A Critical Review of High and Very High-Resolution Remote Sensing Approaches for Detecting and Mapping Slums: Trends, Challenges and Emerging Opportunities. Urban Sci. 2018, 2, 8. [Google Scholar] [CrossRef] [Green Version]
- Kohli, D.; Sliuzas, R.; Stein, A. Urban slum detection using texture and spatial metrics derived from satellite imagery. J. Spat. Sci. 2016, 61, 405–426. [Google Scholar] [CrossRef] [Green Version]
- Pratomo, J.; Kuffer, M.; Martinez, J.; Kohli, D. Coupling Uncertainties with Accuracy Assessment in Object-Based Slum Detections, Case Study: Jakarta, Indonesia. Remote Sens. 2017, 9, 1164. [Google Scholar] [CrossRef] [Green Version]
- Kohli, D.; Stein, A.; Sliuzas, R. Uncertainty analysis for image interpretations of urban slums. Comput. Environ. Urban Syst. 2016, 60, 37–49. [Google Scholar] [CrossRef]
- Tachikawa, T.; Kaku, M.; Iwasaki, A.; Gesch, D.B.; Oimoen, M.J.; Zhang, Z.; Danielson, J.J.; Krieger, T.; Curtis, B.; Haase, J.; et al. ASTER Global Digital Elevation Model Version 2—Summary of Validation Results; NASA: Washington, DC, USA, 2011. [Google Scholar] [CrossRef]
- Transforming Our World: The 2030 Agenda for Sustainable Development. In A New Era in Global Health; Rosa, W. (Ed.) Springer Publishing Company: New York, NY, USA, 2017; ISBN 978-0-8261-9011-6. [Google Scholar]
- Kuffer, M.; Orina, F.; Sliuzas, R.; Taubenböck, H. Spatial patterns of slums: Comparing African and Asian cities. In Proceedings of the 2017 Joint Urban Remote Sensing Event (JURSE), Dubai, UAE, 6–8 March 2017; pp. 1–4. [Google Scholar] [CrossRef]
- Taubenböck, H.; Wurm, M. Ich weiß, dass ich nichts weiß—Bevölkerungsschätzung in der Megacity Mumbai. In Globale Urbanisierung; Taubenböck, H., Wurm, M., Esch, T., Dech, S., Eds.; Springer Spektrum: Berlin, Germany, 2015; pp. 171–178. ISBN 978-3-662-44840-3. [Google Scholar] [CrossRef]
- Kit, O.; Lüdeke, M.; Reckien, D. Defining the Bull’S Eye: Satellite Imagery-Assisted Slum Population Assessment in Hyderabad, India. Urban Geogr. 2013, 34, 413–424. [Google Scholar] [CrossRef]
- United Nations. The World’s Cities in 2018; UN: New York, NY, USA, 2018; ISBN 978-92-1-148306-2. [Google Scholar]


| Earth Observation Data | Product | Spatial Resolution | Derived Information |
|---|---|---|---|
| VHR Optical Imagery | - | 0.25–1 m | Morphological Slums |
| TerraSAR-X, TanDEM-X | Global Urban Footprint (GUF) | 30 m (GUF) | Formal Settlements |
| ASTER | ASTER GDEM | 30 m (ASTER GDEM) | Slope Classes |
| Study Area | Date of Acquisition | Sensor | Spatial Resolution |
|---|---|---|---|
| Cairo | 19.06.2012 | WorldView-2 | 0.5 m |
| 24.06.2012 | WorldView-2 | 0.5 m | |
| Cape Town | 28.09.2011 | GeoEye-1 | 0.5 m |
| 07.10.2012 | WordlView-2 | 0.5 m | |
| Caracas | 02.10.2012 | GeoEye-1 | 0.5 m |
| Manila | 25.10.2010 | WorldView-2 | 0.5 m |
| Mumbai | 27.03.2013 | Pléiades | 0.5 m |
| 03.04.2013 | Pléiades | 0.5 m | |
| Rio de Janeiro | 06.10.2011 | Ikonos-2 | 1 m |
| 09.03.2012 | WorldView-2 | 0.5 m | |
| 02.04.2012 | Ikonos-2 | 1 m | |
| 13.04.2012 | WorldView-2 | 0.5 m | |
| 05.05.2012 | Ikonos-2 | 1 m | |
| 01.07.2012 | WorldView-2 | 0.5 m | |
| Sao Paulo | 13.04.2012 | QuickBird-2 | 0.8 m |
| 06.07.2012 | WorldView-2 | 0.5 m | |
| 17.07.2012 | GeoEye-1 | 0.5 m |
| Study Area | Span Width ASTER GDEM | RMSE |
|---|---|---|
| Cairo | 495 m | 5.65 m |
| Cape Town | 1561 m | 6.91 m |
| Caracas | 2701 m | 16.53 m |
| Manila | 270 m | 3.83 m |
| Mumbai | 484 m | 4.85 m |
| Rio de Janeiro | 983 m | 7.99 m |
| Sao Paulo | 1216 m | 8.97 m |
| Study Area | N | Χ2 | df | α | φc |
|---|---|---|---|---|---|
| Cairo | 49,415 | 5.49 | 2 | 0.05 | 0.01 |
| Cape Town | 42,929 | 9.43 | 2 | 0.05 | 0.01 |
| Caracas | 17,719 | 1,125.32 | 2 | 0.05 | 0.25 |
| Manila | 44,884 | 1.58 | 2 | 0.05 | 0.01 |
| Mumbai | 23,553 | 158.58 | 2 | 0.05 | 0.08 |
| Rio de Janeiro | 59,966 | 1,133.17 | 2 | 0.05 | 0.14 |
| Sao Paulo | 83,550 | 416.65 | 2 | 0.05 | 0.07 |
© 2020 by the authors. Licensee MDPI, Basel, Switzerland. This article is an open access article distributed under the terms and conditions of the Creative Commons Attribution (CC BY) license (http://creativecommons.org/licenses/by/4.0/).
Share and Cite
Müller, I.; Taubenböck, H.; Kuffer, M.; Wurm, M. Misperceptions of Predominant Slum Locations? Spatial Analysis of Slum Locations in Terms of Topography Based on Earth Observation Data. Remote Sens. 2020, 12, 2474. https://0-doi-org.brum.beds.ac.uk/10.3390/rs12152474
Müller I, Taubenböck H, Kuffer M, Wurm M. Misperceptions of Predominant Slum Locations? Spatial Analysis of Slum Locations in Terms of Topography Based on Earth Observation Data. Remote Sensing. 2020; 12(15):2474. https://0-doi-org.brum.beds.ac.uk/10.3390/rs12152474
Chicago/Turabian StyleMüller, Inken, Hannes Taubenböck, Monika Kuffer, and Michael Wurm. 2020. "Misperceptions of Predominant Slum Locations? Spatial Analysis of Slum Locations in Terms of Topography Based on Earth Observation Data" Remote Sensing 12, no. 15: 2474. https://0-doi-org.brum.beds.ac.uk/10.3390/rs12152474