Analyzing Spatiotemporal Variation Modes and Industry-Driving Force Research Using VIIRS Nighttime Light in China


1
State Key Laboratory of Remote Sensing Science, Faculty of Geographical Science, Beijing Normal University, Beijing 100875, China
2
Beijing Key Laboratory of Environment Remote Sensing and Digital Cities, Beijing Normal University, Beijing 100875, China
*
Author to whom correspondence should be addressed.
Remote Sens. 2020, 12(17), 2785; https://0-doi-org.brum.beds.ac.uk/10.3390/rs12172785
Submission received: 4 July 2020
/
Revised: 23 August 2020
/
Accepted: 25 August 2020
/
Published: 27 August 2020
(This article belongs to the Special Issue Remote Sensing of Nighttime Observations)
Abstract
:Urbanization is a complex process closely involving the economy, society, and population. While monitoring urban development and exploring the industry-driving force in a real-time and effective way are the prerequisites for optimizing industry structure, narrowing the urban development gap, and achieving sustainable development. Nighttime light is an effective tool to monitor urban development from a macro perspective. However, the systematic research of nighttime light spatiotemporal variation modes and the industry-driving force of urban nighttime light are still unknown. Considering these issues, this paper analyzes the spatiotemporal variation modes of the average light index (ALI) and investigates the industry-driving force of ALI in 100 major prefecture-level cities across China mainland based on National Polar-Orbiting Partnership Satellite Visible Infrared Imaging Radiometer Suite (NPP VIIRS). The conclusions are as following three aspects. First, ALI is observed a funnel pattern among four regions in spatial dimension, with low in center and high in the surrounding, and it shows 5 variation modes (“W,” “√,” “Exponent,” “Logarithm,” and “N”) in temporal dimension, of which the “√” mode accounts for the highest proportion (60%). Second, the industry structure is closely related to ALI. Besides, the factor analysis result illustrates that the secondary and tertiary industry are the driving industries of ALI. Third, the classification result based on the industry contribution rate indicates that cities driven by different industries show significant spatial distribution differences. The three major industry-driving cities are mainly distributed in central and western regions, the secondary and tertiary industry-driving cities are evenly distributed, and the tertiary industry-driving cities are mainly distributed in provincial capitals. From 2013 to 2018, the fluctuation of city distribution driven by different industries changes obviously. The number of tertiary industry-driving cities increases steadily and the three major industry-driving cities are distributed wider spatially. Additionally, the impacts of location and raw coal on ALI are discussed. In general, these findings are essential to further research urban development mode and can be considered as the reference to narrow urban development gap.

1. Introduction
The world is in the stage of rapid urbanization [1,2], which is not only closely related to economic growth, expansion of the urban built-up area, improvement of infrastructure [3,4,5,6,7,8] but also causes changes in land use structure and transition of industry structure [7,9,10]. In the global context, Frick et al. (2018) [11] studied the relationship between the urban concentration and economic growth based on population data among 68 countries from 1985 to 2010, which suggested that urban concentration promoted economy in high-income countries, while the effect was not suitable for developing countries (including China). While in the Chinese context, Deng et al. (2010) [3] proved that the urbanization promote economy and affect economic structure. The difference may result from different research contexts or different assessment indicators. Whether in the global context or Chinese context, unreasonable industry structure that refers to a single economic structure, such as relying solely on coal resource, agriculture or others [12], will not be beneficial to the sustainable development [10,12]. Besides, previous studies have demonstrated that the urban development gap not only exists in Thailand, the Philippines [13], China [3], but also the United States [14] and countries in Europe [15]. These studies proved that the urban development gap is a common phenomenon in the world. China, the second-largest economy in the world, has obtained remarkable achievements. It can be reflected by the gross value added (GVA) referring value of goods and services produced in an area. China ranked the second among 36 major countries in 2014, and the Chinese GVA was 10,283,983 million dollars which is much higher than Japan (4,437,887 million dollars) [10]. However, the urban development gap which refers to technology, education, economy or other aspects of cities is increasing and the uneven phenomenon in economic development is rising [16,17,18]. Although urbanization is important, the development of the countryside is also meaningful since the implementation of urban-rural integration policy in China, which views industry and agriculture, cities and villages, urban residents and rural villages as a whole to plan and conduct comprehensive research. Considering these issues and the urban-rural integration development, accurately and effectively monitoring urban development that includes city center and countryside, and exploring the industry-driving force in a real-time and effective way is greatly significant to optimize industry structure, narrow the urban development gap, and achieve sustainable development [19,20,21].
Defense Meteorological Satellite Program-Operational Linescan System (DMSP-OLS) was an important tool for studying the spatiotemporal distribution of human socioeconomic activities [4,5,22]. Because of the advantage of remote sensing technology, many previous studies explored the socioeconomic activities based on DMSP-OLS and showed that nighttime light is closely associated with the urban built-up area [4,5,7], electric power consumption [22,23,24,25], gross domestic product (GDP) [26,27], poverty [17,28,29], population [30,31,32,33], carbon emissions [34,35], anthropogenic resources accumulation [36], and other socioeconomic activities. However, the deficits in DMSP-OLS also cannot be ignored. First, pixel values in DMSP-OLS were relative values ranging from 0–63 rather than absolute values in Watts per per steradian, the resolution was 30 arc-s and the pixel saturation was universal in the urban center. Second, the sensors were not sensitive to the weak light because there was no low light imaging band. Besides, there was no inter-calibration between different sensors, meanwhile, the sensors have aged. To sum up, although DMSP-OLS played an important and irreplaceable role in previous research, while the shortcoming that existed in sensors also resulted in bias in electric consumption prediction, GDP spatial distribution, and other socioeconomic predictions compared with NPP VIIRS [37].
In 2013, National Oceanic and Administration/National Geophysical Data Center (NOAA/NGDC) released National Polar-Orbiting Partnership Satellite Visible Infrared Imaging Radiometer Suite (NPP VIIRS). Compared with DMSP-OLS, the pixel values in NPP VIIRS are absolute values that represent Watts per per steradian, the resolution is 15 arc-s that can capture more details at night and there is not pixel saturation in the urban center [37,38]. In order to investigate the ability of the two nighttime light data namely DMSP-OLS and NPP VIIRS to characterize socioeconomic indicators, some studies compared the quality and explored the assessment accuracy in socioeconomic activities of the two nighttime light data. For example, Elvidge et al. (2013) [37] analyzed in detail the reasons for which the quality of NPP VIIRS is better than DMSP-OLS. Besides, many previous studies proved that NPP VIIRS is greatly superior to DMSP-OLS with the potential capability of evaluating and predicting socioeconomic activities [6,39,40,41]. Totally, previous studies that related to the quality between the two nighttime light datasets illustrated that NPP VIIRS is greatly improved over DMSP-OLS. Additionally, DMSP-OLS and NPP VIIRS are not comparable because of different overpass time (DMSP-OLS, ~19:30; NPP VIIRS, ~1:30). Therefore, comprehensively considering the aforementioned influencing factors, data quality and overpass time, between DMSP-OLS and NPP VIIRS, this paper selects NPP VIIRS to investigate urban nighttime light.
Previous literature related to urban development mainly used statistical indicators. For example, He et al. (2018) [18] analyzed competitiveness among different regions in Chinese provinces based on assets input, the growth rate of regional gross product, and other statistic data. Besides, Li et al. (2019) [42] revealed the regional differentiation characteristics in Beijing using per capita grain output, labor productivity, income ratio of urban and rural residents, and other statistic data. However, the existence of the dematerialization of socioeconomic capital and a wider range of forms have greatly hindered the quantification of socioeconomic activities [16], which brings inaccuracy in the socioeconomic activities assessment. As a comprehensive manifestation of socioeconomic activities, NPP VIIRS nighttime light provides an effective method for exploring the urban development regularity from space in the nighttime. However, studies paid the most attention to the following two aspects. On the one hand, combining with statistical indicators, some studies analyzed the causes of variation in NPP VIIRS. For example, Lan et al. (2020) [43] monitored urban developmental vitality based on NPP VIIRS nighttime light data and proved that population flows and infrastructure have a significant impact on NPP VIIRS. Meanwhile, Levin et al. (2017) [44] demonstrated that the variation in NPP VIIRS is related to GDP, road density, and vegetation in the area of the densely populated in the world. Besides, Liu et al. (2019) [45] studied the influence of festivals on the NPP VIIRS change pattern, analyzed the seasonal change of NPP VIIRS, and explored spatial distribution pattern of NPP VIIRS during festivals. These studies provided the foundation to analyze urban development based on NPP VIIRS. On the other hand, based on the relationship between nighttime light and socioeconomic activities, some studies suggested that we can monitor urban development using socioeconomic indicators predicted by NPP VIIRS. For example, Pan et al. (2020) [21] explored the factors that result in poverty and inequality in Xiamen-Zhangzhou-Quanzhou urban agglomeration from 2012 to 2018 using NPP VIIRS. Meanwhile, Wu et al. (2020) [46] studied the law of urban development in China from 2012 to 2018 at multiple scales using NPP VIIRS and found that Chinese urban development complies with Zipf’s law. Yang et al. (2019) [19] successfully characterized the relationship between urban spatial expansion and economic development situation based on the exponent model and identified the urban development stage through regression coefficients. Besides, Stokes et al. (2019) [47] divided cities into different categories based on NPP VIIRS by researching the consistency between infrastructure conversion and land use and population. According to the aforementioned studies, we can find that NPP VIIRS indeed provides a powerful tool to investigate urban sprawl, estimate economic development, and evaluate other indicators from a macro perspective. Meanwhile, it facilitates scholars studying socioeconomic activities and reduces labor and cost.
Despite previous efforts, there are two major deficiencies remaining. First, nighttime light is an important tool to predict socioeconomic indicators and monitor urban development in a real-time and effective way [19,46,47]. However, the long-term sequence NPP VIIRS spatiotemporal distribution pattern is still unknown, and it is harmful to monitor overall urban development and cannot provide references for policy-makers in advance. Second, although some studies explored the factors of NPP VIIRS variation [44,45], however, there were no studies systematically explaining the industry-driving force of nighttime light variation in radiance. These limitations seriously hindered the application of nighttime light in urban development.
Wang et al. (2012) [17] and Yu et al. (2015) [48] have proved that nighttime light can represent the urban development gap through analyzing the capability of nighttime light to characterize the poverty situation in different regions. Besides, we all know that nighttime light comes from human activities, and human socioeconomic activities are classified into the primary, secondary, and tertiary industry. Han et al. (2018) [49] pointed out that the industry structure is related to nighttime light and demonstrated that the changes in nighttime light can reflect the tertiary industry structural changes in China at the provincial scale. However, whether there are relationships between nighttime light and the primary and secondary industry is still unknown. The industry structure can be considered as the proportion of the three major industries in each region. We inferred that the more reasonable the industry structure is, the higher the average light index (ALI) is.
Through previous studies, we can know that GDP is the standard to assess urban development level, and nighttime light is a reflection of the urban development level. Thus, this paper analyzed the spatiotemporal variation modes of ALI based on NPP VIIRS and investigated the industry-driving force of ALI in 100 cities across China mainland to provide the government with reference to optimize industry structure, narrow urban development gap, and achieve sustainable development. Additionally, two possible influencing factors namely location and coal resource were further discussed to better understand the spatial distribution of ALI. This paper will support further exploring urban development mode and provide a reference to narrow urban development gap and promote sustainable development.
2. Study Area and Data
2.1. Study Area
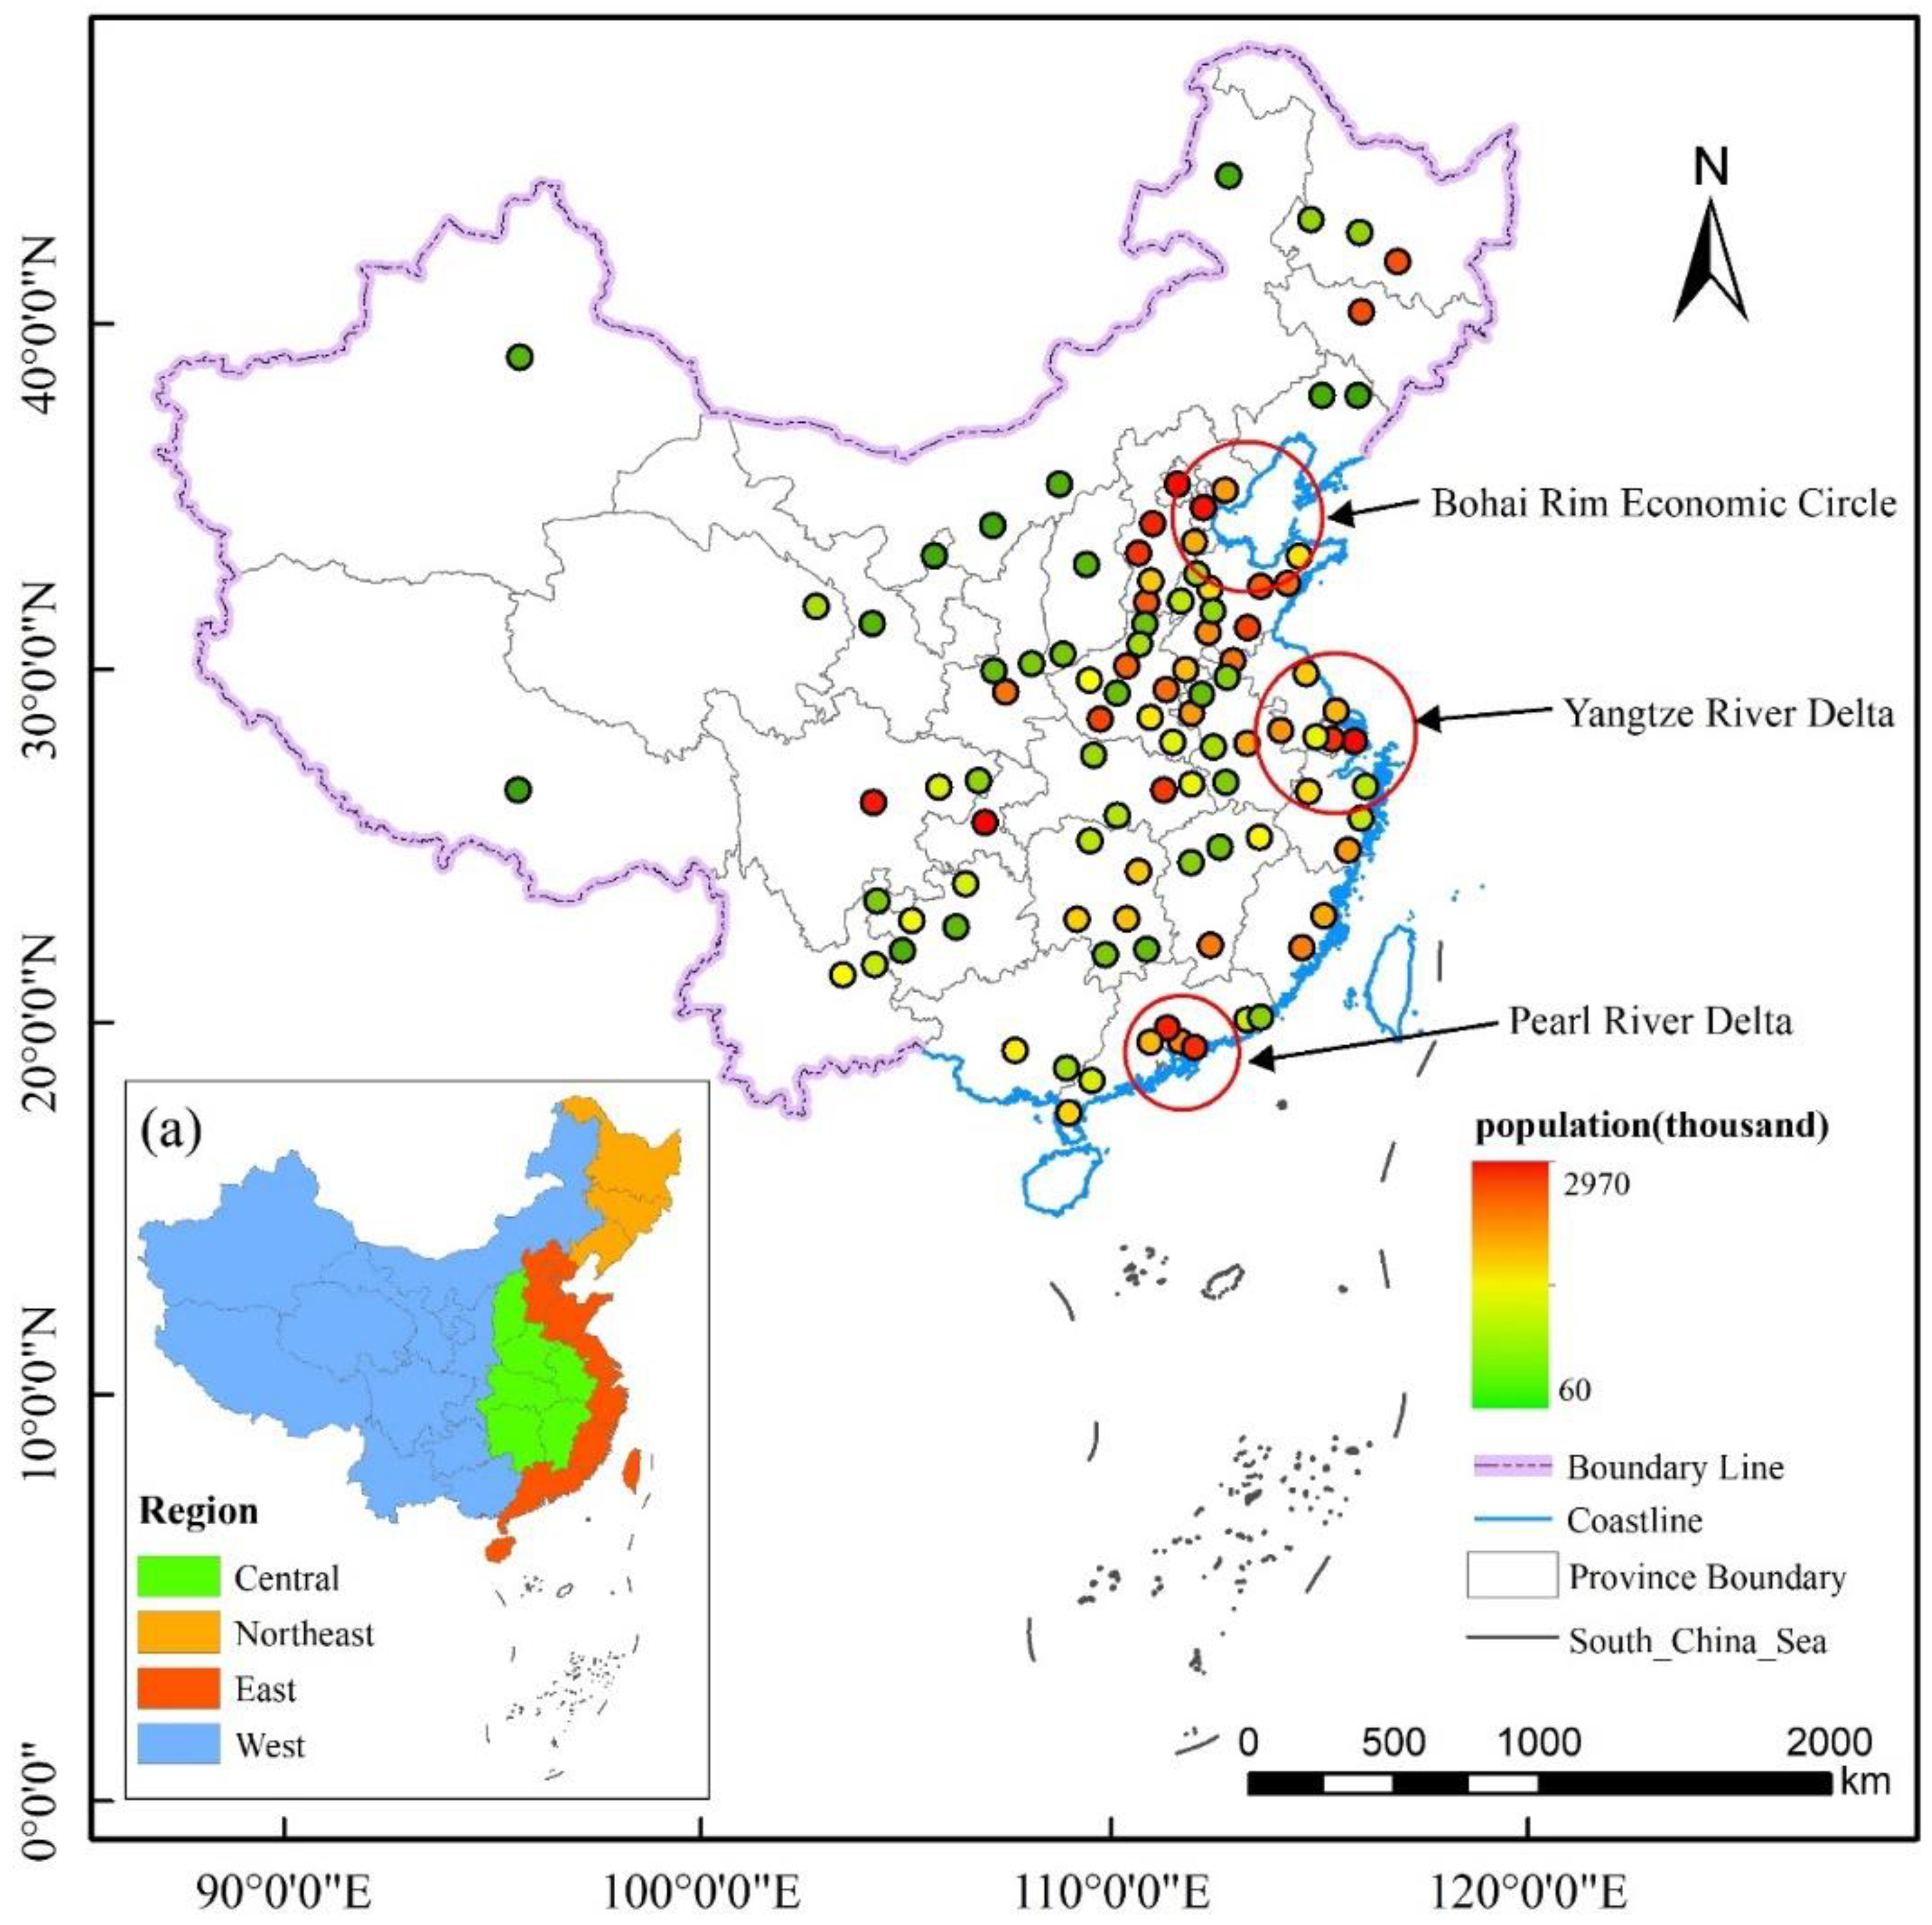
China with a vast territory (960 million land area and 3.96 million sea area), diverse climate-types (temperate continental climate, temperate monsoon climate, tropical monsoon climate and so on), and abundant resources (coal, oil, natural gas, and other resources) is located in the east of Eurasia and on the western coast of the Pacific Ocean [50]. China has obtained notable achievement in recent years [3]. It can be reflected by the GVA (10,283,983 million dollars in 2014) that ranked the second among major countries in 2014 [10]. Besides, the number of poverty counties has decreased to 52 in 2020 (665 poverty counties in 2012) (http://www.cpad.gov.cn/). However, affected by natural conditions namely terrain, climate and resources, and human factors namely transportation and policies, cities in different regions exhibit various development characteristics. It can be characterized by the downward trend in the high-tech industry (mainly in the tertiary industry) from the eastern coastal region to the western region [18]. Thus, accurately exploring the urban development direction and researching the industry-driving force of the cities are significant prerequisites for policy formulation and prospect planning. Owing to the complex geographic environment and diverse economic situation, China is a typical country for studying different urban development modes and different industry-driving force. Synthetically considering the situation of the population, geography and economy, 100 prefecture-level cities across China mainland are selected as the research object in this paper (Figure 1 and Table A1), including 17 coal mining cities (Table A1). According to the City scale standards, the selected cities are classified into super-cities, megacities, large cities, and medium cities (Table A1). In order to facilitate the analysis of the spatial distribution of ALI, the study area is divided into four regions namely the northeastern region, eastern region, central region, and western region according to the Economic zone division standard.
2.2. Data
In 2013, NOAA/NGDC (https://ngdc.noaa.gov/eog/viirs/download_dnb_composites.html) released NPP VIIRS nighttime light dataset (unit: nanoWatts/cm2/sr) which is produced by the Earth Observation Group (EOG) using nighttime data from the Infrared Imaging Radiometer Suite Day/Night Band (DNB). The pixel values of DMSP-OLS ranges from 0 to 63 rather than absolute values in Watts per per steradian, while the values of the NPP VIIRS are absolute values that greatly overcome pixel saturation in urban centers. Besides, the resolution of DMSP-OLS (30 arc-s) is far lower than NPP VIIRS (15 arc-s). Additionally, the DMSP-OLS sensors lack low light imaging spectral bands that cannot capture weak light. Despite the shortcomings that existed in DMSP-OLS, it plays a significant and irreplaceable role in early years. However, considering the advantages of the spatial resolution of 15 arc-s, wider radiation detection range and in-flight calibration, NPP VIIRS is selected to investigate the spatiotemporal variation of nighttime light. While there are also shortcomings in NPP VIIRS that the pixels of monthly composites are missing in high latitude in some months and NOAA/NGDC only provides the annual composites which remove temporal lights and background values in 2015 and 2016. Limited by the missing of monthly and annual composites nighttime light data, we select complete NPP VIIRS monthly composites data. Finally, referencing to Shi et al. (2014) [6], we use the annual composites nighttime light data in 2015 and 2016 as the mask to remove background noise and use the maximum threshold method to remove outliers in monthly composites nighttime light data.
Statistical data used in this paper is provided by the National Bureau of Statistics (http://www.stats.gov.cn/tjgz/wzlj/dftjwz), including the GDP of 100 prefecture-level cities which is composed of urban and rural area, and three major industries data namely the primary (mainly in agriculture), secondary (mainly in industry) and tertiary (mainly in service) industry from 2013 to 2018. The GDP data is used to evaluate the ability of NPP VIIRS to characterize economic development and three major industries data is used to study the relationship between the rationality of the industry structure and NPP VIIRS. In China, the rationality of the industry structure refers to an industry structure based on the rational use of resources, coordinated development of various industries, high-tech industries as the leading, and advantageous industries as the base [18,49].
Raw coal production data from 2013 to 2018 are provided by the National Coal Industry Network (http://www.coalchina.org.cn/).
3. Method
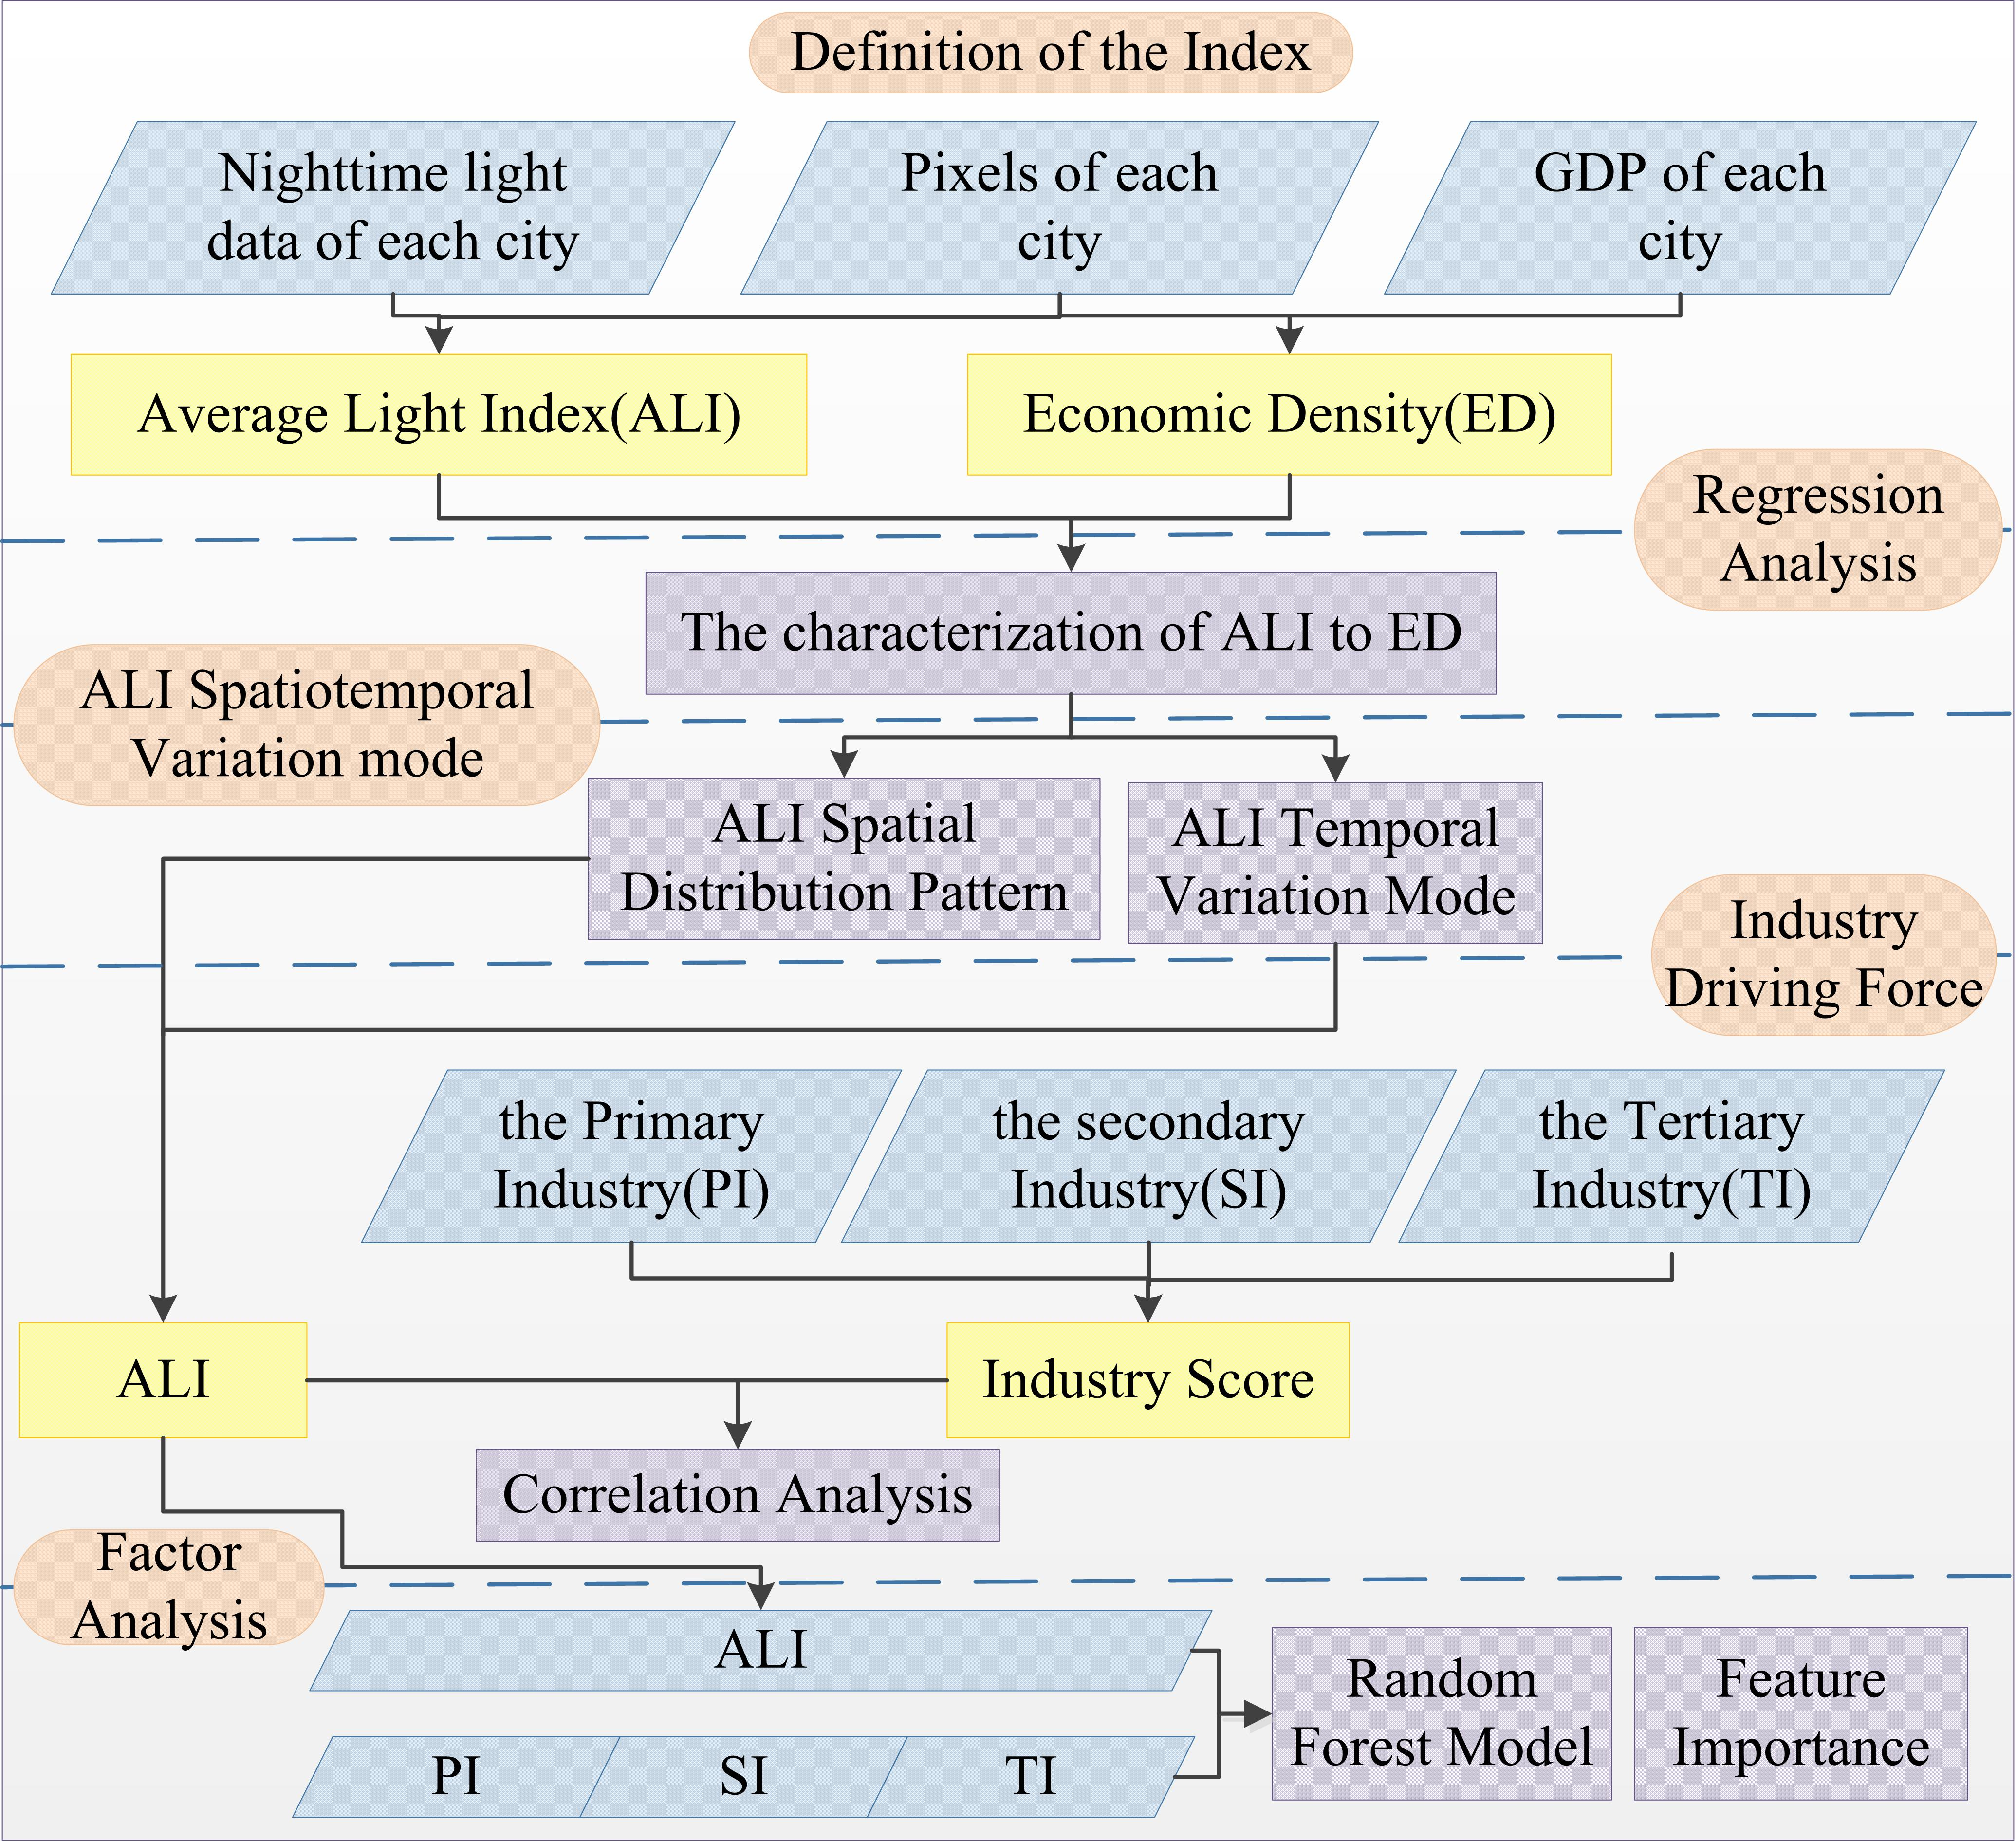
3.1. Definition of Parameters
3.1.1. Average Light Index (ALI)
ALI can represent the average level of a region [48]. Yu et al. (2015) [48] have demonstrated the accuracy of ALI by comparing it with the integrated poverty index at the county level in China. Besides, ALI has been extensively used to characterize socioeconomic indicators [21,51,52]. Meanwhile, NPP VIIRS processing methods, proposed by Shi et al. (2014) [40] and Li et al. (2013) [51], have been widely used [20,21,48]. Actually, these methods are based on the hypothesis that the lit area in DMSP-OLS and NPP VIIRS are same and generated a mask with all pixels with positive DN values and then corrected NPP VIIRS using the mask. With the same hypothesis, we correct original NPP VIIRS with more up-to-date data that include 2015 and 2016 NPP VIIRS annual composite processed by NGDC, and calculate ALI of 100 cities as follows:
where represents the average light radiation of the ith city that includes urban and surrounding areas, represents the radiation of the jth pixel in the ith city, and represents the total number of pixels in the ith city.
3.1.2. Economic Density Index (ED)
GDP, a reflection of the comprehensive economic level, is related to the urban economic development level and the urban administrative area [17], which means two regions with the same economic development level, the GDP is higher in the larger urban administrative. While the GDP only measures the general economic status and development level of a country or region [48]. In order to represent the average development level of the city, we select economic density (ED) which can characterize the efficiency of economic activities per unit area of a city as the economic indicator:
where represents the economic density index of the ith city, represents the GDP of the ith city, and represents the total number of pixels in the ith city.
3.2. Regression Analysis
Regression models help to find the linear or non-linear relationship between independent and dependent variable from data mixed with noise and predict the inversion variables quantitatively. Because of the superiority of quantifiable nature and reliability in regression models, there are a large number of studies that quantitatively analyze the relationship between independent variables and dependent variables based on regression models [22,53]. For example, Hu et al. (2019) [25] modeled the global electric power consumption using linear, logarithmic, exponential, and second-order polynomial regression models. Besides, Zhu et al. (2017) [54] applied linear, quadratic polynomial, and power function model to predict GDP in China. Among the regression models, the linear regression model is a commonly used correlation analysis model. For example, Shi et al. (2014) [40] used the linear regression model to predict GDP and electric power consumption. Li et al. (2019) [53] established a linear regression model to study the correlation between electric power consumption and nighttime light. Because of the advantages of simplicity, intuitiveness, and high accuracy, we select the linear regression model to explore the correlation between independent and dependent variables in this paper.
3.3. Rationality of the Industry Structure
Entropy weight theory, an objective approach, has been widely used in the multi-index comprehensive evaluation system [43,48,55]. Research suggested that the evaluation of the rationality of industry structure based on the entropy weight method can effectively reflect the changing law of integrated industry development [42]. The 16th National Congress of the Communist Party of China pointed out that reasonable industry structure refers to an industrial pattern with high-tech industry as the forerunner, basic industry, and manufacturing as the support and the service industry developing in an all-round way, and it is essential to sustainable development [10]. Because of the advantage of objectivity, we select the entropy weight method to score the industry structure layout and quantitatively evaluate the rationality of the urban industry structure. The higher the industry structure score is, the more reasonable the industry structure is.
The primary, secondary, and tertiary industry data are standardized as follows:
where represents the standardized value of the jth industry in the ith city, represents the original value of the jth industry in the ith city, and and represent the minimum and maximum value of the jth industry in the ith city in each year, respectively.
Using the standardized value, the industry structure score is calculated based on the entropy weight method:
where represents the industry structure score in the ith city, represents the weight of the jth industry, and K equals to 3, representing the three major industries.
3.4. Factor Analysis
Nighttime light is related to economy. For example, Levin et al. (2017) [44] illustrated that nighttime light positively correlated with GDP per capita. Besides, Han et al. (2018) [49] have pointed out that nighttime light intensity is related to industry structural changes that are composed of the primary, secondary and tertiary industry. Therefore, we conduct factor analysis to further investigate the factor contribution of the three major industries to ALI.
Random forest (RF) is an ensemble of prediction trees based on the regression and classification trees. It was integrated into a scikit-learn python library. RF can predict results by averaging values calculated by each tree. Zhao et al. (2019) [52] estimated poverty in Bangladesh using RF. Liang et al. (2020) [56] analyzed spatial distribution employing RFR. Li et al. (2019) [57] used RF to research the factor contribution of six potential factors to surface urban heat island intensity difference. Therefore, RF is utilized to conduct factor analysis because of the advantages of robust and high precision.
4. Results
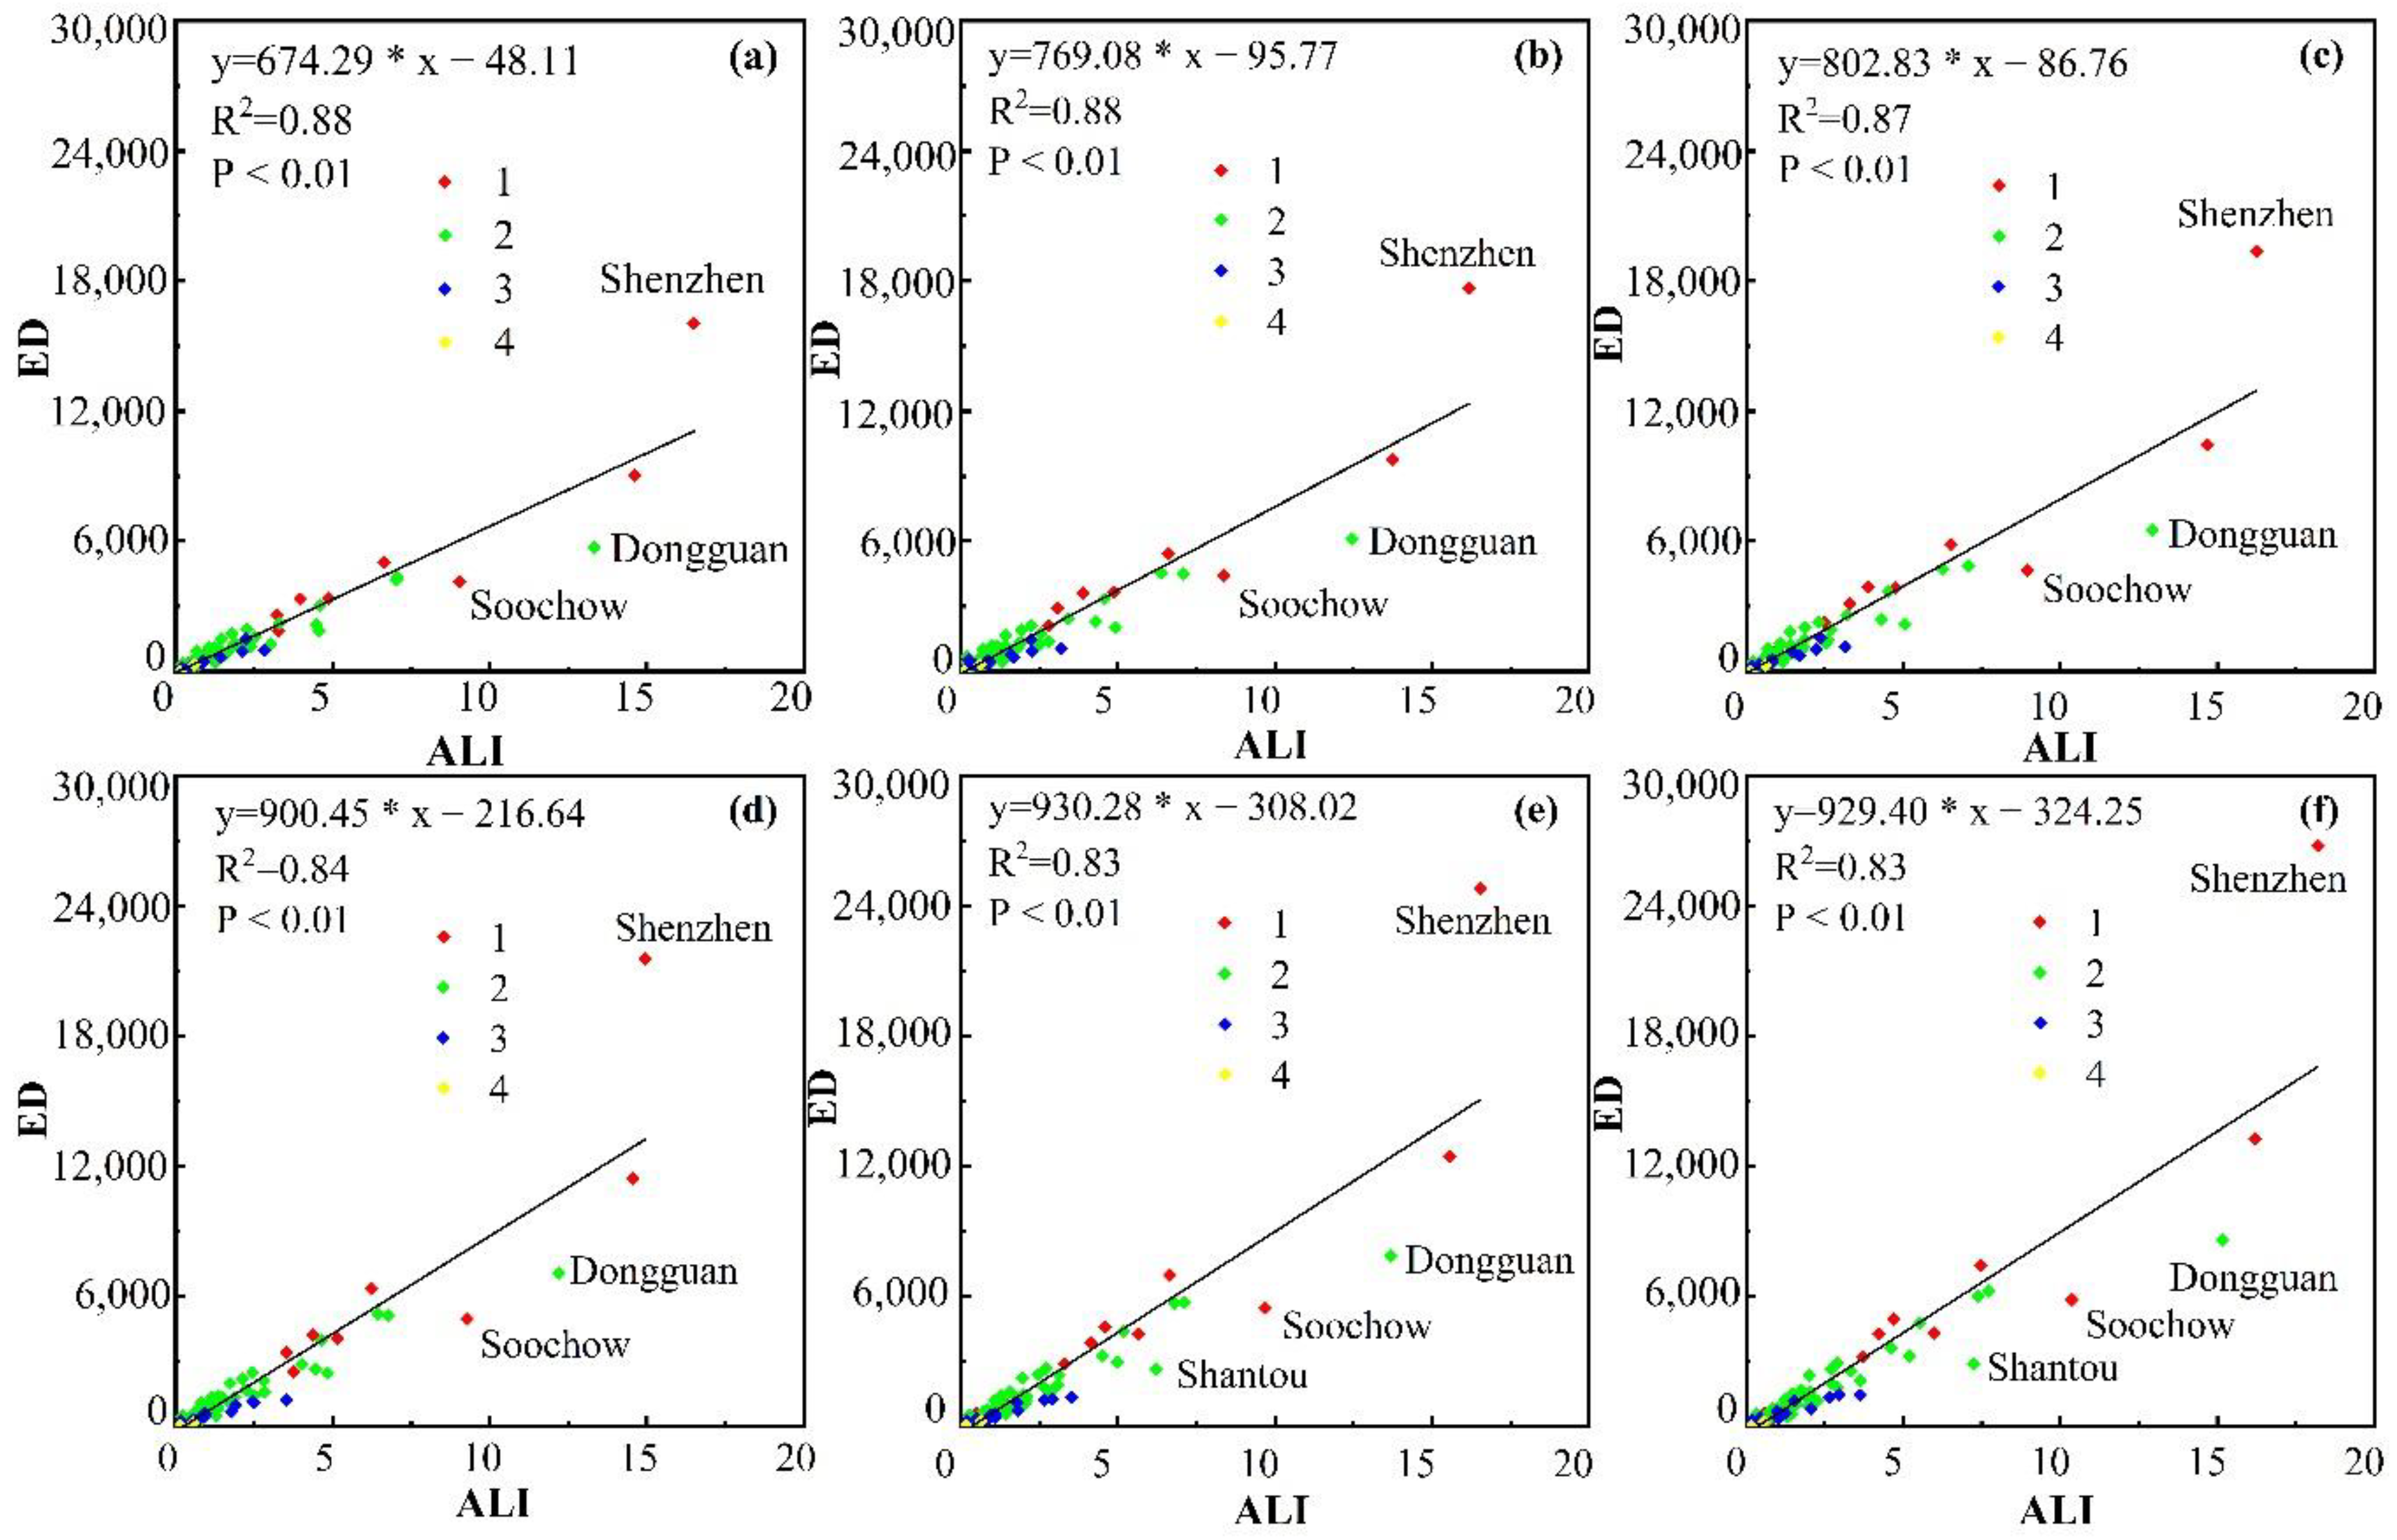
4.1. Characterization of ALI to Economic Development
The regression analysis results () of ALI and ED are greater than 0.8 (Figure 2), which represent that ALI can explain economic changes at a level higher than 80%, illustrating that ALI has the potentiality to characterize the economy. In Figure 2, a good correlation between ALI and ED is observed among most cities that belong to medium cities, large cities, and megacities. However, a few super-cities and megacities are far from the regression line. Among these cities, the economic development of Shenzhen reaches a mature stage, the spatial and economic urbanization is high, and the speed of economic development is faster than ALI. On the contrary, the economic development of Soochow, Dongguan, and Shantou is in the stage of rapid development and the ability of ALI to characterize ED is weak [19]. To sum up, the regression results suggest that ALI can effectively characterize the economic development.
4.2. Spatiotemporal Distribution of ALI
4.2.1. Spatial Distribution Pattern of ALI
To investigate the spatial distribution of nighttime light, ALI of the 100 cities calculated by corrected NPP VIIRS is shown in Figure 3 and the mean value of ALI in four regions are shown in Table 1. In Figure 3, ALI is observed a funnel pattern in four regions, with low in center region and high in the surrounding. According to Table 1, we can know that the growth rates of ALI from 2013 to 2018 in the eastern, western, central, and northeastern regions are 0.038, 0.047, 0.078, and 0.31, respectively. The level of economic development in the central and western regions is relatively low, while the in-depth implementation in the great western development strategy and the Rise of Central China has accelerated urbanization [16,58] which results in the high growth rate of ALI. However, compared with the eastern region, since the initial endowment of production factors is relatively low [16], socioeconomic activities are weak and the net increase of ALI is low. As an old industrial base, ALI in the northeastern region is relatively low as the population is massively outflowing and urban development lacks vitality [43]. Because of the high economic development level and a strong economic foundation [19], the net increase of ALI in the eastern region is high. On the whole, ALI shows a noteworthy difference in space because of economic and natural conditions.
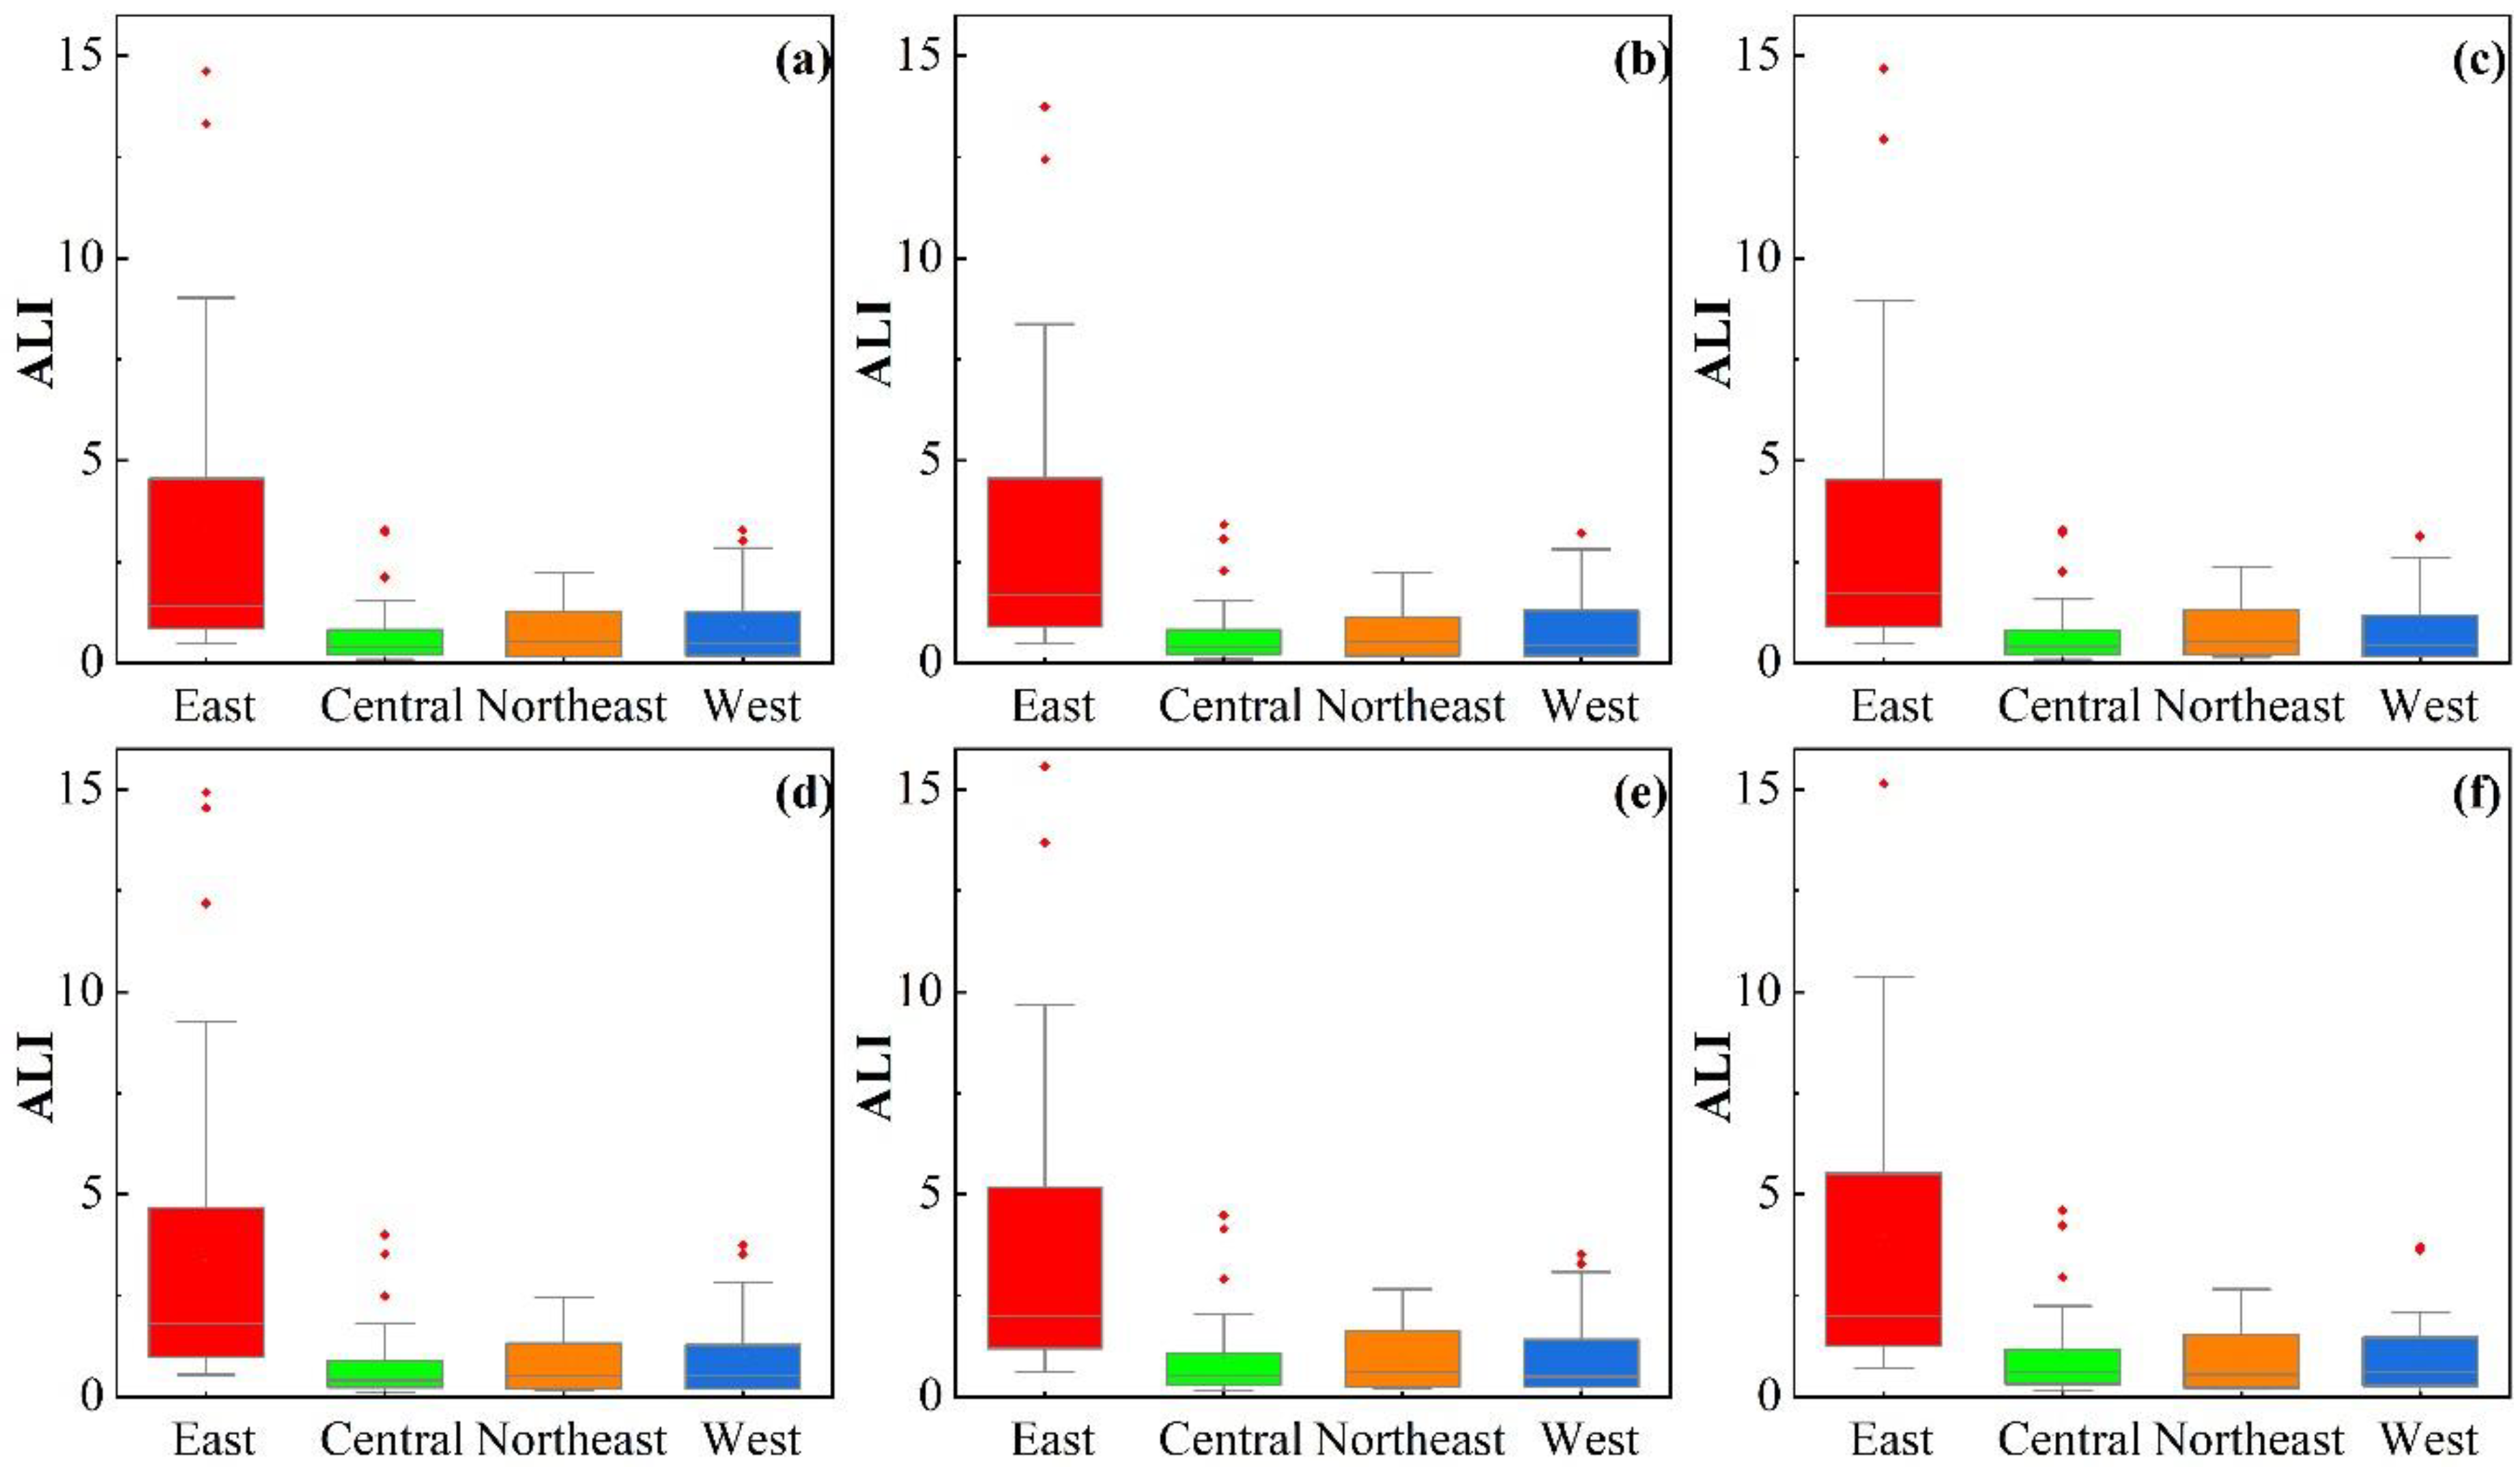
In order to clearly investigate the distribution difference among the four regions, the distribution characteristics of ALI from 2013 to 2018 are represented by box-plots (Figure 4). According to Table 1 and Figure 4, the ALI shows significant difference characteristics in four regions. Take 2018 as an example, in the northeastern region, ALI in Shenyang is the highest (2.66 nanoWatts/cm2/sr), and ALI in Suihua is the lowest (0.18 nanoWatts/cm2/sr); in the eastern region, ALI in Shenzhen is the highest (18.19 nanoWatts/cm2/sr), and ALI in Maoming is the lowest (0.70 nanoWatts/cm2/sr); in the central region, ALI in Zhengzhou is the highest (4.6 nanoWatts/cm2/sr) and ALI in Yongzhou is the lowest (0.16 nanoWatts/cm2/sr); in the western region, ALI in Chengdu is the highest (3.71 nanoWatts/cm2/sr), and ALI in Hulunbuir is the lowest (0.03 nanoWatts/cm2/sr). Among the four regions, ALI in the eastern region is the highest overall and the average ALI are 3.39-, 3.32-, 3.37-, 3.40-, 3.79-, and 4.08 nanoWatts/cm2/sr from 2013 to 2018, respectively. Although the 38 cities are all in the eastern region, while limited by location, resource, and transportation conditions, the ALI of cities outside the Yangtze River Delta, the Pearl River Delta, and the Bohai Rim Economic Circle are much lower than those within the economic circle, resulting in a great difference of ALI in the eastern region. Since half of the selected cities in the western region are provincial capital cities whose main functions are to enhance economic radiation capacity, rationally allocate resources, and improve regional industry structure and economic development quality, the ALI of provincial capital cities is much higher than that of non-provincial cities, leading to large ALI difference in the western region. Besides, ALI in the northeastern region is higher than that in the central region and the difference of ALI in the northeastern region is relatively small with the benefit of a strong industrial foundation. While compared with the other three regions, the cities in the central region have a relatively dense population (429 population/ in the central region) which is much higher than that in the northeastern (215 population/) and western region (202 population/), and lower than that in the eastern region (869 population/). Besides, cities in the central region have relatively developed agriculture and stable economic development, with the lowest ALI and smallest difference.
4.2.2. Temporal Variation Mode of ALI
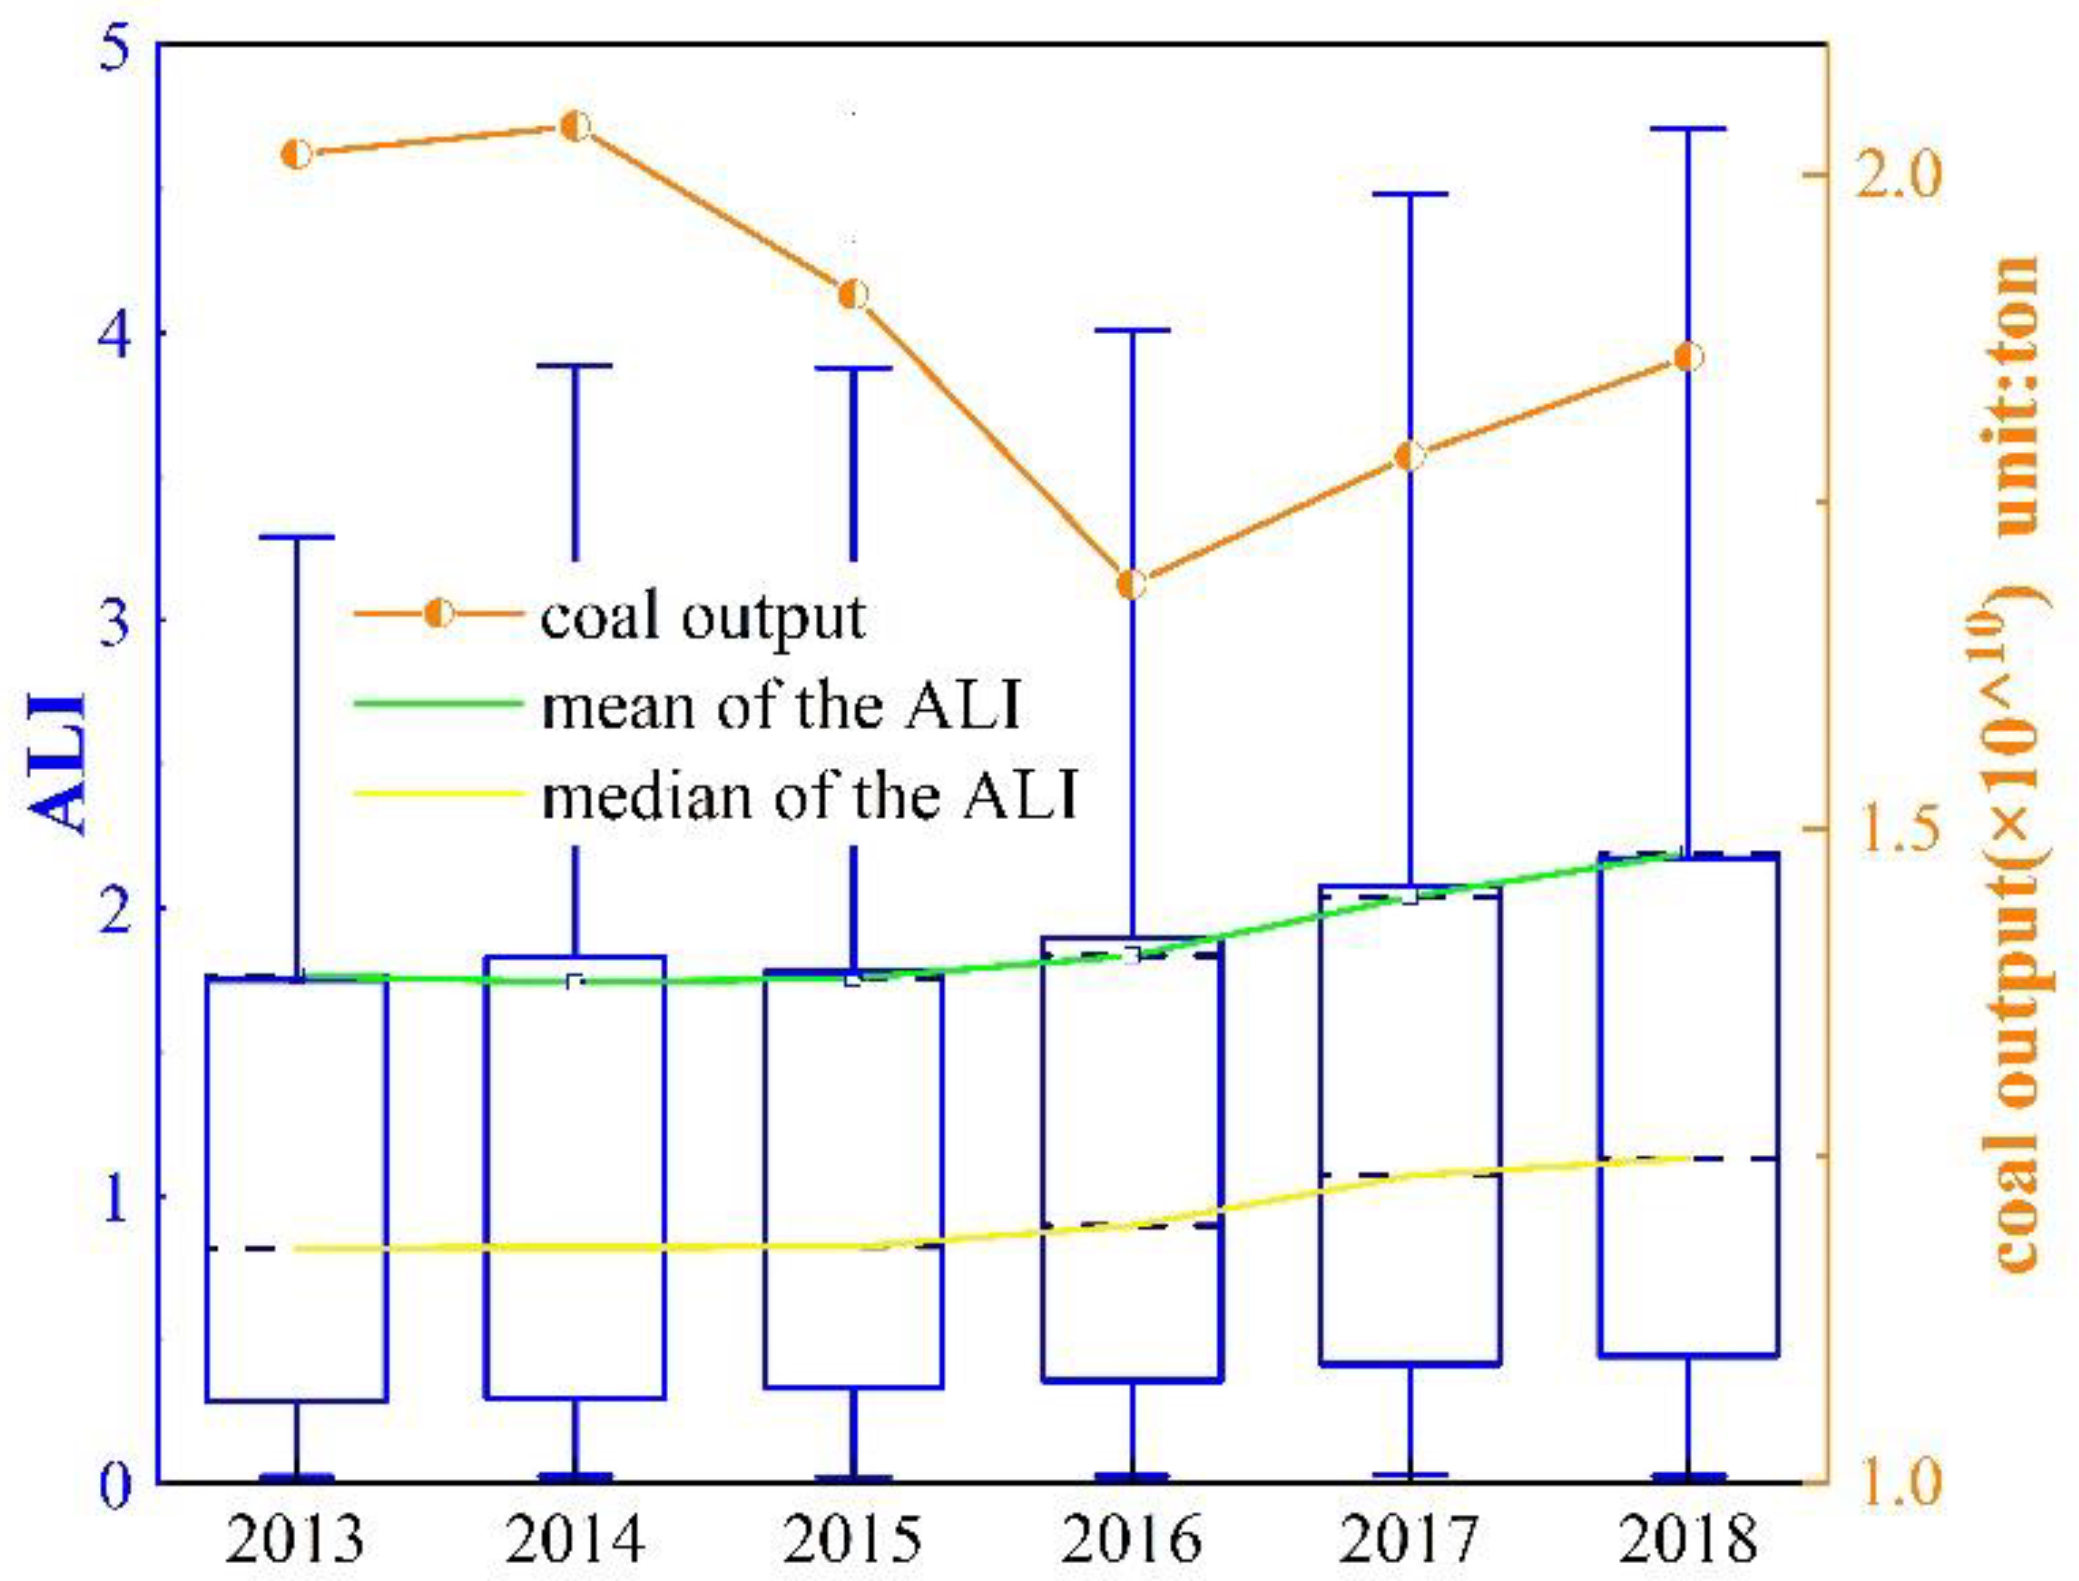
ALI distribution difference and the raw coal production change from 2013 to 2018 are shown in Figure 5. The median and mean value of ALI are in the upward trend from 2013 to 2018, and the upward trend is slight in 2014 and 2016 and the upward extend is obvious in 2017 and 2018. The trend of raw coal production is consistent with the trend of ALI, which is in the downward during 2015 and 2016 in most cities. Studies illustrated that nighttime light significantly positively correlates with electricity consumption [22,53,59], as well as about 70 percent of our country’s electricity is produced from coal through thermal power generation [60]. Thus, we inferred that the raw coal production indirectly affects nighttime light through electricity produced by raw coal. Besides, ALI in 100 selected Chinese cities shows an increasing disparity from 2013 to 2018. The eastern region is the center of the economy that focuses on the rapid development of the high-tech industry [61]. Besides, under the in-depth implementation of the east-west region industry transfer, the rise of the central region and other national strategies, the central and western regions accelerate the speed of economic development [62]. However, compared with the eastern region, the development level in the western region is still low as the western region is limited by natural and traffic conditions [63], leading to an increasing disparity in ALI from 2013 to 2018.
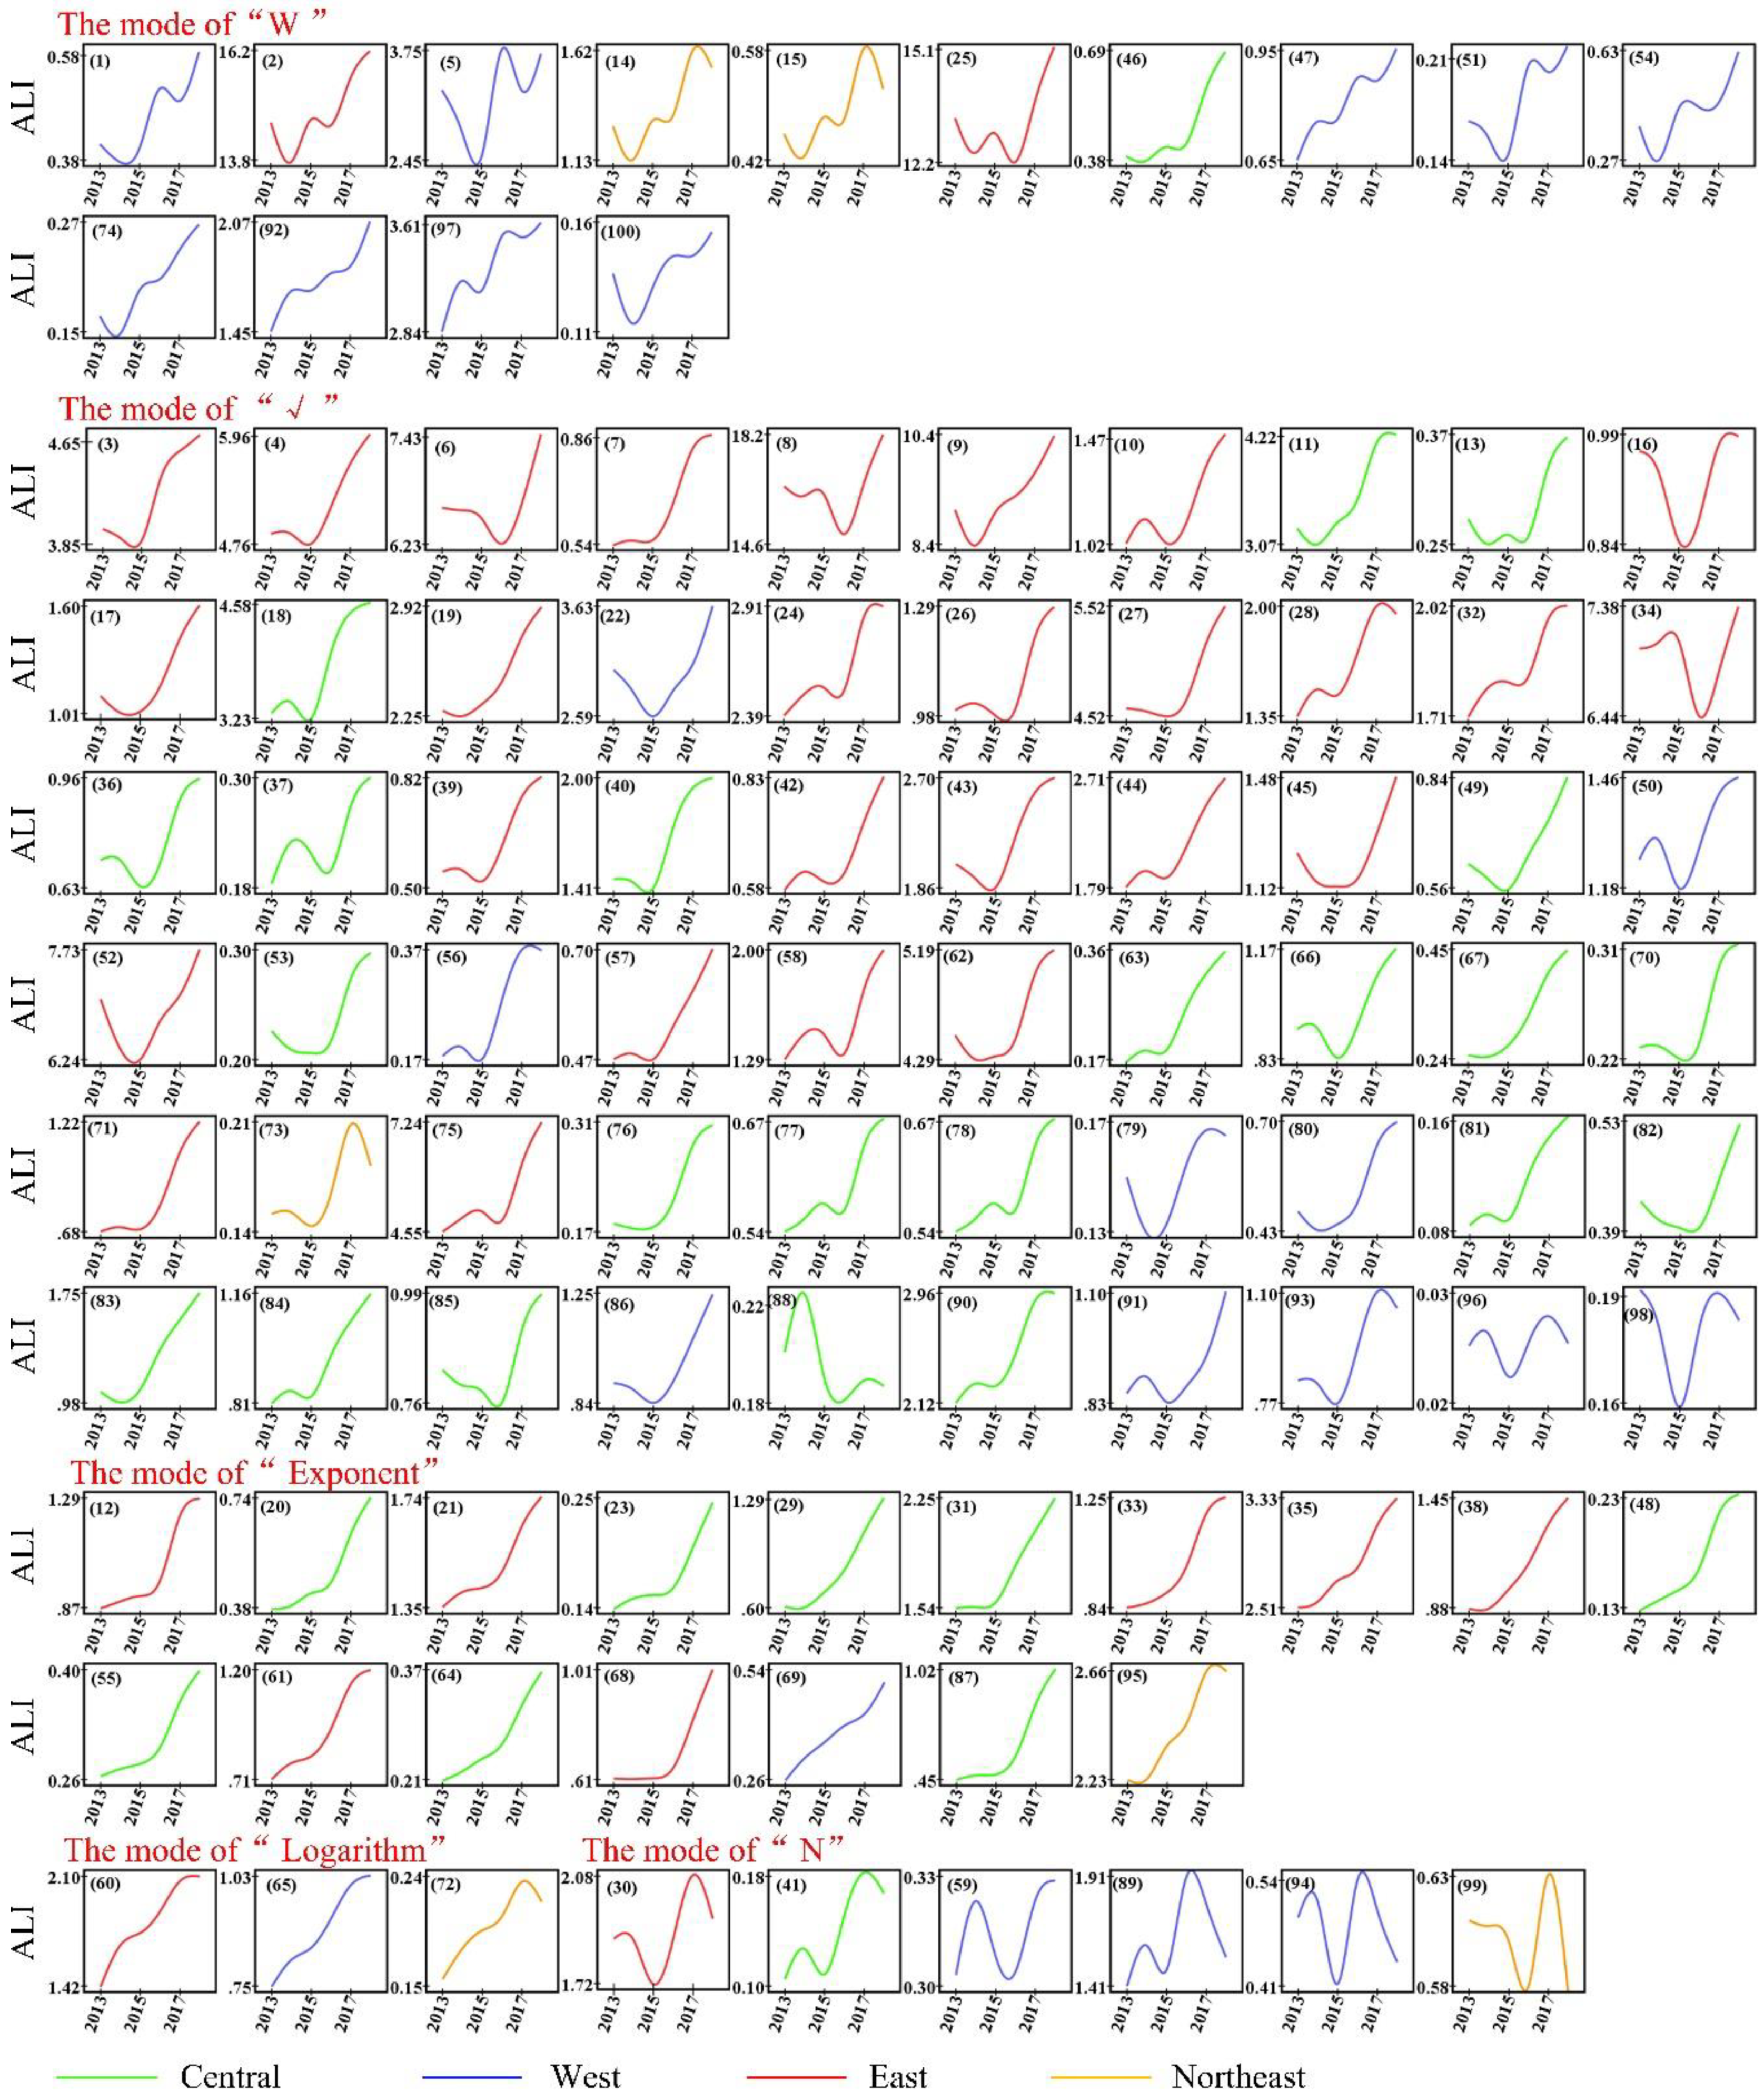
By defining different ALI fluctuation states, the ALI of the 100 cities from 2013 to 2018 shows five variation modes (Figure 6) namely “W” mode (ALI experiences decrease twice), “√” mode (ALI experiences decrease once), “Logarithm” mode (ALI increases quickly in the first period and slows down in the second period), “N” mode (ALI changes greatly), and “Exponent” mode (ALI increases steadily). In Figure 6, the “√” mode accounts for 60% among the five modes, which is consistent with the Chinese economic development situation [16], while Liupanshui, Chenzhou, and Fushun, accounting for only 3% among 100 cities, are coal mining cities where coal resource depletion leads to increased urban vulnerability [64], changes in land use structure [12] and lacking vitality in urban development, resulting in the decreased light radiation intensity.
According to Figure 5 and Figure 6, 60% of the selected cities experience a decline in ALI with the sharp decline of raw coal production in 2015 and 2016, especially coal mining cities like Handan, Tangshan, and Fushun. The phenomenon of ALI rising and falling together with raw coal production indicates that the raw coal production not only seriously affect the ALI variation mode in coal mining cities, but also affect the ALI variation mode in other cities.
Counting the number of 5 ALI variation modes in four regions (Table 2), the “√” mode concentrates in the central and eastern regions, the “Exponent” mode concentrates in the eastern and central regions, the “Logarithm” mode evenly concentrates in four regions, and the “N” and “W” mode mainly concentrates in the western region. On the whole, the “W” mode and “N” mode whose fluctuation is large mainly concentrates in the western region, while the mode of “√,” “Exponent,” and “Logarithm” whose fluctuation is small mainly concentrates in the eastern and central regions. This phenomenon is associated with the economic development situation and initial endowment of production factors in different regions.
4.3. Industry-Driving Force
The nighttime light radiation comes from the three major industries. It is conducive to in-depth research if we explore the effect of the industry structure layout on ALI and investigate the industry-driving force of ALI.
4.3.1. The Quality of Industry Structure
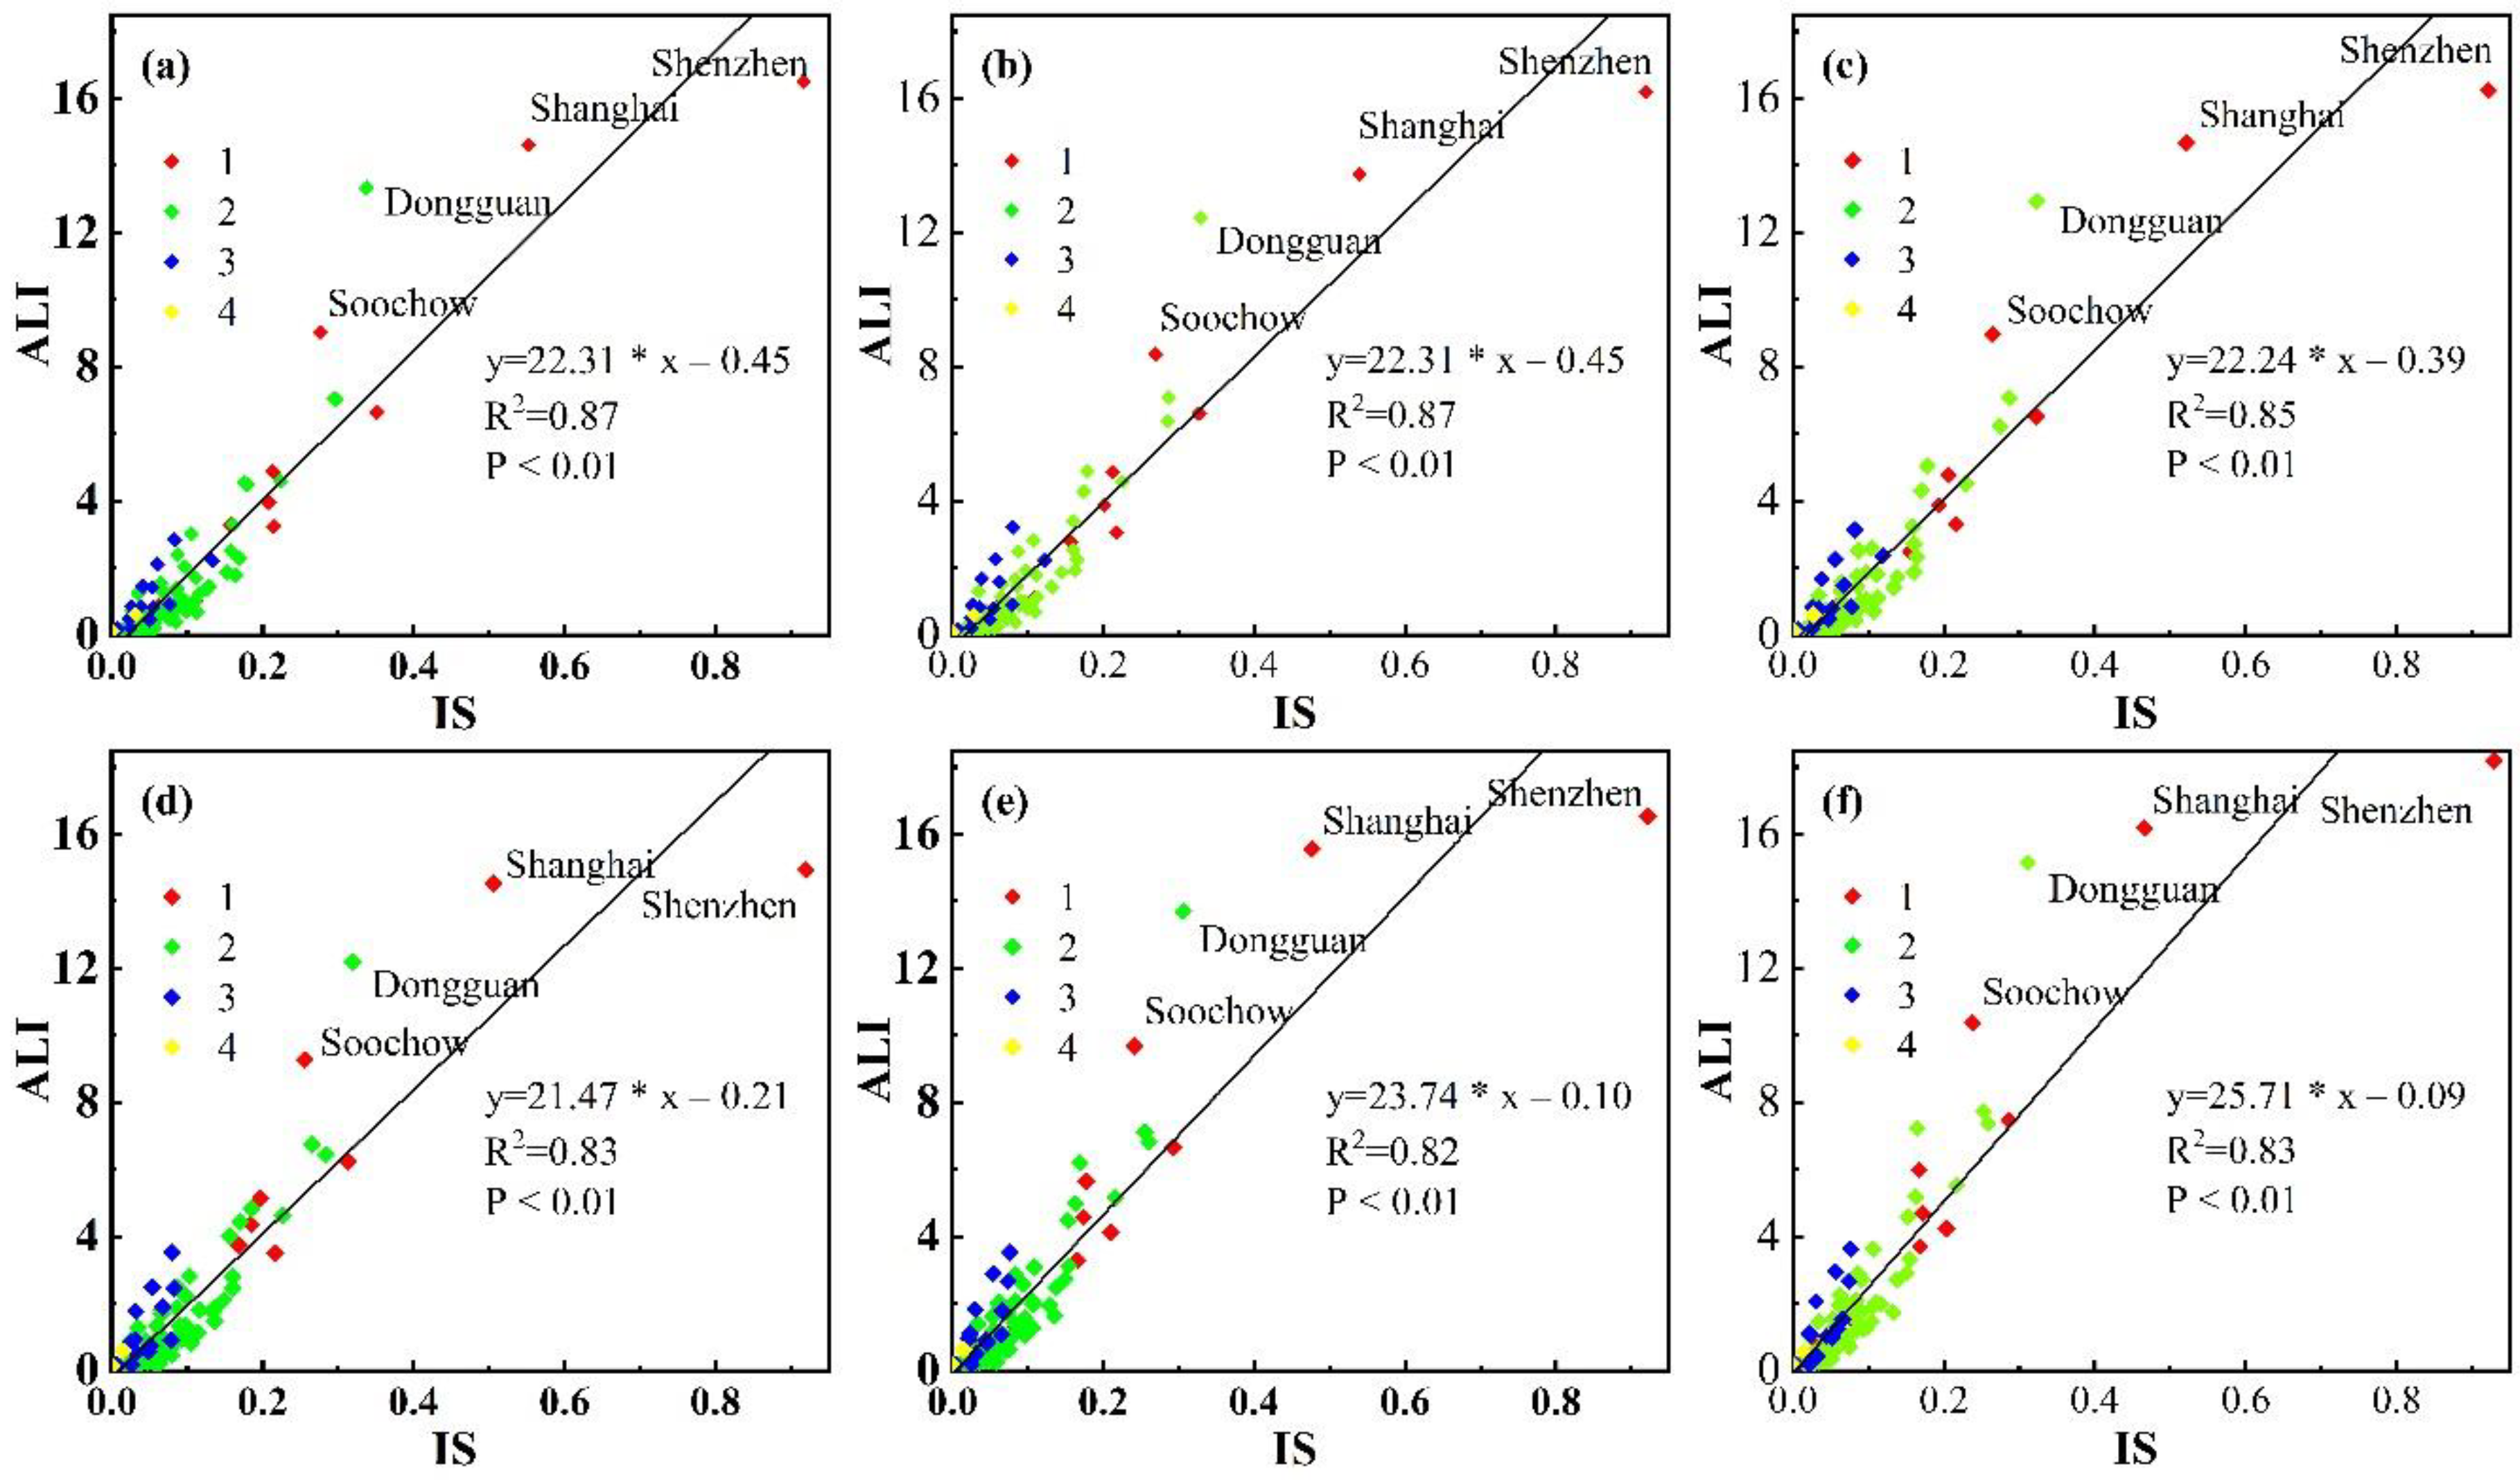
Using the three major industries data to obtain IS based on entropy weight method and conducting regression analysis between IS and ALI, the goodness of fit () is greater than 0.8 (Figure 7), and cities far from the fit line are basically consistent with those in Figure 2. According to the regression results between IS and ALI, IS affects ALI significantly. Besides, research indicated that GDP is positively correlated with NPP VIIRS [56], and the essence of the GDP is the three major industries in China. Additionally, Han et al. (2018) have demonstrated that the industry structure change in China is related to nighttime light based on DMSP-OLS. Therefore, we inferred that the industry structure layout indirectly affects ALI and it may be the fundamental cause of ALI variation.
4.3.2. Industry-Driving Force
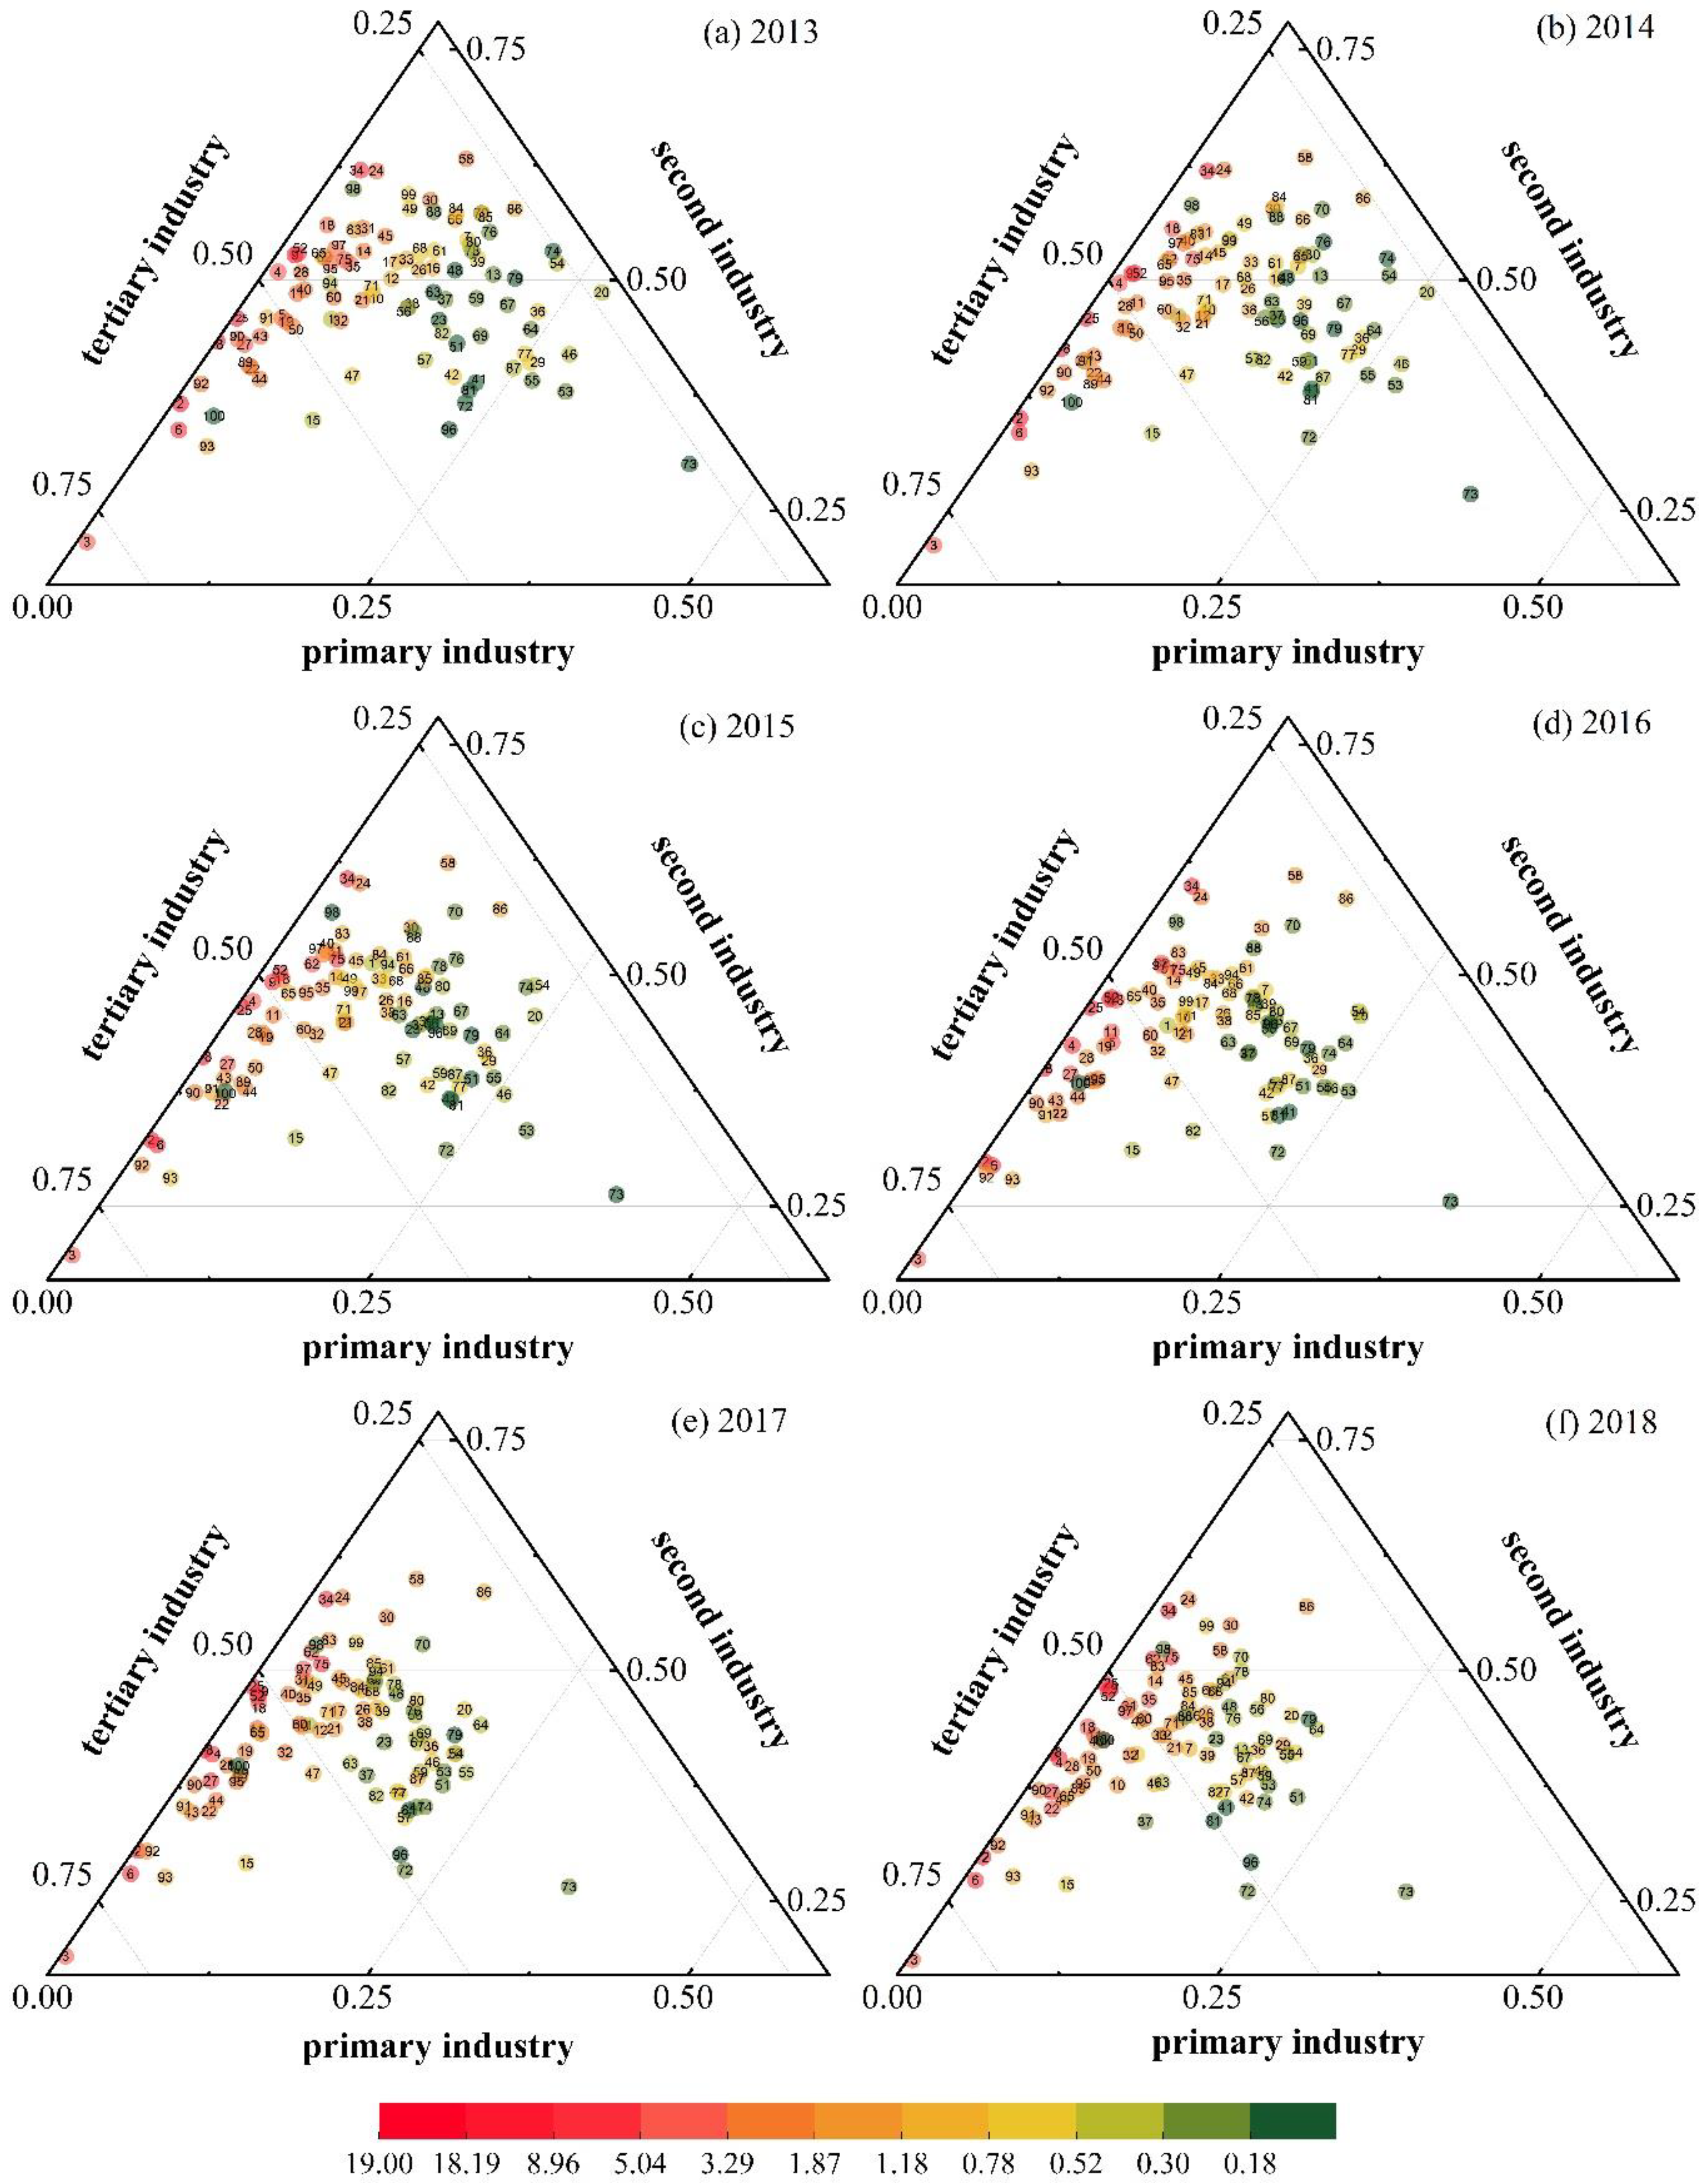
Using the three major industries data and GDP from 2013 to 2018 to calculate the contribution of the three major industries of 100 cities, the position of dots presents the industry structure layout, and the color of dots presents ALI (Figure 8). In Figure 8, since super-cities and megacities like Beijing, Shanghai, and Shenzhen with sound economic development are mainly dominated by the tertiary industry, ALI is high. However, since large and medium cities like Hulunbuir and Qiqihar with relatively depressed economic development are mainly dominated by the secondary or primary industry, ALI is relatively low. Besides, compared with cities in the eastern region, cities in the western region like the Ordos dominated by the secondary industry and Lhasa dominated by the tertiary industry have an expansive district but a sparse population with relatively weaker socioeconomic activities, leading to relatively lower ALI. Additionally, ALI decreases with the rise of the proportion of the primary industry, while it increases with the rise of the proportion of the secondary and tertiary industry, indicating that the secondary and tertiary industry are the industry-driving force of ALI. From 2013 to 2018, the primary industry is gradually transformed into the secondary and tertiary industry in most cities, and the industry structure layout of some cities is mainly in the tertiary industry. Therefore, ALI experiences a significant rise.
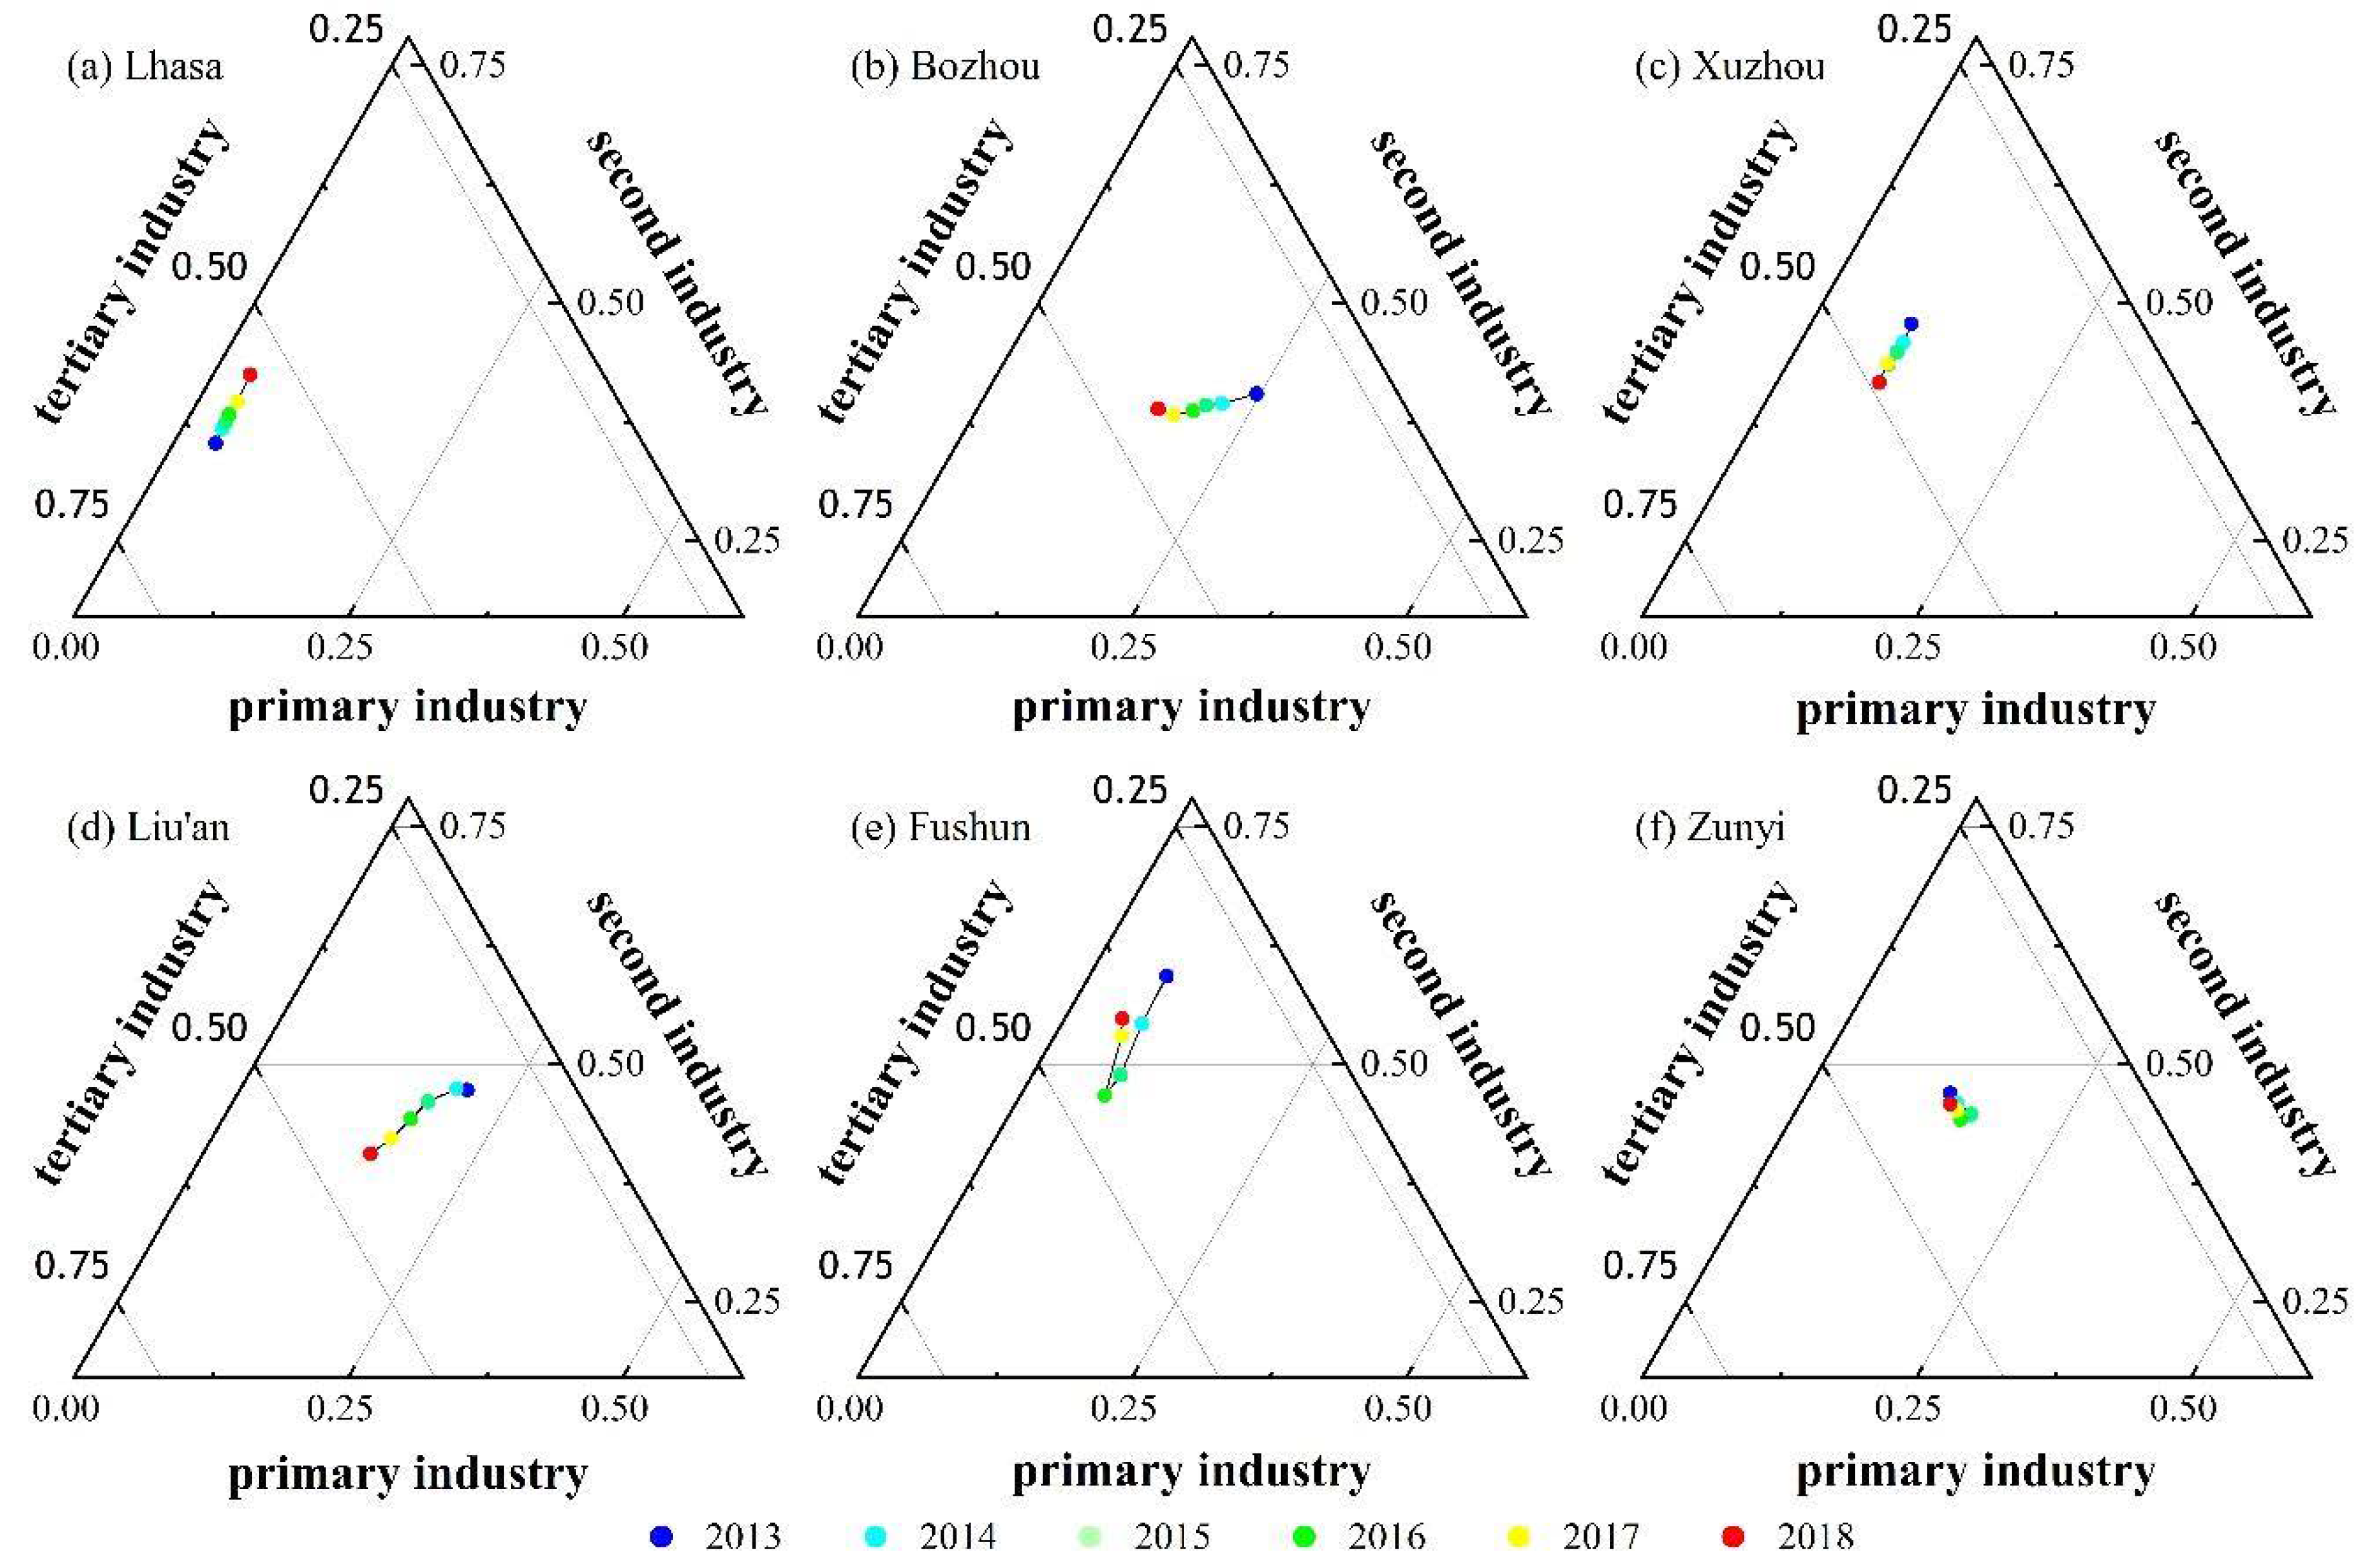
By defining different morphological characteristics of the temporal moving trajectories of 100 cities from 2013 to 2018 on the ternary diagrams, we find six types of industry structure layout changing trajectories (Figure 9). Represented by Lhasa, Bozhou, Xuzhou, Lu’an, Fushun, and Zunyi, respectively, the meaning of the six types of industry structure layout changing characteristics of cities are as follows: (a) Represents that the proportion of secondary industry increases, while the proportion of tertiary industry decreases; (b) represents that the proportion of tertiary industry increases, while the proportion of primary industry decreases; (c) represents that the proportion of tertiary industry increases, while the proportion of secondary industry decreases; (d) represents that the proportion of tertiary industry increases, while the proportion of primary and secondary industry decreases; (e) represents that the proportion of the three major industries reciprocates; (f) represents that the proportion of the tertiary industry changes slightly.
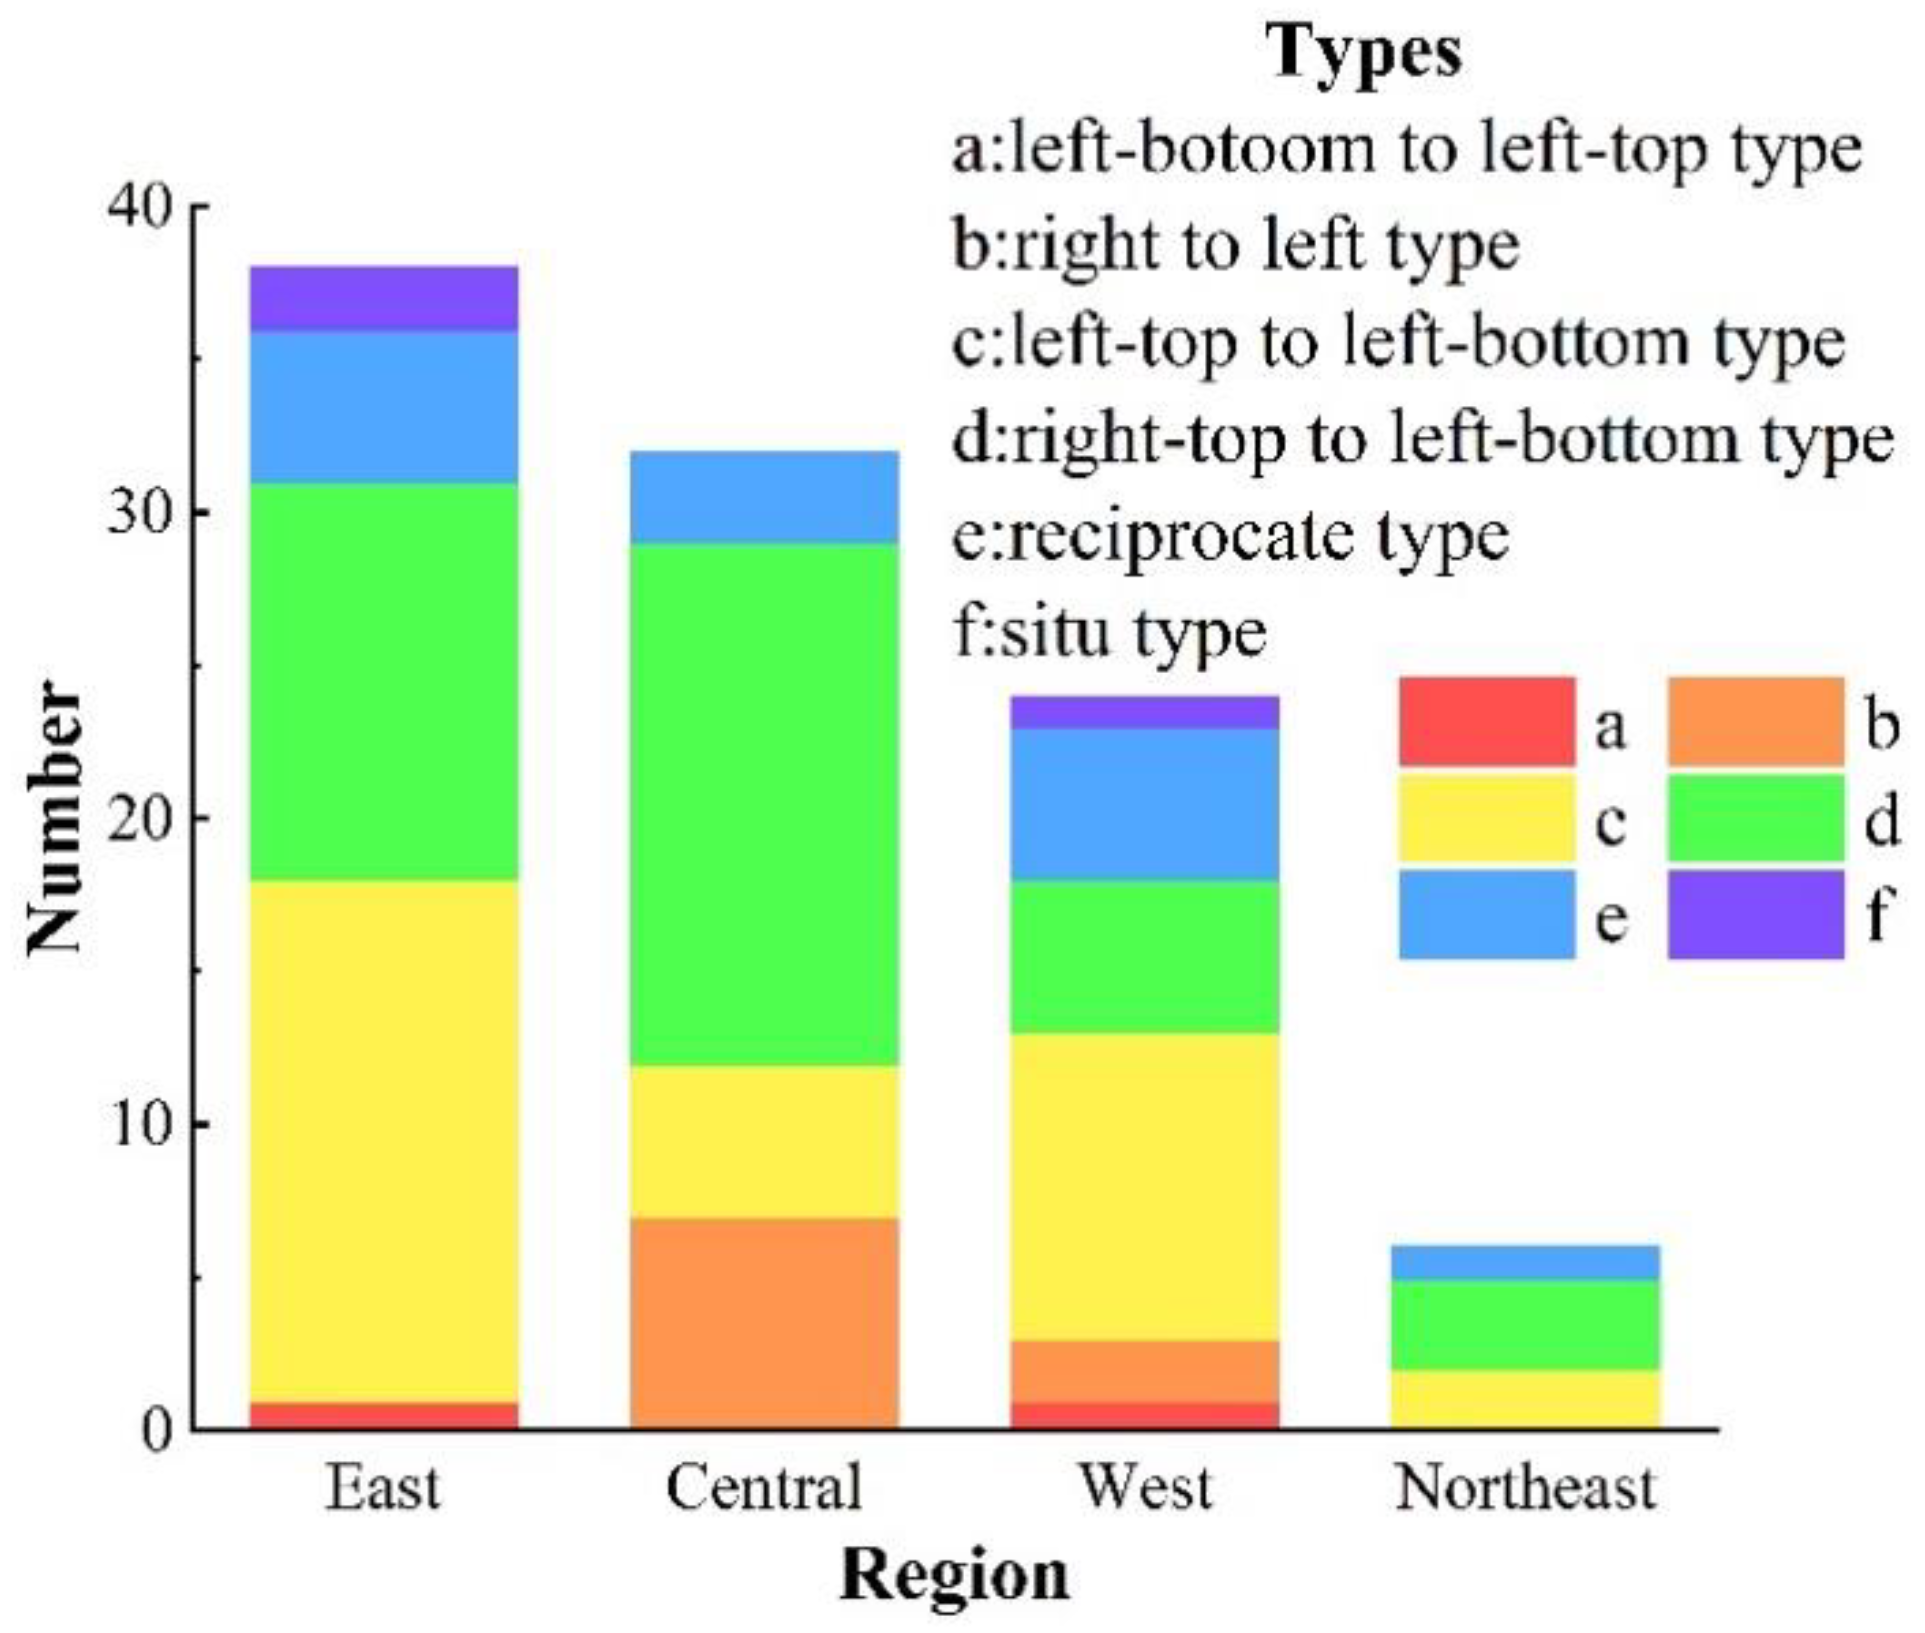
There are spatial differences among the four regions in the industry structure layout changing types (Figure 10). The eastern region concentrates on the development of the high-tech industry in recent years [18], with a significant increase in the proportion of the tertiary industry and the industry structure layout changing types mainly in the type of c and d. Besides, under the radiation of the eastern region, the tertiary industry in the central region obtains relatively speedy development and the main type of industry structure layout change is d. All the six types exist in the western region, of which c is the main type of industry structure layout changing types. Additionally, the industry structure layout changing types in the northeastern region are c, d, and e. Generally, in recent years, China focuses on developing high-tech industries to optimize industry structure [18], resulting in b, c, and d are the main types in 100 cities, accounting for 81%.
4.3.3. Factor Analysis
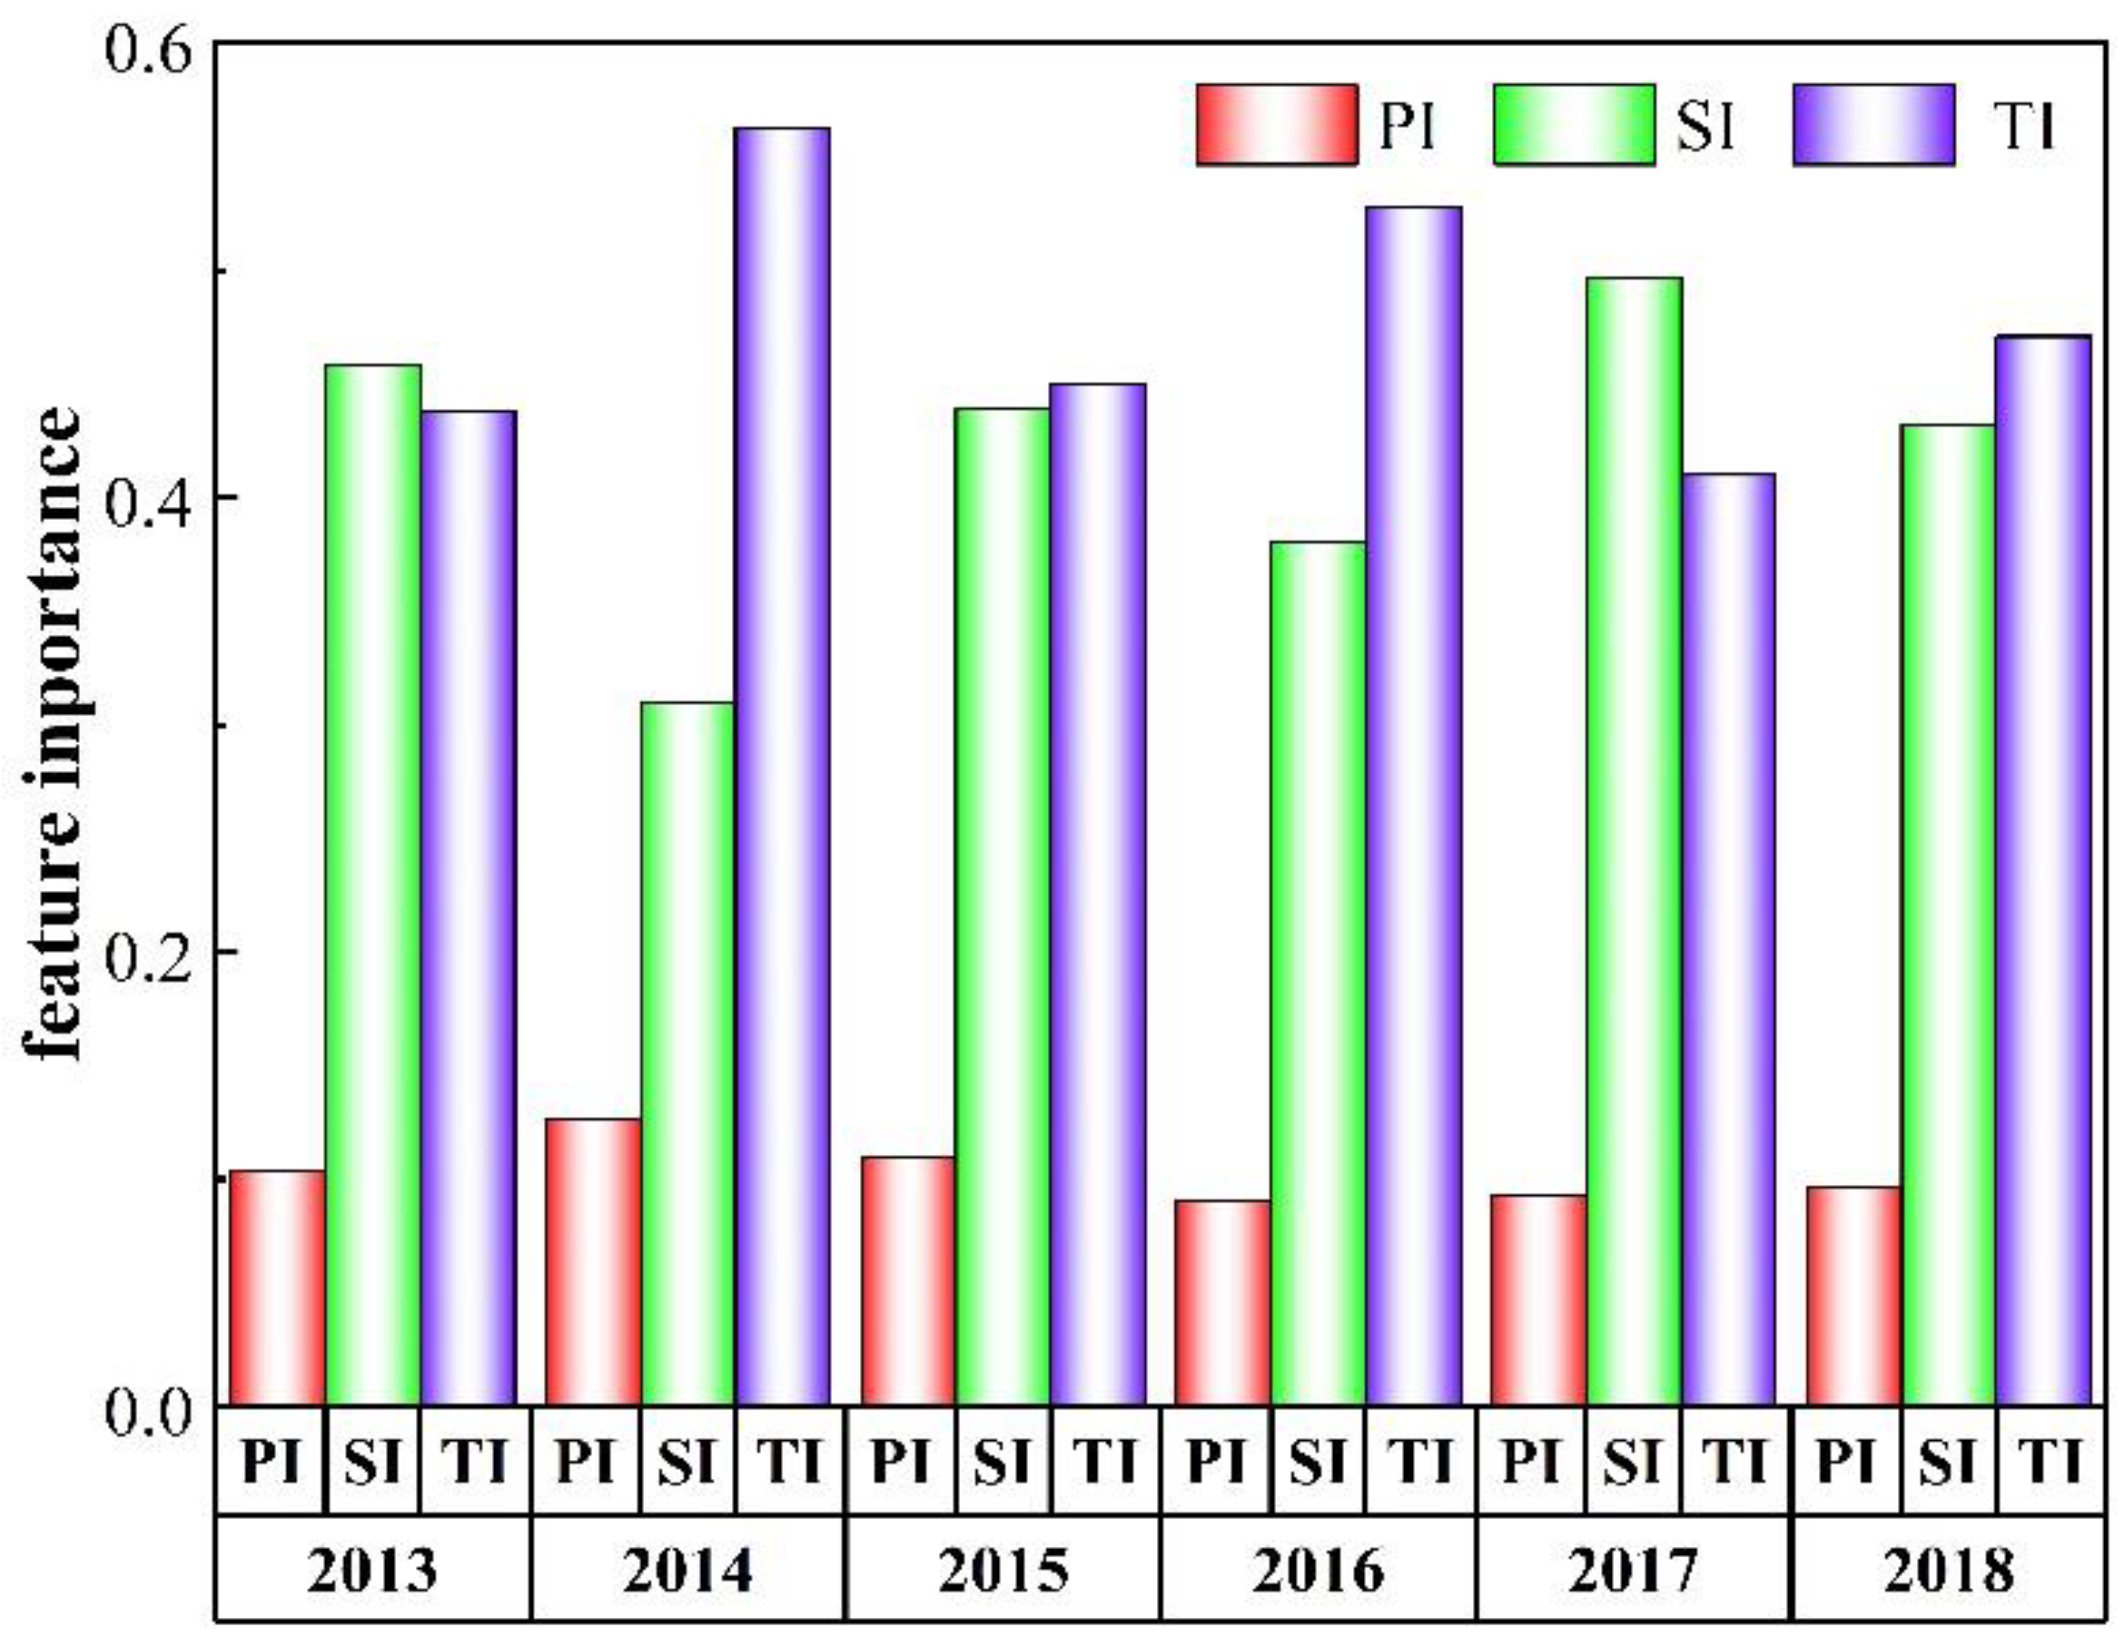
The importance of the primary industry to ALI is significantly lower than that of the secondary and tertiary industry (Figure 11). The factor analysis result suggests that about 10% of nighttime light comes from the primary industry, and the other 90% nighttime light comes from the secondary and tertiary industry. Thus, the ALI variation is more controlled by the second and tertiary industry. Transportation, infrastructure, business, industry, and manufacturing that produce light at night all belong to the secondary and tertiary industry. Thus, the importance of the secondary and tertiary industry to ALI is much higher than that of the primary industry, which illustrates that the secondary and tertiary industry are the driving industries of ALI. In Figure 7, the regression results illustrate that the higher the IS is, the higher the ALI is, and the cities with relatively high ALI are super-cities and megacities. According to Figure 8, the cities where the proportion of the secondary and tertiary industry is high, ALI is relatively high. Combined with Figure 7, Figure 8, and Figure 11, we can infer that the higher the IS and the proportion of the secondary and tertiary industry are, the higher ALI is. But this relationship between industry structure and ALI will show deviation in several western cities like Lhasa and Ordos because of poor initial endowment of production factors.
Under the fast economic development and the policy of transformation and upgrading of the industry structure in China [49], the primary industry will be transferred into the secondary and tertiary industry, which will consistently strengthen the nighttime light radiation intensity. While when nighttime light reaches saturation referring nighttime light intensity will not be enhanced with the economic development in the urban and rural areas, the ALI will keep stable. Therefore, the “Exponent” ALI variation mode is expected in a short period, and the “Logarithm” ALI variation mode is expected in a long period under ideal circumstances. On the whole, the contribution of the secondary and tertiary industry to ALI is significantly greater than the primary industry.
4.4. City Classification Based on Urban Industry-Driving Force
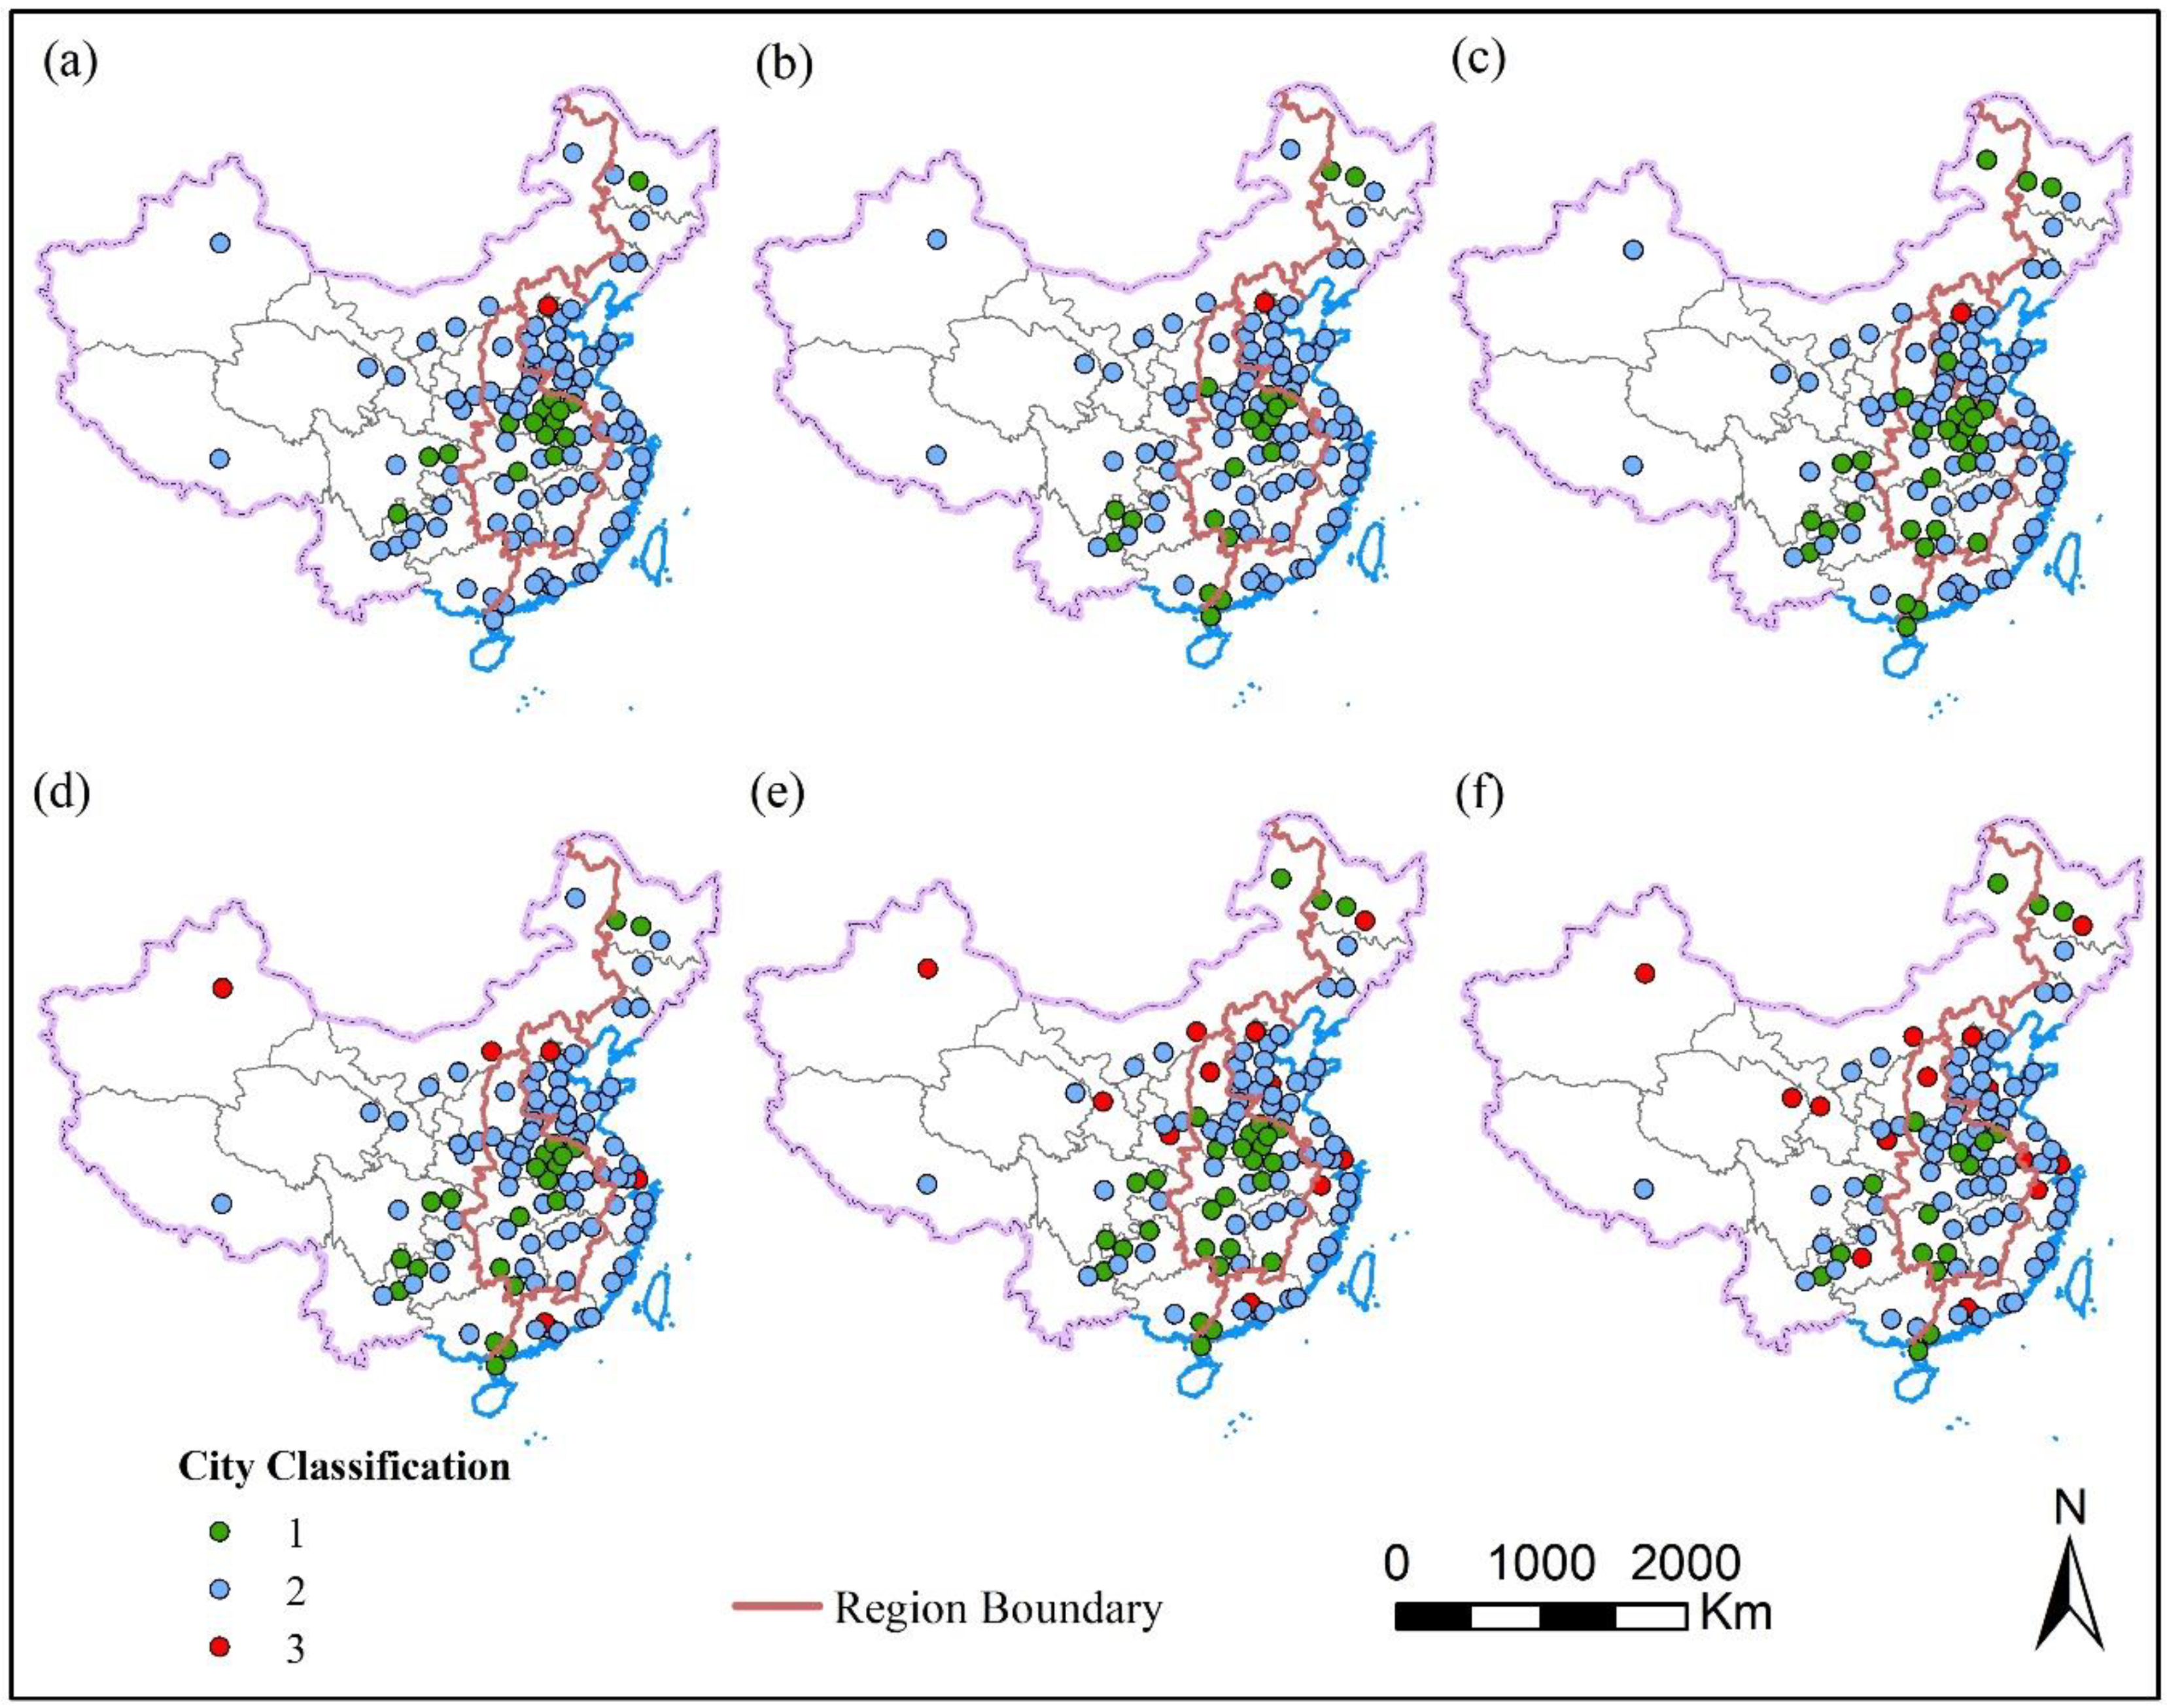
Based on the proportion of the three major industries from 2013 to 2018, the clustering analysis of 100 cities is performed (Figure 12). The three major industry-driving cities are mainly distributed in the central and western regions with relatively developed agriculture. Studies indicated that the central region possesses the highest percentage of the agricultural area to the total area, while compared with other three regions, the western region has the smallest agricultural area loss [7]. Besides, the secondary and tertiary industry-driving cities are evenly distributed in China as the secondary and tertiary industry are the leading industries in Chinese economic development [10]. Additionally, as the economic center of the province, some provincial capitals are the tertiary industry-driving cities that focus on education, scientific research, service industry, and high-tech industry.
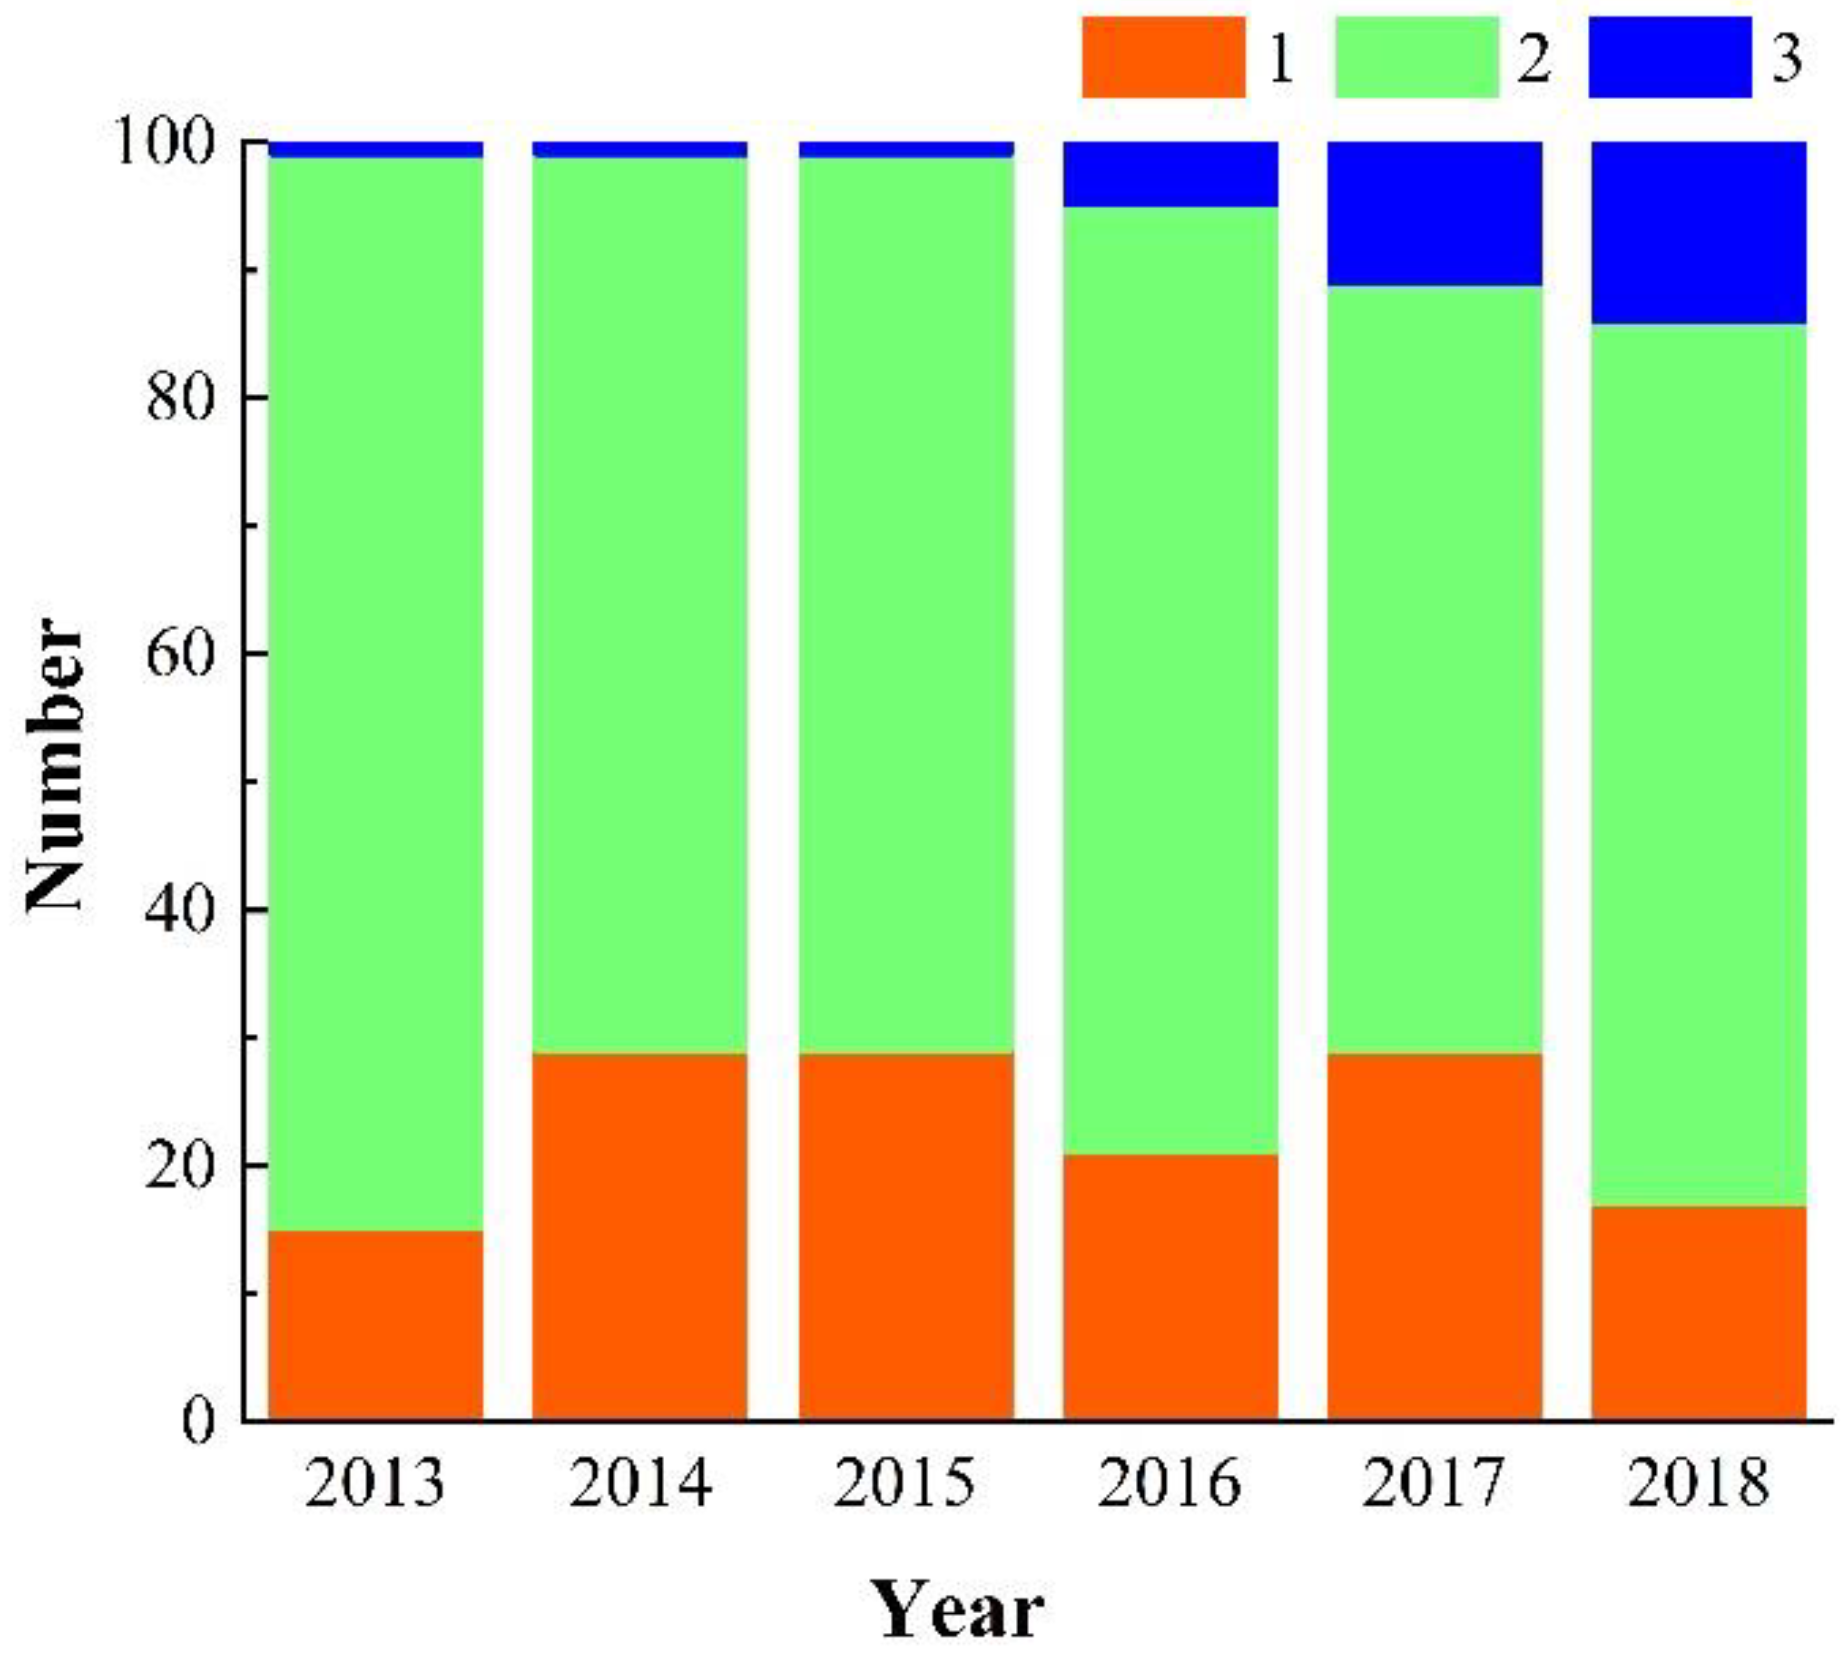
Counting the number of cities driven by different industries from 2013 to 2018, the result is shown in Figure 13. In 2013, only Beijing is the tertiary industry-driving city and the three major industry-driving cities are mainly distributed in the central region as shown in Figure 12. According to Figure 12 and Figure 13, with the implementation of industry transformation and industry optimization policies in recent years, the number of tertiary industry-driving cities is increasing, all of which are provincial capital cities. Besides, agriculture is the foundation of a country, and the Chinese government has formulated agricultural development policies and the red line for arable land to promote modern agricultural development [65]. Therefore, the proportion of the primary industry in some cities is significantly increasing, resulting in that the number of cities driven by the three major industries increases and become more widely distributed.
5. Discussion
5.1. Characterization of TNL to ED
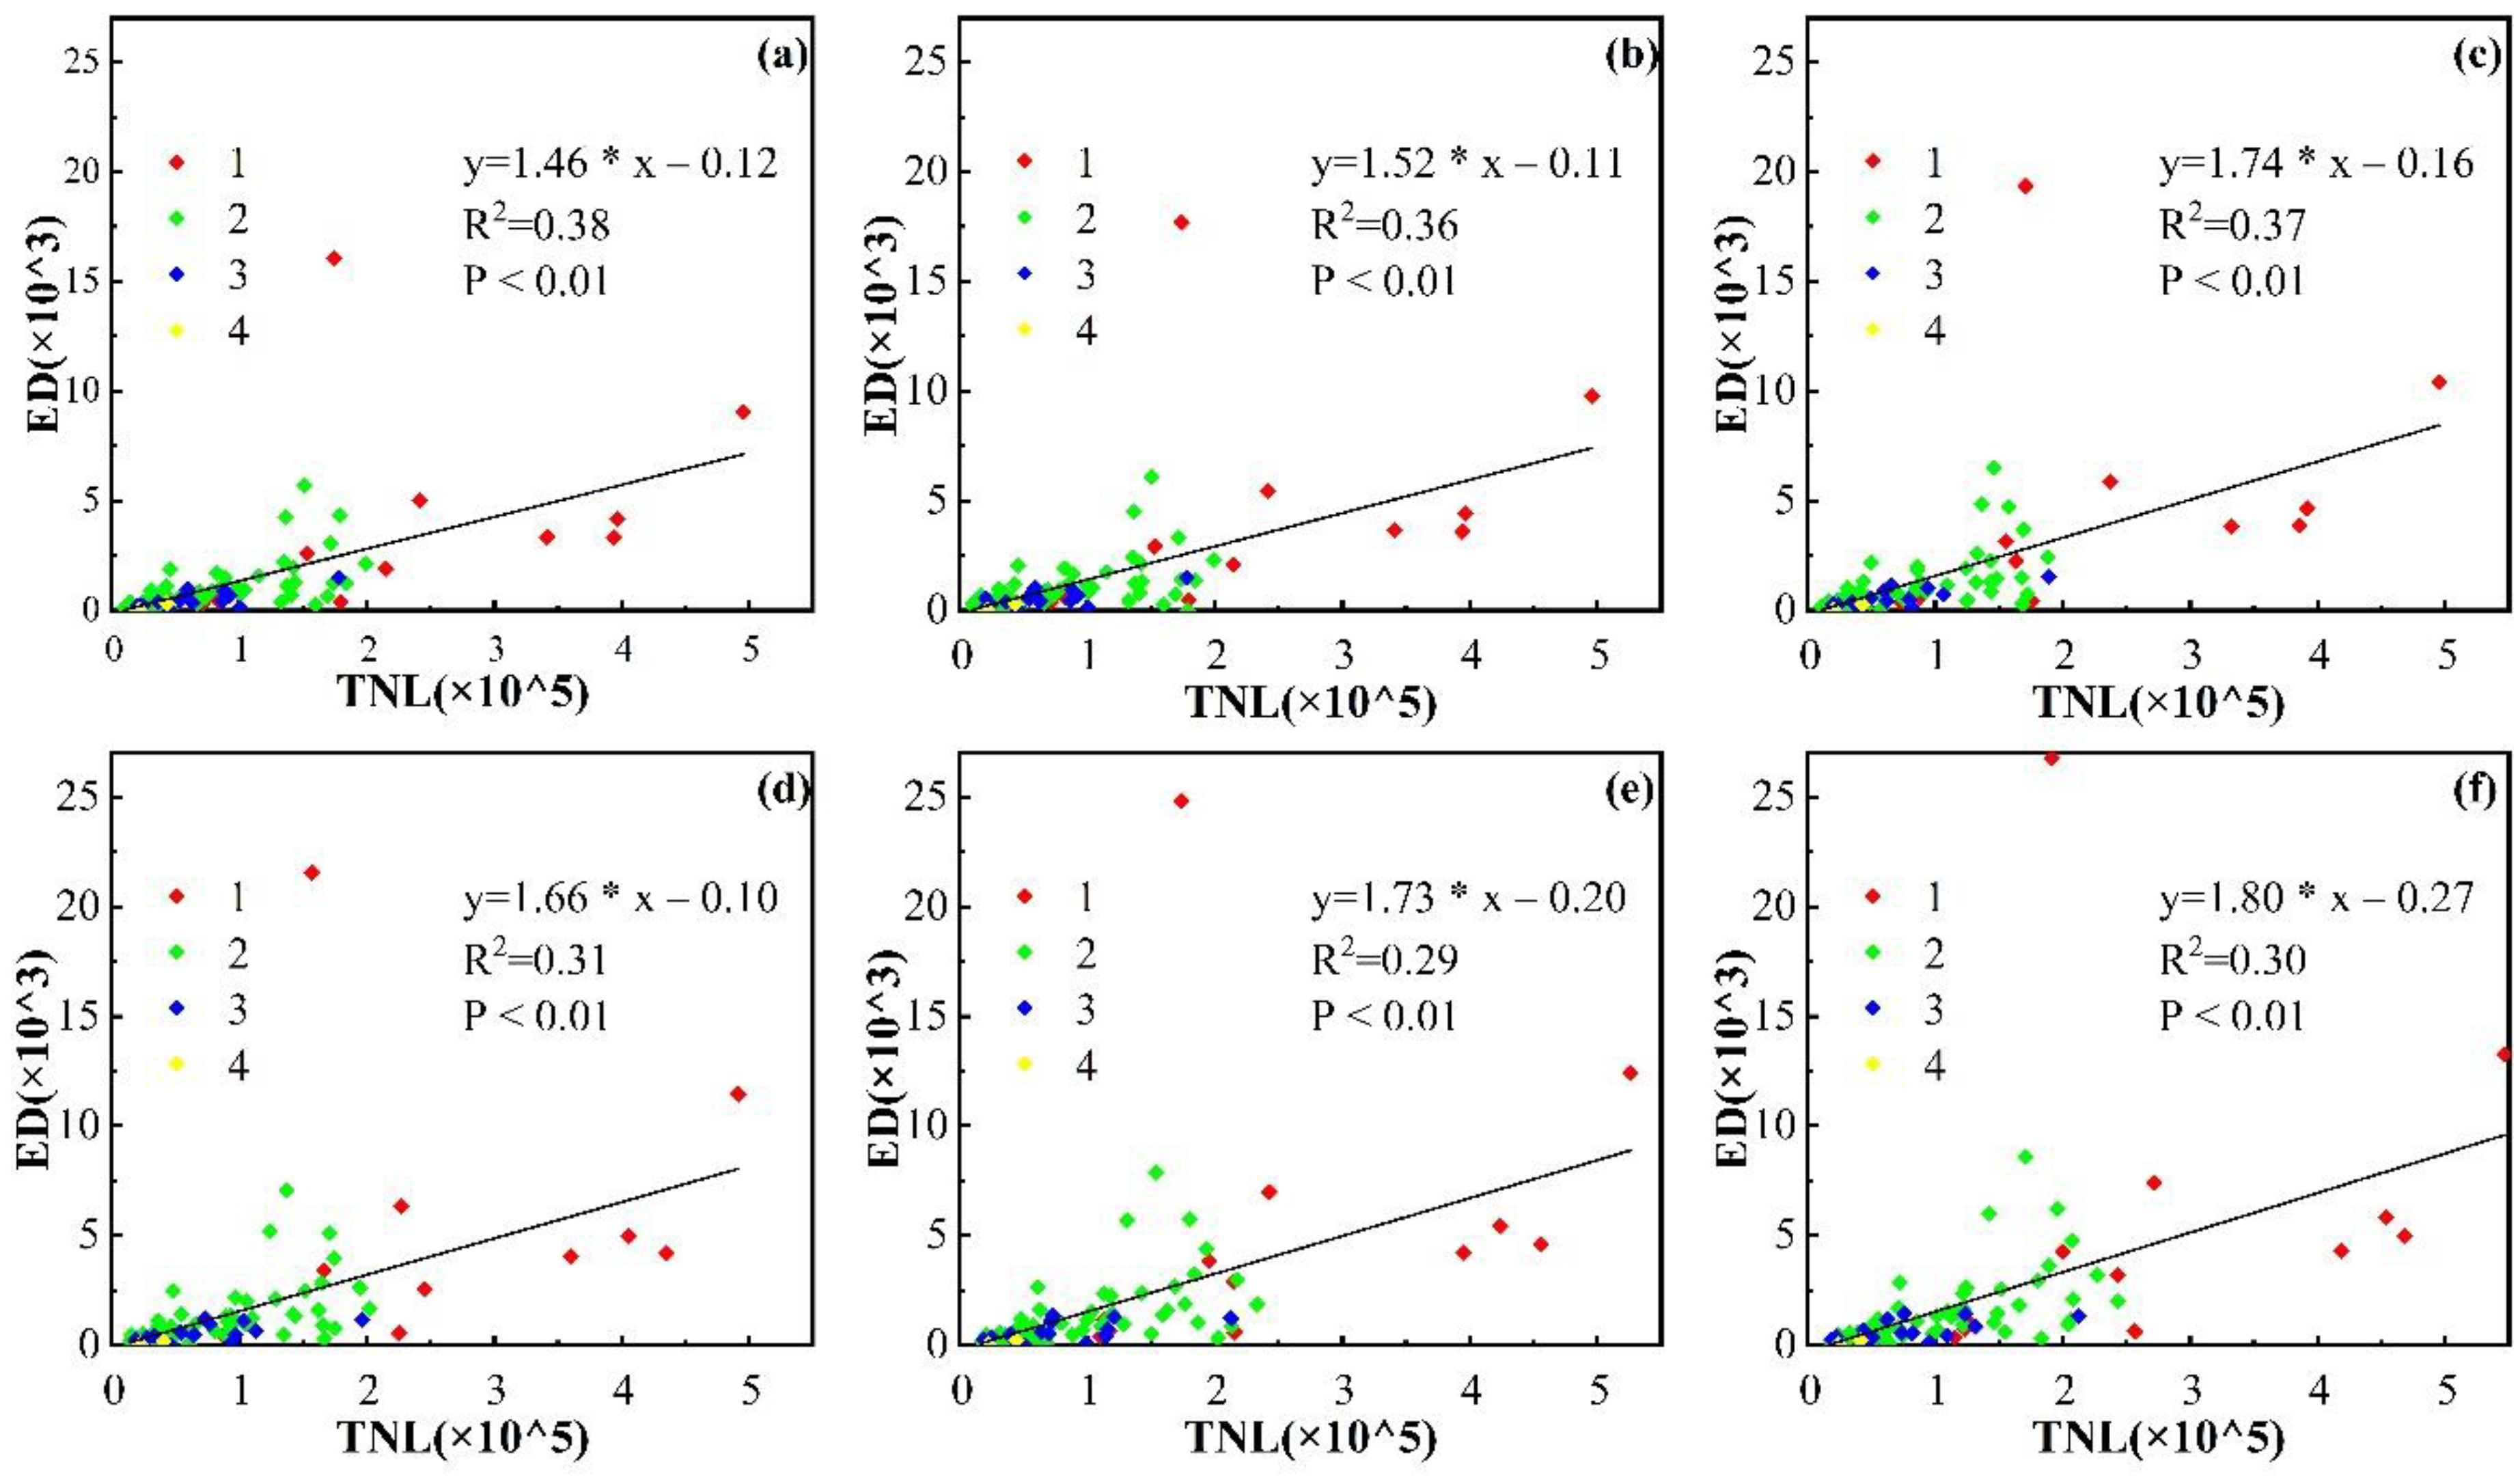
A large number of previous studies predict GDP, electricity consumption, and carbon emissions based on Total Nighttime Light (TNL). For example, Shi et al. (2014) [40] evaluated GDP and electric power consumption of the provincial- and prefectural-level divisions using TNL. Besides, Yang et al. (2020) [34] measured carbon emissions based on TNL. While there were also studies assessing socioeconomic level based on ALI. For example, Yu et al. (2015) [48] and Wang et al. (2012) [17] estimated poverty based on ALI. Pan et al. (2020) [21] measured poverty and inequality in the Xiamen-Zhangzhou-Quanzhou city cluster in China based on ALI. Besides, Yang et al. (2019) [19] proposed that ALI represents the average level of economic development in a city, and cities with the same industry structure layout and development stage have little difference in ALI. From these studies, we can know that the indicators related to the specific socioeconomic indicators were predicated by TNL, while the indicators related to the whole socioeconomic development like poverty and inequality were predicated by ALI. In this paper, ED represents the average development level that is correlated with every inch of land in cities. Thus, ALI is selected to study the economic spatiotemporal distribution and analyze the relationship between ALI and the three major industries. In order to further demonstrate the reliability of ALI to characterize ED, we conducted the regression analysis between TNL and ED (Figure 14). According to Figure 2 and Figure 14, we can know that ALI is indeed superior to TNL in characterizing ED.
5.2. Potential Influencing Factors of ALI Changes
NPP VIIRS is not only affected by festivals, seasons, infrastructure, GDP [43,44,45,66] but also affected by location and electricity power consumption [21,23]. We will discuss the effect of location, and raw coal which is the main resource of electricity power consumption on ALI in this paper. In Figure 5 and Figure 6, the result shows that raw coal production indirectly affects NPP VIIRS. In Figure 3, the cities in the Yangtze River Delta, the Pearl River Delta, and the Bohai Rim Economic Circle that to some extent represent the highest level of Chinese economic development have the highest ALI values. The selected cities include 24 cities in the economic circle and 17 coal mining cities. To better understand the influence of raw coal and location on ALI, we analyze the ALI in different cities under the two influencing factors.
The impacts of location and raw coal on ALI are shown in Table 3 and Table 4. In Table 3, the p-value (<0.05) illustrates that ALI shows the great difference between cities within and outside the economic circle, which demonstrates that the economic circles produce a significant influence on economic development in China. In Table 4, the p-value (>0.05) suggests that there is no significant difference between coal mining cities and other cities, which demonstrate that raw coal production affects the ALI of coal mining cities and other cities. These discussion further demonstrate the aforementioned result (Figure 3 and Figure 6).
We have demonstrated that the secondary and tertiary industry are the driving industries of ALI. Besides, we mastered the contribution of the three major industries to ALI. However, there is still a lot of work to be done. In this paper, because of the different data statistic standards of the 100 cities, it is difficult to find consistent research indicators. Thus, we only discuss the impact of different industry structures on ALI from the perspective of the three major industries. In fact, the three major industries have many different structural components. For example, the tertiary industry includes service, education and scientific research, tourism, and others. Therefore, we need to further study the specific driving forces of ALI in our future work from a more micro perspective.
6. Conclusions
This paper analyzes ALI variation mode and industry-driving force of ALI in China. It is the first attempt to synthetically analyze the influence of the three major industries to nighttime light. This study proves that nighttime light is closely related to industry structure, and helps us further understand the source of nighttime light from the industry structure perspective. The results indicate that there are obvious differences in ALI among the 100 cities, and the importance of the primary, secondary, and tertiary to ALI presents great disparities.
The detailed conclusions are summarized as three following aspects. First, ALI is observed a concave funnel pattern in four regions, with low in center and high in the surrounding. Meanwhile, ALI shows five temporal variation modes (“W,” “√,” “Exponent,” “Logarithm,” and “N”), of which the “√” mode accounts for the highest proportion (60%). Second, the regression results of IS and ALI (R2 > 0.8) suggest that the industry structure is significantly correlated with ALI. The factor analysis result illustrates that the secondary and tertiary industry are the driving industries of ALI. Third, the classification result cities based on the industry contribution rate indicates that cities driven by different industries show significant spatial distribution differences. The three major industry-driving cities are mainly distributed in the central and western regions, the secondary and tertiary industry-driving cities are evenly distributed in four regions, and the tertiary industry-driving cities are mainly distributed in provincial capitals. From 2013 to 2018, the fluctuation of cities driven by different industries changes obviously. The number of the tertiary industry-driving cities increases steadily and the three major industry-driving cities are distributed widely spatially.
In the section of the discussion, the results of the regression analysis further demonstrate that ALI is the better indicator to characterize economic development. Additionally, the influence of raw coal and the location on ALI are conducted. The discussion illustrates that the location of cities has a significant effect on ALI spatial distribution, while the raw coal does not.
Author Contributions
Conceptualization, X.S., Y.C., and K.L.; methodology, X.S.; software, X.S.; validation, X.S., Y.C. and K.L.; formal analysis, X.S.; investigation, X.S.; resources, X.S.; data curation, X.S.; writing—original draft preparation, X.S.; writing—review and editing, Y.C., K.L., and X.S.; visualization, X.S.; supervision, X.S.; funding acquisition, Y.C. All authors have read and agreed to the published version of the manuscript.
Funding
This work was supported by National Key R&D Program on monitoring, early warning and prevention of major natural disasters (2017YFC1502406), and in part by Beijing Laboratory of Water Resources Security.
Acknowledgments
The authors would like to thank the editor and the anonymous reviews for their constructive and significant comments on the earlier version of this paper.
Conflicts of Interest
The authors declare no conflict of interest.
Appendix A

Table A1.
The selected cities across China mainland.
| CI | CN | R | CT | CC | CI | CN | R | CT | CC |
|---|---|---|---|---|---|---|---|---|---|
| 1 | Chongqing |  | Ⅰ | N | 51 | Bijie | | Ⅱ | Y |
| 2 | Shanghai |  | Ⅰ | N | 52 | Wuxi | | Ⅱ | N |
| 3 | Beijing | | Ⅰ | N | 53 | Xinyang |  | Ⅱ | N |
| 4 | Tianjin | | Ⅰ | N | 54 | Nanchong | | Ⅱ | N |
| 5 | Chengdu | | Ⅰ | N | 55 | Huanggang | | Ⅱ | N |
| 6 | Guangzhou | | Ⅰ | N | 56 | Zunyi | | Ⅱ | N |
| 7 | Baoding | | Ⅰ | N | 57 | Maoming | | Ⅱ | N |
| 8 | Shenzhen | | Ⅰ | N | 58 | Jieyang | | Ⅱ | N |
| 9 | Suzhou | | Ⅰ | N | 59 | Qujing | | Ⅱ | N |
| 10 | Shijiazhuang | | Ⅰ | N | 60 | Taizhou | | Ⅱ | N |
| 11 | Wuhan | | Ⅰ | N | 61 | Liaocheng | | Ⅱ | N |
| 12 | Linyi | | Ⅰ | N | 62 | Ningbo | | Ⅱ | N |
| 13 | Nanyang | | Ⅰ | N | 63 | Changde | | Ⅱ | N |
| 14 | Changchun |  | Ⅱ | N | 64 | Jingzhou | | Ⅱ | N |
| 15 | Harbin | | Ⅱ | N | 65 | Sining | | Ⅱ | N |
| 16 | Handan | | Ⅱ | Y | 66 | Xinxiang | | Ⅱ | N |
| 17 | Weifang | | Ⅱ | N | 67 | Liu’an | | Ⅱ | N |
| 18 | Zhengzhou | | Ⅱ | N | 68 | Dezhou | | Ⅱ | N |
| 19 | Qingdao | | Ⅱ | N | 69 | Yulin | | Ⅱ | N |
| 20 | Zhoukou | | Ⅱ | N | 70 | Xiangyang | | Ⅱ | N |
| 21 | Xuzhou | | Ⅱ | N | 71 | Tai’an | | Ⅱ | N |
| 22 | Xi’an | | Ⅱ | N | 72 | Qiqihar | | Ⅱ | N |
| 23 | Ganzhou | | Ⅱ | N | 73 | Suihua | | Ⅱ | N |
| 24 | Quanzhou | | Ⅱ | N | 74 | Dazhou | | Ⅱ | N |
| 25 | Dongguan | | Ⅱ | N | 75 | Shantou | | Ⅱ | N |
| 26 | Jining | | Ⅱ | Y | 76 | Yichun | | Ⅱ | N |
| 27 | Nanjing | | Ⅱ | N | 77 | Suzhou | | Ⅱ | Y |
| 28 | Wenzhou | | Ⅱ | N | 78 | Anqing | | Ⅱ | N |
| 29 | Fuyang | | Ⅱ | N | 79 | Zhaotong | | Ⅱ | Y |
| 30 | Tangshan | | Ⅱ | Y | 80 | Weinan | | Ⅱ | Y |
| 31 | Hefei | | Ⅱ | N | 81 | Yongzhou | | Ⅱ | N |
| 32 | Fuzhou | | Ⅱ | N | 82 | Yuncheng | | Ⅱ | Y |
| 33 | Cangzhou | | Ⅱ | N | 83 | Nanchang | | Ⅱ | N |
| 34 | Foshan | | Ⅱ | N | 84 | Anyang | | Ⅱ | N |
| 35 | Nantong | | Ⅱ | N | 85 | Pingdingshan | | Ⅲ | Y |
| 36 | Shangqiu | | Ⅱ | N | 86 | Xianyang | | Ⅲ | Y |
| 37 | Hengyang | | Ⅱ | N | 87 | Bozhou | | Ⅲ | N |
| 38 | Yancheng | | Ⅱ | N | 88 | Chenzhou | | Ⅲ | Y |
| 39 | Xingtai | | Ⅱ | Y | 89 | Guiyang | | Ⅲ | N |
| 40 | Changsha | | Ⅱ | N | 90 | Taiyuan | | Ⅲ | N |
| 41 | Shaoyang | | Ⅱ | Y | 91 | Lanzhou | | Ⅲ | N |
| 42 | Zhanjiang | | Ⅱ | N | 92 | Urumchi | | Ⅲ | N |
| 43 | Hangzhou | | Ⅱ | N | 93 | Hohhot | | Ⅲ | N |
| 44 | Jinan | | Ⅱ | N | 94 | Liupanshui | | Ⅲ | Y |
| 45 | Yantai | | Ⅱ | N | 95 | Shenyang | | Ⅲ | N |
| 46 | Zhumadian | | Ⅱ | N | 96 | Hulunbuir | | Ⅲ | Y |
| 47 | Nanning | | Ⅱ | N | 97 | Yinchuan | | Ⅲ | N |
| 48 | Shangrao | | Ⅱ | N | 98 | Erdos | | Ⅲ | Y |
| 49 | Luoyang | | Ⅱ | N | 99 | Fushun | | Ⅳ | Y |
| 50 | Kunming | | Ⅱ | N | 100 | Lhasa | | Ⅳ | N |
Note: CI represent city ID, CN represent the name of the city, R represent the region (green, orange, red, and blue represent cities in the Central, Northeast, East, and West regions, respectively.), CT represents the city size (Ⅰ, Ⅱ, Ⅲ, and Ⅳ represent the super-cities, megacities, large cities, and medium cities, respectively), CI represent coal mining cities (Y represent Yes, N represent No).
References
- Gao, B.; Huang, Q.; He, C.; Sun, Z.; Zhang, D. How does sprawl differ across cities in China? A multi-scale investigation using nighttime light and census data. Landsc. Urban Plan. 2016, 148, 89–98. [Google Scholar] [CrossRef]
- Duque, J.C.; Lozano-Gracia, N.; Patino, J.E.; Restrepo, P.; Velasquez, W.A. Spatiotemporal dynamics of urban growth in Latin American cities: An analysis using nighttime light imagery. Landsc. Urban Plan. 2019, 191, 103640. [Google Scholar] [CrossRef]
- Deng, X.; Huang, J.; Rozelle, S.; Uchida, E. Economic Growth and the Expansion of Urban Land in China. Urban Stud. 2010, 47, 813–843. [Google Scholar] [CrossRef]
- Zhang, C.; Miao, C.; Zhang, W.; Chen, X. Spatiotemporal patterns of urban sprawl and its relationship with economic development in China during 1990–2010. Habitat Int. 2018, 79, 51–60. [Google Scholar] [CrossRef]
- Fan, J.; Ma, T.; Zhou, C.; Zhou, Y.; Xu, T. Comparative Estimation of Urban Development in China’s Cities Using Socioeconomic and DMSP/OLS Night Light Data. Remote Sens. 2014, 6, 7840–7856. [Google Scholar] [CrossRef] [Green Version]
- Shi, K.; Huang, C.; Yu, B.; Yin, B.; Huang, Y.; Wu, J. Evaluation of NPP-VIIRS night-time light composite data for extracting built-up urban areas. Remote Sens. Lett. 2014, 5, 358–366. [Google Scholar] [CrossRef]
- Shi, K.; Chen, Y.; Yu, B.; Xu, T.; Li, L.; Huang, C.; Liu, R.; Chen, Z.; Wu, J. Urban Expansion and Agricultural Land Loss in China: A Multiscale Perspective. Sustainability 2016, 8, 790. [Google Scholar] [CrossRef] [Green Version]
- Fang, C. Important progress and future direction of studies on China’s urban agglomerations. J. Geogr. Sci. 2015, 25, 1003–1024. [Google Scholar] [CrossRef] [Green Version]
- del Mar López, T.; Aide, T.M.; Thomlinson, J.R. Urban Expansion and the Loss of Prime Agricultural Lands in Puerto Rico. Ambio J. Hum. Environ. 2001, 30, 49–54. [Google Scholar] [CrossRef]
- Gryshova, I.; Kyzym, M.; Khaustova, V.; Korneev, V.; Kramarev, H. Assessment of the Industrial Structure and its Influence on Sustainable Economic Development and Quality of Life of the Population of Different World Countries. Sustainability 2020, 12, 2072. [Google Scholar] [CrossRef] [Green Version]
- Frick, S.A.; Rodríguez-Pose, A. Change in urban concentration and economic growth. World Dev. 2018, 105, 156–170. [Google Scholar] [CrossRef]
- Wen, B.; Pan, Y.; Zhang, Y.; Liu, J.; Xia, M. Does the Exhaustion of Resources Drive Land Use Changes? Evidence from the Influence of Coal Resources-Exhaustion on Coal Resources–Based Industry Land Use Changes. Sustainability 2018, 10, 2698. [Google Scholar] [CrossRef] [Green Version]
- Kurita, K.; Kurosaki, T. Dynamics of Growth, Poverty and Inequality: A Panel Analysis of Regional Data from Thailand and the Philippines*. Asian Econ. J. 2011, 25, 3–33. [Google Scholar] [CrossRef]
- Fan, C.C.; Casetti, E. The spatial and temporal dynamics of US regional income inequality, 1950–1989. Ann. Reg. Sci. 1994, 28, 177–196. [Google Scholar] [CrossRef]
- Bouvet, F. EMU and the dynamics of regional per capita income inequality in Europe. J. Econ. Inequal. 2010, 8, 323–344. [Google Scholar] [CrossRef]
- Lan, H.; Zhuang, T.; Meng, Z.; Zu, X. Chinese regional economic cooperative development model based on network analysis and multimedia data visualization. Multimed. Tools Appl. 2019, 78, 4743–4765. [Google Scholar] [CrossRef]
- Wang, W.; Cheng, H.; Zhang, L. Poverty assessment using DMSP/OLS night-time light satellite imagery at a provincial scale in China. Adv. Space Res. 2012, 49, 1253–1264. [Google Scholar] [CrossRef]
- He, W.; Lin, Z.; Hao, R. Analysis of regional competitiveness in the high-tech industry. Curr. Sci. 2018, 114, 854–860. [Google Scholar] [CrossRef]
- Yang, C.; Yu, B.; Chen, Z.; Song, W.; Zhou, Y.; Li, X.; Wu, J. A Spatial-Socioeconomic Urban Development Status Curve from NPP-VIIRS Nighttime Light Data. Remote Sens. 2019, 11, 2398. [Google Scholar] [CrossRef] [Green Version]
- Wu, R.; Yang, D.; Dong, J.; Zhang, L.; Xia, F. Regional Inequality in China Based on NPP-VIIRS Night-Time Light Imagery. Remote Sens. 2018, 10, 240. [Google Scholar] [CrossRef] [Green Version]
- Pan, W.; Fu, H.; Zheng, P. Regional Poverty and Inequality in the Xiamen-Zhangzhou-Quanzhou City Cluster in China Based on NPP/VIIRS Night-Time Light Imagery. Sustainability 2020, 12, 2547. [Google Scholar] [CrossRef] [Green Version]
- Shi, K.; Chen, Y.; Yu, B.; Xu, T.; Yang, C.; Li, L.; Huang, C.; Chen, Z.; Liu, R.; Wu, J. Detecting spatiotemporal dynamics of global electric power consumption using DMSP-OLS nighttime stable light data. Appl. Energy 2016, 184, 450–463. [Google Scholar] [CrossRef]
- Shi, K.; Yang, Q.; Fang, G.; Yu, B.; Chen, Z.; Yang, C.; Wu, J. Evaluating spatiotemporal patterns of urban electricity consumption within different spatial boundaries: A case study of Chongqing, China. Energy 2019, 167, 641–653. [Google Scholar] [CrossRef]
- Elvidge, C.D.; Baugh, K.E.; Kihn, E.A.; Kroehl, H.W.; Davis, E.R.; Davis, C.W. Relation between satellite observed visible-near infrared emissions, population, economic activity and electric power consumption. Int. J. Remote Sens. 1997, 18, 1373–1379. [Google Scholar] [CrossRef]
- Hu, T.; Huang, X. A novel locally adaptive method for modeling the spatiotemporal dynamics of global electric power consumption based on DMSP-OLS nighttime stable light data. Appl. Energy 2019, 240, 778–792. [Google Scholar] [CrossRef]
- Yue, W.; Gao, J.; Yang, X. Estimation of Gross Domestic Product Using Multi-Sensor Remote Sensing Data: A Case Study in Zhejiang Province, East China. Remote Sens. 2014, 6, 7260–7275. [Google Scholar] [CrossRef] [Green Version]
- Forbes, D.J. Multi-scale analysis of the relationship between economic statistics and DMSP-OLS night light images. GISci. Remote Sens. 2013, 50, 483–499. [Google Scholar] [CrossRef]
- Li, G.; Cai, Z.; Liu, X.; Liu, J.; Su, S. A comparison of machine learning approaches for identifying high-poverty counties: Robust features of DMSP/OLS night-time light imagery. Int. J. Remote Sens. 2019, 40, 5716–5736. [Google Scholar] [CrossRef]
- Li, G.; Chang, L.; Liu, X.; Su, S.; Cai, Z.; Huang, X.; Li, B. Monitoring the spatiotemporal dynamics of poor counties in China: Implications for global sustainable development goals. J. Clean. Prod. 2019, 227, 392–404. [Google Scholar] [CrossRef]
- Kumar, P.; Sajjad, H.; Joshi, P.K.; Elvidge, C.D.; Rehman, S.; Chaudhary, B.S.; Tripathy, B.R.; Singh, J.; Pipal, G. Modeling the luminous intensity of Beijing, China using DMSP-OLS night-time lights series data for estimating population density. Phys. Chem. Earth 2019, 109, 31–39. [Google Scholar] [CrossRef]
- Li, X.; Zhou, W. Dasymetric mapping of urban population in China based on radiance corrected DMSP-OLS nighttime light and land cover data. Sci. Total Environ. 2018, 643, 1248–1256. [Google Scholar] [CrossRef] [PubMed]
- Yu, S.; Zhang, Z.; Liu, F. Monitoring Population Evolution in China Using Time-Series DMSP/OLS Nightlight Imagery. Remote Sens. 2018, 10, 194. [Google Scholar] [CrossRef] [Green Version]
- Sun, W.; Zhang, X.; Wang, N.; Cen, Y. Estimating Population Density Using DMSP-OLS Night-Time Imagery and Land Cover Data. IEEE J. Sel. Top. Appl. Earth Observ. Remote Sens. 2017, 10, 2674–2684. [Google Scholar] [CrossRef]
- Yang, D.; Luan, W.; Qiao, L.; Pratama, M. Modeling and spatio-temporal analysis of city-level carbon emissions based on nighttime light satellite imagery. Appl. Energy 2020, 268, 114696. [Google Scholar] [CrossRef]
- Shi, K.; Chen, Y.; Li, L.; Huang, C. Spatiotemporal variations of urban CO2 emissions in China: A multiscale perspective. Appl. Energy 2018, 211, 218–229. [Google Scholar] [CrossRef]
- Yu, B.; Deng, S.; Liu, G.; Yang, C.; Chen, Z.; Hill, C.J.; Wu, J. Nighttime Light Images Reveal Spatial-Temporal Dynamics of Global Anthropogenic Resources Accumulation above Ground. Environ. Sci. Technol. 2018, 52, 11520–11527. [Google Scholar] [CrossRef] [Green Version]
- Elvidge, C.D.; Baugh, K.; Zhizhin, M.; Hsu, F.-C. Why VIIRS data are superior to DMSP for mapping nighttime lights. Proc. Asia-Pac. Adv. Network 2013, 35, 62–69. [Google Scholar] [CrossRef] [Green Version]
- Elvidge, C.D.; Zhizhin, M.; Hsu, F.-C.; Baugh, K.E. VIIRS Nightfire: Satellite Pyrometry at Night. Remote Sens. 2013, 5, 4423–4449. [Google Scholar] [CrossRef] [Green Version]
- Sahoo, S.; Gupta, P.K.; Srivastav, S.K. Comparative analysis between VIIRS-DNB and DMSP-OLS night-time light data to estimate electric power consumption in Uttar Pradesh, India. Int. J. Remote Sens. 2019, 41, 2565–2580. [Google Scholar] [CrossRef]
- Shi, K.; Yu, B.; Huang, Y.; Hu, Y.; Yin, B.; Chen, Z.; Chen, L.; Wu, J. Evaluating the Ability of NPP-VIIRS Nighttime Light Data to Estimate the Gross Domestic Product and the Electric Power Consumption of China at Multiple Scales: A Comparison with DMSP-OLS Data. Remote Sens. 2014, 6, 1705–1724. [Google Scholar] [CrossRef] [Green Version]
- Zhao, J.; Chen, Y.; Ji, G.; Wang, Z. Residential carbon dioxide emissions at the urban scale for county-level cities in China: A comparative study of nighttime light data. J. Clean. Prod. 2018, 180, 198–209. [Google Scholar] [CrossRef]
- Li, Z.; Wang, Y.; Hu, Z. Construction and evaluation about convergence of primary, secondary and tertiary industries—a case in Beijing. Chin. J. Agric. Resour. Reg. Plan. 2019, 40, 111–120. [Google Scholar] [CrossRef]
- Lan, F.; Gong, X.; Da, H.; Wen, H. How do population inflow and social infrastructure affect urban vitality? Evidence from 35 large- and medium-sized cities in China. Cities 2020, 100, 102454. [Google Scholar] [CrossRef]
- Levin, N.; Zhang, Q. A global analysis of factors controlling VIIRS nighttime light levels from densely populated areas. Remote Sens. Environ. 2017, 190, 366–382. [Google Scholar] [CrossRef] [Green Version]
- Liu, S.; Li, X.; Levin, N.; Jendryke, M. Tracing cultural festival patterns using time-series of VIIRS monthly products. Remote Sens. Lett. 2019, 10, 1172–1181. [Google Scholar] [CrossRef]
- Wu, Y.; Jiang, M.; Chang, Z.; Li, Y.; Shi, K. Does China’s Urban Development Satisfy Zipf’s Law? A Multiscale Perspective from the NPP-VIIRS Nighttime Light Data. Int. J. Environ. Res. Public Health 2020, 17, 1460. [Google Scholar] [CrossRef] [Green Version]
- Stokes, E.C.; Seto, K.C. Characterizing urban infrastructural transitions for the Sustainable Development Goals using multi-temporal land, population, and nighttime light data. Remote Sens. Environ. 2019, 234, 111430. [Google Scholar] [CrossRef]
- Yu, B.; Shi, K.; Hu, Y.; Huang, C.; Chen, Z.; Wu, J. Poverty Evaluation Using NPP-VIIRS Nighttime Light Composite Data at the County Level in China. IEEE J. Sel. Top. Appl. Earth Observ. Remote Sens. 2015, 8, 1217–1229. [Google Scholar] [CrossRef]
- Han, X.; Tana, G.; Qin, K.; Letu, H. Estimating Industrial Structure Changes in China Using Dmsp—Ols Night-Time Light Data during 1999–2012. ISPRS Int. Arch. Photogramm. Remote Sens. Spat. Inf. Sci. 2018, XLII-3/W5, 9–15. [Google Scholar] [CrossRef] [Green Version]
- Zhan, J.V.; Duan, H.; Zeng, M. Resource Dependence and Human Capital Investment in China. China Q. 2015, 221, 49–72. [Google Scholar] [CrossRef]
- Li, X.; Xu, H.; Chen, X.; Li, C. Potential of NPP-VIIRS Nighttime Light Imagery for Modeling the Regional Economy of China. Remote Sens. 2013, 5, 3057–3081. [Google Scholar] [CrossRef] [Green Version]
- Zhao, X.; Yu, B.; Liu, Y.; Chen, Z.; Li, Q.; Wang, C.; Wu, J. Estimation of Poverty Using Random Forest Regression with Multi-Source Data: A Case Study in Bangladesh. Remote Sens. 2019, 11, 375. [Google Scholar] [CrossRef] [Green Version]
- Li, S.; Cheng, L.; Liu, X.; Mao, J.; Wu, J.; Li, M. City type-oriented modeling electric power consumption in China using NPP-VIIRS nighttime stable light data. Energy 2019, 189, 116040. [Google Scholar] [CrossRef]
- Zhu, X.; Ma, M.; Yang, H.; Ge, W. Modeling the Spatiotemporal Dynamics of Gross Domestic Product in China Using Extended Temporal Coverage Nighttime Light Data. Remote Sens. 2017, 9, 626. [Google Scholar] [CrossRef] [Green Version]
- Yuan, J.; Li, X.; Xu, C.; Zhao, C.; Liu, Y. Investment risk assessment of coal-fired power plants in countries along the Belt and Road initiative based on ANP-Entropy-TODIM method. Energy 2019, 176, 623–640. [Google Scholar] [CrossRef]
- Liang, H.; Guo, Z.; Wu, J.; Chen, Z. GDP spatialization in Ningbo City based on NPP/VIIRS night-time light and auxiliary data using random forest regression. Adv. Space Res. 2020, 65, 481–493. [Google Scholar] [CrossRef]
- Li, K.; Chen, Y.; Wang, M.; Gong, A. Spatial-temporal variations of surface urban heat island intensity induced by different definitions of rural extents in China. Sci. Total Environ. 2019, 669, 229–247. [Google Scholar] [CrossRef]
- Zhuo, C.; Deng, F. How does China’s Western Development Strategy affect regional green economic efficiency? Sci. Total Environ. 2020, 707, 135939. [Google Scholar] [CrossRef]
- Lin, J.; Shi, W. Statistical Correlation between Monthly Electric Power Consumption and VIIRS Nighttime Light. ISPRS Int. Geo-Inf. 2020, 9, 32. [Google Scholar] [CrossRef] [Green Version]
- Yan, Q.; Wang, Y.; Li, Z.; Baležentis, T.; Streimikiene, D. Coordinated development of thermal power generation in Beijing-Tianjin-Hebei region: Evidence from decomposition and scenario analysis for carbon dioxide emission. J. Clean. Prod. 2019, 232, 1402–1417. [Google Scholar] [CrossRef]
- Wu, M.; Zhao, M.; Wu, Z. Evaluation of development level and economic contribution ratio of science and technology innovation in eastern China. Technol. Soc. 2019, 59, 101194. [Google Scholar] [CrossRef]
- Yang, Y.; Guo, H.; Chen, L.; Liu, X.; Gu, M.; Ke, X. Regional analysis of the green development level differences in Chinese mineral resource-based cities. Resour. Policy 2019, 61, 261–272. [Google Scholar] [CrossRef]
- Yao, S.; Zhang, F.; Wang, F.; Ou, J. Regional economic growth and the role of high-speed rail in China. Appl. Econ. 2019, 51, 3465–3479. [Google Scholar] [CrossRef]
- Tai, X.; Xiao, W.; Tang, Y. A quantitative assessment of vulnerability using social-economic-natural compound ecosystem framework in coal mining cities. J. Clean. Prod. 2020, 258, 120969. [Google Scholar] [CrossRef]
- Wang, L.; Anna, H.; Zhang, L.; Xiao, Y.; Wang, Y.; Xiao, Y.; Liu, J.; Ouyang, Z. Spatial and Temporal Changes of Arable Land Driven by Urbanization and Ecological Restoration in China. Chin. Geogr. Sci. 2019, 29, 809–819. [Google Scholar] [CrossRef] [Green Version]
- Chen, Z.; Yu, B.; Ta, N.; Shi, K.; Yang, C.; Wang, C.; Zhao, X.; Deng, S.; Wu, J. Delineating Seasonal Relationships Between Suomi NPP-VIIRS Nighttime Light and Human Activity Across Shanghai, China. IEEE J. Sel. Top. Appl. Earth Observ. Remote Sens. 2019, 12, 4275–4283. [Google Scholar] [CrossRef]
Figure 1.
Geolocation of 100 cities across China mainland. The color of the circle represents the population of the 100 cities, the three red circles represent the location of Bohai Rim Economic Circle, the Yangtze River Delta and the Pearl River Delta, respectively, and (a) represents the four economic regions across China.

Figure 2.
The ability of average light index (ALI) to characterize the economy. (a–f) represent the regression results of ALI and economic density (ED) from 2013 to 2018, respectively (1 represents super-cities, 2 represents megacities, 3 represents large cities, and 4 represents medium cities).
Figure 2.
The ability of average light index (ALI) to characterize the economy. (a–f) represent the regression results of ALI and economic density (ED) from 2013 to 2018, respectively (1 represents super-cities, 2 represents megacities, 3 represents large cities, and 4 represents medium cities).

Figure 3.
Spatial distribution pattern of ALI. (a–f) represent the spatial distribution of ALI across China mainland from 2013 to 2018, respectively.
Figure 3.
Spatial distribution pattern of ALI. (a–f) represent the spatial distribution of ALI across China mainland from 2013 to 2018, respectively.

Figure 4.
Box-plots of ALI in four regions. (a–f) represent the distribution difference of ALI in four regions from 2013 to 2018, respectively.
Figure 4.
Box-plots of ALI in four regions. (a–f) represent the distribution difference of ALI in four regions from 2013 to 2018, respectively.

Figure 5.
ALI distribution characteristics and changes in raw coal production from 2013 to 2018.

Figure 6.
ALI variation mode of 100 cities from 2013 to 2018. The number in the upper left of each small figure represents the City ID, the different colors represent the cities in different regions, and each small figure under different subtitles represents different ALI variation modes.
Figure 6.
ALI variation mode of 100 cities from 2013 to 2018. The number in the upper left of each small figure represents the City ID, the different colors represent the cities in different regions, and each small figure under different subtitles represents different ALI variation modes.

Figure 7.
Regression results. (a–f) represent the regression results of IS and ALI from 2013 to 2018, respectively (1 represents super-cities, 2 represents megacities, 3 represents large cities, and 4 represents medium cities).
Figure 7.
Regression results. (a–f) represent the regression results of IS and ALI from 2013 to 2018, respectively (1 represents super-cities, 2 represents megacities, 3 represents large cities, and 4 represents medium cities).

Figure 8.
Ternary diagrams. (a–f) represent the industry structure layout from 2013 to 2018, respectively. The location of dots presents industry structure layout in 100 cities, and the color of dots presents ALI (red means the high ALI, blue means the low ALI).
Figure 8.
Ternary diagrams. (a–f) represent the industry structure layout from 2013 to 2018, respectively. The location of dots presents industry structure layout in 100 cities, and the color of dots presents ALI (red means the high ALI, blue means the low ALI).

Figure 9.
Six changing types of industry structure layout: (a) Left-bottom to left-top type: the proportion of secondary industry increases, while the proportion of tertiary industry decreases; (b) right to left type: the proportion of tertiary industry increases, while the proportion of primary industry decreases; (c) left-top to left-bottom type: the proportion of tertiary industry increases, while the proportion of secondary industry decreases; (d) right-top to left-bottom type: the proportion of tertiary industry increases, while the proportion of primary and secondary industry decreases; (e) reciprocate type: the proportion of the three major industries reciprocates; (f) situ type: the proportion of the tertiary industry changes slightly.

Figure 10.
Distribution of the type of industry structure layout change in four regions.

Figure 11.
Feature importance of the industry (PI represents the primary industry, SI represents the secondary industry, TI represents the tertiary industry).
Figure 11.
Feature importance of the industry (PI represents the primary industry, SI represents the secondary industry, TI represents the tertiary industry).

Figure 12.
The result of city classification. (a–f) represent the classification results from 2013 to 2018, respectively. (1 indicates the three major industry-driving cities, 2 indicates the secondary and tertiary industry-driving cities, 3 indicates the tertiary industry-driving cities).
Figure 12.
The result of city classification. (a–f) represent the classification results from 2013 to 2018, respectively. (1 indicates the three major industry-driving cities, 2 indicates the secondary and tertiary industry-driving cities, 3 indicates the tertiary industry-driving cities).

Figure 13.
Changes in the number of cities with different industry-driving force. (1 indicates the three major industry-driving cities, 2 indicates the secondary and tertiary industry-driving cities, 3 indicates the tertiary industry-driving cities).
Figure 13.
Changes in the number of cities with different industry-driving force. (1 indicates the three major industry-driving cities, 2 indicates the secondary and tertiary industry-driving cities, 3 indicates the tertiary industry-driving cities).

Figure 14.
The ability of TNL to characterize the economy. (a–f) represent the regression results of ALI and ED from 2013 to 2018, respectively. (1 represents super-cities, 2 represents megacities, 3 represents large cities, and 4 represents medium cities).
Figure 14.
The ability of TNL to characterize the economy. (a–f) represent the regression results of ALI and ED from 2013 to 2018, respectively. (1 represents super-cities, 2 represents megacities, 3 represents large cities, and 4 represents medium cities).

Table 1.
Mean value of ALI in four regions (unit: nanoWatts/cm2/sr).
| Time | Region | |||
|---|---|---|---|---|
| East | Northeast | Central | West | |
| 2013 | 3.39 | 0.81 | 0.70 | 0.86 |
| 2014 | 3.32 | 0.79 | 0.70 | 0.86 |
| 2015 | 3.37 | 0.85 | 0.70 | 0.83 |
| 2016 | 3.40 | 0.87 | 0.80 | 0.98 |
| 2017 | 3.79 | 0.99 | 0.94 | 1.00 |
| 2018 | 4.08 | 0.95 | 1.01 | 1.08 |
Table 2.
5 ALI variation modes in four regions.
| ALI Mode | Region | Total | |||
|---|---|---|---|---|---|
| Northeast | East | West | Central | ||
| √ | 1 | 27 | 10 | 22 | 60 |
| Exponent | 1 | 7 | 1 | 8 | 17 |
| Logarithm | 1 | 1 | 1 | - | 3 |
| N | 1 | 1 | 3 | 1 | 6 |
| W | 2 | 2 | 9 | 1 | 14 |
| Total | 6 | 38 | 24 | 32 | 100 |
Table 3.
The impact of location on ALI (p-value).
| Group | Year | |||||
|---|---|---|---|---|---|---|
| 2013 | 2014 | 2015 | 2016 | 2017 | 2018 | |
| 1–4 | 0.02 | 0.02 | 0.01 | 0.02 | 0.02 | 0.02 |
| 2–4 | 0.03 | 0.03 | 0.03 | 0.03 | 0.03 | 0.03 |
| 3–4 | 0.01 | 0.01 | 0.01 | 0.01 | 0.01 | 0.00 |
| 1–2 | 0.94 | 0.48 | 0.48 | 0.94 | 0.65 | 0.81 |
| 1–3 | 0.95 | 0.95 | 0.84 | 0.95 | 0.84 | 0.84 |
| 2–3 | 0.55 | 0.40 | 0.40 | 0.71 | 0.85 | 0.85 |
Note: Group 4 represents cities in the economic circle; Group 1, 2, and 3 represent other cities.
Table 4.
The impact of raw coal on ALI (p-value).
| Group | Year | |||||
|---|---|---|---|---|---|---|
| 2013 | 2014 | 2015 | 2016 | 2017 | 2018 | |
| 1–5 | 0.22 | 0.22 | 0.22 | 0.22 | 0.22 | 0.22 |
| 2–5 | 0.83 | 0.67 | 0.67 | 0.67 | 0.22 | 0.22 |
| 3–5 | 0.67 | 0.34 | 0.22 | 0.22 | 0.22 | 0.22 |
| 4–5 | 0.67 | 0.67 | 0.34 | 0.22 | 0.22 | 0.22 |
| 1–2 | 0.50 | 0.34 | 0.34 | 0.34 | 0.50 | 0.67 |
| 1–3 | 0.67 | 0.67 | 0.67 | 0.67 | 0.67 | 0.67 |
| 1–4 | 0.34 | 0.34 | 0.34 | 0.34 | 0.34 | 0.34 |
| 2–3 | 0.95 | 0.95 | 0.95 | 0.83 | 0.83 | 0.67 |
| 2–4 | 0.22 | 0.34 | 0.34 | 0.22 | 0.34 | 0.34 |
| 3–4 | 0.22 | 0.13 | 0.13 | 0.13 | 0.22 | 0.22 |
Note: Group 5 represents coal mining cities; Group 1, 2, 3, and 4 represent other cities.
© 2020 by the authors. Licensee MDPI, Basel, Switzerland. This article is an open access article distributed under the terms and conditions of the Creative Commons Attribution (CC BY) license (http://creativecommons.org/licenses/by/4.0/).
Share and Cite
MDPI and ACS Style
Song, X.; Chen, Y.; Li, K. Analyzing Spatiotemporal Variation Modes and Industry-Driving Force Research Using VIIRS Nighttime Light in China. Remote Sens. 2020, 12, 2785. https://0-doi-org.brum.beds.ac.uk/10.3390/rs12172785
AMA Style
Song X, Chen Y, Li K. Analyzing Spatiotemporal Variation Modes and Industry-Driving Force Research Using VIIRS Nighttime Light in China. Remote Sensing. 2020; 12(17):2785. https://0-doi-org.brum.beds.ac.uk/10.3390/rs12172785
Chicago/Turabian StyleSong, Xiaoke, Yunhao Chen, and Kangning Li. 2020. "Analyzing Spatiotemporal Variation Modes and Industry-Driving Force Research Using VIIRS Nighttime Light in China" Remote Sensing 12, no. 17: 2785. https://0-doi-org.brum.beds.ac.uk/10.3390/rs12172785
Note that from the first issue of 2016, this journal uses article numbers instead of page numbers. See further details here.