1. Introduction
The requirements for post-construction commissioning at bridge building sites consist mainly of the quantitative and qualitative assessment of conducted works. They are applied by contracting authorities all over the world and their most important part is a final acceptance. They are one of the most responsible and complex commissioning procedures. A contractor has to complete and provide a lot of documents, certificates, and control examination results to a contracting authority. In the case of large and significant bridges, they are often also the result of examining a bridge under a test load.
A test load constitutes one of the basic and most comprehensive tools in assessing the safety of using a structure. That methodology has been known for a very long time and it is still often implemented as an element of checking the structure before commissioning it for use [
1,
2]. In the past, the need for conducting test loads on bridges was enforced by the difficulties in providing the desired quality of construction works and by the lack of sufficient trust in materials, models, and design intents applied back then. However, the situation now has radically changed. Quality can be confirmed in different ways at any phase of designing and building. There are also better materials and more efficient modeling tools at our disposal.
However, it does not mean that test loads have lost their meaning and that there is no more need for conducting them. In addition, it is known that they do not serve directly to determine a bridge’s load capacity, because to specify it clearly, the bridge would have to be simply destroyed. On the grounds of such a test, basic structure properties (e.g., stiffness) are only identified, which are later used to update a model intended by the designer [
3]. Having a much more reliable model, it can be concluded that the bridge fulfills the requirements concerning a given load class which were accepted at the stage of designing [
4].
Similar identifying actions with model update have to be conducted during installation and Structural Health Monitoring systems (SHM) [
5]. Not every bridge, however, is or will be equipped with an expensive and complicated electronic SHM system. The alternative (or supplement) for them can be the test loads, which should be treated as an element of bridge diagnosis [
6]. Furthermore, not only in the aspect of the commissioning procedure, which is supposed to confirm the quality of implementation and expected load capacity, but also monitoring their technical condition [
7]. Of course, it does not apply to permanent SHM systems, but more to the needs of the future use in Bridge Management Systems (BMS) [
8]. Acceptance tests create a specific construction metric, which, beside design intents verification, should be one of the most important aims of test loads nowadays, both static and dynamic. They should regard new bridges as well as old ones, which have to be reconstructed in their life course [
9].
It must be noted, however, that the traditional methods most often applied during load tests involving, e.g., contact displacements measurement, although effective and reliable, sometimes cannot be implemented. Especially when it comes to large bridges, which are situated over an inaccessible area (e.g., wide rivers, deep valleys, or motorways and railways). In such cases, remote sensing methods are sought, which allow a measurement from long distances and without the need to access the area under the bridge [
10,
11,
12]. These measuring techniques were implemented in the case study described here during load tests of a large tram flyover over an active railway station in the center of Cracow.
Methods of measurement and ways of evaluating the results depend on the type of structure and load or generating vibrations. Therefore, the choice of measuring techniques should not be random. The study [
13] discusses practice currently used in Germany. The authors payed special attention to the potential of the FEM model calibration based on the measurement data. Because in well-developed parts of the world (such as the USA or Western Europe), bridge infrastructure is not quite new and loads are ever increasing and the need for constant evaluation of technical conditions is still a valid problem.
One of the measurement methods is using the FBG-based (fiber Bragg grating) strain sensors. This solution is presented in publication [
14]. The authors show how possible it is to achieve valuable results with the use of sensors working pointwise in comparison to commonly implemented long-gage sensors. The study of bridge structures includes both trials under variable and fixed load conditions. Concentrating mainly on the loads of static characteristics, the authors [
15] describe the developments and application of a laser-based instrument used to experimentally load test bridges. Laser systems are used to quickly and unobtrusively measure bridge girder deflections under static loading. The system can be set up in the median or shoulder of the roadway under the bridge without altering traffic. Laser systems data can be collected on multiple girders from one measurement location without requiring access to the girders, and no special targets are required on the girders. The publication [
16] includes a comparison of values from three methods of evaluating the load: conventional, conventional updated with measuring data, and the method of finite elements which is calibrated based on NDT (non-destructive testing) measurements. After the execution stage, premises about the theoretical model can be eliminated or accepted through measurements directly on the structure.
On the other hand, the publications [
17,
18] report on the results from development and a study of vertical deflection measurement of bridges using digital close-range terrestrial photogrammetry. The photogrammetric results are compared with the deflections estimated using elastic finite-element analysis, level rod readings, and curvature-based deflection measurements. Bridge structure monitoring can be also successfully conducted with classic geodetic techniques. An example of such works is a publication [
19] in which the authors present a solution based on a total station type of instruments.
In the field of structure monitoring, the ground-based synthetic aperture radar (GB-SAR) technique has been available for several years. Originally, this technique was developed to observe the displacement of surface objects such as landslides, glaciers, dams, or embankments [
20,
21,
22]. One of the solutions for creating a synthetic aperture is the use of a linear rail on which the radar unit moves during imaging (e.g., IBIS-L or IBIS-FL radar from the IDS company). As a result, displacements of the surface expressed as 2D pixels are obtained.
In the case of building structures, especially those with an elongated shape, the observation of a surface motion determined for pixels is not required. The displacements are recorded along the radar line of the sight, and the points are identified based on the distance to the target. This mode is provided by the IBIS-S (or IBIS-FS) version of the system developed by the IDS company. The most popular application of this device is the monitoring of bridge structures, chimneys, or high-rise buildings [
10,
23,
24]. This version allows to make observations up to every two seconds (in the static mode) or with a sampling rate of up to 200 Hz (in the dynamic mode). The vast majority of applications known from the literature use the dynamic measurement mode. However, the static mode, guaranteeing higher accuracy according to the manufacturer, may be treated as a quasi-continuous mode for static test loads.
This article highlights the ground-based radar interferometry technique for recording displacements of bridge spans. Results of measurements were additionally validated with other techniques: contact gauges and tacheometry. Comparisons between radar and other measurement techniques in the field of displacement measurement are common in literature. However, in the presented case study—apart from the comparison, which was partially possible—a case was indicated in which it was not possible to use other observational techniques. The focus was on the validation of the remote sensing technique, which, due to the observational conditions, may be the only one that can be used in the study of the deformation of bridge structures.
2. The Bridge under Study and the Load Test Range
The bridge under study is a geometrically and structurally complex tram flyover located over a large and busy railway station in the center of Cracow. It constitutes an important element of an ever-expanding fast tram infrastructure in Cracow. The idea of a fast tram is an example of the so-called “pre-underground” or “light underground”. Pre-underground is a tram line or light train line which includes route sectors in a fast and collision-free connections standard, especially in city center areas. Thanks to that, it is possible in the future to include such a sector into the real underground system.
The flyover was accepted to be used in 2015 and is now the longest of such structure in Poland. In its essential part, it consists of two separate structures: the main bridge of an extradosed type, 469 m long, and a suspension access bridge, 156 m long. Between those two bridges, retaining walls are situated with a ramp for cyclists and the disabled (
Figure 1). Apart from the double tram railway, the bridges hold pedestrian and bicycle traffic over the station. A wide cycle lane with a pedestrian line runs alongside.
Because the case study covers the use of remote sensing for measurements of hard-to-access bridge spans displacements, the following part of the paper focuses on the main bridge only—underneath of which are located 21 electrified railway lines of the station important for Cracow. Maintaining the flow of traffic on them was not only the main problem during the construction but also during the load test. The cantilever erection method with a double pair of travellers form was used which allowed to maintain the flow of railway traffic and finish the construction at the contractual deadline. Whereas for the load test of the hard-accessible spans, additional remote sensing techniques were applied.
The main bridge structure (
Figure 2) is formed by a 7-span continuous supporting structure in which the spans from 4 to 7 are pre-stressed by using external tendons (the extradosed type). Two tram tracks run through the object and, additionally, a bicycle and a pedestrian string. The cross-section is formed by a one-compartment box made of concrete, pre-stressed longitudinally and transversely. The pylons are made of pillars of constant thickness and variable width, connected monolithically with the deck structure over them. The superstructure is connected to the pillars by pot bearings. The structure lies on reinforced concrete abutments and reinforced concrete disc piers. For research planning and later inference purposes, a FEM model of the bridge was developed. The rod and layer elements used in it considered variable superstructure and pylon geometry and different suspension tendons. The results of the study served to identify the basic properties of the structure (stiffness, frequency, and damping of the natural vibrations), and in the next phase, to update the model and the inference about the current load capacity of the bridge.
The test load studies included static and dynamic trials (
Figure 3). Because of the work schedule and lack of connection with the railway system outside the object, a static study was conducted using alternate means, namely, eight trucks loaded to the total weight of 32 tonnes each. In special cases, automobile traffic, e.g., maintenance vehicles or buses, will be allowed on both bridges, therefore such a study was desired.
A static study of the main bridge included four span load patterns (S1, S2, S3, S4) for the spans 4 ÷ 7, which were selected from the condition of maximum span moment and support pattern (P1), selected from the condition of maximum support moment over the support number 6 (
Figure 4). To verify the interaction of the transverse structure, an unsymmetrical pattern (N1) in span number 5 was additionally done.
3. Description of Methods Used in Bridge Load Tests
In the presented case, to measure span displacements under different static loads in a traditional manner, a contact technique which uses mechanic sensors of 50 mm range and 0.01 mm reading resolution was implemented (
Figure 5c). More precise sensors of 0.001 mm resolution and a range of up to 25 mm were used to measure the deformations of the bearings. Settlements of the supports were observed using precise optical levels with a reading resolution of 0.1 mm. In addition, with the use of an electronic total station, deviations of pylon were observed (
Figure 5a). The observation of span displacements as well as supports settlements with crushed bearings allows to determine the span deflections. This way, they can be compared to the theoretical deflections, which are estimated in FEM models.
The static test load procedure consists in measuring the answer of a structure to an applied load, usually in the form of heavy trucks put on a tested span. In this case, the displacement of measuring points in a given cross-section of the girder was observed. Traditional measuring techniques with mechanical contact sensors have limited possibilities. The gauge is attached to a tripod placed on the ground surface. Its contact with the moving span is ensured by the invar wire tensioned with a small weight at the bottom. This traditional measurement can only be used with access to the space under the bridge and a low height above the ground. Additionally, it is not possible to measure the displacement continuously or even quasi-continuously. Manual readings are conducted in quite long-time intervals, usually every 10–15 min. In accordance with the applied procedure, the first series of readings of the deformed structure under a given load pattern is carried out immediately after initiating enforcement (entering and setting the trucks). Successive series (but not less than three) are conducted in regular time intervals, until displacements stabilize. After retracting the enforcement (moving the vehicles back from the span), another series of measurements is carried out in similar time intervals, again until displacements stabilize. Displacement stabilization means the situation when the difference between the last and the second to last measurement indications made in an approved time interval does not exceed 2% of the penultimate measurement.
Applying remote sensing techniques, which additionally enables faster sampling, allows not only to improve measurements, but also to achieve additional quality information regarding the studied issue of span deflections, useful in structure diagnosing. It concerns the relation between the elastic and permanent deflections which together form a total deflection. They have significant meaning in assessing the results of test loads. Permanent deflection is a deflection of a span, which stays after lifting the load and stabilizing displacements. This value is verified during the test load. Depending on the construction material (mainly steel or concrete) and the type of structure, there may be different limits, but usually they should not exceed 10% of the total measured displacement. Otherwise, it may indicate a nonlinear structure response to the load, which may mean permanent damage. In addition, during traditional contact measurement with a long sampling period, it is hard to clearly determine the stabilization of the displacements and interrupt the measurement. That is because in that period, sometimes even tens of minutes, a lot of effects can occur, which influence the measured displacements. They can be changes in temperature, low frequency of vibrations caused by gusts of wind, or the delayed mobilization of a suspension system made of tendons. The GB-SAR radar (
Figure 5b) used here, with sampling every 3 seconds, allowed to more precisely specify the permanent deflections and to better assess the effect quality-wise.
The location of the bridge under the study determined the need to use remote techniques for span deflections measurement. The flyover is situated over a railway station with heavy traffic, through which several active lines run. Access to the underside of the structure for deflection measuring purposes was hindered. Loading gauge and electric traction made it impossible to access the measuring points directly, which is essential in traditional contact measuring techniques. In
Figure 6, which shows the span chosen for study, those points are marked as 1002, 2002, and Rbin39.
In the presented study, the main non-contact method of measurement is the ground-based radar interferometry. The radar system determines the displacements of the observed points by studying the differences in the phases of the emitted waves reflected and scattered by a structure. In the described experiment, an IBIS-S system with IDS production was applied. It uses microwaves from Ku band (
λ = 17.4 mm) to function [
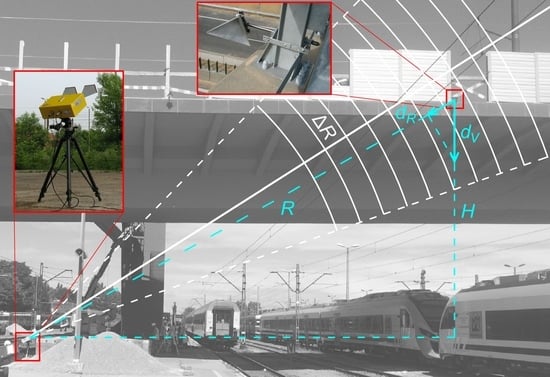
20]. During the field works, the points under observation were marked by the radar reflectors attached to the structure of the span chosen for measurement. Displacements in radial direction (
dR) are subject to direct observation; therefore, for determining vertical displacements (
dV), an additional measurement was carried out (
Figure 7). It included the location of the radar reflectors with regard to the radar unit, using geodetic methods (measurement of
R and
H values). Ultimately, the vertical displacements were determined based on geometric relation:
where:
p—projection factor
A lot of points on the structure can be observed simultaneously by the device, thanks to the applied wave modulation [
24]. Range resolution, which is the minimum distance between the separately observed points (
Figure 7), reaches 0.5 m in the applied radar system [
16]. The sampling rate is up to 200 Hz in the dynamic mode, and the range of operation is up to 1 km. However, these parameters are interdependent. The radial displacement measurement error is 0.1 mm, provided there are strong wave reflections. An important limitation is the ability to measure displacement in only one direction—along the radar axis, which may be a significant limitation, especially with low bridge structures (a high
p value). Observations can be performed without access to the structure. However, it may be problematic (especially when compared with measurements using sensors and surveying instruments) to pinpoint the location of the observed point. It is limited to the value of the range resolution (in the best case 0.5 m). Nevertheless, a clear identification of the observed point can be achieved by installing radar reflectors on the structure, but it means that there is the need for direct access to the structure.
Besides the radar measurements, geodetic techniques ought to be mentioned among the most often applied non-contact measuring techniques. One of them is tacheometry, which allows to determine the 3D coordinates of the point based on the spatial distance measurement as well as the horizontal and vertical angles. In the experiment, it was used not only to determine the p factor value, but primarily to control the results achieved through the radar method.
For total station-based observations, vertical angle measurement is especially important because its change proves the span deflection. The other observations (distance and vertical angle) should not change in a range higher than the measuring error. Instruments used for the study ensured angle measurement accuracy equal to 2 arc-sec (north side) and 0.5 arc-sec (south side), and better than 2.5 mm in regard to spatial distance measurement, provided that the geodetic prisms are mounted on a structure. Based on these observations, the spatial position of the observed point is determined. In the presented test, the observations were conducted in static mode in time intervals of a few minutes. Nonetheless, angle observations allow to achieve a frequency of up to 25 Hz [
19], which can be used in dynamic studies.
The data achieved through the radar method are a time series of regular, 3-second samplings. During the comparative analyses, linear regression was fitted into the radar data. For the calculations, the data corresponding to the static load of the span, that is the observations from 11:38:00 to 12:15:03, were used. The observation made using total station was added to the diagram showing the observations. The calculations were made using the sklearn library (
https://scikit-learn.org/stable/) [
25].
4. Results
For the static measurements, spans 4, 5, 6, and 7 were selected. The measurements were conducted basically using the traditional contact method. In span 6, where there was no access to the middle of the span from the bottom side, the points of the contact methods were moved towards support 7 (
Figure 8). The remote sensing GB-SAR method was used as a supplement to those measurements in the middle of the span. In addition, the geodetic method using total station was applied for verification.
Figure 6 shows the location of the measuring points on span 6. They were used during the three chosen load patterns (according to
Figure 4), which were implemented in the following order: S3, S2, and P1.
Figure 9 shows the sequence of the displacement changes in measuring points 1004 and 2004 using the traditional method (Z-1004 and Z-2004) and tacheometry (TC) (T-1004 and T-2004). Full load in patterns S3, S2, and P1 appeared from 11:35 to 12:30, from 14:00 to 14:30, and from 15:50 to 16:25, respectively. In each of these time intervals, stabilization of displacements of up to 2% of the total displacement occurred.
The analysis of the permanent deflections was determined in time intervals after unloading the span from 12:30 to 13:45, from 14:30 to 15:30, and from 16:25 to 16:55. During unloading, the permanent deflections achieved were smaller than the acceptable values equal to 10% of total deflection.
During the S3 pattern, the maximum deflections were achieved, 64.2 and 66.4 mm, respectively, into points T-1004 and T-2004, as well as 65.8 mm and 65.7 mm in points Z-1004 and Z-2004, see
Figure 10. In patterns S2 and P1, those values were significantly smaller, which was the result of a level of load applied on both of the neighboring spans at the same time.
Comparing both methods of measurement, in each of the three patterns, there were some slight differences. In the case of point 1004, in patterns S3, S2, and P1, they equaled 1.6 mm, 0.8 mm, and 0.1 mm, respectively. When it comes to point 2004, the differences equaled 0.7 mm, 0.1 mm, and 0.8 mm accordingly. Taking into consideration the expanded uncertainty of the traditional method which equals 4.7% of the measured deflection value, the obtained differences lie within error limits. Thereby, the efficiency of the TC method can be confirmed in the span measurements, where it is impossible to implement traditional methods.
Comparative studies were conducted during the static test loads on one of the bridge’s spans. The span was equipped with signals allowing to make radar and geodetic observations (
Table 1) as well as with the use of dial gauges.
The basic measuring technique applied to determine span deflections was the GB-SAR technique. To increase measurement credibility, along the south side edge of the top flange, two radar reflectors were placed whose precise identification on the radar profile was facilitated thanks to the geodetic measurement (
Figure 11). The radar profile includes also reflections from the other elements of the flyover structure.
It should be mentioned that in the case of the SAR measurements, several sources can be identified which cause uncertainties or inaccuracies of the measurement. These include, among others, the microwave beam width and the intensity of the reflected signal.
The first one depends on the type of transmitting and receiving antennas used for the measurement. The narrow-angle antenna type, which was used for the measurement, limits signals beyond the line of sight of the radar to a much greater extent. Nevertheless, “alien” reflections are not completely eliminated. Moreover, in the experiment, two reflectors were subject to observation (
Figure 11a), and therefore the radar axis was aimed between them. Hence, the reflections from the reflectors (marked with vertical lines) are not the strongest on the radar profile (
Figure 11b). In this situation, geodetic measurements of the position of the radar and reflectors were indispensable. On their basis, the distances from the radar to the reflectors were determined and appropriate peaks (the range bins) on the radar profile were identified.
The second factor, i.e., the echo intensity, affects the accuracy of the displacement determination and depends on the type of the reflecting surface. According to the assumptions of the manufacturer of the IBIS system, the use of radar reflectors is not necessary because the engineering structures reflect the radar wave strongly enough. However, the multitude of signals reflected from the structure may constitute a disruptive effect and hinder the interpretation of the result. Therefore, if possible, it is preferable to place the reflectors on the structure as their use increases the certainty of identifying the correct peak on the radar profile.
In addition to the above-mentioned devices, two precise total stations were used in the discussed experiment. They were placed on the north and south side of the span (
Figure 6). A few points were under observation and they are listed in
Table 1. Geodetic prisms were attached to the bridge structure in places corresponding to the radar reflectors’ positions (2002, 2003), whereby for additional control, they were placed symmetrically on the north side of the span (1002, 1003). Additionally, in the bottom part of the box girder, on the north and south sides, the reflective tapes serving as signals (1004, 2004) were placed. Their location corresponds with the place of the traditional measuring system mounting. Apart from that, outside the area of the object influence, two stable referential reflectors (1001, 2001) were placed, tasked with the verification of observing position stability.
Figure 12 presents the results of the deflections measurements carried out for the entire duration of the experiment. The points on the diagrams mark the measurement of all geodetic prism positions. The loads were conducted according to the following patterns:
11:35–12:30—loading of the span under radar and geodetic observations;
14:00–14:30—loading of the adjacent span, which resulted in the lifting of the observed span;
15:50–16:25—loading of the support located between the aforementioned spans.
On the basis of the conducted measurement, the values of the span deflections in the observed points can be determined. Their sequence is compliant with the expectations and the obtained values lie within acceptable ranges. The important conclusion from the measurement is the appearance of permanent deflections after removing the load, especially after the implementation of the first pattern. The stability of the referential reflectors position (1001, 2001) proves that it is not the influence of any artifact (e.g., thermic effects or instability of the observation positions).
The proper deflection measurement was made using the ground interferometry technique. Two points of the span signaled by radar reflectors (
Figure 11) were under observation. The radar measurement was conducted in the static mode with a sampling rate equal to 3 s. The results of the deflections for the three carried out static patterns are presented in
Figure 13, together with the results of the geodetic measurement for the comparison. The disruptions in the diagram sequence of the loads for the radar observations which appear at the beginning and at the end of every deflection are the result of the movement of the trucks used to create the loads.
5. Discussion
During the loading of the studied span, the observations were made simultaneously using TC and IBIS radar. Because the recording of data through radar provides a huge amount of data, there is a possibility to calculate linear regression for a given set of data.
Figure 14 and
Figure 15 present the radar observations (black color), the linear regression of the radar data (the dashed line), as well as the observations made using the total station (the red dots).
The differences vector between the TC measurements and the radar measurements for Rbin23 in relation to the linear regression ranges from 0.48 mm to 2.05 mm.
Therefore, the average difference between measurements done with both methods equals 1.1 mm with a standard deviation equal to 0.60 mm.
In the case of the point Rbin39 observation, the difference vector ranges from −0.17 mm to 1.6 mm.
In this case, the difference between both method measurements equals 0.25 mm with a standard deviation equal to 0.94 mm.
The comparison of the results was done in an absolute system from the beginning of the span observation and not from the moment of loading. Such an approach enables to state the fact that from the very first measurement done at 11:38:00 there is a difference between methods. Referring this difference to a regression made on the radar data (as the ones with much better definition), it equals, respectively, 0.61 mm for Rbin23 and −0.54 mm for Rbin39. It is worth noting that the radar measurement was carried out continuously for the entire experiment, and not for each load pattern separately.
The trend of the results is especially noticeable.
Figure 16 presents diagrams of the differences for the TC observations and for the linear regression of the radar results. The regression was done for the calculated differences—the black color means the measurements based on the Rbin23 results, while the red color represents the measurements based on the Rbin39 results. Based on the residual values, the linear model correctly describes the phenomenon. There is no answer explaining the discrepancy in the literature, but it is an instance to emphasize its occurrence.
In both cases, the difference between the methods grows with time in a linear way, reaching almost 2 mm after 37 minutes of span observation.
The differences in the measurements using the IBIS and TC methods presented above concerned two measuring points (2002 and 2003) situated in the cross-section of the span at the edge of the cantilever. Unlike points 1004 and 2004, where measurements were conducted using the traditional and TC methods, the results of the measurements include simultaneous longitudinal and transverse displacements of the cross-section. It is the result of local displacements of the cantilever against the stiff box girder in which it is mounted. The observed points on the cantilever were additionally exposed to impacts connected with the temperature change of the element. Places at the end of limp cantilever heated up differently than the ones close to the axis of the tall girder. The determined regressions with a time slot during the span load confirm the influence of local cantilever work on the stabilization of the displacements. For points 1004 and 2004, where traditional and TC measurements were used, the effect of the displacement stabilization was within the range of the required values. The differences between the IBIS and TC methods lie within a maximum range of 2.00 mm. This means that they are within the permissible error of 4.7% of the measured value.
On the basis of the diagrams presented in
Figure 16, it is noticed that the increase of deflection recorded by both measuring systems is not even. Total station observations as well as the radar ones allow to claim that the span deflection in the chosen time slot increases. The increase of the deflection proved by the radar observations is bigger though. This cannot be an effect of different observation points, because both pairs of reflectors (2002 and Rbin39, 2003 and Rbin23) were located on the same edge of the top flange. The reason may be found in the atmospheric parameters’ instability along the lines of the observations. However, the course of the distance-meter wave (in the infrared range) is only slightly vulnerable to changes in atmospheric conditions. The change in the measured distance equals only 1 ppm together with the temperature change of 1 °C (or the pressure of 3 hPa, or the relative humidity of 20%) [
26]. Change in atmospheric conditions has a lot more significant influence on a form of radar wave. The total influence of the abovementioned changes of factors is between 8 and 42 ppm, depending on temperature in a range from 0 to 30 °C, which results from the equation presented by Zebker [
27]. Although, to explain the discrepancy between the radar and tacheometry observations, the relative humidity of the atmosphere would have to decrease to about 30% in the time of load duration (max. 45 min). The lack of information about atmospheric parameters does not allow to confirm such a conclusion however.
Nevertheless, the displacement values measured using both techniques (geodetic and radar), despite the uncertainty of their determining, provide the data, which enables to decide to finish the test loads due to displacement stabilization. As was mentioned in
Section 3, such a situation occurs when the difference between the last and last but one measurement indications does not exceed 2% of the penultimate measurement. A significant advantage of applying the radar technique is the ability to conduct the measurement in points hard to access, also without the need to attach reflectors. Moreover, it allows to perform observations in the quasi-continuous mode. However, referential measurements using the geodetic or traditional methods can be a significant help, because they enable to include the influence of unfavorable atmospheric phenomena or installation on the structure (the edge of the top flange instead of the bottom of the box girder—in the presented case).
6. Conclusions
A load test is one of the most credible and complex methods of assessing the technical condition of a bridge structure and determining its actual load capacity. In the past, it served mainly as the study for commissioning new-built constructions whose aim it was to confirm the quality of building works. More and more often, however, it constitutes an important element of Bridge Management Systems, since it allows for the efficient identification of structure properties and FEM model update. A credible model serving as almost like a digital twin together with cyclical repeated load tests can provide a simpler substitute of expensive SHM systems. The condition though is to apply remote sensing techniques for the tests. Traditional contact methods do not allow to measure long spans, which are hard to access. Such cases occur over big rivers or in dense city sprawl.
This article confirms the usefulness of the GB-SAR method for the displacement measurements of the long-span tram flyover over the tracks of the huge railway station in the center of Cracow. A load test using traditional measurement techniques was impossible because of the necessity to maintain the flow of traffic and platform availability. This case study presents an issue that is also relevant in the case of wide rivers in lowlands, where access to the bridge spans from below is impossible. The possibilities offered by remote sensing techniques are sometimes the only solution. Compared to traditional techniques, the sampling rate is much higher, and the error does not increase as a result of multiple observations (such as, e.g., for a leveling run). An additional asset was also a better, quality-wise, assessment of a permanent deflections effect, which constitutes an important part of bridge diagnosis. It was possible thanks to quasi-continuous measurement, which is not possible in traditional techniques. The results of the study serve also to update the FEM model, which can be used by a critical infrastructure owner for managing processes.
Nevertheless, the analysis conducted as part of the research indicated also the need for a critical approach to the results obtained by the GB-SAR method. It is about environmental influences, namely, changes in the parameters of the atmosphere during long-term measurements with variable insolation. In such situations, the legitimacy of using other, more classic measurement techniques has been proven.
Author Contributions
Conceptualization, Ł.O., T.O., and M.S.; methodology, P.K., Ł.O., and M.S.; validation, T.O. and P.Ł.; formal analysis, P.K., T.O., and P.Ł.; investigation, P.K., Ł.O., and M.S.; resources, P.K., Ł.O., and M.S.; data curation, P.K. and P.Ł.; writing—original draft preparation, P.K., Ł.O., T.O., M.S., and P.Ł.; visualization, P.K., T.O., M.S., and P.Ł.; supervision, Ł.O. and M.S.; funding acquisition, T.O. All authors have read and agreed to the published version of the manuscript.
Funding
This research was conducted within the AGH UST study-development contract number 5.5.150.348. The paper was funded by AGH UST project Initiative for Excellence Research University—Intelligent information, telecommunication, computer, and control and operation technologies.
Conflicts of Interest
The authors declare no conflict of interest.
References
- Lantsoght, E.O.L. Load Testing of Bridges: Current Practice and Diagnostic Load Testing, 1st ed.; CRC Press: Boca Raton, FL, USA, 2019. [Google Scholar]
- Brady, K.C.; O’Reilly, M.; Bevc, L.; Žnidarič, A.; O’Brien, E.; Jordan, R. COST 345—Procedures Required for the Assessment of Highway Structures—Final Report; European Commission, Directorate General Transport and Energy: Bruxelles, Belgium, 2015. [Google Scholar]
- Chróścielewski, J.; Miśkiewicz, M.; Pyrzowski, Ł.; Rucka, M.; Sobczyk, B.; Wilde, K. Modal properties identification of a novel sandwich footbridge–Comparison of measured dynamic response and FEA. Compos. Part. B Eng. 2018, 151, 245–255. [Google Scholar] [CrossRef]
- Zhao, J.; Liu, T.; Wang, Y. Static Test Analysis of a Bridge Structure in Civil Engineering. Syst. Eng. Procedia 2011, 1, 10–15. [Google Scholar] [CrossRef] [Green Version]
- Klikowicz, P.; Salamak, M.; Poprawa, G. Structural Health Monitoring of Urban Structures. Procedia Eng. 2016, 161, 958–962. [Google Scholar] [CrossRef] [Green Version]
- Bujňáková, P.; Jošt, J.; Farbák, M. Load testing of Highway Bridge. MATEC Web Conf. 2018, 196, 02020. [Google Scholar] [CrossRef]
- Bień, J.; Zwolski, J. Dynamic Tests in Bridge Monitoring—Systematics and Applications. In Proceedings of the Modal Analysis Conference, Orlando, FL, USA, 19–22 February 2007; pp. 709–718. [Google Scholar]
- Minchin, R.E.; Zayed, T.; Boyd, A.J.; Mendoza, M. Best Practices of Bridge System Management—A Synthesis. J. Manag. Eng. 2006, 22, 186–195. [Google Scholar] [CrossRef]
- Poprawa, G.; Salamak, M. Historical Beam Bridge Model Identification after Changing its Structural System into an Arch. Procedia Eng. 2016, 161, 523–529. [Google Scholar] [CrossRef] [Green Version]
- Owerko, T.; Ortyl, Ł.; Kocierz, R.; Kuras, P.; Salamak, M. Investigation of displacements of road bridges under test loads using radar interferometry—case study. In Proceedings of the 6th International IABMAS Conference, Stresa, Italy, 8–12 July 2012; pp. 181–188. [Google Scholar]
- Miśkiewicz, M.; Pyrzowski, Ł. Load Tests of the Movable Footbridge Over the Port Canal in Ustka. In Proceedings of the Baltic Geodetic Congress (BGC Geomatics), Gdańsk, Poland, 22–25 June 2017; pp. 242–246. [Google Scholar]
- Salamak, M.; Owerko, T.; Łaziński, P. Displacements of cable-stayed bridge measured with the use of traditional and modern techniques. Archit. Civ. Eng. Environ. 2016, 4, 89–97. [Google Scholar] [CrossRef] [Green Version]
- Schacht, G.; Wedel, F.; Marx, S. Bridge Load Testing in Germany. Aci. Symp. Publ. 2018, 323, 1–6. [Google Scholar]
- Torres Górriz, B.; Rinaudo, P.; Calderón García, P.A. Comparison between point and long-gage FBG-based strain sensors during a railway bridge load test. Strain 2017, 53, e12230. [Google Scholar] [CrossRef]
- Fuchs, P.A.; Washer, G.A.; Chase, S.B.; Moore, M. Laser-Based Instrumentation for Bridge Load Testing. J. Perform. Constr. Fac. 2004, 18, 213–219. [Google Scholar] [CrossRef]
- Gentile, C.; Bernardini, G. Output-only modal identification of a reinforced concrete bridge from radar-based measurements. NdtE Int. 2008, 41, 544–553. [Google Scholar] [CrossRef]
- Jáuregui, D.V.; White, K.R.; Woodward, C.B.; Leitch, K.R. Noncontact photogrammetric measurement of vertical bridge deflection. J. Bridge Eng. 2003, 8, 212–222. [Google Scholar] [CrossRef]
- Jiang, R.; Jauregui, D.V. Development of a digital close-range photogrammetric bridge deflection measurement system. Measurement 2010, 43, 1431–1438. [Google Scholar] [CrossRef]
- Lienhart, W.; Ehrhart, M.; Grick, M. High frequent total station measurements for the monitoring of bridge vibrations. J. Appl. Geod. 2017, 11, 1–8. [Google Scholar] [CrossRef]
- Rödelsperger, S.; Läufer, G.; Gerstenecker, C.; Becker, M. Monitoring of displacements with ground-based microwave interferometry: IBIS-S and IBIS-L. J. Appl. Geod. 2010, 4, 41–54. [Google Scholar] [CrossRef]
- Di Pasquale, A.; Nico, G.; Pitullo, A.; Prezioso, G. Monitoring Strategies of Earth Dams by Ground-Based Radar Interferometry: How to Extract Useful Information for Seismic Risk Assessment. Sensors 2018, 18, 244. [Google Scholar] [CrossRef] [Green Version]
- Kuras, P.; Ortyl, Ł.; Owerko, T.; Borecka, A. The geodetic detection of the variable load impact on the earth-filled structure. Appl. Geomat 2020, in press. [Google Scholar] [CrossRef]
- Livitsanos, G.; Saisi, A.; Aggelis, D.G.; Gentile, C. Radar Interferometer Application for Remote Deflection Measurements of a Slender Masonry Chimney. In Proceedings of the 1st International Conference on Transdisciplinary Multispectral Modeling and Cooperation for the Preservation of Cultural Heritage TMM_CH, Athens, Greece, 10–13 October 2018; pp. 430–442. [Google Scholar]
- Hu, J.; Guo, J.; Zhou, L.; Zhang, S.; Chen, M.; Hang, C. Dynamic Vibration Characteristics Monitoring of High-Rise Buildings by Interferometric Real-Aperture Radar Technique: Laboratory and Full-Scale Tests. IEEE Sens. J. 2018, 18, 6423–6431. [Google Scholar] [CrossRef]
- Pedregosa, F.; Varoquaux, G.; Gramfort, A.; Michel, V.; Thirion, B.; Grisel, O.; Blondel, M.; Prettenhofer, P.; Weiss, R.; Dubourg, V.; et al. Scikit-learn: Machine learning in Python. J. Mach. Learn. Res. 2011, 12, 2825–2830. [Google Scholar]
- Artese, S.; Perrelli, M. Monitoring a Landslide with High Accuracy by Total Station: A DTM-Based Model to Correct for the Atmospheric Effects. Geosciences 2018, 8, 46. [Google Scholar] [CrossRef] [Green Version]
- Zebker, H.A.; Rosen, P.A.; Hensley, S. Atmospheric effects in interferometric synthetic aperture radar surface deformation and topographic maps. J. Geophys. Res.Sol. Earth 1997, 102, 7547–7563. [Google Scholar] [CrossRef]
Figure 1.
The plan of the bridges’ geometry.
Figure 1.
The plan of the bridges’ geometry.
Figure 2.
The main bridge seen from the side and in cross-section. Numbers 1–8 stand for axes of supports according to the construction drawings of the bridges; the construction dimensions are given in meters (also in the following figures).
Figure 2.
The main bridge seen from the side and in cross-section. Numbers 1–8 stand for axes of supports according to the construction drawings of the bridges; the construction dimensions are given in meters (also in the following figures).
Figure 3.
A picture showing static load test.
Figure 3.
A picture showing static load test.
Figure 4.
Patterns of the main bridge static loads.
Figure 4.
Patterns of the main bridge static loads.
Figure 5.
Pictures showing the used techniques and measuring devices: (a) total station; (b) IBIS radar; (c) leveling and gauges.
Figure 5.
Pictures showing the used techniques and measuring devices: (a) total station; (b) IBIS radar; (c) leveling and gauges.
Figure 6.
A view of the flyover span under study from the (a) northern and (b) southern position together with the marking of the location of the observed points.
Figure 6.
A view of the flyover span under study from the (a) northern and (b) southern position together with the marking of the location of the observed points.
Figure 7.
The relation between the radial and vertical displacements (blue markings) and the principle of range resolution (white markings).
Figure 7.
The relation between the radial and vertical displacements (blue markings) and the principle of range resolution (white markings).
Figure 8.
The arrangement and marking of the measuring points of span 6.
Figure 8.
The arrangement and marking of the measuring points of span 6.
Figure 9.
The sequence of the displacements of the span using traditional (points Z-1004, Z-2004) and tacheometry (TC) (points T-1004, T-2004) methods of continuous measurement.
Figure 9.
The sequence of the displacements of the span using traditional (points Z-1004, Z-2004) and tacheometry (TC) (points T-1004, T-2004) methods of continuous measurement.
Figure 10.
The maximum elastic span deflections determined on the basis of traditional and TC measurements (taking into account the subsidence of supports).
Figure 10.
The maximum elastic span deflections determined on the basis of traditional and TC measurements (taking into account the subsidence of supports).
Figure 11.
The radar reflectors used in the study: (a) the view from the radar unit position, (b) the radar profile depicting the signal strength reflected from the structure.
Figure 11.
The radar reflectors used in the study: (a) the view from the radar unit position, (b) the radar profile depicting the signal strength reflected from the structure.
Figure 12.
The sequence of the span deflections during the static load patterns implementation recorded using total station (tacheometry).
Figure 12.
The sequence of the span deflections during the static load patterns implementation recorded using total station (tacheometry).
Figure 13.
The comparison of the deflection values of the observed points during the implementation of the static load patterns.
Figure 13.
The comparison of the deflection values of the observed points during the implementation of the static load patterns.
Figure 14.
Rbin23 observed with IBIS and TC. Note all the TC points are above the IBIS regression line.
Figure 14.
Rbin23 observed with IBIS and TC. Note all the TC points are above the IBIS regression line.
Figure 15.
Rbin39 observed with IBIS and TC.
Figure 15.
Rbin39 observed with IBIS and TC.
Figure 16.
Difference TC vs IBIS linear regression (LR). Note the increasing difference in the methods.
Figure 16.
Difference TC vs IBIS linear regression (LR). Note the increasing difference in the methods.
Table 1.
The characteristics of the distribution of the observed points.
Table 1.
The characteristics of the distribution of the observed points.
| North Side Point no. | South Side Point no. | Signal Type | Longitudinal Position | Vertical Position |
|---|
| 1002 | 2002 | geodetic prism | point of maximum deflection expected | top flange |
| – | Rbin39 | radar reflector |
| 1003 | 2003 | geodetic prism | point over the railway platform | top flange |
| – | Rbin23 | radar reflector |
| 1004 | 2004 | reflective tape | point over the railway platform | bottom of box girder |
| 1001 | 2001 | geodetic prism | reference point outside the bridge |
| Publisher’s Note: MDPI stays neutral with regard to jurisdictional claims in published maps and institutional affiliations. |
© 2020 by the authors. Licensee MDPI, Basel, Switzerland. This article is an open access article distributed under the terms and conditions of the Creative Commons Attribution (CC BY) license (http://creativecommons.org/licenses/by/4.0/).


