Mapping an Urban Boundary Based on Multi-Temporal Sentinel-2 and POI Data: A Case Study of Zhengzhou City


1
College of Environment and Planning, Henan University, Kaifeng 475004, China
2
Key Laboratory of Geospatial Technology for Middle and Lower Yellow River Regions, Ministry of Education, Kaifeng 475004, China
3
Institute of Urban Big Data, Henan University, Kaifeng 475004, China
4
Henan Industrial Technology Academy of Spatio-Temporal Big Data, Henan University, Kaifeng 475004, China
5
Key Research Institute of Yellow River Civilization and Sustainable Development, Henan University, Kaifeng 475004, China
*
Author to whom correspondence should be addressed.
Remote Sens. 2020, 12(24), 4103; https://0-doi-org.brum.beds.ac.uk/10.3390/rs12244103
Submission received: 10 November 2020
/
Revised: 11 December 2020
/
Accepted: 13 December 2020
/
Published: 16 December 2020
(This article belongs to the Special Issue Urban Land Use Mapping and Analysis in the Big Data Era)
Abstract
:Accurately identifying and delineating urban boundaries are the premise for and foundation of the control of disorderly urban sprawl, which is helpful for us to accurately grasp the scale and form of cities, optimize the internal spatial structure and pattern of cities, and guide the expansion of urban spaces in the future. At present, the concept and delineation of urban boundaries do not follow a unified method or standard. However, many scholars have made use of multi-source remote sensing images of various scales and social auxiliary data such as point of interest (POI) data to achieve large-scale, high-resolution, and high-precision land cover mapping and impermeable water surface mapping. The accuracy of small- and medium-scale urban boundary mapping has not been improved to an obvious extent. This study uses multi-temporal Sentinel-2 high-resolution images and POI data that can reflect detailed features of human activities to extract multi-dimensional features and use random forests and mathematical morphology to map the urban boundaries of the city of Zhengzhou. The research results show that: (1) the urban construction land extraction model established with multi-dimensional features has a great improvement in accuracy; (2) when the training sample accounts for 65% of the sample data set, the urban construction land extraction model has the highest accuracy, reaching 96.25%, and the Kappa coefficient is 0.93; (3) the optimized boundary of structural elements with a size of 13 × 13 is selected, which is in good agreement in terms of scope and location with the boundary of FROM-GLC10 (Zhengzhou) and visual interpretations. The results from the urban boundary delineation in this paper can be used as an important database for detailed basic land use mapping within cities. Moreover, the method in this paper has some reference value for other cities in terms of delineating urban boundaries.
1. Introduction
Following reform and opening up, China’s urbanization development level has been improving, and its progress of urbanization is remarkable. According to the statistics of China City Statistical Yearbook [1] and China Statistical Yearbook [2], from reform and opening up to 2018, China’s urbanization rate increased from 17.92% to 59.58%. The urbanization rate of Zhengzhou increased from 13.6% to 50.16%. Urban development and expansion have promoted regional economic development, population mobility, and changes in regional land-use patterns and modes. The city is an important carrier of the new urbanization development, and the development quality of urban spaces is directly related to the development of China’s new urbanization. In the accelerating process of urbanization, urban sprawl and the construction of chaotic urban boundaries can occur [3]. Low-quality urbanization development and unreasonable land-use planning are not only detrimental to the healthy development of cities but also to China’s social and economic development. The phenomenon in the development of low quality urbanization has urbanization inconsistent with its economic development, low utilization rate of urban, urban sprawl and unreasonable land use, etc. Some scholars prove that the community with reasonable planning and high-density development has higher utilization efficiency of private investment and public infrastructure investment than that of low-density community [4,5]. To this end, China has managed urban sprawls by requiring the delineation of urban boundaries. The National New Urbanization Plan (2014–2020), released in 2014, clearly states China’s urbanization development goals; namely, to optimize the structure of national urban spatial structures and patterns, to further optimize the pattern of urbanization, to steadily promote the level and quality of national urbanization improvement, and to realize sustainable urban development. Therefore, the quick, accurate mapping of urban boundaries can accurately grasp the spatial scale and form of urban development and understand the urbanization process [6]. Only by accurately understanding the current urban development situation can targeted and reasonable development planning schemes be formulated, and overall planning be improved. Controlling the urbanization process is of great significance to promoting intensive and compact urban development and to further improving land use efficiency.
With the deepening of people’s understanding of urban space and the development of technology, a major focus of urban future spatial planning and development is to establish a kind of spatial strategic standard with maneuverability and different research scope in order to delineate actual urban boundaries, which facilitates the quantitative calculation and analysis of other urban data indicators. However, the concept and delineation of urban boundaries do not follow a unified standard. Both domestic and overseas scholars have long been proposing the urban administrative boundary, urban development boundary, urban growth boundary, and urban built-up area boundary, all of which are similar to the urban boundary, in order to study urban scale and form [7,8]. These concepts of "boundaries" are very similar; therefore, it is necessary to distinguish these concepts so as to avoid confusion. An urban boundary is the boundary that separates urban and rural areas. It is a constantly changing region during urban expansion [9]. The boundary of an administrative division is the legal boundary of a city and has legal significance. It is inappropriate to discuss the actual boundary of a city based only on a boundary of an administrative division. In the actual development process, the city plays an important role in national or regional development. In fact, in the urban-rural boundary zone, there is a kind of fuzzy, mixed and transitional unique space. This space has the typical characteristics of urban mixed land use, and is the pilot area of urban development, reflecting the interaction between urban and rural areas and the complex human-land relationship [10]. An urban boundary is the boundary that separates urban and rural areas. It is a constantly changing region during urban expansion [9]. As a functional area, a city is mainly embodied by human beings, and human activities are of great significance to the delineation of urban boundaries.
When it comes to solving urban problems, the remote sensing image has the characteristics of a high resolution, accurate ground information, and fast acquisition. It is a common method for identifying urban boundaries [11]. Many researchers have tried to extract urban construction land at the resolution of images. Medium and high spatial data from sources such as Landsat, the Moderate Resolution Imaging Spectroradiometer (MODIS), Defense Meteorological Satellite Program-Operational Linescan System (DMSP-OLS) nighttime light data, National Polar-orbiting Operational Environmental Satellite System Preparatory Project-Visible Infrared Imaging Radiometer (NPP-VIIRS) nighttime light data, Sentinel-1/2, and so on, have achieved good results [12,13,14,15,16,17,18,19,20]. The above research methods use remote sensing technology and have achieved good results in the study of extracting urban boundaries, but ignore the important role of human microscopic behaviors in the formation of urban boundaries. Other researchers have added POI data. An urban boundary can be effectively identified through the density distribution of POI, which proves the possibility of POI data identification in urban-scale urban boundaries [21,22]. Although POI data have been recognized by many scholars for their significance in the study of urban development and have effectively improved the accuracy of boundary recognition results, problems still arise when using POI data such as excessively smoothing boundaries, abstracting boundaries, and lacking in details when the kernel density is estimated [23,24,25].
Obtaining data nowadays is no longer a difficult problem. The current research focuses on how to make good use of the existing data in order to carry out data mining much more effectively and deeply. Through the combination of data from multiple sources, many scholars have actively explored the realization of the large-scale, high-resolution, and high-precision mapping of urban areas. At present, the latest 30 m global land cover products that have been announced are FROM-GLC [26], FROM-GlC-seg [27], improved FROM-GlC-agg [28], GlobalLand30 [29], the Global Urban Land Data Product [30], and GAIA [31]. With the continuous improvement of the spatial resolution of remote sensing images, the spatial resolution of FROM-GLC10 [32] has been raised to 10 m, and the classification accuracy is also constantly improving. Although Gong et al. [32] explored global land cover based on random forest (RF) models by using multi-source remote sensing data and social media data, the FROM-GLC10 product has had very big promotion of mapping global land cover in resolution. However, in some small areas, the accuracy of the FROM-GLC10 [32] product and other products [26,27,28,29,30,31,32] fail to meet application requirements, and the coverage is slightly inconsistent with the actual situation. Urbanization expansion monitoring and land space governance have a demand for high-precision urban boundary mapping products. Also, there is no high-precision urban boundary mapping product and comparison products that can be used exclusively for small-scale regional applications. Therefore, we hope to find a method that not only accurately and quickly realizes urban boundaries mapping on small- and medium-sized scales by utilizing remote sensing images and social auxiliary data reflecting human activities, but also provides a reference for urban mapping at a certain scale under the objective and quantitative analysis of urban functional spatial structures. This study aims to improve the accuracy of small-scale urban boundary mapping products and provide a similar product for comparison to enhance the richness of small-scale urban boundary mapping products quantity, thereby providing a decision support tool for the reasonable land use classification mapping within the city, and for the healthy development of the city in the future, which meets the actual need of solving the problem of urbanization expansion monitoring and land space governance in China.
We take Zhengzhou as a case study and present a more accurate small-scale urban boundaries product that has been developed by extracting multi-dimensional features from multi-temporal Sentinel-2 images in a year and the indexes of the images, and combining with the POI data to describe the urban spatial structure in detail. In the method, the RF algorithm and mathematical morphology are adopted to realize the accurate urban boundary mapping of Zhengzhou with a resolution of 10 m. We attempt random sampling and group training using the RF algorithm in order to obtain the most accurate results. Then, its urban boundary morphology is further optimized using mathematical morphology. By comparing the precision of the products, we improve the small-scale urban boundary mapping process and produce a high-precision urban boundary product that can meet the needs of small- and medium-scale applications.
2. Study Area and Data Sources
2.1. Study Area
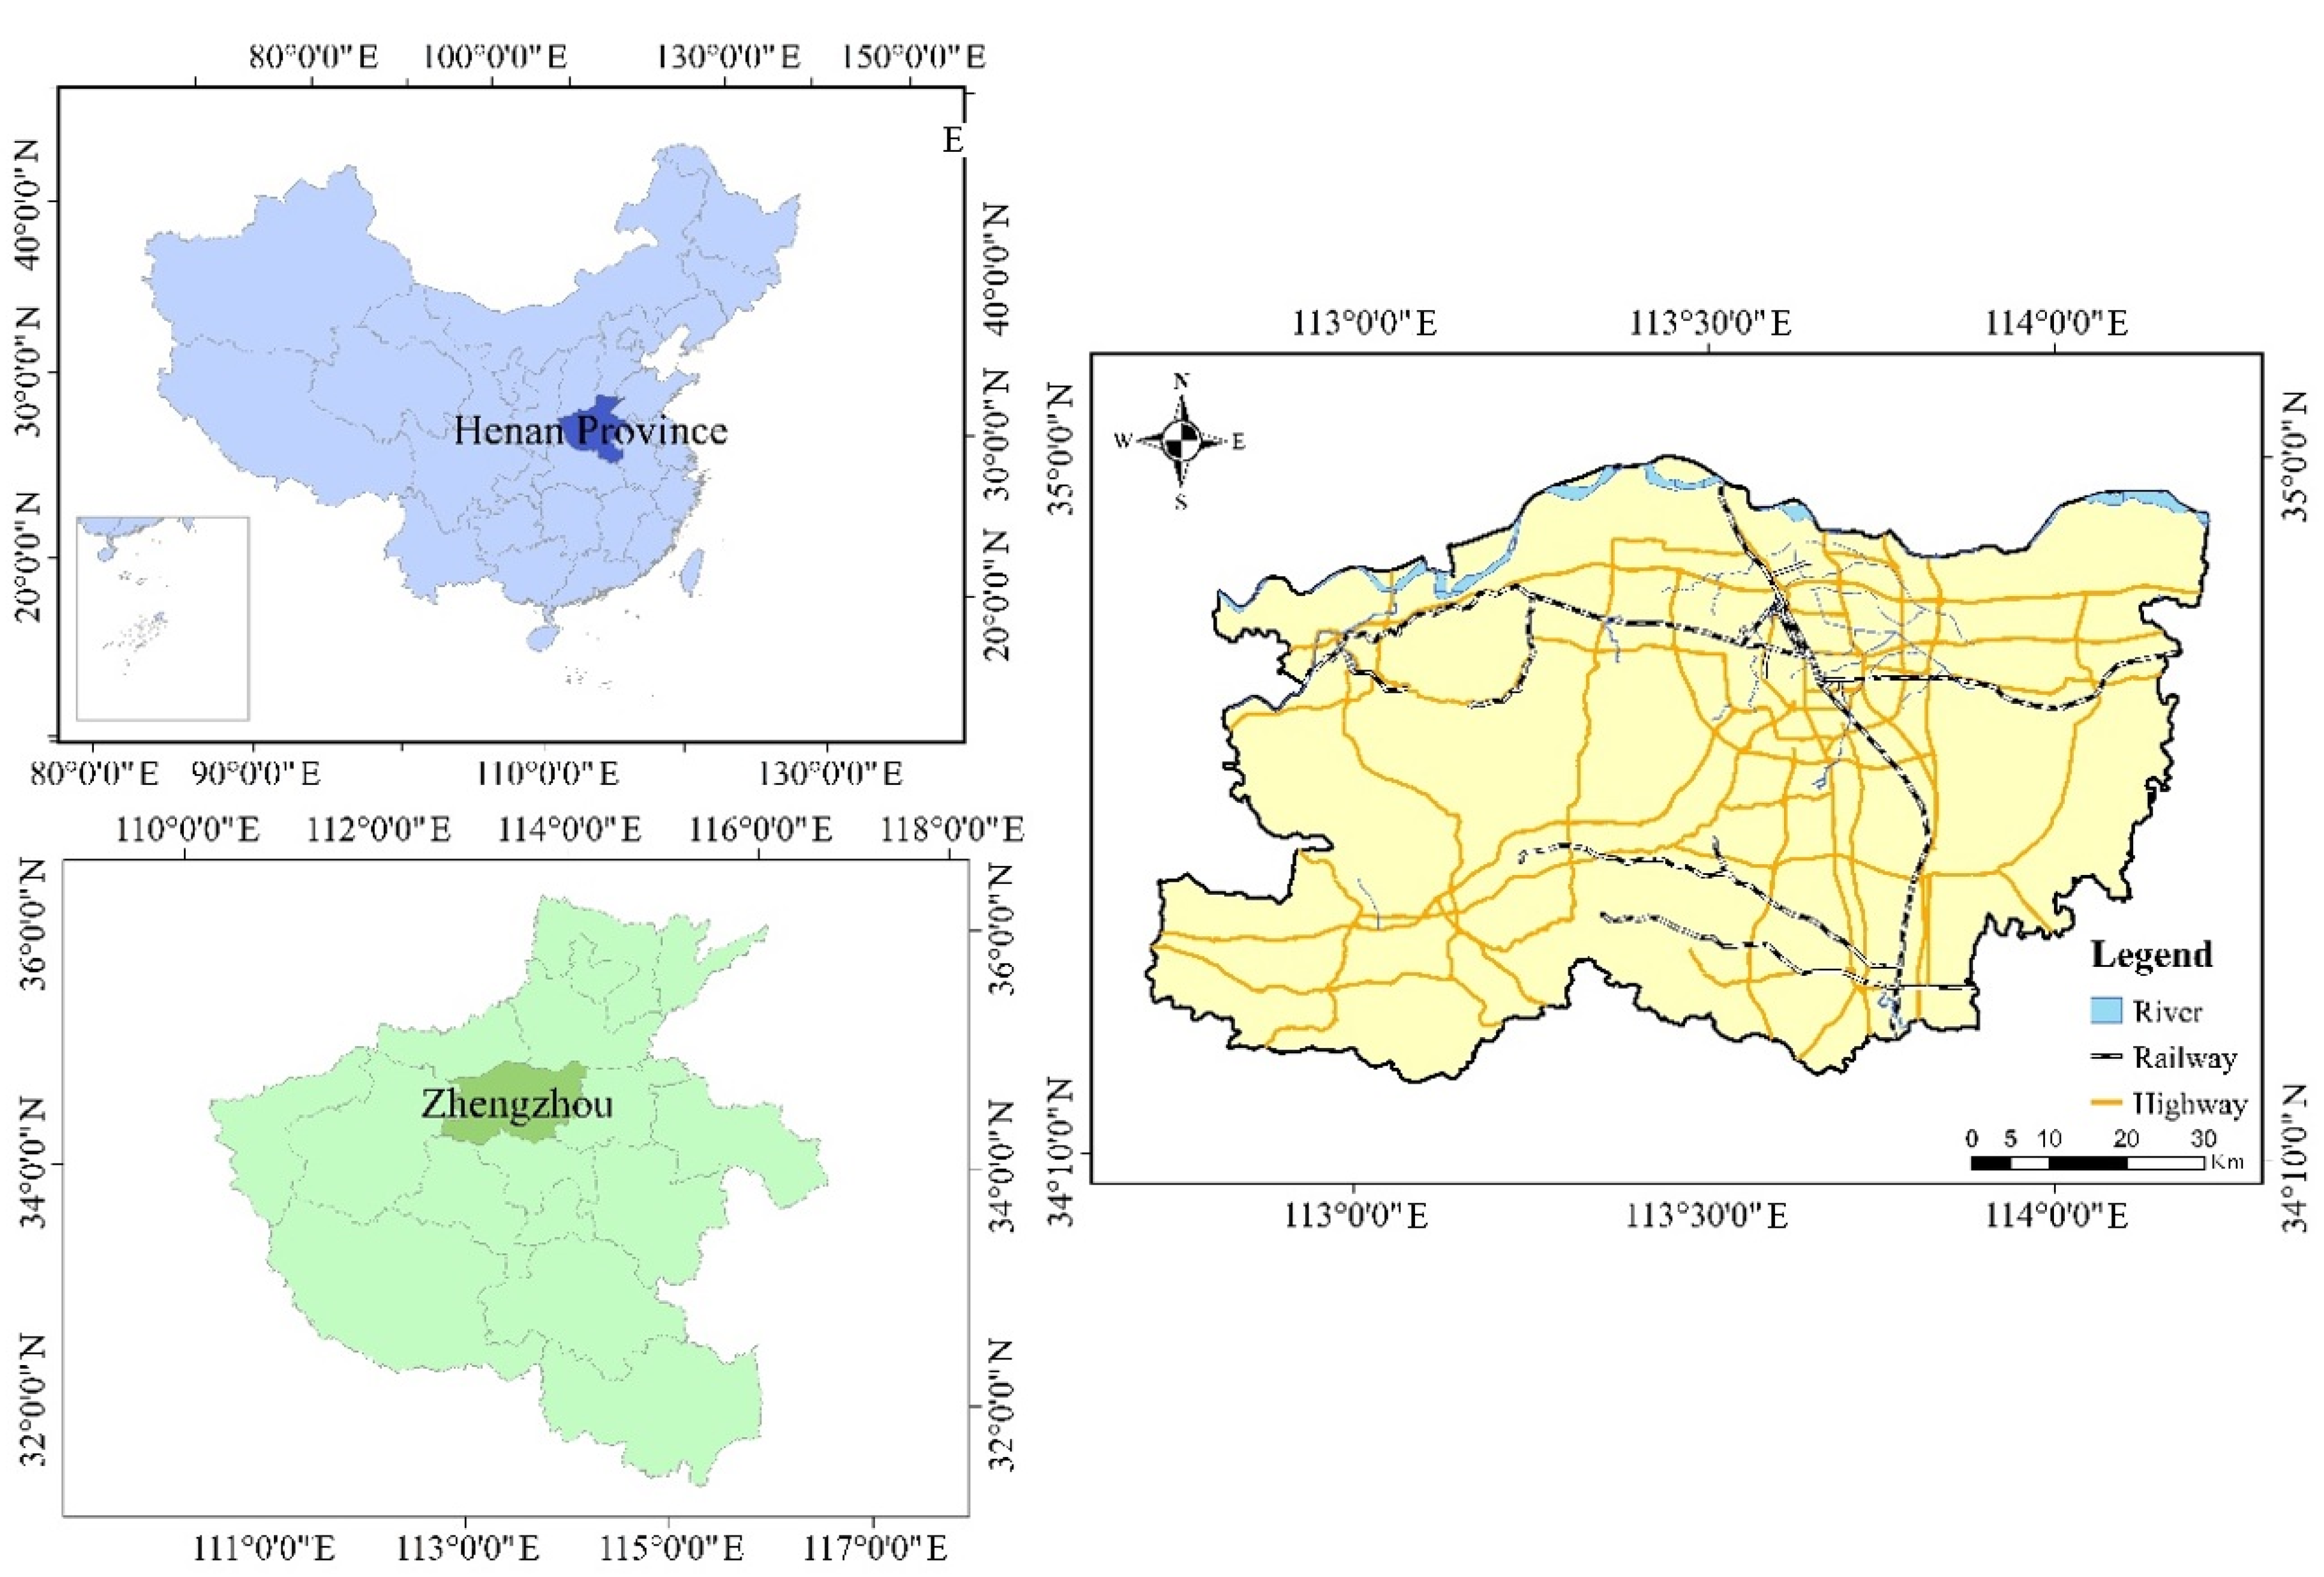
Zhengzhou, located in the hinterland of the central plains, is an important, central city in central China, and is the center for the politics, economy, culture, transportation, communication, and technology in Henan Province. Zhengzhou is located between east longitude 112°42′−114°13′ and north latitude 34°16′−34°58′ (see Figure 1). It is 137.132 km wide from east to west and 80.792 km long from north to south. The administrative area of Zhengzhou covers a total area of 7446 km2, and the urban area is 1010 km2. Zhengzhou is divided into one main urban area, five county-level cities, and one county. The main urban area includes six municipal districts: Jinshui District, Erqi District, Huiji District, Zhongyuan District, Guancheng District, and Shangjie District. The five county-level cities include Dengfeng, Gongyi, Xinmi, Xingyang, and Xinzheng, and there is one county in Zhongmu County. From 2010 to 2017, Zhengzhou’s urbanization construction land increased from 315.7 km2 to 549.33 km2. Compared with 2010, the area of urban construction land in the main urban area increased by 54.1 percent in 2017.
2.2. Data Sources and Pretreatment
2.2.1. Sentinel-2 data
Sentinel-2 high-resolution multi-spectral images are characterized by their high resolution, real-time, fast updating speed, and abundance of feature information about ground objects. They are widely used in the urban construction land extraction. The shape and texture information of urban construction land contained within a high-resolution remote sensing image is very prominent, and it provides a great advantage in urban construction land extraction.
All preprocessed Sentinel-2 data on Zhengzhou in 2018 were downloaded from the USGS (https://earthexplorer.usgs.gov/) as the primary data source. Due to the influence of cloud cover, there may not be images suitable for research and analysis in some months, so we choose images from nearby months to replace them, and try our best to shorten the photo-taking time between two images to be synthesized into one image. Eight Sentinel-2 images of Zhengzhou were selected to produce four high-resolution multi-spectral remote sensing images in February, June, September, and November 2018. The selected image data are shown in Table 1. The remote sensing image of Zhengzhou is shown in the Figure 2.
2.2.2. POI Features
Point of Interest (POI) data are a type of data that contain basic information about cities with specific geographic space identification characteristics such as name, category, attribute, latitude, and longitude. POI big data contain accurate location information and rich attribute information, which directly reflect the intensity range of human activities.
We used the POI data on Zhengzhou city in 2018 provided by Baidu Map, which contained 72,061 pieces of data. After the POI data are screened, eliminated, and merged, the POI data are classified by attributes considering the research requirements of this paper. POI data are divided into five representative categories, including administrative centers, residential communities, public services, commercial centers, and transportation.
3. Method
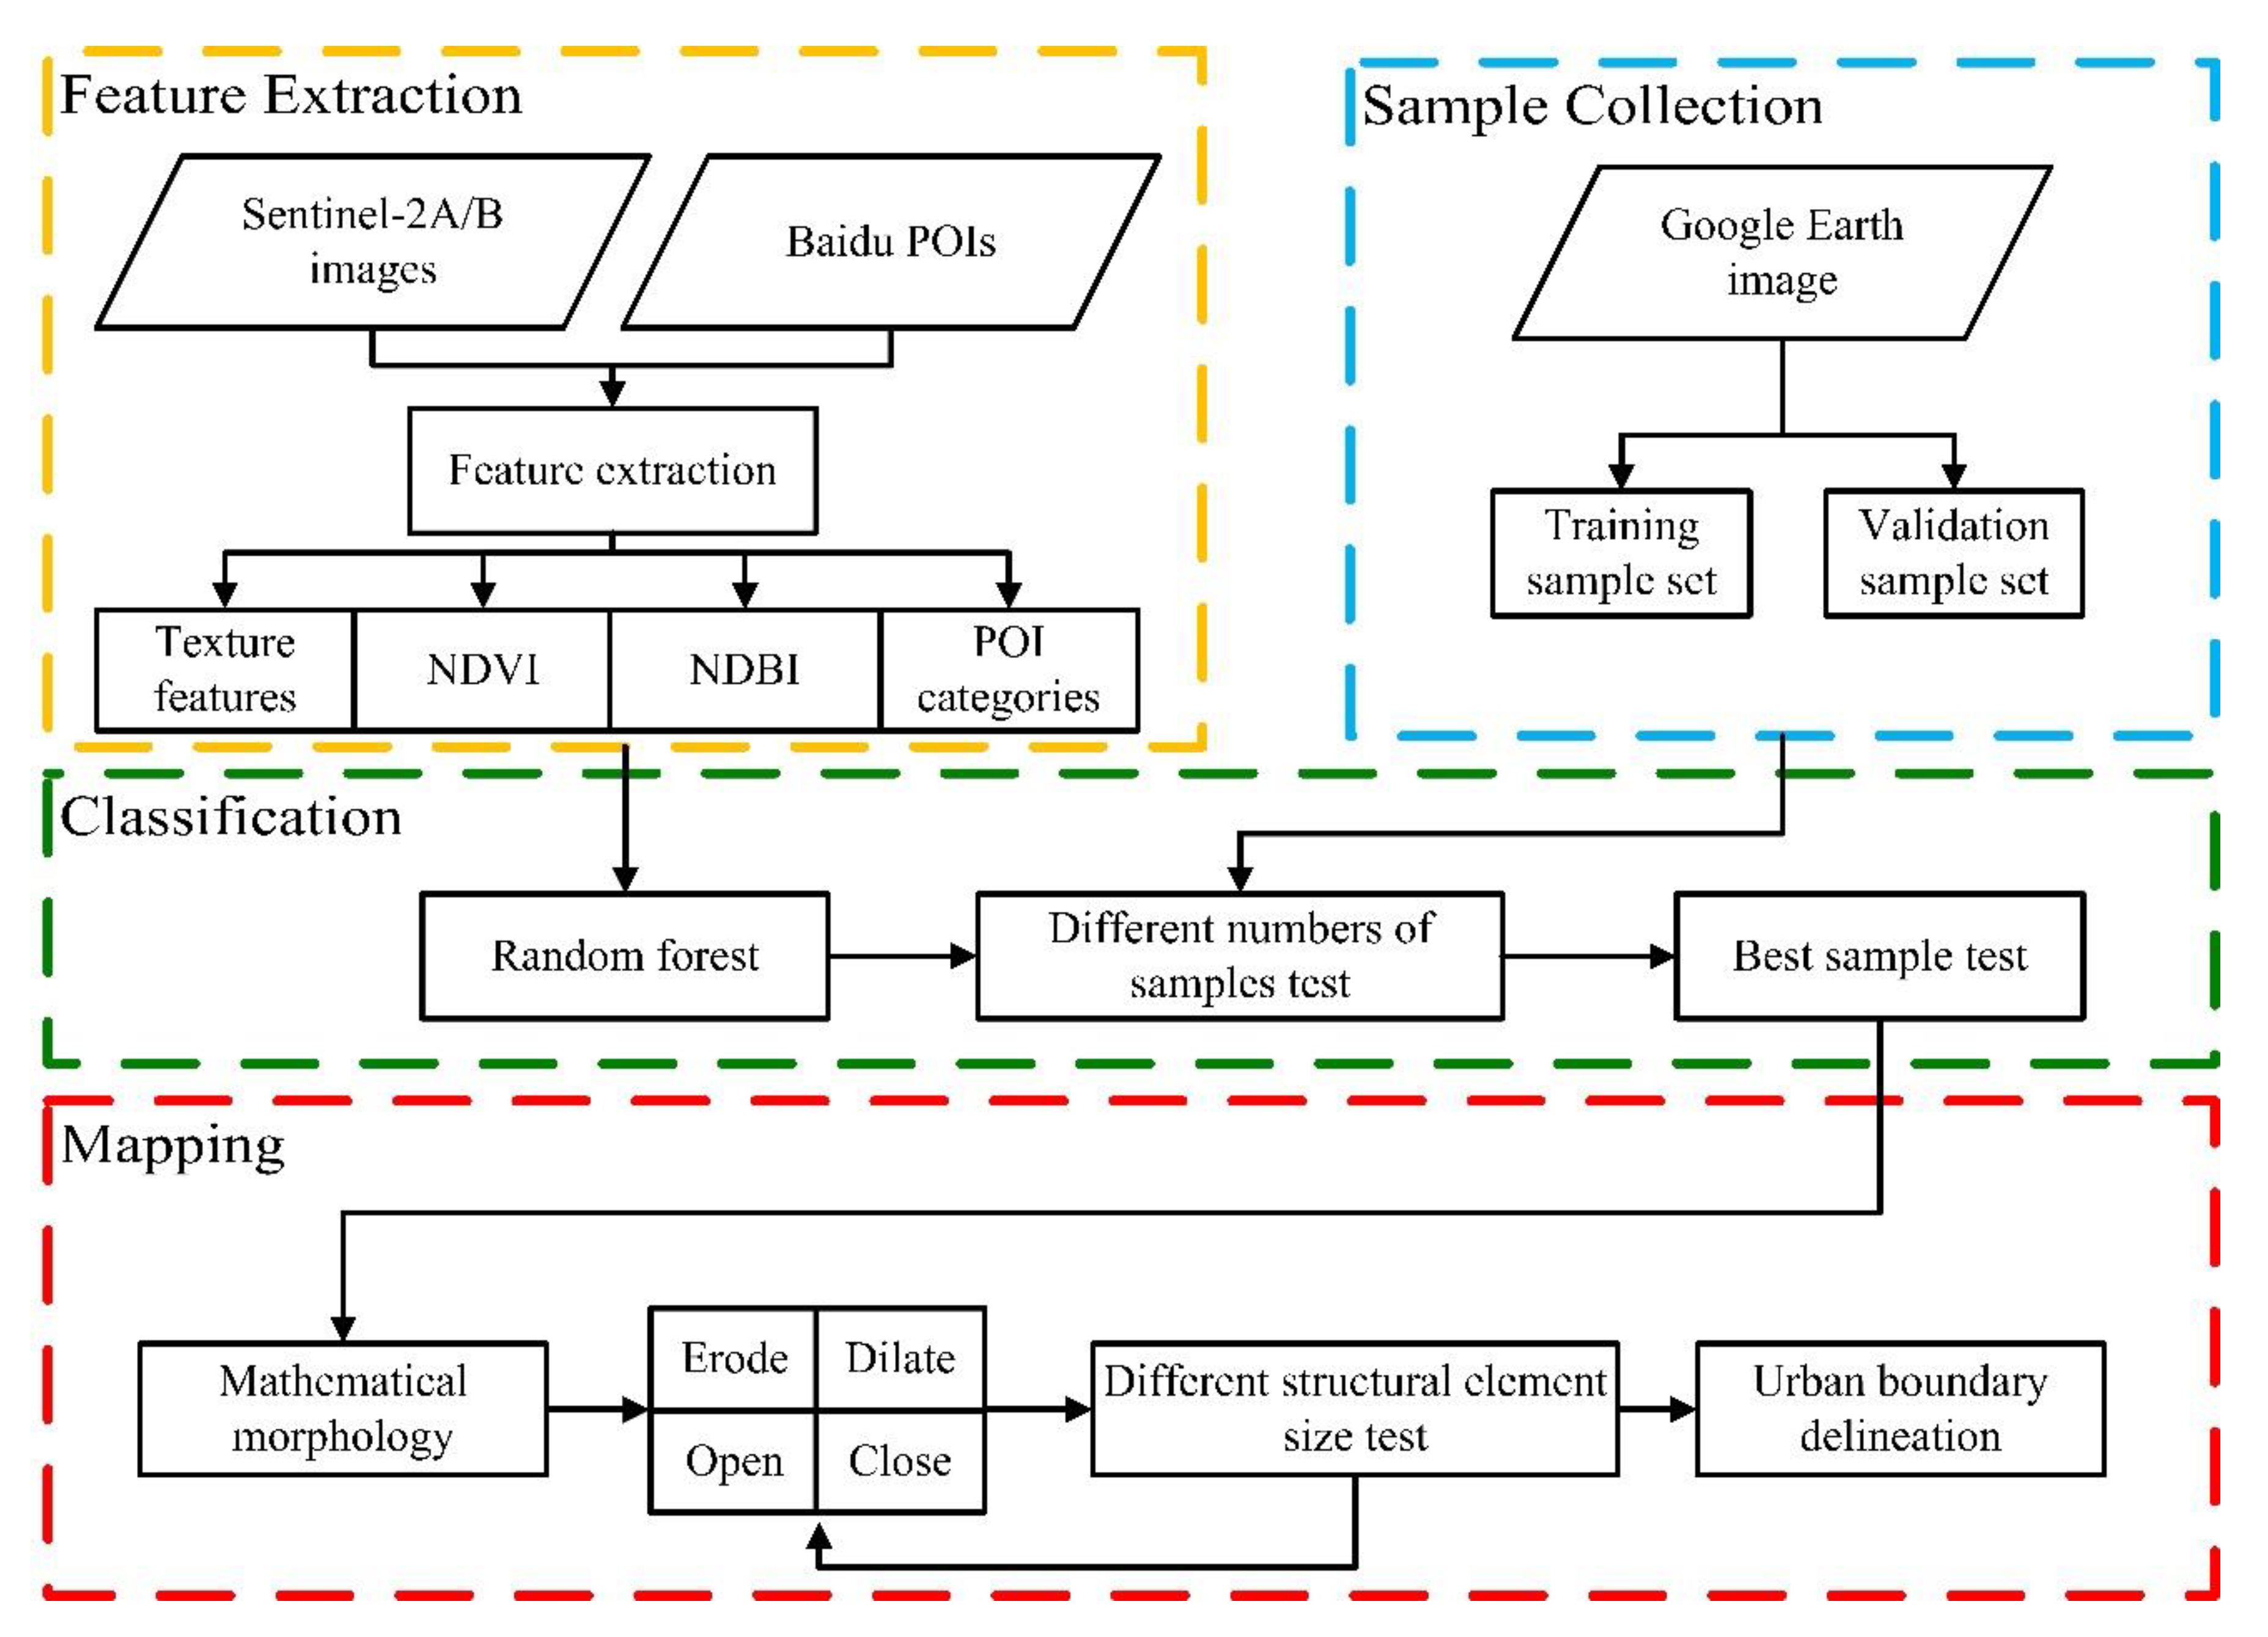
The Sentinel-2 and POI data were used to extract multi-dimensional features, and the RF algorithm and mathematical morphology method were combined to realize the mapping of the Zhengzhou city boundaries. The specific process (Figure 3) is shown below, and consists of (1) extracting the texture features, spectrum features, and human activity features of construction land in Zhengzhou from Sentinel-2 and POI data, and combining multiple features; (2) establishing the sample data set through a visual interpretation of Google Earth high-resolution images; (3) setting different sampling proportions of training samples and verification samples and setting different control groups; (4) establishing an urban construction land extraction model based on the RF algorithm to realize the classification of urban construction land. Based on the verification samples, a confusion matrix was established and the Kappa coefficient was calculated to evaluate the accuracy of the model; (5) selecting the training results from the training group model with the highest accuracy, and using the mathematical morphology to optimize the boundary so as to realize the research on urban boundary mapping in Zhengzhou City.
3.1. Feature Analysis and Extraction
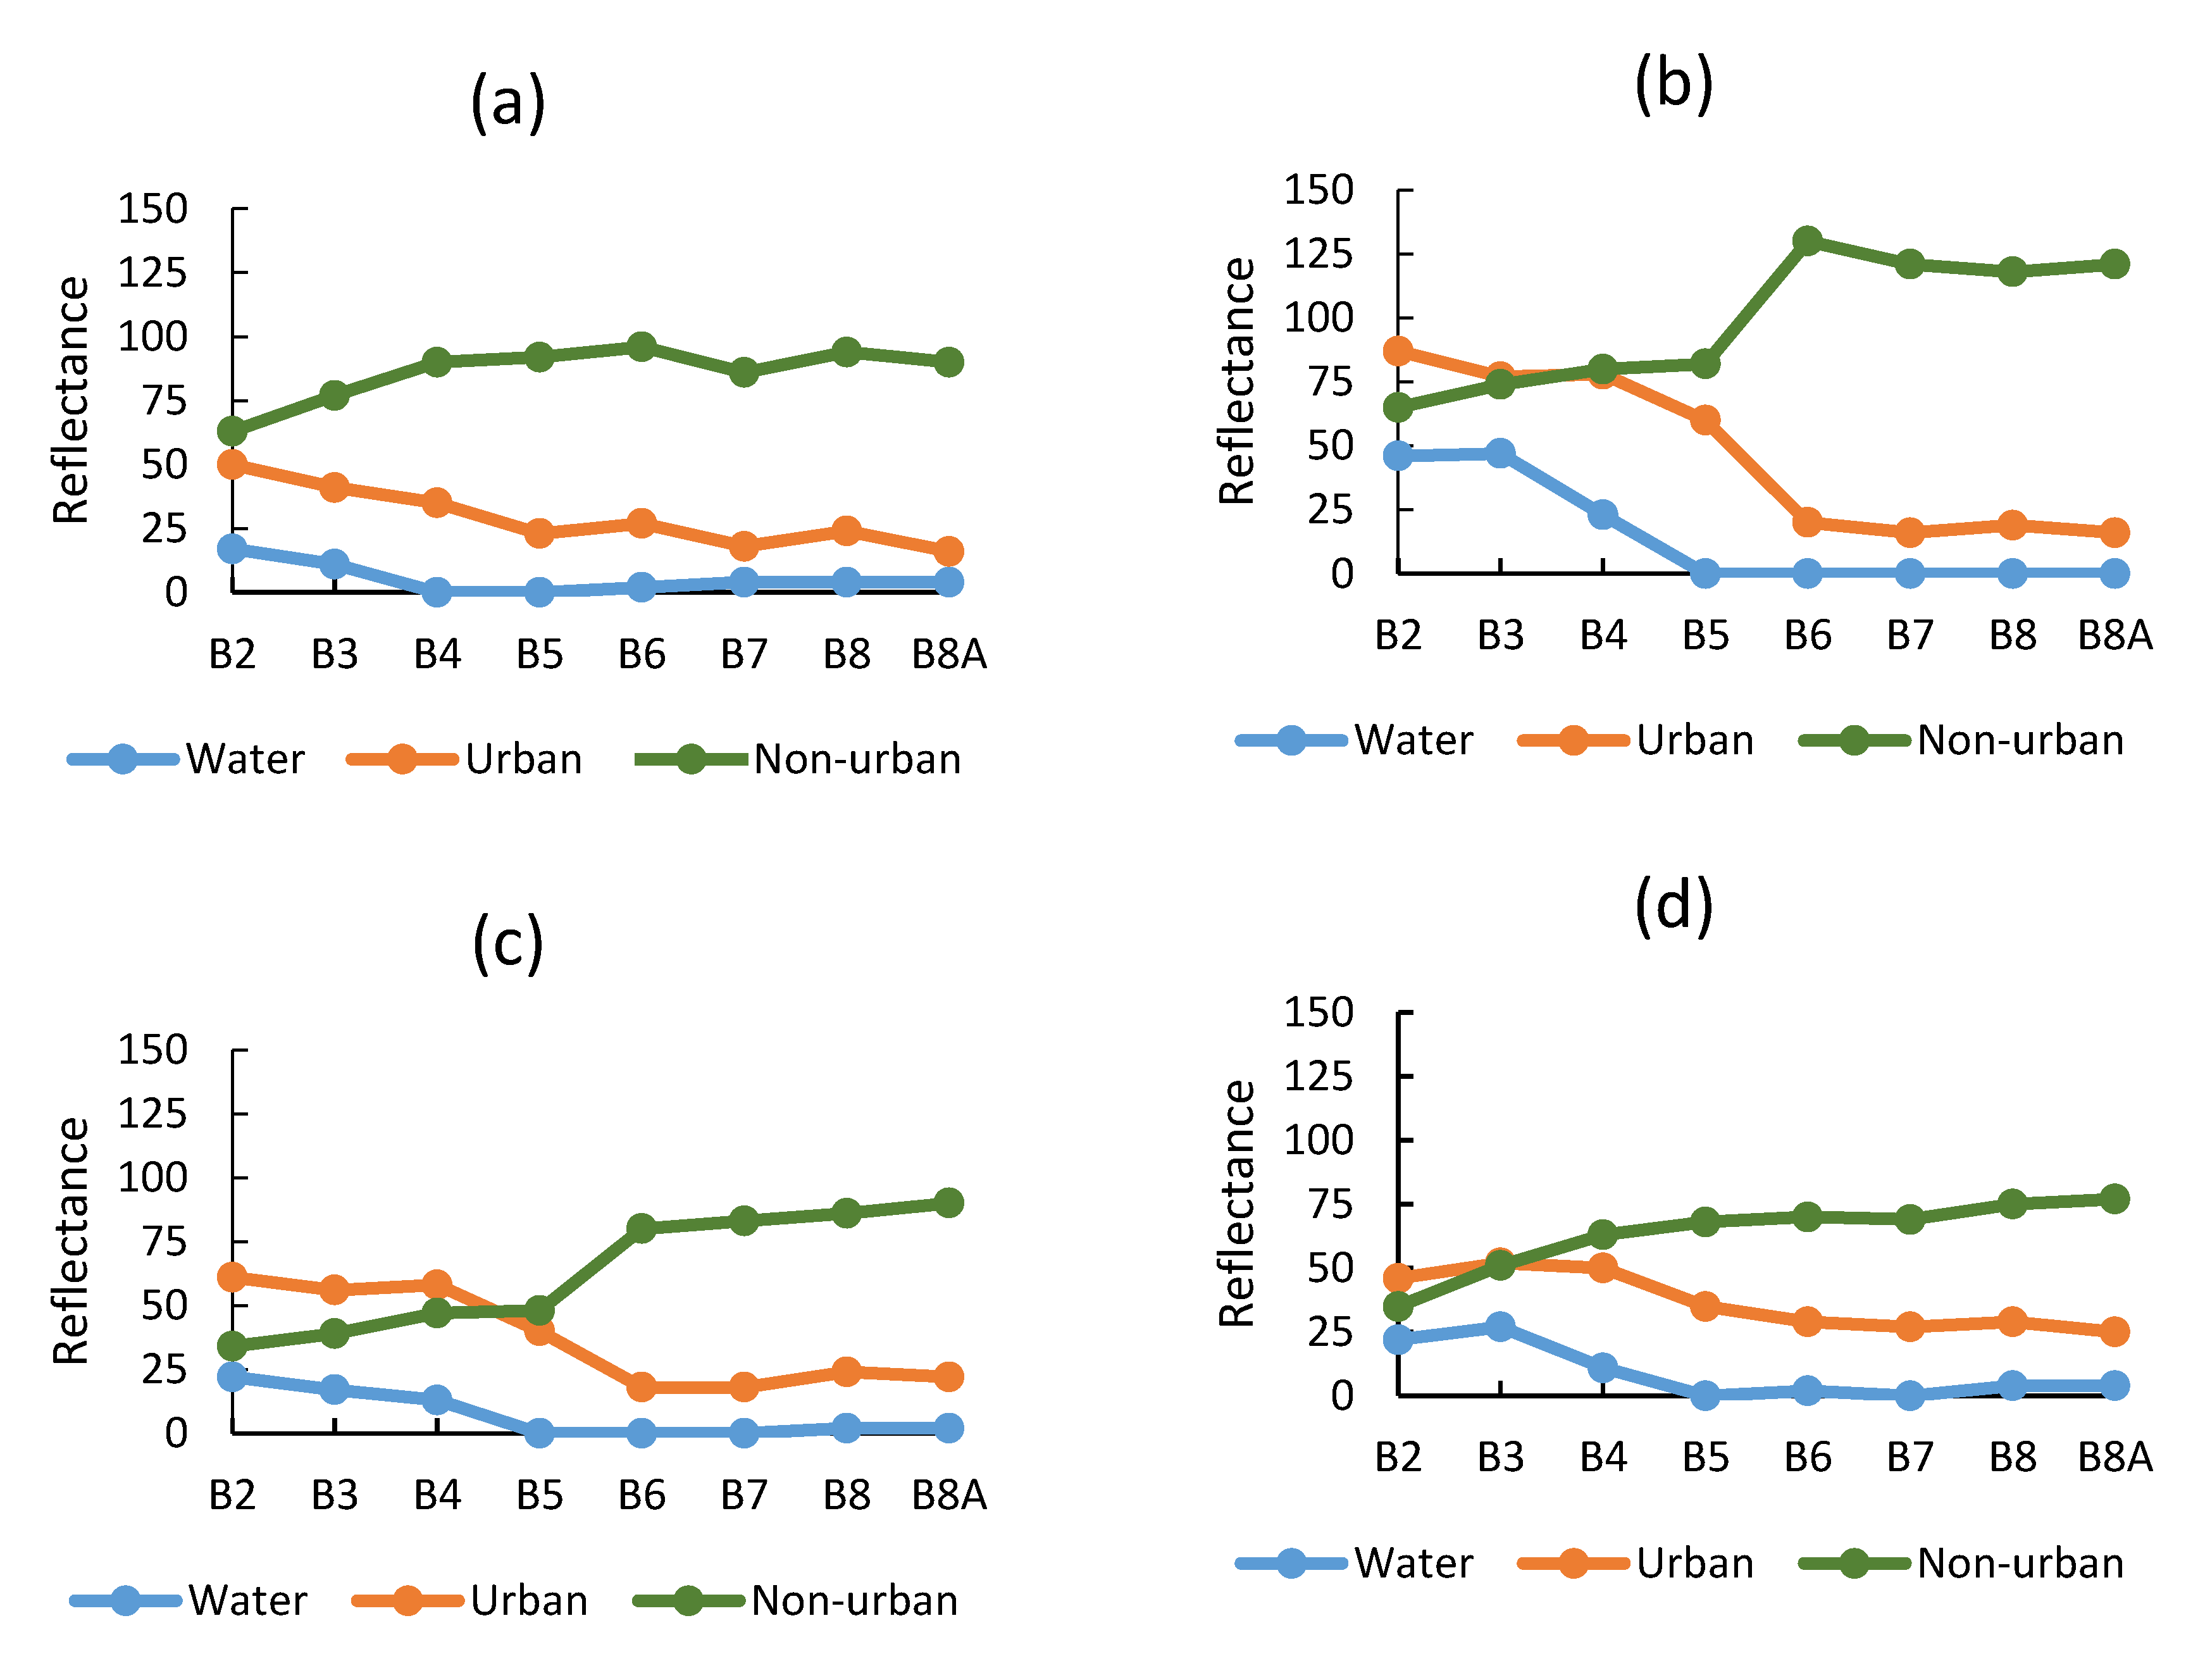
High-resolution multi-spectral images can provide abundant spectral information because different types of objects have different spectral reflectance. Based on the research content of this paper, the main land use type in the research area is divided into an urban area, non-urban area, and water. Eight bands are selected for each image, including band 2, band 3, band 4, band 5, band 6, band 7, band 8, and band 8A. We extracted the spectral reflectance of the different types of sample data from Sentinel-2 multi-temporal images and then calculated the mean reflectance of each type (Figure 4). It can be seen from Figure 3 that there is a significant difference in the reflectance of water. However, in different seasons, the two land use types of urban area and non-urban area have different degrees of confusion in the blue (B2), green (B3), red (B4), and red-edge (B5) bands. Therefore, texture features, the NDVI mean, and the NDBI mean should be used to improve recognition accuracy.
POI data contain accurate location information and rich attribute information, which directly reflect the intensity and scope of human activities. In some areas outside the urban fringe, there are also a large number of population activities, where economic and social activities are closely related to the city, but they are still rural in spatial form and structure, which are difficult to identify by remote sensing interpretation. Including POI data contributes to the precision of urban boundary delineation. In this study, we estimate the kernel density of administrative centers, residential communities, public services, and commercial centers, and process the Euclidean distance to analyze transportation. A total of five POI feature input variables are obtained.
In summary, a total of 4 × 4 × 8 + 2 + 5 = 263 impact factors were preliminarily selected as the model input variables to establish the model feature library (see Table 2).
3.2. Model Building
3.2.1. Random Forest Model
Random Forest (RF) algorithm is a new integrated learning method and it was first proposed by Leo Breiman and Adele Cutler in 2001 [33,34]. As a decision classifier integrated into multiple decision trees, the RF algorithm introduces randomness and then obtains a better effect than general decision trees. Compared with other decision trees, it is more robust and has better generalization performance. Based on the randomness of the RF algorithm and the independence of the decision tree, the RF algorithm is also very effective in the case of multi-dimensional features, the parallel efficiency is also very high, and the over-fitting phenomenon does not occur easily. The specific learning process of RF is as follows. First, n samples are randomly selected from the training sample N and are put back as input samples of the decision tree. The unselected data are called out-of-bag (OOB) data. Since all the samples obtained from each tree will not be drawn during each training, the over-fitting phenomenon is avoided. Then, m (m = ) features are randomly selected from M sample features as each input sample feature, and then the optimal splitting of the m sample features is taken as the splitting rule of this node. Finally, each decision tree grows to its maximum without pruning. The RF algorithm is expressed as {h(X, θk), k = 1,2,…,K}, where K represents the number of the decision tree in the RF algorithm. The sample set N is expressed as {(xi, yi), xiX, yiY, i = 1,2,…,M}, where M is the sample size, the element in X is the attribute feature vector, and Y is the sample category. In training the model, we select 500 decision trees for the parameter N.
3.2.2. Samples for Training and Validation
In order to accurately obtain the information on urban construction land, an appropriate sample database was established. According to the research requirements of this paper, Google Earth images are used in order to sample the urban construction land and non-urban construction land in the study area. Through visual interpretation, a total of 200 samples were collected within the study area of Zhengzhou, including 100 samples of urban construction land and 100 samples of non-urban construction land.
In order to select an appropriate number of training samples, we conducted a set of experiments to set different numbers of training samples and verification samples, and set up 19 different groups, respectively. The number of training samples in each group was increased randomly by 10, including five urban construction land samples and five non-urban construction land samples, and gradually increased to 190. The number of verification samples is randomly reduced by 10, including five construction area samples and five non-construction area samples, and successively reduced to 10 (see Table 3).
3.3. Urban Boundary Delineation Based on Mathematical Morphology
Mathematical Morphology
The basic operations of mathematical morphology include dilation, erosion, opening, and closing [35]. It is a commonly used boundary structuring method. Its main purpose is to eliminate the noise, void, and other factors that affect the image structure by selecting appropriate structural elements to carry out dilation, erosion, and other operations on the target image [36].
(1) Erosion. After erosion, the image shrinks in comparison with the original image. Erosion is defined as:
where X is the original image and B is the structural element. This formula represents the set of X that is still in X after eroding B.
(2) Dilation. Dilation can be thought of as an erosion duality. After dilating, the is expanded compared with the original image. Dilation is defined as:
In the equation, X is the original image and B is a structural element. Set B translated by x is represented by (B)x, (B)x={y|y = b + x, bB}. is B’s reflection of the origin, = {y|y = −b, bB}, which namely image of each point in B take the result. The dilation formula expressed that X dilates with the structural element B. B will do reflection about the origin first to get . Then, set translates x to obtain ()x. Also, ()x and the intersection of X is not null.
(3) Opening and Closing. Opening and closing are quadratic operations of erosion and dilation, and they are also a pair of dual operations. In opening, the original image X is first eroded and then dilated, which is represented by the symbol:
‘Closing’ is first dilated and then erodes the original image X, which is represented by the symbol:
3.4. Tests to Determine the Validity of the Results
In order to verify our results, we compared the extraction results of this paper with both the visual interpretation results in 2018 and the FROM-GLC10(Zhengzhou) product published by Gong et al. [32]. This needs to be verified not only from the delimited urban boundary range but also from the location of the delimited urban boundary. The matching value (P) is the percentage of the area in our results () divided by the area of other urban boundary products (). To calculate the accuracy of boundary location (R), it can be obtained by calculating the ratio of overlapping grids. First, we calculate the intersection of the total number of grid sets in our results () and the total number of grid sets of other products , and then the union of set and set is calculated. The intersection of set and set is divided by the union of set and set , and multiplied by 100 percent to obtain the ratio of overlapping grids. The specific formula is as follows:
4. Results
4.1. Classification Results Based on Different Samples for Training
The training results from each group are shown in Figure 5. The results of the urban construction land extracted are in line with the actual situation, and the main urban areas and the patches of urban construction land in county-level cities are relatively clear. Due to the different numbers of training samples in each group, the training results from the model were slightly different, with no significant difference inside the plaque and a significant difference at the main plaque boundary. There is also some noise inside the patch. Some areas within the urban boundary that belong to the urban area are classified as non-urban areas by the model, which may be related to the selection of training samples. The edges of the urban patches in the main urban areas and county-level cities are very messy and fragmented.
4.2. Comparison Results of Classification Accuracy of Different Training Samples
By establishing a confusion matrix and calculating the Kappa coefficient to evaluate the accuracy of the urban construction land extraction results of each group, different results are obtained (Figure 5). Figure 6 shows the comparison of the overall accuracy (OA) and the Kappa coefficients of the training samples and verification samples with different sampling ratios. We found the following: (1) the OA increases with the increase in the number of samples; (2) when the number of training samples is increased to 130, which includes 65 training samples and 65 verification samples, and the training samples account for 65% of the sample data set, the model has the highest accuracy, reaching 96.25%, and the Kappa coefficient is 0.93; (3) when the number of training samples exceeds 130 and continues to increase, the OA begins to decline significantly.
4.3. Importance of Multi-Dimensional Features for Urban Areas
In order to further explore the influence of each characteristic variable on classification accuracy, the importance of 263 characteristic variables is calculated, all of which differ greatly. In view of the large number of features, features with an importance greater than 0.5 were selected for analysis (see Figure 7).
In general, there are 31 features that contribute more than 0.5, including 28 texture features, one build-up index feature, and two POI features. The significance of Mean_06b8a, NDBI mean, Mean_09b8, and Mean_06b7 are the greatest, indicating that the mean value of band 8a in June, the NDBI mean, the mean value of band 8 in September, and the mean value of band 7 in June make the greatest contribution to the extraction of urban construction land. The visible light band, red edge band, and near-infrared band have a significant effect on land cover classification. The mean of the GLMC reflects the mean value of the gray scale of the image elements, which is the brightness feature of the images, and makes a significant contribution. It can be seen that there is a significant difference in the brightness of the remote sensing images of urban construction land and non-urban construction land, which is conducive to distinguishing between them. Dissimilarity_09b2, Correlation_09b2, Entropy_09b2, and SecondMoment_09b2 contribute significantly and equally to the extraction of urban construction land.
All texture features of the four time-phase images contribute to the identification of urban construction land. Multi-temporal images play an important role in the classification of urban construction land, which reflects the importance of texture features in increasing the classification accuracy, and are suitable for the urban land use classification of high-resolution image. Among the 28 texture features whose contribution is greater than 0.5, there are nine mean values, five entropies, five variances, four correlations, three second moments, one dissimilarity, and one homogeneity (see Figure 7). The texture features of September contributed the most in the first 31 features, followed by February, June, and November (see Figure 8). Also, the mean value contributed the most among 28 texture features in the first 31 features, followed by variance, entropy, correlation, second moment, dissimilarity, and homogeneity (see Figure 9).
Compared with the texture features of Sentinel-2 image data, POI features have little influence on the extraction of urban construction land. Among the POI features, different types of POIs have significant differences in the importance of features. The two types of POI; namely, residential communities and public services, contribute the most to the classification of urban construction land, while the other three types (administrative centers, commercial centers, and transportation) contribute less than 0.5, and are thus, less important, relatively speaking.
4.4. Comparison Results of Different Structural Element Sizes of Urban Boundary Delineation
Although the accuracy of the model extraction is relatively high, it can be seen from Figure 4 that the extracted raster image of the urban construction land tends to one or more closed areas. However, lakes, grasslands, and other unrecognized “holes” within the urban boundary need to be filled, and the edges of patches of major urban construction land are disordered and highly fragmented. In order to obtain a complete urban boundary, we present a mathematical morphology algorithm to optimize the boundary according to the regional connectivity characteristics of urban construction land [37].
In this paper, we attempt to combine open and close. First, ‘close’ is used to fill the internal cavity of the image. Then, ‘open’ is used to eliminate some noise around the image and smooth the patch boundary of the major urban construction land. Finally, the urban boundary is delineated to realize the mapping of the urban boundary. We set 10 different structural element size tests for selection for the experimental comparison of urban boundary delineations. The structural element sizes 3 × 3, 5 × 5, 7 × 7, 9 × 9, 11 × 11, 13 × 13, 15 × 15, 17 × 17, 19 × 19, and 21 × 21 were respectively used to process close and open on each grid on the detection image. The experimental results are shown in Figure 10:
Through experiments, we choose the 13 × 13 size of the structural elements, which can better realize the boundary delineation of Zhengzhou city. It can not only fill in some empty internal boundaries that belong to the urban construction land in the city but can also eliminate a lot of noise outside of the main urban construction land patches, make better connectivity between county and city areas, and make the edges of urban construction land patches smooth and strongly continuous. It could make urban boundaries clear and better reflect the multi-core urban regional outline of Zhengzhou. According to the method in this paper, we finally obtain the urban boundary of Zhengzhou (see Figure 11).
From Figure 11, it can be seen that there is a difference between our results and other products. A visual interpretation is the result of complex analysis by the human brain. Our result is based on machine learning and does not learn urban structure as deeply as the human brain. On the whole, the boundary we have delineated is larger than the results of the visual interpretation product and is slightly different from FROM-GLC10 products.
By calculating the area matching value, the number of overlapping grids, the proportion of overlapping grids, the delimited boundary range, and location of Zhengzhou were all evaluated (Table 4).
The closer the P is to 100%, the better the delineation. From Table 4, on the whole, P1 and P2 are 117.57% and 122.13%, respectively. The city boundaries drawn in this paper are consistent in scope. By calculating the number and proportion of overlapping grids, the position accuracy of the delineation results is analyzed. Compared with the boundary results from the FROM-GLC10(Zhengzhou) product and visual interpretation result, the number of overlapping grids is 1,178,665 and 1,142,217, respectively, and the proportions of positions that overlap are 89.98% and 90.66%, respectively, indicating that the city boundary defined in this paper has good consistency in terms of position (see Table 5).
In conclusion, we discuss and analyze the influence of different sample size on boundary delimitation results and precision, the importance of each features for urban areas and the reasons, also the result and influence of different element sizes on the optimizing boundary, so as to extract small-scale urban boundary with the highest accuracy and most suitable for Zhengzhou.
5. Discussion
In this study, we apply multi-dimensional features formed by multi-temporal Sentinel-2 data and POI data. We achieve highly precise small-scale urban boundary mapping through the RF algorithm and mathematical morphology. Many scholars have made use of multi-source remote sensing images of various scales and social auxiliary data such as POI to achieve large-scale, high-resolution, high-precision land cover mapping and impermeable water surface mapping [12,13,14,15,16,17,18,19,20,21,22]. The accuracy of small- and medium-scale urban boundary mapping has not been improved to any obvious extent. As a matter of fact, there is no high-precision urban boundary mapping product that can be used exclusively for small-scale regional applications. Compared with the previous products, we proposed a process of urban boundary mapping for small and medium scales. Furthermore, the resolution and accuracy of the products that we have produced have been improved greatly [26,27,28,29,30,31,32].
In addition, the data sources used in this method are easy to obtain. If the boundary products of the current year are to be produced, only the data from February, June, September, November, or the nearest month in the current year of Sentinel-2 need to be collected. Although there is a time distinction in the data collection, it is not an absolute requirement. It is selected flexibly according to the quality of the data collection. Meanwhile, POI data from the current year are also easy to obtain. Using these data, the urban spatial structure could be described in detail.
After different training sampling experiments, the highest result accuracy reaches 96.25% and the Kappa coefficient is 0.93, with training samples accounting for 65%. Taking the regional connectivity of the urban boundary into consideration, we adopt the mathematical morphology method to deal with some small holes and sporadic edges in the calculation results. After different structural element size tests, the best result was finally obtained, which was processed using the 13 × 13 size of structural elements. Compared with the current highest-resolution FROM-GLC10(Zhengzhou) data product and visual interpretations, our product has a higher accuracy.
There are also some shortcomings in this method. For instance, we selected 263 dimensional features. Although this may improve the accuracy of the RF algorithm, it is indeed a dimensional disaster that takes a great deal of time to calculate and affects the application and extension of this method to large-scale high-precision mapping. We discussed the influence of each feature on the above classification accuracy and preliminarily obtained the importance of each feature. Therefore, high-precision urban boundary mapping with simplified multi-dimensional features is a future goal for our research.
In addition, the process of adopting a mathematical morphology to optimize the urban boundary is in fact a kind of artificial contrast. In this process, we need to rely on the expert’s subjective experience in order to select the better structural element, and it still lacks an objective standard and an automatic judgment method. Thus, we will continue to complete the production of high-precision samples, which is absolutely necessary, and further improve automatic boundary extraction based on samples. It is of great significance for us to extend to large-scale urban boundary mapping in the future.
6. Conclusions
In this paper, we attempt to take Zhengzhou as an example to provide an urban boundary product, which enriches the similar products for comparison and also provides a method and a reference for the small- and medium-scale city. In addition, our product provides a scientific reference and basis for urban management and development to solve the problems we had in urban expansion and land space governance in China, so as to meet the needs of determining the direction of urban development and formulating urban growth strategies. We further showed that it could be used to as a decision support tool for the reasonable land use classification mapping within the city, and for the healthy development of the city in the future.
Based on previous research, we improve the method of extracting urban construction land. Multi-spectral Sentinel-2 images were used to extract the multi-temporal texture features of B2, B3, B4, B5, B6, B7, B8, and B8a. Meanwhile, the vegetation index (NDVI mean) and build-up index (NDBI mean) were calculated, and the POI features that could reflect the details of human activities were combined. On this basis, the RF algorithm is used to construct the urban construction land extraction model for training. This study found that the combination of remote sensing data and POI data to obtain multi-dimensional feature information for the RF urban construction land extraction model is conducive to improving the classification effect, with the overall classification accuracy reaching 96.25%. It proves that the traditional machine learning method has great potential to improve overall classification accuracy.
The experimental control group with different numbers of training samples and verification samples were set for training, respectively. The results show that the model accuracy is related to the number of training samples. As the number of samples increases, the OA of the model improves. When the number of training samples is 130, accounting for 65% of the total number of samples, the model training has the best effect and the highest OA. As the number of training samples increases, the accuracy of the model decreases. This may be caused by the excessive number of training samples and the over-simulation of the model.
The importance of different features to classification is quite different. In our result, both the texture features of multi-temporal Sentinel-2 image data and POI features contribute to the identification of urban construction land. Among the 31 features whose contribution was greater than 0.5, the contributions of the texture features in February and September were the largest. In the texture features, the mean value of the GLCM contribution is obvious. Compared with Sentinel-2 image data, POI features have little influence on the extraction of urban construction land. Among the POI features, different types of POI have significant differences on importance. The two types of POI; namely, residential communities and public services, contribute the most to the classification of urban construction land, while the other three types (the administrative center, commercial centers, and transportation) contribute less than 0.5, and so are relatively less important.
The method of mathematical morphology was used to optimize the urban construction land extracted from the RF model, and it finally realized the mapping of the urban boundaries of Zhengzhou city. By setting different structural element sizes, the most suitable size processing boundary is selected. After several close and open operations, a clear and definite urban boundary of Zhengzhou is finally obtained. By calculating the matching value, the number of overlapping grids, and the ratio of overlapping grids to be compared with the FROM-GLC10(Zhengzhou) product and the visual interpretation results in terms of range and location, the consistency of the urban boundary delineation in this paper is verified. We obtained a matching value of 117.57% with FROM-GLC10(Zhengzhou) and 122.13% with visual interpretation, respectively. The accuracy of the locations in our results are 89.98% with FROM-GLC10(Zhengzhou) and 90.66% with visual interpretation, respectively. This proves the advantages of this research in terms of the method, precision, and reliability.
Although multi-temporal Sentinel-2 images and POI data are used for feature extraction in this paper, and the RF algorithm is adopted to obtain a high degree of precision in the extraction results of urban construction land in Zhengzhou, the feature selection can still be further discussed. In addition to retaining features with a high contribution, a further study can be conducted on features of other data such as population data and building height data in order to explore the room for improvement in terms of accuracy. At the same time, for future large-scale urban boundary mapping, in addition to a study on feature selection, the methods adopted need to be further improved.
Author Contributions
Conceptualization, Z.W.; methodology, H.W. and Z.W.; formal analysis, Z.W.; investigation, Z.W., H.W. and F.Q.; data curation, Z.W.; writing—original draft preparation, Z.W.; writing—review and editing, H.W.; visualization, Z.W.; supervision, H.W., F.Q., Z.H. and C.M. All authors have read and agreed to the published version of the manuscript.
Funding
The authors gratefully acknowledge support by the National Nature Science Foundation of China (Grant No. 41401457, Grant No. 41871316), Young Backbone Teacher Training Plan of Henan (Grant No. 2020GGJS028), National Science Foundation of Henan (Grant No.202300410096), Key Scientific Research Project Plans of Higher Education Institutions of Henan (Grant No.21A170008), and Technology Development Plan Project of Kaifeng (Grant No.2003009).
Acknowledgments
We express our appreciation to Peng Gong for his constructive comments. The research was also supported by the National Earth System Science Data Sharing Infrastructure, National Science & Technology Infrastructure of China-Data Center of Lower Yellow River Regions (http://henu.geodata.cn).
Conflicts of Interest
The authors declare no conflict of interest.
References
- Department of Urban Surveys National Bureau of Statistics of China. China City Statistical Yearbook; China Statistics Press: Beijing, China, 2018.
- The National Bureau of Statistics of China. China Statistical Yearbook; China Statistics Press: Beijing, China, 2018.
- Kuang, W.; Liu, J.; Zhang, Z.; Lu, D.; Xiang, B. Spatiotemporal dynamics of impervious surface areas across China during the early 21st century. Chin. Sci. Bull. 2013, 58, 465–478. [Google Scholar] [CrossRef] [Green Version]
- Tang, Y.; Robert, J.M.; Zhang, J. Inspiration of Urban Sprawl Control Studies in Foreign Countries. Ecol. Geogr. 2011, 31, 748–753. [Google Scholar] [CrossRef]
- Li, H.; Cao, X. The Connotation of “Compact City” and Its Adaptability in the Development of Chinese Cities. Lan Zhou Xue Kan 2014, 110–116. Available online: https://kns.cnki.net/kcms/detail/detail.aspx?dbcode=CJFD&dbname=CJFD2014&filename=LZXK201406019&v=5toiSIaLw%25mmd2FS3K3pWt2s5TenlPtb2canPRhqsjFiF1gHGO2ZjkgMSNUBlkXf%25mmd2B1BD (accessed on 5 December 2020).
- Liu, X.; Ning, X.; Wang, H.; Wang, C.; Zhang, H.; Meng, J. A Rapid and Automated Urban Boundary Extraction Method Based on Nighttime Light Data in China. Remote Sens. 2019, 11, 1126. [Google Scholar] [CrossRef] [Green Version]
- Hu, Y.; Fu, L.; Li, Q. The prediction of Beijing urban growth boundaries. J. Geo-Inf. Sci. 2017, 19, 486–492. [Google Scholar] [CrossRef]
- Long, Y.; Han, H.; Mao, Q. Establishing urban growth boundaries using constrained CA. Acta Geogr. Sin. 2009, 64, 999–1008. [Google Scholar] [CrossRef]
- Li, X.; Cong, X.; Tong, L.; Cheng, Z. The defining method and application of urban boundary. Urban Probl. 2017, 46–51. [Google Scholar] [CrossRef]
- Wang, H.; Zhang, X.; Kang, T.; Zhao, Y. Urban Fringe Division and Feature Analysis Based on the Multi-criterion Judgment. J. Nat. Resour. 2011, 26, 703–714. [Google Scholar]
- Tannier, C.; Thomas, I. Defining and characterizing urban boundaries: A fractal analysis of theoretical cities and Belgian cities. Comput. Environ. Urban Systems 2013, 41, 234–248. [Google Scholar] [CrossRef]
- Hu, S.; Tong, L.; Frazier, A.E.; Liu, Y. Urban boundary extraction and sprawl analysis using Landsat images: A case study in Wuhan, China. Habitat Int. 2015, 47, 183–195. [Google Scholar] [CrossRef]
- Gong, P.; Li, X.; Zhang, W. 40-Year (1978–2017) human settlement changes in China reflected by impervious surfaces from satellite remote sensing. Sci. Bull. 2019, 64, 756–763. [Google Scholar] [CrossRef] [Green Version]
- Zhuo, L.; Li, Q.; Shi, P.; Chen, J.; Zheng, J.; Li, X. Identification and characteristics analysis of urban land expansion types in China in the 1990s using DMSP/OLS data. Acta Geogr. Sin. 2006, 61, 169–178. Available online: http://kns.cnki.net/kcms/detail/detail.aspx?FileName=DLXB200602005&DbName=CJFQ2006 (accessed on 31 July 2020).
- Song, J.; Li, X.; Lin, T.; Zhang, G.; Ye, H.; He, X.; Ge, R. A Method of Extracting Urban Built-up Area Based on DMSP/OLS Nighttime Data and Google Earth. J. Geo-Inf. Sci. 2015, 17, 750–756. [Google Scholar] [CrossRef]
- Wu, X.; Zhang, P. Urban Boundary Extraction by Fusing of DMSP-OLS and Landsat Images. J. Appl. Sci. 2016, 34, 67–74. [Google Scholar] [CrossRef]
- Potere, D.; Schneider, A.; Angel, S.; Civco, D.L. Mapping urban areas on a global scale: Which of the eight maps now available is more accurate? Int. J. Remote Sens. 2009, 30, 6531–6558. [Google Scholar] [CrossRef]
- Schneidera, A.; Friedl, M.A.; Poterec, D. Mapping global urban areas using MODIS 500-m data: New methods and datasets based on ‘urban ecoregions’. Remote Sens. Environ. 2010, 114, 1733–1746. [Google Scholar] [CrossRef]
- Gong, P.; Chen, B.; Li, X.; Liu, H.; Wang, J.; Bai, Y.; Chen, J.; Chen, X.; Fang, L.; Feng, S.; et al. Mapping Essential Urban Land Use Categories in China (EULUC-China): Preliminary results for 2018. Sci. Bull. 2020, 65, 182–187. [Google Scholar] [CrossRef] [Green Version]
- Xia, N.; Cheng, L.; Li, M. Mapping Urban Areas Using a Combination of Remote Sensing and Geolocation Data. Remote Sens. 2019, 11, 1470. [Google Scholar] [CrossRef] [Green Version]
- Yin, J.; Soliman, A.; Yin, D.; Wang, S. Depicting urban boundaries from a mobility network of spatial interactions: A case study of Great Britain with geo-located Twitter data. Int. J. Geo-Inf. Sci. 2017, 31, 1293–1313. [Google Scholar] [CrossRef] [Green Version]
- Gomes, E.; Abrantes, P.; Banos, A.; Rocha, J. Modeling future land use scenarios based on farmers’ intentions and a cellular automata approach. Land Use Policy. 2019, 85, 142–154. [Google Scholar] [CrossRef]
- Xu, Z.; Gao, X. A novel method for identifying the boundary of urban built-up areas with POI data. Acta Geogr. Sin. 2016, 71, 928–939. [Google Scholar] [CrossRef]
- Gao, X.; Xu, Z.; Niu, F. Delineating the scope of urban agglomerations based upon the Pole-Axis theory. Prog. Geogr. 2015, 34, 280–289. [Google Scholar] [CrossRef]
- Fang, B.; Zhang, X.; Yang, L. Study on urban boundary identification based on POI-A case study of Yuncheng city in Shanxi. Mod. Surv. Mapp. 2017, 40, 20–22. [Google Scholar]
- Gong, P.; Wang, J.; Yu, L.; Zhao, Y.; Zhao, Y.; Liang, L.; Niu, Z.; Huang, X.; Fu, H.; Liu, S.; et al. Finer resolution observation and monitoring of global land cover: First mapping results with Landsat TM and ETM+ data. Int. J. Remote Sens. 2013, 34, 2607–2654. [Google Scholar] [CrossRef] [Green Version]
- Yu, L.; Wang, J.; Gong, P. Improving 30 meter global land cover map FROM-GLC with time series MODIS and auxiliary datasets: A segmentation based approach. Int. J. Remote Sens. 2013, 34, 5851–5867. [Google Scholar] [CrossRef]
- Yu, L.; Wang, J.; Li, X.; Li, C.; Zhao, Y.; Gong, P. A multi-resolution global land cover dataset through multisource data aggregation. Sci. China Earth Sci. 2014, 57, 2317–2329. [Google Scholar] [CrossRef]
- Chen, J.; Chen, J.; Liao, A.; Cao, X.; Chen, L.; Chen, X.; He, C.; Han, G.; Peng, S.; Lu, M.; et al. Global land cover mapping at 30 m resolution: A POK-based operational approach. ISPRSJ. Photogramm. Remote Sens. 2015, 103, 7–27. [Google Scholar] [CrossRef] [Green Version]
- Liu, X.; Hu, G.; Chen, Y.; Li, X.; Xu, X.; Li, S.; Pei, F.; Wang, S. High-resolution multi-temporal mapping of global urban land using Landsat images based on the Google Earth Engine Platform. Remote Sens. Environ. 2018, 209, 227–239. [Google Scholar] [CrossRef]
- Gong, P.; Li, X.; Wang, J.; Bai, Y.; Chen, B.; Hu, T.; Liu, X.; Xu, B.; Yang, J.; Zhang, W.; et al. Annual maps of global artificial impervious areas (GAIA) between 1985 and 2018. Remote Sens. Environ. 2020, 236. [Google Scholar] [CrossRef]
- Gong, P.; Liu, H.; Zhang, M.; Li, C.; Wang, J.; Huang, H.; Clinton, N.; Ji, L.; Li, W.; Bai, Y.; et al. Stable classification with limited sample: Transferring a 30-m resolution sample set collected in 2015 to mapping 10-m resolution global land cover in 2017. Sci. Bull. 2019, 64, 370–373. [Google Scholar] [CrossRef] [Green Version]
- Breiman, L. Random forests. Mach. Learn. 2001, 45, 5–32. [Google Scholar] [CrossRef] [Green Version]
- Cutler, A.; Cutler, D.R.; Stevens, J.R. Random forests. Mach. Learn. 2004, 45, 157–176. [Google Scholar]
- Narayanan, A. Fast binary dilation/erosion algorithm using kernel subdivision. In Proceedings of the Asian Conference on Computer Vision, ACCV 2006, Hyderabad, India, 13–16 January 2006; Springer: Berlin/Heidelberg, Germany, 2006; Volume 3852, pp. 335–342. [Google Scholar]
- Li, X.; Gong, P.; Zhou, Y.; Wang, J.; Bai, Y.; Chen, B.; Hu, T.; Xiao, Y.; Xu, B.; Yang, J.; et al. Mapping global urban boundaries from the global artificial impervious area (GAIA) data. Environ. Res. Lett. 2020, 15, 094044. [Google Scholar] [CrossRef]
- Li, H.; Liu, Y.; Tan, R.; Qiu, L. A New Algorithm of Urban Built-up Area Boundary Extraction Based on High-resolution Panchromatic Image. Bull. Surv. Mapp. 2015, 36–41. [Google Scholar] [CrossRef]
Figure 1.
Location of study area in Zhengzhou, Henan, China.

Figure 2.
The Sentinel-2 image with scene coverage of the study area.

Figure 3.
The workflow of the urban area extraction method proposed in this study.

Figure 4.
Spectral curves of the three types in the study area on (a) 22 February 2018, (b) 7 June 2018, (c) 30 September 2017, and (d) 19 November 2018.
Figure 4.
Spectral curves of the three types in the study area on (a) 22 February 2018, (b) 7 June 2018, (c) 30 September 2017, and (d) 19 November 2018.

Figure 5.
Classification based on different samples for training.

Figure 6.
Overall accuracy and kappa coefficient of the random forest (RF) model based on samples with different purities.
Figure 6.
Overall accuracy and kappa coefficient of the random forest (RF) model based on samples with different purities.

Figure 7.
Feature importance ranking for the optimal feature combination.

Figure 8.
The proportion of the first 31 features.

Figure 9.
The proportion of 28 texture features in the first 31 features.

Figure 10.
Different structural element size tests.

Figure 11.
Comparison of different research results on delineation urban boundaries.


Table 1.
Sentinel-2 data.
| Name | Phase | Resolution |
|---|---|---|
| S2A_MSIL1C_20180222T030731_N0206_R075_T49SFU_20180222T082850.SAFE | 22 February 2018 | 10 m |
| S2A_MSIL1C_20180222T030731_N0206_R075_T49SGU_20180222T082850.SAFE | 22 February 2018 | 10 m |
| S2A_MSIL1C_20180513T030541_N0206_R075_T49SFU_20180513T055623.SAFE | 13 May 2018 | 10 m |
| S2B_MSIL1C_20180607T030539_N0206_R075_T49SGU_20180607T064334.SAFE | 7 June 2018 | 10 m |
| S2A_MSIL1C_20180930T030541_N0206_R075_T49SGU_20180930T060706.SAFE | 30 September 2018 | 10 m |
| S2B_MSIL1C_20181005T030549_N0206_R075_T49SFU_20181005T055242.SAFE | 5 October 2018 | 10 m |
| S2A_MSIL1C_20181109T030931_N0207_R075_T49SFU_20181109T060447.SAFE | 9 November 2018 | 10 m |
| S2A_MSIL1C_20181119T031011_N0207_R075_T49SGU_20181119T061056.SAFE | 9 November 2018 | 10 m |
Table 2.
Feature parameters extracted from the four Sentinel-2 images and POI features.
| Feature Type | Feature Phase | Feature Name | Feature Variable | Count |
|---|---|---|---|---|
| Texture Features | February 2018, June 2018, September 2018, November 2018 | Mean | Mean_b2,3,4,5,6,7,8,8a | 4 × 8 |
| Variance | Variance_b2,3,4,5,6,7,8,8a | 4 × 8 | ||
| Contrast | Contrast_b2,3,4,5,6,7,8,8a | 4 × 8 | ||
| Homogeneity | Homogeneity_b2,3,4,5,6,7,8,8a | 4 × 8 | ||
| Dissimilarity | Dissimilarity_b2,3,4,5,6,7,8,8a | 4 × 8 | ||
| Correlation | Correlation_b2,3,4,5,6,7,8,8a | 4 × 8 | ||
| Entropy | Entropy_b2,3,4,5,6,7,8,8a | 4 × 8 | ||
| Second Moment | SecondMoment_b2,3,4,5,6,7,8,8a | 4 × 8 | ||
| Vegetation Index | 2018 | NDVI mean | NDVI mean | 1 |
| Build-Up Index | 2018 | NDBI mean | NDBI mean | 1 |
| Baidu-Based POI | 2018 | Administrative centers | Kernel_xzzx | 1 |
| Residential communities | Kernel_zzxq | 1 | ||
| Public services | Kernel_ggfw | 1 | ||
| Commercial centers | Kernel_sfyl | 1 | ||
| Transportation | EucDistance_jtdl | 1 | ||
| Sum | 263 | |||
Table 3.
Sample data set with different numbers of samples.
| Group | Training Sample | Validation sample | Sum1/(Sum1 + Sum2) ∗ 100% | ||||
|---|---|---|---|---|---|---|---|
| Urban | Non-urban | Sum1 | Urban | Non-urban | Sum1 | ||
| 1 | 5 | 5 | 10 | 95 | 95 | 190 | 5% |
| 2 | 10 | 10 | 20 | 90 | 90 | 180 | 10% |
| 3 | 15 | 15 | 30 | 85 | 85 | 170 | 15% |
| 4 | 20 | 20 | 40 | 80 | 80 | 160 | 20% |
| 5 | 25 | 25 | 50 | 75 | 75 | 150 | 25% |
| 6 | 30 | 30 | 60 | 70 | 70 | 140 | 30% |
| 7 | 35 | 35 | 70 | 65 | 65 | 130 | 35% |
| 8 | 40 | 40 | 80 | 60 | 60 | 120 | 40% |
| 9 | 45 | 45 | 90 | 55 | 55 | 110 | 45% |
| 10 | 50 | 50 | 100 | 50 | 50 | 100 | 50% |
| 11 | 55 | 55 | 110 | 45 | 45 | 90 | 55% |
| 12 | 60 | 60 | 120 | 40 | 40 | 80 | 60% |
| 13 | 65 | 65 | 130 | 35 | 35 | 70 | 65% |
| 14 | 70 | 70 | 140 | 30 | 30 | 60 | 70% |
| 15 | 75 | 75 | 150 | 25 | 25 | 50 | 75% |
| 16 | 80 | 80 | 160 | 20 | 20 | 40 | 80% |
| 17 | 85 | 85 | 170 | 15 | 15 | 30 | 85% |
| 18 | 90 | 90 | 180 | 10 | 10 | 20 | 90% |
| 19 | 95 | 95 | 190 | 5 | 5 | 10 | 95% |
Table 4.
Comparison of some products in scope over Zhengzhou.
| Place | This Study (km2) | FROM-GLC10 (Zhengzhou) | Visual Interpretation | ||
|---|---|---|---|---|---|
| Area (km2) | P1 (%) | Area (km2) | P2 (%) | ||
| Main urban area of Zhengzhou (include Zhongmu and Xingyang) | 1154 | 969 | 119.09% | 1015 | 113.69% |
| Gongyi | 65 | 73 | 89.04% | 30 | 216.67% |
| Dengfeng | 44 | 25 | 176% | 19 | 231.58% |
| Xinmi | 57 | 56 | 101.79% | 25 | 228% |
| Xinzheng | 65 | 55 | 118.18% | 45 | 144.4% |
| Sum | 1385 | 1178 | 117.57% | 1134 | 122.13% |
Table 5.
Comparison of some products in position over Zhengzhou.
| Comparison of FROM-GLC10 (Zhengzhou) Product | Comparison of Visual Interpretation Result | |
|---|---|---|
| Number of overlapping grids | 1,178,665 | 1,142,217 |
| The ratio of overlapping grids (%) | 89.98% | 90.66% |
Publisher’s Note: MDPI stays neutral with regard to jurisdictional claims in published maps and institutional affiliations. |
© 2020 by the authors. Licensee MDPI, Basel, Switzerland. This article is an open access article distributed under the terms and conditions of the Creative Commons Attribution (CC BY) license (http://creativecommons.org/licenses/by/4.0/).
Share and Cite
MDPI and ACS Style
Wang, Z.; Wang, H.; Qin, F.; Han, Z.; Miao, C. Mapping an Urban Boundary Based on Multi-Temporal Sentinel-2 and POI Data: A Case Study of Zhengzhou City. Remote Sens. 2020, 12, 4103. https://0-doi-org.brum.beds.ac.uk/10.3390/rs12244103
AMA Style
Wang Z, Wang H, Qin F, Han Z, Miao C. Mapping an Urban Boundary Based on Multi-Temporal Sentinel-2 and POI Data: A Case Study of Zhengzhou City. Remote Sensing. 2020; 12(24):4103. https://0-doi-org.brum.beds.ac.uk/10.3390/rs12244103
Chicago/Turabian StyleWang, Zhe, Haiying Wang, Fen Qin, Zhigang Han, and Changhong Miao. 2020. "Mapping an Urban Boundary Based on Multi-Temporal Sentinel-2 and POI Data: A Case Study of Zhengzhou City" Remote Sensing 12, no. 24: 4103. https://0-doi-org.brum.beds.ac.uk/10.3390/rs12244103
Note that from the first issue of 2016, this journal uses article numbers instead of page numbers. See further details here.