Review

Impacts of Climate Variability and Drought on Surface Water Resources in Sub-Saharan Africa Using Remote Sensing: A Review

by
Trisha Deevia Bhaga
1,*,
Timothy Dube
1,
Munyaradzi Davis Shekede
2 and
Cletah Shoko
3
1
Department of Earth Sciences, The University of the Western Cape, Private Bag X17, Bellville 7535, South Africa
2
Department of Geography Geospatial Sciences and Earth Observation, University of Zimbabwe, P.O. Box MP 167, Mount Pleasant, Harare, Zimbabwe
3
Division of Geography, School of Geography, Archaeology and Environmental Studies, University of the Witwatersrand, Johannesburg 2050, South Africa
*
Author to whom correspondence should be addressed.
Remote Sens. 2020, 12(24), 4184; https://0-doi-org.brum.beds.ac.uk/10.3390/rs12244184
Submission received: 21 October 2020 / Revised: 5 December 2020 / Accepted: 15 December 2020 / Published: 21 December 2020

Abstract

:
Climate variability and recurrent droughts have caused remarkable strain on water resources in most regions across the globe, with the arid and semi-arid areas being the hardest hit. The impacts have been notable on surface water resources, which are already under threat from massive abstractions due to increased demand, as well as poor conservation and unsustainable land management practices. Drought and climate variability, as well as their associated impacts on water resources, have gained increased attention in recent decades as nations seek to enhance mitigation and adaptation mechanisms. Although the use of satellite technologies has, of late, gained prominence in generating timely and spatially explicit information on drought and climate variability impacts across different regions, they are somewhat hampered by difficulties in detecting drought evolution due to its complex nature, varying scales, the magnitude of its occurrence, and inherent data gaps. Currently, a number of studies have been conducted to monitor and assess the impacts of climate variability and droughts on water resources in sub-Saharan Africa using different remotely sensed and in-situ datasets. This study therefore provides a detailed overview of the progress made in tracking droughts using remote sensing, including its relevance in monitoring climate variability and hydrological drought impacts on surface water resources in sub-Saharan Africa. The paper further discusses traditional and remote sensing methods of monitoring climate variability, hydrological drought, and water resources, tracking their application and key challenges, with a particular emphasis on sub-Saharan Africa. Additionally, characteristics and limitations of various remote sensors, as well as drought and surface water indices, namely, the Standardized Precipitation Index (SPI), Palmer Drought Severity Index (PDSI), Normalized Difference Vegetation (NDVI), Vegetation Condition Index (VCI), and Water Requirement Satisfaction Index (WRSI), Normalized Difference Water Index (NDWI), Modified Normalized Difference Water Index (MNDWI), Land Surface Water Index (LSWI+5), Modified Normalized Difference Water Index (MNDWI+5), Automated Water Extraction Index (shadow) (AWEIsh), and Automated Water Extraction Index (non-shadow) (AWEInsh), and their relevance in climate variability and drought monitoring are discussed. Additionally, key scientific research strides and knowledge gaps for further investigations are highlighted. While progress has been made in advancing the application of remote sensing in water resources, this review indicates the need for further studies on assessing drought and climate variability impacts on water resources, especially in the context of climate change and increased water demand. The results from this study suggests that Landsat-8 and Sentinel-2 satellite data are likely to be best suited to monitor climate variability, hydrological drought, and surface water bodies, due to their availability at relatively low cost, impressive spectral, spatial, and temporal characteristics. The most effective drought and water indices are SPI, PDSI, NDVI, VCI, NDWI, MNDWI, MNDWI+5, AWEIsh, and AWEInsh. Overall, the findings of this study emphasize the increasing role and potential of remote sensing in generating spatially explicit information on drought and climate variability impacts on surface water resources. However, there is a need for future studies to consider spatial data integration techniques, radar data, precipitation, cloud computing, and machine learning or artificial intelligence (AI) techniques to improve on understanding climate and drought impacts on water resources across various scales.

Graphical Abstract

1. Introduction

Drought is a complex, naturally occurring hazard, resulting from climate variability and change, leading to a change in the water balance, due to drastic decreases in precipitation over an extended period of time [1,2,3]. Droughts occur in all climatic zones, irrespective of the region’s normal precipitation rates and trends [4], and its onset and cessation are difficult to detect, rendering it highly unpredictable, unlike other natural disasters [5]. Characterizing drought impacts is difficult, because they differ spatially and temporally [6]. Atmospheric climate events, such as El Nino Southern Oscillation (ENSO), may cause an increase in the frequency and intensity of droughts [7]. Lack of precipitation, high evapotranspiration rates, and over-exploitation of water resources can lead to drought [8]. The impacts of droughts are diverse, and these can be either direct or indirect. For example, drought results in crop and biodiversity losses, loss of livestock/wildlife, disruptions in hydropower generation, food losses, malnutrition, famine, and even death. In 2011, poor rains in Mauritania led to drought conditions which caused poor harvests, loss of livestock, and an increase in food prices [9]. In Mali, a drought impacted farming, leading to starvation in 2015, and 300,000 people suffered from food insecurity [10]. In Cote d’Ivoire, a drought in 2018 led to 70% of the dams supplying cities to run dry [11]. In 2018, approximately 3.7 million people in South Africa were affected by drought, which was caused by below average precipitation rates [12]. In Madagascar at the end of 2019, more than 2.6 million Malagasy were affected by drought, resulting in severe food shortages, which led to famine [13]. In Lesotho, in 2020, approximately 500,000 people are threatened with hunger, and it is estimated that more than 30% of the population will experience acute food insecurity due to ongoing drought conditions [14]. Therefore, to reduce and mitigate these impacts, there is a need for effective drought and climate variability monitoring. Surface water resources are the major source of freshwater for agriculture, drinking, sanitation, and energy for many countries of sub-Saharan Africa [15]. However, previous studies by [6,15,16] and [17] demonstrate that surface water bodies are vulnerable to climate change. Thus, surface water resources need to be monitored more accurately to be able to: (i) Determine their state, (ii) assess the influence of drought conditions and climate variability on their availability, as well as (iii) ensure their sustainable utilization. This paper therefore seeks to provide a detailed overview on the progress of remote sensing applications in the monitoring of climate variability and drought impacts on surface water resources in sub-Saharan Africa. To do this, the paper first highlights the importance of monitoring climate variability and drought on water resources in the region. This was followed by the details on how relevant literature were searched and consulted, before highlighting key scientific research strides and knowledge gaps for further investigations.

2. Importance of Monitoring Climate Variability and Drought on Water Resources in Sub-Saharan Africa

During the first two decades of the 21st century, 79 global big cities, including those in sub-Saharan Africa, experienced severe drought conditions [18]. It is also projected that the occurrence of drought events is likely to increase and become more intense in the future, due to climate change and variability, which will further pose additional strain on the water supply [19,20]. Droughts affect both water quantity and quality. In terms of water quality, reduced flows result in a decrease in organic matter, nutrients, and sediment pathways in surface water streams [21]. Reduced flows can, in turn, affect wetlands’ stability in providing habitats for wildlife and aquatic species. Droughts can also cause an intrusion of saline water into groundwater systems, a decrease in groundwater levels, and water supply problems. The occurrence of droughts results in limited water available to support and sustain the various social, environmental, and economic services. In this regard, it is a global priority to reduce the social, environmental, and economic impacts of droughts and climate variability, as well as to work towards creating resilient societies [22]. Monitoring climate variability and droughts is essential for planning and management of water resources for various social, environmental, and economic services, which include public supply and sanitation, ecosystems, hydroelectricity, mining, and agriculture [16]. Understanding the different dimensions of droughts, such as historical droughts in the region, their impacts, and their occurrence is also a crucial step towards developing effective models to predict and investigate different drought occurrences [23]. The prediction of drought occurrence permits drought preparedness [24] and necessitates the development of drought specific contingency plans, such as water restrictions and the use of alternative water sources [25].
Water bodies are vulnerable to climate change and therefore, they need accurate, timely, and routine monitoring [26]. This will help in determining the onset of drought conditions in order to come up with mitigation and adaptation strategies and avoid loss of lives and crops, and famine [27]. On the other hand, monitoring the size and dynamics of water bodies is vital for water resource management, to determine how much water is available to supply and maintain the ecological state of surrounding ecosystems [21]. In addition, monitoring the quantity of water resources can be used as a method to predict droughts and therefore useful in arid and semi-arid areas, particularly in sub-Saharan Africa.
So far, a lot of scientific research work has been conducted to monitor these droughts and associated impacts of climate variability [28,29], however, knowledge on the advancements in remote sensing applications and data processing techniques, particularly in sub-Saharan Africa, remains poorly documented. So far, droughts are monitored using paleoclimatology, satellite data, physical based techniques, e.g., floats, sensors, buoy systems, pressure type equipment, ultrasonic and radar techniques, as well as inferences from climate variability modelling studies. Thus, to achieve the objective of this work, the paper describes methods used in reviewing and synthesizing relevant literature before identifying key research advancements as well as knowledge gaps warranting further investigations.

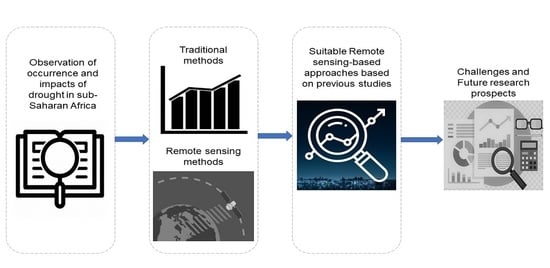
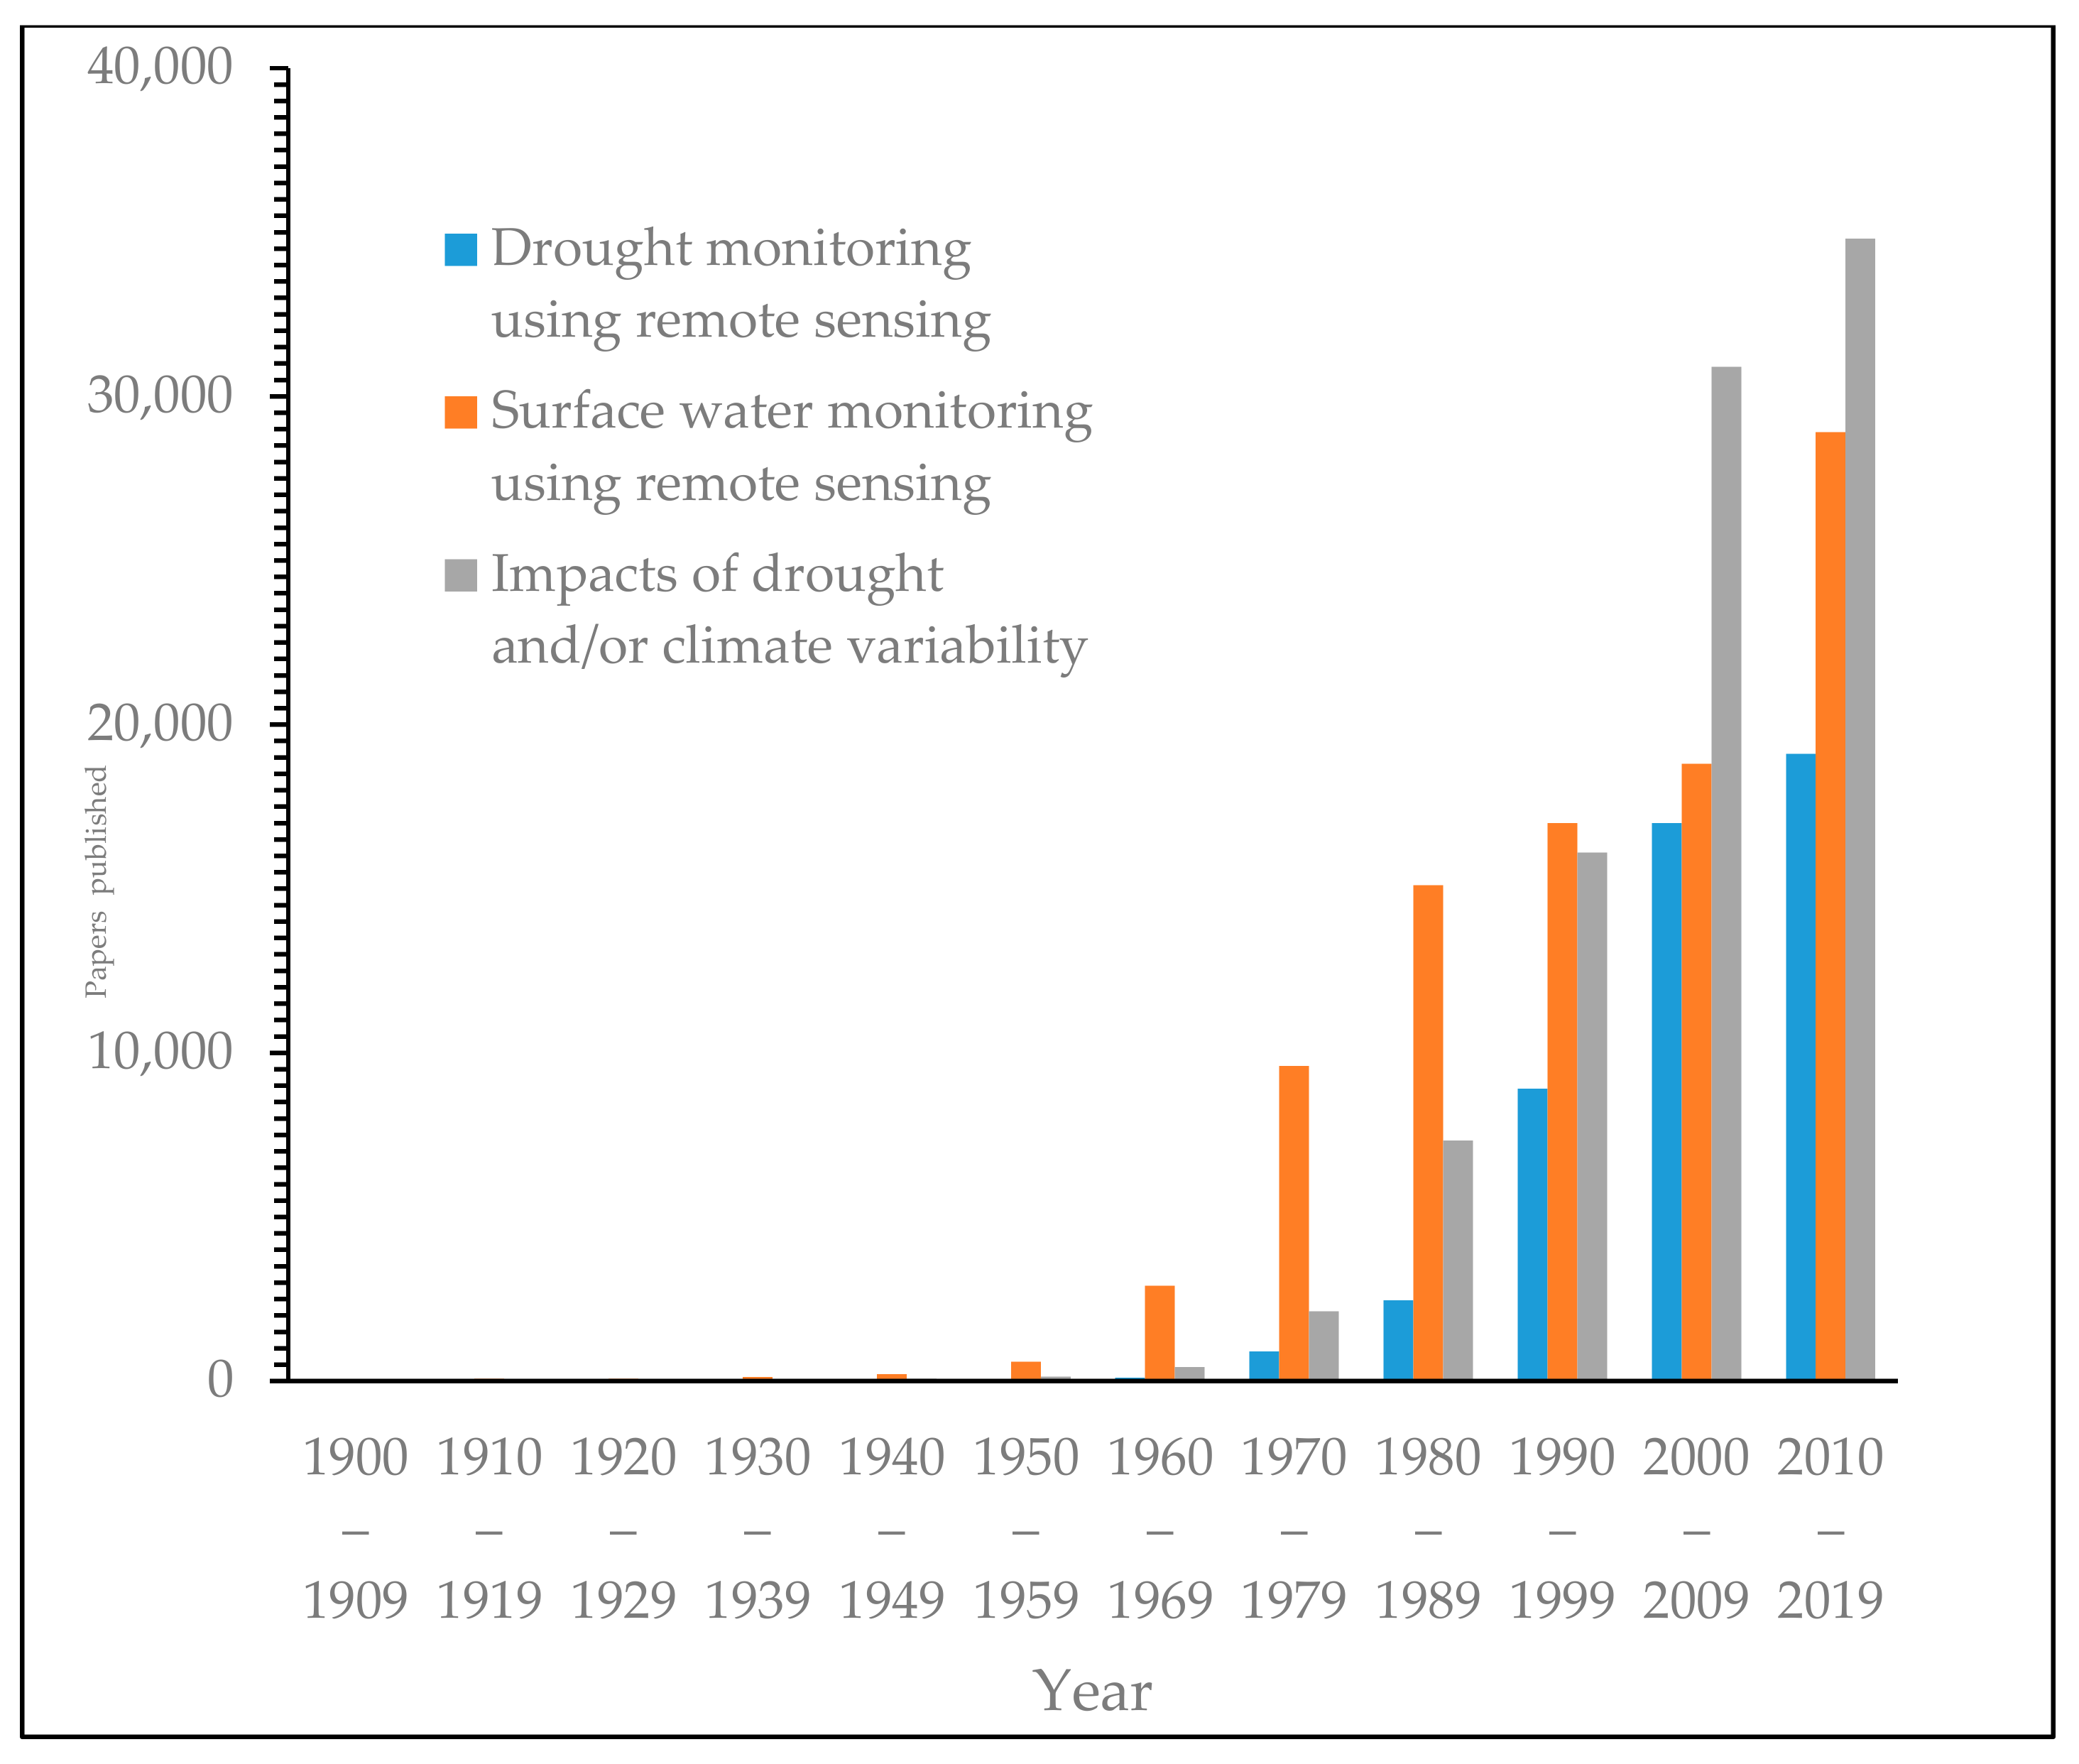
3. Materials and Methods

Literature Search

To gather and determine the most relevant literature for this particular study, different search strategies were adopted. The literature search consisted of English peer-reviewed articles and relevant reports on droughts that were published between 1900 and 2020 covering sub-Saharan Africa. Relevant articles were identified, using targeted searches in Google scholar, Scopus, and the Web of Science. The criteria for the selection included (i) the use of remote sensing in drought, climate variability, and surface water monitoring; (ii) geographical location and year of occurrence; and (iii) publication in a scientific journal. This review omitted research that did not use geospatial technologies from the selection. Each article was assessed according to the accuracy of results and year of publication. The articles were then grouped into three main categories, namely (i) drought monitoring using remote sensing, (ii) surface water monitoring using remote sensing, and (iii) impacts of drought/or climate variability (Figure 1). Most interestingly, it was observed that in the category on drought monitoring, using remote sensing constituted more than half of the review material and consists of remote sensing data. Much of this work focused on drought risk assessment and drought severity mapping, using various indices. The third and final category, impacts of drought, consisted of articles analyzing effects of droughts on various sectors in different countries of sub-Saharan Africa. Various online reports and articles were also consulted in order to tabulate the occurrence of droughts in the region from 1900 to 2020 (Table 1).
Overall, the literature showed that the use of remote sensing for drought and surface water body monitoring has increased significantly in recent years. However, remote sensing applications have not diversified, as there are still many gaps in research, suggesting that its applicability has not been fully tested or exploited for monitoring purposes. Furthermore, not enough studies have been conducted using remote sensing for drought and surface water body monitoring, with approximately only 18,000 articles regarding drought monitoring using remote sensing published from 2010 to 2019 (Figure 1). This observation implies that remote sensing needs to be harnessed to further advance its scientific contribution in various application areas including, but not limited to, drought monitoring, surface water body monitoring, and climate variability, especially in Africa.

4. Definitions, Occurrence, and Impacts of Droughts and Climate Variability

To date, several definitions of drought have been proposed depending on the perspective from which drought is being assessed [6]. For instance, the Food and Agriculture Organization (1983) defines drought as the percentage of years with poor crop yield due to the lack of soil moisture, whereas World Meteorological Organization (1986) describes it as a sustained, extended deficiency in precipitation. On the other hand, the UN Secretariat (1994) defines it as a naturally occurring phenomenon that exists when precipitation is significantly below normal recorded levels, causing serious hydrological imbalances that adversely affect land resource production systems. Thus, it is important to note that the drought definitions significantly vary across different fields depending on the variables such as concepts, observational parameters, and measurement procedures used to describe this phenomenon, leading to different categorizations [8]. Droughts are usually classified into four different categories [6,29,30], namely meteorological, hydrological, agricultural, and socio-economic drought [31]. Recently, ground water drought was proposed as the fifth category by [29]. However, few studies have been conducted on groundwater drought.
Meteorological drought occurs when there is a lack of precipitation over an extended period of time [5,25,32]. Prolonged meteorological droughts lead to a decrease in soil moisture content that can result in agricultural droughts [5]. When streamflow, groundwater, or total water storages are below long-term means, hydrological drought occurs [33], meaning that stream flows and reservoir levels are low [5]. This means that a given water source cannot supply the required amount of water needed for its intended use, leading to limited water supply [3]. In contrast, agricultural drought occurs when there is a deficit in soil moisture [1]. The lack of water caused by insufficient precipitation, in soil and subsoil affects crop growth, thereby causing a decrease in crop yields [1,25,33]. Soil moisture is dependent upon several factors, such as actual evapotranspiration and potential evapotranspiration, physical and biological properties of soil, and the biological characteristics of specific plants [34]. Socio-economic drought occurs when the drought process affects production, because water resources cannot meet water demands, leading to a shortage of certain economic goods [1]. In this regard, the demand for economic goods is greater than supply, due to a shortage of water supply [29]. Thus, socio-economic drought is driven by the other three drought categories [5]. For groundwater drought, the lack of precipitation and high evapotranspiration rates result in low soil moisture, leading to low groundwater recharge [35,36]. Low groundwater recharge, in turn, causes low groundwater levels, thereby reducing groundwater discharge [29]. As the total amount of groundwater available is difficult to determine, this drought category is usually defined by a decrease in groundwater level, groundwater storage, and groundwater recharge or discharge [37].
Drought-related impacts are complex due to their effects on various water-dependent sectors, such as recreation and tourism, energy, and transportation, as well as the environment [6]. The impacts of drought are classified as direct or indirect. For example, a reduction in crops, land degradation, deforestation, increased fire hazard, reduced energy production, a decline in water levels, increased mortality rates of fauna, and damage to wildlife and aquatic ecosystems are examples of direct impacts [6,13]. A decrease in water levels can lead to water shortages, and therefore water supply will be disturbed. Many countries experience drought-induced crop failure and water shortage during drought periods [32]. Indirect impacts are the consequences of the direct impacts mentioned previously. Decreases in crop, rangeland, and forest productivity can lead to farmers and agricultural businesses running at a loss, thereby causing a decrease in food and timber, unemployment, and an increase in crime rates [6]. Indirect losses often exceed direct losses, since these can cascade to other critical socio-economic sectors.
Moreover, droughts and climate variability have severe consequences on the environment, economy, and human wellbeing [38], and the impacts are connected through couplings in land-atmosphere processes [32]. Groundwater resources become stressed when the region experiences an extended period of decreased rates in precipitation and high temperatures, which, in turn, affect groundwater recharge [8]. For example, droughts across the globe, particularly in sub-Saharan Africa [13], affect surface water and groundwater resources, which lead to a lack of water supply, reduction in water quality, crop failure, and a change in riparian habitats [4]. The occurrence of droughts in developed countries, with adequate coping mechanisms, leads to economic losses that can be alleviated through contingency funds or insurance schemes. However, in poor countries, like those in Africa and South America, drought can lead to food shortages and famine [38].
The frequency of drought in Eastern Africa (EA) has doubled from once every six years to once every three years since 2005 [13]; and between 2008 and 2010, droughts affected over 13 million people in EA [39]. Djibouti, Eritrea, Ethiopia, and Somalia, also known as the Horn of Africa (HOA), experienced severe droughts from 2010–2011, which caused food insecurity, famine, malnutrition, and affected approximately 20 million people and led to a significant loss of lives [40]. In Somalia, Kenya, and Ethiopia, drought led to socio-economic instabilities, with Somalia alone recording 250,000 deaths during the same period [13,40] (Table 1).
Droughts have been recurring in sub-Saharan Africa in the past 30 years [39]. During the 1991/1992 drought, agricultural production in Zimbabwe was reduced by 45% and the gross domestic product (GDP) decreased by 11% [1,41], leading to severe food insecurity and famine, due to its dependence on rain-fed agriculture [38]. The Western Cape of South Africa experienced a severe drought from 2015–2018 [1,17,42], and dam levels dropped to approximately 20%, affecting ±3.7 million people [24]. Water restrictions reached level 6b, meaning that the consumption of water was limited to 50 L or less per person per day, and the use of boreholes was discouraged to preserve groundwater resources while the use of non-potable water was encouraged to water fields and gardens [43,44]. A detailed summary on the occurrence and impacts of major recorded droughts in sub-Saharan Africa is provided in Table 1. Overall, west Africa has experienced the highest number of droughts, followed by east Africa, whereas central Africa experienced the least number of droughts. As for individual countries, Tanzania in east Africa recorded the highest number of droughts. Figure 2 also indicates the risk of drought occurrence globally based on the Global Precipitation Climatology Centre (GPCC) Drought Index. It can be observed that the majority of countries in sub-Saharan Africa are high-risk areas of drought occurrence. This further emphasizes the need for continuous monitoring of droughts in the region.
Moreover, drought occurrence affects several Sustainable Development Goals (SDGs) envisaged in the United Nations 2030 agenda [45]. The occurrence of drought affects Goal Number 1 “No poverty”, Goal Number 2 “Zero hunger”, Goal Number 6 “Clean water and Sanitation”, Goal number 11 “Sustainable cities and communities”, Goal number 12 “Responsible production and consumption”, Goal number 13 “Climate action”, and Goal number 15 “Life on land” [45,46].
Droughts and climate variability cannot be completely understood, without understanding their impacts on the environment and societies [47]. Monitoring trends and profiling their impacts on surface water resources is important, as it helps to make informed decisions to address and mitigate the impacts [48]. Understanding the impacts of historical droughts can aid in future predictions or the development of possible adaptation and mitigation measures. Advancements in technology have expanded the ability to monitor droughts and surface water resources using remotely sensed data. Thus, the use of remote sensing to monitor droughts/or climate variability and surface water resources has been on the rise, demonstrating a promising future.

5. Advancements in Remote Sensing Systems and Their Role in Drought, Climate Variability, and Surface Water Resource Monitoring in Sub-Saharan Africa

Before the launch of satellites, aerial photographs were taken on-board low orbiting aircrafts to map the spatial distribution of land cover types. The first Landsat satellite was launched in 1972, and since then remote sensing has been used to monitor changes on the land surface and provided accurate information to ecologists, geologists, hydrologists, forest managers, and soil scientists [49]. Historically, aerial photography provided high spatial data, but with a low frequency, and images were only updated every few years with a limited spectral range. However, with the improvements in technology, aerial photography now provides high spatial data, with high temporal frequency and a wide spectral range [16].
Currently, various satellites are in orbit, providing data at different resolutions, which can be used for water resources monitoring, as well as in assessing droughts and climate variability. The different sensors are provided in Table 2. For example, the Moderate Resolution Imaging Spectroradiometer (MODIS) has a swath width of 2330 km, a revisit period of 1–2 days, and 36 spectral bands, with a spatial resolution of 250–1000 m (Table 2) [16]. Surface water bodies are usually detected at 500 m using the Green and Shortwave Infrared (SWIR) bands of MODIS, which have a spatial resolution of 500 m, therefore detecting small surface water bodies, which are smaller than 4 km2, is problematic [50,51]. Since there are numerous surface water bodies in Africa that are smaller than 4 km2, they are likely to be poorly detected when using this data, thereby rendering MODIS unsuitable for such applications. Although the sensor has limitations for small water bodies, MODIS can record the frequency and distribution of cloud cover, and measure properties such as the distribution and size of aerosols in the atmosphere, liquid water, and ice clouds. MODIS also measures the photosynthetic activity of land and marine plants (phytoplankton), which makes this satellite suitable to monitor lakes. A study conducted by Moser et al. [52] monitored surface water bodies in Burkina Faso using MODIS data to generate a time series from 2000 to 2012 with a temporal frequency of 8 days. The results were validated using Landsat imagery to create a water mask and achieved an accuracy of 75.7%. In a different study, d’Andrimont and Defourny [53] used MODIS data to monitor surface water bodies across the entire African continent from 2004 to 2010 using daily observations. They used a surface water detection method to derive indicators that describe the location, temporal characteristics, and intra- and inter-annual variations. The results were cross validated with existing maps and water products, and a commission error of less than 6% was associated with the findings. In addition, studies by Caccamo et al. [54]; Klisch and Atzberger [55]; Qu et al. [40]; and Henchiri et al. [56] successfully used MODIS data to monitor meteorological, hydrological, and agricultural drought conditions in Australia, China, Kenya, north and west Africa, and the Horn of Africa, respectively. Henchiri et al. [56] conducted a study in north and west Africa to evaluate the performance of MODIS data used to monitor meteorological and agricultural drought from 2002–2018. The spatial correlation analysis indicated that the Drought Severity Index (DSI) was unreliable in detecting meteorological drought in north and west Africa, however, association analysis between the Normalized Vegetation Supply Water Index (NVSWI) and the Normalized Difference Vegetation Index (NDVI), and NVSWI and DSI efficiently monitored meteorological and hydrological drought in north and west Africa. Qu et al. [40] used MODIS data from the years 2000 to 2017 to monitor meteorological and agricultural drought conditions in the Horn of Africa (HOA). Results from the study indicated that croplands deteriorated due to drought conditions, and there was therefore an urgent need for sustainable solutions to aid timely monitoring of drought and to determine the severity of food security. Studies by Yan et al. [57], and Berge-Nguyen and Cretaux [58], used MODIS data to detect floodplain inundation from 2001 to 2006 and 2000 to 2013, respectively. A study by Berge-Nguyen and Cretaux [58], monitored floodplain inundation over the Inner Niger Delta, using MODIS data from 2000–2013. They were able to describe inundations in the delta and to separate the flooded areas in the Inner Niger Delta into open water and mixture of water and dry land. This study indicated that MODIS data is able to detect surface water body and monitor the Earth’s surface efficiently, due to its short repeat time and wide coverage. However, its coarse spatial resolution causes low accuracies and therefore may make it unsuitable for monitoring drought and climate variability, including smaller surface water bodies.
The Advanced Very High Resolution Radiometer on-board National Oceanic and Atmospheric Administration satellites (NOAA/AVHRR) has a coarse resolution, but has a high temporal resolution of 0.5 days, and a relatively high spatial resolution of 1100 m (Table 2) [16]. NOAA/AVHRR was designed to monitor the ocean and atmosphere. Unganai and Kogan [59] were able to monitor meteorological drought conditions in Southern Africa using NOAA/AVHRR data. However heavy cloud contamination reduced the accuracy of the results. Anyamba and Tucker [60] calculated the Normalized Difference Vegetation Index (NDVI) using NOAA/AVHRR data in the Sahel, situated in Northern Africa, from 1981 to 2003, to improve the understanding of the persistence and spatial distribution of meteorological drought conditions. Rojas et al. [61] used NOAA/AVHRR derived NDVI and the Vegetation Health Index (VHI) for Africa from 1981 to 2009 to monitor agricultural drought and observe changes in climate. The study demonstrated the utility of the sensors in identifying high risk areas of drought, though the coarse resolution led to low accuracies over small study areas. NOAA/AVHRR data might not perform optimally in monitoring drought and climate variability due to its coarse resolution and susceptibility to cloud contamination. On the other hand, Medium Resolution Imaging Spectrometer (MERIS) was designed to monitor ocean and land surfaces by using optical sensors to detect water or floods. It has a spectral resolution of 300 m, 15 spectral bands, and a temporal resolution of three days (Table 2). This satellite only has a 10-year data record, ranging from 2002 to 2012, and therefore is not recommended for long term monitoring of surface water bodies [16] due to limited data records and its failure to provide near real-time data. MERIS data has been applied in water quality monitoring, especially in Southern Africa. For instance, a study by Matthews et al. [62] used MERIS data to monitor water quality and cyanobacteria-dominated algal blooms in near-real-time in Zeekoevlei, a lake situated in Cape Town, South Africa. Chawira et al. [63] efficiently monitored water quality in two lakes in Zimbabwe, namely Chivero and Manyame, from 2011 to 2012, and found that MERIS is suitable for near-real-time monitoring of water quality parameters due to its ability to predict chlorophyll-a (R2 = 0.91).
Systeme Probatoire d’Observation dela Tarre (SPOT) has four to five spectral bands with a relatively high spatial resolution ranging from 5.5 to 20 m and a temporal resolution of 26 days (Table 2) [16]. However, the data is not freely available, thereby limiting its application in detection of surface water bodies and flood inundation. Haas et al. [64] used SPOT data to monitor temporary water bodies in sub-Saharan western Africa from January 1999 to September 2007. The data had an overall accuracy of 95.4% and proved to produce satisfactory results. IKONOS, RapidEye, and Quickbird are commercially available high spatial resolution sensors, but due to their small scene coverage and low revisit time, only small surface water bodies can be detected (Table 2). They are thus unable to detect large surface water bodies, and their performance in urban and mountainous areas are weak due to shadows, thus limiting their application in surface water monitoring at large spatial scales [16].
As previously mentioned, the first Landsat mission was launched in 1972 and has since been supplying medium resolution images [47]. Additional Landsat satellite missions were launched in the late 1970s and the 1980s [65]. The early Landsat satellites consisted of the Multispectral Scanner (MSS) sensors, followed by the Thematic Mapper (TM) on Landsat 4 and Landsat 5. Landsat 7 was launched in 1999 and was comprised of the Enhanced Thematic Plus (ETM+) [65]. These Landsat missions were often used to detect surface water bodies and detect changes on the Earth’s surface [47]. Landsat 8 was launched in February 2013 and consists of the Operational Land Imager (OLI) and the Thermal Infrared Sensor (TIRS). Landsat 8 has a spatial resolution of 30 m and a 15 m panchromatic band, which is a greyscale image covering the red, green, and blue portions of the electromagnetic spectrum [66]. It has a temporal resolution of 16 days and a swath width of 185 km, with nine reflective wavelength bands, and six of these bands are designed for land applications (Table 2). It has a pushbroom nature of scanning the Earth’s surface, which means that the satellite scans along the track design, therefore improving the sensitivity of critical surface features and reducing the problem of saturation. Although many studies have been conducted using the Landsat OLI data to monitor and detect surface water bodies, few of these have been conducted in Africa, with most of the studies focusing on monitoring water quality. Zhou et al. [17], and Masocha et al. [66], successfully applied OLI data to detect and monitor surface water bodies with high accuracies. These results from various studies indicate that Landsat satellites have relatively high spectral and spatial resolutions that are ideal for tracking land use and land cover change caused by climate change, drought, wildfires, urbanization, and other natural and human-caused changes. The use of this data for drought or climate variability monitoring remains rudimentary, particularly in sub-Saharan Africa, despite its potential to revolutionize and improve our understanding in the region.
The Sentinel-2 sensor, launched in June 2015, provides the most requisite spatial data continuity for climate variability and drought monitoring, in addition to SPOT and Landsat missions, among others [47]. It consists of the Multispectral Instrument (MSI) and has 13 reflective wavelength bands, four 10 m visible and near-infrared (NIR) bands, six 20 m red edge, near infrared, and shortwave infrared (SWIR) bands, and three 60 m bands [47]. Sentinel-2 has a temporal resolution of 5 days and has a swath of 290 km (Table 2). The data from the sensor has been used extensively in monitoring surface water bodies [17,66,67]. Forkour et al., [66] used Sentinel-2 MSI data to map land use and land cover (LULC), and differentiate between water bodies and non-water bodies, in Burkina Faso and achieved an overall accuracy of 94.3%. In addition, different studies were conducted by Dotzler et al. [68], Laurin et al. [69], Urban et al. [34], and Puletti et al. [70] to monitor drought conditions using Sentinel-2 data. For example, Dotzler et al. [68] used Sentinel-2-derived Photochemical Reflectance Index (PRI), Moisture Stress Index (MSI), Normalized Difference Water Index (NDWI), and Chlorophyll Index (CI) to analyze the response of deciduous trees to drought conditions in the Donnersberg region, Germany. The results highlighted the benefits of high spectral resolution of Sentinel-2 data to monitor drought and climate variability. A study by Urban et al. [34] used Sentinel-1/-2 and Landsat 8 data from March 2015 to November 2017 to investigate the spatiotemporal dynamics of surface moisture and vegetation structure. The study found that it is vital to use land cover and vegetation information for analyzing surface water dynamics and understanding the effects of drought on surface water bodies, and is therefore suited for monitoring drought and climate variability, particularly in Southern Africa. In another study, Laurin et al. [69] used Sentinel-2 data to differentiate forest types, dominant tree species, and water used by plants, using various indices, in Ghana. The results were generated using a Support Vector Machine and achieved an overall accuracy of 92.34%. These high accuracies indicate that this sensor is suitable for monitoring water bodies, droughts, and climate variability, due to its high resolutions (spectral, spatial, and temporal). Its utility in these application areas needs to be tested further in Africa, more particularly, sub-Saharan Africa.
The above review has shown an increase in the number of studies that are applying remote sensing data in monitoring dynamics in quantity and quality of surface water resources, including drought and climate variability. However, in resource constrained regions such as Africa, most studies have taken advantage of the ready availability of satellite data such as NOAA/AVHRR, MODIS, and Landsat, as well as the relatively long-term data record of some of the sensors, e.g., Landsat (>40 years). Unlike the aforementioned sensors, IKONOS, SPOT, and QuickBird have coarse temporal resolution and are commercially available, thereby limiting their applications in water related studies in resource constrained environments such as Africa. Deciding on which data set to use will depend on the type of study and the scale of monitoring. There is therefore a further need to test the applicability of freely available satellites to monitor water resources, drought, and climate variability over large areas. With technological advancements, sensors that have higher temporal, spectral and spatial resolutions need to be designed to integrate multi-datasets to monitor water resources and making remote sensing a more viable option.

6. Remote Sensing Products for Drought and Climate Variability Monitoring

With the advancement in technology, there has been an increased use of satellite images for various water related studies [47]. For instance, advancements in the development of water indices, analysis or integration techniques, and availability of multi-temporal and multi-spectral images mean that it is easier to detect changes in surface water bodies [26]. It also enables the monitoring of various aspects of hydrology, such as precipitation, evapotranspiration, soil moisture, groundwater, water quality, and surface water variability. Although rain gauges are the main source of rainfall data, their networks are inadequate in many countries of sub-Saharan Africa due to their sparse distribution. The limited networks are therefore unable to provide reliable data to produce detailed rainfall information over large spatial scales. On the other hand, rainfall can be estimated using satellite data, which provides information in near real-time and more spatially distributed estimates [31]. The most common satellites used to estimate precipitation are the Climate Hazards Group Infra-Red Precipitation with Stations (CHIRPS), Tropical Rainfall Measuring Mission (TRMM), Meteosat-8, Geostationary Operational Environmental Satellite (GOES), the Tropical Applications of Meteorology using Satellite data and Ground-based observations (TAMSAT), and the Special Sensor Microwave Imager (SSM/I) [71]. Dinku et al. [72] compared the performance of CHIRPS data, African Rainfall Climatology version 2 (ARC2), and TAMSAT data over Ethiopia, Kenya, Somalia, Uganda, Rwanda, and Tanzania, and the results indicated that CHIRPS had the highest accuracy, but often overestimated precipitation. In addition, a study by Seyama et al. [73] evaluated TAMSAT data in Southern Africa to accurately estimate precipitation and found that the algorithm needs improvement in accurate detection of high precipitation events. Measuring evapotranspiration is important for modelling hydrological processes and climate change, as well as estimating evapotranspiration through using physical-based methods [74]. Using remote sensing techniques to estimate evapotranspiration has been done using various sensors such as the AVHRR, MODIS, and Landsat [74]. A study by Kiptala et al. [75] used MODIS data and the Surface Energy Balance Algorithm of Land (SEBAL) model to estimate the actual evapotranspiration for 16 land use types from 2008 to 2010 in the Upper Pangani River Basin, shared by Kenya and Tanzania. The study indicated a good agreement from different validations and achieved a correlation coefficient of 0.74. On the other hand, Alemayehu et al. [76] used daily MODIS data and Global Land Data Assimilation System (GLDAS) to effectively estimate evapotranspiration in the Mara River basin, shared by Kenya and Tanzania.
Soil moisture is vital for understanding and predicting variations of surface temperature, droughts, floods, impacts of climate change, and weather forecasting [77]. Soil moisture controls the rate and amount of precipitation infiltrating into the soil and recharging into aquifers [39]. Remote sensing techniques are preferred to monitor soil moisture over ground-based methods, as it has a wider spatial scale [39]. In this regard, Normalized Difference Vegetation Index (NDVI) and Land Surface Temperature (LST) are the most common parameters used to remotely estimate soil moisture, with MODIS, Landsat, and Soil Moisture Active Passive (SMAP) being the most popular satellites [78]. For example, Xulu et al. [79] used MODIS-derived Normalized Difference Vegetation Index (NDVI) and precipitation data for KwaMbonambi, northern Zululand, from 2002 to 2016 to understand the effects of drought on forest resources, by using remote sensing techniques. The results were validated using multiple linear regression and Mann–Kendall tests and proved to be reliable indicators for temporal drought conditions and characterized plantations, and their response to climate variability efficiently. A study by Ugbaje and Bishop [80] used remote sensing observations of soil moisture and ancillary climatological data to assess the impact of hydrological controls of vegetation greenness dynamics over Africa from 2003 to 2015. To do this, the study used daily soil moisture data from the European Space Agency Climate Change Initiative data portal and was resampled to co-register with the MODIS EVI data. The accuracy was assessed by comparing the out-of-bag prediction of EVI against the observed values and found that it is one of the robust ways to assess the importance of hydrological variables.
Groundwater is a vital component of the hydrological cycle, as it contributes significantly to water resources, as well as agriculture and ecosystem health [36]. Traditional methods are still popular for studying groundwater–surface water interactions [81] despite the increasing use of remote sensing-based methods in monitoring groundwater such as the Gravity Recovery and Climate Experiment (GRACE) and Thermal Airborne Spectrographic Imager (TASI). Munch and Conrad [82] combined remote sensing and GIS techniques to create a GDE (groundwater dependent ecosystem) probability rating map for the Sandveld region in South Africa using Landsat TM imagery. The results provided useful information, and it proved to be a cost-effective solution, however, the imagery was unsuitable for detailed mapping of GDE features. Nanteza et al. [83] integrated GRACE and Lake altimetry data within a soil moisture model to compare GRACE-derived groundwater storage changes to in-situ groundwater observations in East Africa, from 2003 to 2011. The results proved that GRACE data is efficient in monitoring groundwater resources in data scarce and hydrologically complex regions. The results indicated a 0.6 correlation between GRACE-derived data and in-situ data, suggesting that the results were fairly accurate despite overestimation of groundwater by GRACE. A similar study by Bonsor et al. [84] found that changes in groundwater storage of 12 sedimentary aquifers in Africa could be monitored using GRACE data combined with physical datasets derived from Land Surface Models (LSMs). In another study, Agutu et al. [81] found a strong link between GRACE-derived groundwater changes and climate variability in the Greater Horn of Africa based on a 10-year dataset. Specifically, GRACE-derived groundwater changes correlated well (R2 = 0.7) with results from the WaterGap Hydrological Model (WGHM), further indicating the potential of GRACE in groundwater monitoring. Using GRACE data from 2003 to 2016, Frappart [85] characterized dynamics in groundwater storage that occurred in the major North African transboundary aquifers. In the study, a moderate correlation (R2 = 0.5) was observed between GRACE and the Tindouf Aquifer System (TAS), with the correlation attributed to the small size of the system. This implies that the coarse spatial resolution of GRACE is problematic for monitoring groundwater resources for small areas. A recent study by Skaskevych et al. [86] assessed the feasibility of GRACE-based estimation of groundwater storage change in the Ngadda catchment in the Lake Chad Basin and demonstrated that GRACE-based modelling is a cost-effective method to monitor groundwater changes. While important insights have been gained from using this sensor, the coarse resolution limits its application over finer spatial scales. There is therefore the need for an improvement in spectral, spatial, and temporal resolutions of this sensor to overcome some of the shortfalls of this sensor to enable monitoring of water resources, drought, and climate variability in near real-time. In fact, the potential of high-resolution images, i.e., Landsat-8 and MODIS, in monitoring groundwater is promising, as demonstrated by Nhamo et al. [87] in a study that quantified groundwater use by crops in Venda-Gazankulu, Limpopo Province, South Africa.

7. Current Remote Sensing-Based Approaches for Monitoring Drought and Surface Water Resources

Droughts and surface water bodies can be monitored using traditional physical-based methods and/or remote sensing methods. Physical-based methods of droughts include paleoclimatology and recording meteorological data, such as rainfall, river flow, and soil moisture [53]. Paleoclimatology takes advantage of past climatic conditions using data records from ice sheets, tree rings, sediments, rocks, diatoms, and coral to understand past climates and to predict future climate conditions [88]. However, the most common paleoclimatic datasets used for drought monitoring are tree rings and peat lands. Physical-based methods of surface water monitoring are in-situ measurements, which include manual measurements of water levels using equipment such as floats, sensors, buoy systems, pressure type equipment, and ultrasonic and radar techniques [89,90,91]. Remote sensing uses cameras on satellites and airplanes and sonar systems on ships to obtain remotely sensed images, by measuring its reflected and emitted radiation at a distance, to detect and monitor physical characteristics [65]. Computer models use paleoclimatic data as a framework to base these models on [88]. However, physical-based methods are costly, time consuming, and equipment cannot be installed in remote or mountainous areas, thus the use of satellite data for monitoring surface water bodies is increasing, due to its ability to make high frequency and repeatable observations at a low cost [51].

7.1. Traditional Drought and Surface Water Body Monitoring Techniques

Dendroclimatology is the study of determining past climates from tree rings. The use of tree ring data is widely used in highland and lowland environments of the Mediterranean basin, the Middle East, and Asia, however, this method is not often used for drought studies in Africa, because there are still many methodological problems with its use in sub-Saharan Africa [92], and it is often used as a means to validate remote sensing data in other countries [93]. Measuring and recording surface water levels can be done using various types of level recording sensors, which are often used across Africa, such as bubblers, pressure transducers, and ultrasonic sensors; the results from these sensors can be recorded directly into a data logger or into a specialized flow meter [90]. Bubblers are sensors in which air or an inert gas is forced through a small bubble line which is submerged in the river channel and measures the water level by determining the pressure needed to force air bubbles out of the line [20]. Pressure transducers use a probe which is fixed to the bottom of the channel and senses the pressure of the overlying water [90]. Ultrasonic sensors or ground-based weather radar are placed about the flow stream and transmits a sound pulse that is reflected by the surface of the flow, and the time it takes between sending the pulse and receiving an echo determines the water level [90]. Ground-based weather radar has been used to detect precipitation by sending out pulses of microwave energy in narrow beams that scan in a circular motion, and when these pulses encounter precipitation particles, the energy is scattered in all directions, and some of this energy is sent back to the radar [94]. The energy measured is then used to estimate the intensity, altitude, type of precipitation, and motion. These different types of level recording sensors provide measurements of dam and other surface water body levels, such as rivers and lakes. These measurements indicate changes in water levels, and if there is a drastic drop in water levels associated with low levels of precipitation, it could mean that there is an onset of drought conditions. Rain gauges are the most common physical-based method to measure the amount of precipitation received [94]. Rain gauge measurements are point-based and measure the amount of precipitation received at a specific location. Rain gauges can be classified into non-recording rain gauges and recording rain gauges. Non-recording rain gauges collect precipitation, but do not record the amount of precipitation. Recording rain gauges automatically record the amount of precipitation on a graph paper and note the duration of rainfall events. However, manual measurements are not effective due to human errors and point-based measurements, which might not be representative of the entire area, as precipitation might fall more- or less-intensely at the location of the gauge [95]. Physical-based readings are often difficult to record during drought periods as the accuracy of readings decrease, however, if water levels are high, physical-based methods are easier to record [16]. Damage to equipment may induce measurement errors. As the measuring equipment is in direct contact with water, its life span is limited due to chemical and physical properties of water, such as corrosion, pressure underwater, and the composition of the water. This causes physical based techniques to be costly and time consuming [96].

7.2. Remote Sensing Techniques of Drought Monitoring

Due to its wide coverage, repeatable observations, multi-band features, and its applicability to local and global scales in data-rich and data-poor areas, the use of remotely sensed data, and more specifically spectral water indices derived from multispectral sensors, is a promising approach to drought monitoring [79,97]. Remote sensing is an important tool that provides consistent and continuous data [33,98]. Radar altimetry has been used for more than 10 years to monitor the changes in elevation of surface water bodies, such as inland seas, lakes, rivers, and wetland zones [99]. Altimetry data can be used to monitor changes in surface water storage [100]. Surface water is measured with a repeatability varying from 10 to 35 days, depending on the satellite [99]. Weather conditions do not affect data collection; however, altimetry does not have a global view and has several limitations. Varying topography and complex terrains reduce the accuracy of elevation data, and the target size and surface roughness affect the accuracy of altimetry-derived data, and therefore limits global surveying [99]. The use of altimetry data is limited to monitoring rivers that are larger than 1 km, due to its low temporal and spatial resolutions, and thus monitoring smaller water bodies accurately is challenging [101]. Recently, studies have focused on developing indices for reliable detection of drought and identifying surface water bodies using satellite data [3]. These indices are applied in the early detection of drought onset, intensity, cessation, duration, and spatial extent, as well as mapping surface water bodies [3]. A suite of indices exists, and each has its own advantages and weaknesses [33]. In this study, a number of indices were selected based on their performance as reported in literature (Table 3 and Table 4).
Advances in remote sensing and associated indices (algorithms) provide an alternative source of data. These indices are obtained from satellite-based infrared (IR), passive microwave (PMW), or spaceborne precipitation radar (PR) data. Drought conditions can be identified by using a drought index, which assesses the effect of drought, as well as intensity, duration, severity, and spatial extent of drought [48]. These drought indices use meteorological data, such as precipitation, temperature, and soil moisture data [56]. Meteorological drought has been detected using the Standardized Precipitation Index (SPI), Palmer Drought Severity Index (PDSI), Standardized Precipitation Evapotranspiration Index (SPEI), and Enhanced Vegetation Index (EVI) [18]. Indices used to detect hydrological drought include the Palmer Drought Severity Index (PDSI), Normalized Difference Vegetation Index (NDVI), Anomaly Vegetation Index, Normalized Difference Water Index (NDWI), Normalized Difference Drought Index (NDDI), and Temperature Condition Index (TCI) [102]. Agricultural drought can be detected using Palmer Drought Severity Index (PDSI), Drought Severity Index (DSI), Evapotranspiration Deficit Index (ETDI), Vegetation Condition Index (VCI), and Standardized Precipitation and Evaporation Index (SPEI) [102]. There are many indices developed for drought monitoring, however, the indices considered in this study are SPI, PDSI, NDVI, VCI, and WRSI, based on their widespread use (Table 3).
The Standardized Precipitation Index (SPI) was developed by Mckee et al. [103] to monitor the status of drought in Colorado, and has since been used to monitor dry and wet conditions over various time scales [104]. It is based on the long-term precipitation record for the study period and is then fitted to a probability distribution to ensure the mean SPI is zero for the study period and location [103]. Palmer [105] developed the Palmer Drought Severity Index (PDSI), and it was developed to quantify and compare the spatial and temporal drought characteristics across various regions [106]. It uses precipitation and temperature data to estimate moisture supply and demand within two soil layers. The Normalized Difference Vegetation Index (NDVI) measures the photosynthetic ability and productivity of plants, which is the difference between the near-infrared band and the red band [79]. It has been widely used to evaluate drought conditions across the globe [40,56,107]. The Vegetation Condition Index (VCI) was developed by Kogan [108] to detect and track drought by focusing on the impact of drought on vegetation. It records changes in vegetation vigor by using the visible band and near-infrared bands, and compares it with historical data. VCI provides information on prolonged and short-term droughts. The Water Requirement Satisfaction Index (WRSI) was developed by the Food and Agriculture Organization [47]. WRSI is a ratio of actual evapotranspiration to potential evapotranspiration and indicates the performance of crops based on water availability during the growing season [109,110]. It is used to monitor crop production in regions that suffer from famine.
Surface water bodies can be identified from optical sensors or microwave sensors. Optical sensors are used to calculate the differences between spectral bands, and microwave sensors are dependent upon the reflection of water surfaces relative to surrounding land surfaces, however, return signals can be reduced by waves on the water surface [16]. There are many methods to extract surface water bodies from remote sensing imagery, based on the principle of comparing the low reflectance of water to land cover types with a higher reflectance in infrared channels. Water indices can be used to extract surface water bodies, which are calculated from two or more bands, to distinguish between water bodies and non-water bodies [17,51,79]. Many indices have been developed, but for this study, only seven indices will be considered, namely Normalized Difference Water Index (NDWI), Modified Normalized Difference Water Index (MNDWI), Land Surface Water Index VI (LSWI+5), Modified Normalized Difference Water Index VI (MNDWI+5), Automated Water Extraction Index shadow (AWEIsh), and the Automated Water Extraction Index non-shadow (AWEInsh), based on their performance in previous studies (Table 4).
NDWI was introduced by McFeeters [111] in 1996 and extracts water bodies from satellite data. Water bodies have positive values and non-water bodies have zero or negative values, and they are enhanced and suppressed, respectively [112]. MNDWI was proposed by Xu in 2006 [113] to improve the accuracy of NDWI in built-up areas [16]. The Near Infrared (NIR) band in NDWI was replaced with the Shortwave Infrared (SWIR) band, because SWIR better reflects subtle characteristics of water [111], and SWIR is less sensitive to sediment concentrations in water than the NIR band [112]. Water bodies have positive values, and non-water bodies have negative values [114]. LSWI+5 is derived from LSWI, and was introduced by Menarguez [49] and uses the NIR and SWIR portions of the electromagnetic spectrum. It was developed to identify flooding and water bodies. MNDWI+5 was also introduced by Menarguez [49] and uses the NIR and red bands to map flooding or clear water [17]. AWEI was introduced by Feyisa et al. in 2014 [115], and it can detect water bodies. It includes two indices; AWEInsh, is applied when there are no shadows, and AWEIsh is applied to distinguish between water pixels and shadow pixels.
However, the results of these indices are region specific, and therefore certain indices will yield low accuracies due to cloud cover, pixel mixing, and shadows in mountainous or built-up areas. Some indices also need to be used in conjunction with other indices and/or meteorological data, as they cannot account for factors such as evapotranspiration, runoff, and infiltration. Therefore, there is a need to improve indices to improve monitoring conditions, which will be useful in detecting the onset, duration, and end of droughts.
Table 3. Drought indices used and their performance in previous studies.
Drought IndexReference of StudyKey FindingsLimitations of Index
Standardized Precipitation Index (SPI)Tirivarombo and Hughes, [116]Rainfall data from 1960 to 2002 was used to calculate SPI for selected parts of the Zambezi River Basin, in Africa, for a comparative analysis of the relationship between agricultural drought and food security.Needs to be used with other indices, because it does not account for deficits caused by evapotranspiration, infiltration, and runoff.
Chisadza et al. [117]SPI calculated for the Mzingwane catchment, in the Limpopo River Basin, situated in Southern Africa, by using rainfall data from 1999 to 2013 to determine drought severity.Achieved poor results over short study periods and achieved highly accurate results over longer study periods.
Khezazna et al. [118]SPI indices calculated for 13 rainfall stations in Seybouse basin, Algeria to differentiate between dry, normal, and wet periods to analyze variations in annual rainfall over the basin.Required historical rainfall data.
Tirivarombo et al. [119]SPI was able to detect temporal variations of droughts in the Kafue Basin, in northern Zambia.SPI to be used with caution to characterize drought, as it only uses rainfall data and not temperature data, and temperature data is important to characterize droughts.
Lawal et al. [120]Used SPI to quantify severity of drought over Southern Africa.Low accuracy achieved in regions where precipitation was low and short time periods.
Kalisa et al. [121]Calculated SPI over East Africa from 1920 to 2015. Adequately estimated dryness or wetness, and the study proved it can be used to assess drought intensity, especially in drought-prone regions.Results highly variable for shorter time scales, however, for longer time scales results were more accurate, therefore should be used for long-term studies.
Palmer Drought Severity Index (PDSI) Mehta et al. [122]PDSI was correlated with the PDSI forecast by the MIROC5 Earth System Model (ESM) from 1961 to 2019–2020, to assess the predictability accuracy over Southern Africa, and this method achieved efficient results.Higher accuracies over longer study periods. Decadal results were more accurate.
Zeleke et al. [123]PDSI obtained from station and satellite-based observation data sets from the Ethiopian National Meteorological Agency (EMA) for drought monitoring in Ethiopia from 1979 to 2014, accurate data which indicated drought periods.Only accounted for drought impacts based on temperature and precipitation data.
Asfaw et al. [124]PDSI data collected from Climate explorer: KNMI Climate change atlas and used to analyze extent of meteorological drought from 1951–2013. Detected increase in drought years since the 2000s, in the Woleka sub-basin, situated in Ethiopia.Short-term application is problematic, due to lower accuracies compared to long-term application.
Orimoloye et al. [125]PDSI used to identify the susceptibility of Cape Town, South Africa, to drought.Less accurate in areas with extremely dry vegetation.
Ogunrinde et al. [126]PDSI detected hydrological drought approximately 12 months before low flow occurred in the River Niger, in Nigeria.More effective in long-term monitoring of meteorological drought impacts than short-term monitoring.
Normalized Difference Vegetation Index (NDVI)Gelassie [127]Analyzed NDVI to monitor the development of biomass in Amhara, Ethiopia and found that NDVI can be used to estimate crop yield.Noise presence due to cloud cover and shadows which decreased NDVI values.
Tonini et al. [128]NDVI data collected using SPOT 4 and SPOT 5 satellites from 1998 to 2009, and accurately identified which areas are more prone to drought in the Tigray region, Ethiopia.Accuracies affected by the atmosphere, aerosol scattering, snow, and cloud cover.
Chisadza et al. [117]Evaluated vegetation condition and tracked drought severity and occurrence by using the GEONETCast ten-day composite, SPOT VEGETATION, NDVI (S10 NDVI) over the Beitbridge, Esighodini, Mangwe and Mwenezi districts, in Zimbabwe, from 1998 to 2013.Background brightness led to lower accuracies.
Klisch and Atzberger [56]NDVI was calculated in Mandera and Garissa, Kenya using MODIS data and successfully monitored vegetation.High noise interference due to cloud cover.
Lawal et al. [120]NDVI used to understand impacts of drought on southern African vegetation and achieved efficient results.Errors in seasonal NDVI data due to different algorithms used to translate measured wavelengths.
Qu et al. [40]NDVI data derived from MODIS was used to investigate drought conditions in the Horn of Africa (Djibouti, Eritrea, Ethiopia, and Somalia) from 2000 to 2017.Mainly sensitive to vegetation greenness, therefore limited in monitoring drought directly.
Vegetation Condition Index (VCI)Unganai and Kogan [59]AVHRR/NOAA data was successfully able to monitor the temporal and spatial characteristics of drought conditions in Southern Africa.Cloud cover affected drought signal.
Gelassie [127]Examined spatial drought by using VCI and found that drought can be detected and mapped in the Amhara region, Ethiopia from 1999 to 2009.Drought conditions can be monitored during the growing season.
Ghoneim et al. [129]Used MODIS data to calculate VCI and to assess spatial and temporal distribution of drought occurrence in Tunisia from 2000–2013 and accurately identified drought periods.Problematic with occurrence of excessive rain.
Qu et al. [40]Investigated agricultural drought by calculating NDVI from MODIS data from 2000 to 2017 in the Horn of Africa (Djibouti, Eritrea, Ethiopia and Somalia) and achieved a 95% accuracy.Cloud contamination affected accuracy.
Frischen et al. [38]VCI used to assess vegetation health and drought conditions in Zimbabwe, from 1989 to 2019 and found it detects drought dynamicsNot suited for analyzing one single season.
Water Requirement Satisfaction Index (WRSI)Gelassie [127]The spatial distribution of drought was examined using WRSI in Amhara, Ethiopia.Ground truthing for crops and detailed crop calendar is essential, as well as a water balance calculation.
Moeletsi and Walker [130]WRSI was used to quantify droughts in the Free State Province, South Africa, affecting rain-fed maize production.WRSI values in semi-arid areas are locality dependent.
Jayanthi et al. [131]WRSI was used to monitor crop productivity in Southern Africa.Limited hazard and exposure data, therefore long-term synthetic rainfall record had to be generated.
Legesse and Suryabhagavan [109]WRSI was used to assess the spatio-temporal variation in agricultural drought patterns in East Shewa Zone, Ethiopia and found to be a good indicator of agricultural drought.Showed good results for agricultural drought, but further investigation is required for other types of droughts.
Table 4. Surface water body indices used and their performance in previous studies.
Surface Water Body IndexReference of StudyKey FindingsLimitations of Index
Normalized Difference Water Index
(NDWI)
El-Asmar et al. [132]Used MSS, TM, ETM+, and SPOT images to obtain NDWI data to quantify change in the Burullus Lagoon in Egypt between 1973 and 2011 and accurately noted changes in size.Had to apply radiometric normalization to adjust solar angles.
Masocha et al. [27]Had an overall accuracy of 77% when extracting surface water bodies from Landsat-8 OLI data in Mutiriki catchment, Zimbabwe.Cannot suppress the signal from built-up features efficiently.
Orimoloye et al. [125]Used Landsat 8 data to derive NDWI to assess drought occurrence in Cape Town, South Africa from 2014 to 2018, and mapped changes in water bodies. Results agreed with dam levels recorded by the City of Cape Town.Does not consider soil type, geographic location, and climate zone.
Asfaw et al. [133]NDWI used to note changes in Lake Ziway, Ethiopia from 2009 to 2018 using Landsat ETM+/OLI data and obtained an overall accuracy of 91%.Problematic in urban areas with higher reflectance.
Fujihara et al. [134]Calculated NDWI using Landsat-8 data to classify land cover types in the Gash River, Sudan and achieved a Kappa coefficient of 0.960 and is reasonably good.Problematic in built-up areas, water features often confused with built up.
Modified Normalized Difference Water Index
(MNDWI)
El-Asmar et al. [132]MNDWI data obtained from MSS, TM, ETM+, and SPOT images to quantify change in the Burullus Lagoon in Egypt between 1973 and 2011 and accurately noted changes in size.Radiometric normalization applied to adjust solar angles.
Malahlela [135]Landsat-8 data was used to calculate MNDWI to extract waterbodies in South Africa, Republic of Congo and Madagascar from 2013 to 2015 and achieved an overall accuracy of 78.4%.Classified shadows as waterbodies.
Masocha et al. [27]Landsat-8 OLI data was used to map surface water bodies in Mutirikwi catchment, Zimbabwe, it achieved an overall accuracy of 84.3%.Higher performance in areas with vegetation compared to other land covered surfaces.
Asfaw et al. [133]Used MNDWI to note changes in Lake Ziway, Ethiopia from 2009 to 2018 using Landsat ETM+/OLI data and obtained 99% overall accuracy.Misclassified shadows as waterbodies.
Ndehedehe et al. [136]Used Sentinel-2 data to calculate MNDWI to detect changes in the Lake Chad Basin from 2015 to 2019 and achieved an overall accuracy of 97.4%.Sensitive to water content in soil and vegetation.
Slagter et al. [137]Used MNDWI for wetland mapping and surface water dynamics in St Lucia wetlands, South Africa using Sentinel-1 and Sentinel-2 data from 2016 to 2018 and achieved an overall accuracy of 87.1%.Highly vegetated areas led to lower accuracies.
Land Surface Water Index
(LSWI+5)
Jin et al. [71]Used MODIS data in Southern Africa to monitor vegetation phenology from 1999 to 2009 and results agreed with in-situ data.Problematic in built-up areas.
Benefoh et al. [138]Used TM, ETM, and OLI data to get a comprehensive understanding of the landscape in Ghana from 1986 to 2015. Results were correlated with in-situ data and achieved an overall accuracy of 82.6%.Lower accuracies in dry regions.
Masocha et al. [27]Had an overall accuracy of 86% when mapping surface water bodies in Mutirikwi Catchment, Zimbabwe and outperformed the other indices when applied to map surface water bodies in sub-tropical catchments.Further investigation required for performance in various climatic zones.
Ali et al. [139]Used LSWI+5 to analyze plant and soil water content in various watersheds in Ethiopia from 2006 to 2016 from Landsat-7 data.Cloud contamination affected results.
Modified Normalized Difference Water Index(MNDWI+5)Masocha et al. [27]Used to map surface water bodies in Mutirikwi Catchment, Zimbabwe and had an overall accuracy of 79.3%.Performed best in vegetated areas.
Automated Water Extraction Index (shadow)
(AWEIsh)
and
Automated Water Extraction Index (non-shadow)
(AWEInsh)
Feyisa et al. [115]Used Landsat-5 data to map waterbodies in South Africa, Ethiopia, Denmark, Switzerland, and New Zealand and achieved a Kappa coefficient of 0.98 and 0.97 in South Africa and Ethiopia, respectively.Variables that were not tested and could affect accuracies are variations in the angle of the sun, atmospheric composition, and biophysical and chemical changes in waterbodies.
Malahlela [135]Landsat-8 data was used to extract waterbodies in South Africa, Republic of Congo and Madagascar from 2013 to 2015 and achieved an overall accuracy of 83.8%.Classified shadows as water in built-up areas.
Masocha et al. [27]AWEIsh and AWEInsh had an overall accuracy of 81.6% and 50.3%, respectively, when mapping surface water bodies in Mutirikwi Catchment, Zimbabwe.AWEInsh problematic due to background noise and unable to differentiate between water bodies and built-up areas.
Asfaw et al. [133]Used Landsat ETM+/OLI data to note changes in Lake Ziway, Ethiopia from 2009 to 2018 using and obtained an overall accuracy of 99.2%.Problematic in urban areas due to high reflectance.
Danladi et al. [140]Used Landsat imagery to delineate coastal erosion and accumulation in Nigeria from 1973 to 2017.Problematic in built-up areas.
Herndon et al. [141]Achieved an overall accuracy of 98% when using Landsat-8 data to identify waterbodies in the Nigerian Sahel.Background noise led to misclassification.

8. Challenges of Remote Sensing in Drought, Climate Variability, and Surface Water Resource Monitoring, and Possible Future Research Directions

The vulnerability of Africa to droughts is high due to poverty and the dependence on rainfed agriculture. Therefore, there is a need for drought monitoring in an efficient, timely manner and the use of satellite data could significantly provide better monitoring techniques and improve drought planning and mitigation strategies. Remote sensing is a useful tool for drought and surface water monitoring, especially in large areas with limited ability to conduct in-situ monitoring, as this approach is cost effective and repeatable. The use of remote sensing, especially in Africa, will provide information on past, current, and future conditions of drought and will help understand the need for sustainable monitoring solutions. Early drought detection is vital for decision-making and preparedness. However, there are many satellites that provide meteorological data, such as near-surface air relative humidity and vapor pressure deficit, which can improve the early detection of drought and provide vital information [28]. A major limitation of using remote sensing for drought and surface water monitoring is data continuity [28]. Many of the current available satellite datasets, such as GRACE, do not have long historical records and only provide approximately 10–15 years of data, which might not be enough for drought studies from a climatological perspective, however, these records can be used for impact studies [28]. Satellites with sufficient records are Landsat, GOES, and AVHRR-MODIS-VIIRS. A major challenge of satellite data is background noise, which negatively influences the classification of land use zones. Another challenge of using remote sensing data is sensor uncertainties, which is why models and indicators were developed for uncertainty assessment of satellite-based data. However, with continuous developments in algorithms and free access to satellite data there is a promising approach for monitoring the impacts and onsets of drought and various other climatological changes [79].

9. Future Research Directions and Recommendations

This review has shown that remote sensing technology has improved drought and water resource monitoring including climate variability. However, there are still grey areas that need further research if data from earth observation is to make significant impact in resource poor regions such as those in sub-Saharan Africa. For instance, most of the aforementioned drought monitoring and water detection indices were developed for specific satellite data, therefore with the development of new satellites, new indices need to be developed and tested across diverse environments to enhance their utility [16]. There is also a need for more studies to be conducted in sub-Saharan Africa to test remote sensing applications and data processing techniques, to improve drought detection, mitigation, and the monitoring of water resources. Future studies need to be conducted to determine which datasets are best suited for monitoring groundwater resources, as researchers are currently struggling with the coarse resolution provided by GRACE, which reduces the accuracy of the results over small areas [85]. More studies need to be conducted using Landsat, GOES, or AVHRR-MODIS-VIIRS data, as these satellites have historical data, which will aid in impact studies, characterizing patterns and future predictions for drought models [47]. Indices and satellites also need to be developed to reduce the inaccuracies caused by background noise, cloud cover, pixel mixing, and shadows in mountainous or built-up areas, as mountains and clouds are often classified as water bodies due to their reflectance. There is also a need for further studies to investigate the applicability and feasibility of blending remote sensing methods with rain gauge estimates and/or climate models and precipitation models to test whether and in what way blending of these datasets reduces estimation variance. Similarly, the fusion of different remote sensing datasets (e.g., active and passive remotely sensed data) with various earth imaging characteristics is promising for improved detection and spatial characterization of droughts and water resources. Furthermore, more studies need to be conducted using rain gauge estimates integrated with radar data, as radar data is useful for estimating precipitation [74]. Machine learning (ML) is another promising field whose utility in drought monitoring needs to be explored [47]. Commonly used ML algorithms are artificial neural network (ANN), support vector machine (SVM), minimum distance classification, maximum likelihood classification, regression tree-based algorithms, ISODATA, and K-means clustering, however, these methods have yet to be tested in sub-Saharan Africa. The utility of panchromatic images with a higher resolution has been theoretically studied in surface water detection and monitoring, but it still needs to be implemented and tested [47]. Future studies could also test the effectiveness of integrating Digital elevation models (DEMs) with multi-spectral data in cloud removal to enhance water detection and delineation, [74].

10. Conclusions

Drought is characterized by various climatological and hydrological parameters, and to reduce the impacts of droughts and climate variability, these parameters need to be understood and monitored in a timely and efficient manner. Due to climate change, the occurrence of drought is likely to increase, which means the impacts of droughts based on historical, present, and future scenarios need to be analyzed, especially in Africa, which is a data-scarce continent. The use of remote sensing for the monitoring of drought and surface water resources has become popular, since the launch of satellites with improved spatial, spectral, and temporal resolutions that were designed to monitor and detect changes on the earth’s surface, however, it is not being utilized to its full potential, especially in data-poor areas. Advancements in indices, techniques, and the availability of multi-temporal and multi-spectral images, led to the improvement of monitoring and detecting droughts and surface water resources, however, there is still a need to improve indices in order to remedy cloud contamination and the problem of shadows in mountainous and built-up areas. Remotely sensed data has the potential to be used in data-scarce areas, such as Africa, where there are limited physical monitoring stations, due to the high costs involved and location. With these advancements, there is an urgent need for future studies to test the applicability of these satellites and indices, to improve drought early warning systems and preparedness and aid in proactive decision making. This approach allows for fast drought identification, and this is essential for drought-prone regions, like Africa, for water resource planning purposes, and can help decision makers set appropriate measures to alleviate future drought events.

Author Contributions

Conceptualization, T.D., M.D.S., and C.S.; writing—original draft preparation, T.D.B.; writing—review and editing, T.D., M.D.S., and C.S., supervision, T.D., M.D.S., and C.S.; funding acquisition, T.D. and T.D.B. All authors have read and agreed to the published version of the manuscript.

Funding

The National Research Foundation funded this research, grant number MND190827471371.

Conflicts of Interest

The authors declare no conflict of interest.

References

  1. Du, L.; Tian, Q.; Yu, T.; Meng, Q.; Jancso, T.; Udvardy, P.; Huang, Y. A comprehensive drought monitoring method integrating MODIS and TRMM data. Int. J. Appl. Earth Obs. Geoinf. 2013, 23, 245–253. [Google Scholar] [CrossRef]
  2. Keshavarz, M.R.; Vazifedoust, M.; Alizadeh, A. Drought monitoring using a Soil Wetness Deficit Index (SWDI) derived from MODIS satellite data. Agric. Water Manag. 2014, 132, 37–45. [Google Scholar] [CrossRef]
  3. Huang, S.; Li, P.; Huang, Q.; Leng, G.; Hou, B.; Ma, L. The propagation from meteorological to hydrological drought and its potential influence factors. J. Hydrol. 2017, 547, 184–195. [Google Scholar] [CrossRef]
  4. Slette, I.J.; Post, A.K.; Awad, M.; Even, T.; Punzalan, A.; Williams, S.; Smith, M.D.; Knapp, A.K. How ecologists define drought, and why we should do better. Glob. Chang. Biol. 2019, 25, 3193–3200. [Google Scholar] [CrossRef]
  5. Park, S.; Im, J.; Park, S.; Rhee, J. Drought monitoring using high resolution soil moisture through multi-sensor satellite data fusion over the Korean peninsula. Agric. For. Meteorol. 2017, 237, 257–269. [Google Scholar] [CrossRef]
  6. Wilhite, D.A.; Svoboda, M.; Hayes, M.J. Understanding the complex impacts of drought: A key to enhancing drought mitigation and preparedness. Water Resour. Manag. 2007, 21, 763–774. [Google Scholar] [CrossRef] [Green Version]
  7. Verner, D.; Treguer, D.; Redwood, J.; Christensen, J. Climate change, variability and droughts in Morocco. In Climate Variability, Drought, and Drought Management in Morocco’s Agricultural Sector; World Bank Group: Washington, DC, USA, 2018; pp. 1–4. [Google Scholar]
  8. Bhuiyan, C. Various drought Indices for Monitoring Drought Condition in Aravalli Terrain of India; Indian Institute of Technology Kanpur: Kanpur, India, 2004. [Google Scholar]
  9. World Health Organization. Environmental Health Challenges in Mauritania. 2013. Available online: https://www.who.int/features/2013/mauritania_environmental_health/en/ (accessed on 31 March 2020).
  10. Giannini, A.; Krishnamurthy, P.K.; Cousin, R.; Labidi, N.; Choularton, R.J. Climate risk and food security in Mali: A historical perspective on adaptation. Earth’s Future 2017, 5, 144–157. [Google Scholar] [CrossRef] [Green Version]
  11. The New Humanitarian. Drought in Africa Leaves 45 Million in Need across 14 Countries. 2019. Available online: https://www.thenewhumanitarian.org/analysis/2019/06/10/drought-africa-2019-45-million-in-need (accessed on 2 April 2020).
  12. Otto, F.E.L.; Wolski, P.; Lehner, F.; Tebaldi, C.; van Oldenborgh, G.J.; Hogesteeger, S.; Singh, R.; Holden, P.; Fučkar, N.S.; Odoulami, R.C.; et al. Anthropogenic influence on the drivers of the Western Cape drought 2015–2017. Environ. Res. Lett. 2018, 13, 124010. [Google Scholar] [CrossRef]
  13. Haile, G.G.; Tang, Q.; Sun, S.; Huang, Z.; Zhang, X.; Liu, X. Droughts in East Africa: Causes, impacts and resilience. Earth Sci. Rev. 2019, 193, 146–161. [Google Scholar] [CrossRef]
  14. Moyo, H. Half a Million Face Hunger in Drought-Stricken Lesotho. 2020. Available online: https://www.iol.co.za/news/africa/half-a-million-face-hunger-in-drought-stricken-lesotho-42886616 (accessed on 2 April 2020).
  15. Sheffield, J.; Wood, E.; Pan, M.; Beck, H.E.; Coccia, G.; Serrat-Capdevila, A.; Verbist, K. Satellite Remote Sensing for Water Resources Management: Potential for Supporting Sustainable Development in Data-Poor Regions. Water Resour. Res. 2018, 54, 9724–9758. [Google Scholar] [CrossRef] [Green Version]
  16. Huang, C.; Chen, Y.; Zhang, S.; Wu, J. Detecting, Extracting, and Monitoring Surface Water from Space Using Optical Sensors: A Review. Rev. Geophys. 2018, 56, 333–360. [Google Scholar] [CrossRef]
  17. Zhou, Y.; Dong, J.; Xiao, X.; Xiao, T.; Yang, Z.; Zhao, G.; Xiao, X.; Qin, Y. Open Surface Water Mapping Algorithms: A Comparison of Water-Related Spectral Indices and Sensors. Water 2017, 9, 256. [Google Scholar] [CrossRef]
  18. Zhang, A.; Jia, G.; Wang, H. Improving meteorological drought monitoring capability over tropical and subtropical water-limited ecosystems: Evaluation and ensamble of the Microwave Integrated Drought Index. Environ. Res. Lett. 2019, 14, 1–14. [Google Scholar] [CrossRef]
  19. Sheffield, J.; Wood, E.F.; Roderick, M.L. Little change in global drought over the past 60 years. Nature 2012, 491, 435–438. [Google Scholar] [CrossRef]
  20. West, H.; Quinn, N.; Horswell, M. Remote sensing for drought monitoring & impact assessment: Progress, past challenges and future opportunities. Remote Sens. Environ. 2019, 232, 111291. [Google Scholar] [CrossRef]
  21. Sorensen, P. The chronic water shortage in Cape Town and survival strategies. Int. J. Environ. Stud. 2017, 74, 515–527. [Google Scholar] [CrossRef]
  22. Hagenlocher, M.; Meza, I.; Anderson, C.C.; Min, A.; Renaud, F.G.; Walz, Y.; Siebert, S.; Sebesvari, Z. Drought vulnerability and risk assessments: State of the art, persistent gaps, and research agenda. Environ. Res. Lett. 2019, 14, 083002. [Google Scholar] [CrossRef]
  23. Panu, U.S.; Sharma, T.C. Challenges in drought research: Some perspectives and future directions. Hydrol. Sci. J. 2002, 47, S19–S30. [Google Scholar] [CrossRef] [Green Version]
  24. Abiodun, B.J.; Makhanya, N.; Petja, B.; Abatan, A.A.; Oguntunde, P.G. Future projection of droughts over major river basins in Southern Africa at specific global warming levels. Theor. Appl. Clim. 2019, 137, 1785–1799. [Google Scholar] [CrossRef]
  25. Botai, C.M.; Botai, J.O.; de Wit, J.P.; Ncongwane, K.P.; Adeola, A.M. Drought characteristics over the Wastern Cape Province, South Africa. Water 2017, 9, 876. [Google Scholar] [CrossRef] [Green Version]
  26. Du, Z.; Li, W.; Zhou, D.; Tian, L.; Ling, F.; Wang, H.; Gui, Y.; Sun, B. Analysis of Landsat-8 OLI imagery for land surface water mapping. Remote Sens. Lett. 2014, 5, 672–681. [Google Scholar] [CrossRef]
  27. Masocha, M.; Dube, T.; Makore, M.; Shekede, M.D.; Funani, J. Surface water bodies mapping in Zimbabwe using landsat 8 OLI multispectral imagery: A comparison of multiple water indices. Phys. Chem. Earth Parts A/B/C 2018, 106, 63–67. [Google Scholar] [CrossRef]
  28. AghaKouchak, A.; Farahmand, A.M.; Melton, F.S.; Teixeira, J.P.; Anderson, M.C.; Wardlow, B.D.; Hain, C.R. Remote sensing of drought: Progress, challenges and opportunities. Rev. Geophys. 2015, 53, 452–480. [Google Scholar] [CrossRef] [Green Version]
  29. Mishra, A.K.; Singh, V.P. A review of drought concepts. J. Hydrol. 2010, 391, 202–216. [Google Scholar] [CrossRef]
  30. Guo, Y.; Huang, S.; Huang, Q.; Leng, G.; Fang, W.; Wang, L.; Wang, H. Propagation thresholds of meteorological drought for triggering hydrological drought at various levels. Sci. Total Environ. 2020, 712, 136502. [Google Scholar] [CrossRef]
  31. Michaelides, S.; Levizzani, V.; Anagnostou, E.; Bauer, P.; Kasparis, T.; Lane, J.E. Precipitation: Measurement, remote sensing, climatology and modeling. Atmos. Res. 2009, 98, 512–533. [Google Scholar] [CrossRef]
  32. Park, S.; Im, J.; Jang, E.; Rhee, J. Drought assessment and monitoring through blending of multi-sensor indices using machine learning approaches for different climate regions. Agric. For. Meteorol. 2016, 216, 157–169. [Google Scholar] [CrossRef]
  33. Jiao, W.; Tian, C.; Chang, Q.; Novick, K.A.; Wang, L. A new multi-sensor integrated index for drought monitoring. Agric. For. Meteorol. 2019, 268, 74–85. [Google Scholar] [CrossRef] [Green Version]
  34. Urban, M.; Berger, C.; Mudau, T.E.; Heckel, K.; Truckenbrodt, J.; Odipo, V.O.; Smit, I.P.; Schmullius, C. Surface Moisture and Vegetation Cover Analysis for Drought Monitoring in the Southern Kruger National Park Using Sentinel-1, Sentinel-2, and Landsat-8. Remote Sens. 2018, 10, 1482. [Google Scholar] [CrossRef] [Green Version]
  35. Eltahir, E.A.B.; Yeh, P.J.-F. On the asymmetric response of aquifer water level to floods and droughts in Illinois. Water Resour. Res. 1999, 35, 1199–1217. [Google Scholar] [CrossRef] [Green Version]
  36. Yeh, P.J.-F.; Swenson, S.C.; Famiglietti, J.S.; Rodell, M. Remote sensing of groundwater storage changes in Illinois using the Gravity Recovery and Climate Experiment (GRACE). Water Resour. Res. 2006, 42. [Google Scholar] [CrossRef]
  37. Marsh, T.J.; Monkhouse, R.A.; Arnell, N.W.; Lees, M.L.; Reynard, R.S. The 1988–1992 Drought; NERC Institute of Hydrology: Wallingford, UK, 1994. [Google Scholar]
  38. Frischen, J.; Meza, I.; Rupp, D.; Wietler, K.; Hagenlocher, M. Drought Risk to Agricultural Systems in Zimbabwe: A Spatial Analysis of Hazard, Exposure, and Vulnerability. Sustainability 2020, 12, 752. [Google Scholar] [CrossRef] [Green Version]
  39. Muller, J.C. Adaptiong to climate change and addressing drought—Learning from the Red Cross Red Crescent experiences in the Horn of Africa. Weather Clim. Extrem. 2014, 3, 31–36. [Google Scholar] [CrossRef] [Green Version]
  40. Qu, C.; Hao, X.; Qu, J.J. Monitoring Extreme Agricultural Drought over the Horn of Africa (HOA) Using Remote Sensing Measurements. Remote Sens. 2019, 11, 902. [Google Scholar] [CrossRef] [Green Version]
  41. Maphosa, B. Lessons from the 1992 drought in Zimbabwe: The quest for alternative food policies. Nord. J. Afr. Stud. 1994, 3, 53–58. [Google Scholar]
  42. Sousa, P.M.; Blamey, R.C.; Reason, C.J.C.; Ramos, A.M.; Trigo, R.M. The ‘Day Zero’ Cape Town drought and the poleward migration of moisture corridors. Environ. Res. Lett. 2018, 13, 124025. [Google Scholar] [CrossRef] [Green Version]
  43. City of Cape Town. Water Restrictions; City of Cape Town: Cape Town, South Africa, 2018. [Google Scholar]
  44. Muller, M. Lessons from Cape Town’s drought. Nature 2018, 559, 174–176. [Google Scholar] [CrossRef] [Green Version]
  45. Zhang, X.; Chen, N.; Sheng, H.; Ip, C.; Yang, L.; Chen, Y.; Sang, Z.; Tadesse, T.; Lim, T.P.Y.; Rajabifard, A.; et al. Urban drought challenge to 2030 sustainable development goals. Sci. Total Environ. 2019, 693, 133536. [Google Scholar] [CrossRef]
  46. Nilsson, M.; Griggs, D.; Visbeck, M. Policy: Map the interactions between Sustainable Development Goals. Nature 2016, 534, 320–322. [Google Scholar] [CrossRef]
  47. Bijeesh, T.V.; Narasimhamurthy, K.N. Surface water detection and delineation using remote sensing images: A review of methods and algorithms. Sustain. Water Resour. Manag. 2020, 6, 1–23. [Google Scholar] [CrossRef]
  48. Abiy, A.Z.; Melesse, A.M.; Seyoum, W.M.; Abtew, W. Drought and climate telecommunication. In Extreme Hydrology and Climate Variability: Monitoring, Modelling, Adaptation and Mitigation; Elsevier Science Publishing Co Inc.: Amsterdam, The Netherlands, 2019; pp. 275–295. [Google Scholar]
  49. Menarguez, M. Global Water Body Mapping from 1984 to 2015 Using Global High Resolution Multispectral Satellite Imagery; University of Oklahoma: Norman, OK, USA, 2015. [Google Scholar]
  50. Che, X.; Feng, M.; Jiang, H.; Song, J.; Jia, B. Downscaling MODIS Surface Reflectance to Improve Water Body Extraction. Adv. Meteorol. 2015, 2015, 424291. [Google Scholar] [CrossRef] [Green Version]
  51. Li, W.; Du, Z.; Ling, F.; Zhou, D.; Wang, H.; Gui, Y.; Sun, B.; Zhang, X. A comparison of land surface water mapping using the Normalised Difference Index from TM, ETM+ and ALI. Remote Sens. 2013, 5, 5530–5549. [Google Scholar] [CrossRef] [Green Version]
  52. Moser, L.; Voigt, S.; Schoepfer, E.; Palmer, S.C.J. Multitemporal Wetland Monitoring in Sub-Saharan West-Africa Using Medium Resolution Optical Satellite Data. IEEE J. Sel. Top. Appl. Earth Obs. Remote Sens. 2014, 7, 3402–3415. [Google Scholar] [CrossRef] [Green Version]
  53. D’Andrimont, R.; Defourny, P. Monitoring African water bodies from twice-daily MODIS observation. GISci. Remote Sens. 2017, 55, 130–153. [Google Scholar] [CrossRef]
  54. Caccamo, G.; Chisholm, L.; Bradstock, R.; Puotinen, M. Assessing the sensitivity of MODIS to monitor drought in high biomass ecosystems. Remote Sens. Environ. 2011, 115, 2626–2639. [Google Scholar] [CrossRef]
  55. Klisch, A.; Atzberger, C. Operational Drought Monitoring in Kenya Using MODIS NDVI Time Series. Remote Sens. 2016, 8, 267. [Google Scholar] [CrossRef] [Green Version]
  56. Henchiri, M.; Liu, Q.; Essifi, B.; Ali, S.; Kalisa, W.; Zhang, S.; Yun, B.; Zhang, J. Identification of drought and performance evaluation of MODIS and TRMM through remote sensing: A case study in North and West Africa during 2002–2018. Preprints 2020, 1, 1–16. [Google Scholar]
  57. Yan, Y.-E.; Ouyang, Z.-T.; Guo, H.-Q.; Jin, S.-S.; Zhao, B. Detecting the spatiotemporal changes of tidal flood in the estuarine wetland by using MODIS time series data. J. Hydrol. 2010, 384, 156–163. [Google Scholar] [CrossRef]
  58. Bergé-Nguyen, M.; Crétaux, J.-F. Inundations in the Inner Niger Delta: Monitoring and Analysis Using MODIS and Global Precipitation Datasets. Remote Sens. 2015, 7, 2127–2151. [Google Scholar] [CrossRef] [Green Version]
  59. Unganai, L.S.; Kogan, F.N. Drought Monitoring and Corn Yield Estimation in Southern Africa from AVHRR Data. Remote Sens. Environ. 1998, 63, 219–232. [Google Scholar] [CrossRef]
  60. Anyamba, A.; Tucker, C.J. Analysis of Sahelian vegetation dynamics using NOAA-AVHRR NDVI data from 1981–2003. J. Arid. Environ. 2005, 63, 596–614. [Google Scholar] [CrossRef]
  61. Rojas, O.; Vrieling, A.; Rembold, F. Assessing drought probability for agricultural areas in Africa with coarse resolution remote sensing imagery. Remote Sens. Environ. 2011, 115, 343–352. [Google Scholar] [CrossRef]
  62. Matthews, M.W.; Bernard, S.; Winter, K. Remote sensing of cyanobacteria-dominant algal blooms and water quality parameters in Zeekoevlei, a small hypertrophic lake, using MERIS. Remote Sens. Environ. 2010, 114, 2070–2087. [Google Scholar] [CrossRef]
  63. Chawira, M.; Dube, T.; Gumindoga, W. Remote sensing based water quality monitoring in Chivero and Manyame lakes of Zimbabwe. Phys. Chem. Earth Parts A/B/C 2013, 66, 38–44. [Google Scholar] [CrossRef]
  64. Haas, E.; Bartholomé, E.; Combal, B. Time series analysis of optical remote sensing data for the mapping of temporary surface water bodies in sub-Saharan western Africa. J. Hydrol. 2009, 370, 52–63. [Google Scholar] [CrossRef]
  65. USGS. What Is the Landsat Satellite Program and Why Is It Important? 2020. Available online: https://www.usgs.gov/faqs/what-landsat-satellite-program-and-why-it-important?qt-news_science_products=0#qt-news_science_products (accessed on 21 August 2020).
  66. Forkuor, G.; Dimobe, K.; Serme, I.; Tondoh, J.E. Landsat-8 vs. Sentinel-2: Examining the added value of sentinel-2′s red-edge bands to land-use and land-cover mapping in Burkina Faso. GISci. Remote Sens. 2018, 55, 331–354. [Google Scholar] [CrossRef]
  67. Yang, X.; Zhao, S.; Qin, X.; Zhao, N.; Liang, L. Mapping of Urban Surface Water Bodies from Sentinel-2 MSI Imagery at 10 m Resolution via NDWI-Based Image Sharpening. Remote Sens. 2017, 9, 596. [Google Scholar] [CrossRef] [Green Version]
  68. Dotzler, S.; Hill, J.; Buddenbaum, H.; Stoffels, J. The Potential of EnMAP and Sentinel-2 Data for Detecting Drought Stress Phenomena in Deciduous Forest Communities. Remote Sens. 2015, 7, 14227–14258. [Google Scholar] [CrossRef] [Green Version]
  69. Laurin, G.V.; Puletti, N.; Hawthorne, W.; Liesenberg, V.; Corona, P.; Papale, D.; Chen, Q.; Valentini, R. Discrimination of tropical forest types, dominant species, and mapping of functional guilds by hyperspectral and simulated multispectral Sentinel-2 data. Remote Sens. Environ. 2016, 176, 163–176. [Google Scholar] [CrossRef] [Green Version]
  70. Puletti, N.; Mattioli, W.; Bussotti, F.; Pollastrini, M. Monitoring the effects of extreme drought events on forest health by Sentinel-2 imagery. J. Appl. Remote Sens. 2019, 13. [Google Scholar] [CrossRef]
  71. Jin, C.; Xiao, X.; Merbold, L.; Arneth, A.; Veenendaal, E.; Kutsch, W.L. Phenology and gross primary production of two dominant savanna woodland ecosystems in Southern Africa. Remote Sens. Environ. 2013, 135, 189–201. [Google Scholar] [CrossRef]
  72. Dinku, T.; Funk, C.; Peterson, P.; Maidment, R.; Tadesse, T.; Gadain, H.; Ceccato, P. Validation of the CHIRPS satellite rainfall estimates over eastern Africa. Q. J. R. Meteorol. Soc. 2018, 144, 292–312. [Google Scholar] [CrossRef] [Green Version]
  73. Seyama, E.S.; Masocha, M.; Dube, T. Evaluation of TAMSAT satellite rainfall estimates for southern Africa: A comparative approach. Phys. Chem. Earth Parts A/B/C 2019, 112, 141–153. [Google Scholar] [CrossRef]
  74. Chappell, A.; Renzullo, L.J.; Raupach, T.H.; Haylock, M. Evaluating geostatistical methods of blending satellite and gauge data to estimate near real-time daily rainfall for Australia. J. Hydrol. 2013, 493, 105–114. [Google Scholar] [CrossRef]
  75. Kiptala, J.K.; Mohamed, Y.; Mul, M.L.; van der Zaag, P. Mapping evapotranspiration trends using MODIS and SEBAL model in a data scarce and heterogeneous landscape in Eastern Africa. Water Resour. Res. 2013, 49, 8495–8510. [Google Scholar] [CrossRef] [Green Version]
  76. Alemayehu, T.; van Griensven, A.; Senay, G.B.; Bauwens, W. Evapotranspiration Mapping in a Heterogeneous Landscape Using Remote Sensing and Global Weather Datasets: Application to the Mara Basin, East Africa. Remote Sens. 2017, 9, 390. [Google Scholar] [CrossRef] [Green Version]
  77. Robock, A.; Vinnikov, K.Y.; Srinivasan, G.; Entin, J.K.; Hollinger, S.E.; Speranskaya, N.A.; Liu, S.; Namkhai, A. The Global Soil Moisture Data Bank. Bull. Am. Meteorol. Soc. 2000, 81, 1281–1299. [Google Scholar] [CrossRef] [Green Version]
  78. Fontanet, M.; Fernàndez-Garcia, D.; Ferrer, F. The value of satellite remote sensing soil moisture data and the DISPATCH algorithm in irrigation fields. Hydrol. Earth Syst. Sci. 2018, 22, 5889–5900. [Google Scholar] [CrossRef] [Green Version]
  79. Xulu, S.; Peerbhay, K.; Gebreslasie, M.; Ismail, R. Drought Influence on Forest Plantations in Zululand, South Africa, Using MODIS Time Series and Climate Data. Forests 2018, 9, 528. [Google Scholar] [CrossRef] [Green Version]
  80. Ugbaje, S.U.; Bishop, T.F.A. Hydrological Control of Vegetation Greenness Dynamics in Africa: A Multivariate Analysis Using Satellite Observed Soil Moisture, Terrestrial Water Storage and Precipitation. Land 2020, 9, 15. [Google Scholar] [CrossRef] [Green Version]
  81. Agutu, N.O.; Awange, J.; Ndehedehe, C.E.; Kirimi, F.; Kuhn, M. GRACE-derived groundwater changes over Greater Horn of Africa: Temporal variability and the potential for irrigated agriculture. Sci. Total Environ. 2019, 693, 133467. [Google Scholar] [CrossRef] [PubMed]
  82. Münch, Z.; Conrad, J. Remote sensing and GIS based determination of groundwater dependent ecosystems in the Western Cape, South Africa. Hydrogeol. J. 2006, 15, 19–28. [Google Scholar] [CrossRef]
  83. Nanteza, J.; de Linage, C.R.; Thomas, B.F.; Famiglietti, J.S. Monitoring groundwater storage changes in complex basement aquifers: An evaluation of the GRACE satellites over East Africa. Water Resour. Res. 2016, 52, 9542–9564. [Google Scholar] [CrossRef]
  84. Bonsor, H.C.; Shamsudduha, M.; Marchant, B.; Macdonald, A.M.; Taylor, R. Seasonal and Decadal Groundwater Changes in African Sedimentary Aquifers Estimated Using GRACE Products and LSMs. Remote Sens. 2018, 10, 904. [Google Scholar] [CrossRef] [Green Version]
  85. Frappart, F. Groundwater Storage Changes in the Major North African Transboundary Aquifer Systems during the GRACE Era (2003–2016). Water 2020, 12, 2669. [Google Scholar] [CrossRef]
  86. Skaskevych, A.; Lee, J.; Jung, H.C.; Bolten, J.; David, J.L.; Policelli, F.S.; Goni, I.B.; Favreau, G.; San, S.; Ichoku, C.M. Application of GRACE to the estimation of groundwater storage change in a data-poor region: A case study of Ngadda catchment in the Lake Chad Basin. Hydrol. Process. 2020, 34, 941–955. [Google Scholar] [CrossRef]
  87. Nhamo, L.; Ebrahim, G.Y.; Mabhaudhi, T.; Mpandeli, S.; Magombeyi, M.; Chitakira, M.; Magidi, J.; Sibanda, M. An assessment of groundwater use in irrigated agriculture using multi-spectral remote sensing. Phys. Chem. Earth Parts A/B/C 2020, 115, 102810. [Google Scholar] [CrossRef]
  88. Bruckner, M. Paleoclimatology: How Can We Infer Past Climates? 2020. Available online: https://serc.carleton.edu/microbelife/topics/proxies/paleoclimate.html (accessed on 20 April 2020).
  89. Chapuis, R.P. Overdumped slug test in monitoring wells: Review of interpretation methods with mathematical, physical, and numerical analysis of storavity influence. Can. Geotech. J. 1998, 35, 697–719. [Google Scholar] [CrossRef]
  90. Donald, W.; Meals, A.; Steven, A. Surface Water Flow Measurement for Water Quality Monitoring Projects; U.S. Environmental Protection Agency: Fairfax, VA, USA, 2008. [Google Scholar]
  91. Janke, R.; Murray, R.; Uber, J.; Taxon, T. Comparison of Physical Sampling and Real-Time Monitoring Strategies for Designing a Contamination Warning System in a Drinking Water Distribution System. J. Water Resour. Plan. Manag. 2006, 132, 310–313. [Google Scholar] [CrossRef]
  92. Wils, T.H.G.; Sass-Klaassen, U.G.W.; Eshetu, Z.; Bräuning, A.; Gebrekirstos, A.; Couralet, C.; Robertson, I.; Touchan, R.; Koprowski, M.; Conway, D.; et al. Dendrochronology in the dry tropics: The Ethiopian case. Trees 2010, 25, 345–354. [Google Scholar] [CrossRef]
  93. Bradley, R.S. High-Resolution Paleoclimatology. Dendroclimatology 2010, 11, 3–15. [Google Scholar] [CrossRef] [Green Version]
  94. World Bank Group. Measuring Precipitation: On the Ground and from Space. 2020. Available online: https://olc.worldbank.org/sites/default/files/sco/E7B1C4DE-C187-5EDB-3EF2897802DEA3BF/Nasa/chapter2.html#:~:text=Today%2C%20scientists%20can%20measure%20precipitation,and%20Earth%2Dobserving%20satellites) (accessed on 27 November 2020).
  95. Alsdorf, D.E.; Rodríguez, E.; Lettenmaier, D.P. Measuring surface water from space. Rev. Geophys. 2007, 45. [Google Scholar] [CrossRef]
  96. Nirupam-Dwivedi, A.K.; Solanki, S.S. Innovative design of dam water level sensor. Sens. Transducers 2015, 189, 150–156. [Google Scholar]
  97. Palmer, S.C.; Kutser, T.; Hunter, P.D. Remote sensing of inland waters: Challenges, progress and future directions. Remote Sens. Environ. 2015, 157, 1–8. [Google Scholar] [CrossRef] [Green Version]
  98. Rhee, J.; Im, J.; Carbone, G.J. Monitoring agricultural drought for arid and humid regions using multi-sensor remote sensing data. Remote Sens. Environ. 2010, 114, 2875–2887. [Google Scholar] [CrossRef]
  99. Crétaux, J.-F.; Birkett, C. Lake studies from satellite radar altimetry. C. R. Geosci. 2006, 338, 1098–1112. [Google Scholar] [CrossRef]
  100. Khaki, M.; Awange, J. Altimetry-derived surface water data assimilation over the Nile Basin. Sci. Total Environ. 2020, 735, 139008. [Google Scholar] [CrossRef]
  101. Sulistioadi, Y.B.; Tseng, K.H.; Shum, C.K.; Hidayat, H.; Sumaryono, M.; Suhardiman, A.; Setiawan, F.; Sunarso, S. Satellite radar altimery for monitoring small rivers and lakes in Indonesia. Hydrol. Earth Syst. Sci. 2015, 19, 341–359. [Google Scholar] [CrossRef] [Green Version]
  102. Su, Z.; He, Y.; Dong, X.; Wang, L. Drought Monitoring and Assessment Using Remote Sensing. In Flood Monitoring through Remote Sensing; Springer: Berlin/Heidelberg, Germany, 2016; pp. 151–172. [Google Scholar]
  103. Mckee, T.B.; Doesken, N.J.; Kleist, J. The relationship of drought frequency and duration to time scales. In Proceedings of the Eighth Conference on Applied Climatology, Anaheim, CA, USA, 17–22 January 1993; American Meteorological Society: Boston, MA, USA, 1993; pp. 179–184. [Google Scholar]
  104. Wu, H.; Hayes, M.J.; Weiss, A.; Hu, Q. An evaluation of the Standardized Precipitation Index, the China-Z Index and the statistical Z-Score. Int. J. Clim. 2001, 21, 745–758. [Google Scholar] [CrossRef]
  105. Palmer, W.C. Meteorological Drought. In Research Papers; U.S. V Commerce: Washington, DC, USA, 1965; pp. 45–58. [Google Scholar]
  106. Jacobi, J.; Perrone, D.; Duncan, L.L.; Hornberger, G. A tool for calculating the Palmer drought indices. Water Resour. Res. 2013, 49, 6086–6089. [Google Scholar] [CrossRef]
  107. Dong, Z.; Wang, Z.; Liu, D.; Song, K.; Li, L.; Jia, M.; Ding, Z. Mapping wetland areas using Landsat-derived NDVI and LSWI: A case study of West Songen Plain, Northeast China. Indian Soc. Remote Sens. 2014, 42, 569–576. [Google Scholar] [CrossRef]
  108. Kogan, F. Application of vegetation index and brightness temperature for drought detection. Adv. Space Res. 1995, 15, 91–100. [Google Scholar] [CrossRef]
  109. Legesse, G.; Suryabhagavan, K.V. Remote sensing and GIS based agricultural drought asssessment in East Shewa Zone, Ethiopia. Trop. Ecol. 2014, 55, 349–363. [Google Scholar]
  110. Suryabhagavan, K.V. GIS-based climate variability and drought characterization in Ethiopia over three decades. Weather Clim. Extrem. 2017, 15, 11–23. [Google Scholar] [CrossRef]
  111. McFeeters, S.K. The use of Normalised Difference Water Index (NDWI) in the delineation of open water features. Int. J. Remote Sens. 1996, 17, 1425–1432. [Google Scholar] [CrossRef]
  112. Sarp, G.; Ozcelik, M. Water body extraction and change detection using time series: A case study of Lake Burdur, Turkey. J. Taibah Univ. Sci. 2017, 11, 381–391. [Google Scholar] [CrossRef] [Green Version]
  113. Xu, H. Modification of the Normalised Difference Water Index (NDWI) to enhance open water features in remotely sensed imagery. Int. J. Remote Sens. 2006, 27, 3025–3033. [Google Scholar] [CrossRef]
  114. Chandrasekar, K.; Sai, M.V.R.S.; Roy, P.S.; Dwevedi, R.S. Land Surface Water Index (LSWI) response to rainfall and NDVI using the MODIS Vegetation Index product. Int. J. Remote Sens. 2010, 31, 3987–4005. [Google Scholar] [CrossRef]
  115. Feyisa, G.L.; Meilby, H.; Fensholt, R.; Proud, S.R. Automated Water Extraction Index: A new technique for surface water mapping using Landsat imagery. Remote Sens. Environ. 2014, 140, 23–35. [Google Scholar] [CrossRef]
  116. Tirivarombo, S.; Hughes, D. Regional droughts and food security relationships in the Zambezi River Basin. Phys. Chem. Earth Parts A/B/C 2011, 36, 977–983. [Google Scholar] [CrossRef]
  117. Chisadza, B.; Tumbare, M.J.; Nyabeze, W.R.; Nhapi, I. Linkagesbetween local knowledge drought forecasting indicators and scientific drought forecasting parameters in the Limpopo River Basin in Southern Africa. Int. J. Disaster Risk Reduct. 2015, 12, 226–233. [Google Scholar] [CrossRef]
  118. Khezazna, A.; Amarchi, H.; Derdous, O.; Bousakhria, F. Drought monitoring in the Seybouse basin (Algeria) over the last decades. J. Water Land Dev. 2017, 33, 79–88. [Google Scholar] [CrossRef] [Green Version]
  119. Tirivarombo, S.; Osupile, D.; Eliasson, P.E. Drought monitoring and analysis: Standardised Precipitation Evapotranspiration Index (SPEI) and Standardised Precipitation Index (SPI). Phys. Chem. Earth Parts A/B/C 2018, 106, 1–10. [Google Scholar] [CrossRef]
  120. Lawal, S.; Lennard, C.; Jack, C.; Wolski, P.; Hewitson, B.; Abiodun, B. The observed and model-simulated response of southern African vegetation to drought. Agric. For. Meteorol. 2019, 279, 107698. [Google Scholar] [CrossRef]
  121. Kalisa, W.; Zhang, J.; Igbawua, T.; Ujoh, F.; Ebohon, O.J.; Namugize, J.N.; Yao, F. Spatio-temporal analysis of drought and return periods over the East African region using Standardised Precipitation Index from 1920 to 2016. Agric. Water Manag. 2020, 237, 1–13. [Google Scholar] [CrossRef]
  122. Mehta, V.M.; Wang, H.; Mendoza, K.; Rosenberg, N.J. Predictability and prediction of decadal hydrologic cycles: A case study in Southern Africa. Weather Clim. Extrem. 2014, 3, 47–53. [Google Scholar] [CrossRef] [Green Version]
  123. Zeleke, T.T.; Giorgi, F.; Diro, G.T.; Zaitchik, B.F. Trend and periodicity of drought over Ethiopia. Int. J. Clim. 2017, 37, 4733–4748. [Google Scholar] [CrossRef]
  124. Asfaw, A.; Simane, B.; Hassen, A.; Bantider, A. Variability and time series trend analysis of rainfall and temperature in northcentral Ethiopia: A case study in Woleka sub-basin. Weather Clim. Extrem. 2018, 19, 29–41. [Google Scholar] [CrossRef]
  125. Orimoloye, I.; Ololade, O.O.; Mazinyo, S.; Kalumba, A.; Ekundayo, O.; Busayo, E.; Akinsanola, A.; Nel, W. Spatial assessment of drought severity in Cape Town area, South Africa. Heliyon 2019, 5, e02148. [Google Scholar] [CrossRef] [Green Version]
  126. Ogunrinde, A.T.; Oguntunde, P.G.; Olasehinde, D.A.; Fasinmirin, J.T.; Akinwumiju, A.S. Drought spatiotemporal characterization using self-calibrating Palmer Drought Severity Index in the northern region of Nigeria. Results Eng. 2020, 5, 100088. [Google Scholar] [CrossRef]
  127. Gelassie, T.Y. Remote Sensing Evapotranspiration Using Geonetcast and In-Situ Data Streams for Drought Monitoring and Early Warning: Case Study for the Amhara Region in Ethiopia. Unpublished work, 2012. [Google Scholar]
  128. Tonini, F.; Jona-Lasinio, G.; Hochmair, H.H. Mapping return levels of absolute NDVI variations for the assessment of drought risk in Ethiopia. Int. J. Appl. Earth Obs. Geoinf. 2012, 18, 564–572. [Google Scholar] [CrossRef] [Green Version]
  129. Ghoneim, E.; Dorofeeva, A.; Benedetti, M.; Gamble, D.; Leonard, L. Vegetation Drought Analysis In Tunisia: A Geospatial Investigation. J. Atmos. Earth Sci. 2017, 1, 1–9. [Google Scholar] [CrossRef]
  130. Moeletsi, M.E.; Walker, S. Assessment of agricultural drought using a simple water balance model in the Free State Province of South Africa. Theor. Appl. Clim. 2011, 108, 425–450. [Google Scholar] [CrossRef]
  131. Jayanthi, H.; Husak, G.J.; Funk, C.; Magadzire, T.; Adoum, A.; Verdin, J.P. A probabilistic approach to assess agricultural drought risk to maize in Southern Africa and millet in Western Sahel using satellite estimated rainfall. Int. J. Disaster Risk Reduct. 2014, 10, 490–502. [Google Scholar] [CrossRef]
  132. El-Asmar, H.M.; Hereher, M.E.; el Kafrawy, S.B. Surface area change detection of the Burullus Lagoon, North of the Nile Delta, Egypt, using water indices: A remote sensing approach. Egypt. J. Remote Sens. Space Sci. 2013, 16, 119–123. [Google Scholar] [CrossRef] [Green Version]
  133. Asfaw, W.; Haile, A.T.; Rientjes, T. Combining multisource satellite data to estimate storage variation of a lake in the Rift Valley Basin, Ethiopia. Int. J. Appl. Earth Obs. Geoinf. 2020, 89, 102095. [Google Scholar] [CrossRef]
  134. Fujihara, Y.; Tanakamaru, H.; Tada, A.; Adam, B.M.A.; Elamin, K.A.E. Analysis of cropping patterns in Sudan’s Gash Spate Irrigation System using Landsat 8 images. J. Arid Environ. 2020, 173, 104044. [Google Scholar] [CrossRef]
  135. Malahlela, O.E. Inland waterbody mapping: Towards improving discrimination and extraction of inland surface water features. Int. J. Remote Sens. 2016, 37, 4574–4589. [Google Scholar] [CrossRef]
  136. Ndehedehe, C.E.; Ferreira, V.G.; Onojeghuo, A.O.; Agutu, N.O.; Emengini, E.; Getirana, A. Influence of global climate on freshwater changes in Africa’s largest endorheic basin using multi-scaled indicators. Sci. Total Environ. 2020, 737, 139643. [Google Scholar] [CrossRef]
  137. Slagter, B.; Tsendbazar, N.-E.; Vollrath, A.; Reiche, J. Mapping wetland characteristics using temporally dense Sentinel-1 and Sentinel-2 data: A case study in the St. Lucia wetlands, South Africa. Int. J. Appl. Earth Obs. Geoinf. 2020, 86, 102009. [Google Scholar] [CrossRef]
  138. Benefoh, D.T.; Villamor, G.B.; van Noordwijk, M.; Borgemeister, C.; Asante, W.A.; Asubonteng, K.O. Assessing land-use typologies and change intensities in a structurally complex Ghanaian cocoa landscape. Appl. Geogr. 2018, 99, 109–119. [Google Scholar] [CrossRef]
  139. Ali, D.A.; Deininger, K.; Monchuk, D. Using satellite imagery to assess impacts of soil and water conservation measures: Evidence from Ethiopia’s Tana-Beles watershed. Ecol. Econ. 2020, 169. [Google Scholar] [CrossRef] [Green Version]
  140. Danladi, I.B.; Gül, M.; Ateş, E. Response of the barrier island coastal region of southwestern Nigeria to climate and non-climate forcing. Afr. J. Mar. Sci. 2020, 42, 43–51. [Google Scholar] [CrossRef]
  141. Herndon, K.; Muench, R.E.; Cherrington, E.A.; Griffin, R.E. An Assessment of Surface Water Detection Methods for Water Resource Management in the Nigerien Sahel. Sensors 2020, 20, 431. [Google Scholar] [CrossRef] [PubMed] [Green Version]
Figure 1. Number of journal article publications on drought monitoring using remote sensing, surface water monitoring using remote sensing, and impacts of drought and/or climate variability.
Remotesensing 12 04184 g001
Figure 2. Global drought map, calculated by using the Global Precipitation Climatology Centre (GPCC) Drought Index, indicating the risk of drought occurrence globally, with red zones showing high risk areas and blue zones indicating low risk areas. (Source: National Integrated Drought Information System (NIDIS)).
Remotesensing 12 04184 g002
Table 1. Occurrence and impacts of major recorded droughts in Africa from the 1900s. No data available for Equatorial Guinea, Gabon, and Sierra Leone.
Region/CountryDrought YearsNumber of EventsDroughts Effects
North Africa 32
Algeria1910–1920; 1945–1947; 1973–1980; 1981–1983; 1999–2002590% loss of livestock in 1945; decrease in groundwater levels, shallow wells, dry springs, wildfires, crop loss, and production loss causing famine in 1966.
Egypt1972–1973; 1978–1987; 1990–2002; 2010–20114Unemployment rates increased, as 55% of the population were employed by the agricultural sector and riparian vegetation was severely affected.
Libya1945; 1950s; 1960s3The 1945 drought led to loss of cattle. The details are not available due to political issues and poor record keeping
Morocco1917–1920; 1930–1935; 1945–1950; 1981–1984; 1991–1995; 1999–2003; 2015–2016; 20188Disruptions in water supply, agricultural sector, and cereal production. In 1999, approximately 275,000 people were affected, and economic damages were $900 million.
Sudan1967–1973; 1980–1984; 1985–1993; 2008–2009; 2011–2012; 2017–20196Approximately 7 million people suffered from severe food insecurity in 2019, and approximately 21,000 people are experiencing famine conditions. In 2016, Sudan experienced agricultural losses of over 2 million dinars ($900 million).
Tunisia1961–1969; 1987–1988; 1993–1995; 1999–2002; 2000–2008; 2015–20166Disruption in water supply, increase in salinity in water retentions, and decreased production of grains and forages.
Central Africa 22
Angola1981–1985; 2004–2006; 2012–2013; 20194Approximately 1.8 million people and 2.3 million people were affected by the drought in 2012 and 2019, respectively, leading to food insecurity and malnourishment.
Cameroon1971; 1990; 2001; 2005; 2011–20155Cereal production fell by 30,000 tons in 2011 when compared to 2010, leading to inflation. In 2015, 2.7 million people suffered from food insecurity.
Central African Republic1963; 1983275% of Central African people rely on agriculture for their livelihoods, while 1.9 million people were experiencing severe food insecurity.
Chad1966–1967; 1969; 1993–1997; 2001–2005; 2012–2013; 2017–20186Drought and food insecurity affected approximately 3.4 million people, leading to high unemployment rates, as most people were employed in the agricultural sector and are dependent upon subsistence farming.
Democratic Republic (DR) of Congo1978; 1983; 2017–20203The 2017 drought period affected hydroelectric power generation and left 13.1 million people to be severely food insecure.
Sao Tome & Principe1947; 19832Drought led to food insecurity and severe famine and affected about 93,000 people.
West Africa 83
Benin1977; 1984; 1992; 2010–2013; 2017–20195In 2017, approximately 80% of the population dependent on the agricultural sector was unemployed.
Burkina Faso1968–1974; 1976; 1995; 1998; 2001; 2011; 2015–20197Drought during 2016, led to water shortages and affected 2 million people, as over 80% of the population relied on subsistence farming, leading to malnutrition and food insecurity.
Republic of Cabo Verde1941–1943; 1947–1948; 1969; 1977; 1998; 2002; 2015–20197Drought in the 1940s killed approximately 45,000 people due to starvation, and Santiago lost 65% of its population. In 2017, most farmers lost most of their production, which caused severe food insecurity in 2018.
Cote d’Ivoire1970–1974; 1976–1993; 2000–2005; 2006–2010; 2015–20195Drought in 2005 caused disruptions in agricultural sector, reducing harvests, per capita incomes, and water supply. In 2018, dams that supply 70% of cities ran dry.
Gambia1968–1974; 2012; 2016–20193The 2012 drought led to 70% of crop failure, triggering food insecurity and high unemployment rates, as 78% of the population is employed by the agricultural sector.
Ghana1980–1984; 1997–1998; 2006–2007; 2010–20124Approximately 35% of total food production was destroyed in the 1980s, leading to food shortages, and in 2006 there was a disruption of hydropower.
Guinea1980; 1998; 2015–2016; 2018–20194Drought led to disruption of income, interruptions in the agricultural sector, and disturbed river regimes, and 2.5 million people were affected in 2016 and suffered from severe food shortages.
Guinea Bissau1910; 1940; 1969; 1980; 2002; 2004–20066In 2002, drought affected 100,000 people, and 32,000 people in 2004 suffered from food security through disruptions in the production of agriculture and livestock.
Liberia1972–1973; 1983–1984; 1991–1992; 20194In 2019, 360,000 children under the age of five suffered from acute malnutrition due to extreme food shortages, which led to famine and death.
Mali1982–1984; 2001; 2005–2006; 2010–2011; 2017–20195Drought impacted farming, leading to starvation. In 2015, 300,000 people suffered from food insecurity. Mali experienced severe food shortages, which led to famine in 2019.
Mauritania1910–1916; 1940s; 1968–1974; 1976–1978; 1993–1997; 2010–2012; 2017–20197In 2011, drought led to poor harvests, loss of livestock, and an increase in food prices, and in 2012 approximately 700,000 people in southern regions were affected by food shortages, while in 2017 and 2018, 379,000 and 350,000 people were food insecure, respectively.
Niger1966; 1980; 1988–1990; 1997; 2001; 2005–2007; 2009; 2010–20128Recurrent droughts led to food crises, loss of livestock, and desertification; in 2010, 8 million people needed food due to failure of crops.
Nigeria1911–1914; 1951–1954; 1972–1973; 1984–1985; 2007; 20116Crop and livestock production are a source of income for many people in Nigeria. In 2010, 65% of the population worked in the agricultural sector, causing an increase in unemployment rates.
Senegal1979; 1980; 2002; 2011; 2014; 2017–20186In 2018, drought left 245,000 people food insecure and 23,000 children suffering from severe acute malnutrition due to crop failure and loss of livestock.
Togo1942–1943; 1971; 1976–1977; 1980; 1982–1983; 19896Severe famine due to a decrease in agricultural yields, death of livestock, and a decrease in agricultural revenue. 71% of Togolese were vulnerable to food security.
East Africa 64
Burundi1999; 2003–2005; 2008–20103In 2004, drought affected 2 million Burundians and affected the agricultural sector, which is the main source of livelihood for 90% of the population.
Comoros1981; 2011–20122Drought affected food security and led to food shortages.
Djibouti1980–1983; 1988; 1996–1999; 2005; 2008–20145In 2014, approximately 250,000 people were affected by more than four years of consecutive drought, and 18% of the population suffered from malnutrition due to crop loss and livestock.
Eritrea1993; 1998–1999; 2000–2004; 20084In 2004, 600,000 Eritreans were affected by drought, and 19% of the population suffered from acute malnutrition.
Ethiopia1973–1979; 1984–1985; 1997–1999; 2005; 2008–2009; 2015–20206Continuous droughts led to crop failure, which caused food insecurity and famine. In 1984, drought led to famine, which killed approximately 1 million people. In 2017, 7.7 million Ethiopians experienced severe famine and needed emergency food aid.
Kenya1971–1975; 1994–1996; 1999–2000; 2004–2006; 2008–2012; 2016–20206Drought led to disruptions in hydropower generation, increasing unemployment rates and loss of lives, crops, and livestock. In 2010, 10 million people were at risk of being food insecure due to failed harvests from drought conditions.
Madagascar1981; 1988; 2000–2002; 2005–2007; 2010–2012; 2015–20206In 2016, 1.1 million Malagasy suffered from food insecurity due to crop failure, as agricultural production was 90–95% lower than usual. At the end of 2019, more than 2.6 million Malagasy were affected by drought.
Mozambique1991–1992; 2001–2003; 2005–2007; 2016–20194In 2010, 81% of Mozambicans relied on agriculture for food and employment, therefore increasing unemployment rates and food shortages, and by 2019, more than 60,000 Mozambicans were affected and in some areas 60% of crops were lost.
Rwanda1976; 1984; 1989; 1996; 1999; 2003; 2016–20197More than 100,000 Rwandese were affected by drought in 2016 due to crop failure, which led to food shortages, and by 2017, 6.7 million Rwandese received food aid.
Somalia1964; 1999; 2004; 2005; 2008; 2010–20206The worst recorded drought after 60 years was experienced between 2010 and 2011, as more than 250,000 people died, and in 2017, 2.1 million Somalians were displaced by drought, and 6.7 million people suffered from food shortages.
Tanzania1996; 1999–2002; 2004–2006; 2011; 2016–201910In 2011, Tanzanians were affected by water and food shortages, and in 2017 the agricultural sector suffered a loss of approximately $200 million, causing food prices to increase by 12%.
Uganda1998–1999; 2005, 2008; 2010–2011; 2014–20195At least 200,000 Ugandans are affected every year due to drought conditions, and in 2010, the drought caused $1.2 billion of damages, which was equivalent to 7.5% of Uganda’s GDP.
Southern Africa 53
Botswana1981–1984; 1990; 2005; 2012–2013; 2014–20205In 2015, some areas experienced decreased water pressure and water supply was cut-off in some areas, and in 2019, 40,000 cattle died and led to a 70% drop in land cultivation.
Lesotho1968; 1983; 1990; 2002; 2007; 2011; 2015–20207In 2019, approximately 71,000 people suffered from food insecurity, and in 2020 approximately 500,000 people are threatened with hunger, and it is estimated that more than 30% of the population will experience acute food insecurity.
Malawi1987; 1991–1992; 2001–2002; 2005–2007; 2012; 2016–20176In 2016, maize production decreased by 12%, leading to food shortages. In 2017, 6.5 million Malawians were food insecure due to poor agricultural seasons.
Mauritius1999; 2011–20132The agricultural sector lost $160 million in 1999 due to crop failure and in 2011, only 15–20% of the harvest was viable.
Namibia1981; 1990; 1995; 1998; 2001; 2002; 2013; 2015–20208In 2013, there were 463,581 people that suffered from food insecurity, and in 2019 The Agricultural Bank of Namibia’s employment opportunities from the agricultural sector decreased from 34% in 2012 to 23%.
Seychelles1998–1999; 2010–20112The 1998 drought led to bleaching of 90% coral reefs.
South Africa1964; 1986; 1988; 1990; 1995; 2004; 2015–20197The worst drought experienced in 30 years occurred in 2015, and in 2018 approximately 3.7 million South Africans were affected by drought, leading to cut-offs of water supply in certain areas and to nation-wide water restrictions.
Swaziland1981; 1984; 1990; 2001; 2007; 2014–20205In 2016, 80,000 cattle died; and maize production dropped by 67% between 2015 and 2016, and in 2017, 308,059 people suffered from food insecurity.
Zambia1981; 1983; 1990–1995; 1999–2002; 2004–2005; 2015–20206Drought in 1981 led to disruption in maize production, which led to severe famine, and in 2019, 1.3 million people needed food aid, as maize production dropped from 2.4 million tons to 2 million tons, and there was a disruption in hydropower generation.
Zimbabwe1981–1983; 1986–1987; 1991–1992; 2010–2011; 2015–20205In 2019, 2.3 million Zimbabweans needed food aid, and maize production dropped by more than 70% compared to 2017/18, and the death of livestock affected 2.2 million people in cities and 5.5 million people in rural villages.
Table 2. Summary of remote sensors discussed.
SensorSwath Width (km)Temporal Resolution (Days)Number of BandsSpatial Resolution (m)Data AvailabilityUsesChallenges
Moderate Resolution Imaging Spectroradiometer (MODIS)23301–236250–10001999–presentMeasures distribution and size of aerosols, liquid water, and ice clouds, can also measure phytoplankton activity, floods, surface water bodies, and drought.Coarse spatial resolution, therefore cannot detect water bodies smaller than 4 km2.
National Oceanic and Atmospheric Administration’s Advanced Very High Resolution Radiometer (NOAA/AVHRR)29000.5511001978–presentAble to monitor floods, surface water bodies, clouds, sea surface temperature, and vegetation greenness. Coarse spatial resolution and susceptible to cloud contamination.
Medium Resolution Imaging Spectrometer (MERIS)11503153002002–2012Monitors ocean and land surfaces, water quality, and occurrence of floods. Has a 10-year data record and therefore cannot be used for long-term and near real-time monitoring.
Systeme Probatoire d’Observation dela Tarre (SPOT)60264–520–5.51986–presentUsed to detect surface water bodies and flood inundation. Data is not available freely and can only detect small water bodies due to small scene coverage.
IKONOS111.5–351–41999–presentCan map natural disasters, land cover changes, and almost all aspects of environmental studies.Data is not freely available and can only detect small water bodies due to small scene coverage.
RapidEye771–5.5552008–presentCan be used in agriculture, forestry, mining, and hydrological studies. Data is not freely available and has limited application for monitoring large water bodies due to small scene coverage.
Quickbird16.8/181–3.550.61–2.242001–2015Used for environmental studies to monitor changes in land use, agriculture, and forests. Has a 14-year data record and data is not freely available.
Landsat 1185184601972–1978Designed to monitor Earth’s resources, such as water resources and agriculture.Problem of cloud cover.
Landsat 2185184801975–1982Used to monitor changes on land surfaces, seas, and water resources.Technical issues caused it to be decommissioned.
Landsat 3185184801978–1983Designed to extend data acquisition of Earth resources by Landsat 1 and 2.Became decommissioned due to equipment failure.
Landsat 4185167301982–1993Designed to provide global satellite data on Earth resources.Banding affected data.
Landsat 5185167301984–2013Used to observe and monitor Earth’s land and coastal areas. Data loss occurred due to technical issues.
Landsat 618516815–301993Designed to continue the Landsat mission.Failed to reach orbit.
Landsat 718516815–301999–presentAimed to improve and extend medium-resolution data record of Earth’s surfaces.Issues of cloud cover affects data.
Landsat 818516915–302013–presentDesigned to continue to provide medium-resolution data of Earth’s surfaces and monitor land changes due to climate change, urbanization, drought, wildfires, and other natural and human-caused changes. Clouds contaminate images.
Sentinel-14006–12152014–presentDeveloped to provide data continuity for the SPOT and Landsat missions and used to monitor changes on the Earth’s surface.Satellite images may suffer from cloud contamination.
Sentinel-229051310–602015–presentUsed for land monitoring for mapping land cover and detecting land changes, and to monitor vegetation and burned areas.Cloud contamination affects images.
Sentinel-312701–2721–11300–10002016–presentDesigned to measure sea surface topography, and sea and land surface temperature for environmental and climate monitoring.Data missing due to anomalies.
Sentinel-480.130.5 nm–0.12 nm2019–presentDesigned to monitor air quality trace gases and aerosols over Europe.Only monitors Europe and does provide global data.
Sentinel-526701675.5–72017–presentAimed to monitor trace gas concentrations for atmospheric chemistry and climate changes.Data anomalies due to issues onboard.
Sentinel-5P2600178–502018–presentDesigned to provide data delivery for atmospheric services between 2015–2020.Data anomalies due to issues onboard.
Publisher’s Note: MDPI stays neutral with regard to jurisdictional claims in published maps and institutional affiliations.

