A Review of Remote Sensing Challenges for Food Security with Respect to Salinity and Drought Threats


1
Institute of Environmental Sciences (CML), Leiden University, Box 9518, 2300 RA Leiden, The Netherlands
2
Institute for Biodiversity and Ecosystem Dynamics, University of Amsterdam, 1090 GE Amsterdam, The Netherlands
*
Author to whom correspondence should be addressed.
Remote Sens. 2021, 13(1), 6; https://0-doi-org.brum.beds.ac.uk/10.3390/rs13010006
Submission received: 16 November 2020
/
Revised: 17 December 2020
/
Accepted: 18 December 2020
/
Published: 22 December 2020
(This article belongs to the Special Issue Remote Sensing for Biophysical and Biochemical Property of Crops and Natural Vegetation)
Abstract
:Drought and salinity stress are considered to be the two main factors limiting crop productivity. With climate change, these stresses are projected to increase, further exacerbating the risks to global food security. Consequently, to tackle this problem, better agricultural management is required on the basis of improved drought and salinity stress monitoring capabilities. Remote sensing makes it possible to monitor crop health at various spatiotemporal scales and extents. However, remote sensing has not yet been used to monitor both drought and salinity stresses simultaneously. The aim of this paper is to review the current ability of remote sensing to detect the impact of these stresses on vegetation indices (VIs) and crop trait responses. We found that VIs are insufficiently accurate (0.02 ≤ R2 ≤ 0.80) to characterize the crop health under drought and salinity stress. In contrast, we found that plant functional traits have a high potential to monitor the impacts of such stresses on crop health, as they are more in line with the vegetation processes. However, we also found that further investigations are needed to achieve this potential. Specifically, we found that the spectral signals concerning drought and salinity stress were inconsistent for the various crop traits. This inconsistency was present (a) between studies utilizing similar crops and (b) between investigations studying different crops. Moreover, the response signals for joint drought and salinity stress overlapped spectrally, thereby significantly limiting the application of remote sensing to monitor these separately. Therefore, to consistently monitor crop responses to drought and salinity, we need to resolve the current indeterminacy of the relationships between crop traits and spectrum and evaluate multiple traits simultaneously. Using radiative transfer models (RTMs) and multi-sensor frameworks allow monitoring multiple crop traits and may constitute a way forward toward evaluating drought and salinity impacts.
1. Introduction
Food security is a serious problem around the world with a significantly large number of food production systems currently at risk [1]. It is predicted that by 2030, the population suffering from food insecurity will rise to more than 840 million. Meanwhile, it is projected that the ongoing COVID-19 could further worsen the number of undernourished people around the world [2]. Further exacerbating this food security problem, crop productivity itself also suffers great threats from stresses, such as drought stress, nutrient stress, and salinity stress, which reduce the yield at various locations by more than 50% [3]. Moreover, crops frequently suffer from a combination of stress [4], which further causes challenges for food production. In order to allow for sustainable agricultural production and mitigate the threat of global food shortages, the impact of these stressors needs to be monitored and alleviated.
Water stress, in the form of droughts, has been identified as the most serious threat for global agriculture, approximately affecting 40% of the world’s land area [5]. Between 1980 and 2020, droughts have caused economic damages of around $6 billion per year in the United States, exceeding damages from other weather and climate disasters [6]. Likewise, in China, the average annual economic damage due to drought was $12.8 billion during 2006–2015 [7]. In addition to drought, salinity has emerged as a major factor limiting the productivity of crops. Southwest United States, southern Asia (including India and Pakistan), eastern Asia (Western China), eastern Australia, and northwest Africa are the most affected areas [8,9,10]. The United Nations Food and Agriculture Organization (FAO) has estimated that 11% of the global irrigated area (34 Mha) is currently affected by different levels of salinity. Therein, China, the United States, Pakistan, and India hold more than 60% of the total area (21 Mha).
While presently, drought and salinity already pose tremendous challenges for food production, it has been forecasted that both stressors will increase both spatially and in severity. Climate change will increase the frequency and severity of drought events in numerous regions [11,12,13,14], leading to dramatic impacts on crop growth and productivity [12]. Specifically, higher temperatures and lower humidity have been shown to lead to an increasing water demand (in the form of crop evapotranspiration) and a reduced water availability from effective precipitation, while simultaneously, a lower and infrequent effective precipitation significantly reduces water availability, thereby negatively affecting food production [15]. Similarly, it has been suggested that salinity will impact 50% of the cultivated land by 2050 [16]. Soil salinity levels have been shown to increase in arid lands because fresh water is not available to drain accumulated salts [17], thus acting as a practically irreversible process. Moreover, soil salinization has been shown to increase with the expansion of agriculture to semi-arid and arid regions [17,18,19]. Therefore, the increase in drought frequency and soil salinity under climate change further exacerbate the threat to crop production.
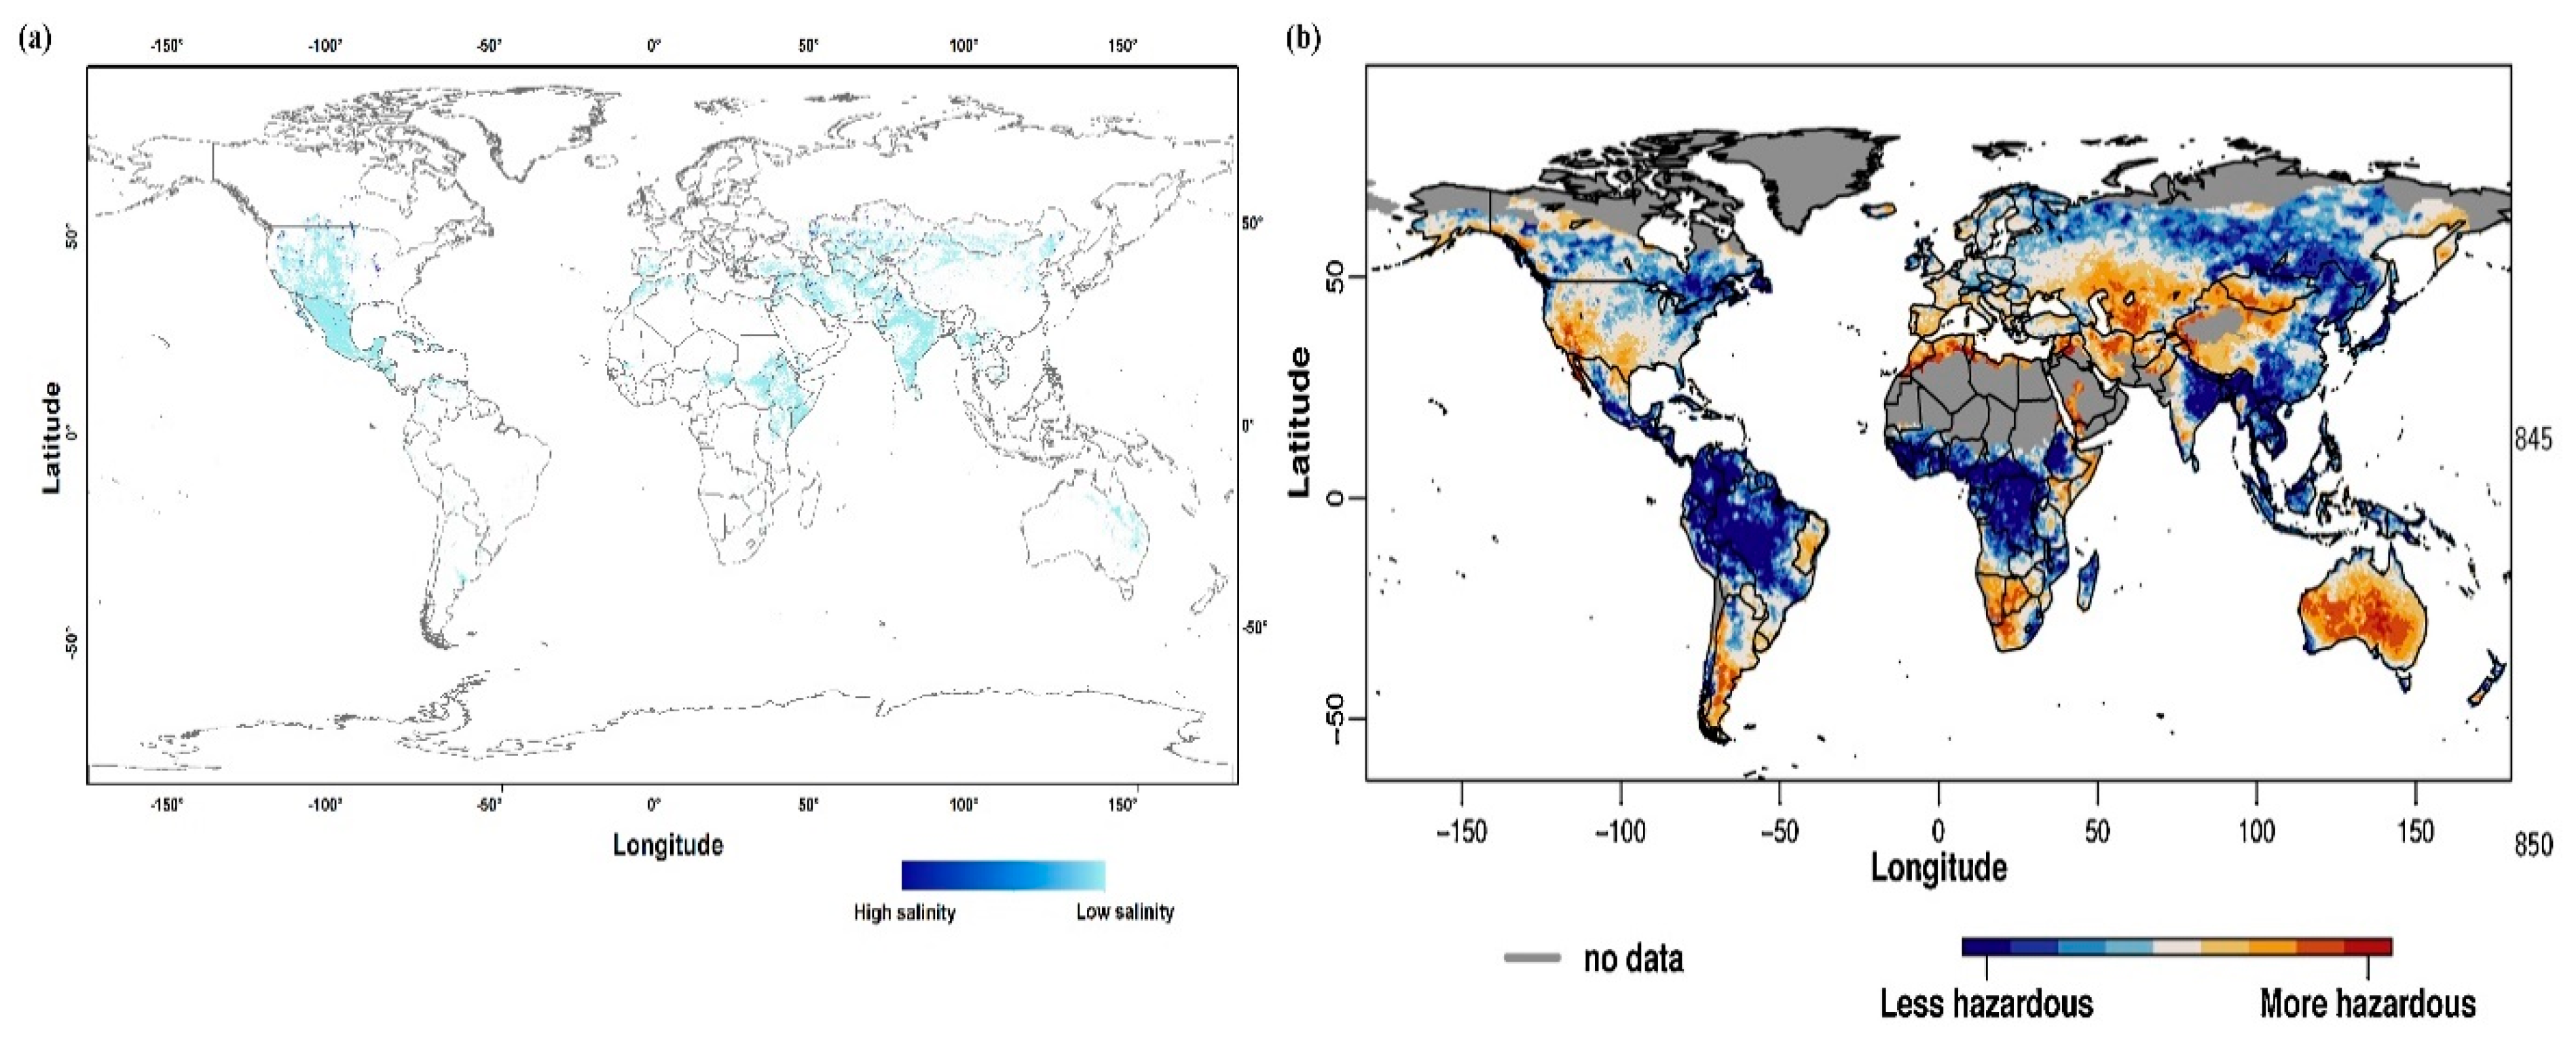
Drought and salinity cannot be seen independently of each other. As an aspect of water quality, salinity has been proven to increase during drought periods [14,20,21]. Specifically, it has been shown that due to lower river levels, hydrological drought significantly increases the salinity in rivers [14,22]. Consequently, increased drought frequency and severity will exacerbate the accumulation of salinization and adversely affect crop yield and sustainable agricultural development [23]. As such, there are already numerous areas in the world where both drought and salinity stress co-occur (Figure 1). Furthermore, due to sea level rise in the future, cultivated land (and in particular coastal lowlands) will have a higher probability to suffer from both drought and salinity stress [24,25,26,27]. Therefore, drought and salinity should not be viewed independently, and impacts of joint drought and salinity stress to agricultural production should be investigated.
Remote sensing (RS) is a key method for monitoring crop health due to its capability to monitor and detect effective changes of large areas at relatively low-cost, in comparison to traditional methods [29]. For this purpose, several vegetation indices (VIs) such as the Normalized Difference Vegetation Index (NDVI) [30], the Perpendicular Vegetation Index (PVI) [31] and the Soil Adjusted Vegetation Index (SAVI) [32] have been developed in the past to monitor agricultural production. In addition, drought (impact) indicators have been developed that account for seasonality effects (based on long-term standardized observations), e.g., the Vegetation Condition Index (VCI) [33], the Vegetation Health Index (VHI) [34], and the Normalized Difference Water Index (NDWI) anomalies [35]. However, each of these drought indicators has specific limitations that limit its applicability as early warning signals of drought [36]. As a consequence, results vary among different indices, and most applications with these indicators focus on local scales and individual crop types. As such, no comprehensive vegetation index has been developed that can be applied globally to investigate drought impact consistently [36]. Similar to drought monitoring, vegetation indices, used to monitor crop salinity stress, are also affected by limitations regarding noise, halophyte presence, and spatial resolution [37,38]. In response, a more comprehensive measurement of the reflectance spectrum representing crop traits is required to monitor crop growth and health as affected by stress. In this regard, it has been shown that hyperspectral data have a strong potential to detect biophysical and biochemical parameters [39,40]. In addition, various studies highlighted that other (multi-spectral) RS methods (e.g., microwave, thermal infrared (TIR), hyperspectral) show great promises to characterize vegetation stress [41,42]. However, the number of studies focusing on this is limited, and only part of these investigations focused on agricultural RS applications [43,44], while studies on the relationship between crop traits and spectral properties in relation to under drought or salinity stress is even more limited. Therefore, an in-depth analysis of the reflectance spectrum of crop traits under stress is required to better identify plant drought and salinity stress by remote sensing.
The main objective of the study is to evaluate the current state and shortcomings in the RS monitoring of crops under drought and/or salinity stress. Based on a comprehensive analysis, we evaluate the potential of remote sensing to identify and assess agricultural ecosystems under drought and salinity stress through vegetation indices and plant traits.
2. Methodology
To evaluate the current state of monitoring drought and salinity stress by RS, we applied a thorough systematic review of recent scientific publications. For this, we (a) collected a large representative set of scientific publications, and (b) analyzed their results to identify the response patterns in vegetation indices and in plant traits. For the analysis of plant traits, we classified them according to underlying plant functions (relating to primary production, hydrological processes, and osmosis). This allows us to coherently investigate the potential of remote sensing for monitoring the salinity/drought impact on biological pathways/processes.
2.1. Creating Representative Database though a Systematic Review
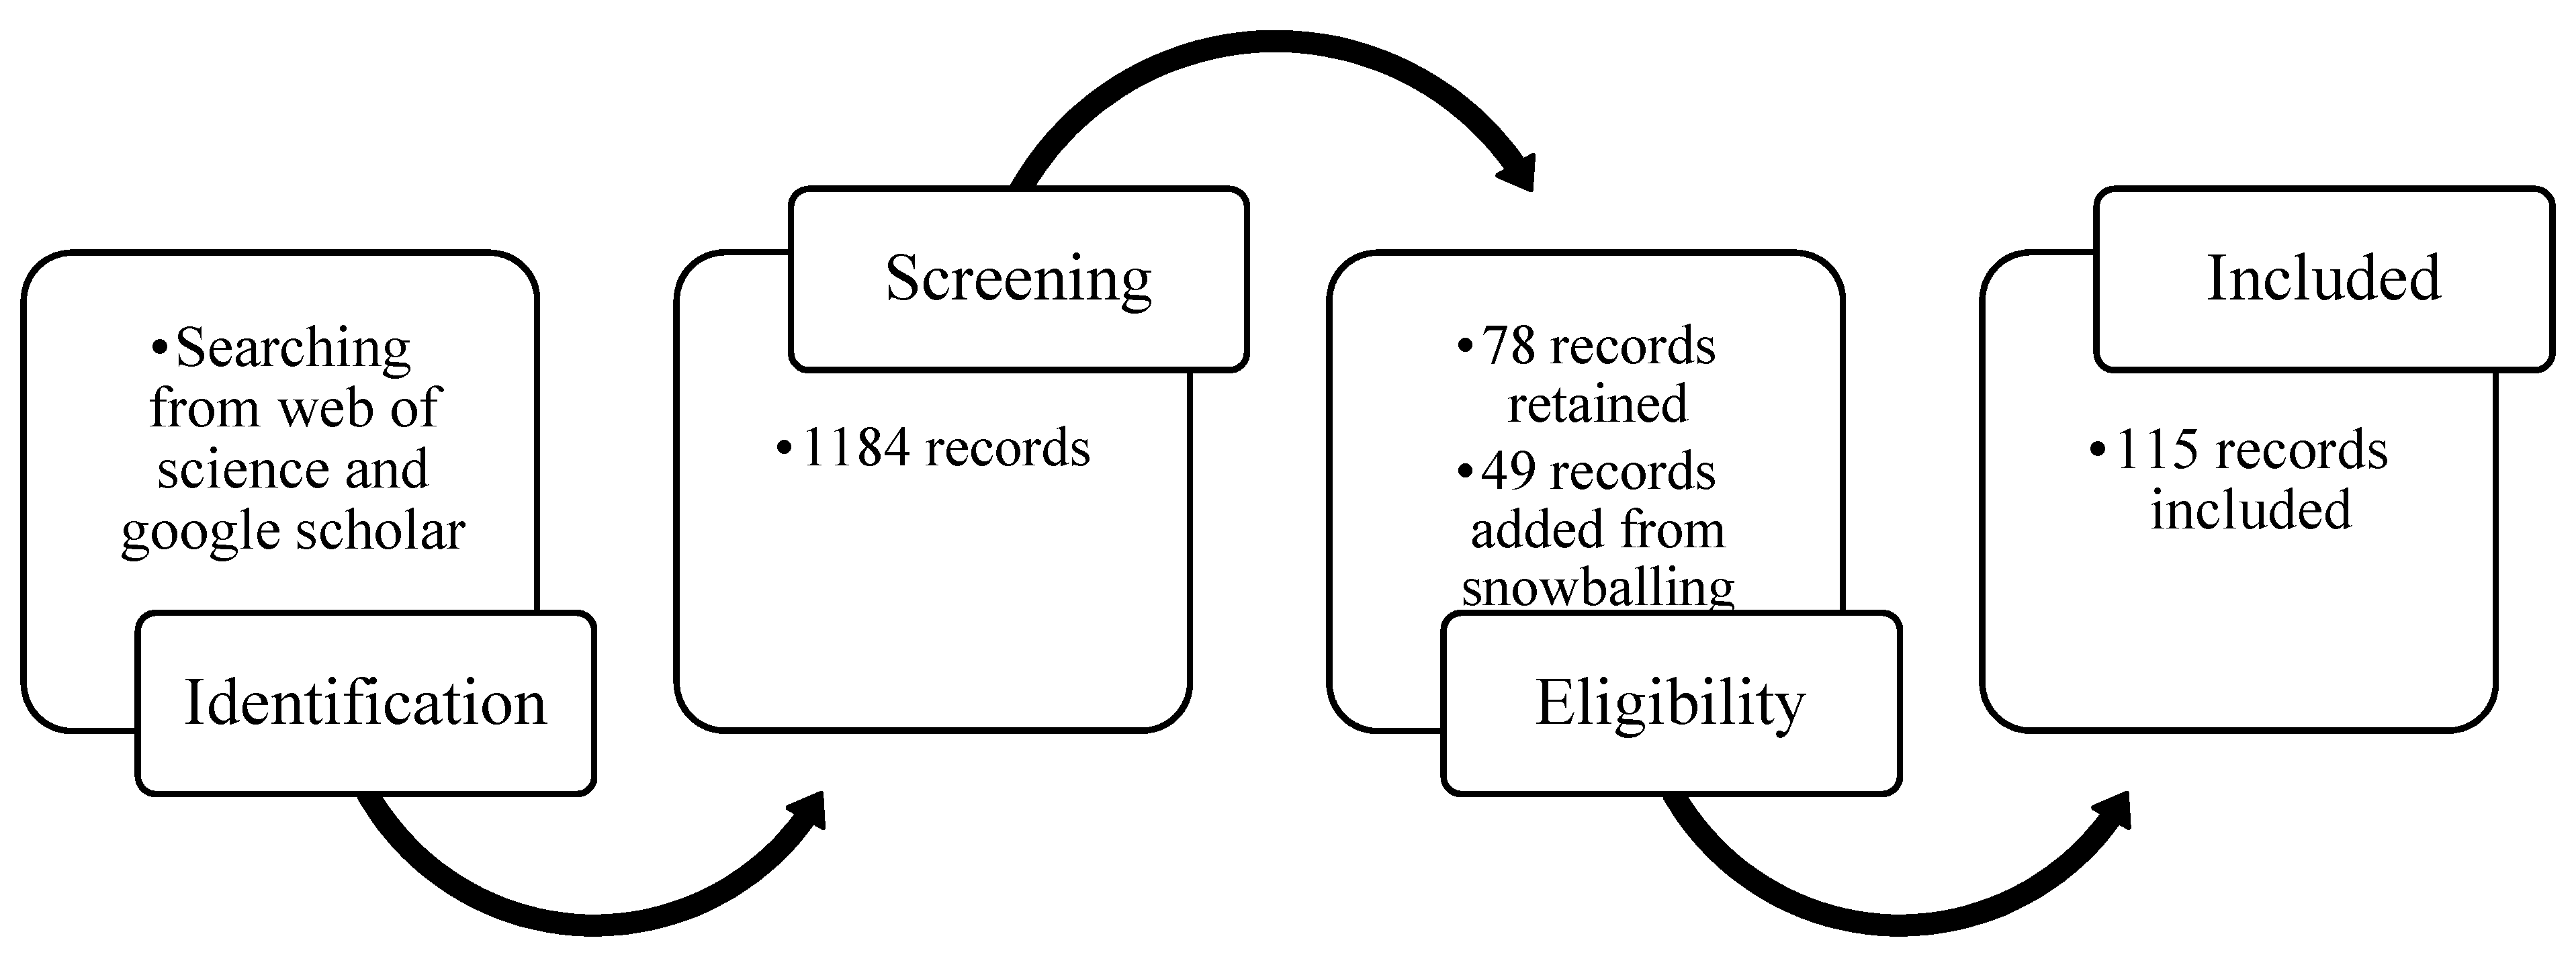
In order to facilitate the analysis of a representative set of recent publications, we adopted an optimized systematic review approach [45]. Specifically, we focused on scientific peer-reviewed papers published between 2005 and 2020 through Web of Science (WOS) and Google Scholar (GS) (Figure 2). This approach first requires the definition of a representative set of keywords. For our study, these keywords were “remote sensing”, “drought”, “salinity”, “agriculture”, and “traits”, as well as their synonyms (such as RS, food security, etc.). Afterwards, publications were selected from WOS and GS according to the occurrence of combinations of these keywords in the title, abstract, author keywords, and keywords plus, to create a first selection of publications, leading to 1184 selected records. Then, this set of publications was screened to capture only papers that analyzed (a) the impact of drought/salinity stress on VIs/traits of crops by remote sensing, and (b) included information on the spectral wavelength on which the analysis was based. This resulted in 78 unique records. Next, through snowballing these records (to capture papers that were missed in the first step), an additional 49 publications were obtained. In total, 115 publications (Table S1) fitting these criteria were identified after removing 12 duplicates. More details on each step are provided in the supplementary information (Figure S1). Maps of co-authors and co-occurrences based on the results of the systematic review were created through VOSviewer (Figure S2).
2.2. Extraction of Drought/Salinity Stress Information
From the full set of publications on drought and salinity stress of agricultural crops, we extracted the correlation strengths between vegetation indices/crop traits responding to drought and salinity stress and spectral bands/wavelengths. Finally, 348 correlations were found, among which 102 traits were wavelength correlations, 171 were VIs-wavelength correlations, and 75 traits were VIs correlations. All 171 Vis-wavelength correlations that we found focused on drought, and no reviewed study provided correlations for salinity stress.
2.3. Classification of Plant Traits and Vegetation Indices
After the creation of our representative set of publications, we clustered the traits into four groups to relate the impact of drought/salinity stress to biological processes. Specifically, we classified the traits together on the basis of their definitions and the functional processes involved [46,47]. This provided us with four clusters, namely biomass traits, photosynthesis traits, water traits, and osmosis traits. Afterwards, each cluster was further divided into RS (directly measurable by RS) and In-RS (indirectly derived by RS) (Table 1).
In addition to individual plant functional traits, well-known RS vegetation indices have been related to the responses to drought and/or salinity stress. For consistency, we clustered the results of these studies on the basis of a functional classification, resulting in xanthophyll indices, water content indices, carotenoid indices, and greenness indices (Table 2).
2.4. Analyses of Vegetation Responses
After all functional clusters were defined, we aggregated the results from the different papers for each functional cluster (of VIs and plant traits) and proceeded to analyze their correlations. We firstly analyzed the spectral signatures of VIs under drought and their strengths. Afterwards, the distribution of spectral signatures of each functional traits cluster was investigated in the range of 400–2800 nm. Finally, we analyzed the correlations of different clusters of VIs and plant traits.
3. Results
3.1. Spectral Signatures of VIs under Drought Stress
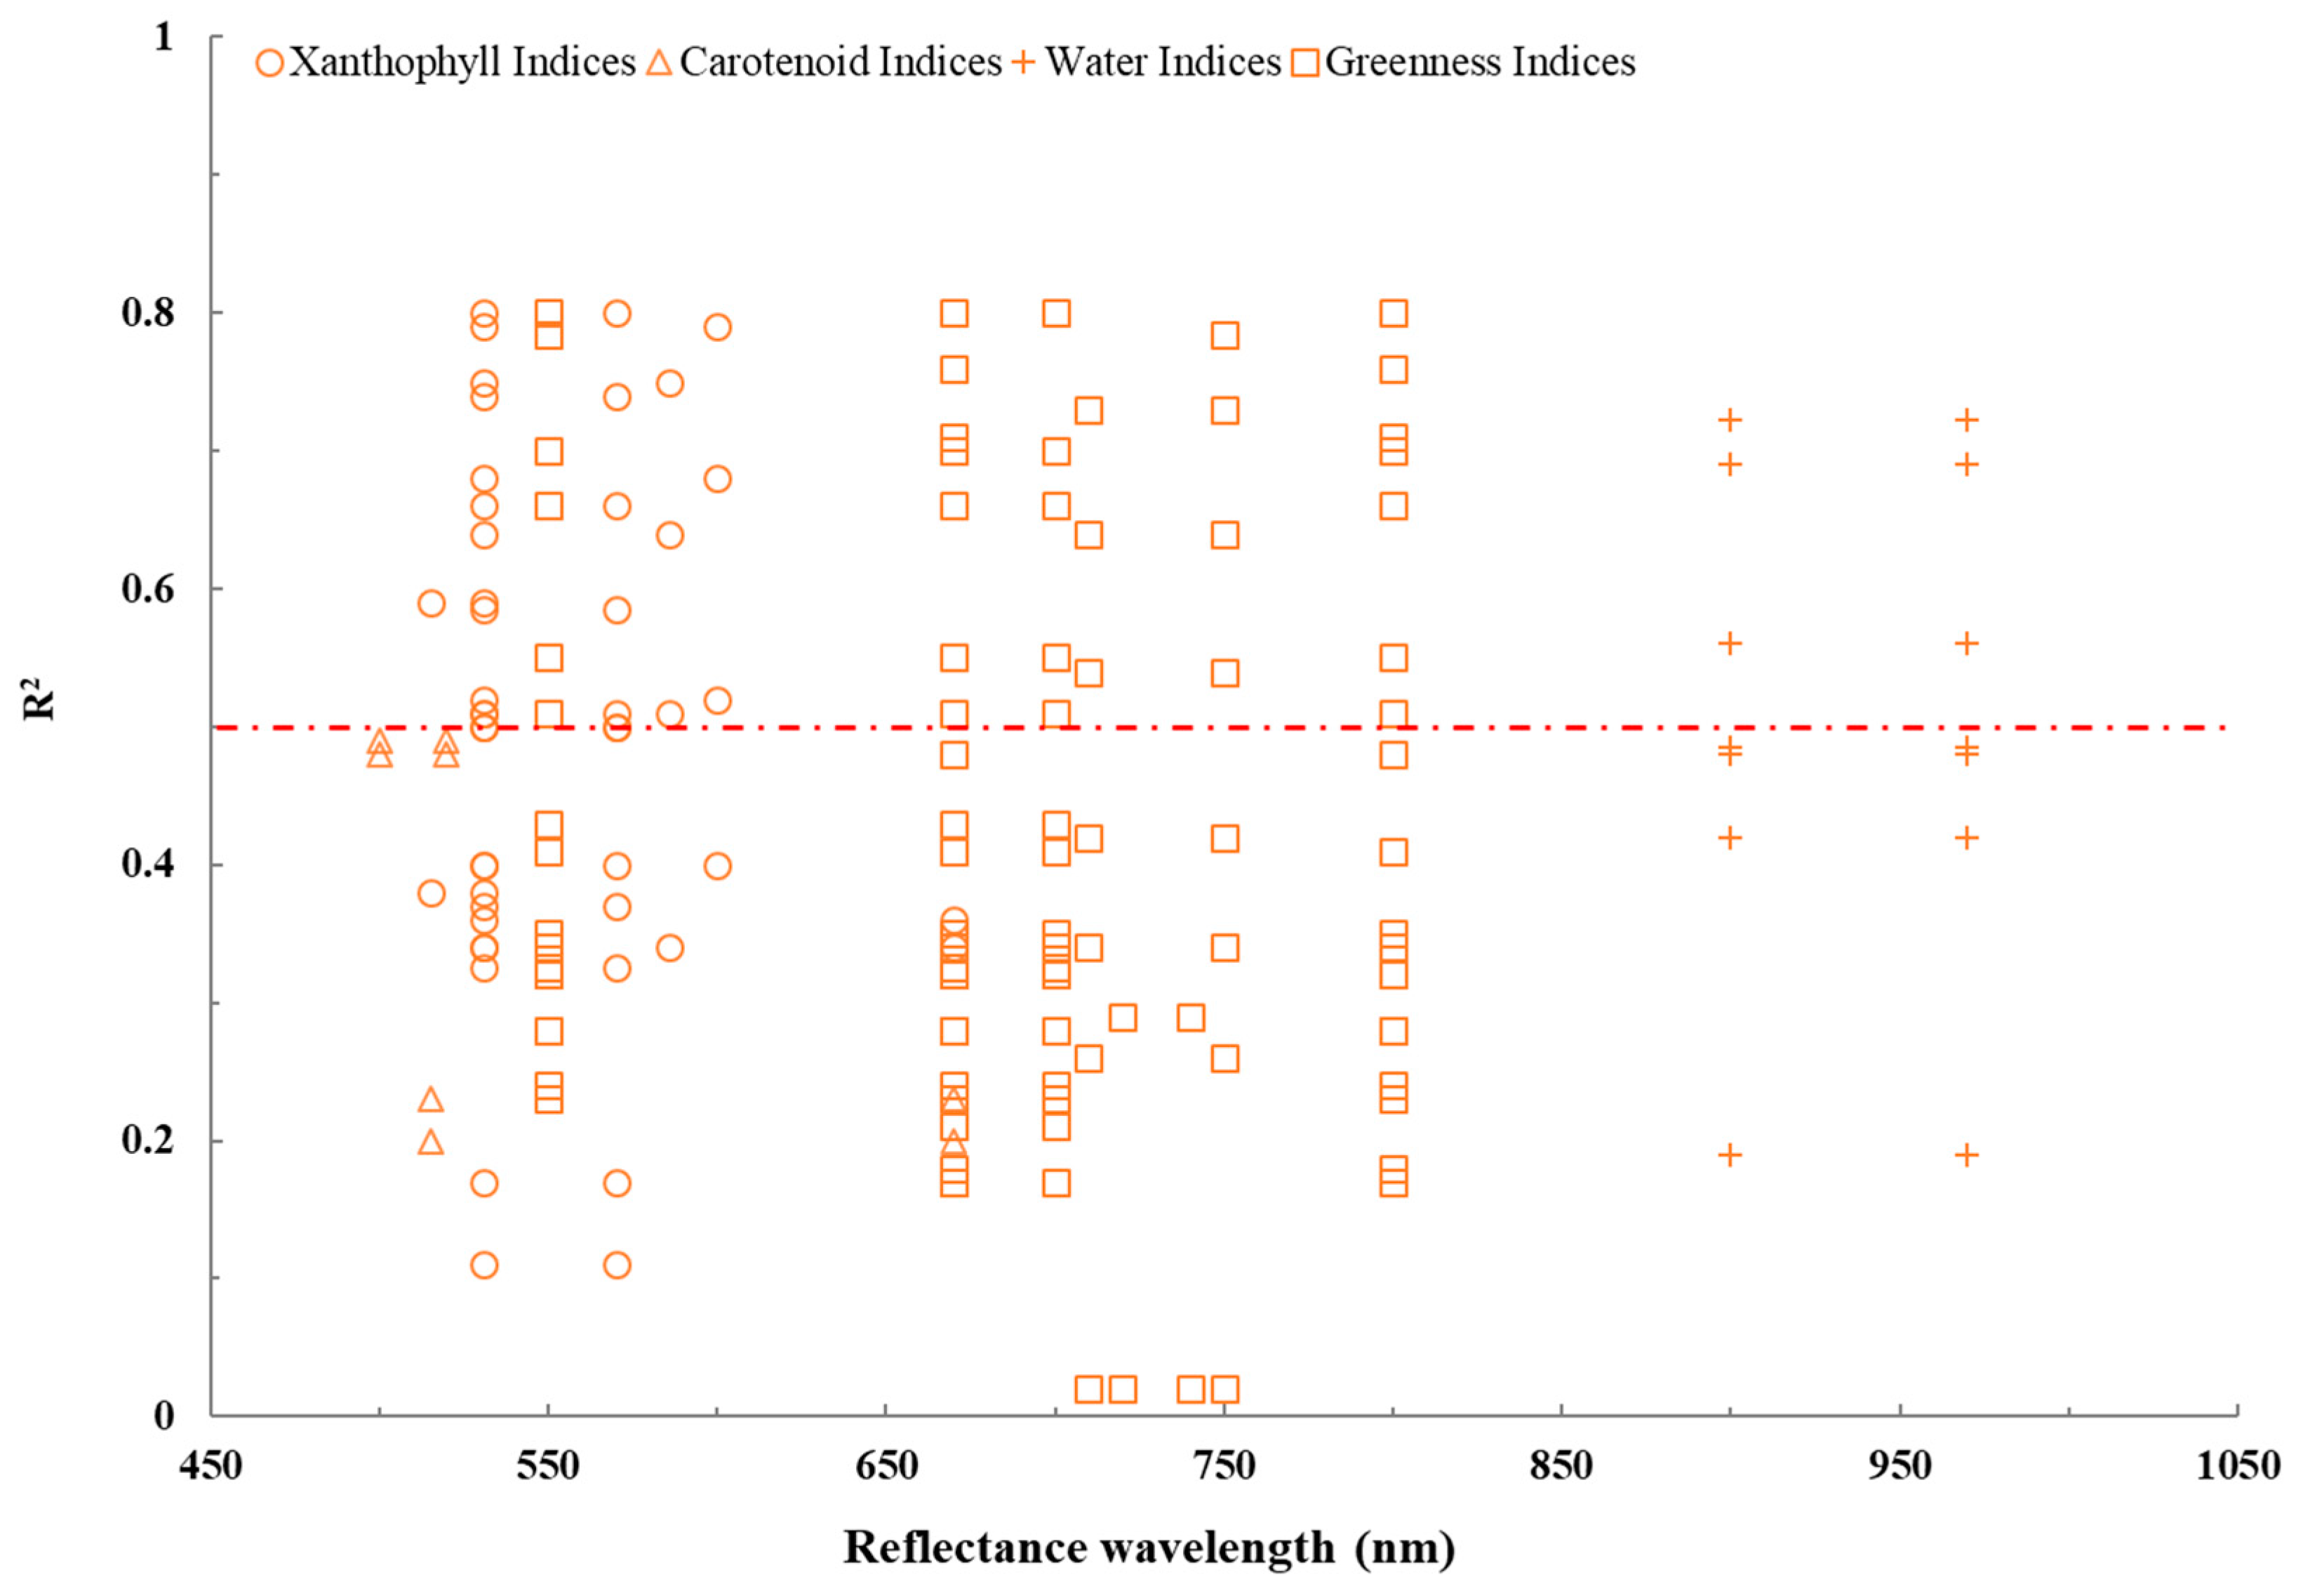
We found a wide range of correlations for the four clusters of VIs (defined within the spectral range of 500–1050 nm) under drought stress, as highlighted in Figure 3. Specifically, xanthophyll indices showed their highest R2 at 531 nm (R2max = 0.80) and 570–600 nm (R2max = 0.80), while greenness indices showed their highest R2 at 550 nm (R2max = 0.70), 670 nm (R2max = 0.76), 700–750 nm (R2max = 0.78), and 800 nm (R2max = 0.76), and water indices showed their highest R2 at 900 nm (R2max = 0.72) and 970 nm (R2max = 0.72). For carotenoid indices, no such region could be identified due to mostly low correlations (0.20 ≤ R2 ≤ 0.49).
While we could identify specific regions where individual VIs provided a maximum sensitivity, we also found variation in this sensitivity. Although we identified studies that highlighted the potential of specific VIs for drought monitoring, we also found other studies reporting low R2 (R2 < 0.50) for the same VIs and wavelengths. Thus, there are undeniable limitations to identifying vegetation health using VIs under drought stress.
3.2. Spectral Signatures of Plant Traits under Drought and Salinity Stress
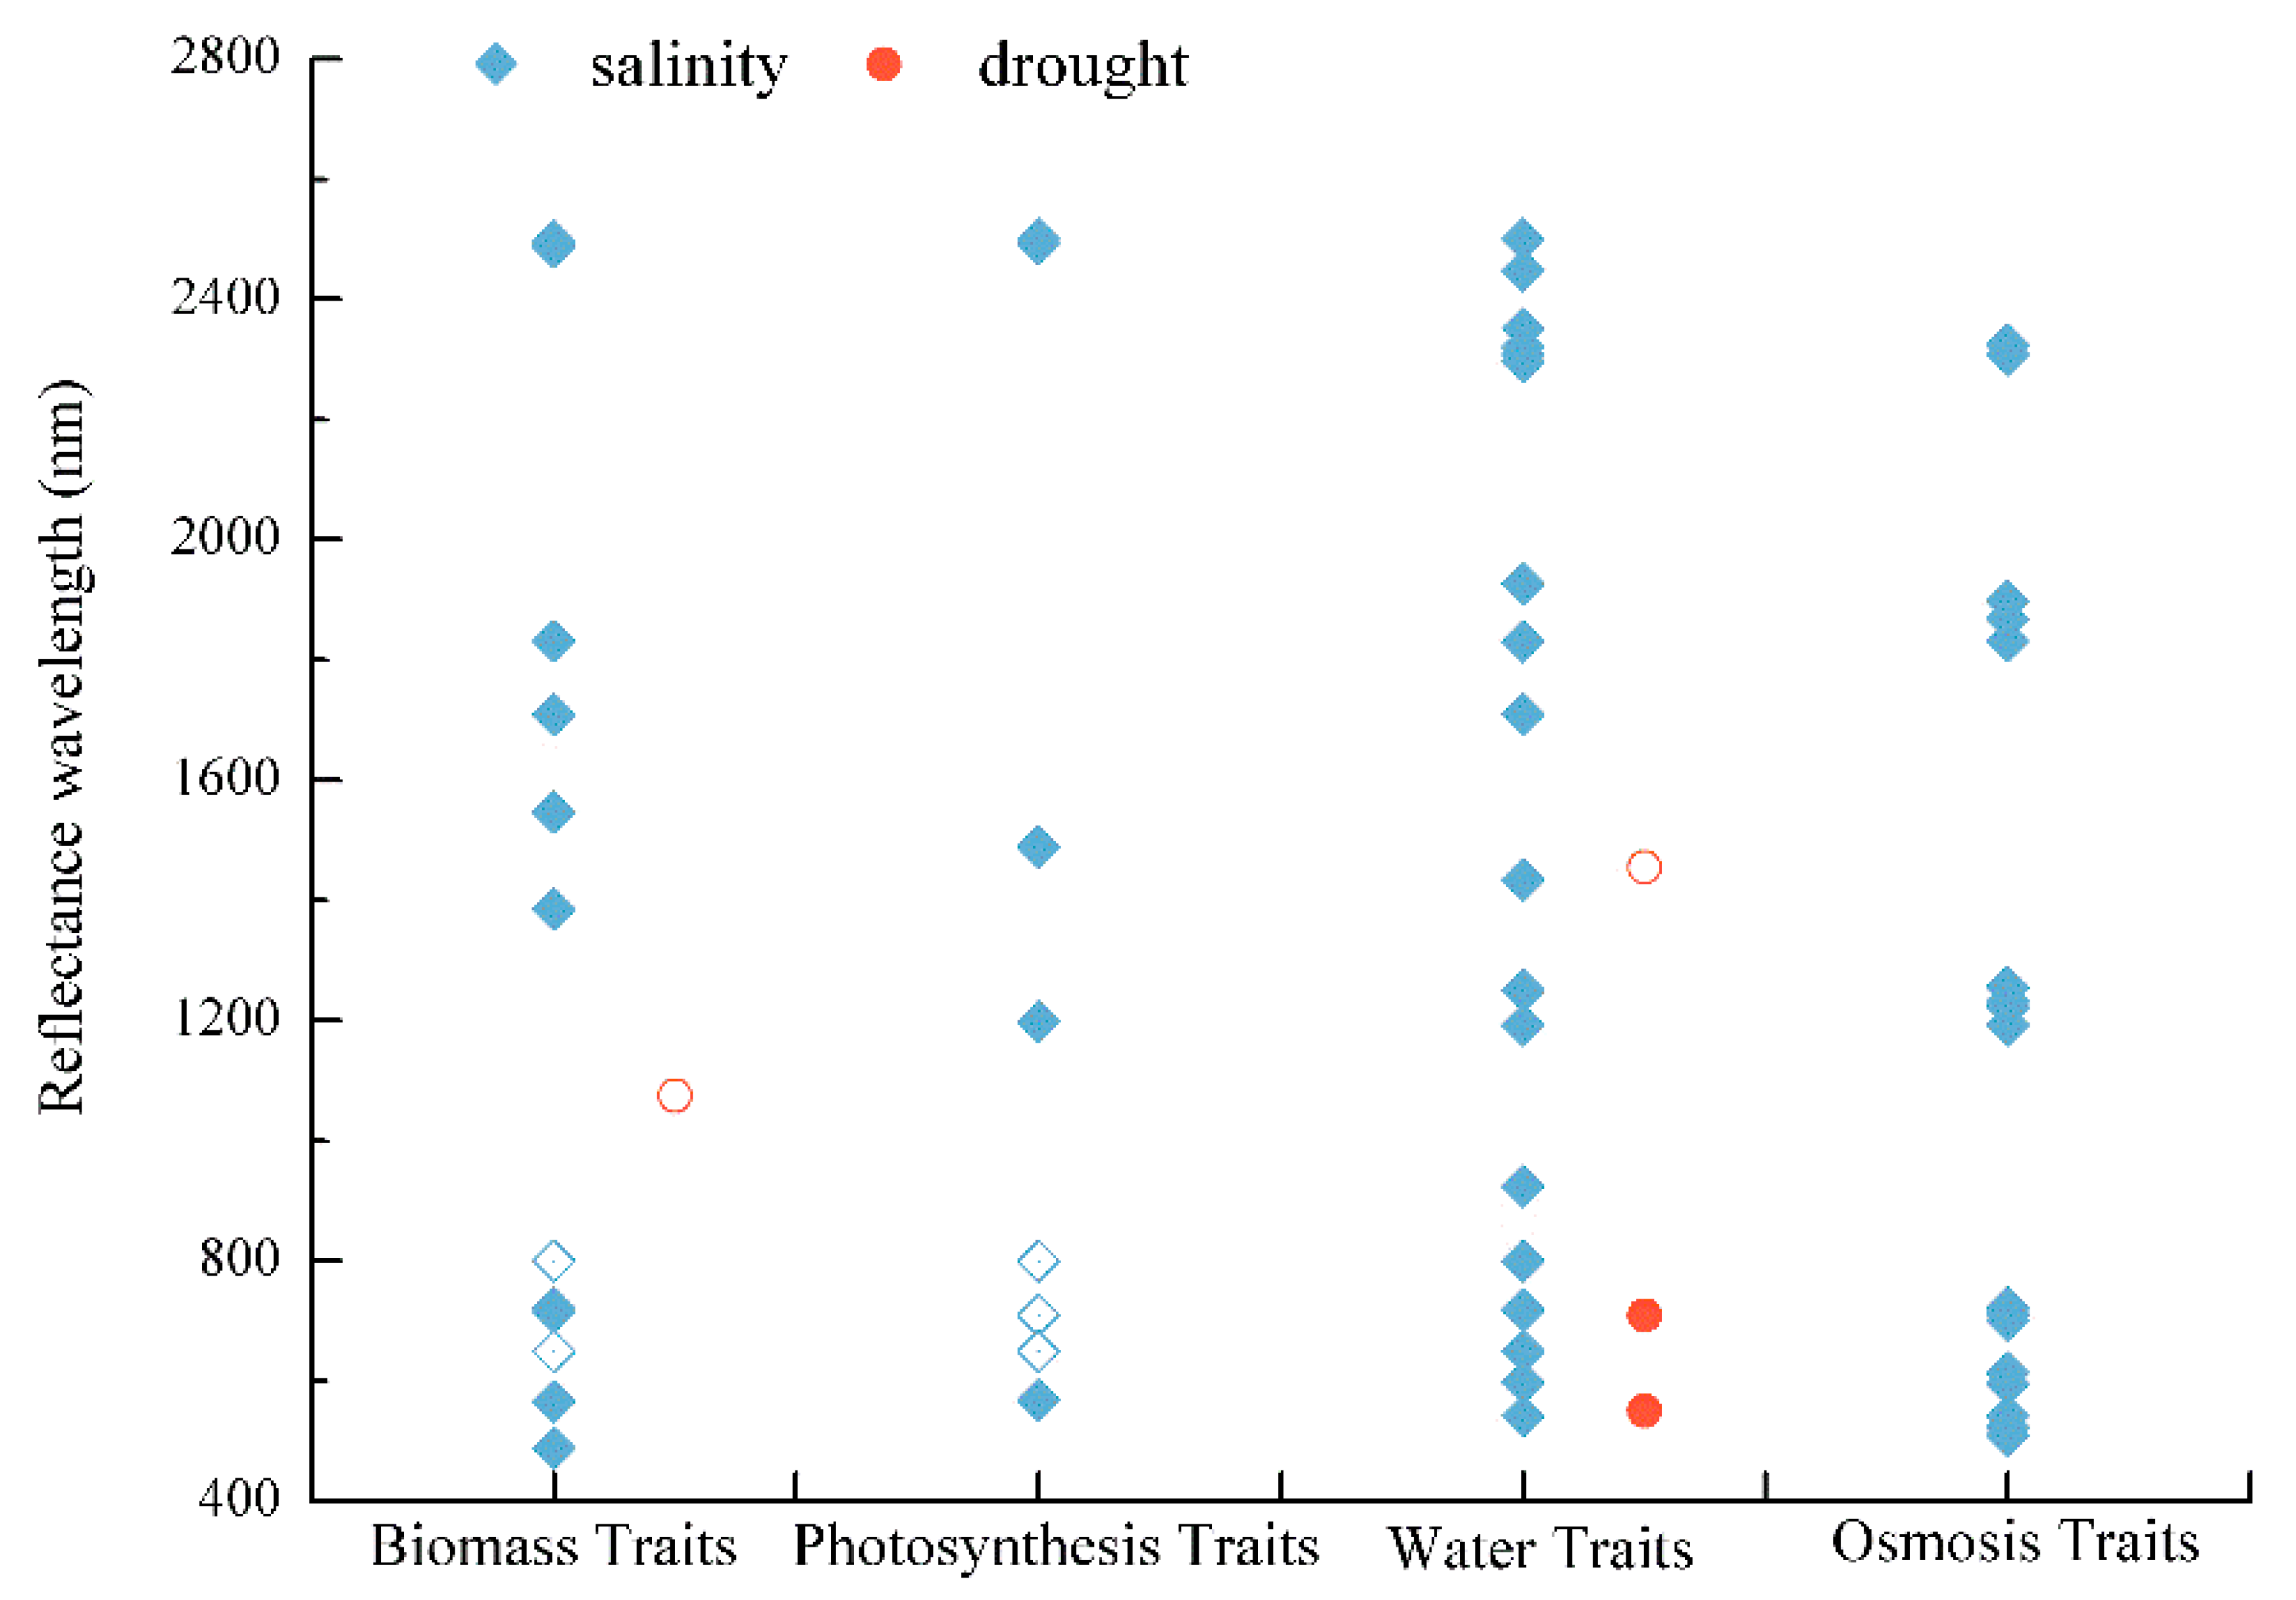
The reviewed studies focusing on plant trait signals showed that these crop responses were not constrained to specific wavelengths. Biomass, photosynthesis, water, and osmosis clusters of traits were identified across the full spectral range. These clusters showed few spectral patterns, even for those traits clusters that were supposedly directly measurable by RS (Figure 4). The only recognizable trends concern the osmosis traits cluster (with a significant response to salinity stress), with a slight tendency to occur more frequently at 550–750 nm, and the biomass traits and water traits occurring at 1400–1850 nm. In as far as the few observations for drought do allow, those patterns did not seem to deviate much from those for salinity (Figure 4).
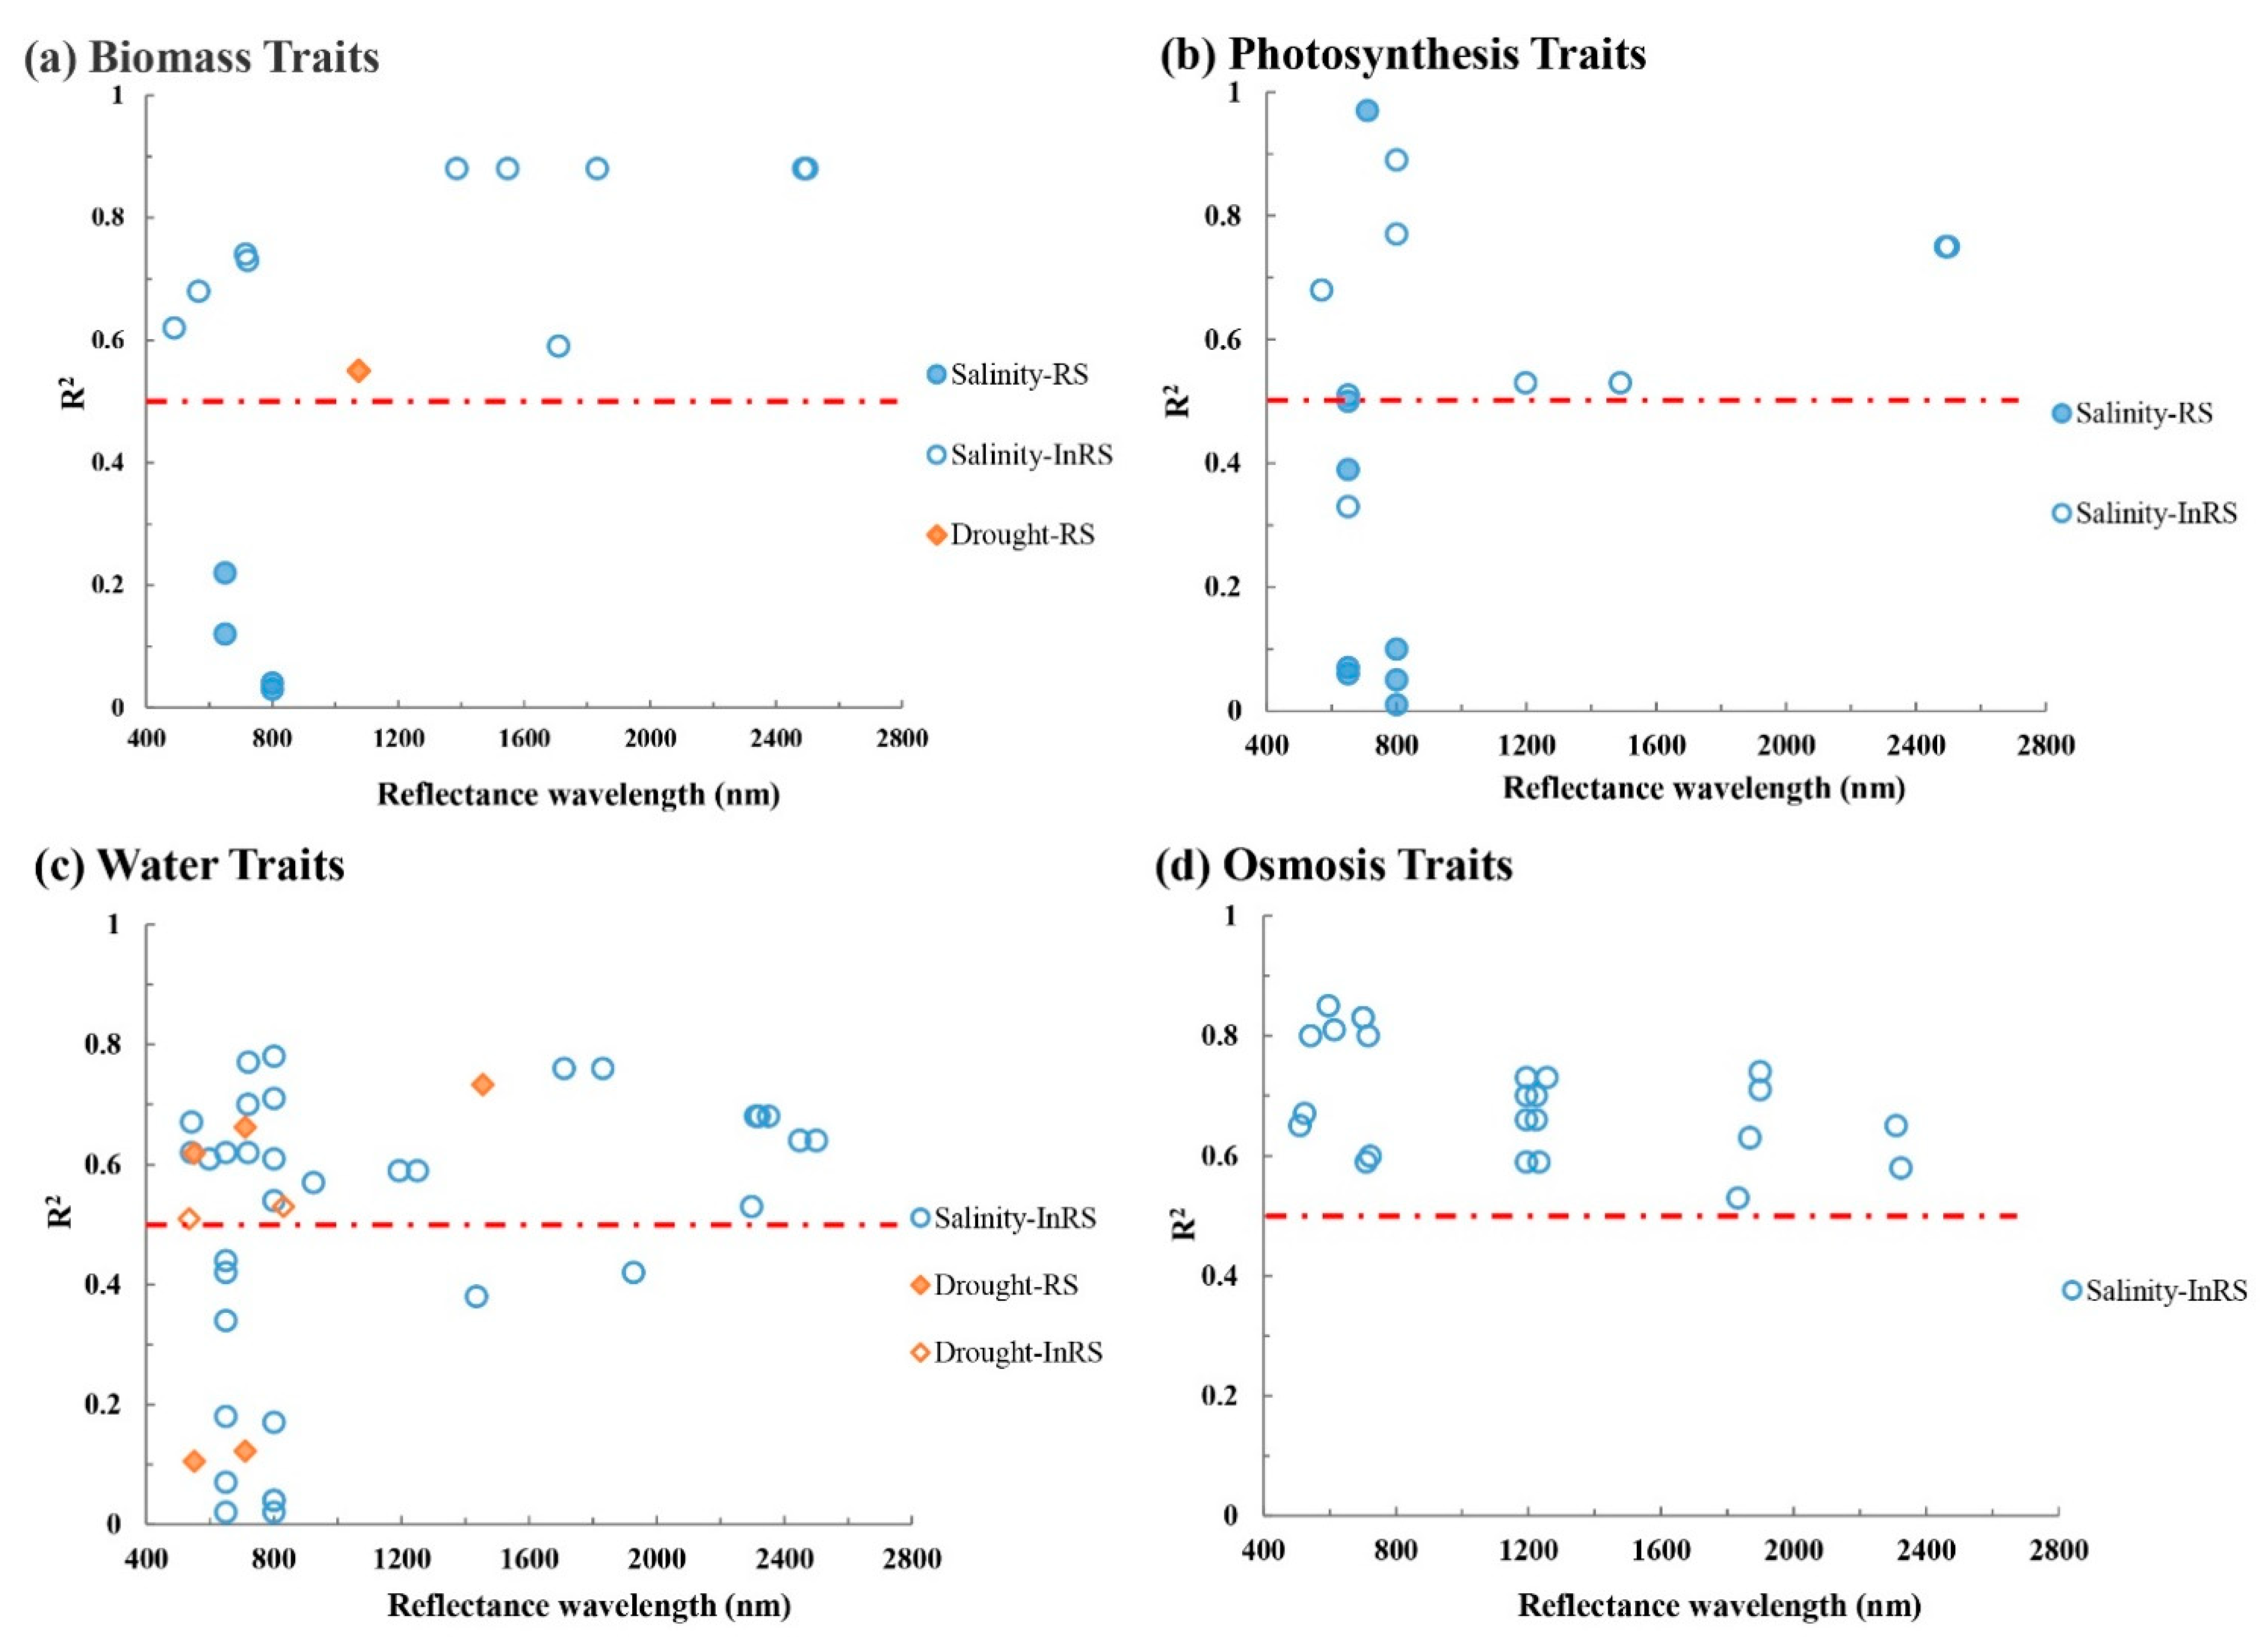
Moreover, while plant traits are more directly related to plant functioning and thus to stress, the correlations between the plant traits and the (drought and salinity) stress were not necessarily stronger (Figure 5). Biomass traits showed to have high R2 value to salinity stress at around 720 nm (R2max = 0.74), 1300–1800 nm (R2max = 0.88), and around 2500 nm (R2max = 0.88). Photosynthesis traits had high R2 values at 710 nm (R2max = 0.97), 800 nm (R2max = 0.89), 1200 nm, and around 2500 nm (R2max = 0.75). Interestingly, for both biomass and photosynthesis traits, the indirectly derived plant traits had generally higher R2 values than the directly measurable RS traits. For water traits, we found different patterns from for biomass traits and photosynthesis traits, with high R2 widely distributed between 500 and 2500 nm (R2max = 0.78). While high R2 peaked in the 600–800 nm range, they were also highly variable (0.02 ≤ R2 ≤ 0.78). In contrast, osmosis traits (only indirectly retrievable) showed a very promising performance (all with R2 > 0.50) across the entire region of 500–2300 nm. Thus, it seemed that osmosis traits were most directly related to salinity stress responses.
For drought stress, the number of studies that presented the wavelengths they used was too limited to draw clear conclusions. In general though, neither the range of R2 values nor the wavelengths at which traits responded to drought stress deviated much from those for salinity stress.
3.3. The Relationship between VIs and Plant Traits
Vegetation indices have been shown to strongly correlate with individual plant traits (e.g., LAI and Chl), but the linkage between VIs, spectral reflectance, and crop traits remains inadequately understood. Thus, we analyzed the relationship between VIs and plant traits, and the results are shown in Table 3. For biomass traits, LAI showed high correlations with xanthophyll indices (R2max = 0.66) and greenness indices (R2max = 0.71) (particularly for OSAVI). Photosynthesis traits were also highly correlated with xanthophyll indices (R2max = 0.68) and greenness indices (R2max = 0.70). Especially, ΔF/Fm was highly correlated with TCARI/OSAVI (R2max = 0.70). Water traits showed a wide range of correlations (0.02 ≤ R2 ≤ 0.80) with VIs. Therein, Tl − Tair was highly correlated with PRI570 (R2 = 0.74), PRI600 (R2 = 0.79), and TCARI/OSAVI (R2 = 0.80). CWC was highly correlated to three VIs, including WI (R2 = 0.72), CIgreen (R2 = 0.78), and CIred edge (R2 = 0.73). EWTcanopy was highly correlated to PRI586 (R2 = 0.75) and OSAVI (R2 = 0.76). LWP was highly correlated to CWSI (R2 = 0.78) and Gs was highly correlated with CWSI (R2 = 0.77). Osmosis traits were mainly high correlated with PRI570 (R2max = 0.50). Thus, in general, the four traits clusters were highly correlated with xanthophyll indices (0.50 ≤ R2max ≤ 0.79), while they showed lower correlations with carotenoid indices (0.20 ≤ R2 ≤ 0.49). Furthermore, water traits were stronger correlated with water indices (0.42 ≤ R2 ≤ 0.78) than with the other three traits groups (0.19 ≤ R2 ≤ 0.49). Greenness indices showed high correlations with biomass traits (R2max = 0.71), photosynthesis traits (R2max = 0.70), and water traits (R2max = 0.80) but not with osmosis traits (R2max = 0.35). However, despite these general patterns, Table 3 also shows that variability in the relationships is high.
4. Discussion
In this study, we systematically evaluated the usefulness of current monitoring approaches (i.e., vegetation indices (VIs) and plant traits) for evaluating vegetation responses to drought and salinity stress. Vegetation indices have been developed to monitor vegetation health condition since the 1980s [61], and a review of drought indices can be found in [62]. In contrast, only over the past two decades, remote sensing techniques have advanced enough to retrieve plant traits, increasingly leading to remote sensing applications to monitor plant traits to characterize both natural vegetation and crop functioning [63]. However, a systematic review on the extents to which these metrics can pick up drought and salinity stress had so far been missing.
Our study reveals that most VIs reviewed are not accurate and consistent enough to detect changes in crop temporal and spatial responses under stress. This finding coincides with previous studies [36] that showed that simple VIs were hardly able to detect the impact of drought on crops. A possible explanation for this is that most VIs do not directly reflect the mechanism of crop responses to stress. While many VIs are related to (normalized) features of e.g., greenness, carotenoid, or xanthophyll concentrations, it seems that these features do not only vary because of the actual drought and salinity stress, but also under the influence of various other local conditions. This may explain the wide range of R2 values in relation to drought or salinity stress. In order to comprehensively monitor stress, we should therefore focus on exploring the spectral characteristics of crop tolerance and stress response mechanisms to truly reflect the crop health condition under stress.
Plant traits might provide an approach to measure these stress mechanisms, given that traits have proven to be indicators of plant and ecosystem functioning. While previous studies showed that RS could potentially address plant traits, in particular traits related to photosynthetic process, canopy structure, and leaf biochemistry [43,44], there are a few plant traits studies that focus on drought and salinity stress. More specifically, the number of drought and salinity studies evaluating plant traits is much lower than those using VIs. Irrespective of this dichotomy, our systematic review shows that neither the wavelengths at which traits are detected nor the strength of the relationship to drought and salinity stress is consistent within or between traits of different crops. In fact, a wide range of wavelengths used to detect plant traits was found [43], which suggests that most relationships to spectral signatures are indirect at best. These indirect relationships, and thus the potential for confounding factors, may provide a partial explanation for the large variance we found in R2 values and the generally low explained variance. One of those confounding factors concerns that crop (biomass and water) responses to salinity are to some extent similar to those to drought. This confounding factor leads to confuse some results and has hitherto not been accounted for in previous studies. Furthermore, the relationship between traits and stress is further complicated by the fact the drought—and salinity—tolerance mechanisms of crops are complicated and multivariate.
An exception to the low and varied R2 values is the osmotic traits as detected (indirectly) by remote sensing. In all evaluated studies, osmotic traits were strongly related to salinity stress. This phenomenon is linked to crop response mechanisms and is—in contrast to biomass and water responses—unique to salinity stress. Salinity stress inflicts damage to plants due to (a) the disruption of the ionic equilibrium, (b) an osmotic imbalance and thereby (c) a decreased photosynthesis due to the toxicity of Na+. Likewise, evidence shows that an increased expression of K+, Ca2+, Salt Overly Sensitive (SOS) pathways, and glycine betaine are related to salinity stress tolerance [64,65,66]. Both drought and salinity stress cause osmotic stress and decrease cytosolic as well as vacuolar volumes. In case of drought, this osmotic stress is the result of a displacement of membrane proteins and disruptions in cellular metabolism [64]. In addition, reactive oxygen species are produced, which have adverse effects on cellular structures and metabolism [67]. Therefore, the responses of plants to drought and salinity are identical at the early stage. Consequently, osmotic traits show a high potential as a suitable indicator for drought and salinity stress RS monitoring. In particular, promising results have been found for detecting ionic concentrations of sodium, potassium, and chloride [68,69]. Unfortunately, though, it seems that our understanding at which wavelengths the osmotic traits are expressed is still limited.
As highlighted in the previous paragraph, plant functioning under stress is affected by various pathways. From that perspective, instead of focusing on individual VIs or traits, an alternative approach to monitoring drought and salinity stress is the consideration of multiple trait responses simultaneously. Although stresses have been investigated using many aspects, previous studies rarely utilized multiple variables to assess these pathways. Radiative transfer models (RTMs) may be particularly useful to retrieve such multiple variables from remote sensing observations. RTMs have been developed to study the relationship between vegetation biochemical and biophysical properties, and hyperspectral reflectance [70,71]. In the forward mode, RTMs simulate the vegetation spectrum based on known spectral signatures of vegetation biochemical and biophysical properties. Likewise, RTMs can retrieve vegetation properties from reflectance data in the inverse mode [72,73,74]. Indeed, RTM inversion has been successfully applied to monitor the changes in plant traits and reflectance upon drought [70]. By monitoring multiple traits simultaneously, through the inversion of RTMs, it will become possible to evaluate how multiple traits in concert are affected by drought and/or salinity stress. This may also provide additional insights in the plant strategies to deal with drought and/or salinity stress. Unfortunately, though, the ill-posedness of the inversion problem commonly puts major constraints on the generic applicability of RTMs for crop monitoring. Another major constraint, in the context of this review, is that osmosis traits are difficult to measure directly by remote sensing. Dissolved salts such as Na+, Cl−, K+ and Ca2+ are not directly tractable, although NaCl has a clearly defined spectrum in the infrared spectrum. This strongly limits its incorporation within RTMs, which indeed only focus on a limited number of vegetation traits such as LAI, Chl, and CWC. More research will be needed to evaluate the prospects of physical modeling of the radiative transfer under the influence of known stress response mechanisms. Traditional multi- or high-spectral field sensors to investigate the impacts of drought and salinity on crops in relation to in situ observed traits related to these stresses will be the way forward here.
A final limitation to monitoring plant traits in response to drought and salinity stress is the spatiotemporal and spectral resolution of current satellites. Low spatiotemporal resolution and revisit periods are two main restrains for current satellite sensors applications in crop management [75], although this has strongly improved with the launch of the Sentinels satellites. The spectral resolution is currently probably more limiting. The inconsistency across multiple sensors of different satellites does not allow combining them in one retrieval [36]. Hyperspectral missions, such as foreseen in EnMAP, may provide such information. This may be particularly interesting if combined with Light Detection and Ranging (LiDAR) information (e.g., from Global Ecosystem Dynamics Investigation (GEDI)) or high-resolution information on temperature (e.g., the Ecosystem Spaceborne Thermal Radiometer Experiment on Space Station (ECOSTRESS)). However, also, for a fruitful incorporation of such information sources, it will be essential to first characterize the spectral properties of traits directly related to the plant responses to drought and salinity stress. This will reduce the impacts of confounding factors that currently seem to dominate the patterns obtained, as seems apparent from Figure 3, Figure 4 and Figure 5.
5. Conclusions
Based on a systematic review, we conclude that a significant number of challenges remain before RS can be used to monitor drought and salinity stress on crop health. Specifically, we found that VIs are insufficiently accurate to consistently estimate these effects. For plant traits, we found some positive correlations for individual cases, confirming that plant traits indeed reflect stress response mechanisms. However, these cases were too few to accurately monitor the pathways for drought and salinity stress. Furthermore, we found that both spectral wavelengths and the strength of the relationship to drought and salinity stress varied strongly. Osmosis traits appear to be the exception to this and consequently have the potential to be used for monitoring the pathways along which drought and salinity impact crops. However, osmosis traits cannot be directly measured by RS. In order to fully capture the biophysical/biochemical pathways of drought/salinity stress on crop health, future research should focus on (1) advancing our capability to simultaneously monitor (through multi-sensor frameworks) the suite of crop traits that are connected to the different pathways affected by drought and salinity, and (2) expanding our characterization of the spectral properties of osmotic traits (through optimized RTMs).
Supplementary Materials
The following are available online at https://0-www-mdpi-com.brum.beds.ac.uk/2072-4292/13/1/6/s1, Figure S1: The flowchart of the systematic review, Figure S2: Maps of co-authors and co-occurrences from the results of the systematic review, Table S1: 115 publications identified from the systematic review.
Author Contributions
Conceptualization, J.T., P.M.v.B. and W.W.; methodology, J.T., W.W. and P.M.v.B.; investigation, W.W.; writing—original draft preparation, W.W.; writing—review and editing, P.M.v.B., J.T. and Q.C.; supervision, P.M.v.B. and J.T. All authors have read and agreed to the published version of the manuscript.
Funding
This work was supported by the China Scholarship Council (CSC).
Conflicts of Interest
The authors declare no conflict of interest.
References
- FAO. The State of the World’s Land and Water Resources for Food and Agriculture-Managing Systems at Risk; Earthscan: Abingdon, UK, 2011. [Google Scholar]
- FAO; UNICEF; WFP; WHO. The State of Food Security and Nutrition in the World 2020; FAO: Rome, Italy, 2020. [Google Scholar]
- Anami, B.S.; Malvade, N.N.; Palaiah, S. Classification of yield affecting biotic and abiotic paddy crop stresses using field images. Inf. Process. Agric. 2020, 7, 272–285. [Google Scholar] [CrossRef]
- Dresselhaus, T.; Hückelhoven, R. Biotic and Abiotic Stress Responses in Crop Plants. Agronomy 2018, 8, 267. [Google Scholar] [CrossRef] [Green Version]
- Dunn, R.J.H.; Stanitski, D.M.; Gobron, N.; Willett, K.M. (Eds.) Global climate state of the climate in 2019. Bull. Amer. Meteor. 2020, 101, S9–S127. [Google Scholar]
- Smith, A.B. U.S. Billion-Dollar Weather and Climate Disasters, 1980–Present; NCEI Accession 0209268; NOAA National Centers for Environmental Information: Asheville, NC, USA, 2020. [CrossRef]
- Su, B.; Huang, J.; Fischer, T.; Wang, Y.; Kundzewicz, Z.W.; Zhai, J.; Sun, H.; Wang, A.; Zeng, X.; Wang, G.; et al. Drought losses in China might double between the 1.5 °C and 2.0 °C warming. Proc. Natl. Acad. Sci. USA 2018, 115, 10600–10605. [Google Scholar] [CrossRef] [Green Version]
- FAO; IIASA; ISRIC; ISSCAS; JRC. Harmonized World Soil Database (Version 1.2); FAO: Rome, Italy; Laxenburg, Austria, 2012. [Google Scholar]
- Koohafkan, P. Water and Cereals in Drylands; Routledge: London, UK, 2012. [Google Scholar]
- Ivushkin, K.; Bartholomeus, H.; Bregt, A.K.; Pulatov, A.; Kempen, B.; de Sousa, L. Global mapping of soil salinity change. Remote Sens. Environ. 2019, 231, 111260. [Google Scholar] [CrossRef]
- Cook, B.I.; Ault, T.R.; Smerdon, J.E. Unprecedented 21st century drought risk in the American Southwest and Central Plains. Sci. Adv. 2015, 1, e1400082. [Google Scholar] [CrossRef] [Green Version]
- Trenberth, K.E.; Dai, A.; van der Schrier, G.; Jones, P.D.; Barichivich, J.; Briffa, K.R.; Sheffield, J. Global warming and changes in drought. Nat. Clim. Chang. 2014, 4, 17–22. [Google Scholar] [CrossRef]
- Schwalm, C.R.; Anderegg, W.R.L.; Michalak, A.M.; Fisher, J.B.; Biondi, F.; Koch, G.; Litvak, M.; Ogle, K.; Shaw, J.D.; Wolf, A.; et al. Global patterns of drought recovery. Nature 2017, 548, 202–205. [Google Scholar] [CrossRef]
- Mosley, L.M. Drought impacts on the water quality of freshwater systems: Review and integration. Earth Sci. Rev. 2015, 140, 203–214. [Google Scholar] [CrossRef]
- Mimi, Z.A.; Jamous, S.A. Climate change and agricultural water demand: Impacts and adaptations. Afr. J. Environ. Sci. Technol. 2010, 4, 183–191. [Google Scholar] [CrossRef]
- Butcher, K.; Wick, A.F.; DeSutter, T.; Chatterjee, A.; Harmon, J. Soil Salinity: A Threat to Global Food Security. Agron. J. 2016, 108, 2189–2200. [Google Scholar] [CrossRef]
- Rozema, J.; Flowers, T. Ecology: Crops for a salinized world. Science 2008, 322, 1478–1480. [Google Scholar] [CrossRef] [PubMed]
- Cramer, G.R.; Ergul, A.; Grimplet, J.; Tillett, R.L.; Tattersall, E.A.; Bohlman, M.C.; Vincent, D.; Sonderegger, J.; Evans, J.; Osborne, C.; et al. Water and salinity stress in grapevines: Early and late changes in transcript and metabolite profiles. Funct. Integr. Genom. 2007, 7, 111–134. [Google Scholar] [CrossRef] [PubMed]
- Oki, T.; Kanae, S. Global hydrological cycles and world water resources. Science 2006, 313, 1068–1072. [Google Scholar] [CrossRef] [PubMed] [Green Version]
- Hrdinka, T.; Novický, O.; Hanslík, E.; Rieder, M. Possible impacts of floods and droughts on water quality. J. Hydro-Environ. Res. 2012, 6, 145–150. [Google Scholar] [CrossRef]
- van Vliet, M.T.H.; Zwolsman, J.J.G. Impact of summer droughts on the water quality of the Meuse river. J. Hydrol. 2008, 353, 1–17. [Google Scholar] [CrossRef]
- Jones, E.; van Vliet, M.T.H. Drought impacts on river salinity in the southern US: Implications for water scarcity. Sci. Total Environ. 2018, 644, 844–853. [Google Scholar] [CrossRef]
- Wang, J.; Huang, X.; Zhong, T.; Chen, Z. Climate change impacts and adaptation for saline agriculture in north Jiangsu Province, China. Environ. Sci. Policy 2013, 25, 83–93. [Google Scholar] [CrossRef]
- Katschnig, D.; Broekman, R.; Rozema, J. Salt tolerance in the halophyte Salicornia dolichostachya Moss: Growth, morphology and physiology. Environ. Exp. Bot. 2013, 92, 32–42. [Google Scholar] [CrossRef]
- Pankova, Y.I.; Konyushkova, M.V. Effect of global warming on soil salinity of the arid regions. Russ. Agric. Sci. 2014, 39, 464–467. [Google Scholar] [CrossRef]
- Corwin, D.L. Climate change impacts on soil salinity in agricultural areas. Eur. J. Soil Sci. 2020. [Google Scholar] [CrossRef]
- Gopalakrishnan, T.; Hasan, M.; Haque, A.; Jayasinghe, S.; Kumar, L. Sustainability of Coastal Agriculture under Climate Change. Sustainability 2019, 11, 7200. [Google Scholar] [CrossRef] [Green Version]
- Carrão, H.; Naumann, G.; Barbosa, P. Mapping global patterns of drought risk: An empirical framework based on sub-national estimates of hazard, exposure and vulnerability. Glob. Environ. Chang. 2016, 39, 108–124. [Google Scholar] [CrossRef]
- Wu, B.; Gommes, R.; Zhang, M.; Zeng, H.; Yan, N.; Zou, W.; Zheng, Y.; Zhang, N.; Chang, S.; Xing, Q.; et al. Global Crop Monitoring: A Satellite-Based Hierarchical Approach. Remote Sens. 2015, 7, 3907–3933. [Google Scholar] [CrossRef] [Green Version]
- Tucker, C.J. Red and Photographic Infrared Linear Combinations for Monitoring Vegetation. Remote Sens. Environ. 1979, 8, 127–150. [Google Scholar] [CrossRef] [Green Version]
- Rondeaux, G.; Steven, M.; Baret, F. Optimization of soil-adjusted vegetation indices. Remote Sens. Environ. 1996, 55, 95–107. [Google Scholar] [CrossRef]
- Huete, A.R. A Soil-Adjusted Vegetation Index (Savi). Remote Sens. Environ. 1988, 25, 295–309. [Google Scholar] [CrossRef]
- Kogan, F.N. Droughts of the Late 1980′s in the United States as Derived from Noaa Polar-Orbiting Satellite Data. Bull. Am. Meteorol. Soc. 1995, 76, 655–668. [Google Scholar] [CrossRef] [Green Version]
- Kogan, F.N. Global drought watch from space. Bull. Am. Meteorol. Soc. 1997, 78, 621–636. [Google Scholar] [CrossRef]
- Gao, B.C. NDWI—A normalized difference water index for remote sensing of vegetation liquid water from space. Remote Sens. Environ. 1996, 58, 257–266. [Google Scholar] [CrossRef]
- Liu, X.; Zhu, X.; Pan, Y.; Li, S.; Liu, Y.; Ma, Y. Agricultural drought monitoring: Progress, challenges, and prospects. J. Geogr. Sci. 2016, 26, 750–767. [Google Scholar] [CrossRef] [Green Version]
- Allbed, A.; Kumar, L. Soil Salinity Mapping and Monitoring in Arid and Semi-Arid Regions Using Remote Sensing Technology: A Review. Adv. Remote Sens. 2013, 2, 373–385. [Google Scholar] [CrossRef] [Green Version]
- Metternicht, G.I.; Zinck, J.A. Remote sensing of soil salinity: Potentials and constraints. Remote Sens. Environ. 2003, 85, 1–20. [Google Scholar] [CrossRef]
- Serbin, S.P.; Singh, A.; Desai, A.R.; Dubois, S.G.; Jablonski, A.D.; Kingdon, C.C.; Kruger, E.L.; Townsend, P.A. Remotely estimating photosynthetic capacity, and its response to temperature, in vegetation canopies using imaging spectroscopy. Remote Sens. Environ. 2015, 167, 78–87. [Google Scholar] [CrossRef]
- Serbin, S.P.; Singh, A.; McNeil, B.E.; Kingdon, C.C.; Townsend, P.A. Spectroscopic determination of leaf morphological and biochemical traits for northern temperate and boreal tree species. Ecol. Appl. 2014, 24, 1651–1669. [Google Scholar] [CrossRef] [Green Version]
- Gerhards, M.; Schlerf, M.; Mallick, K.; Udelhoven, T. Challenges and Future Perspectives of Multi-/Hyperspectral Thermal Infrared Remote Sensing for Crop Water-Stress Detection: A Review. Remote Sens. 2019, 11, 1240. [Google Scholar] [CrossRef] [Green Version]
- Vereecken, H.; Weihermüller, L.; Jonard, F.; Montzka, C. Characterization of Crop Canopies and Water Stress Related Phenomena using Microwave Remote Sensing Methods: A Review. Vadose Zone J. 2012, 11, vzj2011.0138ra. [Google Scholar] [CrossRef]
- Homolová, L.; Malenovský, Z.; Clevers, J.G.P.W.; García-Santos, G.; Schaepman, M.E. Review of optical-based remote sensing for plant trait mapping. Ecol. Complex. 2013, 15, 1–16. [Google Scholar] [CrossRef] [Green Version]
- Weiss, M.; Jacob, F.; Duveiller, G. Remote sensing for agricultural applications: A meta-review. Remote Sens. Environ. 2020, 236, 111402. [Google Scholar] [CrossRef]
- Berger, K.; Atzberger, C.; Danner, M.; D’Urso, G.; Mauser, W.; Vuolo, F.; Hank, T. Evaluation of the PROSAIL Model Capabilities for Future Hyperspectral Model Environments: A Review Study. Remote Sens. 2018, 10, 85. [Google Scholar] [CrossRef] [Green Version]
- Pérez-Harguindeguy, N.; Díaz, S.; Garnier, E.; Lavorel, S.; Poorter, H.; Jaureguiberry, P.; Bret-Harte, M.S.; Cornwell, W.K.; Craine, J.M.; Gurvich, D.E.; et al. New handbook for standardised measurement of plant functional traits worldwide. Aust. J. Bot. 2013, 61, 167–234. [Google Scholar] [CrossRef]
- Niinemets, U. Is there a species spectrum within the world-wide leaf economics spectrum? Major variations in leaf functional traits in the Mediterranean sclerophyll Quercus ilex. N. Phytol. 2015, 205, 79–96. [Google Scholar] [CrossRef] [PubMed]
- Gamon, J.A.; Penuelas, J.; Field, C.B. A Narrow-Waveband Spectral Index That Tracks Diurnal Changes in Photosynthetic Efficiency. Remote Sens. Environ. 1992, 41, 35–44. [Google Scholar] [CrossRef]
- Hernández-Clemente, R.; Navarro-Cerrillo, R.M.; Suárez, L.; Morales, F.; Zarco-Tejada, P.J. Assessing structural effects on PRI for stress detection in conifer forests. Remote Sens. Environ. 2011, 115, 2360–2375. [Google Scholar] [CrossRef]
- Panigada, C.; Rossini, M.; Meroni, M.; Cilia, C.; Busetto, L.; Amaducci, S.; Boschetti, M.; Cogliati, S.; Picchi, V.; Pinto, F.; et al. Fluorescence, PRI and canopy temperature for water stress detection in cereal crops. Int. J. Appl. Earth Obs. Geoinf. 2014, 30, 167–178. [Google Scholar] [CrossRef]
- Peñuelas, J.; Filella, I.; Biel, C.; Serrano, L.; Savé, R. The reflectance at the 950–970 nm region as an indicator of plant water status. Int. J. Remote Sens. 1993, 14, 1887–1905. [Google Scholar] [CrossRef]
- Idso, S.B.; Jackson, R.D.; Pinter, P.J.; Reginato, R.J.; Hatfield, J.L. Normalizing the Stress-Degree-Day Parameter for Environmental Variability. Agric. Meteorol. 1981, 24, 45–55. [Google Scholar] [CrossRef]
- Zarco-Tejada, P.J.; González-Dugo, V.; Berni, J.A.J. Fluorescence, temperature and narrow-band indices acquired from a UAV platform for water stress detection using a micro-hyperspectral imager and a thermal camera. Remote Sens. Environ. 2012, 117, 322–337. [Google Scholar] [CrossRef]
- Haboudane, D.; Miller, J.R.; Tremblay, N.; Zarco-Tejada, P.J.; Dextraze, L. Integrated narrow-band vegetation indices for prediction of crop chlorophyll content for application to precision agriculture. Remote Sens. Environ. 2002, 81, 416–426. [Google Scholar] [CrossRef]
- Gitelson, A.A. Remote estimation of canopy chlorophyll content in crops. Geophys. Res. Lett. 2005, 32, L08403. [Google Scholar] [CrossRef] [Green Version]
- Asrar, G.; Kanemasu, E.T.; Jackson, R.D.; Pinter, P.J. Estimation of Total above-Ground Phytomass Production Using Remotely Sensed Data. Remote Sens. Environ. 1985, 17, 211–220. [Google Scholar] [CrossRef]
- Zarco-Tejada, P.J.; González-Dugo, V.; Williams, L.E.; Suárez, L.; Berni, J.A.J.; Goldhamer, D.; Fereres, E. A PRI-based water stress index combining structural and chlorophyll effects: Assessment using diurnal narrow-band airborne imagery and the CWSI thermal index. Remote Sens. Environ. 2013, 138, 38–50. [Google Scholar] [CrossRef]
- Vogelmann, J.E.; Rock, B.N.; Moss, D.M. Red edge spectral measurements from sugar maple leaves. Int. J. Remote Sens. 1993, 14, 1563–1575. [Google Scholar] [CrossRef]
- Zarco-Tejada, P.J.; Miller, J.R.; Noland, T.L.; Mohammed, G.H.; Sampson, P.H. Scaling-up and model inversion methods with narrowband optical indices for chlorophyll content estimation in closed forest canopies with hyperspectral data. IEEE Trans. Geosci. Remote Sens. 2001, 39, 1491–1507. [Google Scholar] [CrossRef] [Green Version]
- Rahimzadeh-Bajgiran, P.; Darvishsefat, A.A.; Khalili, A.; Makhdoum, M.F. Using AVHRR-based vegetation indices for drought monitoring in the Northwest of Iran. J. Arid Environ. 2008, 72, 1086–1096. [Google Scholar] [CrossRef]
- Rahimzadeh-Bajgiran, P.; Omasa, K.; Shimizu, Y. Comparative evaluation of the Vegetation Dryness Index (VDI), the Temperature Vegetation Dryness Index (TVDI) and the improved TVDI (iTVDI) for water stress detection in semi-arid regions of Iran. ISPRS J. Photogramm. Remote Sens. 2012, 68, 1–12. [Google Scholar] [CrossRef]
- Zargar, A.; Sadiq, R.; Naser, B.; Khan, F.I. A review of drought indices. Environ. Rev. 2011, 19, 333–349. [Google Scholar] [CrossRef]
- Moreno-Martínez, Á.; Camps-Valls, G.; Kattge, J.; Robinson, N.; Reichstein, M.; van Bodegom, P.; Kramer, K.; Cornelissen, J.H.C.; Reich, P.; Bahn, M.; et al. A methodology to derive global maps of leaf traits using remote sensing and climate data. Remote Sens. Environ. 2018, 218, 69–88. [Google Scholar] [CrossRef] [Green Version]
- Mahajan, S.; Tuteja, N. Cold, salinity and drought stresses: An overview. Arch. Biochem. Biophys. 2005, 444, 139–158. [Google Scholar] [CrossRef]
- Yeo, A. Molecular biology of salt tolerance in the context of whole-plant physiology. J. Exp. Bot. 1998, 49, 915–929. [Google Scholar] [CrossRef]
- Niu, X.; Bressan, R.A.; Hasegawa, P.M.; Pardo, J.M. Ion Homeostasis in NaCl Stress Environments. Plant Physiol. 1995, 109, 735–742. [Google Scholar] [CrossRef] [PubMed] [Green Version]
- Bartels, D.; Sunkar, R. Drought and Salt Tolerance in Plants. Crit. Rev. Plant Sci. 2005, 24, 23–58. [Google Scholar] [CrossRef]
- El-Hendawy, S.E.; Al-Suhaibani, N.A.; Hassan, W.M.; Dewir, Y.H.; Elsayed, S.; Al-Ashkar, I.; Abdella, K.A.; Schmidhalter, U. Evaluation of wavelengths and spectral reflectance indices for high-throughput assessment of growth, water relations and ion contents of wheat irrigated with saline water. Agric. Water Manag. 2019, 212, 358–377. [Google Scholar] [CrossRef]
- Zhang, L.; Zhou, Z.; Zhang, G.; Meng, Y.; Chen, B.; Wang, Y. Monitoring cotton (Gossypium hirsutum L.) leaf ion content and leaf water content in saline soil with hyperspectral reflectance. Eur. J. Remote Sens. 2014, 47, 593–610. [Google Scholar] [CrossRef]
- Bayat, B.; van der Tol, C.; Verhoef, W. Remote Sensing of Grass Response to Drought Stress Using Spectroscopic Techniques and Canopy Reflectance Model Inversion. Remote Sens. 2016, 8, 557. [Google Scholar] [CrossRef] [Green Version]
- Botha, E.J.; Zebarth, B.J.; Leblon, B. Non-destructive estimation of potato leaf chlorophyll and protein contents from hyperspectral measurements using the PROSPECT radiative transfer model. Can. J. Plant Sci. 2006, 86, 279–291. [Google Scholar] [CrossRef]
- Jacquemoud, S.; Bacour, C.; Poilve, H.; Frangi, J.P. Comparison of Four Radiative Transfer Modelsto Simulate Plant Canopies Reflectance: Direct and Inverse Mode. Remote Sens. Environ. 2000, 74, 471–481. [Google Scholar] [CrossRef]
- Lu, B.; Dao, P.D.; Liu, J.; He, Y.; Shang, J. Recent Advances of Hyperspectral Imaging Technology and Applications in Agriculture. Remote Sens. 2020, 12, 2659. [Google Scholar] [CrossRef]
- Timmermans, J.; Verhoef, W.; van der Tol, C.; Su, Z. Retrieval of canopy component temperatures through Bayesian inversion of directional thermal measurements. Hydrol. Earth Syst. Sci. 2009, 13, 1249–1260. [Google Scholar] [CrossRef] [Green Version]
- Berni, J.; Zarco-Tejada, P.J.; Suarez, L.; Fereres, E. Thermal and Narrowband Multispectral Remote Sensing for Vegetation Monitoring from an Unmanned Aerial Vehicle. IEEE Trans. Geosci. Remote Sens. 2009, 47, 722–738. [Google Scholar] [CrossRef] [Green Version]
Figure 1.
Global distribution of drought and salinity. In panel (a), the global map of soil salinity change is shown [10], while in panel (b) the global map of drought hazard [28] is shown. Global soil salinity map was extracted from [10] and then transformed to the plate carrée projection by ArcGIS.

Figure 2.
Flowchart of the systematic review.

Figure 3.
Relationships between R2 and wavelength of different VIs clusters under drought stress. The red line indicates that R2 > 0.50.
Figure 3.
Relationships between R2 and wavelength of different VIs clusters under drought stress. The red line indicates that R2 > 0.50.

Figure 4.
Drought and salinity stress responses of different trait clusters across the reflectance spectrum based on relationships with R2 > 0. Solid symbols indicate traits directly measured by RS; empty symbols are related to traits indirectly measured by RS.
Figure 4.
Drought and salinity stress responses of different trait clusters across the reflectance spectrum based on relationships with R2 > 0. Solid symbols indicate traits directly measured by RS; empty symbols are related to traits indirectly measured by RS.

Figure 5.
Relationship between R2 and wavelength of different traits clusters under drought/salinity stress. RS identifies traits that can be directly measured by RS; InRS identifies traits that can be indirectly measured by RS. The red line indicates R2 > 0.50.
Figure 5.
Relationship between R2 and wavelength of different traits clusters under drought/salinity stress. RS identifies traits that can be directly measured by RS; InRS identifies traits that can be indirectly measured by RS. The red line indicates R2 > 0.50.


Table 1.
Classification of plant traits included in this study.
| Group | RS Methods | Traits | |||||||
|---|---|---|---|---|---|---|---|---|---|
| Biomass traits | RS | LMA | LAI | -- | -- | -- | -- | -- | -- |
| In-RS | FS | SDW | BDW | BFW | -- | -- | -- | -- | |
| Photosynthesis traits | RS | Chl | Chla/Chlb | -- | -- | -- | -- | -- | -- |
| In-RS | A | Pn | ΔF/Fm | Chl × ΔF/Fm | -- | -- | -- | -- | |
| Water traits | RS | LCT | CWC | RWC | EWT | CWM | -- | ||
| In-RS | Gs | LOP | Ψp | LWP | Ψs | E | Tl − Tair | -- | |
| Osmosis traits | RS | -- | -- | -- | -- | -- | -- | -- | -- |
| In-RS | Na+ | Cl− | K+ | Ca2+ | K+/Na+ | TSS | TA | TSS/TA | |
Notes: leaf mass per unit area (LMA), leaf area index (LAI), fruit size (FS), shoot dry weight (SDW), biomass dry weight (BDW), biomass fresh weight (BFW), stomatal conductance (Gs), net gas exchange (A), leaf total chlorophyll (Chl), quantum yield of photosystem II efficiency (ΔF/Fm), net photosynthesis rate (Pn), difference between leaf and air temperature (Tl − Tair), transpiration rate (E), leaf water potential (LWP), stem water potential (Ψs), leaf osmotic potential (LOP), leaf canopy temperature (LCT), canopy water content (CWC), relative water content (RWC), leaf equivalent water thickness (EWT), pressure potential (Ψp), canopy water mass (CWM), Na+ contents in leaf (Na+), Cl− contents in leaf (Cl−), K+ contents in leaf (K+), Ca2+ contents in leaf (Ca2+), total soluble solids (TSS), titratable acidity (TA). RS methods: directly derived by remote sensing (RS), indirectly derived by remote sensing (In-RS).
Table 2.
Classification, explanation, and equations of different vegetation indices (VIs) included in this study.
Table 2.
Classification, explanation, and equations of different vegetation indices (VIs) included in this study.
| VIs | Meaning | Equation | Reference |
|---|---|---|---|
| Xanthophyll Indices | |||
| PRI570 | Photochemical reflectance index | (R531 − R570)/(R531 + R570) | [48] |
| PRI515 | Photochemical reflectance index | (R531 − R515)/(R531 + R515) | [49] |
| PRI586 | Photochemical reflectance index | (R531 − R586)/(R531 + R586) | [50] |
| PRI600 | Photochemical reflectance index | (R531 − R602)/(R531 + R602) | [49] |
| PRI670 | Photochemical reflectance index | (R531 − R668)/(R531 + R668) | [49] |
| Water Content Indices | |||
| WI | Water index | R900/R970 | [51] |
| CWSI | Crop Water Stress Index | CWSI = (Tleaf − Twet)/(Tdry − Twet) | [52] |
| Carotenoid Indices | |||
| R520/R500 | Carotenoid concentration | [53] | |
| R515/R570 | Carotenoid concentration | [53] | |
| Greenness Indices | |||
| OSAVI | Optimized Soil-Adjusted Vegetation Index | (R800 − R670)/(R800 + R670 + 0.16) | [31] |
| TCARI | The Transformed Chlorophyll Absorption in Reflectance Index | TCARI = 3 [(R700 − R670) − 0.2 (R700 − R550) (R700/R670)] | [54] |
| TCARI/OSAVI | Normalized by OSAVI to obtain | TCARI/OSAVI = [3 [(R700 − R670) − 0.2 (R700 − R550) (R700/R670)]]/[(1 + 0.16) (R800 − R670)/(R800 + R670 + 0.16)] | [54] |
| CIgreen | Green chlorophyll index | (R750/R550) − 1 | [55] |
| CIred edge | Red edge chlorophyll index | (R750/R710) − 1 | [55] |
| SR | Simple ratio | R800/R670 | [56] |
| Red edge ratio index | R700/R670 | [57] | |
| VOG1 | The chlorophyll a + b index | R740/R720 | [58] |
| ZM | The chlorophyll a + b index | R750/R710 | [59] |
Notes: R means the reflectance of the band and T means temperature. While NDVI has been used frequently for drought monitoring at a regional scale, we did not include it in this review. The reasoning for this is that NDVI is considered as a greenness index related to chlorophyll instead of the water status of the vegetation. In support of this interpretation, NDVI has not been found to respond to rainfall or major precipitation events during the crop growth period [60,61]. Therefore, NDVI was not included in the review.
Table 3.
The relationship between traits and VIs under drought stress.
| Vis | Biomass Traits | Photosynthesis Traits | Water Traits | Osmosis Traits | |||||||||||
|---|---|---|---|---|---|---|---|---|---|---|---|---|---|---|---|
| LAI * | FS | Chl * | ΔF/Fm | Chl × ΔF/Fm | Tl − Tair | CWC * | RWC * | EWT * | EWTcanopy * | LWP | Gs | TSS | TA | TSS/TA | |
| Xanthophyll Indices | |||||||||||||||
| PRI570 | 0.66 | 0.11 | -- | -- | 0.40 | 0.74 | -- | 0.51 | -- | -- | 0.37 | 0.59 | 0.17 | 0.50 | 0.50 |
| PRI515 | -- | -- | -- | -- | -- | -- | -- | -- | -- | -- | 0.38 | 0.59 | -- | -- | -- |
| PRI586 | 0.64 | -- | -- | 0.51 | 0.34 | -- | -- | -- | -- | 0.75 | -- | -- | -- | -- | -- |
| PRI600 | 0.40 | -- | -- | 0.68 | -- | 0.79 | -- | 0.52 | -- | -- | -- | -- | -- | -- | -- |
| PRI670 | -- | -- | -- | 0.34 | 0.36 | -- | -- | -- | -- | -- | -- | -- | -- | -- | -- |
| Carotenoid Indices | |||||||||||||||
| R520/R500 | -- | -- | -- | -- | -- | -- | -- | -- | -- | -- | 0.48 | 0.49 | -- | -- | -- |
| R515/R670 | -- | -- | -- | -- | -- | -- | -- | -- | -- | -- | 0.20 | 0.23 | -- | -- | -- |
| Water Content Indices | |||||||||||||||
| WI | 0.49 | -- | -- | 0.48 | 0.19 | 0.69 | 0.72 | 0.42 | -- | 0.56 | -- | -- | -- | -- | -- |
| CWSI | -- | -- | -- | -- | -- | -- | -- | -- | -- | -- | 0.78 | 0.77 | -- | -- | -- |
| Greenness Indices | |||||||||||||||
| OSAVI | 0.71 | -- | -- | 0.48 | 0.32 | -- | -- | -- | -- | 0.76 | -- | -- | -- | -- | -- |
| TCARI | -- | -- | 0.43 | -- | -- | -- | -- | -- | -- | -- | 0.325 | 0.32 | -- | -- | -- |
| TCARI/OSAVI | 0.34 | 0.32 | 0.66 | 0.70 | 0.51 | 0.80 | -- | 0.41 | 0.55 | -- | 0.28 | 0.23 | 0.24 | 0.35 | 0.28 |
| CIgreen | -- | -- | -- | -- | -- | -- | 0.78 | -- | -- | -- | -- | -- | -- | -- | -- |
| CIred edge | 0.64 | -- | -- | 0.42 | -- | 0.54 | 0.73 | 0.34 | -- | -- | -- | -- | -- | -- | -- |
| SR | -- | 0.18 | -- | -- | -- | -- | -- | -- | -- | -- | -- | -- | 0.28 | 0.34 | 0.17 |
| Red edge ratio index | -- | -- | -- | -- | -- | -- | -- | -- | -- | -- | -- | 0.21 | -- | -- | -- |
| VOG1 | -- | -- | -- | -- | -- | -- | -- | -- | -- | -- | 0.02 | 0.29 | -- | -- | -- |
| ZM | -- | -- | -- | -- | -- | -- | -- | -- | -- | -- | 0.02 | 0.26 | -- | -- | -- |
Note: bold numbers indicate that R2 > 0.50. * means the traits could be directly measured by RS.
Publisher’s Note: MDPI stays neutral with regard to jurisdictional claims in published maps and institutional affiliations. |
© 2020 by the authors. Licensee MDPI, Basel, Switzerland. This article is an open access article distributed under the terms and conditions of the Creative Commons Attribution (CC BY) license (http://creativecommons.org/licenses/by/4.0/).
Share and Cite
MDPI and ACS Style
Wen, W.; Timmermans, J.; Chen, Q.; van Bodegom, P.M. A Review of Remote Sensing Challenges for Food Security with Respect to Salinity and Drought Threats. Remote Sens. 2021, 13, 6. https://0-doi-org.brum.beds.ac.uk/10.3390/rs13010006
AMA Style
Wen W, Timmermans J, Chen Q, van Bodegom PM. A Review of Remote Sensing Challenges for Food Security with Respect to Salinity and Drought Threats. Remote Sensing. 2021; 13(1):6. https://0-doi-org.brum.beds.ac.uk/10.3390/rs13010006
Chicago/Turabian StyleWen, Wen, Joris Timmermans, Qi Chen, and Peter M. van Bodegom. 2021. "A Review of Remote Sensing Challenges for Food Security with Respect to Salinity and Drought Threats" Remote Sensing 13, no. 1: 6. https://0-doi-org.brum.beds.ac.uk/10.3390/rs13010006
Note that from the first issue of 2016, this journal uses article numbers instead of page numbers. See further details here.