Article

Impact of Topography and Rainfall Intensity on the Accuracy of IMERG Precipitation Estimates in an Arid Region

by
Mohammed T. Mahmoud
1,2,
Safa A. Mohammed
1,
Mohamed A. Hamouda
1,3,* and
Mohamed M. Mohamed
1,3
1
Department of Civil and Environmental Engineering, United Arab Emirates University, Al Ain 15551, UAE
2
Civil Engineering Department, University of Khartoum, Khartoum 11111, Sudan
3
National Water Center, UAE University, Al Ain 15551, UAE
*
Author to whom correspondence should be addressed.
Submission received: 30 November 2020 / Revised: 16 December 2020 / Accepted: 21 December 2020 / Published: 22 December 2020
(This article belongs to the Special Issue Precipitation and Water Cycle Measurements Using Remote Sensing)

Abstract

:
The influence of topographical characteristics and rainfall intensity on the accuracy of satellite precipitation estimates is of importance to the adoption of satellite data for hydrological applications. This study evaluates the three GPM IMERG V05B products over the arid country of Saudi Arabia. Statistical indices quantifying the performance of IMERG products were calculated under three evaluation techniques: seasonal-based, topographical, and rainfall intensity-based. Results indicated that IMERG products have the capability to detect seasons with the highest precipitation values (spring) and seasons with the lowest precipitation (summer). Moreover, results showed that IMERG products performed well under various rainfall intensities, particularly under light rain, which is the most common rainfall in arid regions. Furthermore, IMERG products exhibited high detection accuracy over moderate elevations, whereas it had poor performance over coastal and mountainous regions. Overall, the results confirmed that the performance of the final-run product surpassed the near-real-time products in terms of consistency and errors. IMERG products can improve temporal resolution and play a significant role in filling data gaps in poorly gauged regions. However, due to the errors in IMERG products, it is recommended to use sub-daily rain gauge data in satellite calibration for better rainfall estimation over arid and semiarid regions.

Graphical Abstract

1. Introduction

Precipitation is one of the most complex natural process in the hydrological cycle that undergoes momentous variability at both the spatial and temporal scales. The acquisition of accurate precipitation measurements is crucial since it is the main input in a wide range of applications such as climate change prediction, environmental studies, hydrological modelling, flood forecasting, drought monitoring, and water resources assessment. In addition, precipitation measurements at a high spatial and temporal resolution are crucial to properly simulate the hydrological states of natural systems. Precipitation characteristics, such as the rainfall pattern, intensity, probability distribution of rainfall and return periods, are considered the basis for studying the hydrological behavior of any catchment [1,2,3,4,5,6].
In the last three decades, meteorologists and hydrologists were attracted by advancements in satellite information technology; primarily their focus was on developing algorithms to retrieve precipitation data from information remotely collected by these satellites. These algorithms estimate precipitation amounts from the characteristics of clouds as interpreted from infrared (IR), visible (VI), and microwave (MW) satellite images [7]. Generally, passive microwave (PMW) measurements have demonstrated high performance at the global scale compared to algorithms that were based on IR and VI, while precipitation estimations that are based on IR have a higher temporal resolution than others [8,9]. Currently, most of the recognized satellite-based precipitation products rely on a combination of MW and IR to benefit from their complementary strengths. For instance, the Precipitation Estimation from Remotely Sensed Information using Artificial Neural Networks method (PERSIANN) generates rainfall estimates by deriving relations between MW data and IR data [10]. Furthermore, other methods such as Climate Prediction Centre Morphing Method CMORPH generates rainfall estimates that are derived from MW data, whereas IR data are used to propagate rain pixels by a tracking approach to derive a cloud’s motion field [11].
The first devoted meteorological precipitation satellite is the Multi-satellite Precipitation Analysis (TMPA) 3B42R that was produced by the Tropical Rainfall Measuring Mission (TRMM). The National Aeronautics and Space Administration (NASA) launched the successful satellite in late 1997. The TRMM products were used widely, and it provided two products: the post-processed product (3B42-V7) and the near-real-time product (3B42RT). TMPA applies an estimation method that relies on using IR-calibrated estimates with MW estimates. The TMPA product provides estimations of tropical precipitation with good accuracy [12,13,14,15]. Recently, in 2014, NASA and Japan Aerospace Exploration Agency (JAXA) cooperated to launch the Global Precipitation Measurement (GPM) satellite, after the impressive success of TRMM. It consists of one main observatory satellite and ten other partner satellites, carrying an up-to-date Dual-frequency Precipitation Radar (DPR), GPM Microwave Imager (GMI), and other innovative instruments [12,16]. The satellite is anticipated to perform efficiently in the prediction of flood hazards and reduce uncertainties in estimating short-term precipitation as it has a high spatiotemporal resolution [17,18]. According to NASA, the GPM provides four levels of data which are Level-0, Level-1, Level-2 and Level-3. The Level-3 product is the Integrated Multi-satellitE Retrievals for GPM (IMERG), released in early 2015, and has since gained more attention and recommendations from researchers and practitioners. IMERG products have a high resolution (spatially 0.1° latitude × 0.1° longitude) and multiple temporal resolutions (ranging from half-hourly, up to monthly basis). It includes three modes of output namely an, early, late, and final run product based on latency and accuracy.
One of the often-discussed challenges for satellite precipitation retrievals is estimating precipitation over areas of complex topography, where precipitation has high spatiotemporal variation [9]. It is not common to find rain gauges in mountainous regions, particularly in Saudi Arabia, due to accessibility issues. In addition, since most developments exist in lowlands, it follows that most of the rain gauges are concentrated in lowlands, while the highlands are left under-represented. Since this under-representation can be augmented with satellite products, researchers have started focusing on evaluating satellite precipitation products over complex topography [15,19,20,21,22,23]. These efforts represent a good start, but more research is needed to cover different topographic and climatic regions around the globe. Results from previous studies show that the main sources of error in satellite precipitation measurements are from IR and PMW retrievals [3,15,19,24]. In addition to complex topography, low rainfall intensity (light rainfall) events represent another challenge for satellite precipitation products. Although light rain covers vast areas of the globe, particularly the subtropics, to date limited studies are attempting to evaluate the accuracy of satellite products in the detection of light rain. Previously, TRMM Precipitation Radar TRMM PR was only sensitive to precipitation exceeding 0.5 mm/h. This is particularly relevant to the evaluation of GPM precipitation products, since one of its main missions is to improve the monitoring of snowfall and light rain by using highly sensitive PMW sensors, which are sensitive to precipitation as low as 0.2 mm/h [25].
In the past decade, several studies were conducted to evaluate the detection accuracy of satellite rainfall products in arid and semiarid regions. One study evaluated seven satellite rainfall products over an arid and semiarid region that spans from North-Western Africa to North-Western India [26]. These satellite precipitation products included CMORPH, GSMaP-MVK, TRMM (3B42), TRMM (3B42RT), African rainfall climatology, and African rainfall estimation algorithm. Their findings showed that satellite precipitation measurements had an overall positive detection performance, particularly during the wet season. Few studies, however, specifically focused on evaluating the performance of GPM IMERG products over arid regions. The latest studies [27,28] assessed the performance of GPM IMERG rainfall products over the United Arab Emirates and Egypt, respectively. Both are considered arid countries with high rainfall scarcity. Mahmoud et al. [27] found that the calibrated IMERG product outperformed the near-real-time products, giving the highest detection accuracy and the lowest errors. Moreover, Nashwan et al. [28] evaluated two products other than IMERG, namely: Global Satellite Mapping of Precipitation (GSMaP), and Climate Hazards Group InfraRed Precipitation with Station data (CHIRPS). The results showed the superiority of IMERG products in rainfall occurrence detection and its capability to represent rainfall spatial variability during extreme events. Moreover, two earlier studies evaluated the accuracy of the TRMM products over Saudi Arabia and found that there was considerable variation in the accuracy of the products for different events and sub-regions; the conclusion was that TRMM cannot be the only source of data for hydrological applications as it provides limited input information [16,29]. A more recent study validated the IMERG products over Saudi Arabia, and the findings showed that the final-run product had a better performance than other products in detecting and estimating precipitation in the study area [4]. This study was, however, limited to only one rainy season, and did not investigate the impact of varying topographical regions and rainfall intensity on the performance of satellite measurements. A more comprehensive study is thus needed to address these research gaps and investigate the ability of GPM satellite instruments in overcoming the impact of complex topography, and verifying the claim that it can detect low rainfall intensity events, which has not been addressed in arid and semi-arid regions—such as Saudi Arabia—to date.
The main purpose of this study is to evaluate the performance of GPM IMERG V05B products, namely early, late, and final run products, over Saudi Arabia. The evaluation was conducted by using ground observation data acquired from 275 rain gauge stations at daily scale over the period from March 2014 to June 2018. The evaluation of IMERG satellite products in this study was threefold: (1) evaluate the impact of spatial characteristics (topography) on IMERG products; (2) evaluate the variation in IMERG performance in different seasons (temporal); and (3) evaluate the performance of IMERG products in detecting rainfall of different intensities. More importantly, for the first time in arid and semi-arid regions, this study evaluated the performance of IMERG precipitation products across the five rainfall intensity categories (light, moderate, heavy, storm, and strong storm) with a focus on light rain detection. The outcome of this analysis could verify the utility of IMERG products as a source of rainfall data over arid regions such as Saudi Arabia. This analysis could also highlight the use of GPM data in forecasting and early warning against potentially hazardous rainfall events in less prepared arid regions.

2. Materials and Methods

The primary objective of this study is to assess the capability of the IMERG products for detecting the rainfall under low intensity, and over various topography over Saudi Arabia. The evaluation was carried out in the following main steps: preparation of rain gauge data, processing of the satellite data, and performing the spatiotemporal and intensity-based evaluation of the GPM satellite data versus the gauged-based data using a set of statistical indices.

2.1. Study Area

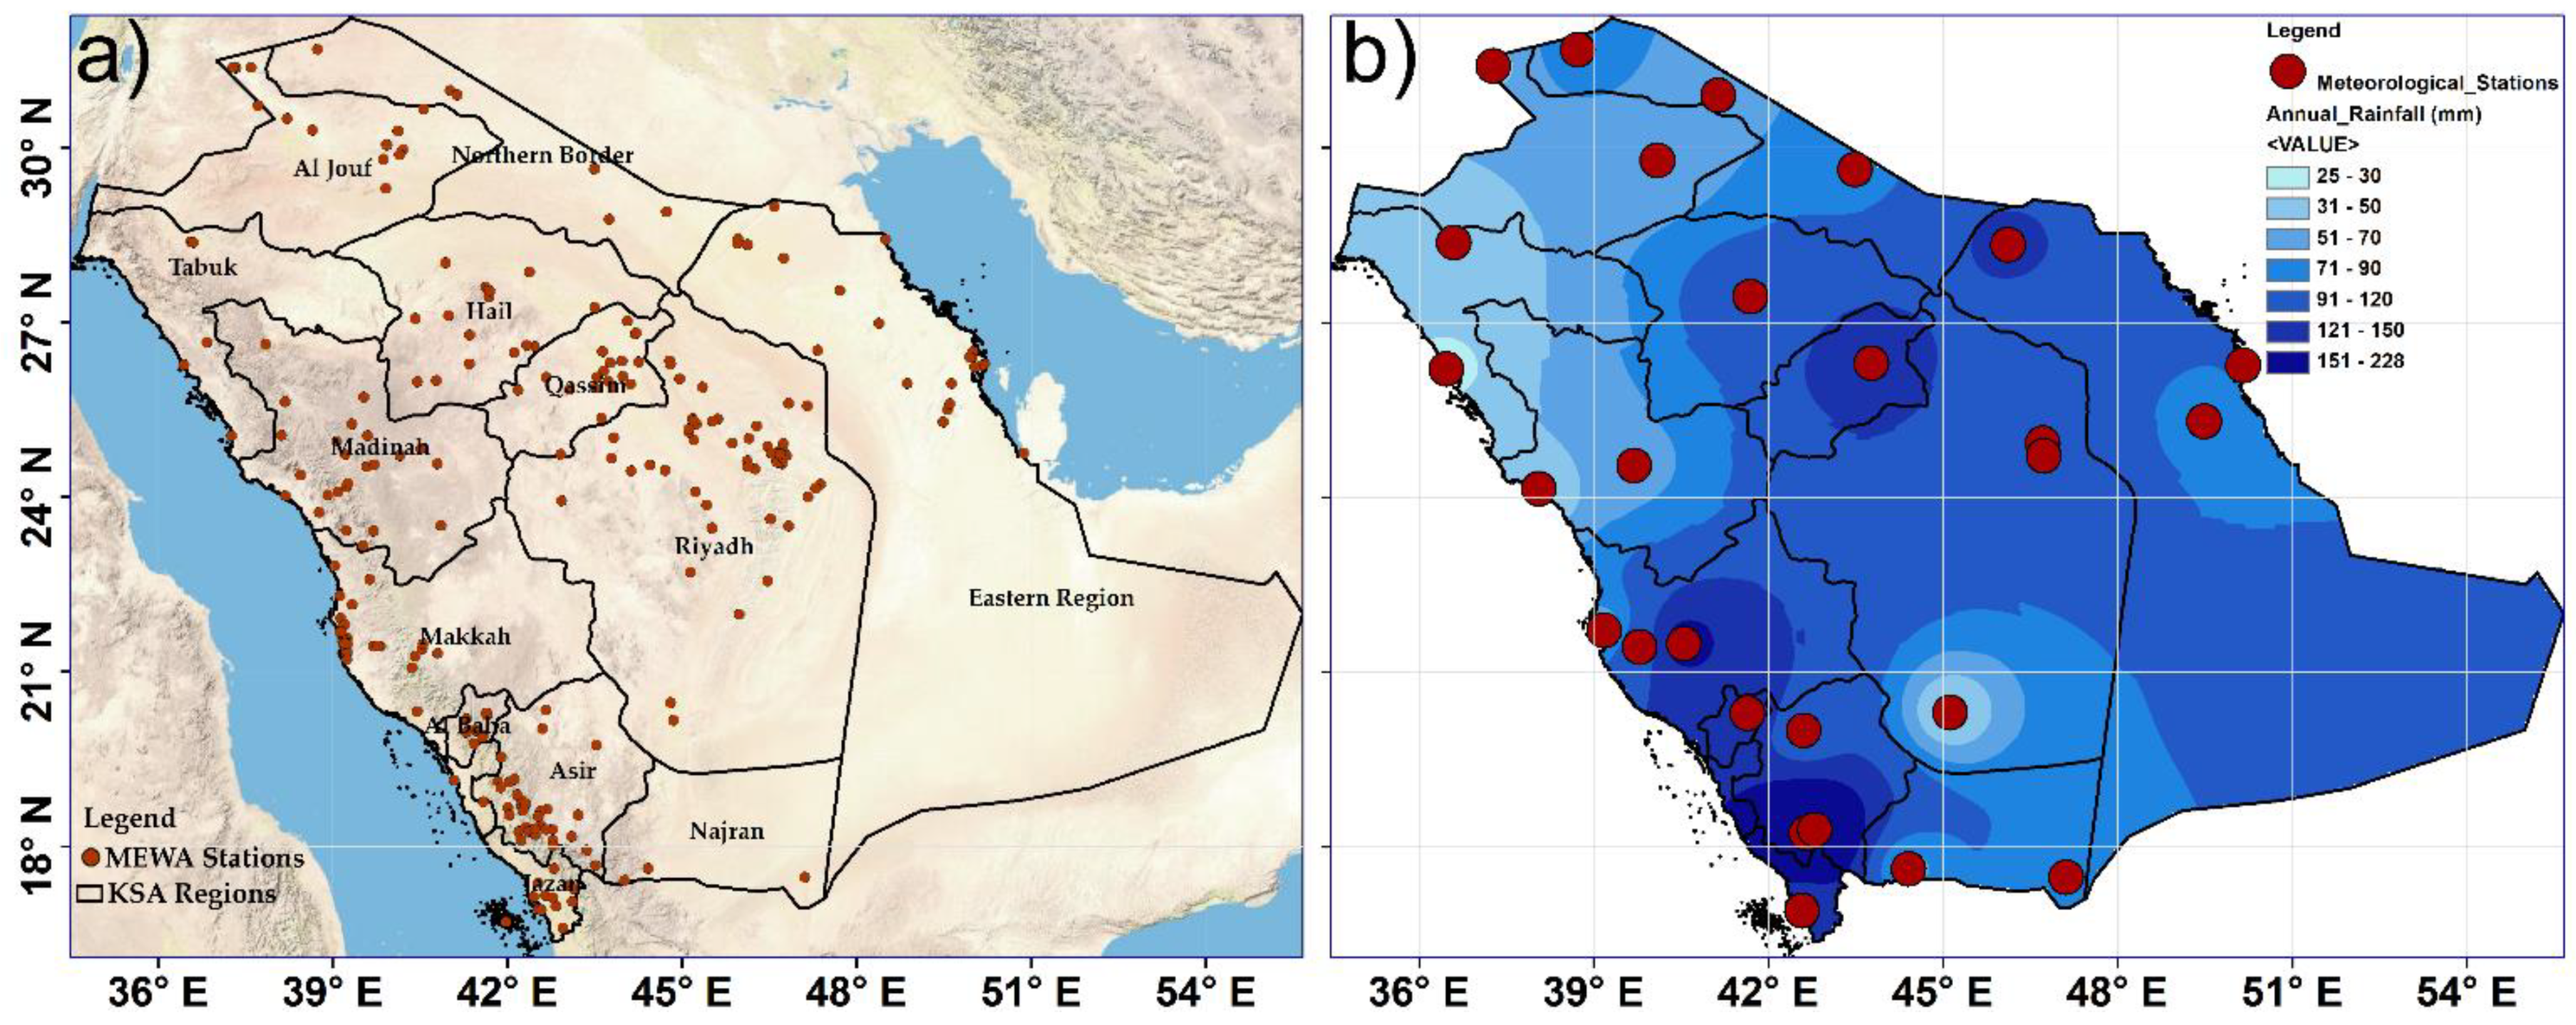
This study is focused on the country of Saudi Arabia that occupies an area of about 2,250,000 km2, which is just under eighty percent of the Arabian Peninsula. The country has complex topographical features and falls between 34°–55°E and 16°–32°N, as represented in Figure 1. Its vast area (with a wide latitude expanse) combined with its topographical variation resulted in diverse rainfall rates over the area [4,30]. The country has thirteen administrative regions and about 400 rainfall stations [31].
Although the country has a wide climatic range due to spatial and temporal temperature variability, it is considered one of the driest countries in the world [30]. Based on the aridity index, the majority of the country’s area is classified as a desert climate, where precipitation is infrequent, and temperatures are high, with the exception of the mountainous region as it is considered a semiarid region. Saudi Arabia is sandwiched between the massive continental land of Africa and Asia and is at the same time close to the circum-global latitudinal belt, that has high atmospheric pressure. These factors make Saudi Arabia one of the hottest and lowest humidity countries in the world, except for its coastal lands [30,32].
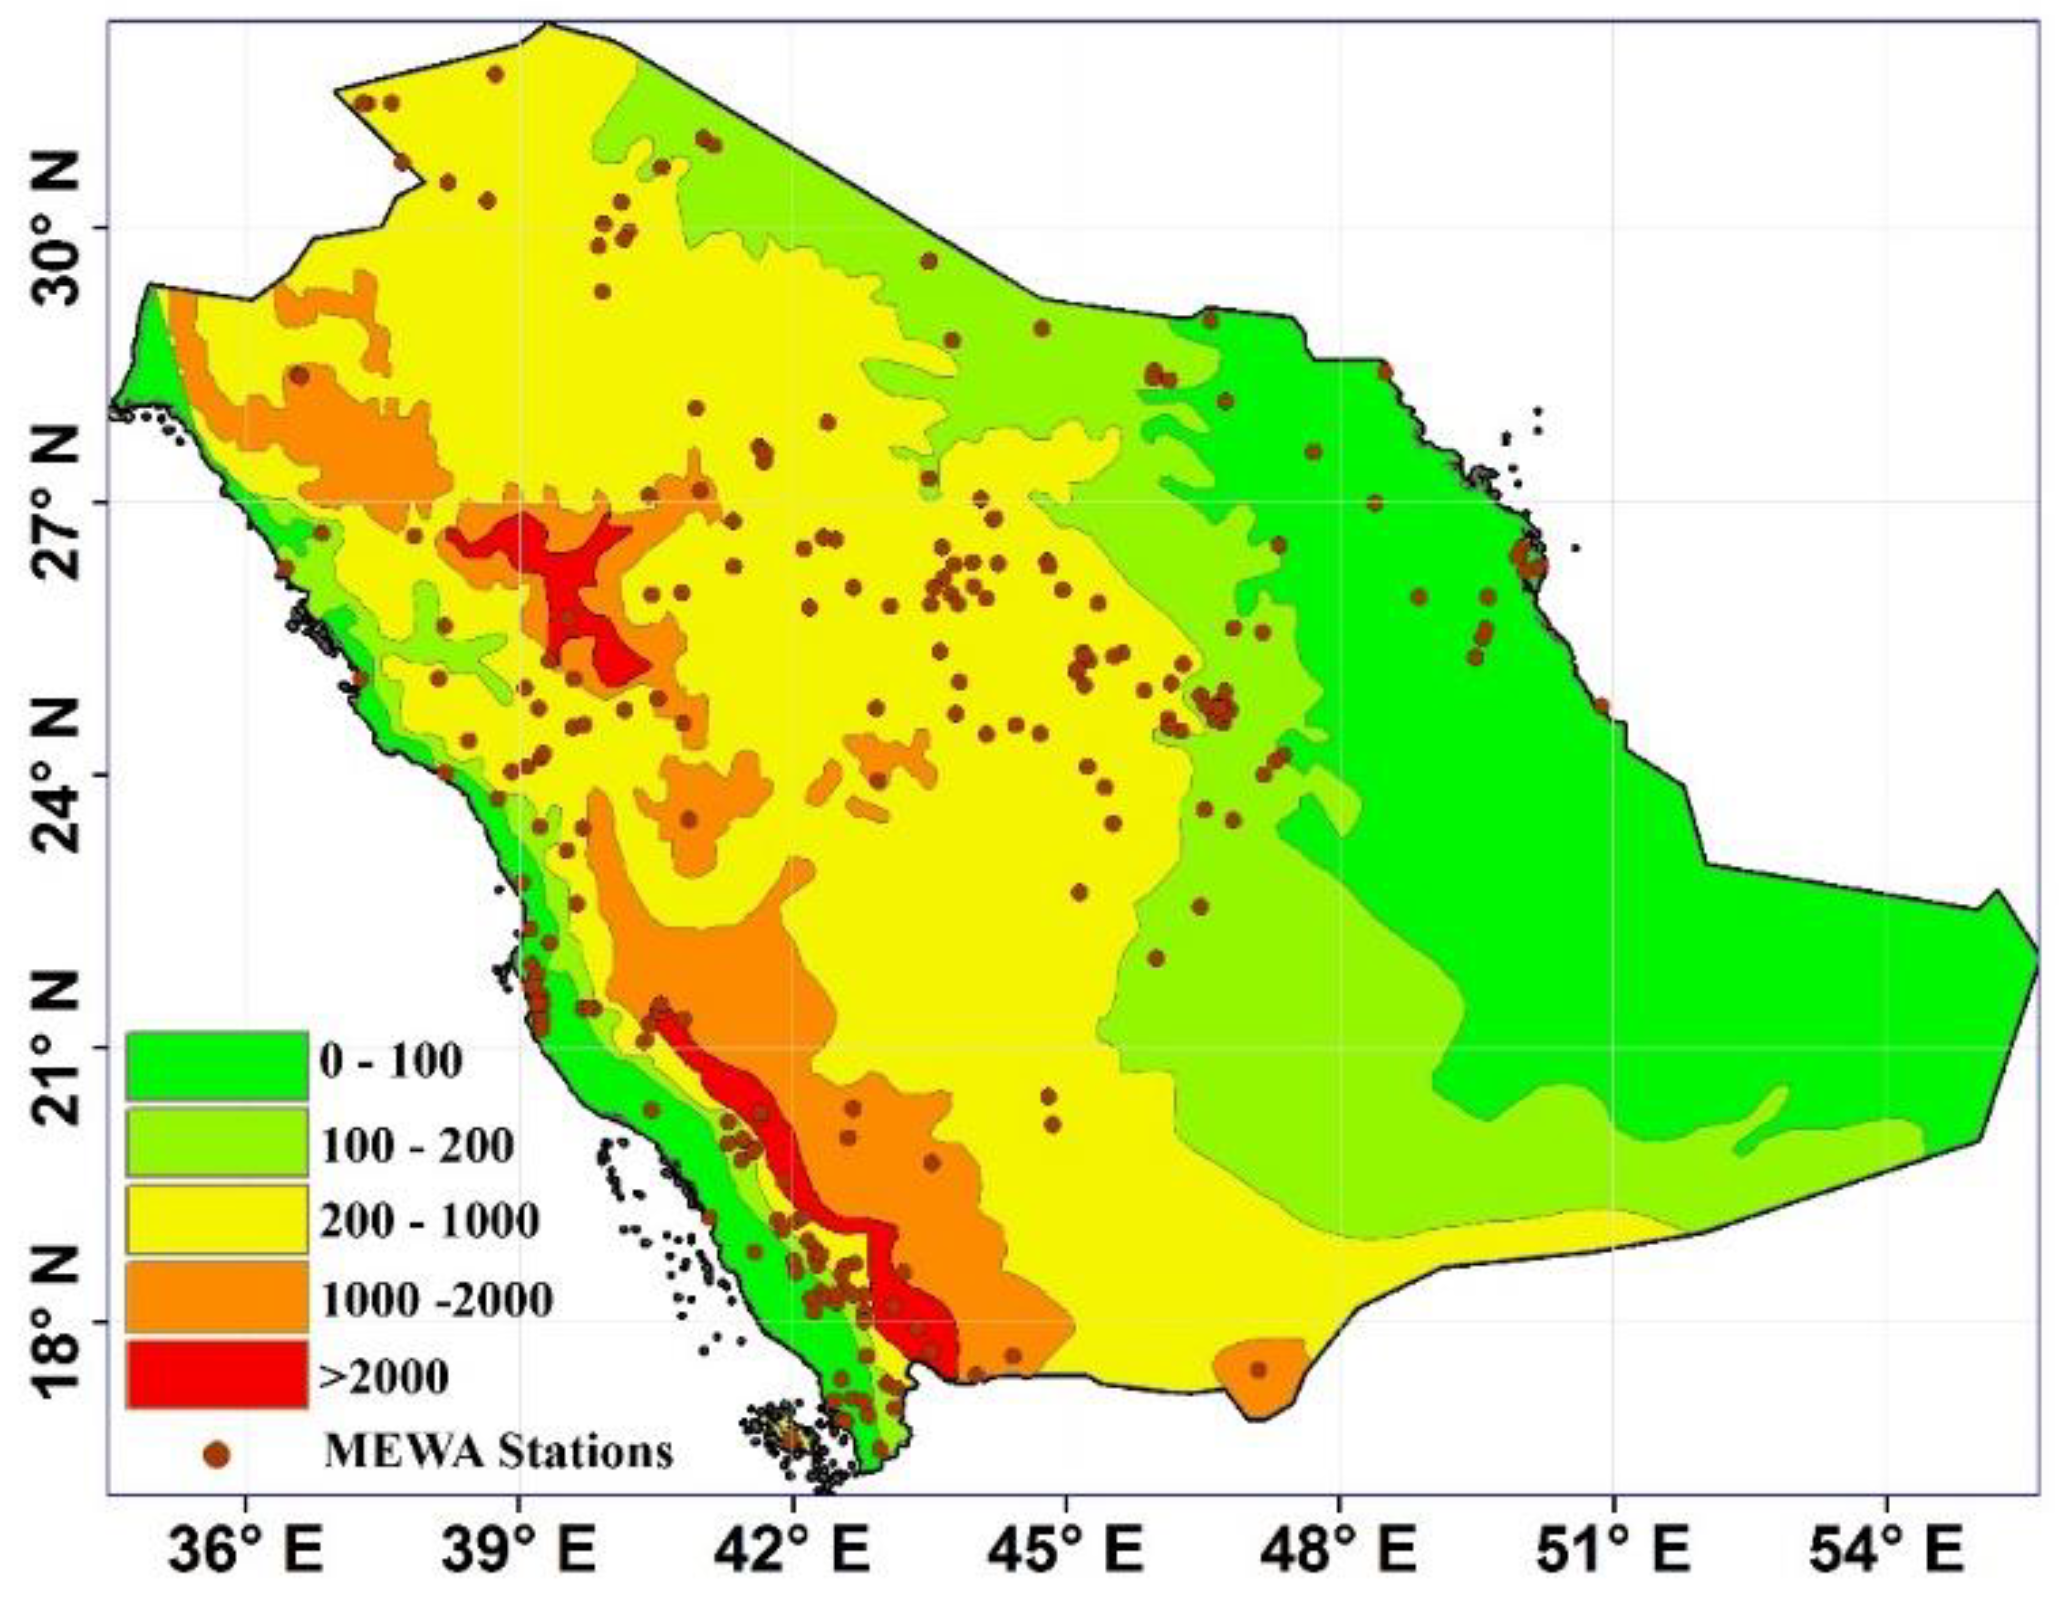
In general, precipitation over Saudi Arabia is variable. In the northern half of the country, the rainy season starts in October and ends by April while there is almost no precipitation for the remainder of the year. Rain in this area results from the feeble weather originating from the Mediterranean or North Africa. The southwestern region, on the other hand, experiences a different precipitation pattern resulting from a mountain range that extends to western Yemen in a north–south orientation along the Red Sea, reaching heights of more than 1500 m. These mountains cause an uplifting of the Indian monsoon and the occurrence of heavy rainfall in the region. Overall, this part of Saudi Arabia is characterized by rainfall throughout the whole year due to convective and orographic rain driven by topography [30,32]. Overall, in the desert areas, the mean annual precipitation is less than 100 mm while in mountain areas it ranges between 250 and 300 mm [30,31,33]. Figure 1b shows the annual rainfall (mm) over Saudi Arabia during the period 1979–2009 [30]. Table 1 provides summary statistics of annual rainfall based on rainfall events for the period from March 2014 to June 2018. Appendix A shows descriptive statistics of large rainfall events that occurred during the study period (2014 to 2018).

2.2. Rainfall Datasets

2.2.1. Rain Gauge Dataset

Ideally, well-distributed and sufficiently dense rain gauge stations should be used for such a study. Rainfall data were obtained by special request from the Ministry of Environment, Water, and Agriculture (MEWA) of Saudi Arabia, the data were provided in the form of daily rainfall records. MEWA is the authority that owns, operates, and maintains the rain gauges used in this study [4]. The data included 275 gauges distributed over the country (see Figure 1) and extended for the period from March 2014 to June 2018. Overall, the data covers most of the study area with a slight variation in distribution. It can be observed that the rain gauge stations are concentrated in the western and southwestern parts of the country as well as in the middle part, which has the country’s capital city Riyadh. The eastern part also has a good distribution of the gauges. On the other hand, the northern part and the southeastern parts of the country have a sparse distribution of rain gauge stations.
In the past, Saudi Arabia had two meteorological authorities that observed and provided the precipitation data, namely MEWA and The General Authority of Meteorology and Environmental Protection. Currently, both datasets are merged under MEWA; however, in this study, we excluded the data of The General Authority of Meteorology and Environmental Protection because this data is used to produce the Global Precipitation Climatology Centre (GPCC) product, which is used to calibrate the GPM IMERG-F. Thus, to make this study independent, we excluded these stations.

2.2.2. IMERG Dataset

The IMERG V05B data are available from NASA at a spatial scale of approximately 11 × 11 km2 and between 60°S–60°N with different temporal scales. In this study, the finest temporal resolution (half-hourly) data were used. It includes three modes of runs, near real-time: early-run (IMERG-E) and late-run (IMERG-L), and post-real-time: final-run (IMERG-F). The differences between the three products are the time of release and the calibration process. The near-real-time products are pure satellite products, which are released 4 h and 12 h after a real-time, respectively; while the post-real-time IMERG-F is calibrated with the GPCC data and released after about 2 months. The IMERG products were requested and collected from NASA’s website through the link (https://pmm.nasa.gov/data-access/downloads/gpm).

2.3. Data Preparation and Processing

Data preparation was carried out in several steps. The first step involved sorting and storing ground precipitation data in a database. Then IMERG data were processed and converted to an ASCII format. This step required processing of 75,480 files to cover the period from March 2014 to June 2018. The processed satellite data were then adjusted to match Saudi Arabia’s local time (time was converted from Universal Time Coordinated (UTC) to Local Standard Time (LST), which is GMT +3) and aggregated from half-hourly to daily to sustain the homogeneity in comparison with gauge-based data, which were available only at a daily temporal resolution.
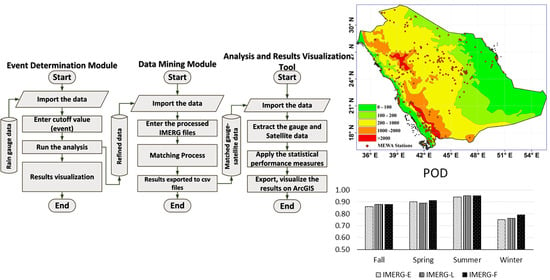
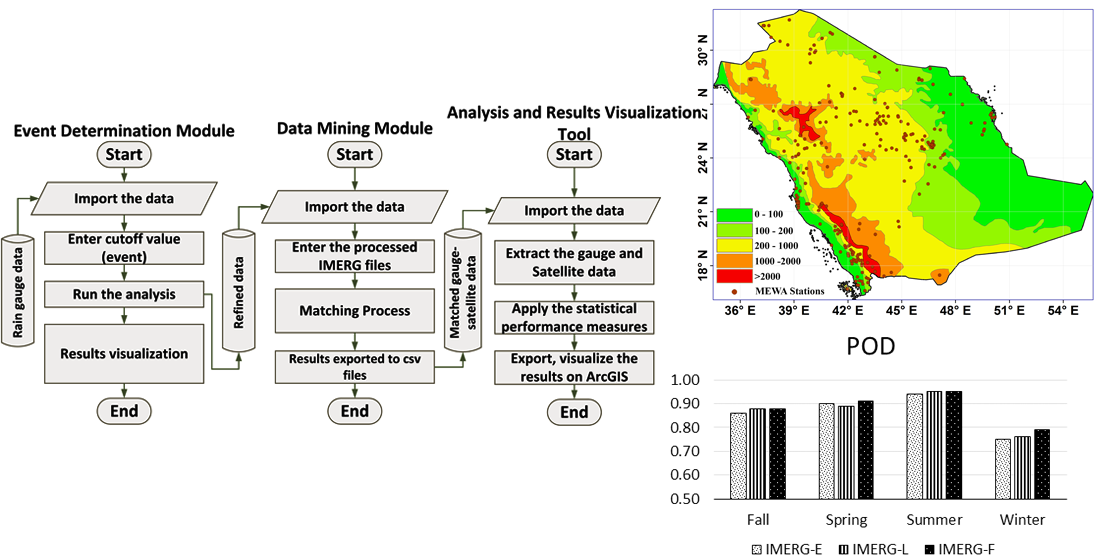
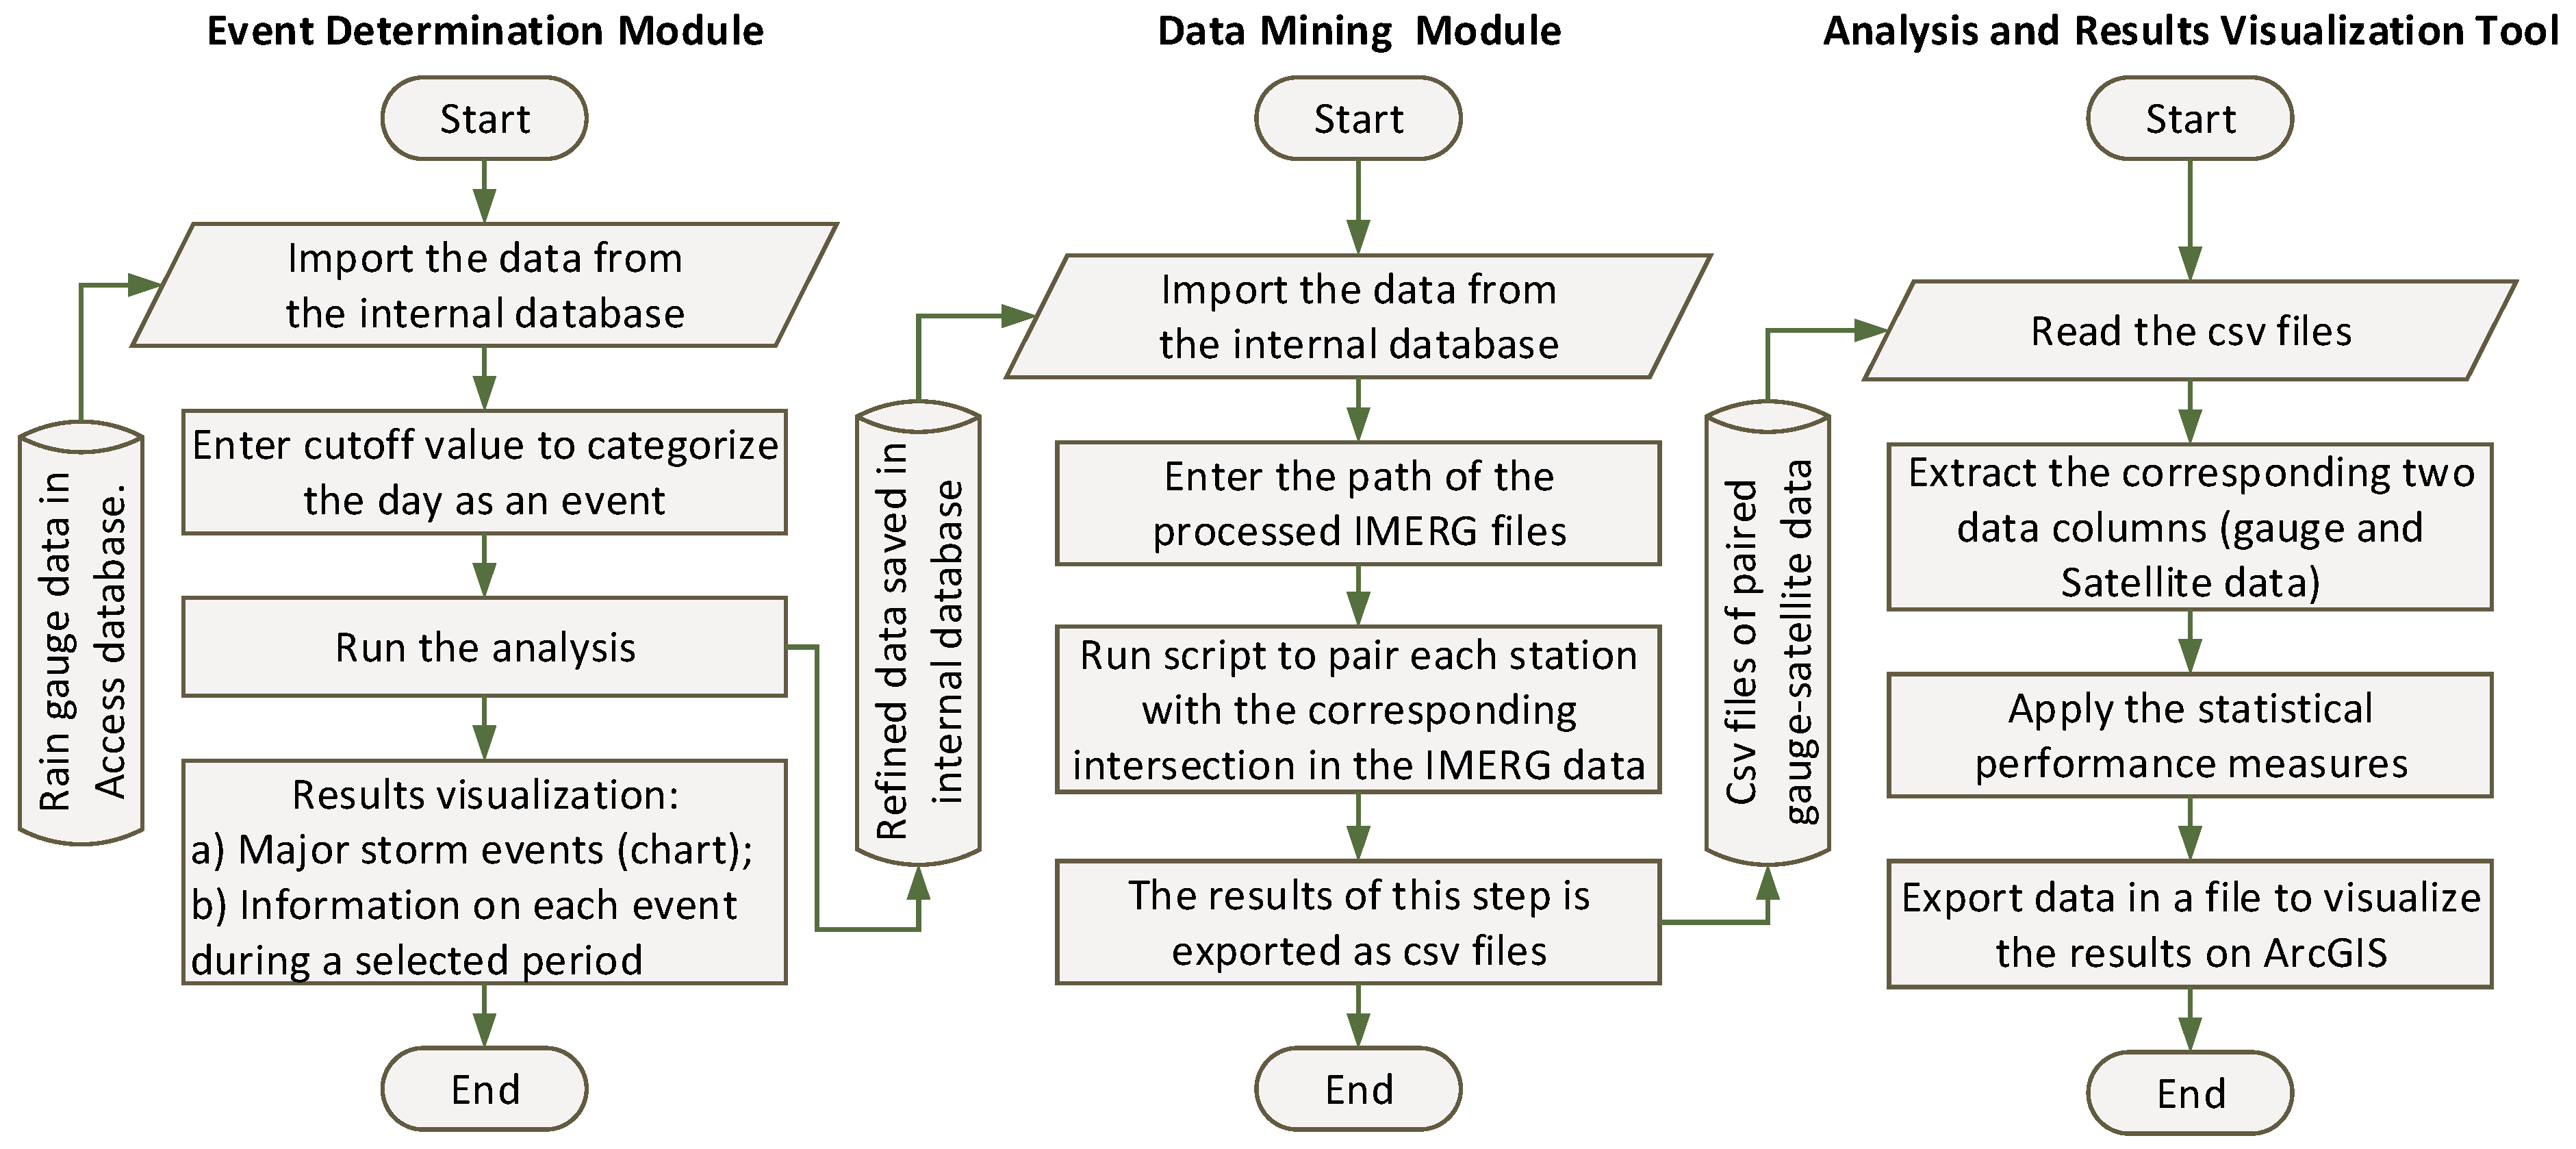
Several modules (scripts) were developed to carry on the analysis and further steps in data processing and preparation (Figure 2). The first module determines large rainfall events that occurred during the study period based on ground observations. Due to the scarcity of the rain events over Saudi Arabia, the data analysis and evaluation process in this study were based on identified rain events and not on the time series rainfall data. Thus, the false positives cannot be analyzed as most of the data in the time series indicate zero rainfall. The second module deals with data mining, which is a process of specifying the nearest GPM grid point that represents the rain gauge station (point to point analysis). Thus, the outputs of the second module are two datasets that include rain gauge data and their corresponding IMERG estimates. The final module handles data analysis and visualization by applying statistical performance measures to evaluate the accuracy of the IMERG products. Figure 2 demonstrates the structure of each module and how each part of the analysis was implemented.

2.4. Statistical Evaluation Indices

Quantitative statistical indices were used to evaluate the accuracy of the GPM IMERG products against ground station observations. In this study, statistical measures were divided into three main indices: the detection accuracy indicator, error and bias indices, and the correlation coefficient index (Table 2). The probability of detection (POD) measures the ratio of ground observations that were correctly detected by the IMERG estimates. The second group measures the level of error and bias in IMERG products; it includes a mean absolute error (MAE), root-mean-square error (RMSE) and relative bias (RBIAS). Usually, RMSE is either larger than or equal to the MAE. However, the main difference between MAE and RMSE is that the latter correlates with the variance in the individual errors in an analyzed dataset. Finally, the consistency of the IMERG products with ground observations was tested using the correlation coefficient (CC). The equations of the statistical indices presented in Table 2 are based on earlier peer-reviewed studies in the field of satellite products evaluation [17,34].
Where n is number of records, D i is the detected precipitation value by the satellite, O i is the observed rainfall value by ground stations, D ¯ and O ¯ are mean values of D i and O i , N O D is the number of observed and detected events by both satellite and rain gauge, N O is the number of events that are observed by rain gauge but not detected by the satellite, N D is the number of events that are not observed by the rain gauge but detected by the satellite.

2.5. Evaluation Techniques

To comprehensively evaluate the accuracy of GPM IMERG precipitation products, three evaluation scales were adopted, namely seasonal evaluation (temporal evaluation), rainfall intensity-based evaluation, and topographical (spatial) evaluation.

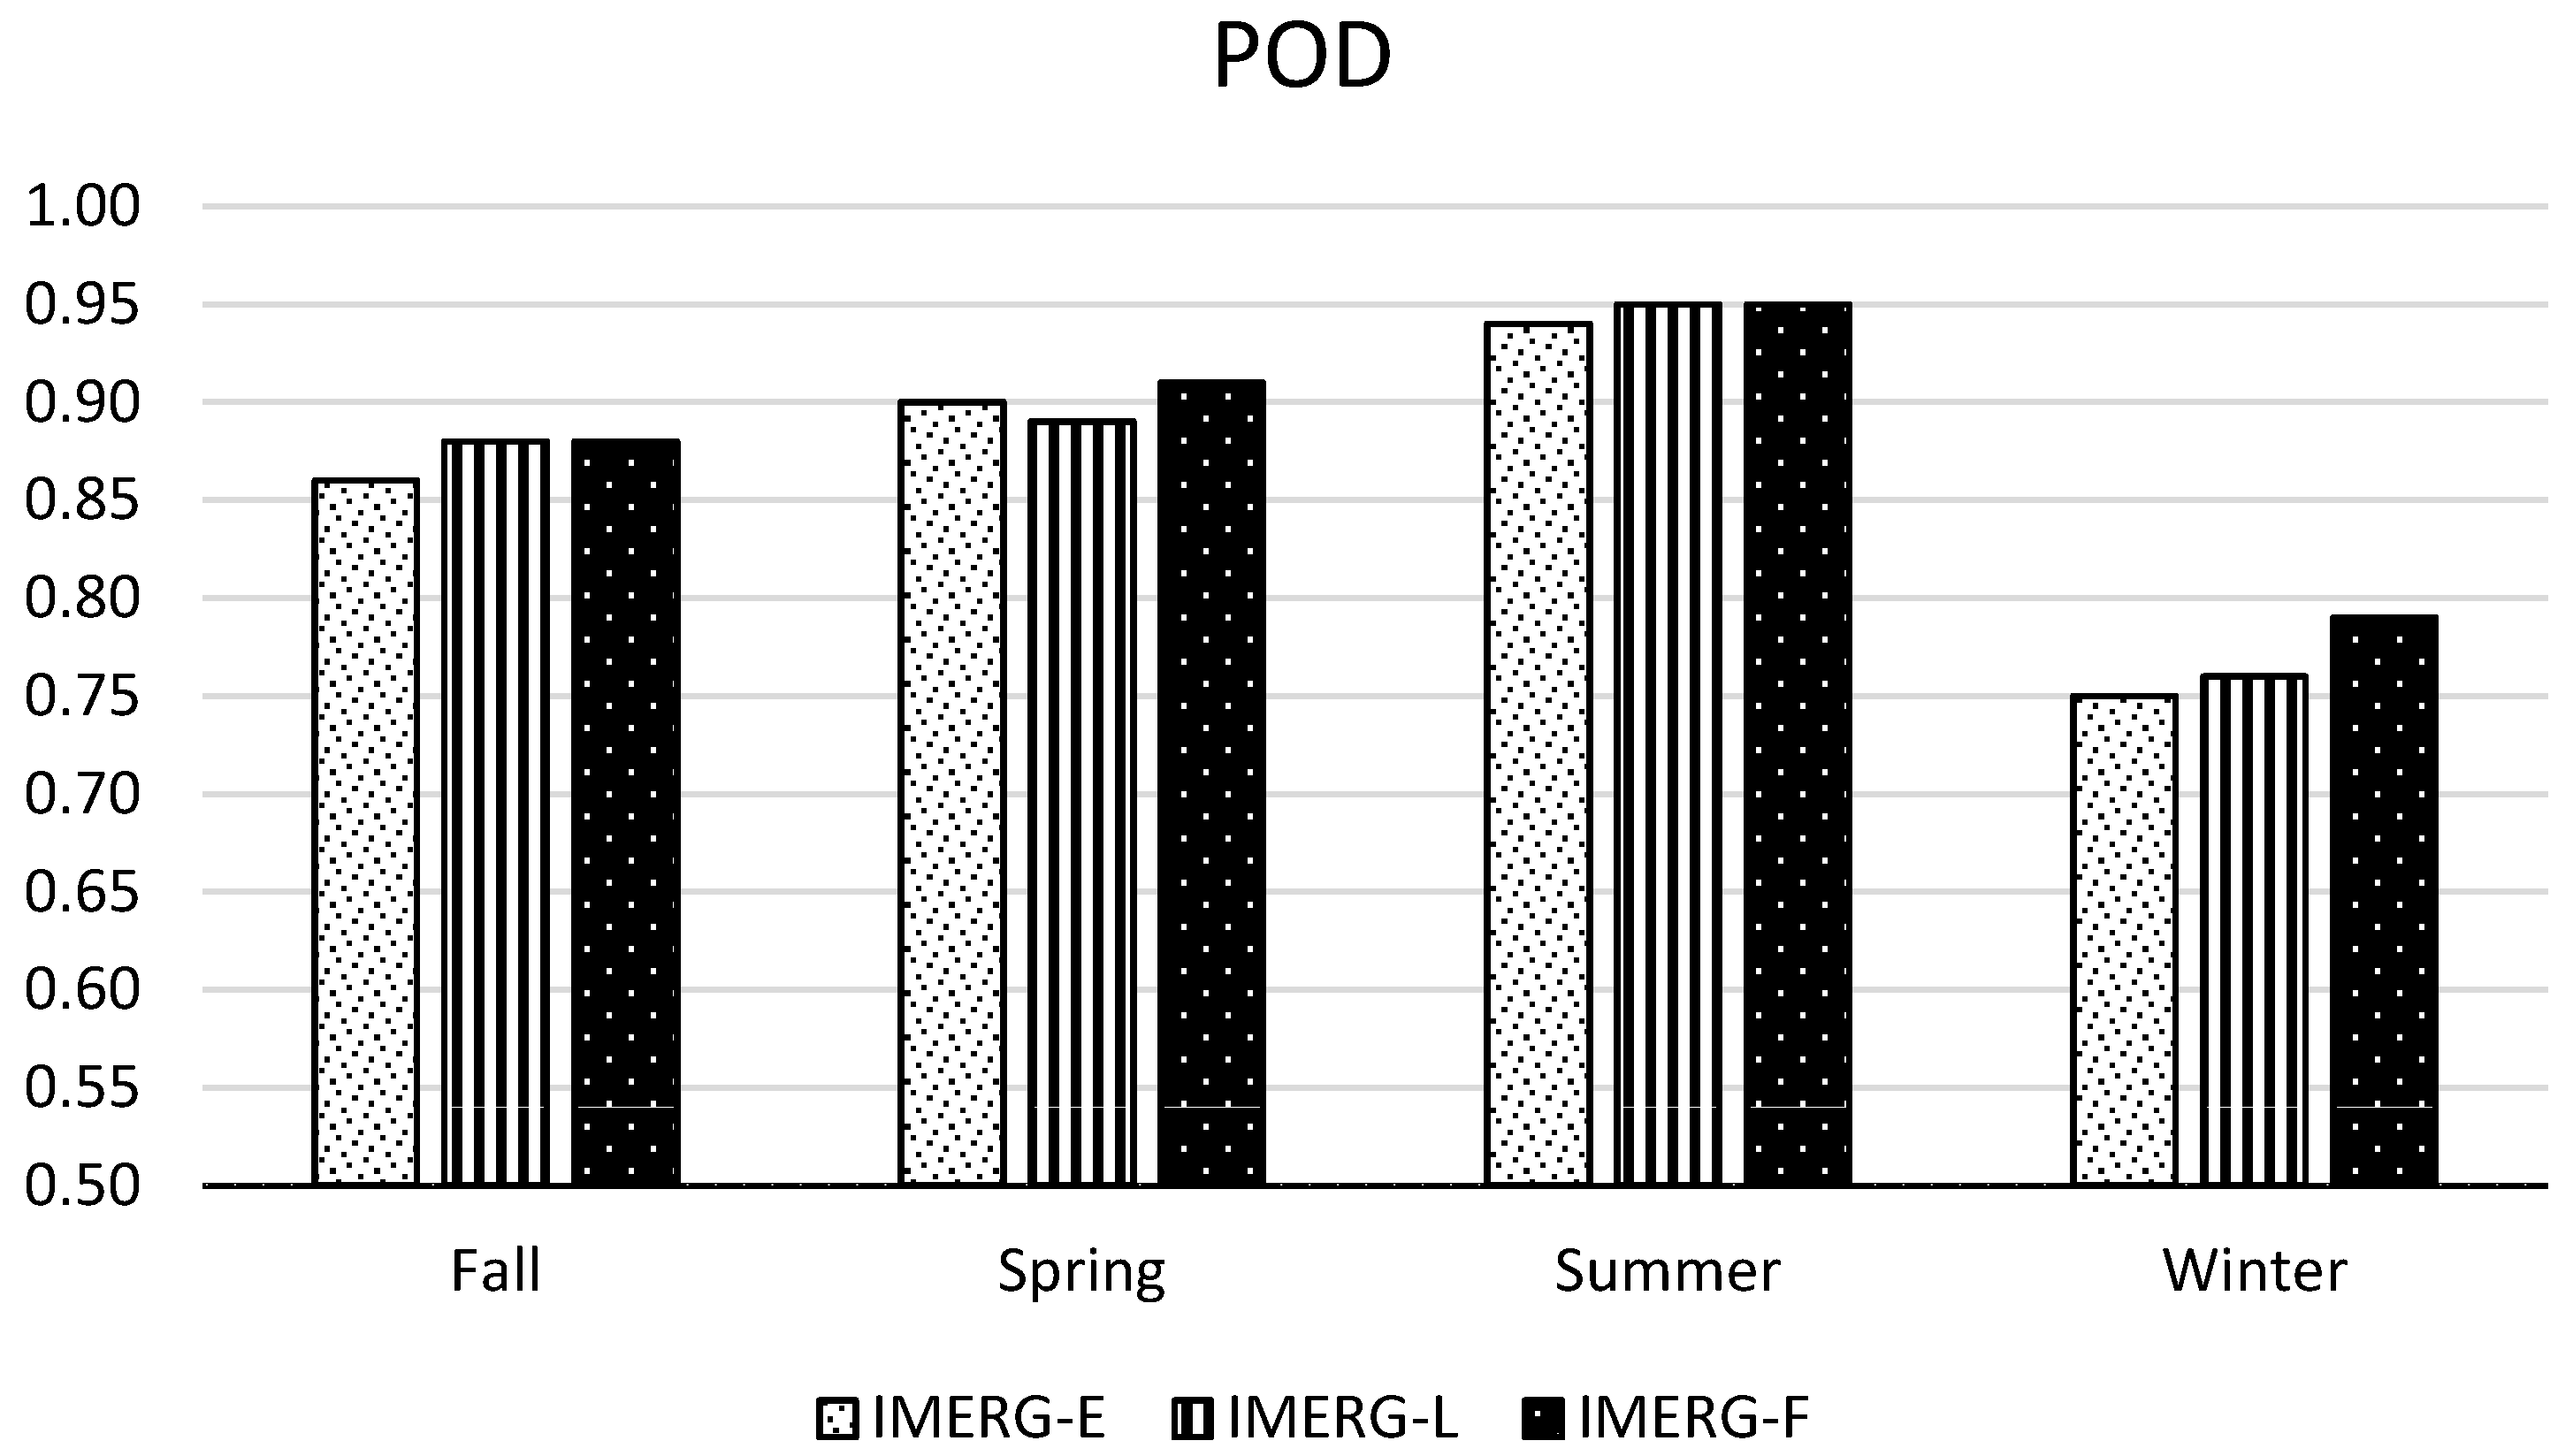
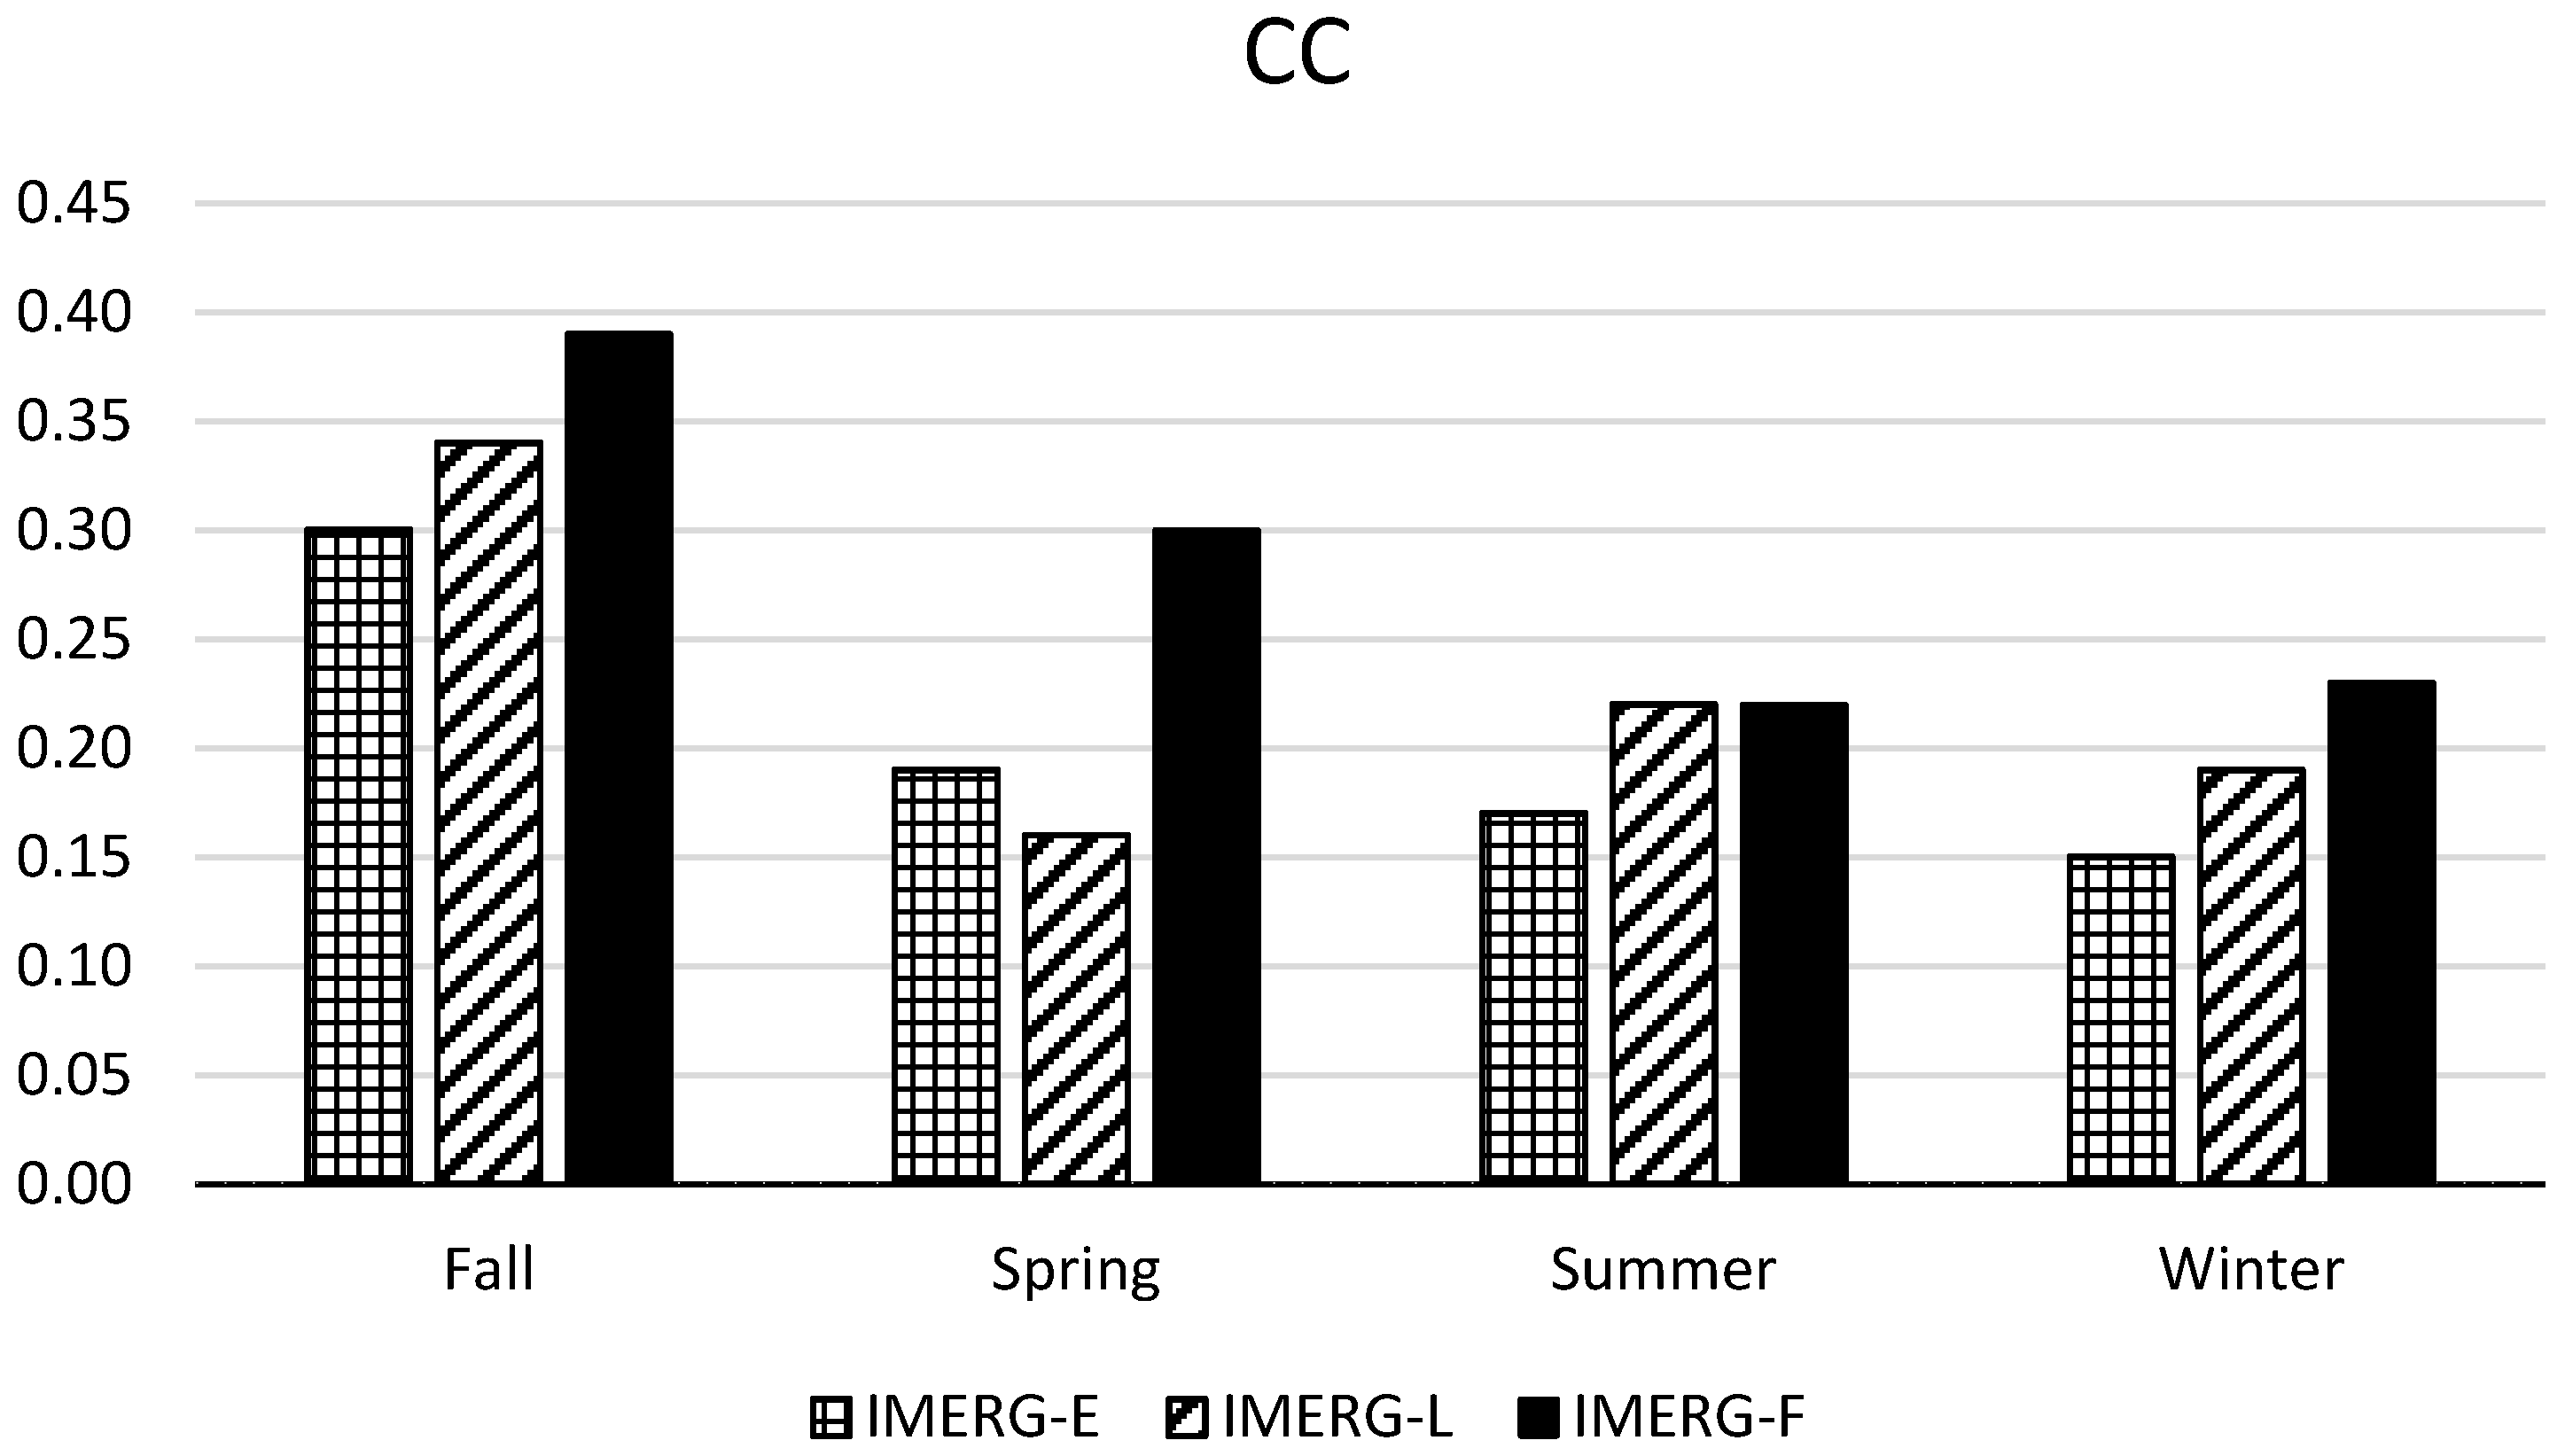
2.5.1. Seasonal Evaluation

The seasonal evaluation was conducted by analyzing rainfall on a seasonal basis throughout the study period. This evaluation intended to investigate the capability of IMERG products to accurately detect rainfall in each season and determine which product has the capability to represent the variability in rainfall distribution within each season. Ground observations and IMERG datasets were prepared and aggregated to represent the four seasons of Saudi Arabia, which are December to February (winter), March to May (spring), June to August (summer), and September to November (fall).

2.5.2. Rainfall Intensity-Based Evaluation

The objective of this evaluation was to explore the accuracy of GPM satellite products in detecting different precipitation intensities ranging from light rain to large storm events. This article will focus more on the detection of light rain since it is the most frequent type of precipitation in arid regions such as Saudi Arabia. Data aggregation was neither strictly temporal nor spatial, but rather a combination of both. The analysis encompassed the evaluation of the detectability of events that had fallen within the study area, and throughout the entire study period, categorized only by precipitation intensity. The approach required imposing various thresholds to classify precipitation intensities (Table 3), these were adopted from the classification by the Chinese Meteorological department [35].

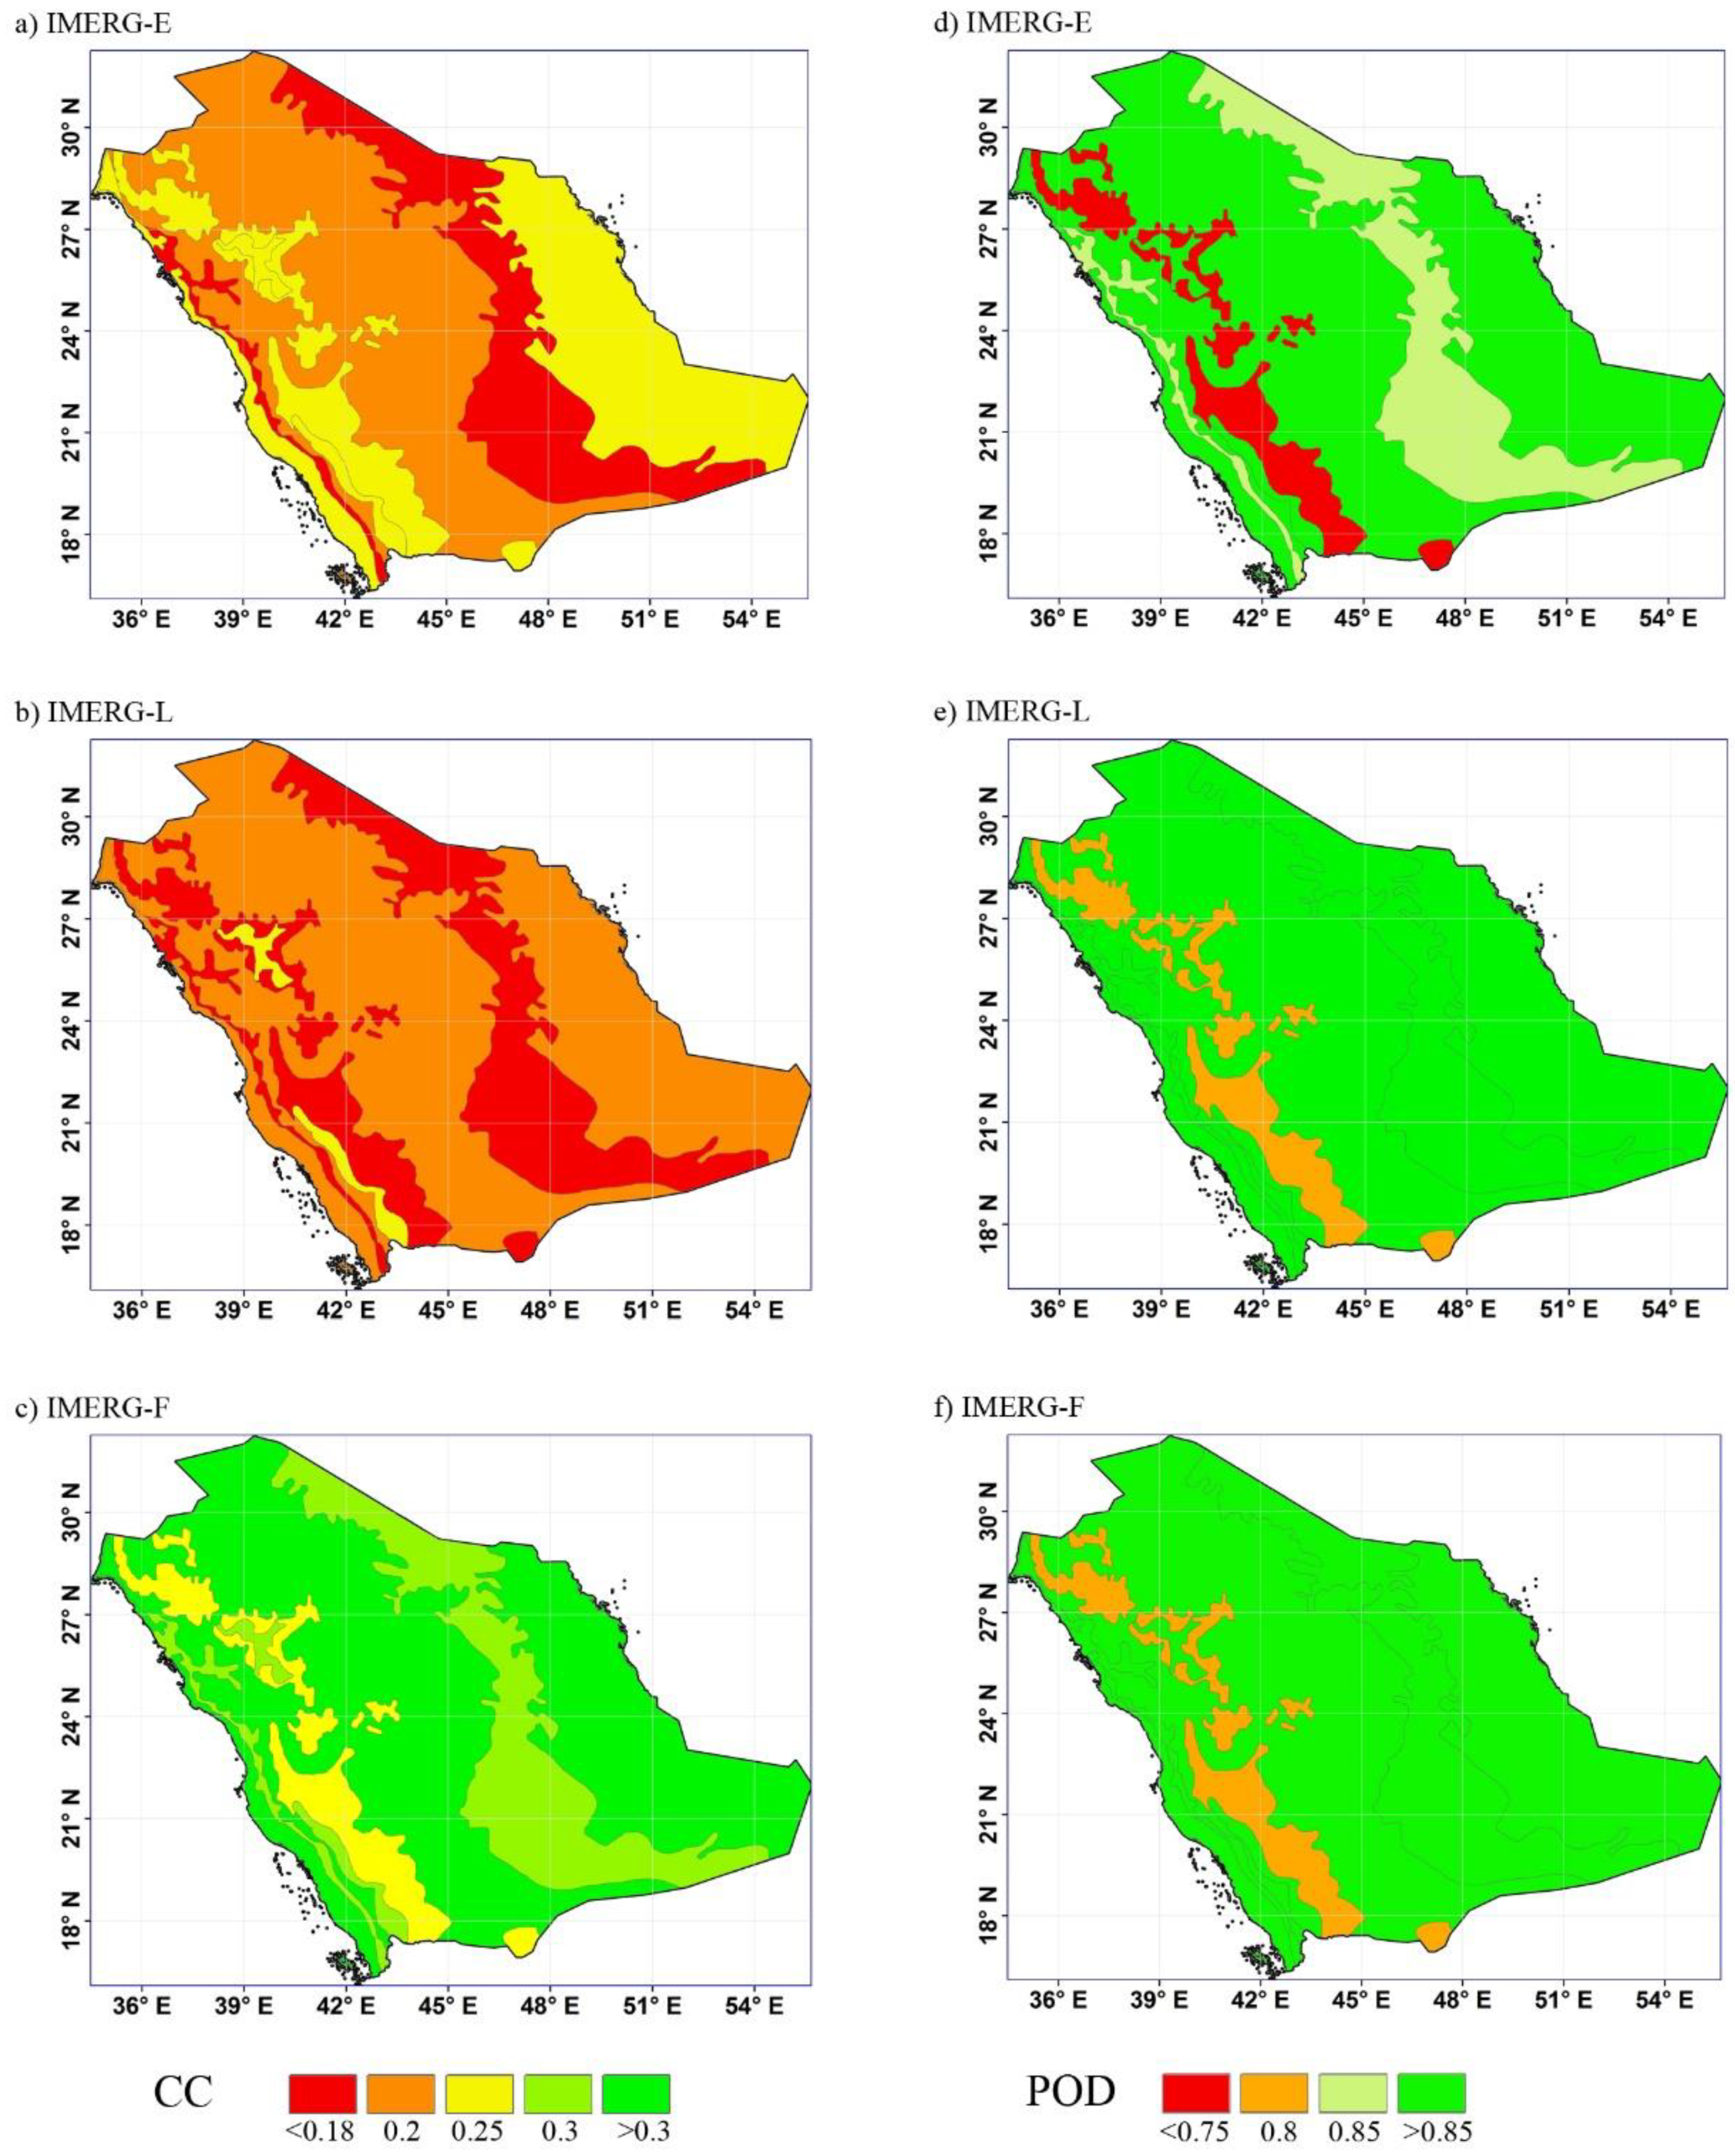
2.5.3. Topographical (Spatial) Evaluation

The spatial evaluation was conducted based on the topographical characteristics of the study area. This evaluation is intended to assess the influence of topography on the performance of the IMERG precipitation measurements. This is particularly important since Saudi Arabia has a complex and highly varying topography. Data were aggregated for each analyzed topographical region, and the statistical measures were applied to compare between the two aggregated datasets formulated by point to point matching (rain gauge observation and corresponding satellite estimates). For example, if a set of rain gauges fall within one region, the observations from these rain gauges will form one dataset to be compared to the dataset formed from the matching (nearest) satellite point precipitation estimates. The study area was divided into five topographical regions as shown in Figure 3, these regions were specified in previous studies such as [36]. The topography in Saudi Arabia varies from low altitudes in the coastal areas (0 up to 100 m) to high altitudes in the mountainous areas (more than 2000 m). Table 4 shows the distribution of ground stations and the number of observations (precipitation events) across the different topographical regions. It can be observed that there are few stations located in the high mountain regions, which resulted in a very low station density, whereas the inland region has the highest number of rain gauges.

3. Results

3.1. Seasonal-Based Evaluation

The seasonal evaluation was carried out to investigate the accuracy of the IMERG products over the four seasons. In this study, a total of 17 seasons (4 falls, summers, winters, and 5 springs) were evaluated. Figure 4 and Figure 5, and Table 5 illustrate the results of the performance indices of the three IMERG products. The analysis was based on the three performance measures: detection accuracy indicator, error and bias indices, and the correlation coefficient index.
In terms of IMERG products detection accuracy, the three IMERG products performed well during the four seasons over the study period (Figure 4). Most of the seasons showed remarkable detectability, with an average POD of 0.9, while the winter season showed the least detection accuracy with values ranging between 0.75 and 0.8. In general, IMERG-F and IMERG-L performed better than IMERG-E, and both had almost the same results during the study period. All IMERG products performed accurately in summer with high POD values reaching 0.95. Spring comes after the summer in the level of detection accuracy where all IMERG products showed relatively high PODs with an average of 0.9.
An interesting finding was associated with the error and bias indicators (MAE, RMSE, and RBIAS), which showed relatively low error values compared to similar studies [4,16,27] for all IMERG products and seasons (Table 5). IMERG-F had the least MAE and RMSE values for all seasons compared with IMERG-E and IMERG-L. In addition, all IMERG products showed very small values of RBIAS fluctuating between underestimation and overestimation of the rainfall during all the seasons with a maximum of −0.35% and 1.5%, respectively. The spring season exhibited the lowest estimated errors amongst other seasons for the three IMERG products, followed by fall and summer season. The winter season had the highest errors (MAEs and RMSEs) compared to the rest of the seasons.
In terms of consistency, IMERG products showed low CCs (<0.5) for all the seasons throughout the study period (Figure 5). However, the results revealed that IMERG-F had a better consistency than the other two products. It was observed that fall seasons showed the highest CCs compared to other seasons, reaching 0.39 on average.

3.2. Rainfall Intensity-Based Evaluation

The purpose of this evaluation is to investigate the accuracy of the IMERG products to detect different intensities. The results illustrate the accuracy of the IMERG products in terms of detection, consistency and the errors associated with the precipitation estimates (Table 6). Overall, the three products of IMERG presented a high detection accuracy (greater than 70%) for the four various rainfall classes over Saudi Arabia during the study period (March 2014 to June 2018). The observed PODs ranged between 0.71 and 0.96. However, IMERG-F and IMERG-L showed similar values with an average of POD = 0.9. In addition, IMERG-F and IMERG-L had a higher performance in detecting all rainfall classes than IMERG-E. Furthermore, it can be observed that IMERG products had a slightly lower performance in detecting light rain than other rainfall classes. However, the value of POD still shows remarkable performance in detecting the light rain (POD > 0.8).
In terms of errors and bias, it can be observed that the error indicators (MAE and RMSE) increased with the increase in rainfall intensity for all IMERG products (Table 6). The error values showed a gradual increase with an average increase of about 10 mm, except for large storm events, as it showed the highest errors with a significant increase (more than 50mm). Regarding the RBIAS, very small percentages (less than 0.69%) were observed for the three IMERG products during light, moderate, and heavy rainfall. However, a clear underestimation was observed in large storm events, which could cause flash floods, accounting for −12% on average. Overall, both light rain and moderate rain showed an acceptable level of errors, while the remaining rainfall classes had high errors compared to previous studies [4]. In general, IMERG-F exhibited the least errors in almost all the rainfall classes, while IMERG-E and IMERG-L fluctuated in performance across the different classes. On the other hand, all IMERG products had very low correlations with ground observations. This was observed for four classes of the rainfall, except for large storm events, which showed a higher correlation between the satellite estimate and the ground observations, reaching an average of CC = 0.6 compared to other classes.
In summary, IMERG products showed a considerably good performance in capturing the various rainfall intensities. Specifically, light rain was fairly detected by all IMERG products. Since about 60% of the total precipitation occurring over Saudi Arabia is classified as light rain, it is particularly important to have a high detection accuracy for this class with minimum errors. Furthermore, the results showed a higher CCs for large storms events and these events are quite rare over Saudi Arabia; they represent less than 0.2% of the total precipitation. Thus, it is expected that there would be a lower error in the detection of such large, rare events, consequently resulting in a high CC between ground data and satellite data for these large storm events. IMERG-F had the most accurate performance for most rainfall classes while it showed a close performance to IMERG-E and IMERG-L for the heavy rainfall and large storm events, as evidenced by the calculated errors (MAE and RMSE).

3.3. Topographical (Spatial) Evaluation

The three GPM IMERG products were evaluated spatially by investigating the effect of topography on the performance of the GPM satellite. The study focused on linking the different topographical region with the accuracy of the satellite by testing the detection, consistency and the error associated with the satellite estimates. The satellite detection accuracy for the three IMERG products showed relatively high PODs (>0.8), with some exceptions in foothills and mountainous regions (Figure 6). IMERG-L and IMERG-F showed similar patterns and results of POD over the five topographical regions, and they had slightly higher detection accuracy than IMERG-E in foothills and mountainous regions.
Overall, all IMERG precipitation products exhibited a low correlation (CC) with the ground observations ranging between 0.18 and 0.3. However, it can be noticed that there was a considerable enhancement in the performance of IMERG-F compared to the other IMERG products, while IMERG-L had the lowest performance. Furthermore, the consistency results showed low values of CC over foothills and mountainous regions for all IMERG products with a slight improvement in IMERG-F product.
The error estimators supported the results of consistency and detection accuracy of the satellite rainfall products (Figure 7). It was observed that IMERG-F had relatively low estimation errors, while IMERG-L had the highest estimation errors. For both IMERG-E and IMERG-L, the estimation errors in inland areas and areas adjacent to the coastal region were moderate. While coastal and mountainous regions exhibited high errors. In contrast, IMERG-F revealed low detection errors with MAE < 10 mm, for most of the topographical regions except the foothills region. Regarding MAE comparisons, the MAE of the inland areas, foothills, and the region adjacent to coastal areas remained the same in both IMERG-E and IMERG-L, while it dropped to less than 5 mm in IMERG-F. The estimated errors of the coastal region decreased to reach MAE between 7 and 10 mm for IMERG-F. The same trend was observed for RMSE as the best product with the lowest RMSE in all topographical regions was IMERG-F, and the worst one was IMERG-L. The greatest improvement was observed for the coastal and high mountains region for which RMSE decreased from 15 mm for IMERG-E to 5 mm for IMERG-F. These regions represent the topographic extremes in the study area. Minor percentages of RBIAS, almost negligible, were observed for all the IMERG products as seen in Table 7.

4. Discussion

4.1. Discussion of Evaluation Results

The weak correlation exhibited by IMERG products during the seasons might be attributed to high spatiotemporal variability of precipitation over Saudi Arabia. Furthermore, the IMERG-F—the calibrated product—should have had better correlation; however, the low correlation may be because it was calibrated only with GPCC monthly data [37]. Thus, it is proposed to use daily precipitation in the calibration to improve the IMERG-F algorithm. This is reinforced by similar findings and justifications stipulated when the IMERG products were assessed over Malaysia [37]. Moreover, it can be noticed that, based on the averages of the statistical indices, spring and summer were better represented by the IMERG products than fall and winter seasons. This finding indicates that IMERG products have the capability to detect seasons with the highest precipitation values (spring season) as well as the seasons with the lowest ones (summer season). On the other hand, IMERG products had relatively low performance in the winter; this may be due to the fact that most winter precipitation particularly falls over the southwest region which is dominated by mountainous areas [30]. This finding was reinforced by findings from the topography-based evaluation in Section 3.3.
The results presented in the intensity-based evaluation section are of significant importance to arid countries, where rainfall intensities often fall in the light rain category. Previous research highlighted that the high-frequency GMI and DPR lead to the high detection accuracy of light rain by GPM products [16,38]. The results of this study thus is in agreement with other studies conducted on an arid region in Far-East Asia, which verified the high detection of light rain by IMERG products in comparison to TRMM (TMPA) [16,39]. This was also supported by previous research evaluating IMERG products against other satellite products over arid regions in Malaysia and China, these studies revealed that IMERG products had the ability to detect light rain more accurately than other satellite products [37]. However, despite the small RBIAS associated with the various rainfall classes, IMERG products exhibited a tendency to overestimate light rain. This finding is consistent with a previous study that also proved that light rain has lower PODs than heavy rain and that the POD increased with the rainfall intensity [40].
The results of the topography-based evaluation indicate a high detection accuracy of IMERG-F in different topographical regions. Even though all the IMERG products presented low correlation values with ground observations over the different topographical regions, IMERG-F showed a good improvement compared to IMERG-E and IMERG-L. Moreover, the coastal, foothills, and high mountains regions exhibited the highest errors compared to other topographical regions. This conclusion is in agreement with the findings of a previous study conducted by Prakash et al. [13], which assessed the performance of IMERG products over India. Their results indicated that IMERG products were affected by the orographic process, which leads to higher errors and negative bias in mountainous areas. A further study carried by Navarro et al. [41] revealed the poor performance of the IMERG product over the mountainous areas of the continent, particularly over the Alps and Scandinavian mountains. Another study carried out by Kim et al. [16] also revealed the drawbacks of IMERG products over mountainous and coastal regions. They attributed the poor performance of IMERG at coastal regions to a deficiency in the calibration algorithm that identifies rainy clouds over coastal areas. Similar results were obtained by Anjum et al. [42], which prompted them to recommend refraining from using IMERG products in mountainous areas because of the high uncertainty in daily precipitation estimates, particularly light rainfall.

4.2. Study Limitations

In order to comprehensively investigate the temporal variation of precipitation, sub-daily data are required. In this study, only daily rainfall data were available for rain gauges in Saudi Arabia, which could not allow for a more extensive evaluation of satellite products. In addition, rainfall events in an arid region such as Saudi Arabia are quite rare. Thus, this study relied on data extracted for rainfall events rather than analyzing the entire time-series data from satellite and ground stations. Therefore, the study did not investigate the false detection of precipitation by satellite, which is important for an extensive evaluation of satellite products. Moreover, this study assumed that data from ground observations represented the correct value of rainfall measurements and thus the inherent errors in ground data were obscured in the evaluation of satellite estimates. Finally, while this study included the density of rain gauges in the description of the study area, it did not consider the influence of the variation of rain gauge density on the evaluation results.

5. Conclusions

This study assessed the performance of the GPM IMERG V05B products, including early, late, and final-run products, over Saudi Arabia. Ground observations from 275 rain gauge stations over the period March 2014 to June 2018 were used as a reference. The performance of IMERG satellite precipitation products was assessed using three evaluation techniques: seasonal-based (temporal) assessment, topographical (spatial) evaluation, and rainfall intensity-based evaluation. Quantitative statistical indices were used to quantify the performance of the IMERG products. The main conclusions of this study can be summarized as follows:
  • The seasonal analysis showed an improvement in the performance from IMERG-E, to IMERG-L, to IMERG-F. Nevertheless, all IMERG products showed very weak correlations with ground observations throughout all the seasons.
  • Spring and summer are the most detected seasons by IMERG products. This leads to a conclusion that IMERG products have the capability to detect seasonal rainfall with both the highest (maximum daily rainfall observed on spring) and the lowest precipitation.
  • It was interesting to observe the high performance of IMERG products across the various rainfall intensity classes. According to the calculated classical statistical indices, the light rain had the lowest detection errors by IMERG products. However, higher rainfall intensities exhibited higher detection errors in the IMERG products. The detectability of rainfall, as indicated by POD, was excellent for midrange classes of rainfall, whereas that for extreme rainfall intensities (light rain and large storms) was slightly lower. This finding is particularly promising for the applicability of IMERG products in arid regions dominated by light rain events.
  • Even though the CC values are generally low for different rainfall intensities, large storm events showed significantly higher CCs (0.5 to 0.7) compared to lower intensity events. This is probably induced by the rarity of such large storms over arid regions such as Saudi Arabia.
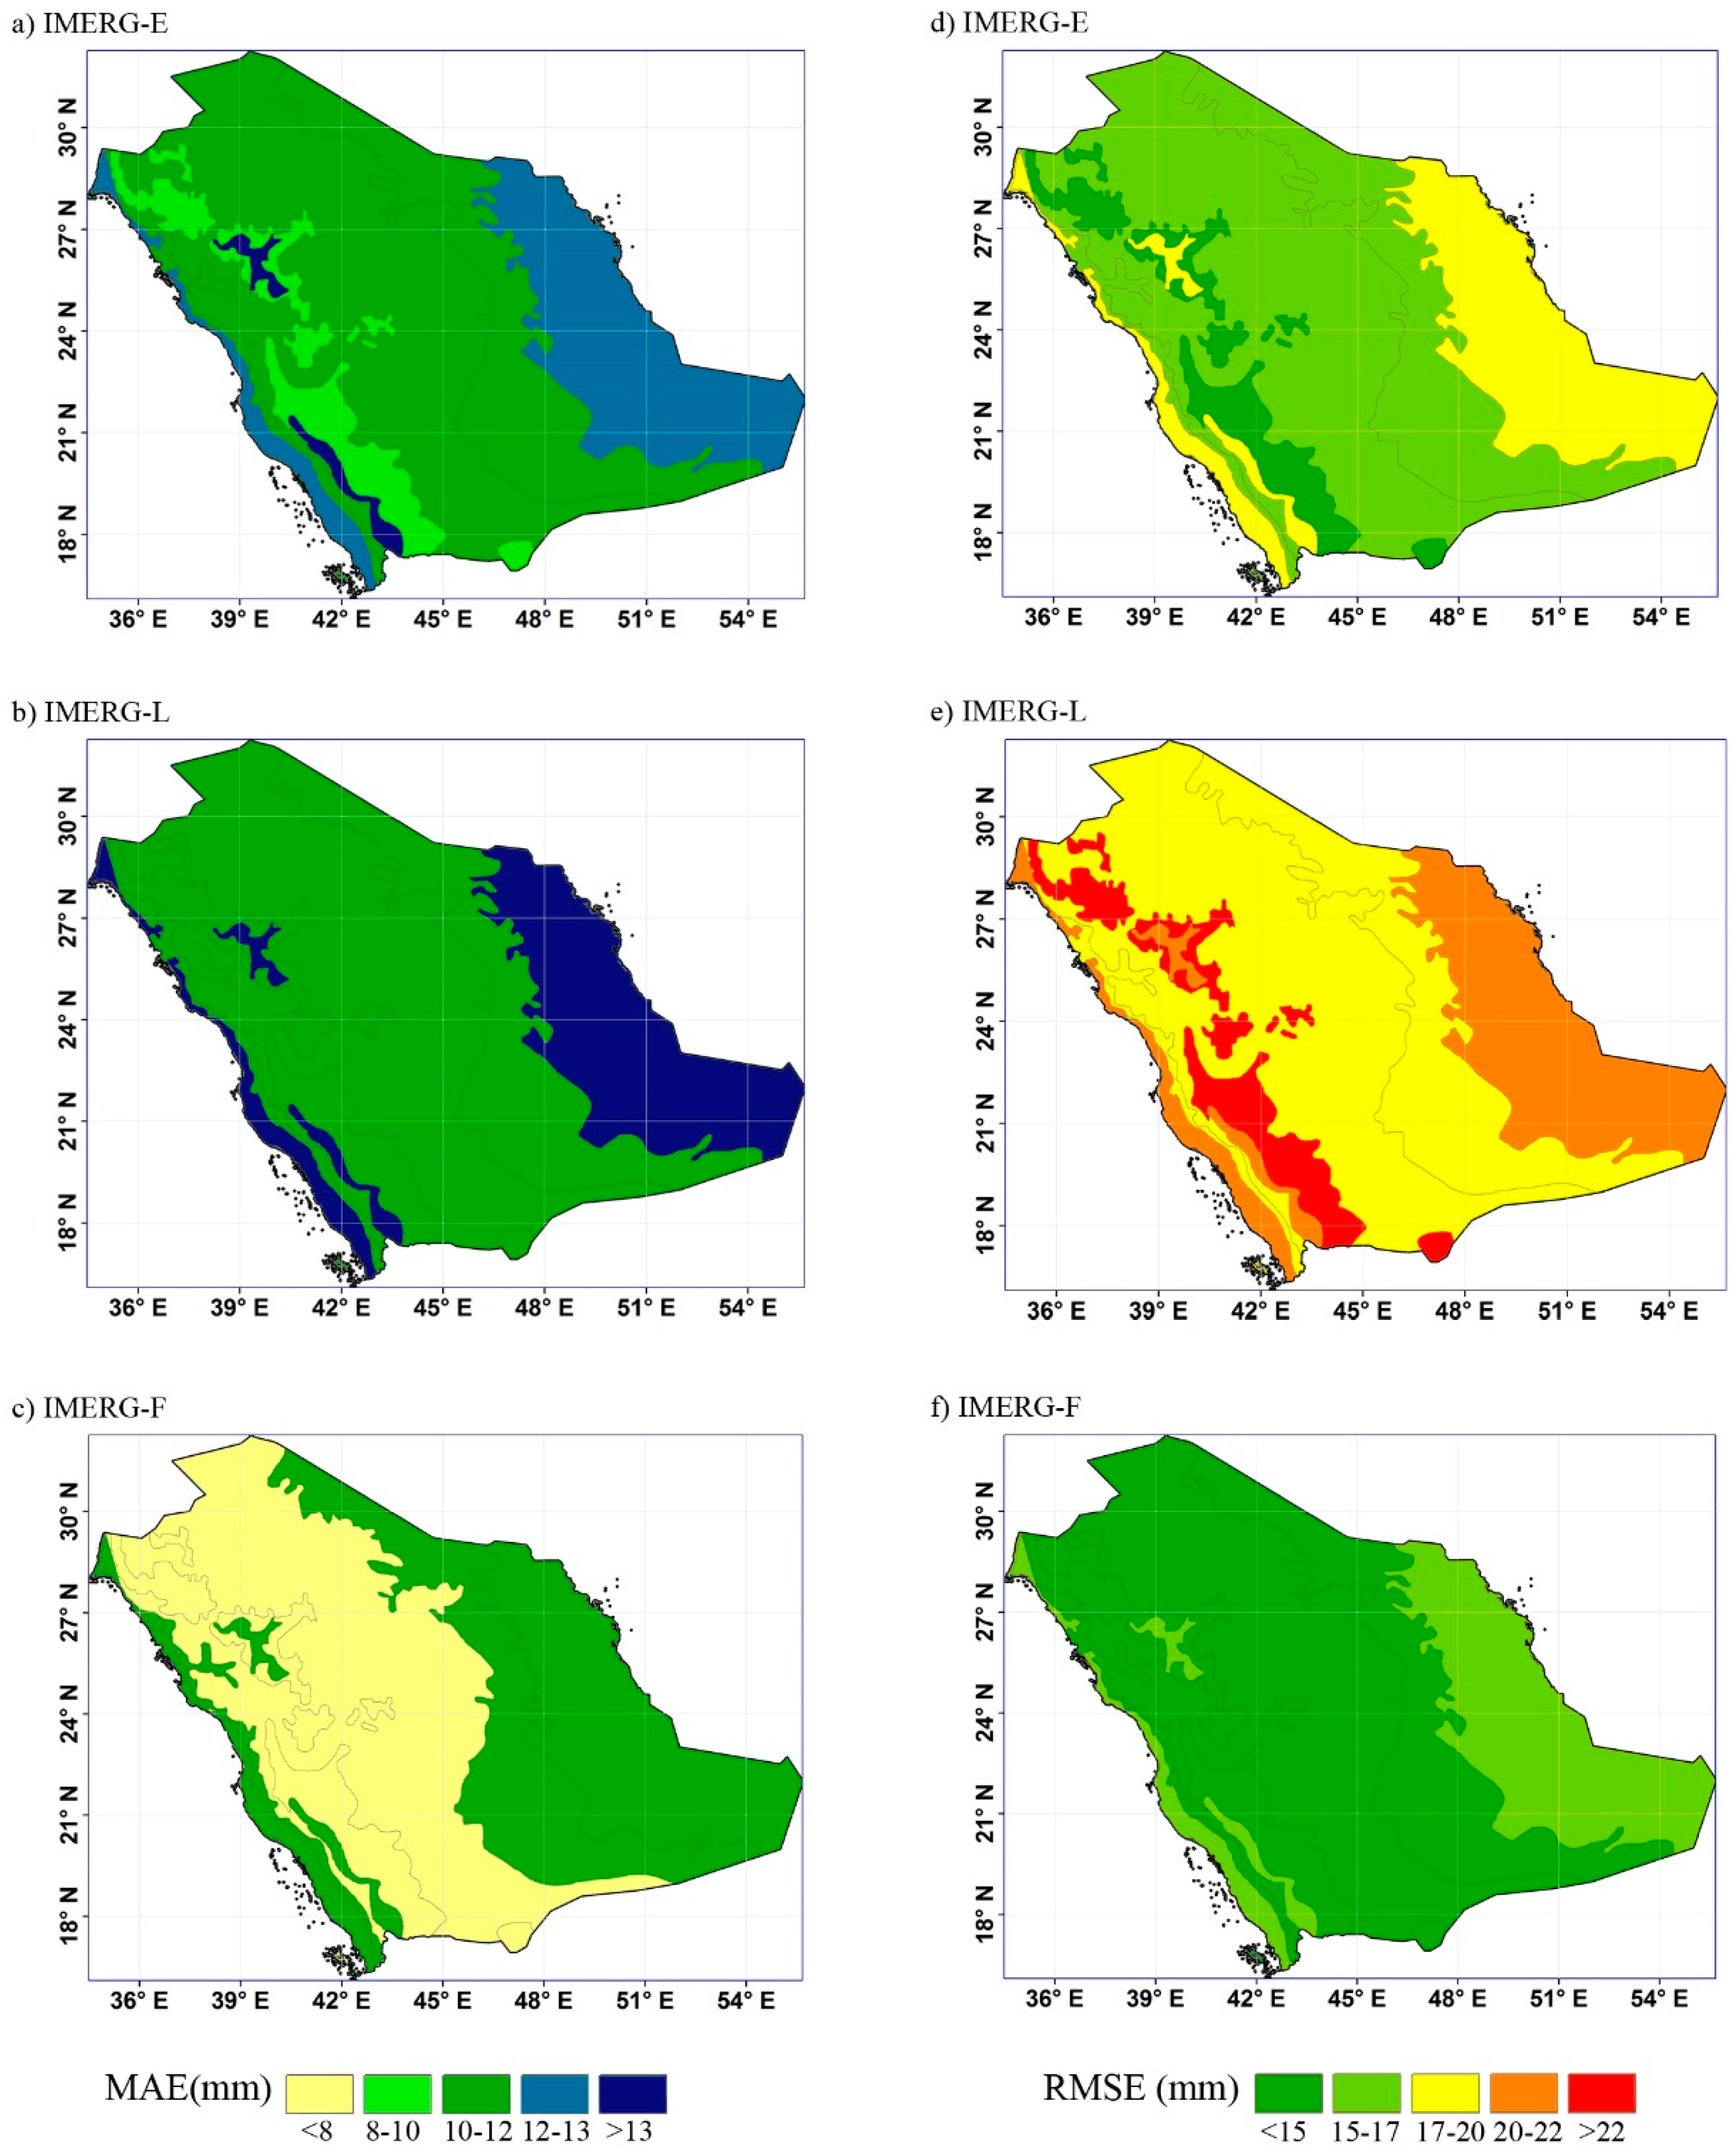
  • Topographical features had a significant influence on the performance of IMERG products. The detectability (POD) was improved significantly in higher altitudes (mountains and foothills regions), particularly for IMERG-F. However, the areas adjacent to the coasts showed a significant reduction in the estimation errors of IMERG-F, whereas the highest estimation errors were observed in coastal regions, foothills, and mountainous regions.
In conclusion, IMERG products have great potential for improving the temporal resolution of rainfall data. In addition, it could play a significant role in complementing or filling the spatial gaps in rainfall observations, especially for extremely arid regions such as Saudi Arabia. Furthermore, the consistency of the IMERG products in detecting high rainfall intensities could provide significant information on managing and mitigating hazardous events such as flash floods, which are characteristic of arid regions. Finally, due to the errors associated with the IMERG precipitations estimates, it is recommended to use sub-daily rainfall data to calibrate the satellite algorithms for better rainfall estimation over arid and semiarid regions. In addition, further investigations are needed to assess the impact of rain gauge density on the evaluation of satellite precipitation products [41].
It is recommended that future studies incorporate uncertainty analyses into the investigation of satellite performance. Sources of uncertainty may include errors from ground observations (such as instrumental problems, weather conditions, and data gaps); or errors from the satellite instrument itself. Several factors could affect the satellite estimation of precipitation such as the brightness of clouds in the visible spectrum, and the misidentification of clouds. In addition, there are uncertainties due to error propagation through the IMERG algorithms into the applications relying on IMERG products, such as hydrological models. Thus, a comprehensive study on the uncertainties of the IMERG precipitation products and the propagation of error is highly recommended.

Author Contributions

Conceptualization, M.T.M., M.A.H. and M.M.M.; Data curation, M.T.M., S.A.M., M.A.H. and M.M.M.; Formal analysis, M.T.M. and S.A.M.; Funding acquisition, M.A.H. and M.M.M.; Investigation, M.T.M.; Methodology, M.T.M.; Project administration, M.A.H. and M.M.M.; Resources, M.A.H. and M.M.M.; Supervision, M.A.H. and M.M.M.; Validation, S.A.M.; Visualization, M.T.M.; Writing—original draft, M.T.M. and S.A.M.; Writing—review and editing, M.A.H. All authors have read and agreed to the published version of the manuscript.

Funding

This research was funded by the National Water and Energy Center at United Arab Emirates University, grant number 31R281-AUA-NWEC.

Conflicts of Interest

The authors declare no conflict of interest.

Appendix A

Table A1. Descriptive statistics of large rainfall events over Saudi Arabia observed from 2014 to 2018.
YearDateNo of Obs.MeanMedianStd. ErrorStd. Dev.Var.KurtosisSkew.MinMaxTotal
201422-November369.4952.2913.73188.4320.474.090.580341.8
23-November417.2060.805.1526.570.980.930.822295.1
24-November3311.4471.739.9498.82−0.390.95135377.5
30-November4811.378.41.329.1784.050.531.08138545.9
201521-March347.276.11.277.4054.812.891.740.331247.1
28-October358.323.62.7015.97255.0418.014.120.586291.3
17-November407.444.51.076.7545.605.062.22130297.5
23-November5911.6810.51.078.2467.831.371.040.539689.2
24-November5623.6217.752.3917.92321.19−0.190.691771322.7
2-December3512.32101.549.0982.690.671.14133.5431.3
23-December578.165.61.138.5472.906.802.480.542465
30-December465.1140.513.4611.961.401.260.515235.2
20164-April4913.3192.1114.78218.4211.733.051.384652.35
12-April7011.127.751.2310.29105.949.232.380.564778.7
13-April3130.12214.5625.40645.090.351.07096933.65
29-April469.936.71.4910.09101.815.252.220.545.2456.9
31-July3225.5222.752.7815.74247.781.070.982.571816.5
25-November4410.227.41.338.8678.411.221.21136449.8
26-November6010.235.51.239.5491.030.381.18135614
27-November5117.69152.4317.36301.549.102.59198.2902.2
28-November4916.2815.81.4410.09101.781.771.02251797.7
201714-February4123.69155.3334.141165.512.353.451.5165971.2
13-May3811.818.251.7610.83117.372.601.661.247448.7
21-November3219.579.34.4325.08628.871.561.610.490626.1
201824-February5810.178.251.068.0664.908.912.58148589.9
6-April3710.6681.287.7960.721.181.26234.4394.6
8-April348.996.51.488.6074.040.731.290.532305.6
10-April3916.23171.8211.35128.87−0.420.550.545632.9

References

  1. Li, Z.; Yang, D.; Hong, Y. Multi-scale evaluation of high-resolution multi-sensor blended global precipitation products over the Yangtze River. J. Hydrol. 2013, 500, 157–169. [Google Scholar] [CrossRef]
  2. Wu, H.; Adler, R.F.; Hong, Y.; Tian, Y.; Policelli, F. Evaluation of Global Flood Detection Using Satellite-Based Rainfall and a Hydrologic Model. J. Hydrometeorol. 2012, 13, 1268–1284. [Google Scholar] [CrossRef]
  3. Derin, Y.; Yilmaz, K.K. Evaluation of Multiple Satellite-Based Precipitation Products over Complex Topography. J. Hydrometeorol. 2014, 15, 1498–1516. [Google Scholar] [CrossRef] [Green Version]
  4. Mahmoud, M.T.; Al-Zahrani, M.A.; Sharif, H.O. Assessment of global precipitation measurement satellite products over Saudi Arabia. J. Hydrol. 2018, 559, 1–12. [Google Scholar] [CrossRef]
  5. Saouabe, T.; El Khalki, E.M.; Saidi, M.E.M.; Najmi, A.; Hadri, A.; Rachidi, S.; Jadoud, M.; Tramblay, Y. Evaluation of the GPM-IMERG precipitation product for flood modeling in a semi-arid mountainous basin in Morocco. Water 2020, 12, 2516. [Google Scholar] [CrossRef]
  6. Song, Y.; Zhang, J.; Meng, X.; Zhou, Y.; Lai, Y.; Cao, Y. Comparison study of multiple precipitation forcing data on hydrological modeling and projection in the qujiang river basin. Water 2020, 12, 2626. [Google Scholar] [CrossRef]
  7. Boushaki, F.I.; Hsu, K.-L.; Sorooshian, S.; Park, G.-H.; Mahani, S.; Shi, W. Bias Adjustment of Satellite Precipitation Estimation Using Ground-Based Measurement: A Case Study Evaluation over the Southwestern United States. J. Hydrometeorol. 2009, 10, 1231–1242. [Google Scholar] [CrossRef]
  8. Ebert, E.E.; Janowiak, J.E.; Kidd, C. Comparison of near-real-time precipitation estimates from satellite observations and numerical models. Bull. Am. Meteorol. Soc. 2007, 88, 47–64. [Google Scholar] [CrossRef] [Green Version]
  9. Hobouchian, M.P.; Salio, P.; García Skabar, Y.; Vila, D.; Garreaud, R. Assessment of satellite precipitation estimates over the slopes of the subtropical Andes. Atmos. Res. 2017, 190, 43–54. [Google Scholar] [CrossRef]
  10. Sorooshian, S.; Hsu, K.L.; Gao, X.; Gupta, H.V.; Imam, B.; Braithwaite, D. Evaluation of PERSIANN system satellite-based estimates of tropical rainfall. Bull. Am. Meteorol. Soc. 2000, 81, 2035–2046. [Google Scholar] [CrossRef] [Green Version]
  11. Joyce, R.J.; Janowiak, J.E.; Arkin, P.A.; Xie, P. CMORPH: A Method that Produces Global Precipitation Estimates from Passive Microwave and Infrared Data at High Spatial and Temporal Resolution. J. Hydrometeorol. 2004, 5, 487–503. [Google Scholar] [CrossRef]
  12. Huffman, G.; Bolvin, D. TRMM and Other Data Precipitation Data Set Documentation; NASA: Greenbelt, MD, USA, 2007; pp. 1–25.
  13. Prakash, S.; Mitra, A.K.; AghaKouchak, A.; Liu, Z.; Norouzi, H.; Pai, D.S. A preliminary assessment of GPM-based multi-satellite precipitation estimates over a monsoon dominated region. J. Hydrol. 2018, 556, 865–876. [Google Scholar] [CrossRef] [Green Version]
  14. Huffman, G.J.; Bolvin, D.T.; Nelkin, E.J.; Wolff, D.B.; Adler, R.F.; Gu, G.; Hong, Y.; Bowman, K.P.; Stocker, E.F. The TRMM Multisatellite Precipitation Analysis (TMPA): Quasi-Global, Multiyear, Combined-Sensor Precipitation Estimates at Fine Scales. J. Hydrometeorol. 2007, 8, 38–55. [Google Scholar] [CrossRef]
  15. Hirpa, F.A.; Gebremichael, M.; Hopson, T. Evaluation of high-resolution satellite precipitation products over very complex terrain in Ethiopia. J. Appl. Meteorol. Climatol. 2010, 49, 1044–1051. [Google Scholar] [CrossRef]
  16. Kim, K.; Park, J.; Baik, J.; Choi, M. Evaluation of topographical and seasonal feature using GPM IMERG and TRMM 3B42 over Far-East Asia. Atmos. Res. 2017, 187, 95–105. [Google Scholar] [CrossRef]
  17. Sharifi, E.; Steinacker, R.; Saghafian, B. Assessment of GPM-IMERG and other precipitation products against gauge data under different topographic and climatic conditions in Iran: Preliminary results. Remote Sens. 2016, 8, 135. [Google Scholar] [CrossRef] [Green Version]
  18. De Coning, E.; Poolman, E. South African Weather Service operational satellite based precipitation estimation technique: Applications and improvements. Hydrol. Earth Syst. Sci. 2011, 15, 1131–1145. [Google Scholar] [CrossRef] [Green Version]
  19. Dinku, T.; Connor, S.J.; Ceccato, P. Comparison of CMORPH and TRMM-3B42 over mountainous regions of Africa and South America. Satell. Rainfall Appl. Surf. Hydrol. 2010, 193–204. [Google Scholar] [CrossRef]
  20. Habib, E.; Haile, A.T.; Sazib, N.; Zhang, Y.; Rientjes, T. Effect of bias correction of satellite-rainfall estimates on runoff simulations at the source of the Upper Blue Nile. Remote Sens. 2014, 6, 6688–6708. [Google Scholar] [CrossRef] [Green Version]
  21. Gao, Y.C.; Liu, M.F. Evaluation of high-resolution satellite precipitation products using rain gauge observations over the Tibetan Plateau. Hydrol. Earth Syst. Sci. 2013, 17, 837–849. [Google Scholar] [CrossRef] [Green Version]
  22. Blacutt, L.A.; Herdies, D.L.; de Gonçalves, L.G.G.; Vila, D.A.; Andrade, M. Precipitation comparison for the CFSR, MERRA, TRMM3B42 and Combined Scheme datasets in Bolivia. Atmos. Res. 2015, 163, 117–131. [Google Scholar] [CrossRef] [Green Version]
  23. Salio, P.; Hobouchian, M.P.; García Skabar, Y.; Vila, D. Evaluation of high-resolution satellite precipitation estimates over southern South America using a dense rain gauge network. Atmos. Res. 2015, 163, 146–161. [Google Scholar] [CrossRef]
  24. Dinku, T.; Chidzambwa, S.; Ceccato, P.; Connor, S.J.; Ropelewski, C.F. Validation of high-resolution satellite rainfall products over complex terrain. Int. J. Remote Sens. 2008, 29, 4097–4110. [Google Scholar] [CrossRef]
  25. Hou, A.Y.; Kakar, R.K.; Neeck, S.; Azarbarzin, A.A.; Kummerow, C.D.; Kojima, M.; Oki, R.; Nakamura, K.; Iguchi, T. The global precipitation measurement mission. Bull. Am. Meteorol. Soc. 2014, 95, 701–722. [Google Scholar] [CrossRef]
  26. Dinku, T.; Ceccato, P.; Cressman, K.; Connor, S.J. Evaluating detection skills of satellite rainfall estimates over desert locust recession regions. J. Appl. Meteorol. Climatol. 2010, 49, 1322–1332. [Google Scholar] [CrossRef]
  27. Mahmoud, M.T.; Hamouda, M.A.; Mohamed, M.M. Spatiotemporal evaluation of the GPM satellite precipitation products over the United Arab Emirates. Atmos. Res. 2019, 219, 200–212. [Google Scholar] [CrossRef]
  28. Nashwan, M.S.; Shahid, S.; Wang, X. Assessment of satellite-based precipitation measurement products over the hot desert climate of Egypt. Remote Sens. 2019, 11, 555. [Google Scholar] [CrossRef] [Green Version]
  29. Almazroui, M. Calibration of TRMM rainfall climatology over Saudi Arabia during 1998–2009. Atmos. Res. 2011, 99, 400–414. [Google Scholar] [CrossRef]
  30. Hasanean, H.; Almazroui, M. Rainfall: Features and variations over Saudi Arabia, a review. Climate 2015, 3, 578–626. [Google Scholar] [CrossRef] [Green Version]
  31. Al-Zahrani, M.; Husain, T. An algorithm for designing a precipitation network in the south-western region of Saudi Arabia. J. Hydrol. 1998, 205, 205–216. [Google Scholar] [CrossRef]
  32. Horton, R.; Gornitz, V.; Bowman, M.; Blake, R. Climate observations and projections. Ann. N. Y. Acad. Sci. 2010, 1196, 41–62. [Google Scholar] [CrossRef] [PubMed]
  33. Hag-elsafi, S.; El-Tayib, M. Spatial and statistical analysis of rainfall in the Kingdom of Saudi Arabia from 1979 to 2008. Weather 2016, 71, 262–266. [Google Scholar] [CrossRef]
  34. Wang, Z.; Zhong, R.; Lai, C.; Chen, J. Evaluation of the GPM IMERG satellite-based precipitation products and the hydrological utility. Atmos. Res. 2017, 196, 151–163. [Google Scholar] [CrossRef]
  35. Zheng, J.; Liao, K.; Zhu, Q.; Yang, G.; Li, Q. Soil moisture response to rainfall in forestland and vegetable plot in Taihu Lake Basin, China. Chinese Geogr. Sci. 2014, 25, 426–437. [Google Scholar]
  36. Elnesr, M.N.; Abu-Zreig, M.M.; Alazba, A.A. Temperature trends and distribution in the arabian peninsula. Am. J. Environ. Sci. 2010, 6, 191–203. [Google Scholar] [CrossRef] [Green Version]
  37. Tan, M.L.; Santo, H. Comparison of GPM IMERG, TMPA 3B42 and PERSIANN-CDR satellite precipitation products over Malaysia. Atmos. Res. 2018, 202, 63–76. [Google Scholar] [CrossRef]
  38. Shi, J.; Yuan, F.; Shi, C.; Zhao, C.; Zhang, L.; Ren, L.; Zhu, Y.; Jiang, S.; Liu, Y. Statistical evaluation of the latest GPM-Era IMERG and GSMaP satellite precipitation products in the Yellow River source region. Water 2020, 12, 1006. [Google Scholar] [CrossRef] [Green Version]
  39. Xiao, S.; Xia, J.; Zou, L. Evaluation of multi-satellite precipitation products and their ability in capturing the characteristics of extreme climate events over the Yangtze River Basin, China. Water 2020, 12, 1179. [Google Scholar] [CrossRef] [Green Version]
  40. Tian, F.; Hou, S.; Yang, L.; Hu, H.; Hou, A. How Does the Evaluation of the GPM IMERG Rainfall Product Depend on Gauge Density and Rainfall Intensity? J. Hydrometeorol. 2017, 19, 339–349. [Google Scholar] [CrossRef]
  41. Navarro, A.; García-Ortega, E.; Merino, A.; Sánchez, J.L.; Kummerow, C.; Tapiador, F.J. Assessment of IMERG precipitation estimates over Europe. Remote Sens. 2019, 11, 2470. [Google Scholar] [CrossRef] [Green Version]
  42. Anjum, M.N.; Ding, Y.; Shangguan, D.; Ahmad, I.; Ijaz, M.W.; Farid, H.U.; Yagoub, Y.E.; Zaman, M.; Adnan, M. Performance evaluation of latest integrated multi-satellite retrievals for Global Precipitation Measurement (IMERG) over the northern highlands of Pakistan. Atmos. Res. 2018, 205, 134–146. [Google Scholar] [CrossRef]
Figure 1. (a) Distribution of rain gauge network operated by Ministry of Environment, Water, and Agriculture (MEWA), Saudi Arabia; (b) Average annual rainfall values for rainfall stations distributed across Saudi Arabia from 1979 to 2009 [30].
Remotesensing 13 00013 g001
Figure 2. Schematic diagram of the event determination, matching coordinates, and data analysis modules.
Remotesensing 13 00013 g002
Figure 3. Distribution of rain gauges over the different topographical regions in Saudi Arabia (altitudes are in m).
Remotesensing 13 00013 g003
Figure 4. POD values for each season based on the seasonal evaluation.
Remotesensing 13 00013 g004
Figure 5. CC values for each season based on the seasonal evaluation.
Remotesensing 13 00013 g005
Figure 6. Evaluation of IMERG products for the different topographical regions using CC measurements for (a) IMERG-E, (b) IMERG-L, and (c) IMERG-F and POD indicator for (d) IMERG-E, (e) IMERG-L, and (f) IMERG-F.
Remotesensing 13 00013 g006
Figure 7. Evaluation of IMERG products for the different topographical regions using MAE measurements for (a) IMERG–E, (b) IMERG-L, and (c) IMERG-F and RMSE indicator for (d) IMERG-E, (e) IMERG-L, and (f) IMERG-F.
Remotesensing 13 00013 g007
Table 1. Descriptive statistics of annual rainfall based on events measured by MEWA stations (in mm).
YearMean aStandard DeviationSample VarianceKurtosisSkewnessRangeAverage Annual Rainfall
20149.776.6844.663.621.5538.5543.64 b
201510.106.3840.660.750.8930.3089.65
201611.597.8161.023.071.3350.00110.80
201710.577.4555.542.161.3141.0069.05
20188.535.3228.35−0.500.5920.3826.5 b
a The Mean is the average rainfall depth (mm) of annual rainfall events; b 2014 data spans from March–Dec, whereas for 2018 covers from January to June.
Table 2. List of statistical evaluation indices utilized to assess the IMERG-E, IMERG-L, and IMERG-F.
Statistical IndicesFormulaeOptimum Value
Probability of Detection (POD) P O D = N O D N O D + N O 1
Mean Absolute Error (MAE) M A E = 1 n i = 1 n | D i O i | 0
Root Mean Square Error (RMSE) R M S E = 1 n i = 1 n ( D i O i ) 2 0
Relative Bias (RBIAS) R B I A S = i = 1 n ( D i O i ) i = 1 n O i × 100 % 0%
Correlation Coefficient (CC) C C = i = 1 n ( D i D ¯ ) ( O i O ¯ ) i = 1 n ( D i D ¯ ) i = 1 n ( O i O ¯ ) 1
Table 3. Rainfall intensity classification [35].
Rainfall ClassLight RainfallModerate RainfallHeavy RainfallStormLarge StormExtreme Large Storm
24 h Rainfall (mm)<1010–2525–5050–100100–250≥250
Table 4. Rain gauge distribution in each topographical region.
Topographical RegionsNo. of Observations *No. of StationsStation Density #/1000 km2
Coastal region1140630.14
Areas adjacent to the coasts1657580.15
Inland region1918960.46
Foothills region215190.52
High mountains region213120.01
Total5143248 **
* The total number of precipitation events collected over a topographical region throughout the study duration. ** Excluding offshore stations.
Table 5. Error and BIAS indices based on the seasonal evaluation.
SeasonMAERMSERBIAS
IMERG-EIMERG-LIMERG-FIMERG-EIMERG-LIMERG-FIMERG-EIMERG-LIMERG-F
Fall11.5111.009.2217.3916.7013.84−0.02−0.01−0.15
Spring10.329.437.8215.7014.4212.520.004−0.19−0.16
Summer11.9511.3410.8516.9416.0815.44−0.16−0.18−0.38
Winter13.4812.9211.7218.1218.2914.280.121.50−0.15
Table 6. Rainfall intensity-based evaluation matrices.
Event DateProductCCMAERMSEBIASPOD
LightIMERG-E0.0937.5113.040.030.84
IMERG-L0.0758.6817.170.040.87
IMERG-F0.1454.266.660.0010.87
ModerateIMERG-E0.04512.5916.49−0.010.89
IMERG-L0.03913.3218.83−0.010.9
IMERG-F0.07311.4113.39−0.030.9
HeavyIMERG-E0.01223.5826.55−0.10.9
IMERG-L0.03423.1826.36−0.090.91
IMERG-F0.11324.4626.55−0.140.91
StormIMERG-E0.17341.6845.66−0.640.93
IMERG-L0.14740.4644.52−0.610.96
IMERG-F0.17543.2247.24-0.690.96
Large stormIMERG-E0.488121.19123.97−13.030.71
IMERG-L0.714117.57119.64−12.640.86
IMERG-F0.621110.01112.5−11.830.86
Table 7. RBIAS measurements for IMERG-E, IMERG-L, and IMERG-F using the topographical-based evaluation.
Region NameAltitude (m)IMERG-EIMERG-LIMERG-F
Coastal region0–1000.001−0.030.01
Areas adjacent to the coasts100 to 200−0.02−0.03−0.01
Inland region200 to 10000.01−0.020.02
Foothills region1000 to 2000−0.08−0.250.11
High mountains regionMore than 2000−0.09−0.23−0.05
Publisher’s Note: MDPI stays neutral with regard to jurisdictional claims in published maps and institutional affiliations.

