A New Machine Learning Approach in Detecting the Oil Palm Plantations Using Remote Sensing Data

 , , ,
, , ,
Abstract
:
1. Introduction
2. Study Area and Materials
2.1. Study Area
2.2. Datasets
2.3. Training Data Collection
3. Methods
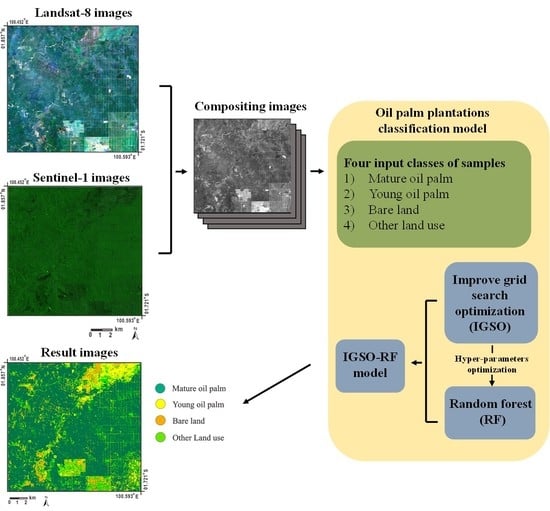
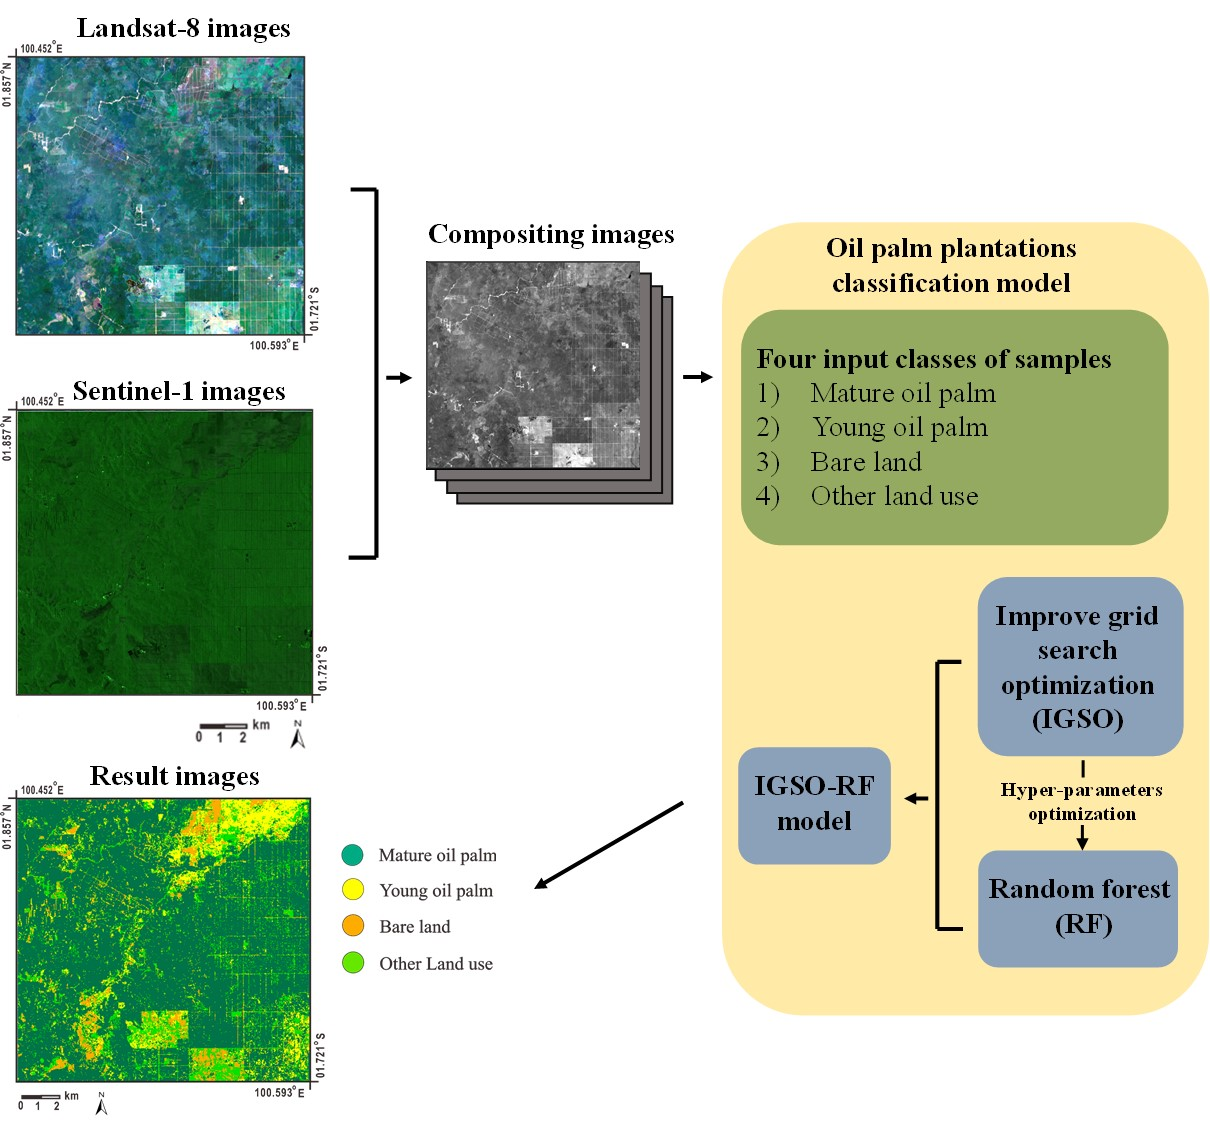
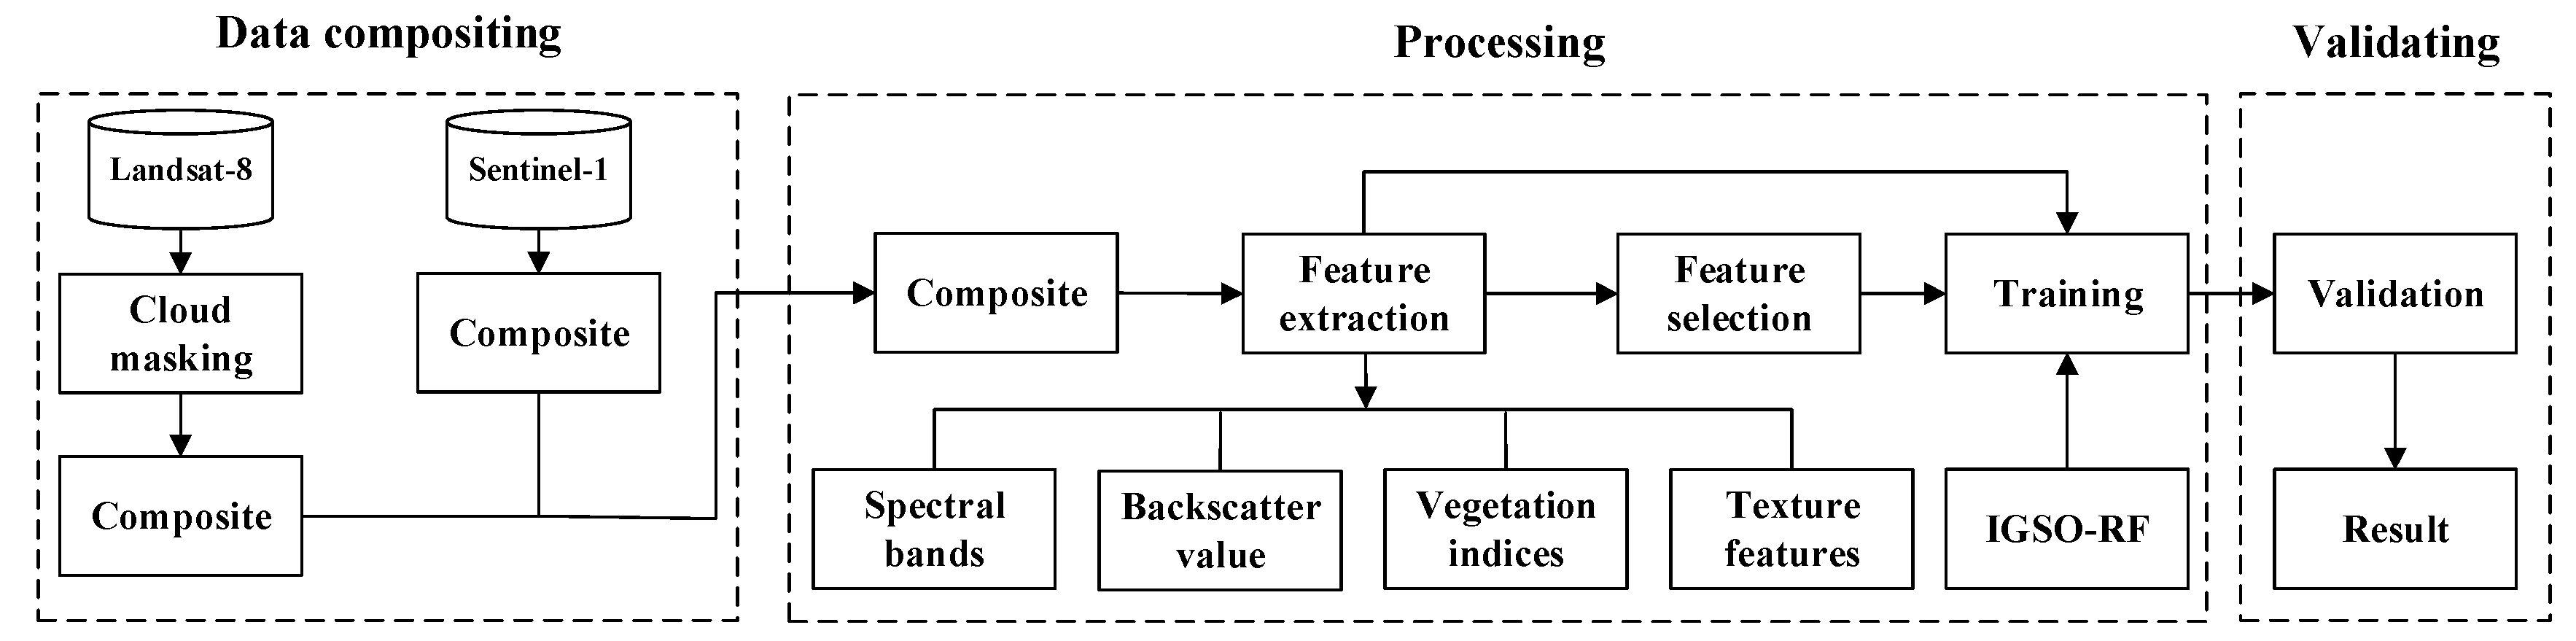
3.1. Overview
3.2. Sentinel-1 and Landsat-8 Compositing
3.3. Feature Extraction
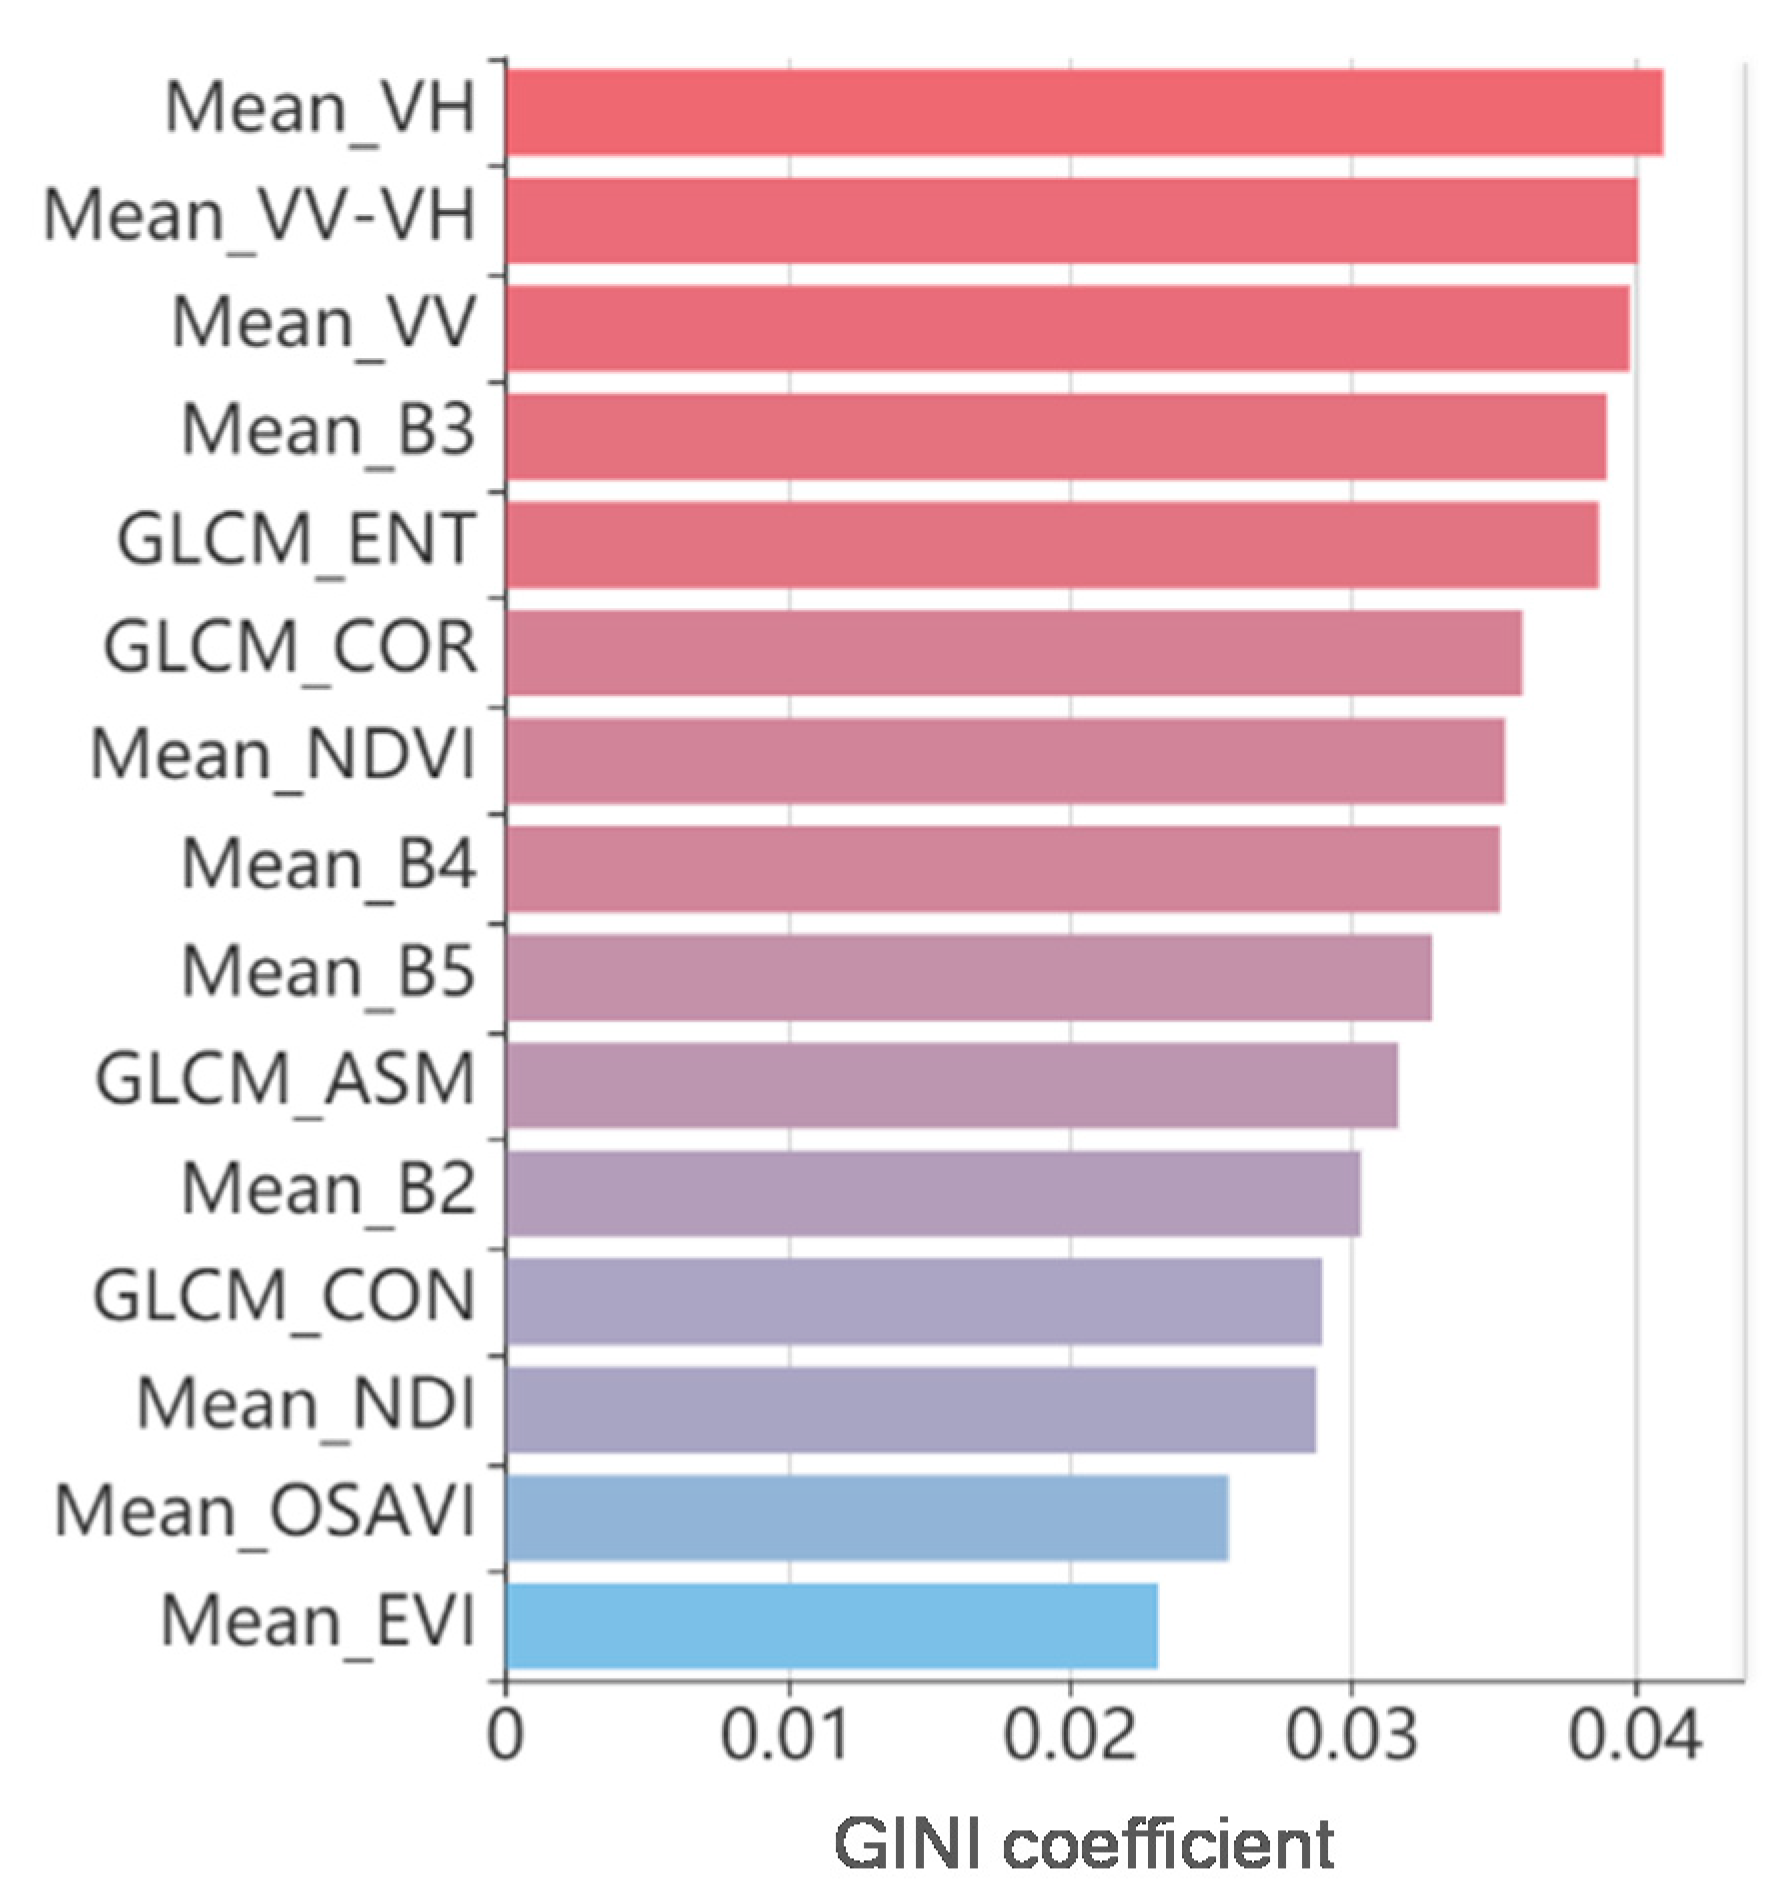
3.4. Feature Selection
3.5. Random Forest Algorithm and Optimization of Parameters
- The ranges of and , which represent the number of decision trees and the number of split features, respectively, are determined. Then, the step size is set, and a two-dimensional grid is established for the parameter search. The grid nodes are parameter pairs of and .
- A RF decision tree is constructed for each set of hyper-parameters on the grid node, and estimate function is utilized to estimate the classification error.
- The parameters and with the minimum classification error are selected. If either the classification error or the step size meets the requirements, the optimal parameters and classification error are output; otherwise, the step size is reduced, the above steps are repeated, and the search continues.
3.6. Validation
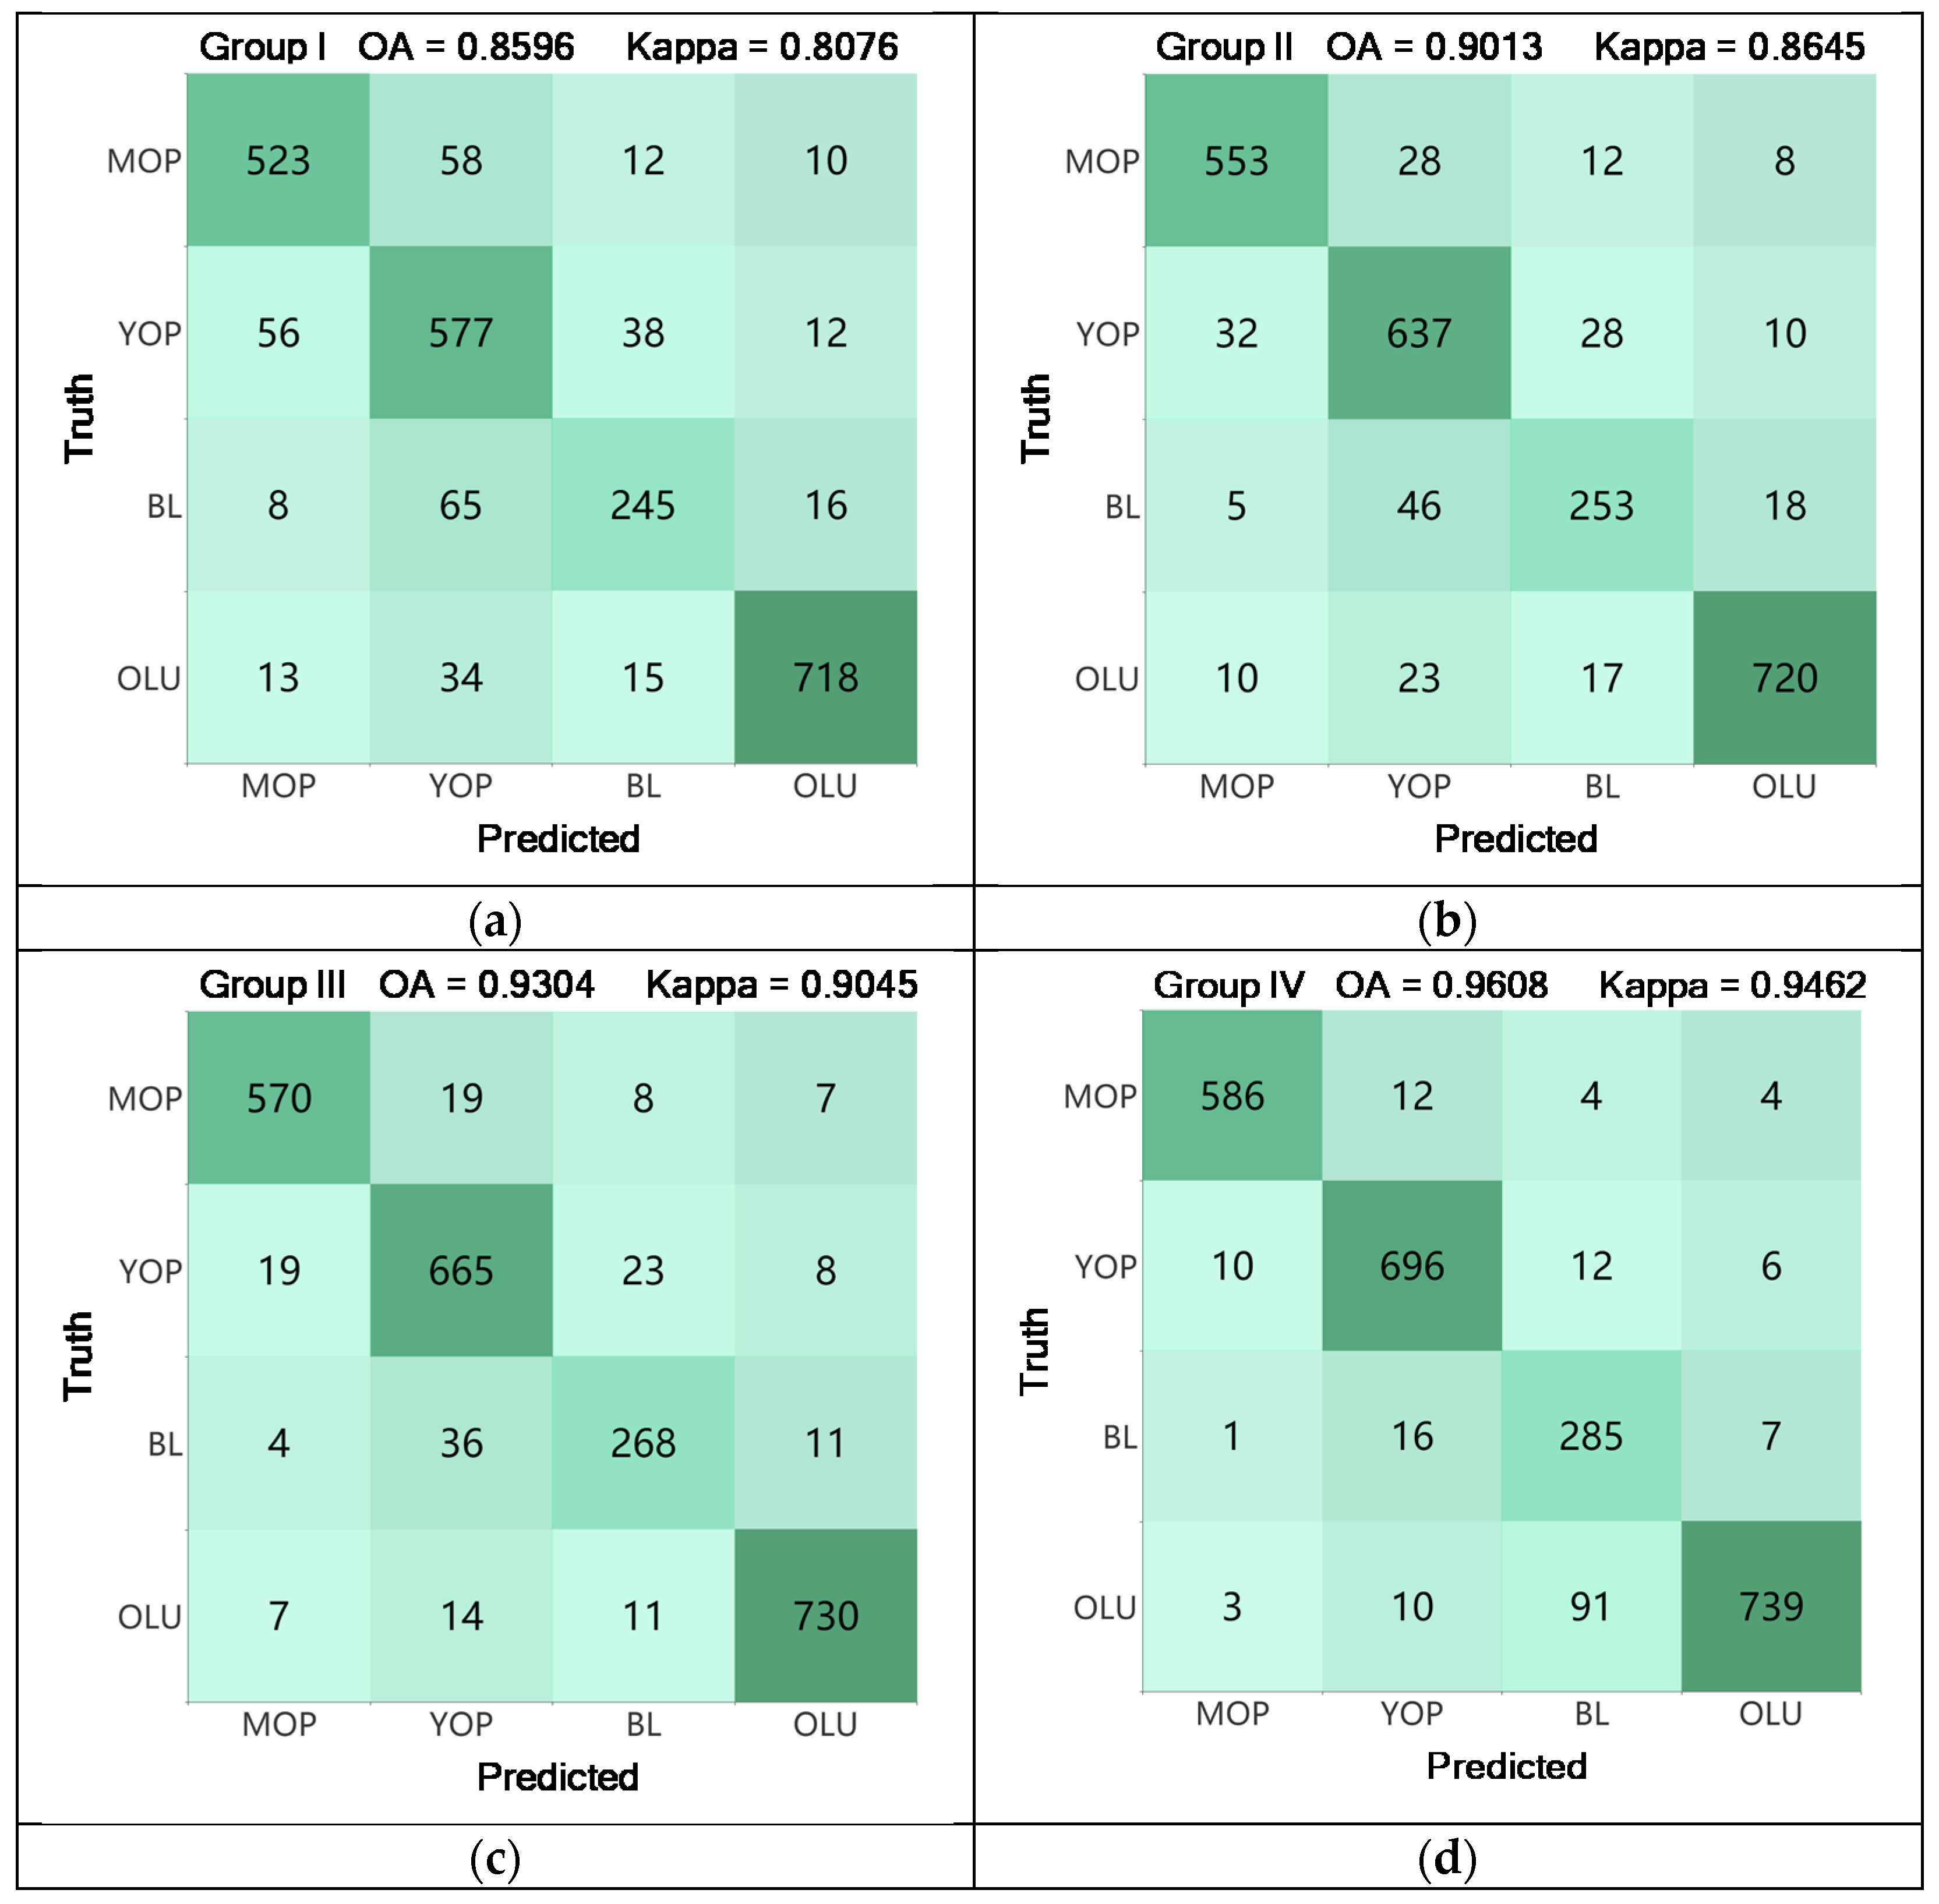
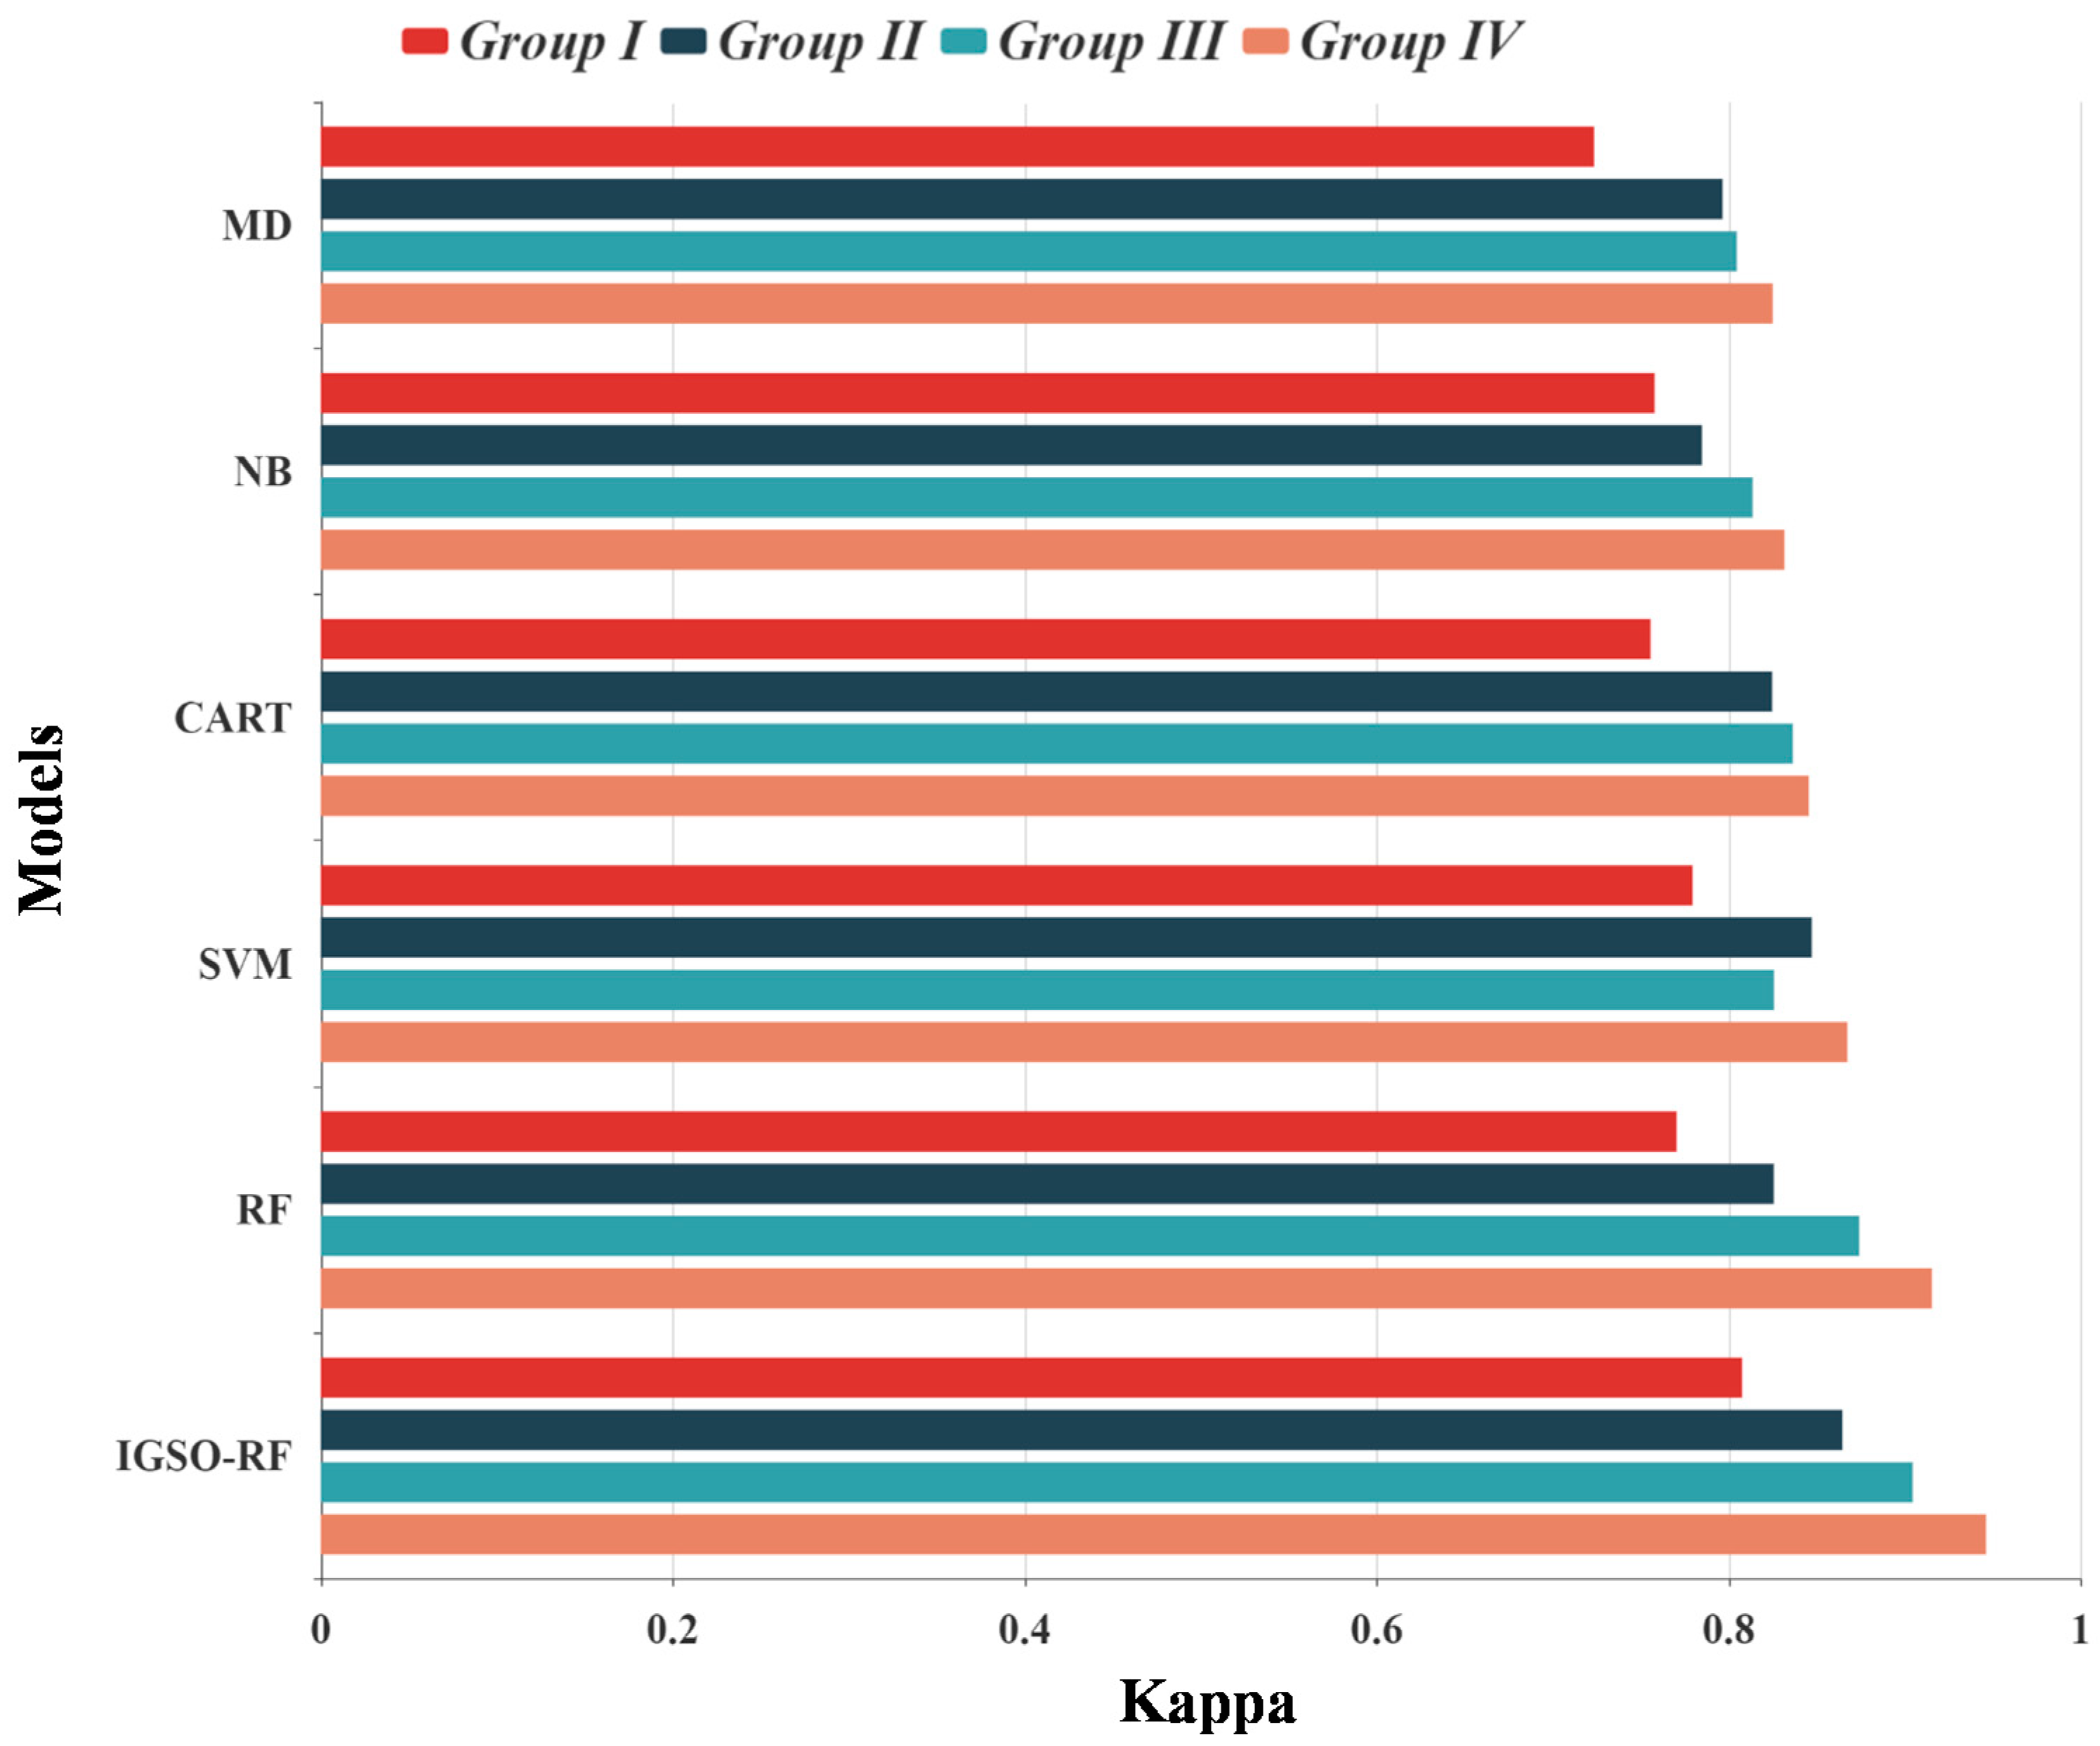
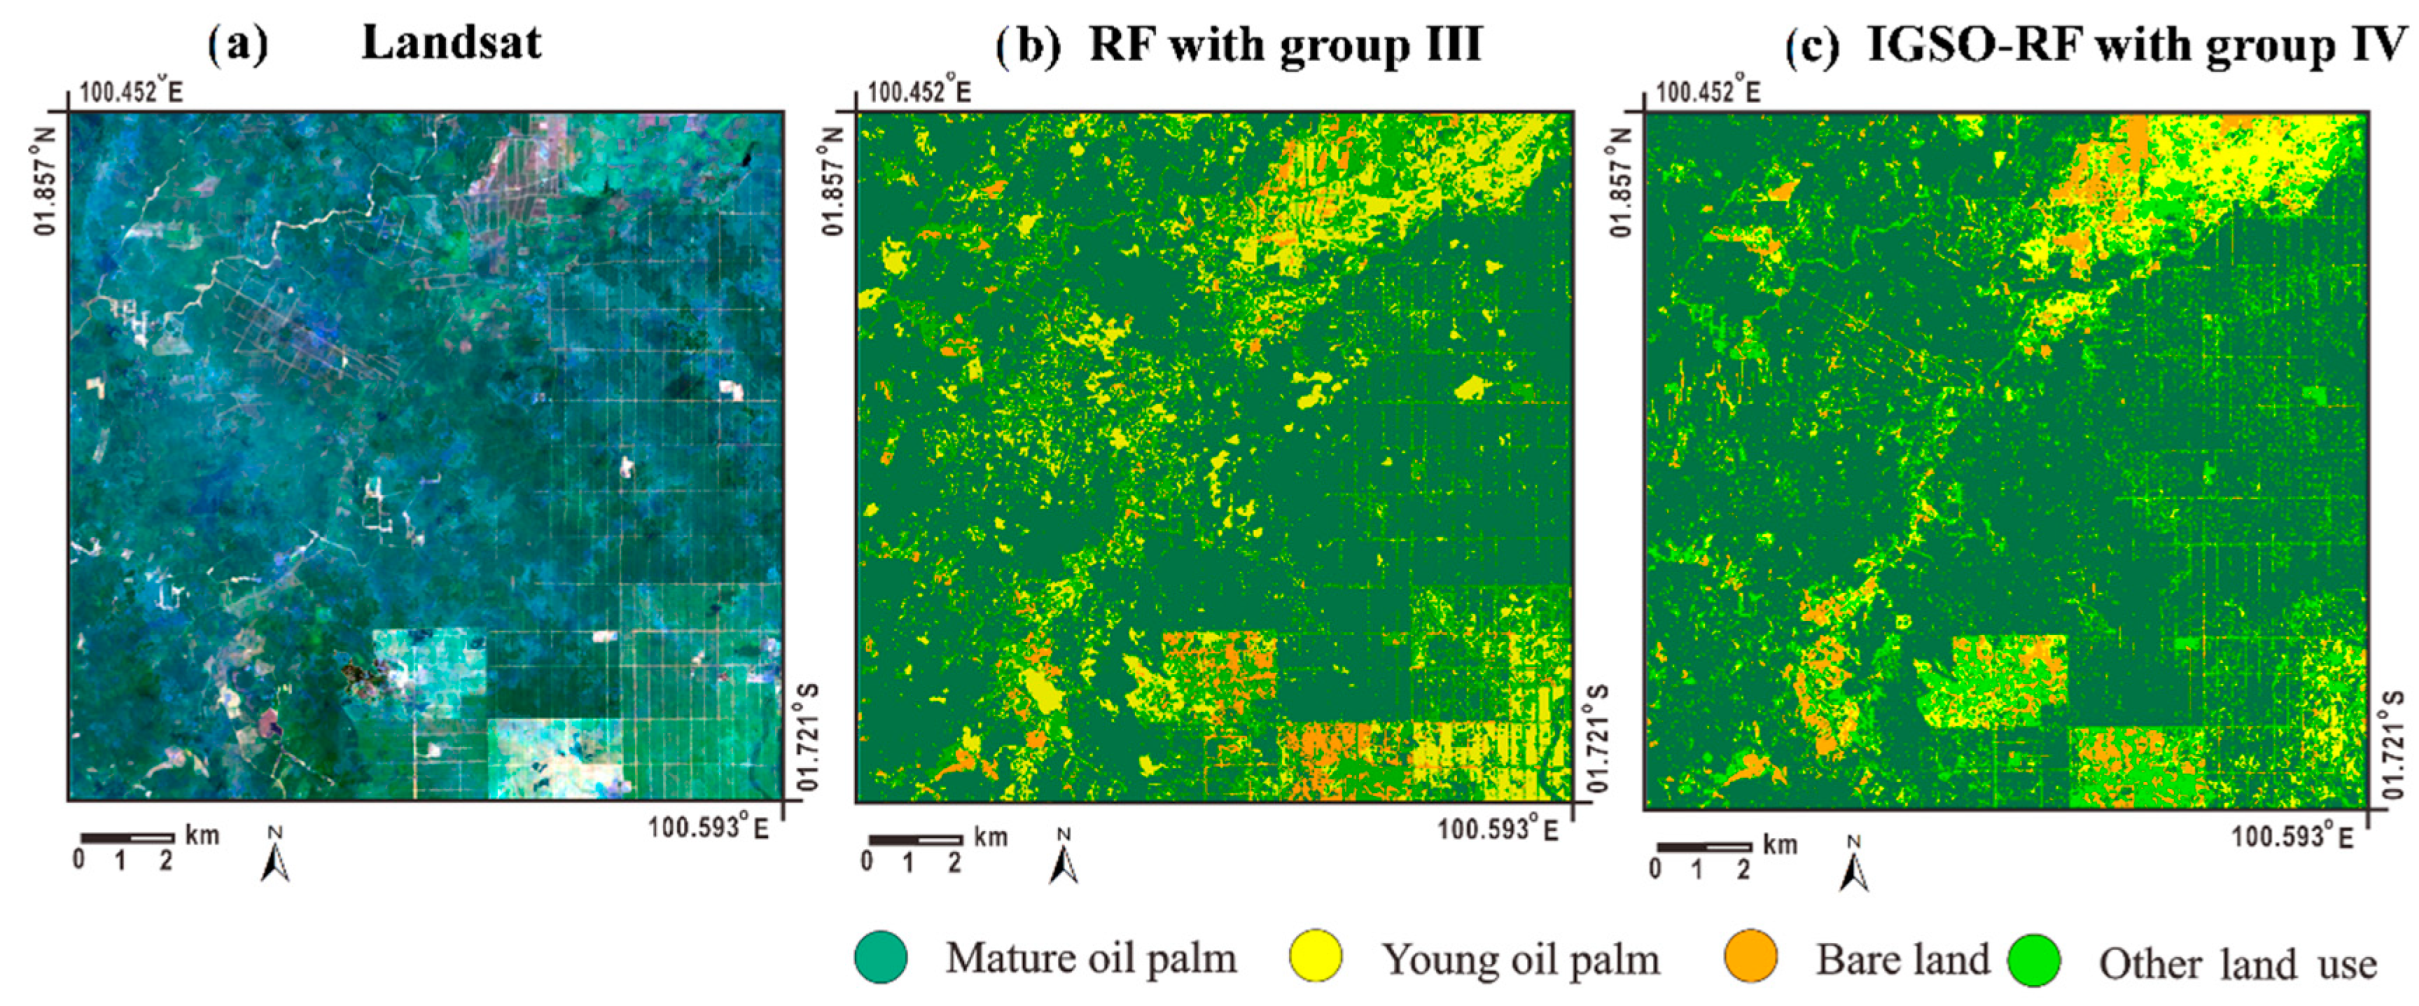
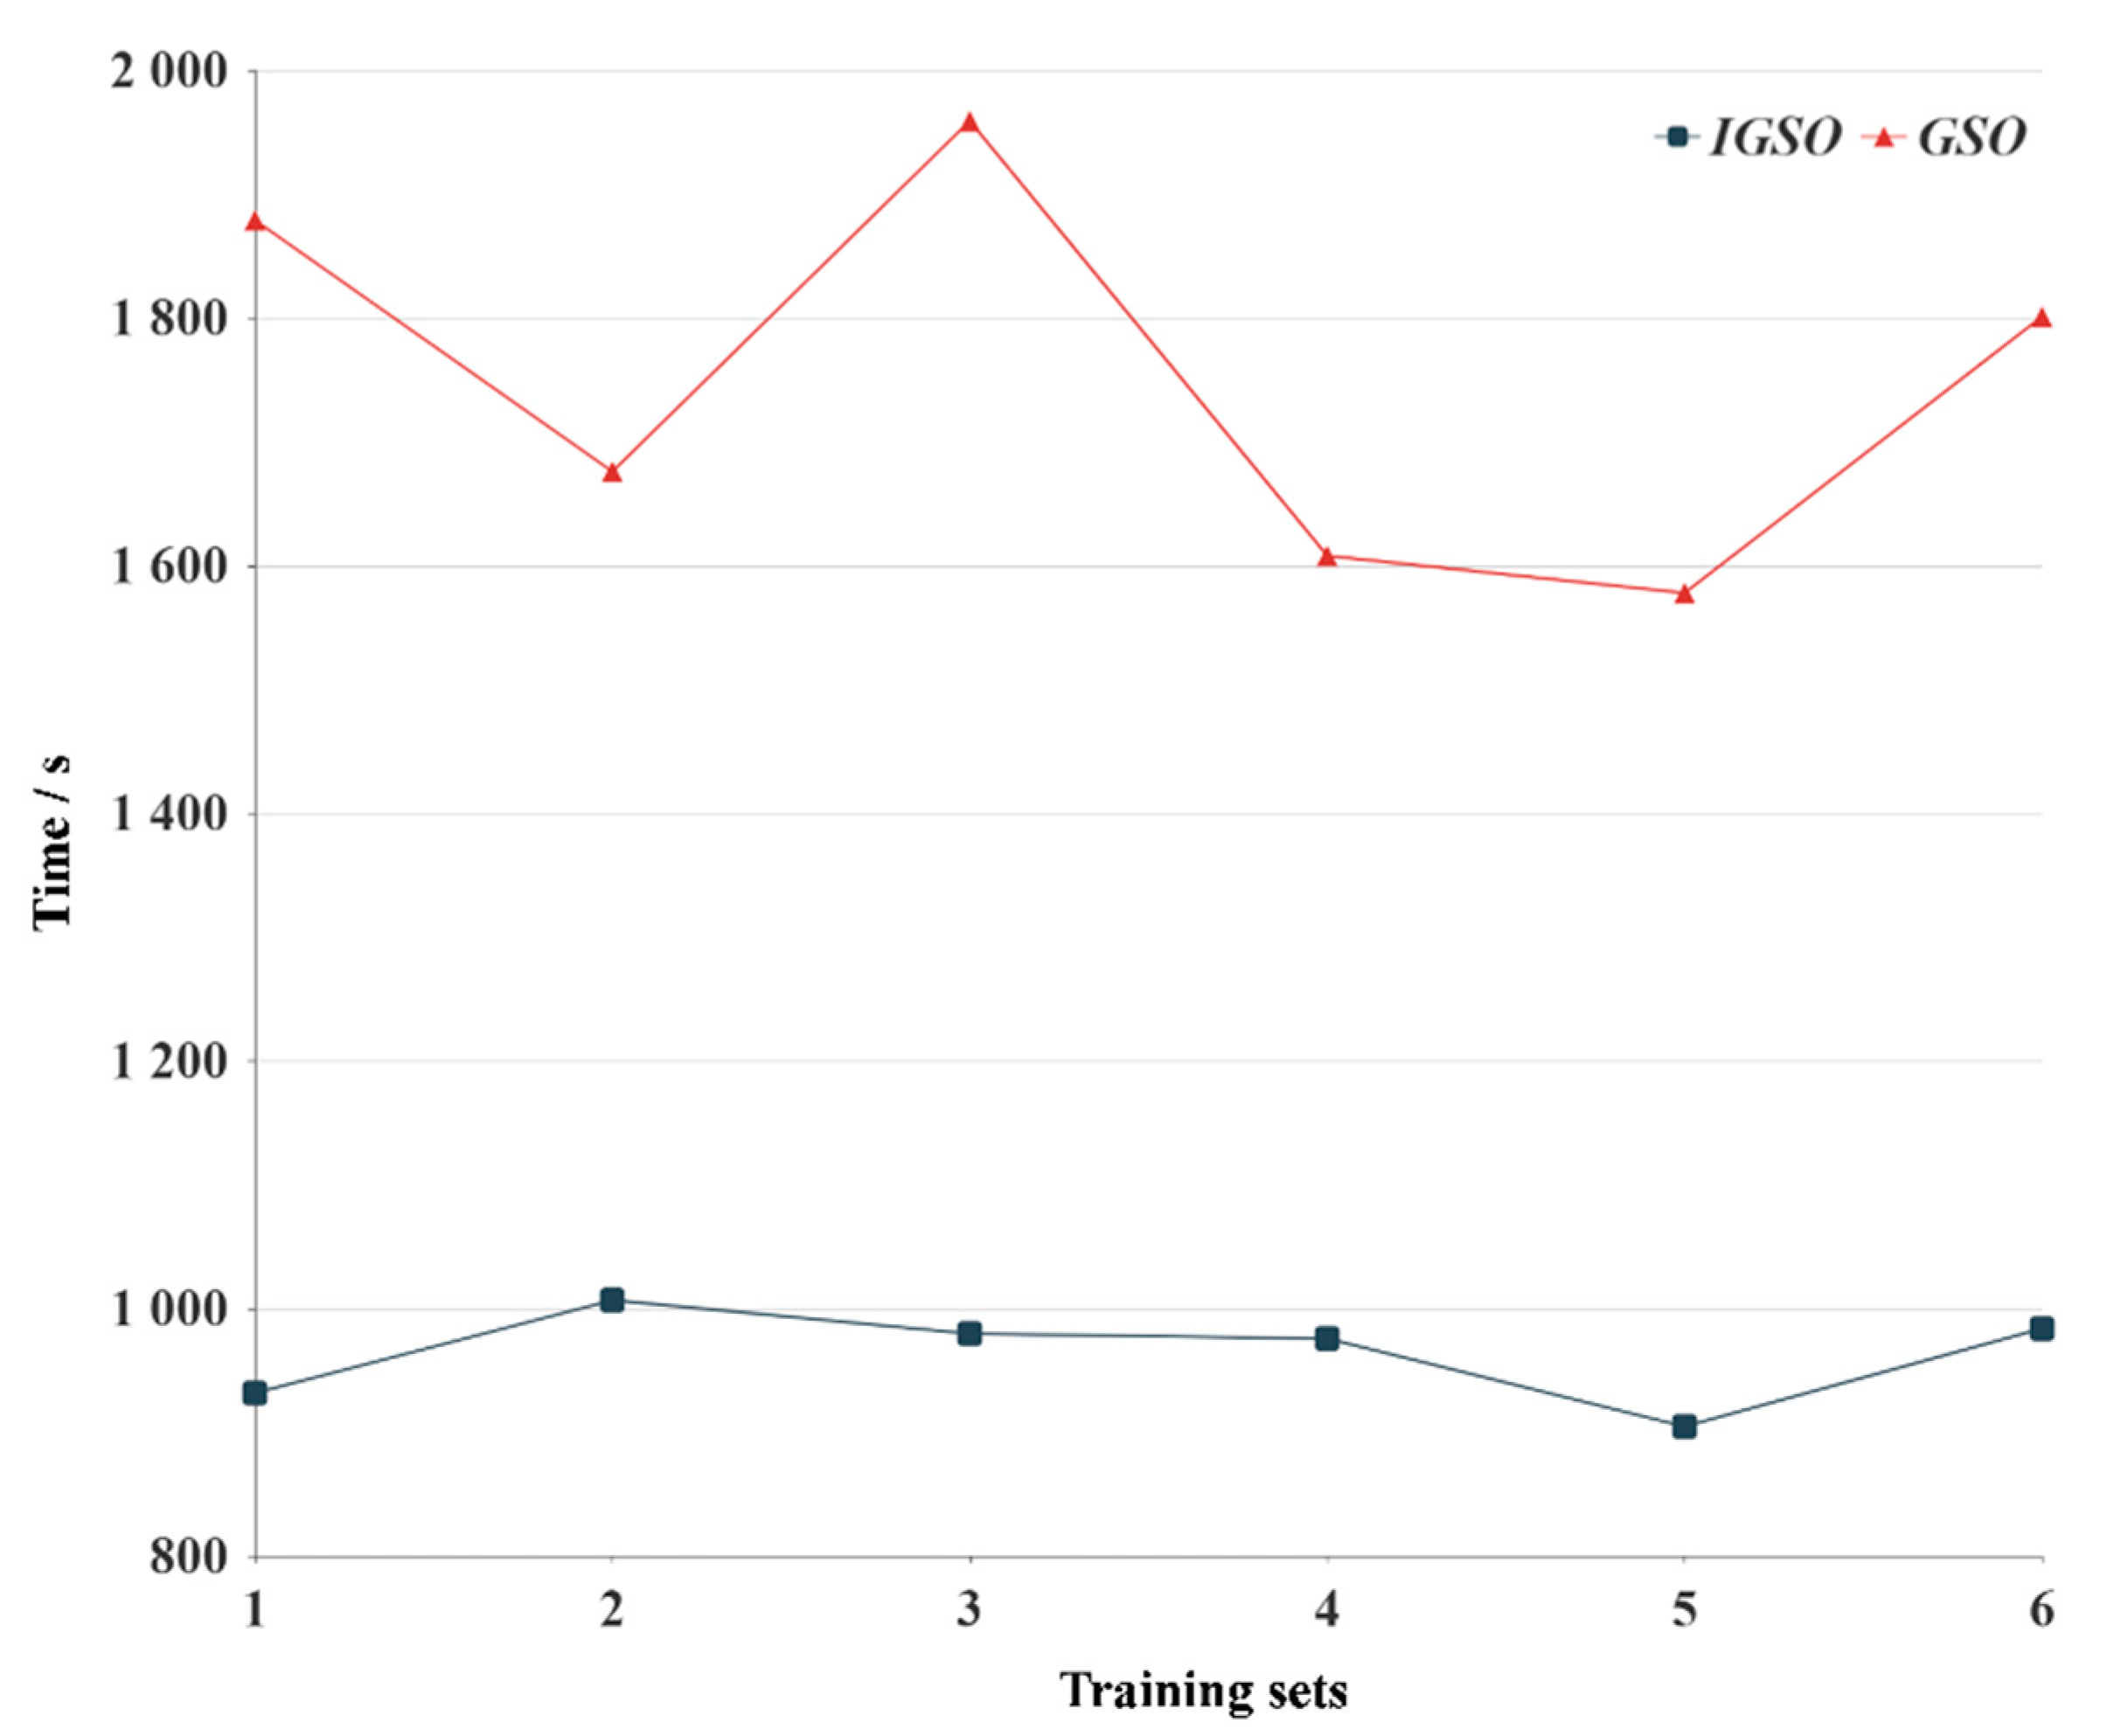
4. Results
5. Discussion
6. Conclusions
Author Contributions
Funding
Acknowledgments
Conflicts of Interest
References
- Rulli, M.C.; Casirati, S.; Dell’Angelo, J.; Davis, K.F.; Passera, C.; D’Odorico, P. Interdependencies and telecoupling of oil palm expansion at the expense of Indonesian rainforest. Renew. Sustain. Energy Rev. 2019, 105, 499–512. [Google Scholar] [CrossRef]
- Murphy, D.J. Oil palm: Future prospects for yield and quality improvements. Lipid Technol. 2009, 21, 257–260. [Google Scholar] [CrossRef]
- Fitzherbert, E.B.; Struebig, M.J.; Morel, A.; Danielsen, F.; Brühl, C.A.; Donald, P.F.; Phalan, B. How will oil palm expansion affect biodiversity? Trends Ecol. Evol. 2008, 23, 538–545. [Google Scholar] [CrossRef]
- Permpool, N.; Bonnet, S.; Gheewala, S.H. Greenhouse gas emissions from land use change due to oil palm expansion in Thailand for biodiesel production. J. Clean. Prod. 2016, 134, 532–538. [Google Scholar] [CrossRef]
- Carlson, K.M.; Curran, L.M.; Ratnasari, D.; Pittman, A.M.; Soares-Filho, B.S.; Asner, G.P.; Trigg, S.N.; Gaveau, D.A.; Lawrence, D.; Rodrigues, H.O. Committed carbon emissions, deforestation, and community land conversion from oil palm plantation expansion in West Kalimantan, Indonesia. Proc. Natl. Acad. Sci. USA 2012, 109, 7559–7564. [Google Scholar] [CrossRef] [PubMed] [Green Version]
- Carlson, K.M.; Heilmayr, R.; Gibbs, H.K.; Noojipady, P.; Burns, D.N.; Morton, D.C.; Walker, N.F.; Paoli, G.D.; Kremen, C. Effect of oil palm sustainability certification on deforestation and fire in Indonesia. Proc. Natl. Acad. Sci. USA 2018, 115, 121–126. [Google Scholar] [CrossRef] [Green Version]
- Gutiérrez-Vélez, V.H.; DeFries, R.; Pinedo-Vásquez, M.; Uriarte, M.; Padoch, C.; Baethgen, W.; Fernandes, K.; Lim, Y. High-yield oil palm expansion spares land at the expense of forests in the Peruvian Amazon. Environ. Res. Lett. 2011, 6, 044029. [Google Scholar] [CrossRef]
- Srestasathiern, P.; Rakwatin, P. Oil palm tree detection with high resolution multi-spectral satellite imagery. Remote Sens. 2014, 6, 9749–9774. [Google Scholar] [CrossRef] [Green Version]
- Li, W.; Fu, H.; Yu, L.; Cracknell, A. Deep learning based oil palm tree detection and counting for high-resolution remote sensing images. Remote Sens. 2017, 9, 22. [Google Scholar] [CrossRef] [Green Version]
- Li, W.; Dong, R.; Fu, H.; Yu, L. Large-scale oil palm tree detection from high-resolution satellite images using two-stage convolutional neural networks. Remote Sens. 2019, 11, 11. [Google Scholar] [CrossRef] [Green Version]
- Morel, A.C.; Saatchi, S.S.; Malhi, Y.; Berry, N.J.; Banin, L.; Burslem, D.; Nilus, R.; Ong, R.C. Estimating aboveground biomass in forest and oil palm plantation in Sabah, Malaysian Borneo using ALOS PALSAR data. For. Ecol. Manag. 2011, 262, 1786–1798. [Google Scholar] [CrossRef]
- Li, L.; Dong, J.; Njeudeng Tenku, S.; Xiao, X. Mapping oil palm plantations in Cameroon using PALSAR 50-m orthorectified mosaic images. Remote Sens. 2015, 7, 1206–1224. [Google Scholar] [CrossRef] [Green Version]
- Sum, A.F.W.; Shukor, S.A.A. Oil Palm Plantation Monitoring from Satellite Image. IOP Conf. Ser. Mater. Sci. Eng. 2019, 705, 012043. [Google Scholar] [CrossRef]
- Oon, A.; Ngo, K.D.; Azhar, R.; Ashton-Butt, A.; Lechner, A.M.; Azhar, B. Assessment of ALOS-2 PALSAR-2L-band and Sentinel-1 C-band SAR backscatter for discriminating between large-scale oil palm plantations and smallholdings on tropical peatlands. Remote Sens. Appl. Soc. Environ. 2019, 13, 183–190. [Google Scholar] [CrossRef]
- Nomura, K.; Mitchard, E.T.; Patenaude, G. Oil palm concessions in southern Myanmar consist mostly of unconverted forest. Sci. Rep. 2019, 9, 1–9. [Google Scholar] [CrossRef] [Green Version]
- Lazecky, M.; Lhota, S.; Penaz, T.; Klushina, D. Application of Sentinel-1 satellite to identify oil palm plantations in Balikpapan Bay. IOP Conf. Ser. Earth Environ. Sci. 2018, 169, 012064. [Google Scholar] [CrossRef]
- Cheng, Y.; Yu, L.; Cracknell, A.P.; Gong, P. Oil palm mapping using Landsat and PALSAR: A case study in Malaysia. Int. J. Remote Sens. 2018, 37, 5431–5442. [Google Scholar] [CrossRef]
- Poortinga, A.; Tenneson, K.; Shapiro, A.; Nquyen, Q.; San Aung, K.; Chishtie, F.; Saah, D. Mapping plantations in Myanmar by fusing landsat-8, sentinel-2 and sentinel-1 data along with systematic error quantification. Remote Sens. 2019, 11, 831. [Google Scholar] [CrossRef] [Green Version]
- Oon, A.; Mohd Shafri, H.Z.; Lechner, A.M.; Azhar, B. Discriminating between large-scale oil palm plantations and smallholdings on tropical peatlands using vegetation indices and supervised classification of LANDSAT-8. Int. J. Remote Sens. 2019, 40, 7312–7328. [Google Scholar] [CrossRef]
- Shaharum, N.S.N.; Shafri, H.Z.M.; Ghani, W.A.W.A.K.; Samsatli, S.; Prince, H.M.; Yusuf, B.; Hamud, A.M. Mapping the spatial distribution and changes of oil palm land cover using an open source cloud-based mapping platform. Int. J. Remote Sens. 2019, 40, 7459–7476. [Google Scholar] [CrossRef]
- Daliman, S.; Rahman, S.A.; Bakar, S.A.; Busu, I. Segmentation of oil palm area based on GLCM-SVM and NDVI. In Proceedings of the 2014 IEEE Region 10 Symposium, Kuala Lumpur, Malaysia, 14–16 April 2014; pp. 645–650. [Google Scholar] [CrossRef]
- Morel, A.C.; Fisher, J.B.; Malhi, Y. Evaluating the potential to monitor aboveground biomass in forest and oil palm in Sabah, Malaysia, for 2000–2008 with Landsat ETM+ and ALOS-PALSAR. Int. J. Remote Sens. 2012, 33, 3614–3639. [Google Scholar] [CrossRef]
- Carolita, I.; Darmawan, S.; Permana, R.; Dirgahayu, D.; Wiratmoko, D.; Kartika, T.; Arifin, S. Comparison of Optic Landsat-8 and SAR Sentinel-1 in Oil Palm Monitoring, Case Study: Asahan, North Sumatera, Indonesia. In IOP Conference Series: Earth and Environmental Science; IOP Publishing: Bristol, UK, 2019; Volume 280, p. 012015. [Google Scholar] [CrossRef]
- Miettinen, J.; Gaveau, D.L.; Liew, S.C. Comparison of visual and automated oil palm mapping in Borneo. Int. J. Remote Sens. 2019, 40, 8174–8185. [Google Scholar] [CrossRef]
- Descals, A.; Szantoi, Z.; Meijaard, E.; Sutikno, H.; Rindanata, G.; Wich, S. Oil Palm (Elaeis guineensis) Mapping with Details: Smallholder versus Industrial Plantations and their Extent in Riau, Sumatra. Remote Sens. 2019, 11, 2590. [Google Scholar] [CrossRef] [Green Version]
- Nooni, I.K.; Duker, A.A.; Van Duren, I.; Addae-Wireko, L.; Osei Jnr, E.M. Support vector machine to map oil palm in a heterogeneous environment. Int. J. Remote Sens. 2014, 35, 4778–4794. [Google Scholar] [CrossRef]
- Sitthi, A.; Nagai, M.; Dailey, M.; Ninsawat, S. Exploring land use and land cover of geotagged social-sensing images using naive bayes classifier. Sustainability 2016, 8, 921. [Google Scholar] [CrossRef] [Green Version]
- Shaharum, N.S.N.; Shafri, H.Z.M.; Ghani, W.A.W.A.K.; Samsatli, S.; Al-Habshi, M.M.A.; Yusuf, B. Oil palm mapping over Peninsular Malaysia using Google Earth Engine and machine learning algorithms. Remote Sens. Appl. Soc. Environ. 2020, 17, 100287. [Google Scholar] [CrossRef]
- Mubin, N.A.; Nadarajoo, E.; Shafri, H.Z.M.; Hamedianfar, A. Young and mature oil palm tree detection and counting using convolutional neural network deep learning method. Int. J. Remote Sens. 2019, 40, 7500–7515. [Google Scholar] [CrossRef]
- Liu, M.; Wang, M.; Wang, J.; Li, D. Comparison of random forest, support vector machine and back propagation neural network for electronic tongue data classification: Application to the recognition of orange beverage and Chinese vinegar. Sens. Actuator B-Chem. 2013, 177, 970–980. [Google Scholar] [CrossRef]
- Breiman, L. Random forests. Mach. Learn. 2001, 45, 5–32. [Google Scholar] [CrossRef] [Green Version]
- Tan, K.P.; Kanniah, K.D.; Cracknell, A.P. Use of UK-DMC 2 and ALOS PALSAR for studying the age of oil palm trees in southern peninsular Malaysia. Int. J. Remote Sens. 2013, 34, 7424–7446. [Google Scholar] [CrossRef]
- Bergstra, J.; Bengio, Y. Random search for hyper-parameter optimization. J. Mach. Learn. Res. 2012, 13, 281–305. [Google Scholar] [CrossRef]
- Chapelle, O.; Vapnik, V.; Bousquet, O.; Mukherjee, S. Choosing multiple parameters for support vector machines. Mach. Learn. 2002, 46, 131–159. [Google Scholar] [CrossRef]
- Susanti, A. Oil Palm Expansion in Indonesia: Serving People, Planet and Profit? Eburon Academic Publishers: Utrecht, The Netherlands, 2016. [Google Scholar]
- Gorelick, N.; Hancher, M.; Dixon, M.; Ilyushchenko, S.; Thau, D.; Moore, R. Google Earth Engine: Planetary-scale geospatial analysis for everyone. Remote Sens. Environ. 2017, 202, 18–27. [Google Scholar] [CrossRef]
- Huang, H.; Chen, Y.; Clinton, N.; Wang, J.; Wang, X.; Liu, C.; Gong, P.; Yang, J.; Bai, Y.; Zheng, Y.; et al. Mapping major land cover dynamics in Beijing using all Landsat images in Google Earth Engine. Remote Sens. Environ. 2017, 202, 166–176. [Google Scholar] [CrossRef]
- Miettinen, J.; Liew, S.C.; Kwoh, L.K. Usability of Sentinel-1 dual polarization C-band data for plantation detection in insular Southeast Asia. In Proceedings of the 36th Asian Conference Remote Sensing, Manila, Philippines, 19–23 October 2015; pp. 19–23. [Google Scholar]
- Richardson, A.J.; Everitt, J.H. Using spectral vegetation indices to estimate rangeland productivity. Geocarto Int. 1992, 7, 63–69. [Google Scholar] [CrossRef]
- Jordan, C.F. Derivation of leaf-area index from quality of light on the forest floor. Ecology 1969, 50, 663–666. [Google Scholar] [CrossRef]
- Tucker, C.J.; Pinzon, J.E.; Brown, M.E.; Slayback, D.A.; Pak, E.W.; Mahoney, R.; Vermote, E.F.; El Saleous, N. An extended AVHRR 8-km NDVI dataset compatible with MODIS and SPOT vegetation NDVI data. Int. J. Remote Sens. 2005, 26, 4485–4498. [Google Scholar] [CrossRef]
- De Petris, S.; Boccardo, P.; Borgogno-Mondino, E. Detection and characterization of oil palm plantations through MODIS EVI time series. Int. J. Remote Sens. 2019, 40, 7297–7311. [Google Scholar] [CrossRef]
- Huete, A. A soil-adjusted vegetation index (SAVI). Remote Sens. Environ. 1988, 25, 295–309. [Google Scholar] [CrossRef]
- Haralick, R.M.; Shanmugam, K.; Dinstein, I.H. Textural features for image classification. IEEE Trans. Syst. Man Cybern. 1973, 6, 610–621. [Google Scholar] [CrossRef] [Green Version]
- Kee, Y.W.; Shariff, A.R.M.; Sood, A.M.; Nordin, L. Application of SAR data for oil palm tree discrimination. In IOP Conference Series: Earth and Environmental Science; IOP Publishing: Bristol, UK, 2018; Volume 169, p. 012065. [Google Scholar] [CrossRef]
- Bannari, A.; Morin, D.; Bonn, F.; Huete, A.R. A review of vegetation indices. Remote Sens. Rev. 1995, 13, 95–120. [Google Scholar] [CrossRef]
- Mohanaiah, P.; Sathyanarayana, P.; GuruKumar, L. Image texture feature extraction using GLCM approach. Int. J. Sci. Res. publications. 2013, 3, 1. [Google Scholar]
- Ulaby, F.T.; Kouyate, F.; Brisco, B.; Williams, T.L. Textural infornation in SAR images. IEEE Trans. Geosci. Remote Sens. 1986, 2, 235–245. [Google Scholar] [CrossRef]
- Chandrashekar, G.; Sahin, F. A survey on feature selection methods. Comput. Electr. Eng. 2014, 40, 16–28. [Google Scholar] [CrossRef]
- Breiman, L. Some properties of splitting criteria. Mach. Learn. 1996, 24, 41–47. [Google Scholar] [CrossRef] [Green Version]
- Wang, X.; Gong, G.; Li, N.; Qiu, S. Detection analysis of epileptic EEG using a novel random forest model combined with grid search optimization. Front. Hum. Neurosci. 2019, 13, 52. [Google Scholar] [CrossRef]
- Lee, J.S.H.; Wich, S.; Widayati, A.; Koh, L.P. Detecting industrial oil palm plantations on Landsat images with Google Earth Engine. Remote Sens. Appl. Soc. Environ. 2016, 4, 219–224. [Google Scholar] [CrossRef] [Green Version]
- Allouche, O.; Tsoar, A.; Kadmon, R. Assessing the accuracy of species distribution models: Prevalence, kappa and the true skill statistic (TSS). J. Appl. Ecol. 2006, 43, 1223–1232. [Google Scholar] [CrossRef]
- Jung, Y. Multiple predicting K-fold cross-validation for model selection. J. Nonparametr. Stat. 2018, 30, 197–215. [Google Scholar] [CrossRef]
- Miettinen, J.; Liew, S.C. Separability of insular Southeast Asian woody plantation species in the 50 m resolution ALOS PALSAR mosaic product. Remote Sens. Lett. 2011, 2, 299–307. [Google Scholar] [CrossRef]
- Wenwen, L.; Xiaoxue, X.; Fu, L.; Yu, Z. Application of improved grid search algorithm on SVM for classification of tumor gene. Int. J. Multimed. Ubiquitous Eng. 2014, 9, 181–188. [Google Scholar] [CrossRef]
- Karaboga, D.; Basturk, B. Artificial bee colony (ABC) optimization algorithm for solving constrained optimization problems. In International Fuzzy Systems Association World Congress; Springer: Berlin/Heidelberg, Germany, 2007; pp. 789–798. [Google Scholar]
- Dorigo, M.; Birattari, M.; Stutzle, T. Ant colony optimization. IEEE Comput. Intell. Mag. 2006, 1, 28–39. [Google Scholar] [CrossRef] [Green Version]


| Sensor | Landsat-8 | Sentinel-1A |
|---|---|---|
| Bands | Blue, Green, Red and Near Infrared(B2, B3, B4, B5) | Dual Polarization (VV, VH) |
| Sensor Type | Thermal Infrared Sensor (TIRS), Pushbroom | S1 Ground Range Detected Scenes |
| Spatial Resolution | 30 m | 10 m |
| Product Type | Top-of-Atmosphere Reflectance Images | Ground Range Detected Image |
| Group | Feature Combination |
|---|---|
| I | Spectral bands |
| II | Spectral bands and backscatter values |
| III | Spectral bands, backscatter values, vegetation indices and texture features |
| IV | Optimal subset of all bands and features |
| Feature Group | Feature Variables | Input Bands or Calculation | Reference |
|---|---|---|---|
| Blue | |||
| Spectral Bands | Green | ||
| Red | |||
| Near Infrared | |||
| SAR Backscatter | VV Polarization | ||
| VH Polarization | |||
| Difference | |||
| Ratio | |||
| Normalized Difference Index (NDI) | [38] | ||
| Vegetation Indices | Difference Vegetation Index (DVI) | [39] | |
| Ratio Vegetation Index (RVI) | [40] | ||
| Greenness Index (GI) | |||
| Normalized Difference Vegetation Index (NDVI) | [41] | ||
| Enhanced Vegetation Index (EVI) | [42] | ||
| Soil-Adjusted Vegetation Index (SAVI) | [43] | ||
| Texture Features | Contrast (CON) | [44] | |
| Angular Second Moment (ASM) | [44] | ||
| Entropy (ENT) | [44] | ||
| Correlation (COR) | [44] |
| Group | Feature Variables | Numbers of Features |
|---|---|---|
| I | Blue, Green, Red, Near Infrared | 4 |
| II | Blue, Green, Red, Near Infrared, VV, VH, Difference, Ratio, NDI | 9 |
| III | Blue, Green, Red, Near Infrared, VV, VH, Difference, Ratio, NDI, DVI, RVI, GI, NDVI, EVI, SAVI, CON, ASM, ENT, COR | 19 |
| IV | Most Relevant features | 15 |
Publisher’s Note: MDPI stays neutral with regard to jurisdictional claims in published maps and institutional affiliations. |
© 2021 by the authors. Licensee MDPI, Basel, Switzerland. This article is an open access article distributed under the terms and conditions of the Creative Commons Attribution (CC BY) license (http://creativecommons.org/licenses/by/4.0/).
Share and Cite
Xu, K.; Qian, J.; Hu, Z.; Duan, Z.; Chen, C.; Liu, J.; Sun, J.; Wei, S.; Xing, X. A New Machine Learning Approach in Detecting the Oil Palm Plantations Using Remote Sensing Data. Remote Sens. 2021, 13, 236. https://0-doi-org.brum.beds.ac.uk/10.3390/rs13020236
Xu K, Qian J, Hu Z, Duan Z, Chen C, Liu J, Sun J, Wei S, Xing X. A New Machine Learning Approach in Detecting the Oil Palm Plantations Using Remote Sensing Data. Remote Sensing. 2021; 13(2):236. https://0-doi-org.brum.beds.ac.uk/10.3390/rs13020236
Chicago/Turabian StyleXu, Kaibin, Jing Qian, Zengyun Hu, Zheng Duan, Chaoliang Chen, Jun Liu, Jiayu Sun, Shujie Wei, and Xiuwei Xing. 2021. "A New Machine Learning Approach in Detecting the Oil Palm Plantations Using Remote Sensing Data" Remote Sensing 13, no. 2: 236. https://0-doi-org.brum.beds.ac.uk/10.3390/rs13020236