Article

A Practical Satellite-Derived Vegetation Drought Index for Arid and Semi-Arid Grassland Drought Monitoring

1
State Key Laboratory of Remote Sensing Science, Aerospace Information Research Institute, Chinese Academy of Sciences (AIRCAS), Olympic Village Science Park, W. Beichen Road, Beijing 100101, China
2
China Aero Geophysical Survey and Remote Sensing Center for Nature Resources, Beijing 100083, China
3
National Remote Sensing Center, Information and Research Institute of Meteorology, Hydrology and Environment (IRIMHE), Ulaanbaatar 15160, Mongolia
*
Author to whom correspondence should be addressed.
Submission received: 14 December 2020 / Revised: 7 January 2021 / Accepted: 19 January 2021 / Published: 25 January 2021

Abstract

:
In semi-arid pasture areas, drought may directly influence livestock production, cause economic losses, and accelerate the processes of desertification along with destructive human activities (i.e., overgrazing). The aim of this article is to analyze the disadvantages of several drought indices derived from remote sensing data and develop a new vegetation drought index (VDI) for monitoring of grassland drought with high temporal frequency (dekad) and fine spatial resolution (1 km). The site-based soil moisture data from the field campaign in 2014 and the fenced biomass values at nine sites from 2000 to 2015 were adopted for validation. The results indicate that the proposed VDI would better reflect the extent, severity, and changes of drought compared with single drought indices or the vegetation health index (VHI); specifically, the VDI is more closely related to site-based soil moisture, with R human increasing to approximately 0.07 compared with the VHI; and with normalized fenced biomass (NFB) values, with average R human increasing to approximately 0.11 compared with the VHI. However, the correlations between VHI and VDI with NFB values are relatively lower in desert steppe regions. Furthermore, regional drought-affected data (RDA) are used to ensure spatial consistency of the evaluation; the VDI map is in good agreement with the RDA map based on field measurements. The presented VDI shows reliable and stable drought monitoring ability, which will play an important role in the future drought monitoring of inland grassland.

1. Introduction

Drought is a kind of natural disaster. Although drought processes occur gradually, they have a large impact range, long duration, and can occur repeatedly within a short time period, causing huge losses [1]. With the evolution of global warming, the frequency of drought has shown an obvious upward trend [2,3]. Most areas in the world experience droughts, especially in arid regions where the annual rainfall is mainly derived from a few rainfall events [4]. Two billion people worldwide and 41% of the earth are affected by drought to varying degrees [5].
Vegetation growth is affected by the changes in the thermal inertia of the soil and atmosphere, surface temperature, soil moisture, rainfall, and other related environmental variables. Satellite-based indices have been developed and used to effectively detect and identify drought worldwide. Satellite-derived environmental indices can reflect different agricultural drought conditions. Thermal inertia methods based on thermal infrared bands have been studied for drought detection [6,7]. Soil water content values derived from passive microwave brightness temperature data have been widely used for drought monitoring [8,9,10,11,12]. In addition, agricultural drought has been monitored through the changes of morphological and physiological indices, such as the normalized difference vegetation index (NDVI) and related indices improved by the NDVI [13,14,15,16,17]. Overall, a single drought index cannot define unique drought events, so combined indices were proposed in succession [18,19,20,21,22,23,24,25].
In the early studies, the scaled drought condition index (SDCI) was proposed [19] for agricultural drought monitoring in both arid and humid areas. Hao and Agha Kouchak [20] demonstrated more severe drought conditions when both precipitation and soil moisture were insufficient in California and North Carolina. In the same year, the integrated surface drought index (ISDI) was introduced by Wu et al. [21], composed of the NDVI, land surface temperature (LST), ecological zones, and Palmer drought severity index (PSDI) for drought monitoring in mid-eastern China. Different synthetic drought indices have been put forward, combining precipitation, LST, NDVI, leaf area index (LAI), evapotranspiration, and soil moisture measures through empirical weight, principal component analysis (PCA), and machine learning methods [21,22,23]. All of these indices were calculated in order to focus on drought research in different countries or regions. Further, the introduction of meteorological data could reduce the spatial representation of these indices.
Due to the influence of factors such as atmospheric circulation, soil type, and the crop or steppe growth period, the spatial and temporal characteristics of drought events are different; that is, satellite bands in different regions have different responses to drought conditions, and the degree of drought varies in different regions. The vegetation health index (VHI) has been widely applied in agricultural drought monitoring and assessment in many countries [13,26,27,28,29]. This is based on the inverse relationship between LST and NDVI. However, positive correlations have been found in evergreen forests, shrub areas, and high-latitude regions in Mongolia [26,30,31]. In such cases, the VHI is not suitable for drought monitoring. In addition, several researchers showed that the response of NDVI to soil moisture and drought was delayed [32,33,34,35]. Together, our previous studies have shown that the normalized difference water index (NDWI) can effectively reflect grassland drought, especially for forest steppe areas in Mongolia [36]. Thus, a novel drought model must be developed to detect drought events in arid and semi-arid grassland areas.
The main objective of this paper is to propose a new vegetation drought index (VDI) based on the combination of the vegetation conditions, temperature stress, and water deficit, which can be used for dekad drought detection with fine resolution, which would be better than the monthly or seasonal scales involved in previous investigations. More specifically, the dekad VDI was established based on the proposed water condition index (WCI), vegetation condition index (VCI), and temperature condition index (TCI) using the PCA method. Hereafter, comparisons with single indices and the VHI were conducted. Finally, the dekad drought results for the proposed VDI were verified using site-based soil moisture and fenced biomass values, as well as regional drought-affected data (RDA).

2. Study Area and Data

2.1. Study Area

The study area covers the whole of Mongolia and is located in Central Asia at 41°35′N to 52°09′N and 87°44′E to 119°56′E. It contains vast grass and shrub steppe grazing lands that can support a large number of grazing herbivores [37] (Figure 1). However, the ecosystems in Mongolia are susceptible to frequent natural disasters. As a result of climate change and global warming, the frequency and scale of natural disasters (drought, winter dzud disasters, and fires) tend to increase.

2.2. Data

The daily land surface reflectance and temperature data (named as MOD09GA and MOD11A1) were derived from the Moderate-Resolution Imaging Spectroradiometer (MODIS) on the TERRA satellite, which launched in December 1999 from the National Aeronautics and Space Administration (NASA) and can cover the Earth’s entire surface in one to two days. The data can be obtained from the National Aeronautics and Space Administration’s (NASA) Earth Observing System Data and Information System (EOSDIS; https://search.earthdata.nasa.gov/). In this paper, we directly synthesized the daily reflectance data and land surface temperature data into dekad according to data quality flags, while MOD09GA and MOD11A1 data from EOSDIS/NASA were also available in Google Earth Engine platform (GEE, https://code.earthengine.google.com/).
Field soil moisture values were measured using a time domain reflectometer (TDR 300) in a fixed experimental area located in Bayan Soum, Tuv province, Mongolia, as shown in the red box in Figure 1. The unit of soil moisture is represented as a volumetric percentage (%/%). Records were obtained for each dekad from the middle of June to late September in 2014. The field campaign comprised a 10 × 10 km region of the steppe zone. In total, 9 plots (1 × 1 km) were selected in the study area. There were 5 observation points (100 × 100 m) in each plot, and measurements were repeated three times. The design for the field sampling plan is shown in Figure 2. The soil moisture data from 12 and 20 cm depths were collected from collaboration experiments by the Information and Research Institute of Meteorology, Hydrology, and Environment (IRIMHE) and the Institute of Remote Sensing and Digital Earth, Chinese Academy of Sciences (RADI).
Fenced biomass (FB) data were taken from nine forage enclosure sites across Mongolia by the IRIMHE (Erdenemandal (EL), Bulgan (BN), Darkhan (DN), Dashbalbar (DR), Baruunurt (BT), Bogd (BD), Mandalgobi (MI), Dornogovi (DI), and Khanbogd (KD)). The unit of fenced biomass was g/m2. The reason for choosing these data sources was that the forage from those sites grows naturally and is not eaten by livestock, meaning the corresponding FB changes accurately reflect the changes and severity of drought events.
To select the optimal drought indices for Mongolia, the conventional field drought assessment data were referred to as the RDA data (also referred to as summer condition data by some researchers). RDA pixel values are obtained by IRIMHE each dekad according to an evaluation of the vegetation conditions of the growing season in Mongolia based on the plant growth, growth stage, and grassland productivity. Additionally, every 10 days, meteorological observers ask local herders and environmental officers about summer conditions. After this, assessment values are obtained via summary evaluation from the community in the county center based on multiple field observations. The appraisal RDA values from the IRIMHE range from 1 to 6: 1 = extreme drought; 2 = serious drought; 3 = moderate drought; 4 = slight drought; 5 = no drought (normal conditions); 6 = good conditions.
The land cover data were from 2010 Mongolia Land Cover Map produced by the Mongolian National Remote Sensing Center (NRSC) [38]. The Mongolian grassland was divided into forest steppe (FS), steppe (ST), and desert steppe (DS) zones, and the differences and changes of multiple drought results in different zones were analyzed.

3. Methodology

3.1. Single Drought Indices

Dozens of drought indices have been proposed by many researchers, which are mainly aimed at certain regions or periods, as described in the previous section. The VCI, TCI, and VHI based on AVHRR data were proposed by Kogan [13] for monitoring drought. Kogan [26] previously applied the VHI to drought detection and the derivation of pastoral biomass in Mongolia and found that the VHI could reflect grassland health status and the vegetation stress related to water and temperature during drought. Furthermore, Sheng’s [36] results indicated that the VHI and NDWI were considered to be the most appropriate for assessing drought characteristics and monitoring drought conditions in Mongolia. These indices can detect the time and process of drought occurrence and can allow quantification of drought severity under the given conditions.
The shortwave infrared reflectance (SWIR) is sensitive to the liquid water content of a leaf. By combined the near-infrared reflectance (NIR) and SWIR data, the water-sensitive indices (NDWI) for monitoring drought occurrences were presented. The existing research results showed that the NDWI is very sensitive to changes in vegetation water and soil moisture, which are closely related to the vegetation drought status of the grassland and cropland regions of the Oklahoma Mesonet [39].
In addition, the NDWI is an effective drought index in Mongolian grassland areas, especially for FS and ST zones [40]. Previous researchers [16,39,40] also reached similar conclusions—the NDWI could reflect changes in soil moisture and vegetation water information, showing a faster response to drought than the NDVI. The NDWI could be affected by short-term or long-term ecosystem changes and climate differences and cannot be directly compared in time and space. Therefore, we proposed a new water condition index (named the WCI) based on the NDWI, which uses similar equations to VCI and TCI. The drought index formulas are as follows.
VCI i = ( NDVI i NDVI min ) / ( NDVI max NDVI min )
TCI i = ( LST i LST min ) / ( LST max LST min )
VHI i = 0.5 VCI i + 0.5 TCI i
WCI i = ( NDWI i NDWI min ) / ( NDWI max NDWI min )
where i is a certain dekad; VCI i is the vegetation condition index in a certain dekad; NDVImax and NDVImin are the historical maximum and minimum values of the NDVI, respectively; TCI i is the temperature condition index in a certain dekad; LSTmax and LSTmin are the historical maximum and minimum values of the LST, respectively. WCI i is the moisture condition index in a certain dekad; NDWImax and NDWImin are the maximum and minimum values of the NDWI on the long-term sequence, respectively. The larger the WCI is, the better the moisture conditions are, and the fewer droughts occur; on the contrary, the smaller the WCI is, the more serious the drought is.

3.2. Vegetation Drought Index (VDI)

The VHI, composed of the TCI and VCI, expressed drought changes based on the negative relations between the NDVI and LST [13]. However, positive correlations were found by Karnieli et al. [30]. They demonstrated that the slope of the LST and NDVI in Mongolia had changed, and that the positive slope appeared in the northern part of the country, indicating that higher temperatures will not stop grass growth; in contrast, they may promote growth, while TCI is not an effective index for such conditions. The advantages of the NDWI mentioned above (Section 3.1) can complement the TCI’s shortcomings for such conditions. In addition, spatial variety occurred in terms of the drought characteristics, and drought reflected by the same index were different from the variable steppe zones. Thus, the new drought index named the VDI was proposed by combining the VCI, WCI, and TCI in different steppe zones.
Pearson’s correlation coefficient (R) can take any value from −1 to +1. A correlation coefficient of 1 would indicate a perfect positive correlation (both values increasing together,) whereas a correlation coefficient of −1 indicates a perfect negative correlation. Generally, this can be divided into three levels: |r| < 0.4 = low degree of correlation; 0.4 ≤ |r| < 0.7 = significant correlation; 0.7 ≤ |r| < 1 = high correlation [41,42]. Here, a threshold of −0.4 was employed to distinguish whether there was a significant correlation or not between NDVI and LST in this paper. The relationships between them for each pixel derived from the time series data from 2000 to 2019 were produced. When the value was more than −0.4, this meant that there was no negative significant relation between NDVI and LST, and TCI is not suitable for drought monitoring. The WCI and VCI were used to detect drought. When the value was less than −0.4, the combination of VCI, WCI, and TCI were used for the VDI construction.
The combination of multiple indices is based on a quantitative approach that assigns a weight to each input parameter using the PCA method [43,44]. In this study, the contribution of each input parameter (VCI, WCI, and TCI) was used as the weight or coefficient of the VDI, which was estimated by using a similar PCA method. The input parameters were taken from data from multiple years over the period of 2000 to 2019. The whole principal component transformation process was finished by using an Interactive Data Language (IDL). Firstly, input parameters in each pixel were standardized to enhance the spatial comparison of each parameter. Then, the correlation coefficient matrix was developed using the standardized time series values of input parameters, which can be used to calculate the eigenvectors and establish the relationship between the principal components and the original input parameters. The variance contribution rate of each principal component was calculated and taken as the weight, then the weighted average of the principal component loading was assessed to determine the weight of each parameter of each pixel. When the relationship between the NDVI and LST was less than −0.4, the three input parameters were VCI, WCI, and TCI. When the relationship between the NDVI and LST was more than −0.4, the two input parameters were VCI and WCI. Finally, the pixel-based weights of each parameter were averaged into three steppe zones, then these weights were further normalized into a value ranging from 0 to 1. The normalized weights for each input parameter are shown in Table 1, which were taken as coefficients of proposed VDI model (Equation (5)).
VDI i = { a × VCI + b × WCI + c × TCI ( R NDVI & LST 0.4 ) d × VCI + e × WCI ( R NDVI & LST > 0.4 )
where i is steppe zone, R NDVI & LST is the correlation between the NDVI and LST; a, b, c, d, and e are the coefficients of the VDI.
The classification criteria for the TCI, VCI, WCI, VHI, and VDI are same, which are divided into five levels: extreme drought, severe drought, moderate drought, mild drought, and no drought (as shown in Table 2). According to the color identifier (RGB value) for each drought severity level defined in this table, we could draw and generate drought spatial distribution map.

3.3. Pearson Correlation Coefficient

It is very necessary and important to evaluate the results (pixels) of remote sensing models using in situ reference data (points) when it is difficult to obtain regional ground truth drought data. Pearson’s correlation coefficient (R) usually represents the correlation between two variables, which can be used to evaluate the performance of the model. In this paper, the novel VDI was evaluated using field soil moisture and NFB values. The dekad soil moisture was introduced in Section 2.2, whereby 5 observation points and three repeated points in each plot were averaged into one soil moisture value, with 9 plots (1 × 1 km) being used for corresponding satellite-derived drought indices with the same resolution. A total of 8 dekads of soil moisture were obtained, while 72 dekads of soil moisture were available. The corresponding pixel values of satellite-derived drought indices were extracted by each plot’s coordinate range. The time series of FB datasets for the nine sites was relatively long, ranging from 2000 to 2015, which is convenient for obtaining stable normalized fenced biomass (NFB) values.

3.4. Spatial Consistency

In this study, we established a field drought distribution map based on field-derived RDA data and compared it with the remote sensing drought map to evaluate the spatial distribution differences and the consistency of the temporal variation between them. The inverse distance weighting (IDW) method was adopted by IRIMHE to convert the in situ RDA data to a 1 km grid format to create a spatial distribution map of field drought [38]. The distribution maps of remotely sensed drought indices were produced using ArcGIS 10.0 software. This was used to determine whether remotely sensed drought indices and RDA data exhibited consistent spatial distributions and temporal fluctuations at large scales and at the county level.

4. Results

4.1. Drought Distribution Maps for Typical Years

The RDA map was occupied as a reference drought to evaluate the new synthetic drought index, i.e., the VDI. Mongolia experienced heavy drought in 2002 and mild or moderate drought in 2003 and 2004. The spatial drought characteristics of the VDI, TCI, VCI, WCI, and VHI were compared using reference RDA data from 2002 to 2004. These indices were classified according to the drought severity criteria listed in Table 2. The similarities and discrepancies were clearly reflected through the drought distribution maps shown in Figure 3. In addition, RS-derived drought indices provided more detailed drought information than RDA data because of the higher spatial resolution (1 × 1 km).
Generally speaking, as shown in all indices, the drought was serious in July 2002, while the drought in 2003 was milder than that in 2002 and 2004. The TCI indicated that most areas had severe drought, which was different from the drought degree of the RDA map for the north, east, and west. The drought extent indicated by the TCI was heavier than that in 2002. The VCI indicated that severe drought occurred in some central areas in 2003 and 2004, showing few moderate and mild droughts; additionally, the eastern and southern regions were less affected. In the northern and eastern regions, the WCI was consistent with RDA map and similar to the VCI distribution in other regions. With regard to the VHI and VDI, the consistency was higher with the RDA map, and the latter was more consistent with RDA map in the eastern, central, and southern regions in 2003 and 2004. In general, the proposed VDI could provide a coherent description of the field-based drought conditions throughout Mongolia.
Figure 4, Figure 5 and Figure 6 show the drought depictions based on the VDI and VHI in three provinces (Arhangay, Suhbaatar, and Omnogovi provinces) from 2002 to 2004, and compares them with the spatial patterns from the RDA map. In Arhangay, most of the regions experienced severe drought in 2002 (Figure 4). Generally, similar drought distributions can be observed for the VDI, VHI, and RDA map. Differences can be found in west border, whereby the RDA map illustrated drought in that area, but no drought was indicated by the VDI and VHI. The VHI showed severe drought, while moderate drought was found by the VDI and RDA in the eastern region. In 2003 and 2004, the differences were not significant for VDI and RDA, while VHI showed less drought than VDI and RDA. The western drought of 2004 shown by the RDA was not presented by the VHI, while the VDI with mild drought.
Figure 5 shows that the Suhbaatar province experienced drought changes from 2002 to 2004. The VHI and VDI had similar drought distributions in 2002 and 2003. The drought in 2002 was shown by the RDA as a slight drought, while the VDI and VHI showed a partly severe drought. For the drought in 2003, inverse results were shown, with the RDA indicating a more severe drought than the VDI and VHI. The VDI’s drought pattern was consistent with the RDA map, but the VHI showed mild drought. Severe drought occurred in the southwest of Suhbaatar according to the VDI and RDA maps, while the VHI demonstrated mild drought.
Drought occurrence in the Omnogovi province demonstrated a similar spatial distribution in 2002, as shown in Figure 6. The VDI and VHI precisely detected the drought region from the RDA map. In 2003. “no drought” was indicated by the VHI and RDA, while the VDI showed few drought events. The RDA demonstrated heavy drought in the mid-northern region, but almost no drought was shown by the VDI and VHI in 2004.
In general, the spatial distributions of drought were more consistent between the VDI and RDA than with the VHI. Temporal changes of drought from 2002 to 2004 were detected by the VDI, VHI, and RDA. However, some regional differences still existed when viewing fine comparison analysis of them.

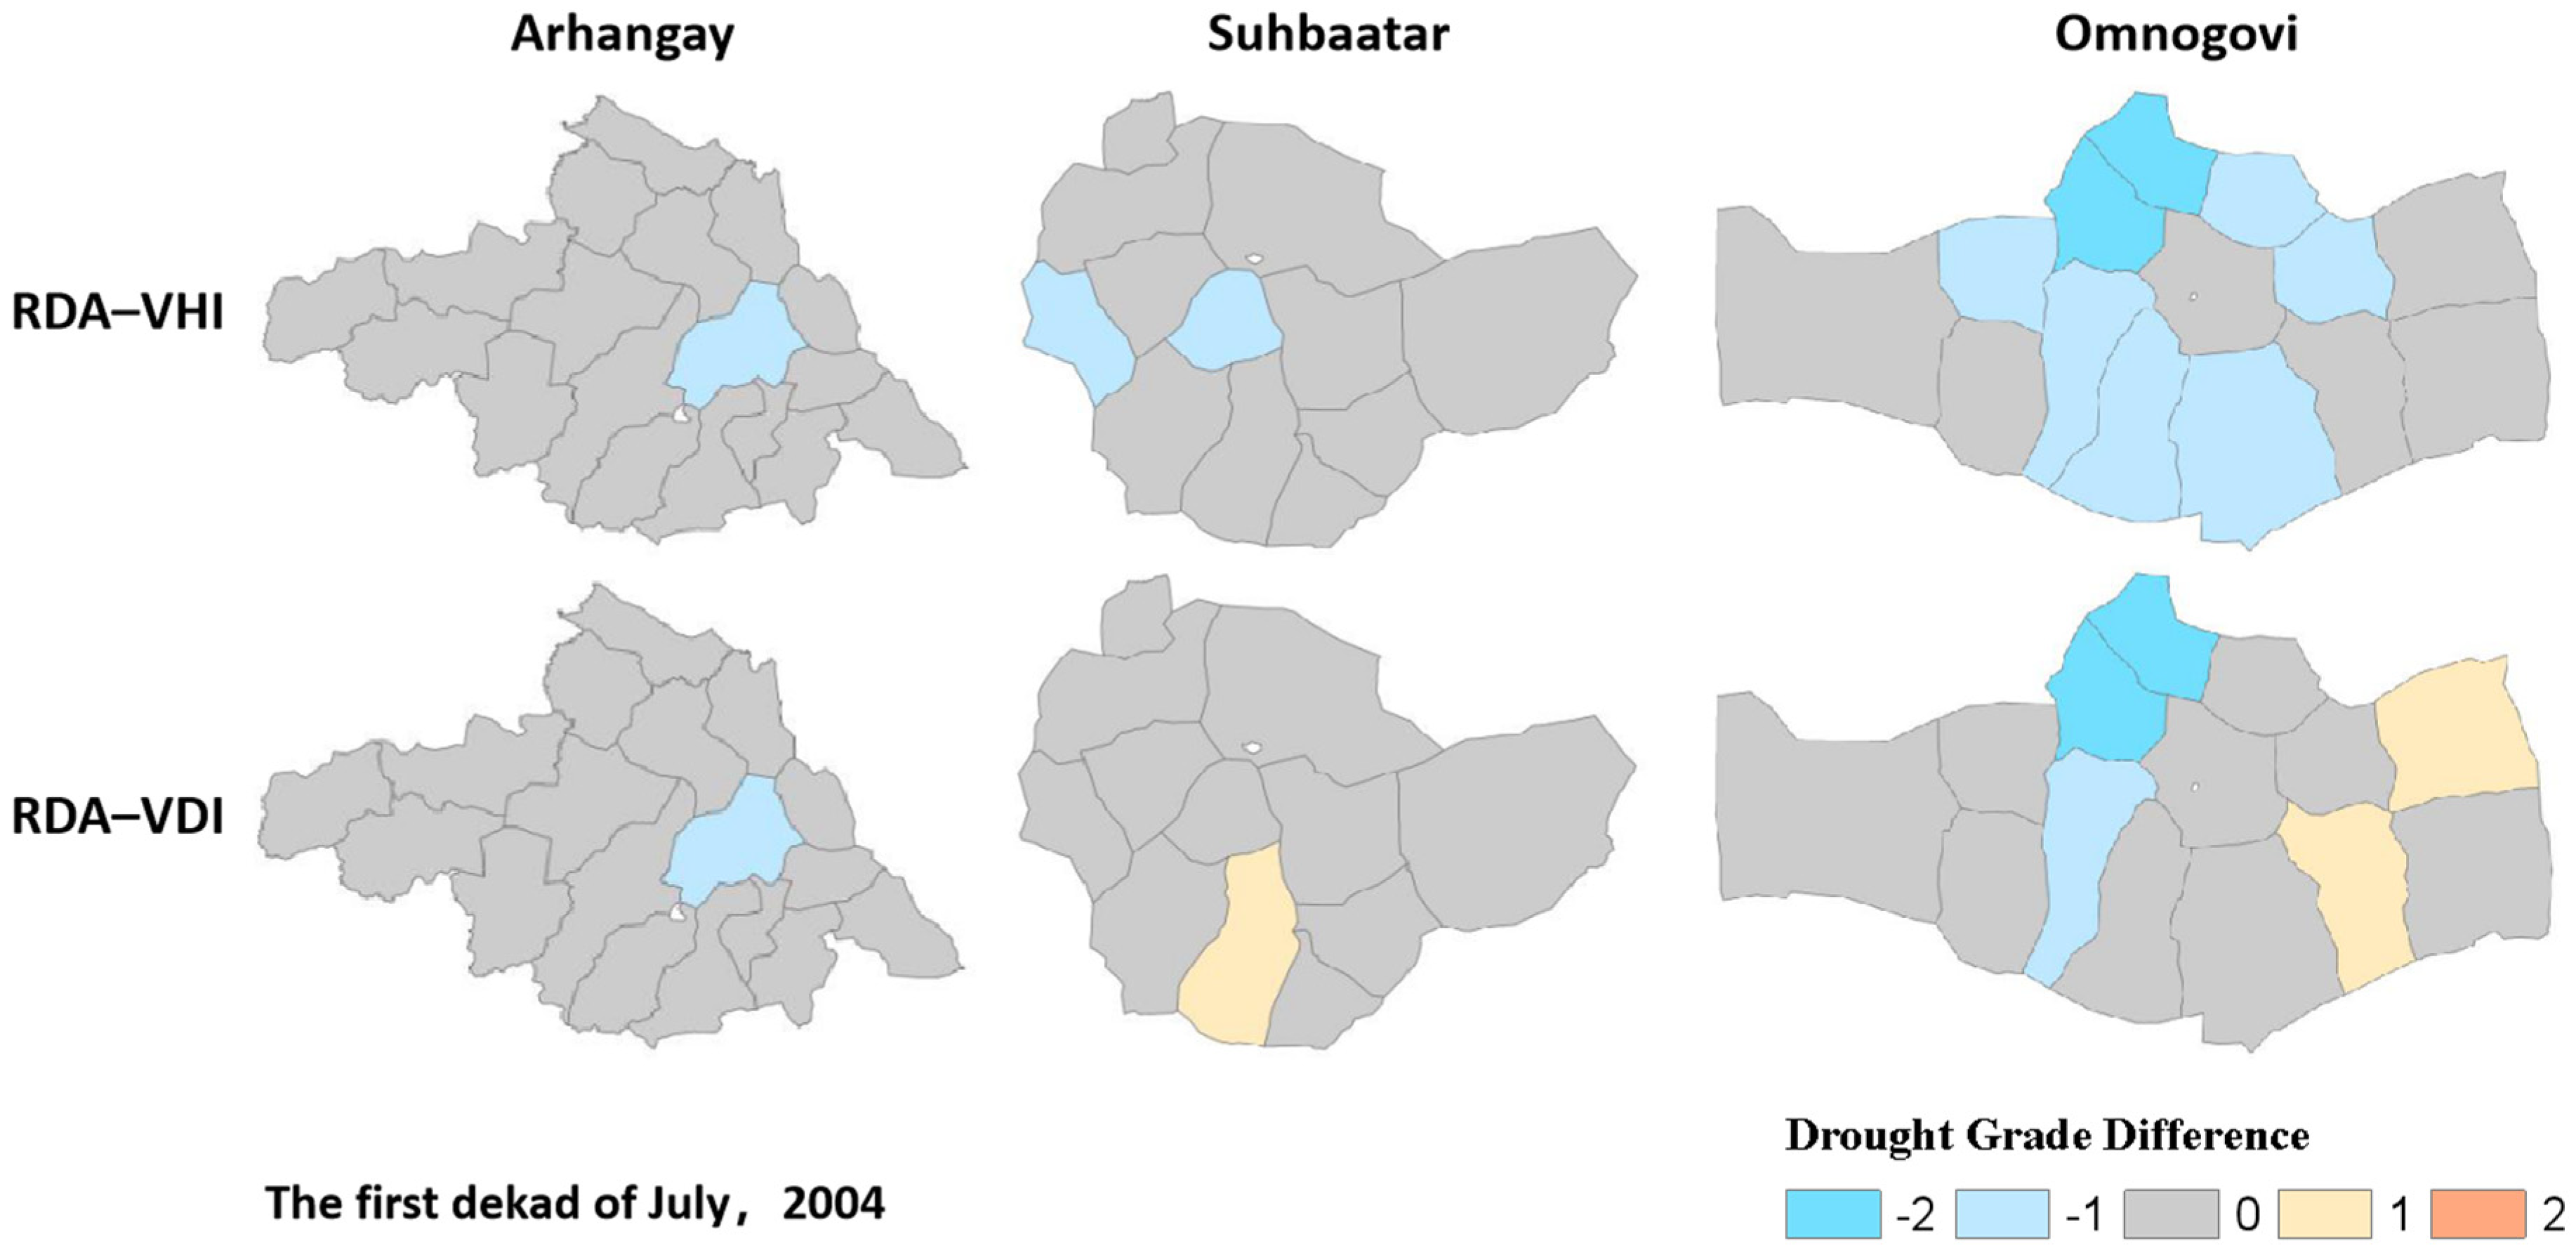
4.2. Validation by RDA at the County Level

Multiple RDAs of each county were averaged with regional characteristics, so they were used to evaluate the VDI at the county level. The grid VDI and VHI values were averaged in each county, then classified into 5 grades according to the criteria in Table 2. Averaged VDI and VHI values in each county were limited to scores of 1 to 5: 1 = extreme drought; 2 = serious drought; 3 = moderate drought; 4 = slight drought; 5 = no drought. We combined IRIMHE’s last two classes (as seen in Section 2.2) into one, denoted the “no drought” class. In this case, the averaged VDI and VHI were comparable to the averaged RDA. The drought grade differences between the RDA and VDI (VHI) were used to validate the performance of the VDI and VHI at the county level. If the difference was equal to 0, this meant that results were consistent. Otherwise, the VDI or VHI showed either greater or lesser extent of drought than RDA.
The drought grade differences for the VHI, VDI, and averaged RDA at the county level from 2002 to 2004 (first dekad of July) for three typical provinces are shown in Figure 7. The three typical provinces mentioned before included 42 counties, which were adapted to carry out further analysis. For the severe drought year in 2002, inconsistencies between the averaged VHI and RDA were found in 11 out of 18 counties, while inconsistencies between the VDI and RDA were found in 5 counties for Arhangay province. The drought grade difference for the VHI and RDA in one county (orange color marked in Figure 7) was up to 2, but no bias existed in the corresponding VDI and RDA. Similarly, the VDI exceeded the VHI for Omnogovi province, whereby 4 counties showed differences between the VDI and RDA. The averaged VDI had slightly better consistency than the VHI for Suhbaatar province. Drought was detected in 74% of counties by VDI and 50% of counties for VHI, which was a significant improvement.
We carefully analyzed the lower drought years of 2003 and 2004 (Figure 8 and Figure 9), in which less drought events occurred in the three typical provinces. Both the VHI and VDI showed good performance in 2003. The VDI’s consistency with the RDA was higher than the VHI. Drought was detected in more than 90% of counties by the VDI and in more than 83% of counties by the VHI. The advantages of the VDI are not very obvious. In 2004, the same results occurred for Arhangay province. For the other two provinces, the consistency between the VDI and RDA was slightly better than with the VHI. The consistency level was 83% for the VDI and 74% for the VHI.
Considering the difference changes from 2002 to 2004, the consistency rates were 74%, 90%, and 83% for the VDI (50%, 83%, and 74% for the VHI), which showed that the changes were the smallest in the heavy drought year of 2002 compared with mild or moderate years (2003 and 2004). It seems that there is still potential for improvement in the ability to detect severe droughts.

4.3. Validation by Field Soil Moisture

A soil moisture deficit will cause drought changes and then affect vegetation growth. The field soil moisture reflects the environmental water supply and was used as a reference to validate the proposed VDI. To demonstrate the performance of the VDI for agricultural drought monitoring, the relationship between dekad VDI (as well as TCI, VCI, WCI, and VHI) and dekad field soil moisture observations at soil depths of 12 and 20 cm were quantified, as shown in Figure 10. The results showed that there were significant correlations among the field soil moisture and drought indices, all at the 0.01 significance level. As shown in Figure 6, the correlations between drought indices and field soil moisture at the 12 cm depth were greater than that at the 20 cm depth. This is because in arid and semi-arid areas, the RS-derived drought indices are more sensitive to upper soil moisture (12 cm).
Specifically, Figure 6 shows that at the same depth of 12 cm, the correlation between the TCI and soil moisture was the lowest, while that between the VDI and soil moisture was the highest, reaching 0.66. The WCI had slightly higher correlation with the field soil moisture compared with the VCI (0.65 to 0.63), while the correlation of VHI and soil moisture was 0.59. Another comparison showed that the five drought indices (TCI, VCI, WCI, VHI, and VDI) had lower correlations with soil moisture at a depth of 20 cm than at 12 cm, while the highest R correlation was for the VDI and soil moisture at 0.60. Overall, the VDI was more sensitive to soil moisture than the VHI, and the R increase was up to about 0.10. This result means that the proposed VDI with the added WCI information better identified the soil moisture changes than the VHI.
Because soil moisture typically cannot be used by vegetation or grass immediately, there is a lag from a change in water level to a vegetation response. Some results showed that the vegetation variations indicated by the NDVI were lagged responses to soil moisture [35]. We also examined the correlation coefficients between field soil moisture and the RS-derived drought indices calculated with one dekad lag. As shown in Figure 10, the soil moisture one dekad ahead was more closely related to the current drought index than the current soil moisture, and an increasing R was demonstrated. For the 12 cm depth, the R increased from 0.66 to 0.78; for the 20 cm depth, the R increased from 0.60 to 0.70 for the VDI. The lag effect was determined according to these results. However, when we carefully studied and observed the changes of the relationships among TCI, VCI, and WCI in Figure 6, it seems that the main contribution was from the TCI, with the R value increasing from 0.44 to 0.68 at 12 cm depth and 0.39 to 0.62 at 20 cm depth. The correlations showed little change between the VCI or WCI and soil moisture compared to soil moisture one dekad ahead (R values for the VCI ranged from 0.63 to 0.65 at 12 cm depth; R values for the WCI ranged from 0.65 to 0.67 at 12 cm depth). Similar results can be found for the 20 cm depth. In other words, the lag effect of the vegetation index on soil moisture was not obvious for the VCI or WCI at the one-dekad scale. One possible explanation is that the time scale of drought indices was a dekad, while field soil moisture values came from a certain day; the dekad average for the VCI and WCI weakened the time change information, while dekad average for the TCI indicated a faster response to soil moisture changes. The daily drought products of satellite images need to be further studied.

4.4. Validation by Normalized Fenced Biomass (NFB)

The unfenced biomass was presented by Sheng [36] for drought index evaluation; however, it included the biomass change caused by livestock grazing, which would impact the comparison results. The FB obtained from the grasses in the enclosed area grew naturally and was not eaten by livestock; therefore, the corresponding biomass changes can better describe real drought situations. The FB was normalized to the NFB, which was similar method to the normalized biomass indicator in a previous paper [36]. FB data (2000–2015) for the nine enclosed pasture sites in the country (locations shown in Figure 1) were selected and used to accurately evaluate the proposed drought index. Pearson’s correlation coefficient (R) was used to represent the VDI performance with NFB changes.
The correlations of NFB with the TCI, VCI, WCI, and VHI and VDI from 2000 to 2015 are shown in Table 3. The correlations between the VCI and NFB were high in five of nine sites, with R values ranging from 0.53 to 0.71. the WCI shows the same performance and had strong relationships in five out of nine sites (from 0.57 to 0.72). For the single drought indices, the R values for the DS site were low, especially at the Dornogovi site, with a maximum R value of 0.27. Therefore, the VCI and WCI gave better expressions of vegetation information changes caused by drought. These results also confirm the point proposed in this study that the introduction of the WCI can improve the accuracy and stability of drought monitoring.
Further, to compare the VHI and VDI, the correlation between the VDI and NFB was significantly higher than that of the VHI (average R value increased by about 0.11 overall), especially for FS and ST sites, as shown in Figure 11. However, for the DS site, the increase was not obvious, the correlations between each index and the NFB were relatively small, especially for DI and KD sites, and the maximum correlation coefficient was 0.36. The correlations between the VDI and NFB were slightly higher than those between the VHI at DI and KD sites.

5. Discussion

The proposed VDI can detect grassland drought effectively and stably with good performance. However, some uncertainties and limitations must be explained and clarified. For NDVI- and NDWI-based indices, it is a challenge to identify grassland drought events in very sparse and dry vegetation areas (i.e., the DS region in southern Mongolia). The soil background information was included in optical satellite observations [40] and the NDVI and NDWI values found in this study were very low. In such cases, the VCI and WCI may contain large uncertainties, which need to be considered and studied in depth.
Regarding the cause of the poor correlation between the VDI and NFB in the desert steppe, we returned and extracted NDVI, NDWI, LST, and FB data for the three desert sites over 16 years, the statistical results for which are shown in Table 4. We found that vegetation coverage was poor (the maximum values were 0.23, 0.22, and 0.17, respectively) and that there were no significant fluctuations, even during the grass growth period. This is a regional characteristic of grassland in southern Mongolia, a region that is an arid desert with annual precipitation of less than 100 mm (or even 50 mm) [43]. Increases of the LST enhance evaporation and lead to decreases of vegetation. Water and soil information are the main factors limiting the growth of grassland. In Figure 8, the very dry grassland areas showed negative NDWI values most of the time. These results indicates that the proposed VDI is not suitable for the DS region, because the NDVI is very low and the NDWI is negative.
The low NDVI, NDWI, and biomass values, together with the water deficit, indicated that the vegetation status and temperature index cannot identify grassland drought well in a few grassland regions with coarse pixels (1 × 1 km). This result further explains the low correlations between drought indices and NFB at the DS site (shown in Figure 12). Higher-resolution remote sensing and soil moisture data are of great significance for drought monitoring in arid DS regions. This will be the purpose and focus of our future research.
The developed VDI is based on arid and semi-arid grasslands, but other land cover types and regions might be different and may need further investigation.
Additionally, the ST validation site area is approximately 10 × 10 km, and the VDI results need to be verified in larger areas or in different climatic regions in further research. Unfortunately, although field soil moisture values are necessary to verify the performance of the VDI, it is not possible to determine the field soil moisture in the northern FS area. Another improvement would be to obtain more point soil moisture values in a pixel to reduce the error of the point representing the pixel value. Regional soil moisture observation instruments, such as cosmic ray neutron sensing [45] or ground-penetrating radar (GPR) [46], are very feasible and reliable solutions.

6. Conclusions

Based on the inverse relationship between the LST and vegetation status (chlorophyll and water contents) corrected by the WCI in conditions of no negative correlation between NDVI and LST, together with the spatial heterogeneity description of drought indices with agro-climatic zone data, a new vegetation drought index VDI was proposed. Compared with the existing drought indices, the advantages of the proposed VDI were visible.
Then, the new index was validated and evaluated using filed-based NFB, soil moisture, and RDA results. The results showed that the performance of the dekad VDI was superior to the previous indicators (TCI, VCI, WCI, and VHI) in terms of correlation and spatial consistency. The VDI can accurately monitor the dekad drought changes in the grassland areas in arid and semi-arid environments. Compared with the VHI, the new index is more closely sensitive to site-based soil moisture at 12 cm depth, with R values increasing from 0.59 to 0.66; and to site-based NFB, with average R values increasing from 0.44 to 0.55. However, the performance of the VDI in DS areas was slightly poorer. The VDI map was in good agreement with the RDA map from field measurements generally. To further improve the efficiency and universality of the VDI, extensive validation and soil moisture results derived from microwave data should be considered in future research.

Author Contributions

S.C. designed and performed the study. B.W. supervised the research and outlined the methods. H.C. wrote parts of the results and discussions sections and revised the manuscript. N.Y., E.N., and B.D. collected and preprocessed the field data. All authors have read and agreed to the published version of the manuscript.

Funding

This work was funded by the National Key R&D Program of China (2017YFE0122700), the National Natural Science Foundation of China (41901308), and the Mongolia Drought Monitoring Mechanism project of the United Nations Economic and Social Commission for Asia and the Pacific (UN-ESCAP).

Data Availability Statement

Data available on request due to restrictions eg privacy or ethical.

Acknowledgments

Great help was provided by the Information and Research Institute of Meteorology, Hydrology, and Environment (IRIMHE), Mongolia. The authors give thanks to cooperative help from the IRIMHE of Mongolia, including from S. Khudulmur, Odbayar Mishigdorj, Gantsetseg Batdelger, Ganbat Bavuudorj, and Barkhas Badam. They provided considerable meteorological data and field observation data. Keran Wang (division head of UN-ESCAP), Yejin Ha, Guoxiang Wu, and Kelly Hayden from UN-ESCAP provided help with project implementation and valuable advice, and our thanks are extended to all of them for their contributions.

Conflicts of Interest

The authors declare no conflict of interest.

References

  1. Li, X.M.; Yang, W.F.; Yang, X.L.; Li, Y.L. Sensitivity analysis of drought indices used in Shaanxi Province. J. Desert Res. 2009, 29, 342–347. [Google Scholar]
  2. Guo, S.J. The meteorological disaster risk assessment based on the diffusion mechanism. J. Risk Analy. Crisis Res. 2012, 2, 124–130. [Google Scholar] [CrossRef] [Green Version]
  3. Dai, A. Drought under global warming: A review. Wiley Interdiscip. Rev. Clim. Chang. 2011, 2, 45–65. [Google Scholar] [CrossRef] [Green Version]
  4. Giannakopoulos, C.; Sager, P.L.; Bindi, M.; Moriondo, M.; Kostopoulou, E.; Goodess, C.M. Climatic changes and associated impacts in the Mediterranean resulting from a 2 °C global warming. Glob. Planet. Chang. 2009, 68, 209–224. [Google Scholar] [CrossRef]
  5. Available online: https://www.huanbao-world.com/zrzy/lyky/161100.html (accessed on 10 December 2020).
  6. Carlson, T.N.; Gillies, R.R.; Perry, E.M. A method to make use of thermal infrared temperature and NDVI measurements to infer surface soil water content and fractional vegetation cover. Remote Sens. Rev. 1994, 9, 161–173. [Google Scholar] [CrossRef]
  7. Tao, Y.; Guoliang, T. Studying the surface soil moisture change by thermal inertia method. J. Remote Sens. 1997, 1, 24–31. [Google Scholar]
  8. Njoku, E.G.; Entekhabi, D. Passive microwave remote sensing of soil moisture. J. Hydrol. 1996, 184, 101–129. [Google Scholar] [CrossRef]
  9. Shi, J.; Wang, J.; Hsu, A.Y.; O’Neill, P.E.; Engman, E.T. Estimation of bare surface soil moisture and surface roughness parameters using L-band SAR image data. IEEE Trans. Geosci. Remote Sens. 1997, 35, 1254–1266. [Google Scholar]
  10. Romshoo, S.A. Geo statistical analysis of soil moisture measurements and remotely sensed data at different spatial scales. Environ. Geol. 2004, 45, 339–349. [Google Scholar] [CrossRef]
  11. Naumann, G.; Barbosa, P.; Carrao, H.; Singleton, A.; Vogt, J. Monitoring drought conditions and their uncertainties in Africa using TRMM data. J. Appl. Meteorol. Climatol. 2012, 51, 1867–1874. [Google Scholar] [CrossRef] [Green Version]
  12. De Jesús, A.; Breña-Naranjo, J.A.; Pedrozo-Acuña, A.; Yamanaka, V.H.A. The Use of TRMM 3B42 Product for Drought Monitoring in Mexico. Water 2016, 8, 325. [Google Scholar] [CrossRef]
  13. Kogan, F.N. Application of Vegetation Index and Brightness Temperature for Drought Detection. Adv. Space Res. 1995, 15, 91–100. [Google Scholar] [CrossRef]
  14. Ji, L.; Peters, A. Assessing vegetation response to drought in the northern Great Plains using vegetation and drought indices. Remote Sens. Environ. 2003, 87, 85–98. [Google Scholar] [CrossRef]
  15. González-Alonso, F.; Cuevas, J.M.; Calle, A.; Casanova, J.L.; Romo, A. Drought monitoring in Spain during the period 1987-2001, using NOAA-AVHRR images. In Proceedings of the 22nd Symposium of the European Association of Remote Sensing Laboratories, Prague, Czech Republic, 4–6 June 2002. [Google Scholar]
  16. Gao, B.C. NDWI-A Normalized Difference Water Index for remote sensing of vegetation liquid water from space. Remote Sens. Environ. 1996, 58, 257–266. [Google Scholar] [CrossRef]
  17. Lyon, B.; Bell, M.A.; Tippett, M.K.; Kumar, A.; Hoerling, M.P.; Quan, X.-W.; Wang, H. Baseline probabilities for the seasonal prediction of meteorological drought. J. Appl. Meteorol. Climatol. 2012, 51, 1222–1237. [Google Scholar] [CrossRef]
  18. Ghulam, A.; Qin, Q.; Teyip, T.; Li, Z. Modified perpendicular drought index (MPDI): A real-time drought monitoring method. ISPRS J. Photogramm. Remote Sens. 2007, 62, 150–164. [Google Scholar] [CrossRef]
  19. Rhee, J.; Im, J.; Carbone, G.J. Monitoring agricultural drought for arid and humid regions using multi-sensor remote sensing data. Remote Sens. Environ. 2010, 114, 2875–2887. [Google Scholar] [CrossRef]
  20. Hao, Z.; AghaKouchak, A. Multivariate standardized drought index: A parametric multi-index model. Adv. Water Resour. 2013, 57, 12–18. [Google Scholar] [CrossRef] [Green Version]
  21. Jianjun, W.; Lei, Z.; Ming, L.; Zhang, J.; Leng, S.; Diao, C. Establishing and assessing the Integrated Surface Drought Index (ISDI) for agricultural drought monitoring in mid-eastern China. Int. J. Appl. Earth Obs. Geoinf. 2013, 23, 397–410. [Google Scholar]
  22. Sánchez, N.; González-Zamora, Á.; Piles, M.; Martínez-Fernández, J. New Soil Moisture Agricultural Drought Index (SMADI) Integrating MODIS and SMOS Products: A Case of Study over the Iberian Peninsula. Remote Sens. 2016, 8, 287. [Google Scholar] [CrossRef] [Green Version]
  23. Jiao, W.; Tian, C.; Chang, Q.; Novick, K.A.; Wang, L. A new multi-sensor integrated index for drought monitoring. Agric. For. Meteorol. 2019, 268, 74–85. [Google Scholar] [CrossRef] [Green Version]
  24. Sepulcre-Canto, G.; Vogt, J.; Arboleda, A.; Antofie, T. Assessment of the EUMETSAT LSA-SAF evapotranspiration product for drought monitoring in Europe. Int. J. Appl. Earth Obs. Geoinf. 2014, 20, 190–202. [Google Scholar] [CrossRef]
  25. Zhang, L.; Jiao, W.; Zhang, H.; Huang, C.; Tong, Q. Studying drought phenomena in the Continental United States in 2011 and 2012 using various drought indices. Remote Sens. Environ. 2017, 190, 96–106. [Google Scholar] [CrossRef]
  26. Kogan, F.N.; Stark, R.; Gitelson, A.; Jargalsaikhan, L.; Dugrajav, C.; Tsooj, S. Derivation of pasture biomass in Mongolia from AVHRR-based vegetation health indices. Int. J. Remote Sens. 2004, 25, 2889–2896. [Google Scholar] [CrossRef]
  27. Unganai, L.S.; Kogan, F.N. Drought monitoring and corn yield estimation in Southern Africa from AVHRR data. Remote Sens. Environ. 1998, 63, 219–232. [Google Scholar] [CrossRef]
  28. Yan, N. Research on Agricultural Drought Monitoring with Multi-sources Data. Inst. Remote Sens. Appl. Chin. Acad. Sci. 2012. (In Chinese) [Google Scholar]
  29. Shen, Z.; Zhang, Q.; Singh, V.P.; Sun, P.; Song, C.; Yu, H. Agricultural drought monitoring across Inner Mongolia, China: Model development, spatiotemporal patterns and impacts. J. Hydrol. 2019, 571, 793–804. [Google Scholar] [CrossRef]
  30. Karnieli, A.; Agam, N.; Pinker, R.T.; Anderson, M.; Imhoff, M.L.; Gutman, G.G.; Panov, N.; Goldberg, A. Use of NDVI and Land Surface Temperature for Drought Assessment: Merits and Limitations. J. Clim. 2010, 23, 618–633. [Google Scholar] [CrossRef]
  31. Karnieli, A.M.; Bayasgalan, Y.; Bayarjargal, N.; Agam, S.; Khudulmur, C.; Tucker, J. Comments on the use of the vegetation health index over Mongolia. Int. J. Remote Sens. 2006, 27, 2017–2024. [Google Scholar] [CrossRef]
  32. Olthof, I.; Latifovic, R. Short-term response of arctic vegetation NDVI to temperature anomalies. Int. J. Remote Sens. 2007, 28, 4823–4840. [Google Scholar] [CrossRef]
  33. Joiner, J.; Yoshida, Y.; Anderson, M.; Holmes, T.; Hain, C.; Reichle, R.; Koster, R.; Middleton, E.; Zeng, F. Global relationships among traditional reflectance vegetation indices (NDVI and NDII), evapotranspiration (ET), and soil moisture variability on weekly timescales. Remote Sens. Environ. 2018, 219, 339–352. [Google Scholar] [CrossRef] [PubMed] [Green Version]
  34. Rundquist, B.C.; Harrington, J.A., Jr. The effects of climatic factors on vegetation dynamics of tallgrass and shortgrass cover. Geo Cart. Int. 2000, 15, 31–36. [Google Scholar] [CrossRef]
  35. Farrar, T.J.; Nicholson, S.E.; Lare, A.R. The influence of soil type on the relationships between NDVI, rainfall and soil moisture in semiarid Botswana. II. NDVI response to soil moisture. Remote Sens. Environ. 1994, 50, 121–133. [Google Scholar] [CrossRef]
  36. Chang, S.; Wu, B.; Yan, N.; Davdai, B.; Nasanbat, E. Suitability assessment of satellite-derived drought indices for mongolian grassland. Remote Sens. 2017, 9, 650. [Google Scholar] [CrossRef] [Green Version]
  37. Khudulmur, S.; Elbegjargal, N.; Tsogtbaatar, J.; Dash, D.; Mandakh, N. Desertification Atlas of Mongolia; Institute of Geoecology, Mongolian Academy of Sciences: Ulaanbaatar, Mongolia, 2014; pp. 38–41. [Google Scholar]
  38. National Remote Sensing Center & Environmental Information Center of IRIMHE in Mongolia. Available online: http://www.icc.mn/index.php?content=58 (accessed on 14 February 2017).
  39. Zhou, Y.; Xiao, X.; Zhang, G.; Wagle, P.; Bajgain, R.; Dong, J.; Jin, C.; Basara, J.B.; Anderson, M.C.; Hain, C.; et al. Quantifying agricultural drought in tallgrass prairie region in the U.S. Southern Great Plains through analysis of a water-related vegetation index from MODIS images. Agric. For. Meteorol. 2017, 246, 111–122. [Google Scholar] [CrossRef]
  40. Gu, Y.; Brown, J.F.; Verdin, J.P.; Wardlow, B. A five-year analysis of MODIS NDVI and NDWI for grassland drought assessment over the central Great Plains of the United States. Geophys. Res. Lett. 2007, 34, L06407. [Google Scholar] [CrossRef] [Green Version]
  41. Correlation Coefficient. Available online: https://blog.csdn.net/coderjiang/article/details/8699650 (accessed on 5 October 2020).
  42. Correlation Coefficient Calculation Formula. Available online: https://www.docin.com/p-1974288713.html (accessed on 5 October 2020).
  43. Yared, A.; Tadesse, B.T.; Svoboda, M.; Wardlow, B.; Poulsen, C.; Swigart, J.; Jan van Andel, S. Developing a satellite-based combined drought indicator to monitor agricultural drought: A case study for Ethiopia. GIScience Remote Sens. 2018, 56, 718–748. [Google Scholar]
  44. Du, L.; Tian, Q.; Yu, T.; Meng, Q.; Jancso, T.; Udvardy, P.; Huang, Y. A comprehensive drought monitoring method integrating MODIS and TRMM data. Int. J. Appl. Earth Obs. Geoinf. 2013, 23, 245–253. [Google Scholar] [CrossRef]
  45. Zhu, X.; Shao, M.; Zeng, C.; Jia, X.; Huang, L.; Zhang, Y.; Zhu, J. Application of cosmic-ray neutron sensing to monitor soil water content in an alpine meadow ecosystem on the northern Tibetan Plateau. J. Hydrol. 2016, 536, 247–254. [Google Scholar] [CrossRef]
  46. Wu, K.; Rodriguez, G.A.; Zajc, M.; Jacquemin, E.; Clément, M.; Lambot, A.d.S. A new drone-borne GPR for soil moisture mapping. Remote Sens. Environ. 2019, 235, 111456. [Google Scholar] [CrossRef]
Figure 1. Study area and field station distribution.
Remotesensing 13 00414 g001
Figure 2. Field sampling design for soil moisture station.
Remotesensing 13 00414 g002
Figure 3. Drought distribution maps for the TCI, VCI, WCI, VHI, VDI, and field-based RDA in the first dekad of each July from 2002 to 2004 for Mongolia.
Remotesensing 13 00414 g003
Figure 4. Drought distribution maps of the VHI, VDI, and field-based RDA in the first dekad of each July from 2002 to 2004 for Arhangay Province.
Remotesensing 13 00414 g004
Figure 5. Drought distribution maps of the VHI, VDI, and field-based RDA in the first dekad of each July Figure 2002 to 2004 for Suhbaatar Province.
Remotesensing 13 00414 g005
Figure 6. Drought distribution maps of the VHI, VDI, and field-based RDA in the first dekad of each July from 2002 to 2004 for Omnogovi Province.
Remotesensing 13 00414 g006
Figure 7. Drought grade differences between the averaged VHI, VDI, and RDA (RDA–VHI, RDA–VDI) at the county level in the first dekad of July, 2002, for three typical provinces.
Remotesensing 13 00414 g007
Figure 8. Drought grade differences for the averaged VHI, VDI, and RDA(RDA–VHI, RDA–VDI) at the county level in the first dekad of July, 2003, for three typical provinces.
Remotesensing 13 00414 g008
Figure 9. Drought grade differences for the averaged VHI, VDI, and RDA (RDA–VHI, RDA–VDI) at the county level in the first dekad of July, 2004, for three typical provinces.
Remotesensing 13 00414 g009
Figure 10. The R values for the TCI, VCI, WCI, VHI, VDI and field soil moisture at depths of 12 and 20 cm.
Remotesensing 13 00414 g010
Figure 11. The R values for the VHI and VDI with the NFB (the results marked as dots are from forest steppe sites, triangles are from steppe sites, and diamonds are from desert steppe sites).
Remotesensing 13 00414 g011
Figure 12. Dekad profiles for the NDVI, NDWI, LST, and FB from 2000 to 2015 at the BD site.
Remotesensing 13 00414 g012
Table 1. Coefficients of proposed VDI model using the PCA method.
Zoneabcde
Forest Steppe0.510.280.210.460.54
Steppe0.510.080.410.500.50
Desert Steppe0.450.130.420.550.45
Table 2. Drought severity criteria for the TCI, VCI, WCI, VHI, and VDI.
LevelTCI/VCI/WCI/VHI/VDIRGB
Extreme drought0~0.05[168,0,0]
Severe drought0.05~0.10[255,0,0]
Moderate drought0.10~0.20[255,170,0]
Mild drought0.20~0.30[255,255,0]
No drought0.30~1.0[85,255,0]
Table 3. The R values between drought indices and NFB for the period 2000–2015. NS: number of samples at 0.01 confidence level).
Site (NS)Land CoverTCIVCIWCIVHIVDI
EL (165)FS0.360.450.570.460.55
BN (147)FS0.130.410.360.300.45
DN (187)FS0.410.570.630.550.67
DR (175)ST0.300.650.680.540.69
BT (162)ST0.320.710.720.590.74
MI (156)ST0.180.580.570.460.64
BD (169)DS0.240.530.490.510.57
DI (157)DS0.170.250.270.270.27
KD(130)DS0.160.340.310.320.36
Table 4. Statistical results for the NDVI, NDWI, LST, and FB for 2000–2015.
NDVI Max/MinNDVI Mean/VarianceNDWI Max/MinNDWI Mean/VarianceLST Max/MinLST Mean/VarianceFB Max/MinFB Mean/Variance
BD0.23/0.060.13/0.040.20/–0.11–0.02/0.05326.1/298.2313.6/6.625.00/0.011.14/1.01
DI0.22/0.070.11/0.030.20/–0.10–0.03/0.05324.7/297.9313.9/6.067.30/0.000.76/0.93
KD0.17/0.070.11/0.020.05/–0.16–0.11/0.03325.3/294.5312.4/5.334.4/0.10.94/0.99
Publisher’s Note: MDPI stays neutral with regard to jurisdictional claims in published maps and institutional affiliations.

