Forest Changes by Precipitation Zones in Northern China after the Three-North Shelterbelt Forest Program in China

 , and
, and
Abstract
:
1. Introduction
- mapping forests by integrating Landsat and PALSAR/PALSAR-2 images based on a decision tree algorithm,
- analyzing the spatial-temporal pattern of forest gain and loss, and
- investigating the forest changes in different precipitation zones.
2. Data and Methods
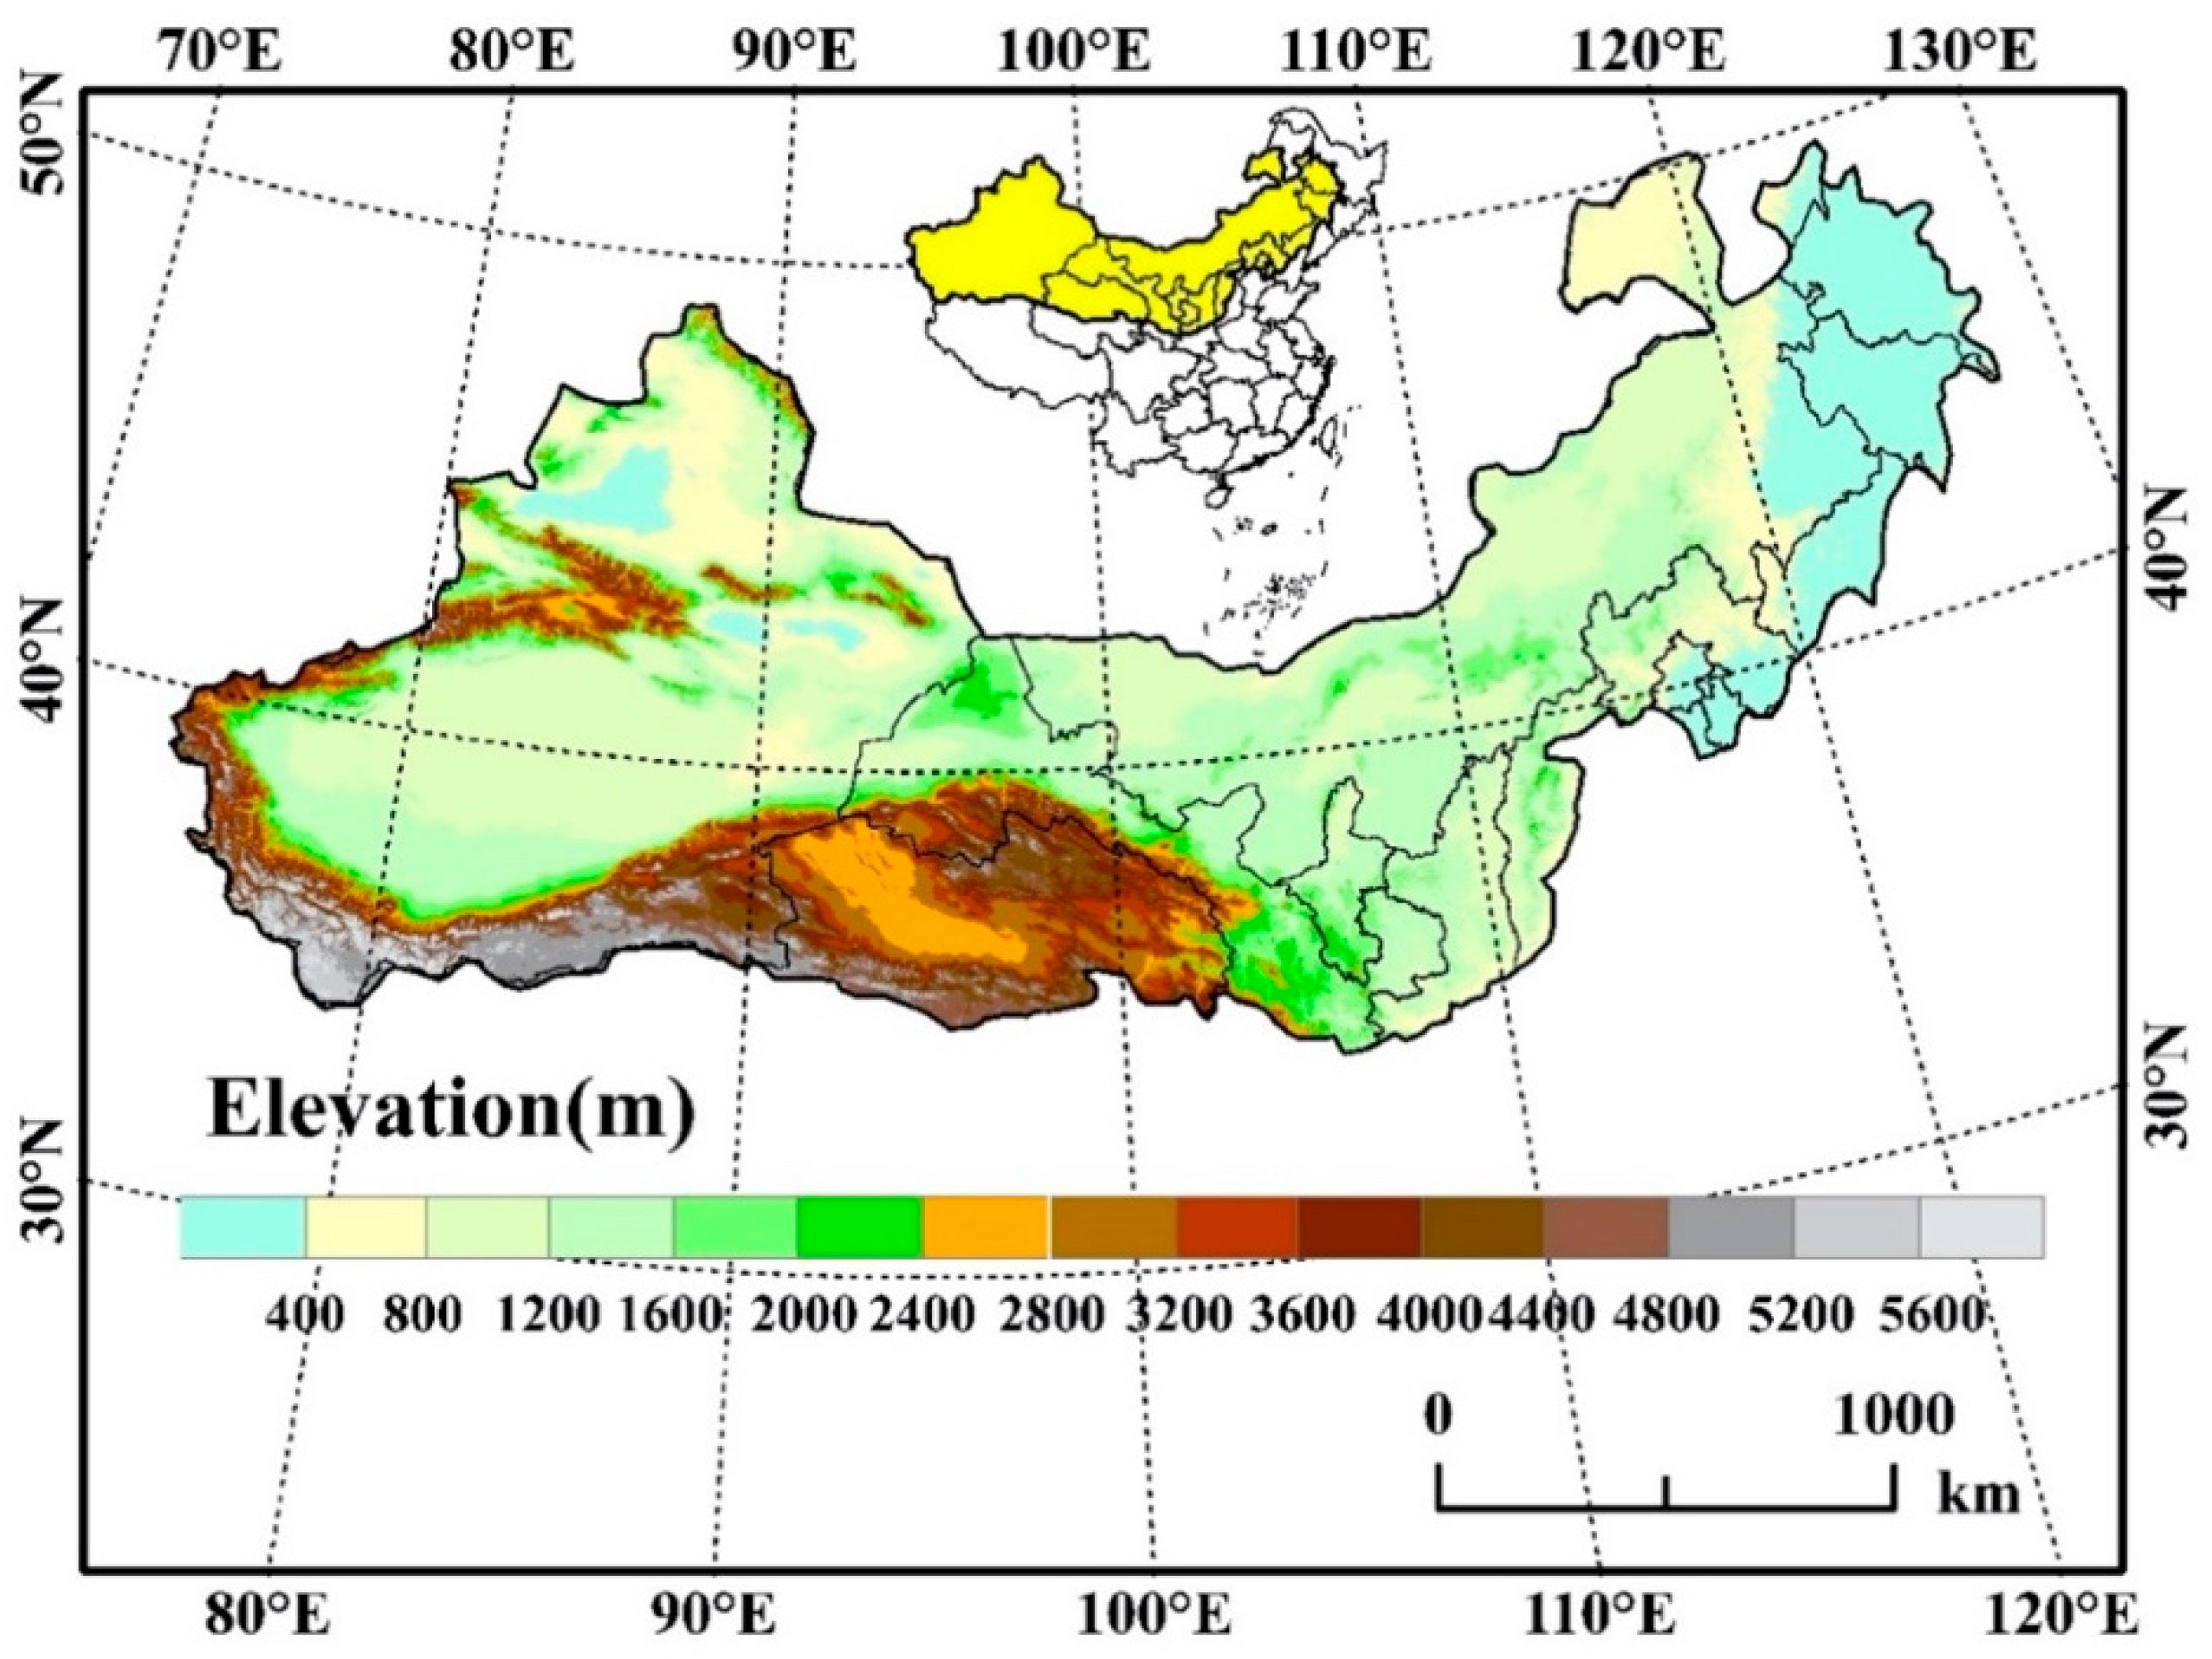
2.1. Study Area
2.2. Data Collection and Preprocessing
2.2.1. PALSAR/PALSAR-2 Dataset and Preprocessing
2.2.2. Landsat Dataset and Preprocessing
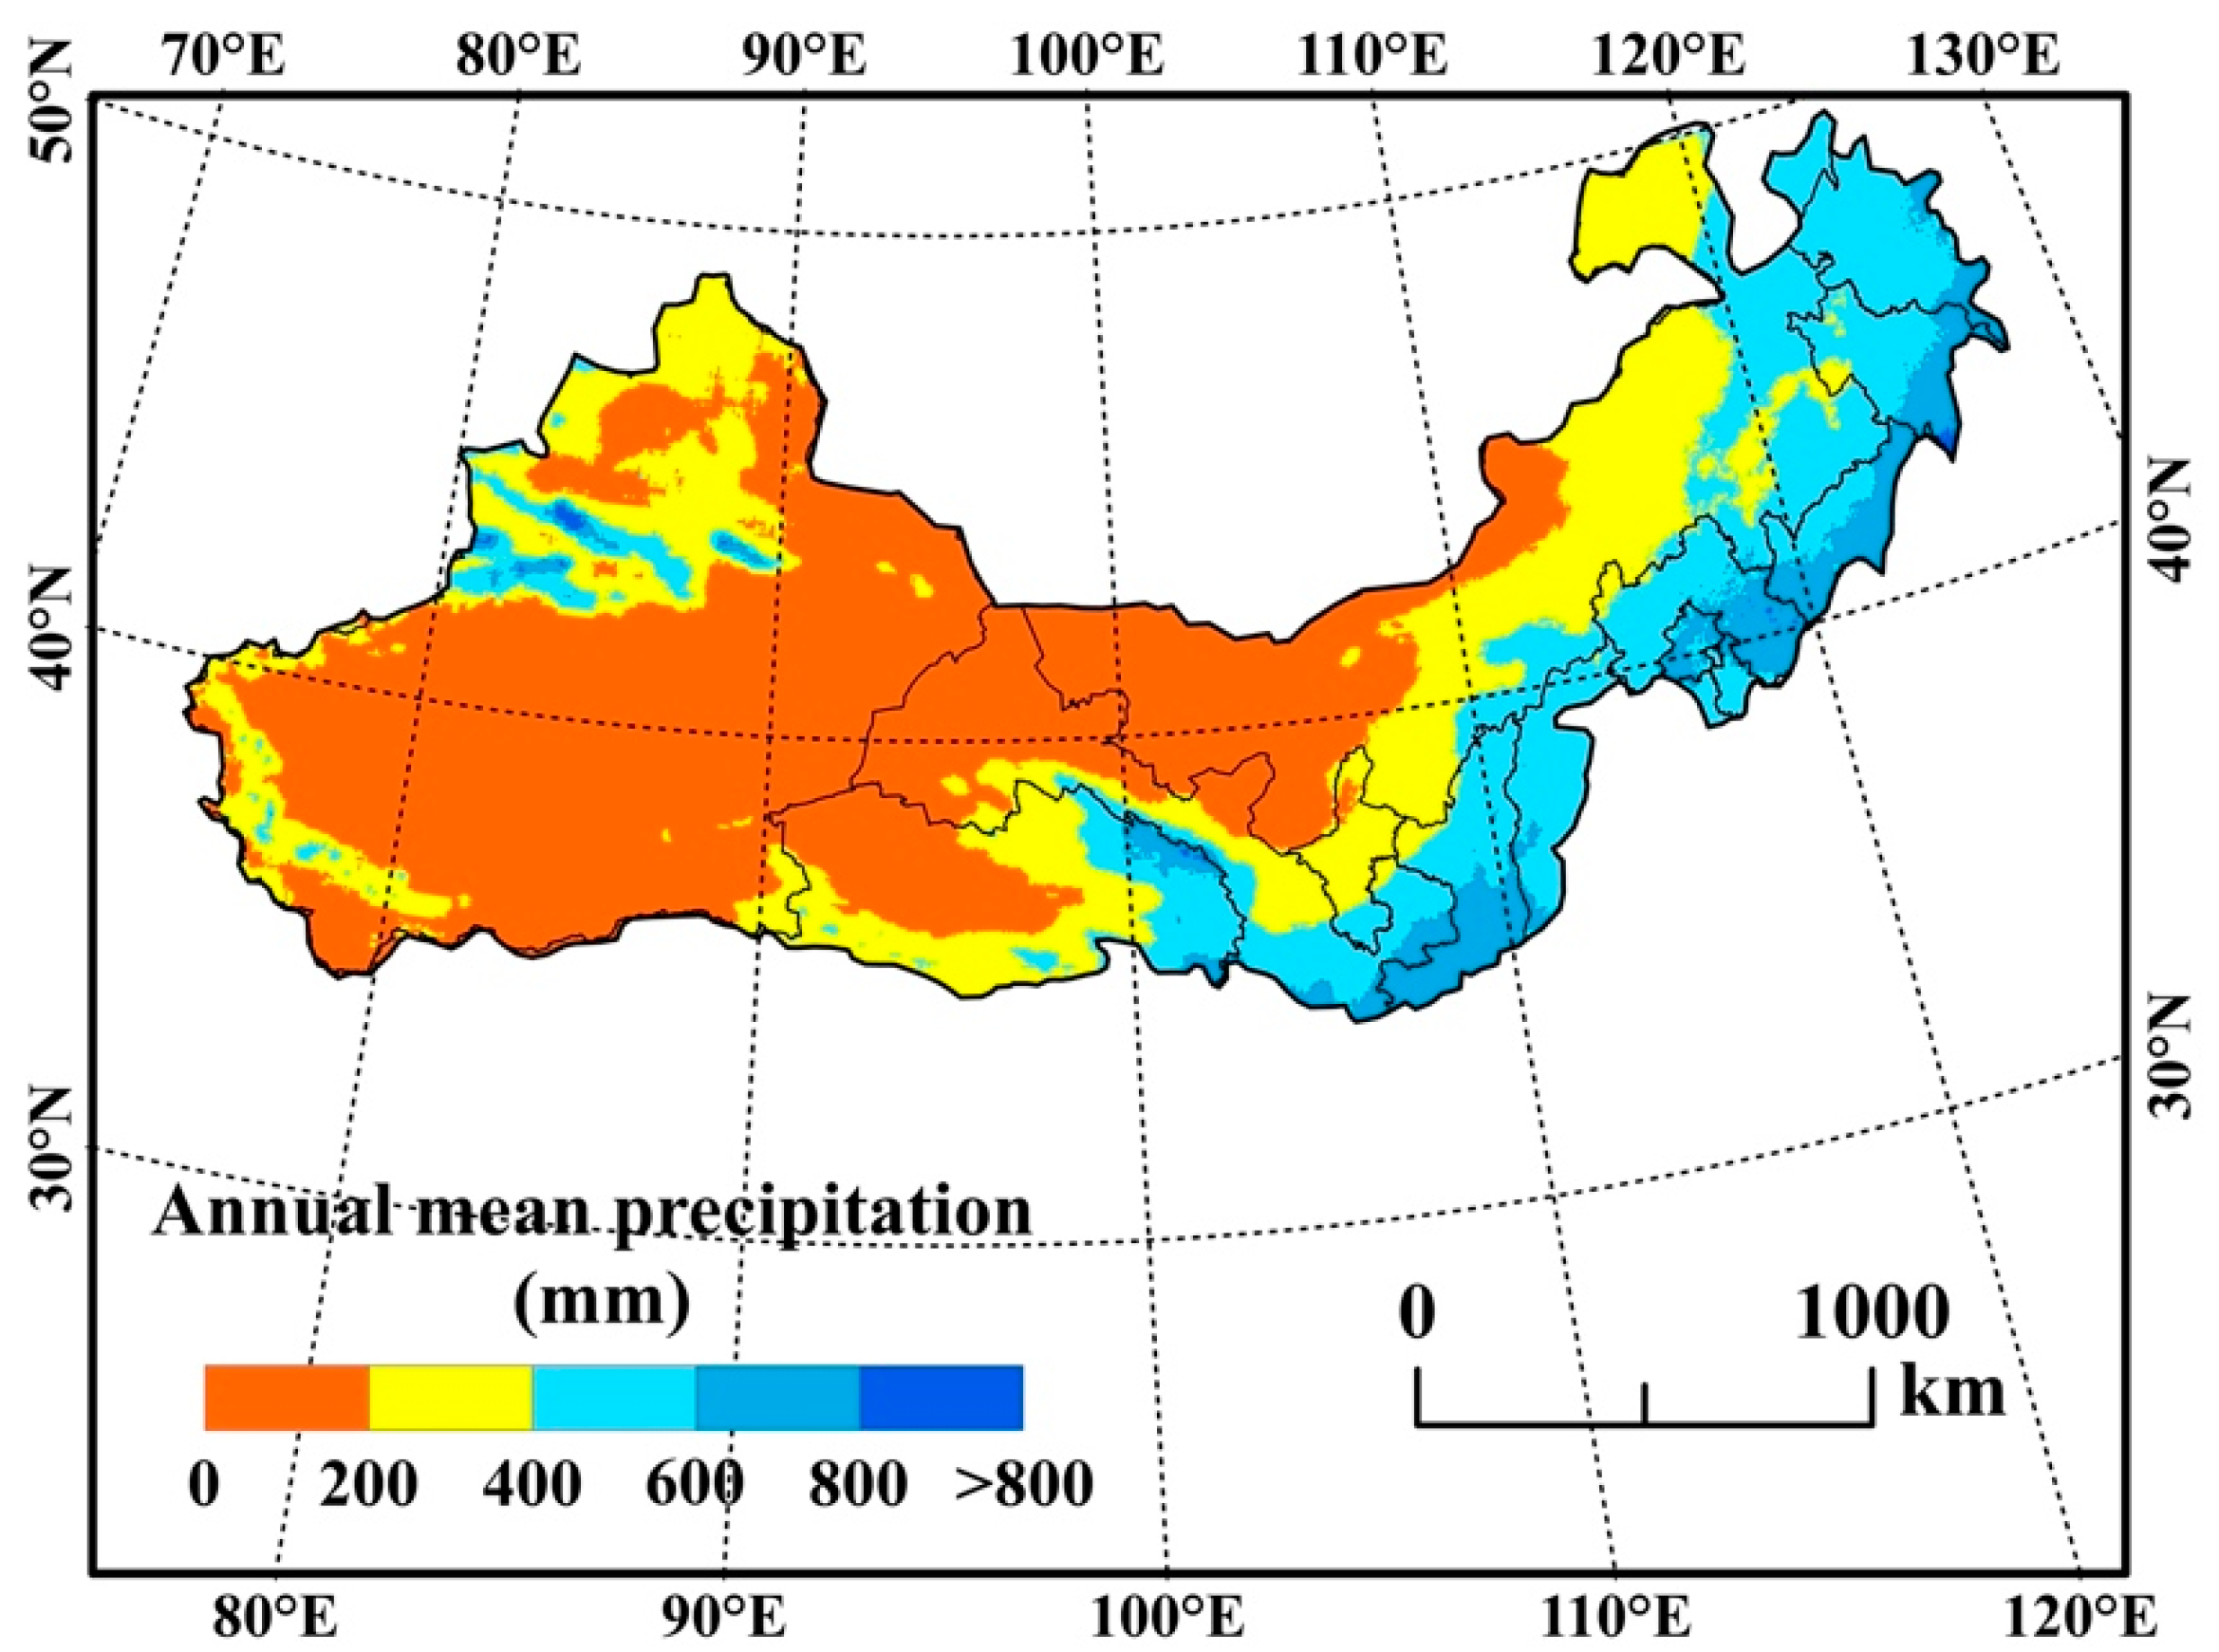
2.2.3. Precipitation Dataset and Preprocessing
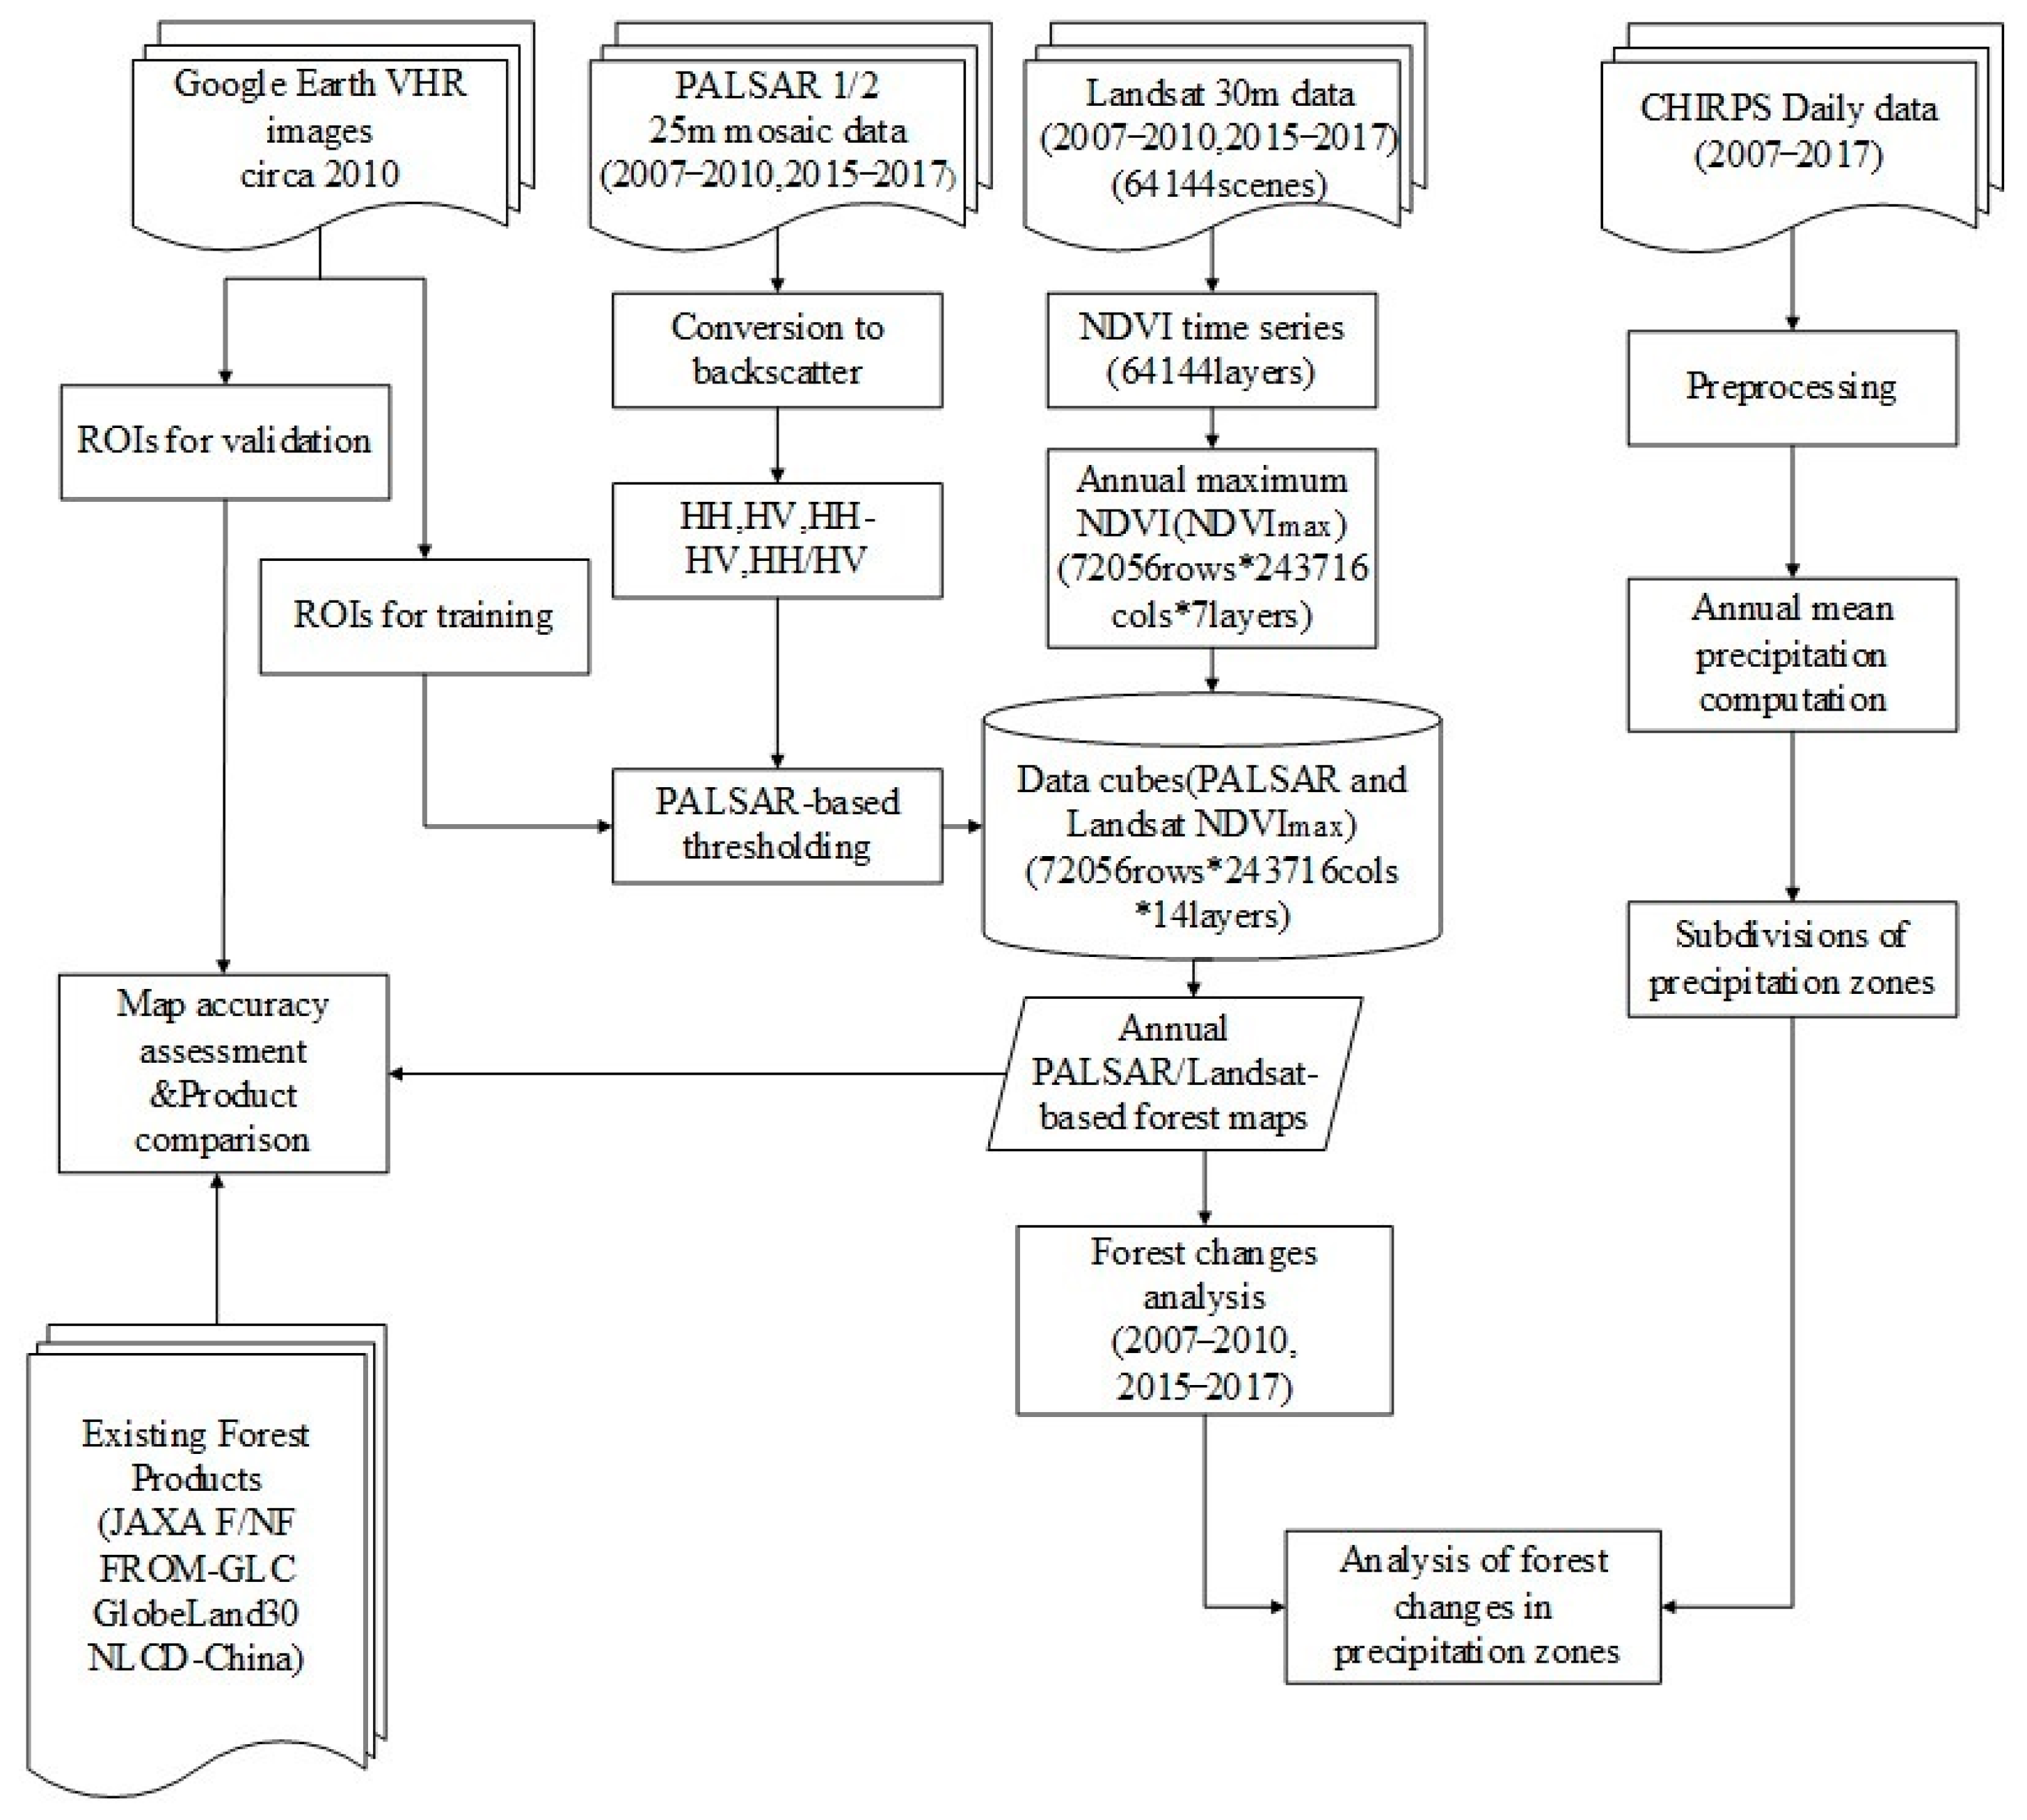
2.3. Forest Changes by Precipitation Zones in Northern China
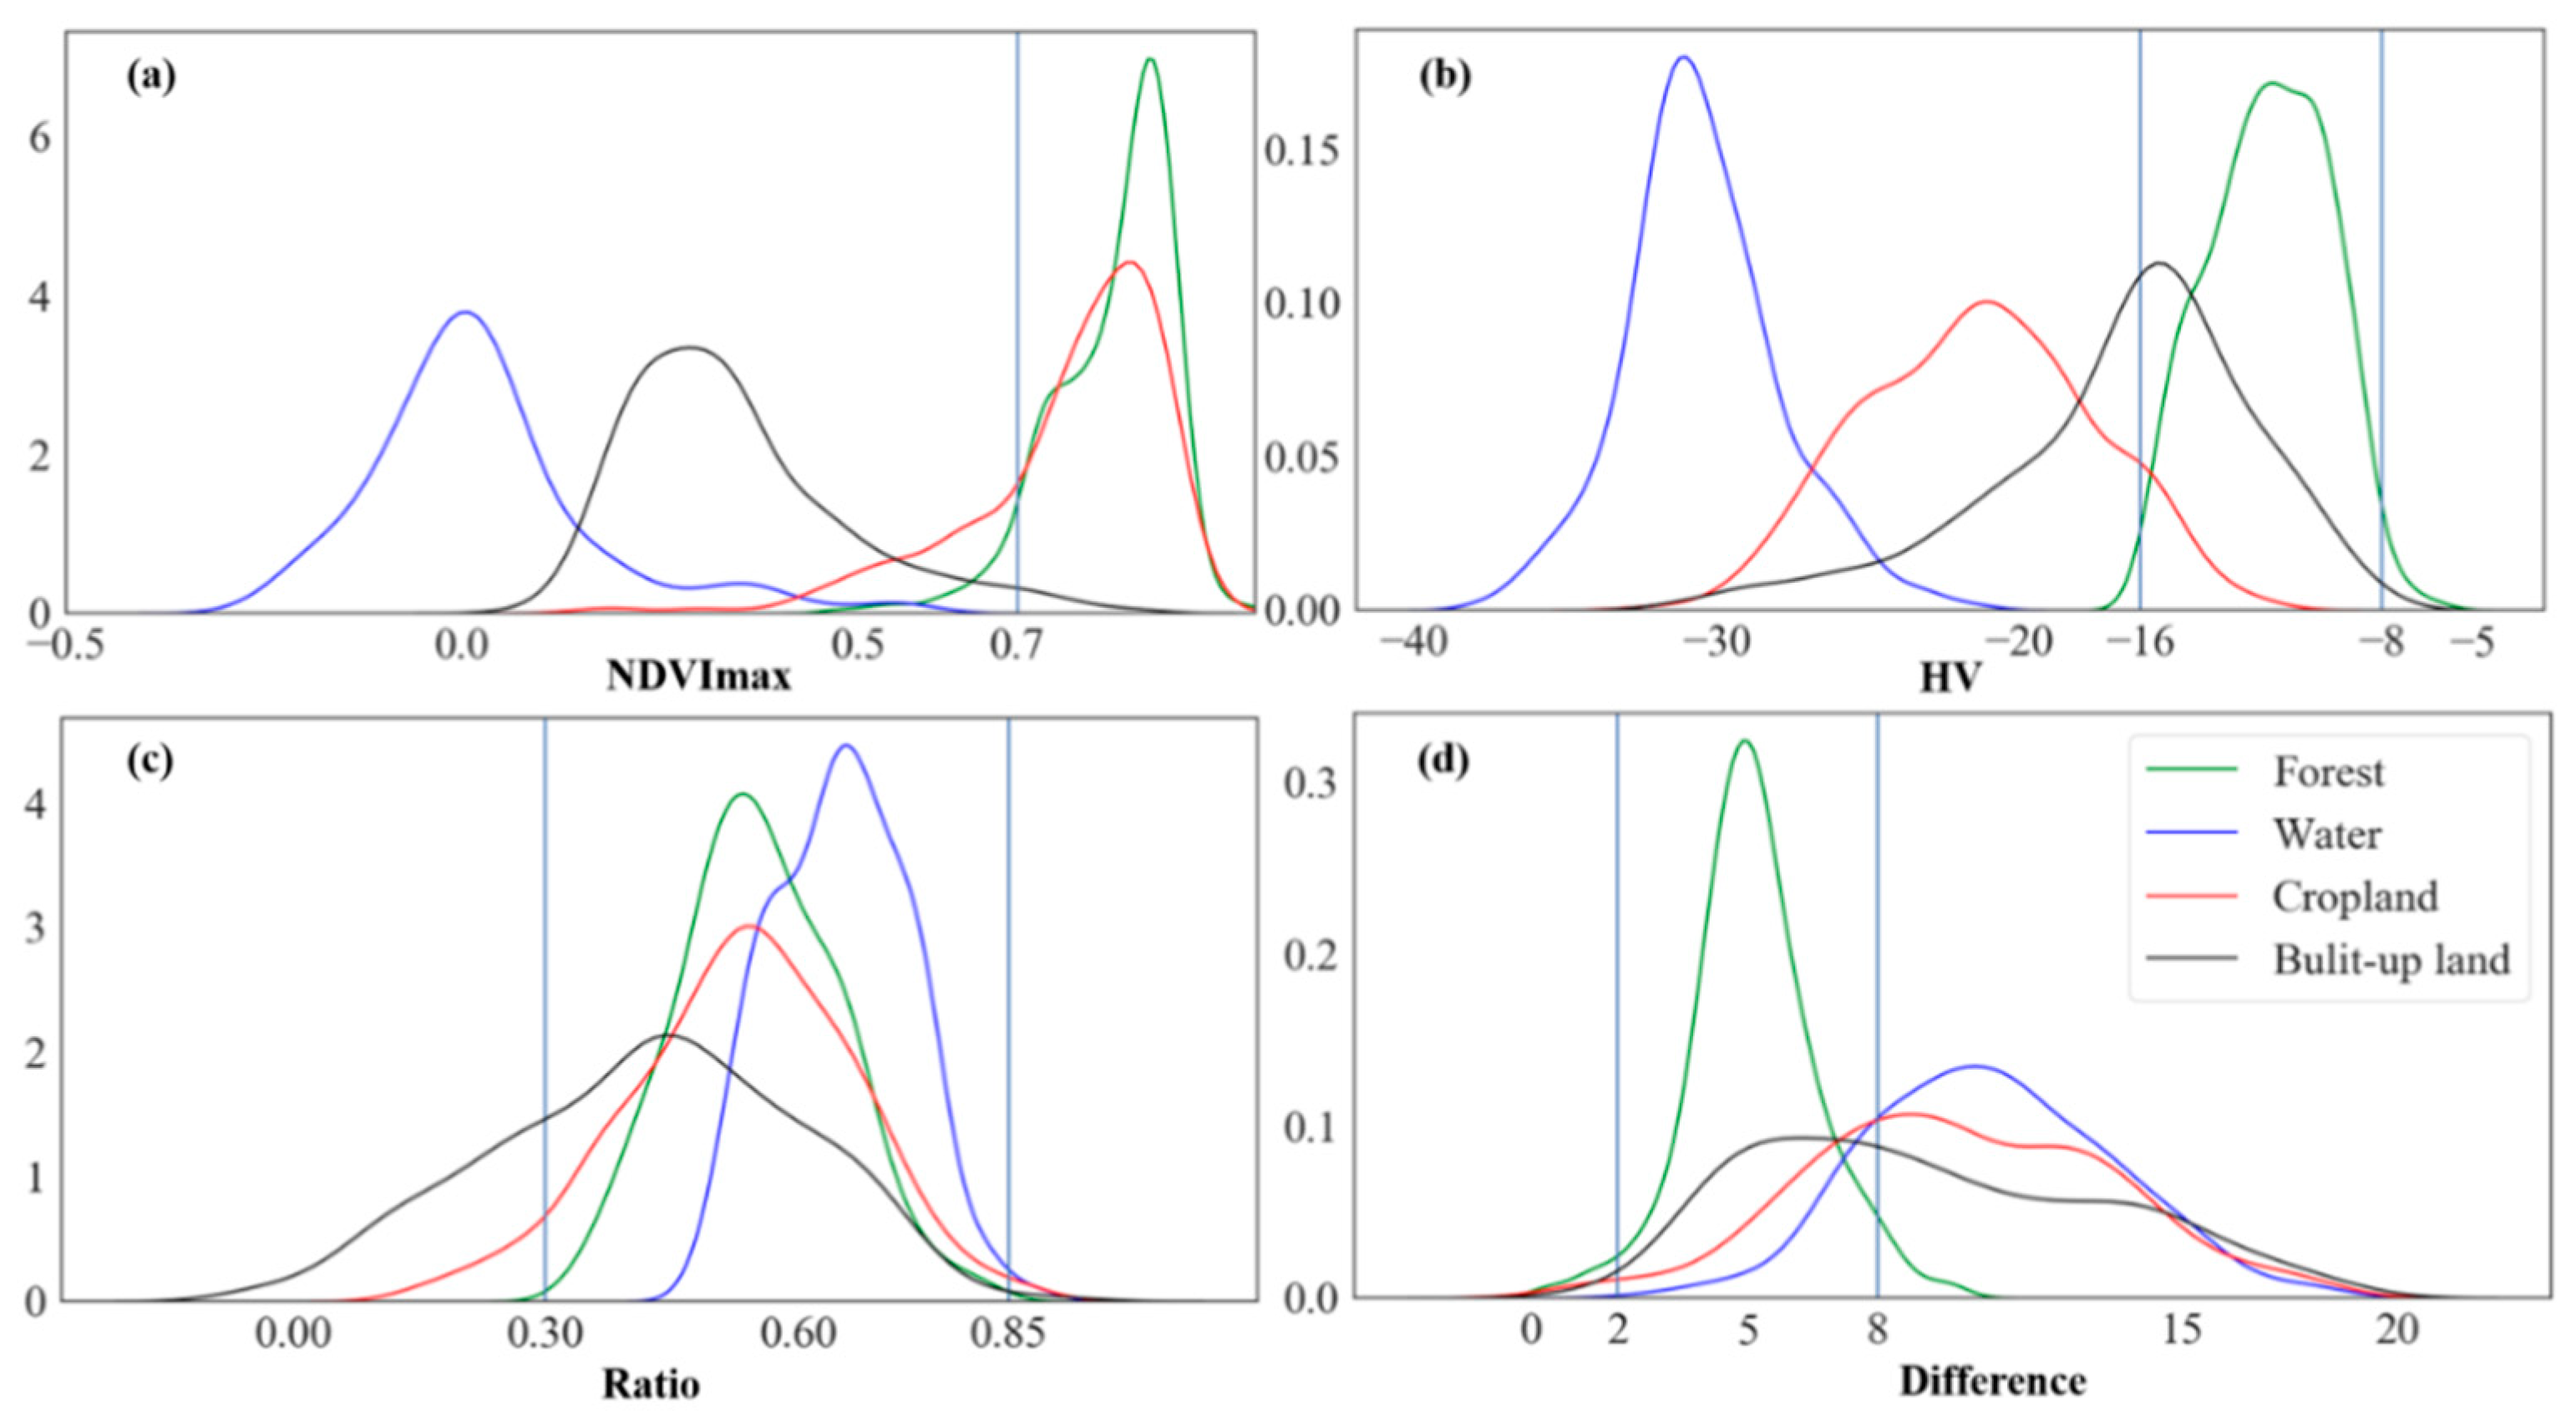
2.3.1. Forest mapping
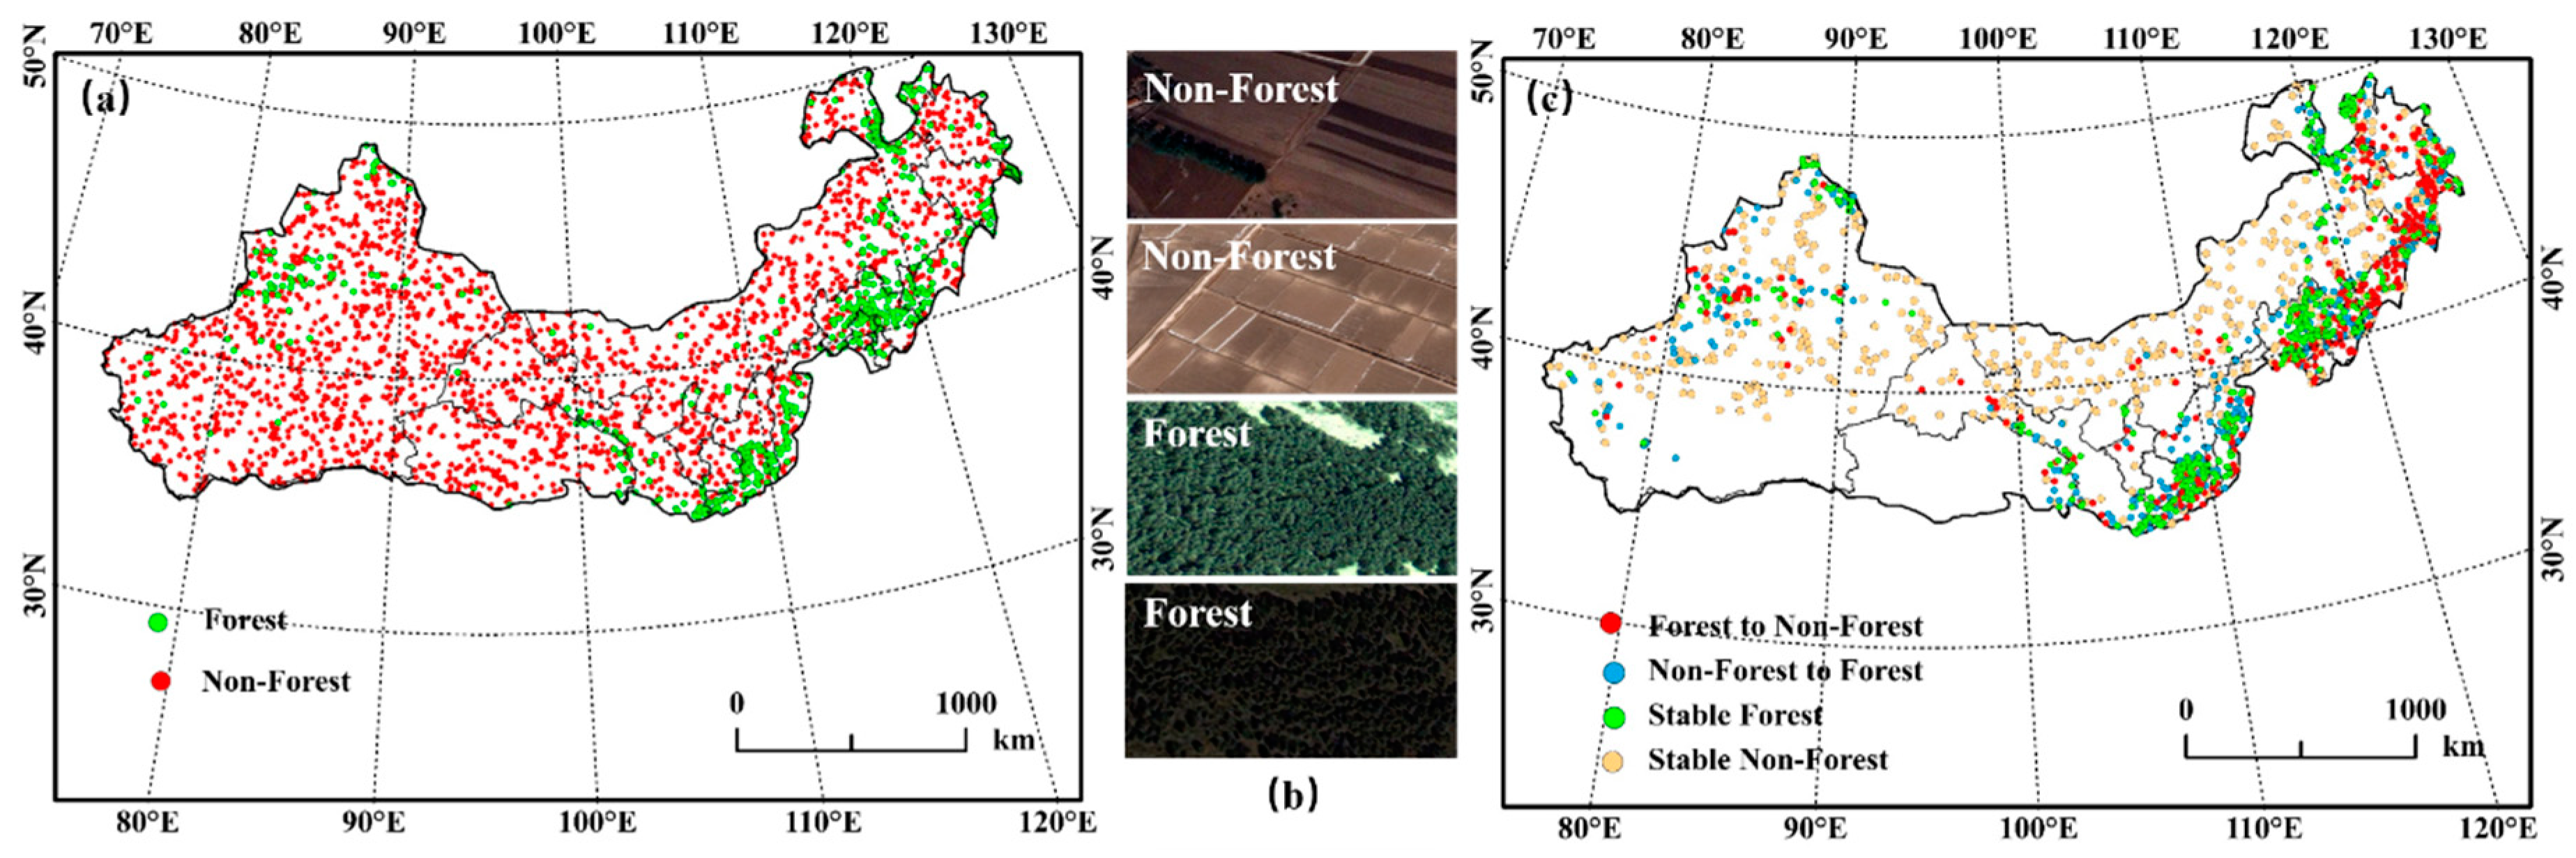
2.3.2. Sample Collection for Accuracy Assessment of Forest Mapping and Changes
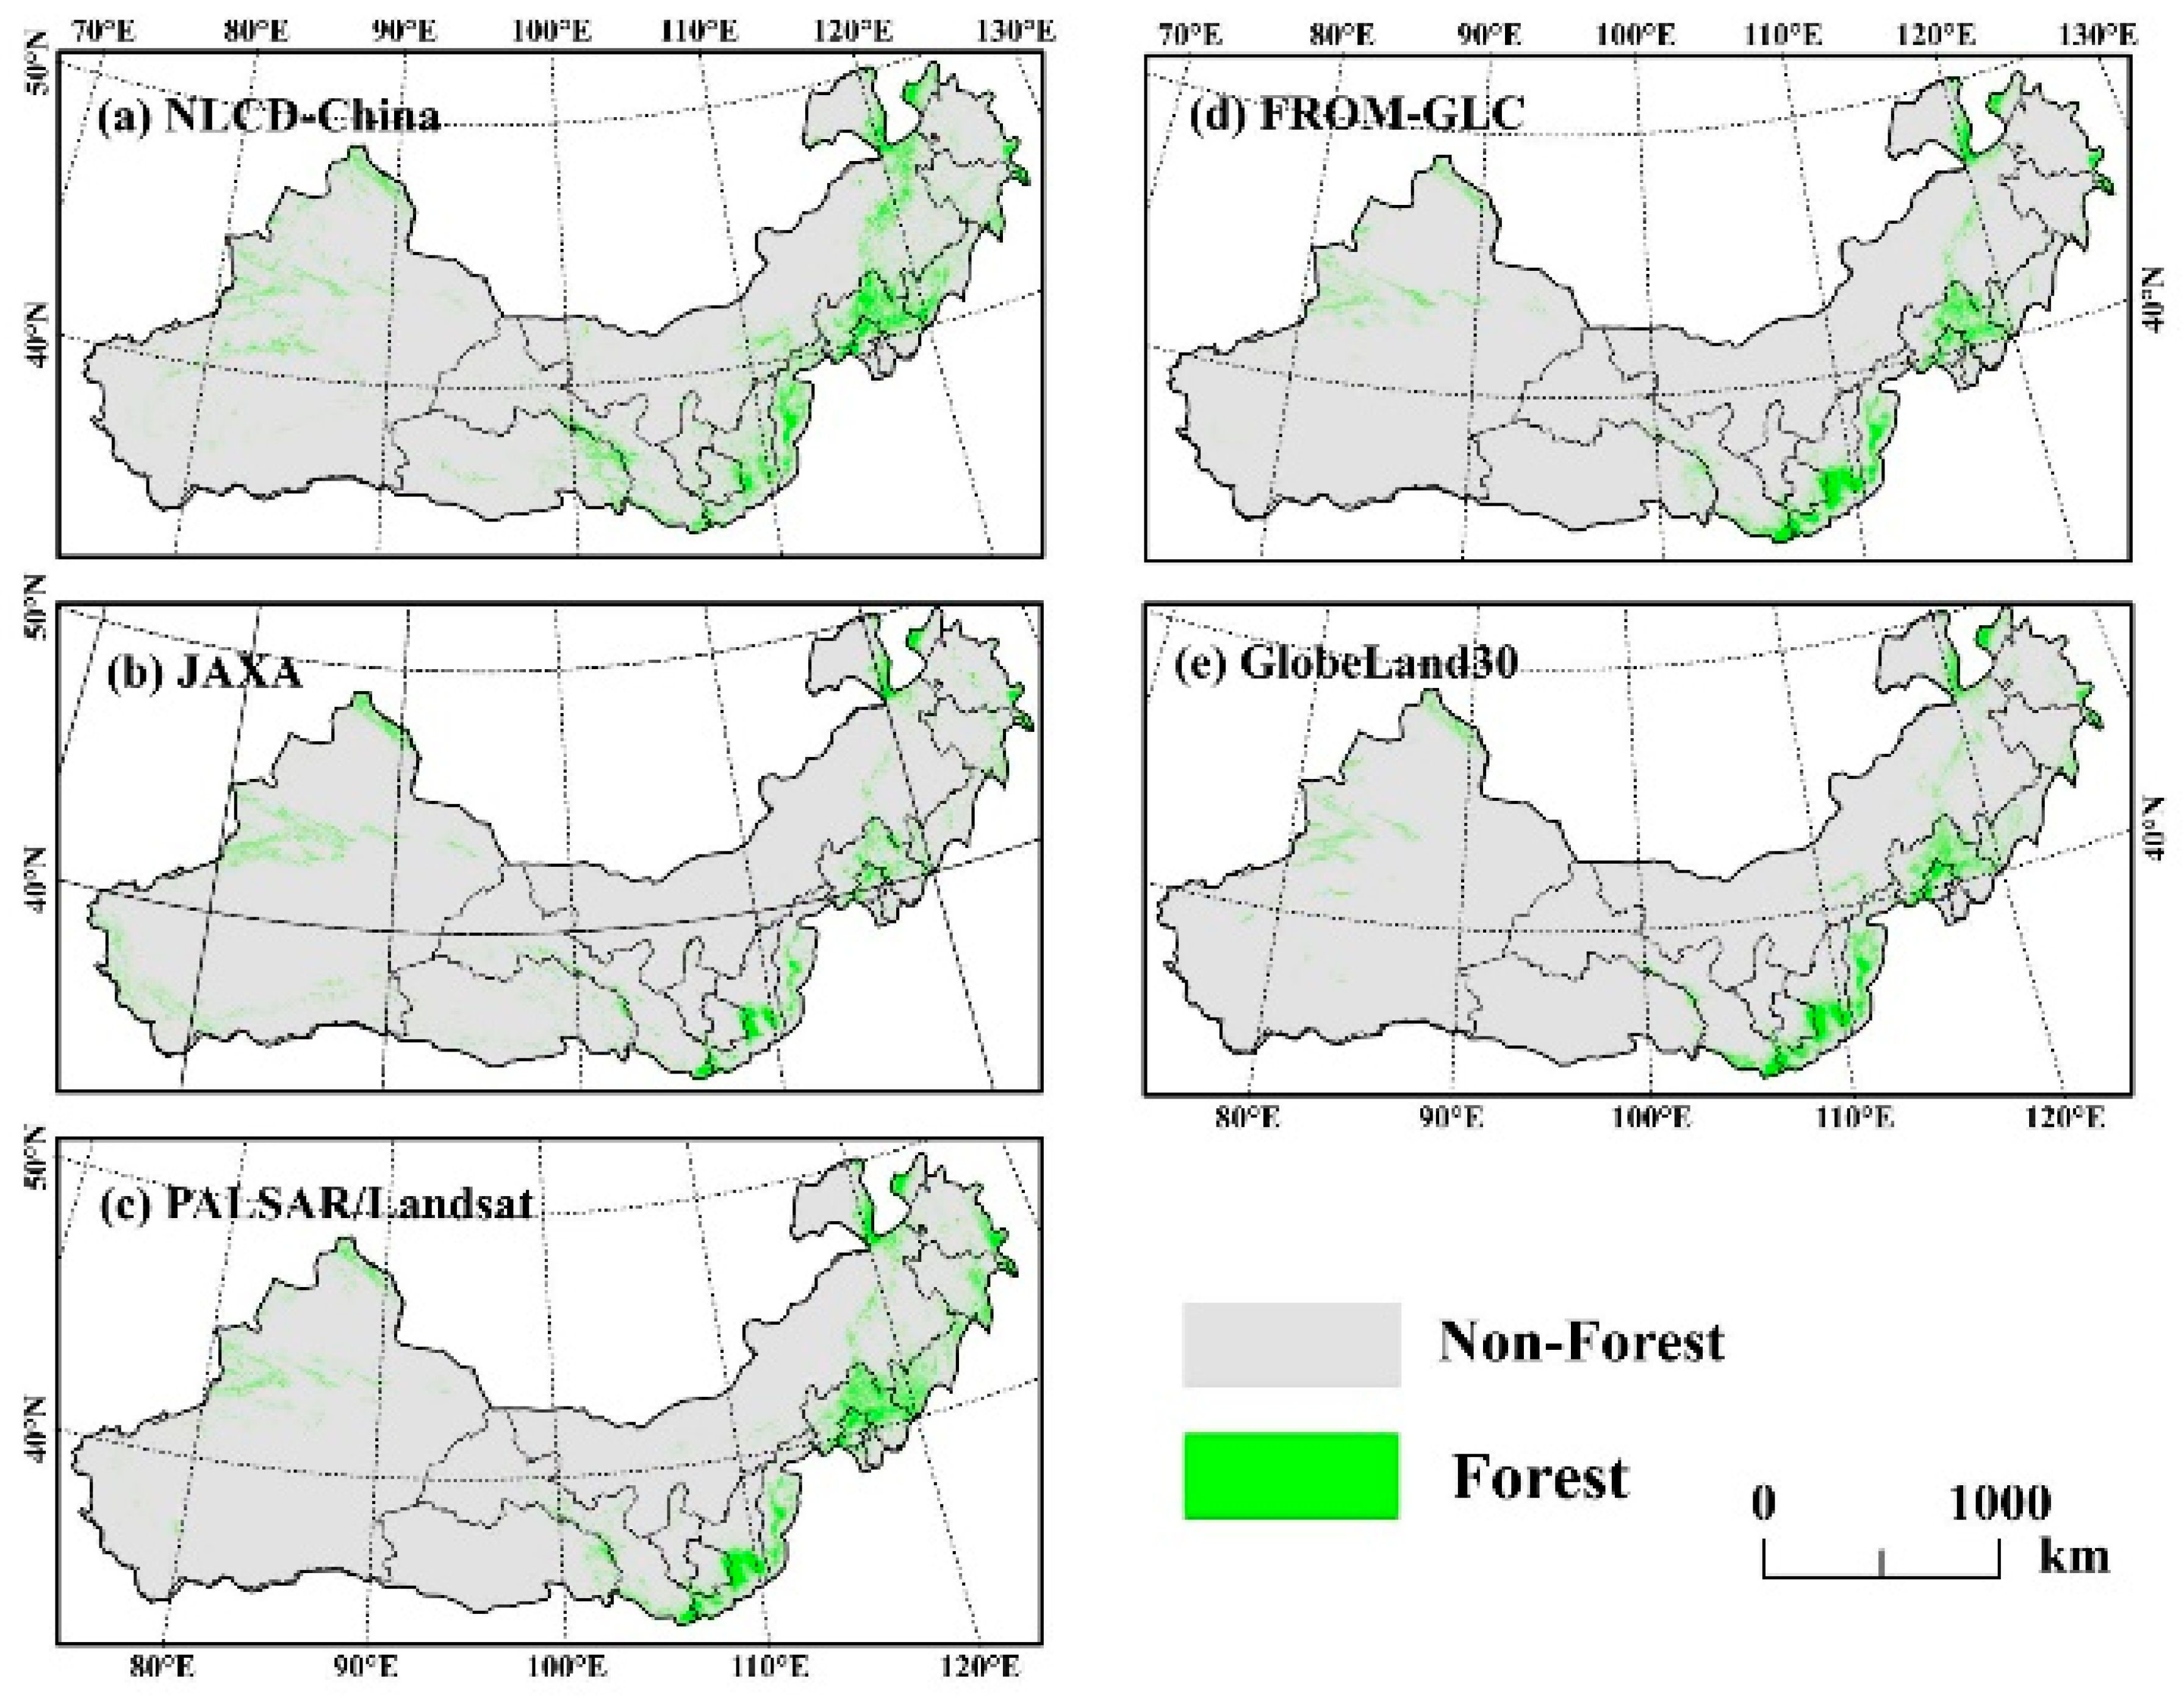
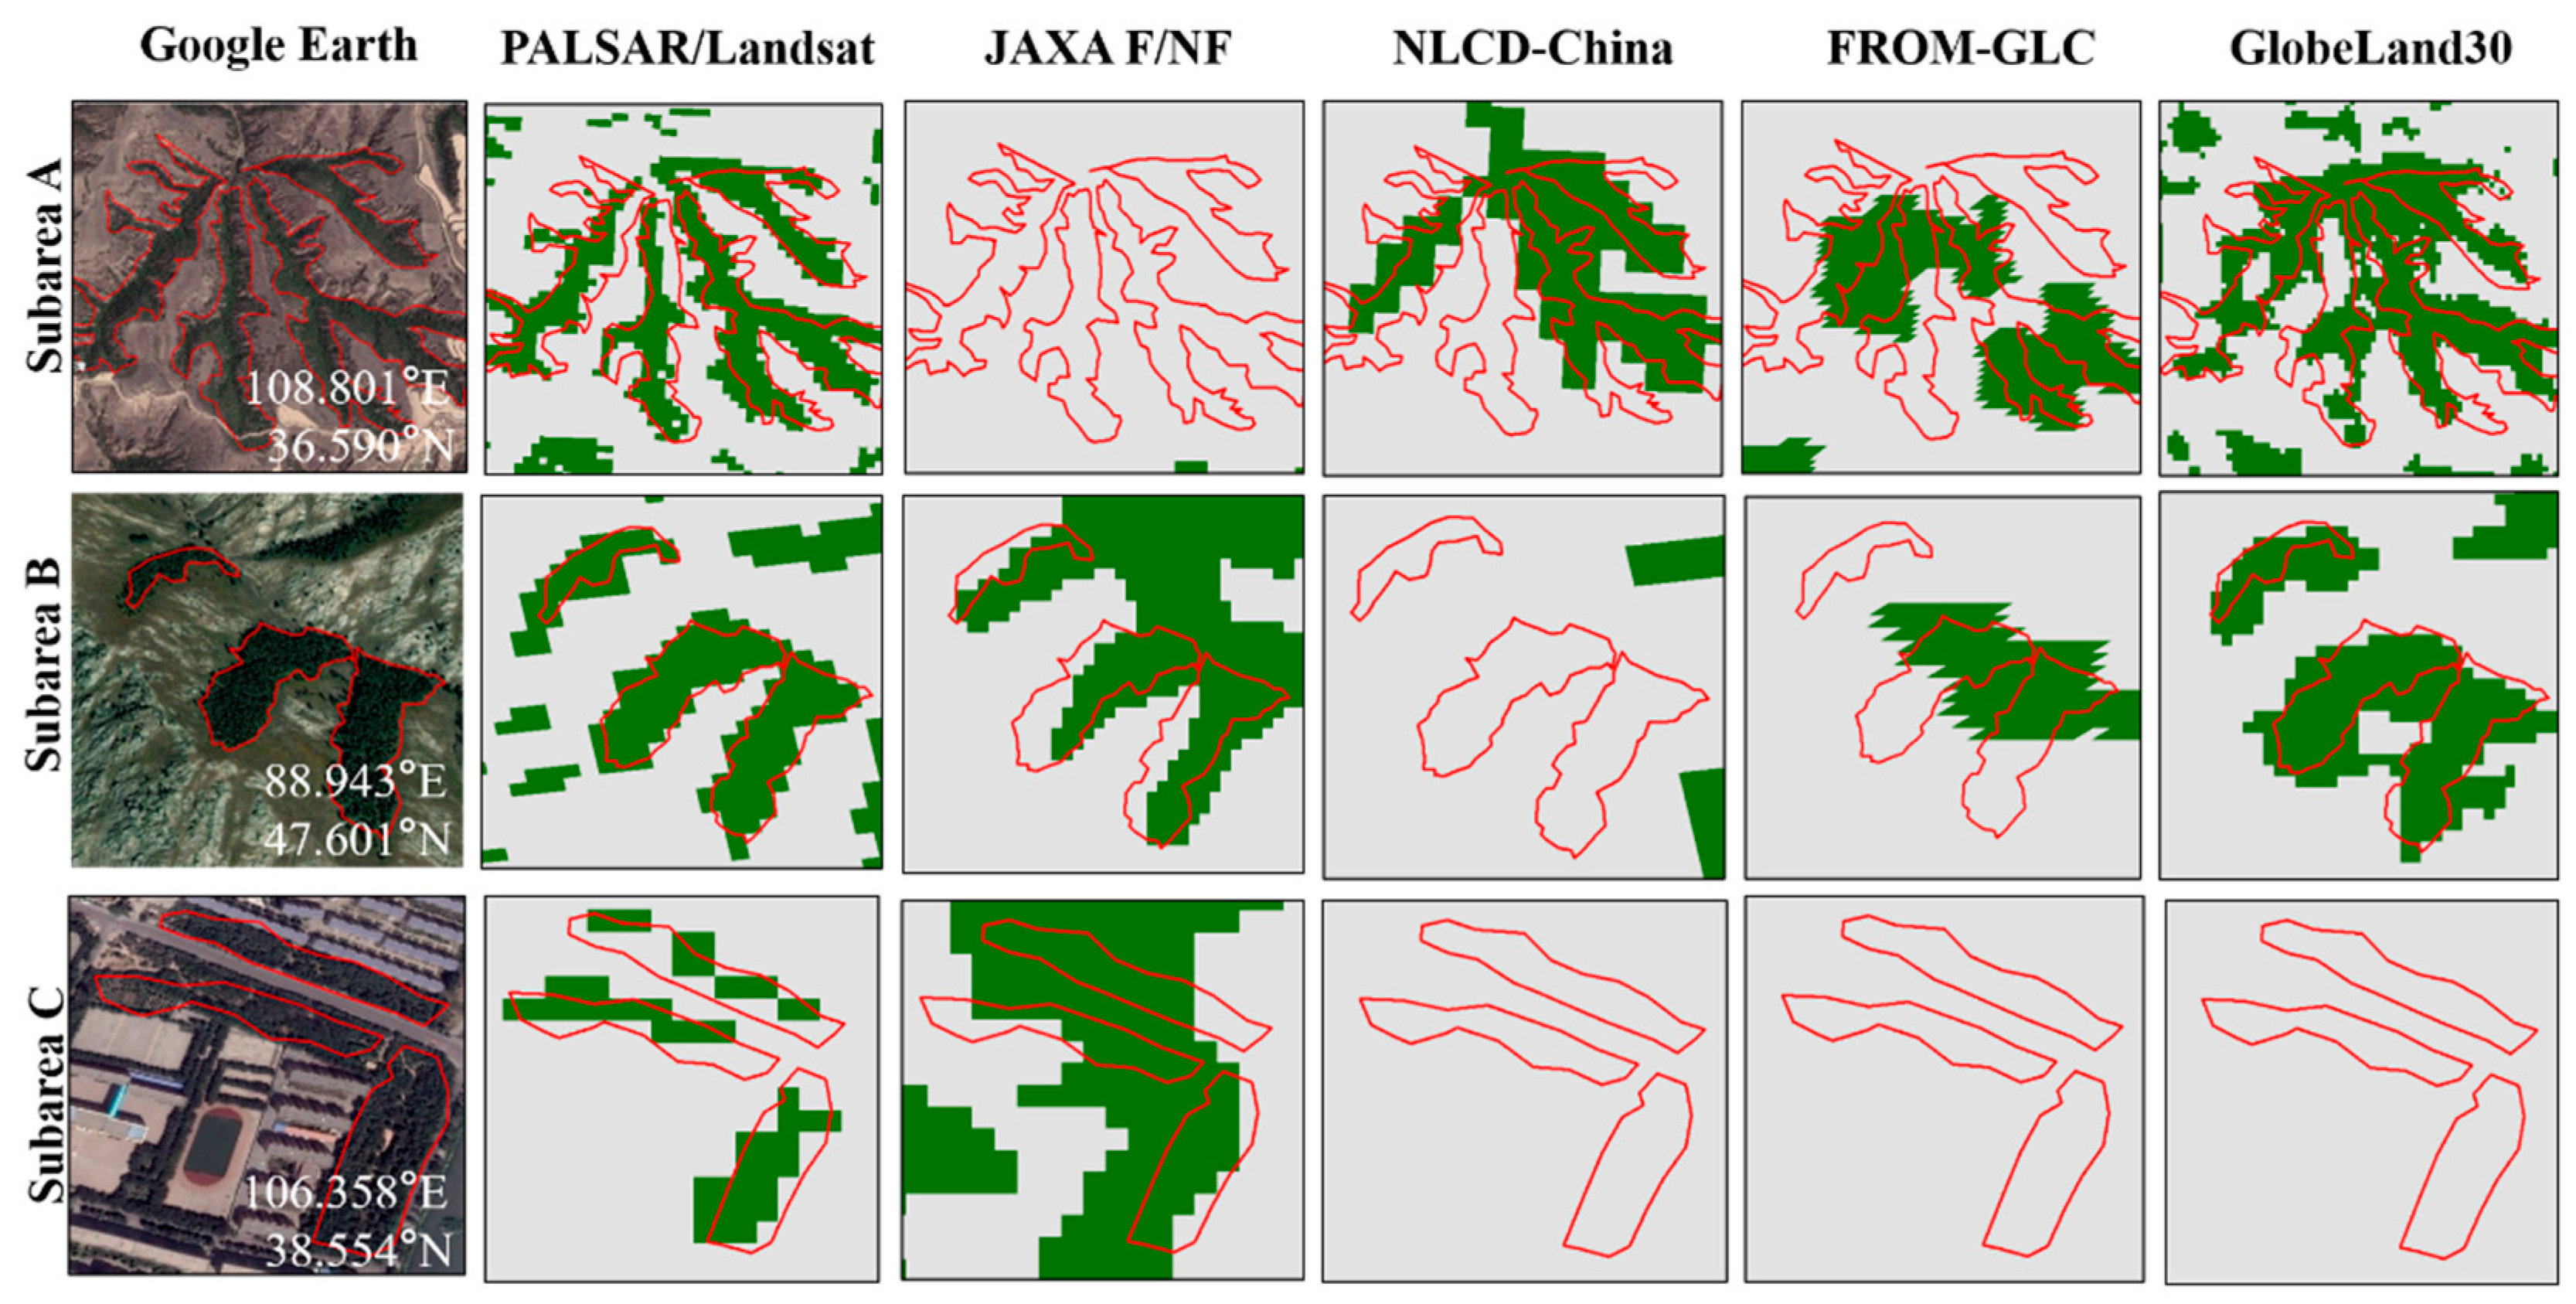
2.3.3. Comparison of Multiple Forest Products in Northern China and Accuracy Assessment
2.3.4. Forest Cover Changes Analysis in Different Precipitation Zones
3. Results
3.1. Accuracy Analysis of PALSAR/Landsat-Based Forest Map of Northern China and Comparison with Other Four Forest Maps
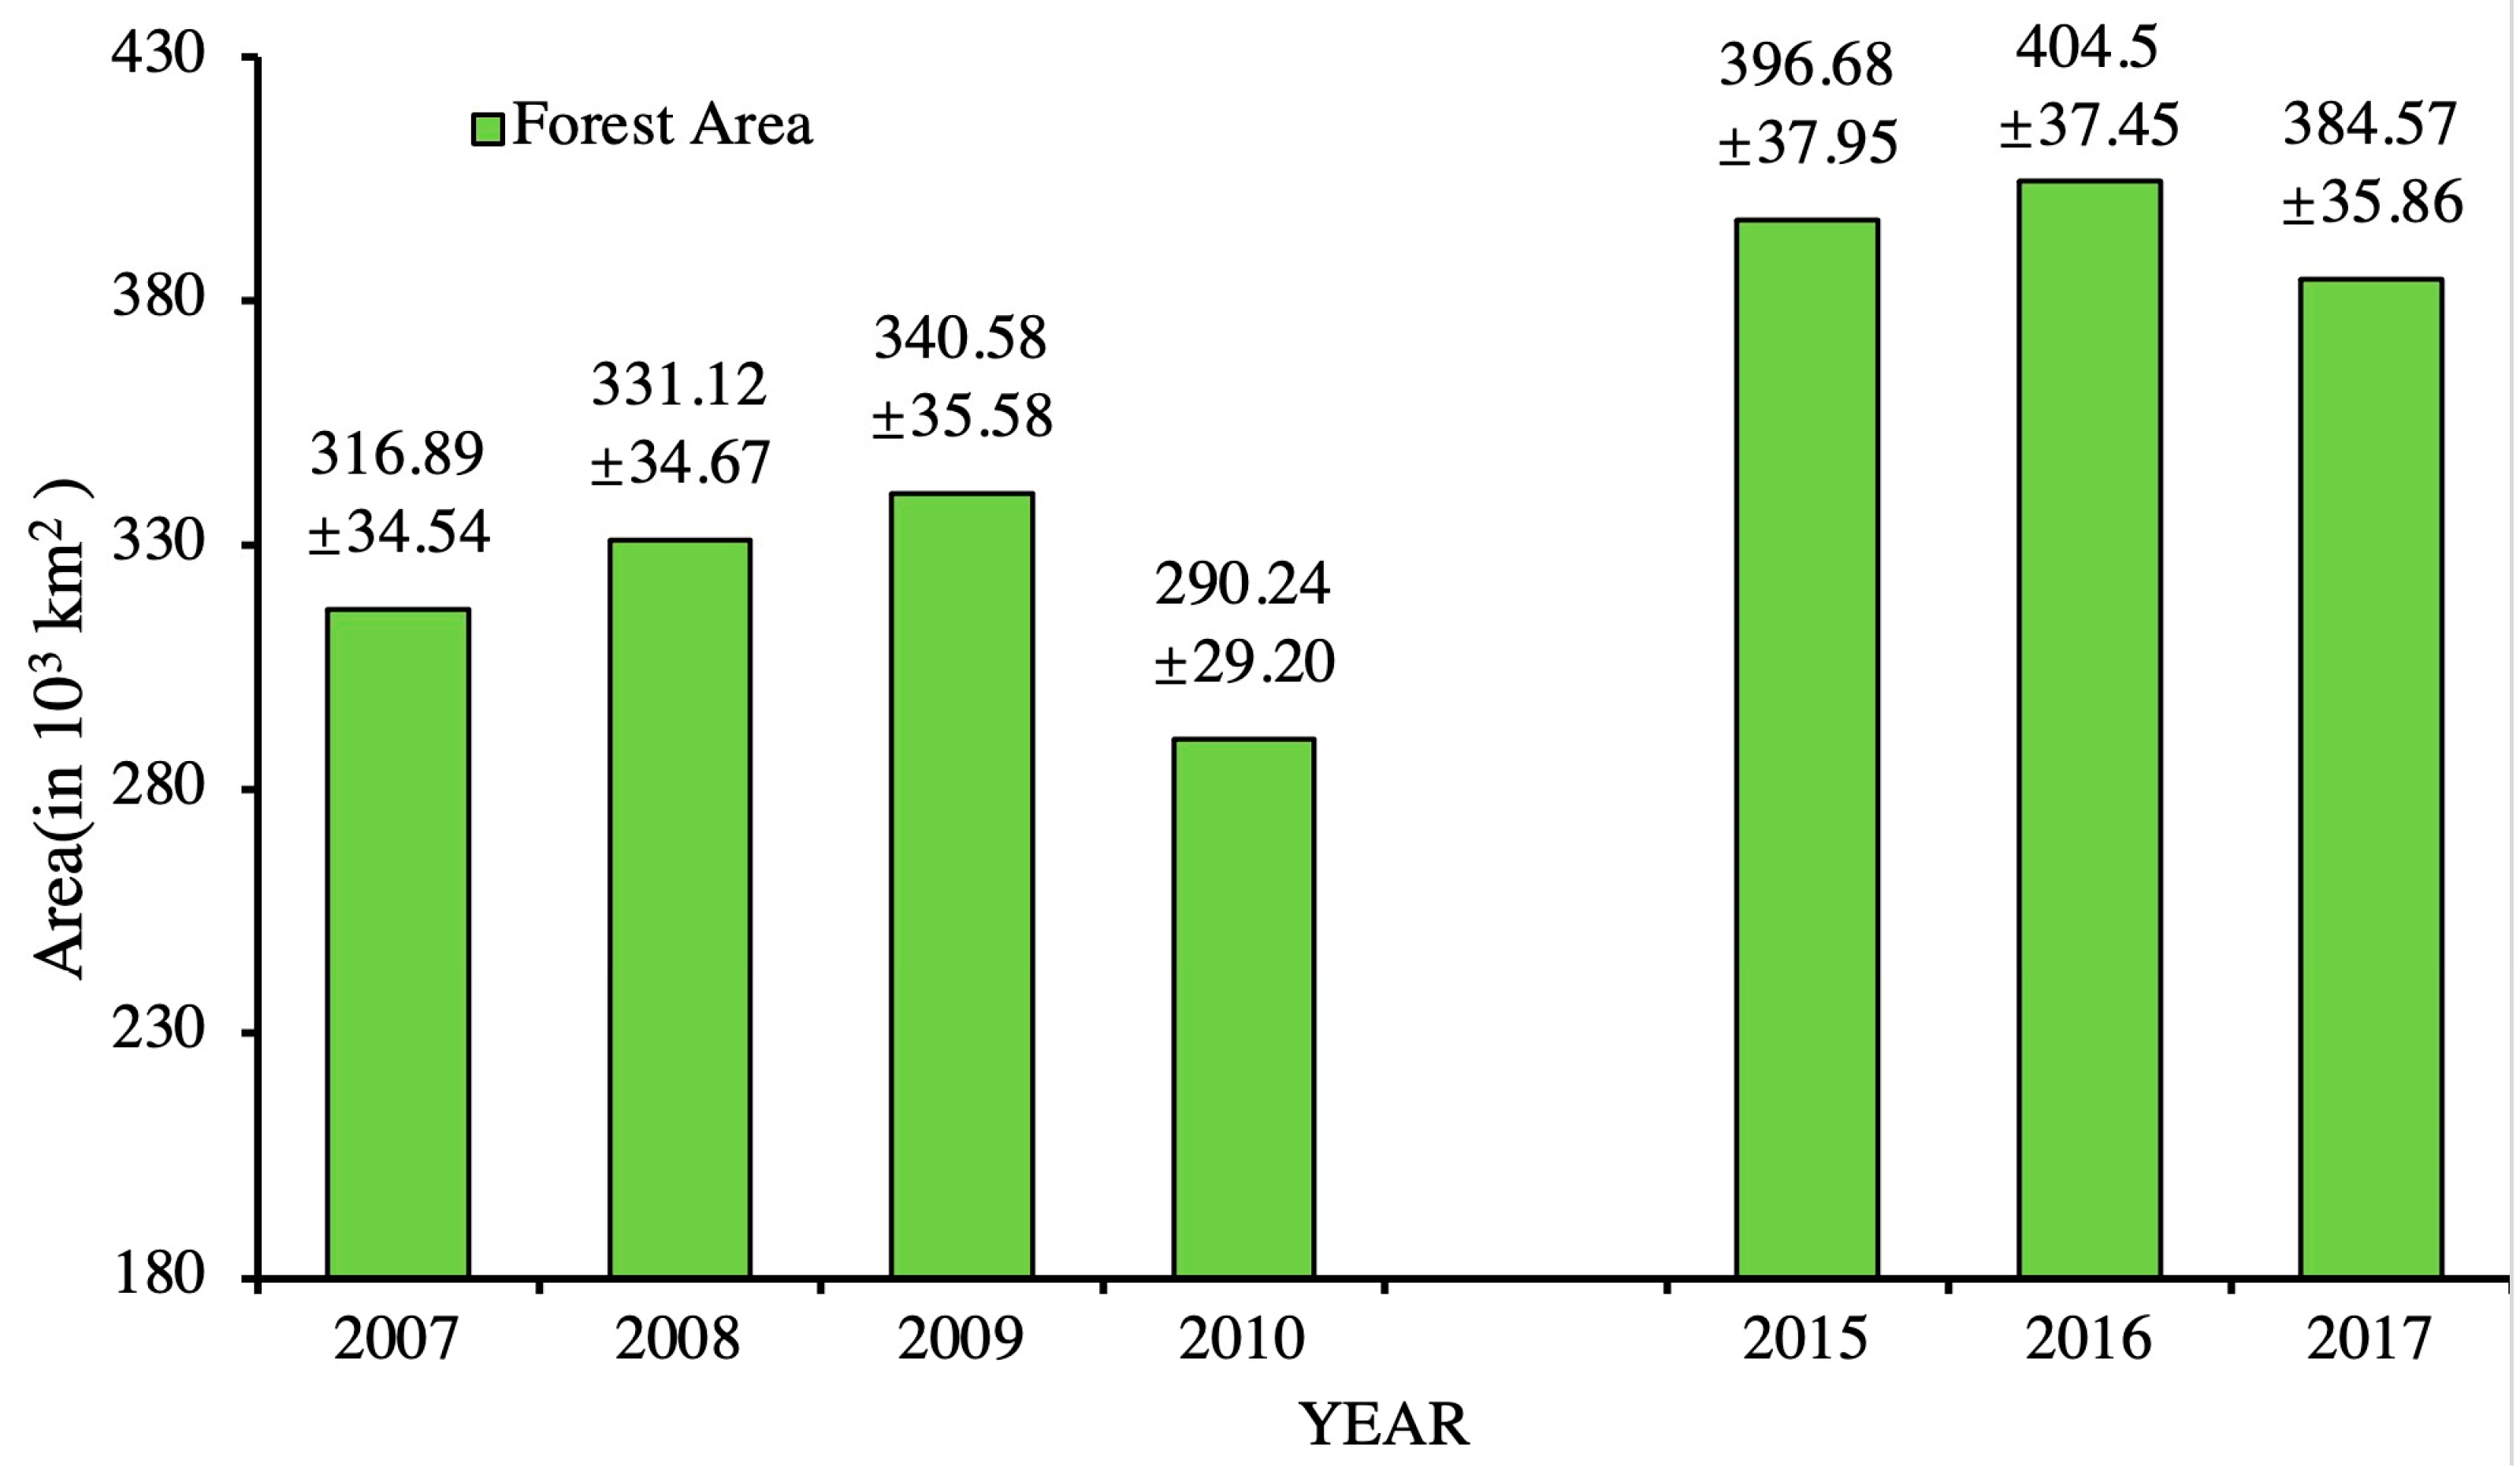
3.2. Areal Changes of PALSAR/Landsat-Based Forest Map
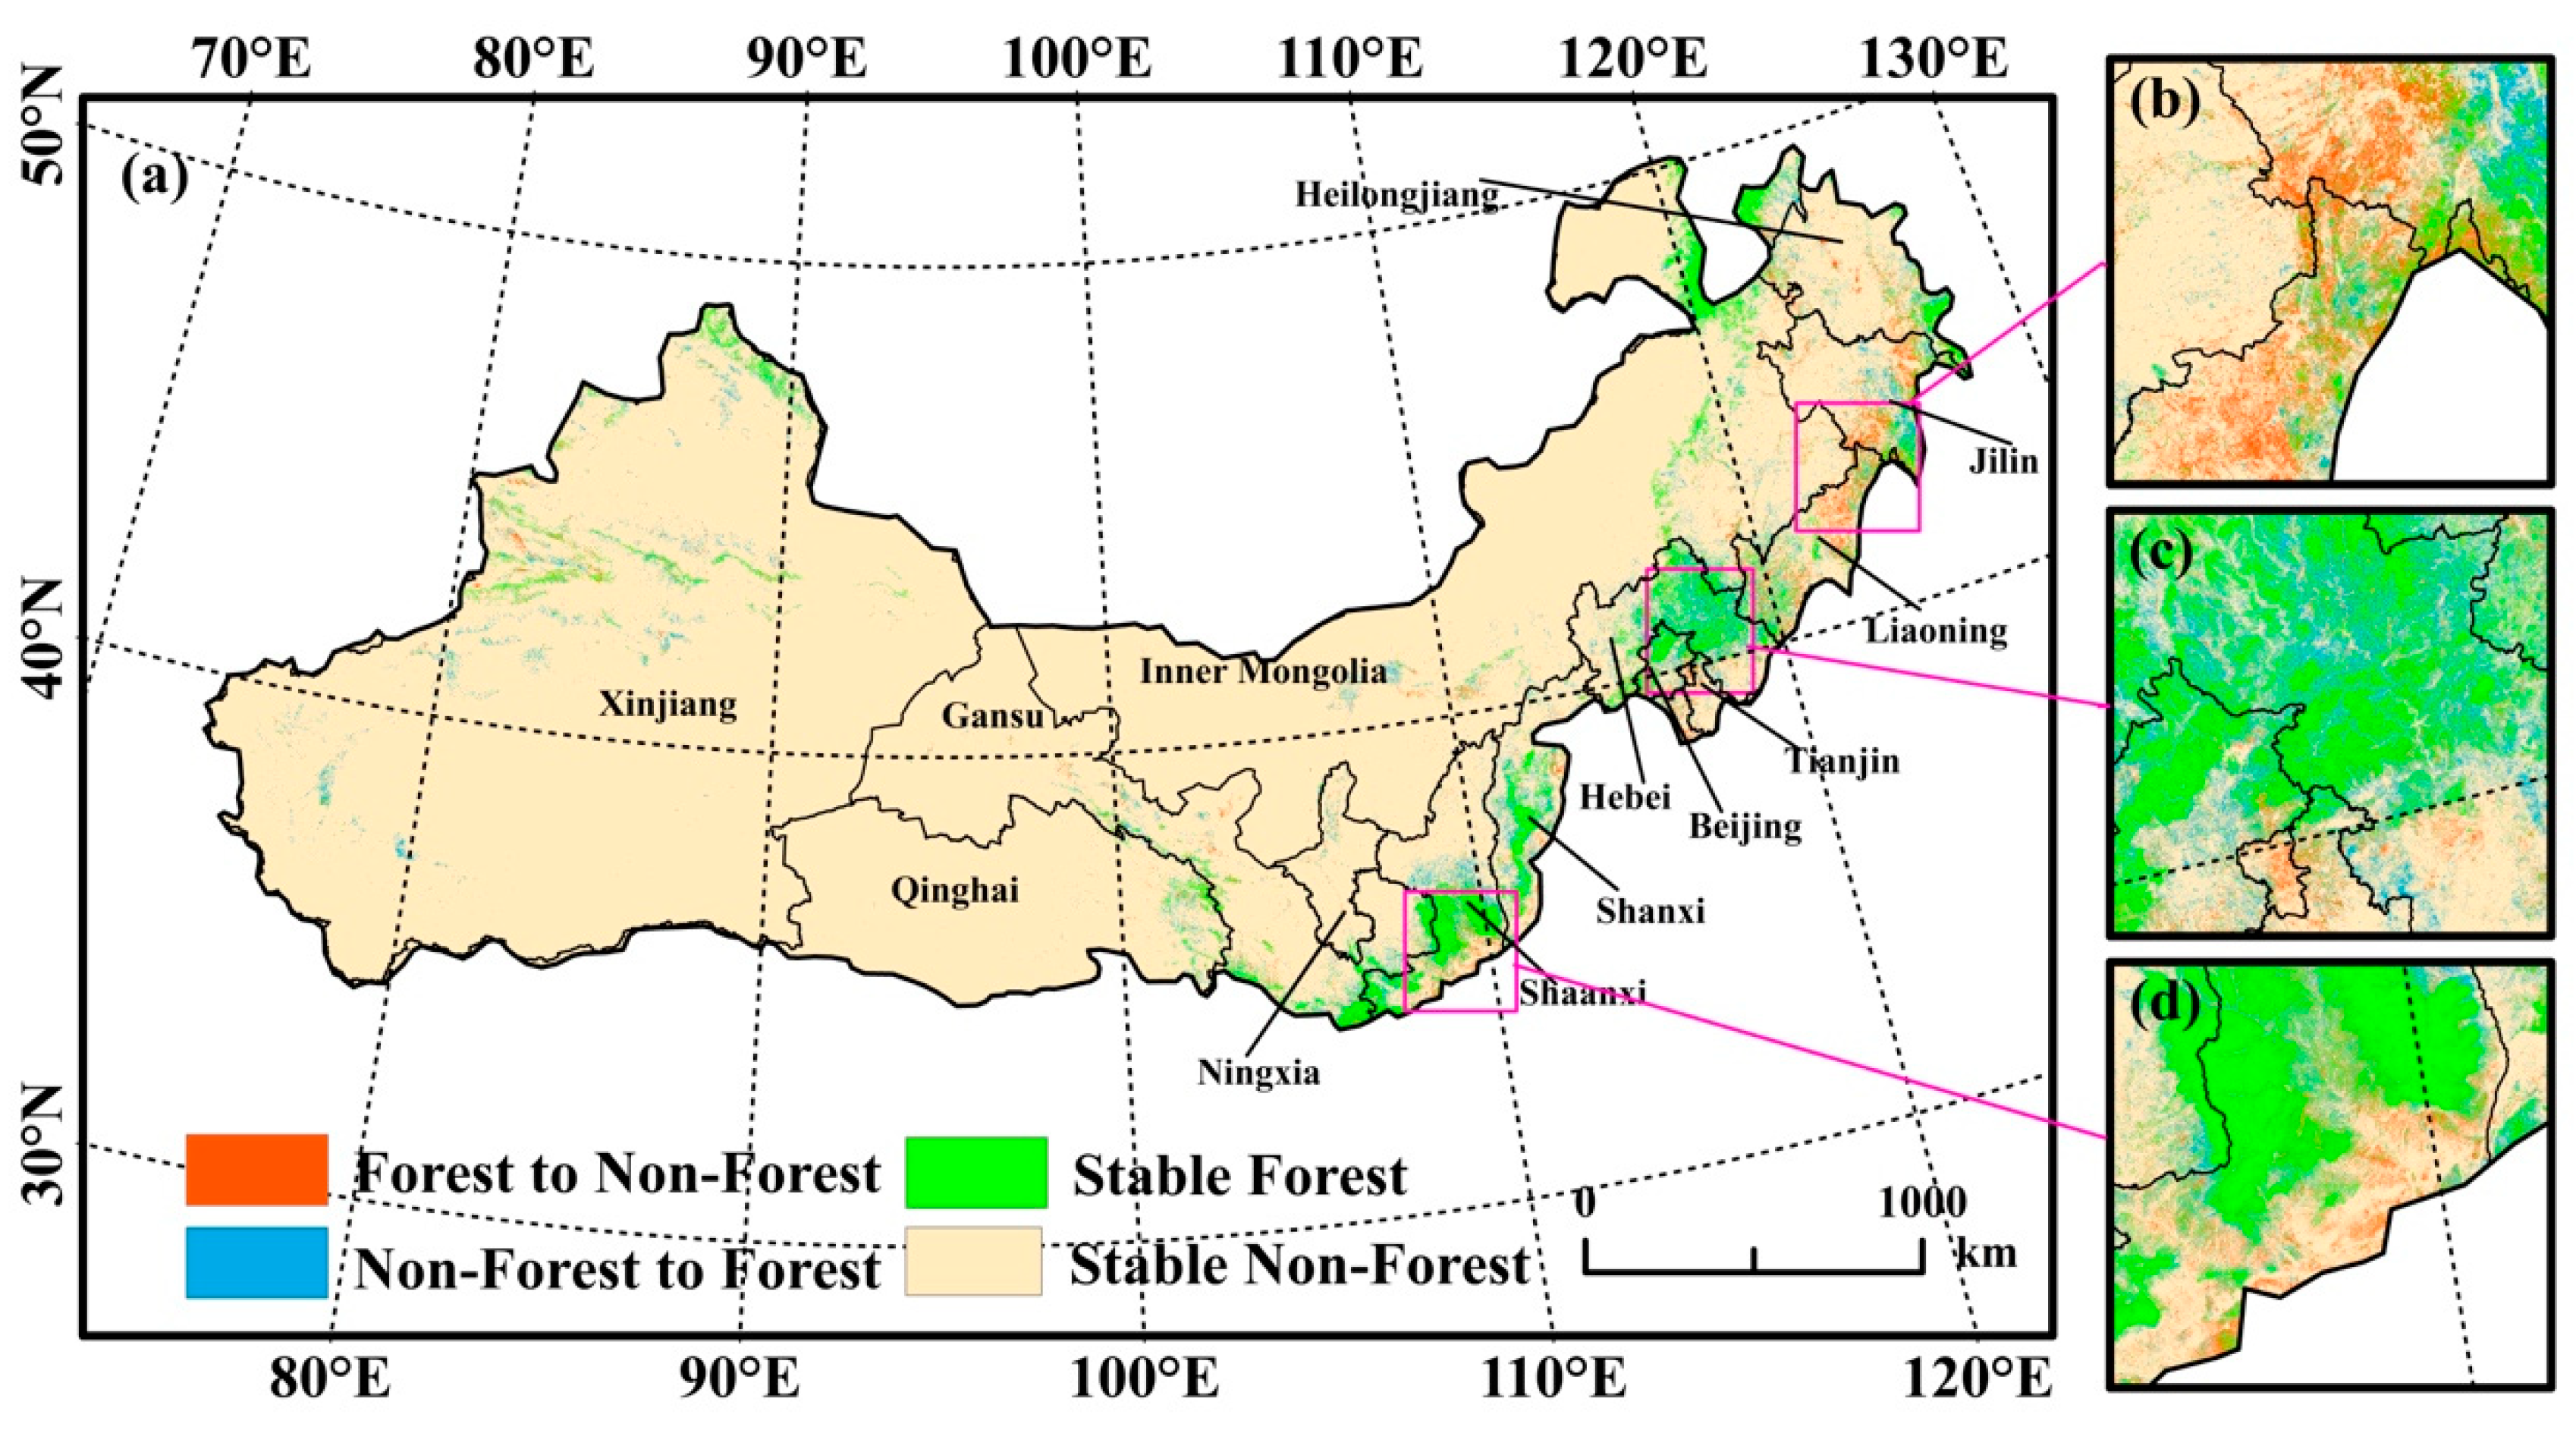
3.3. Forest Spatial Changes during 2007–2017
3.3.1. Accuracy Assessment of Forest Spatial Changes during 2007–2017
3.3.2. Forest Spatial Changes during 2007–2017
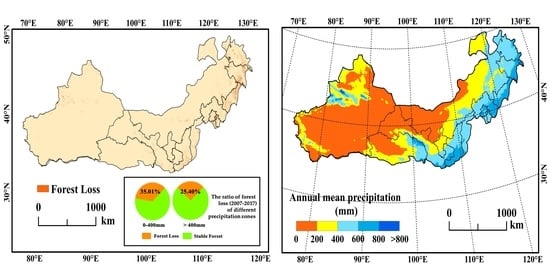
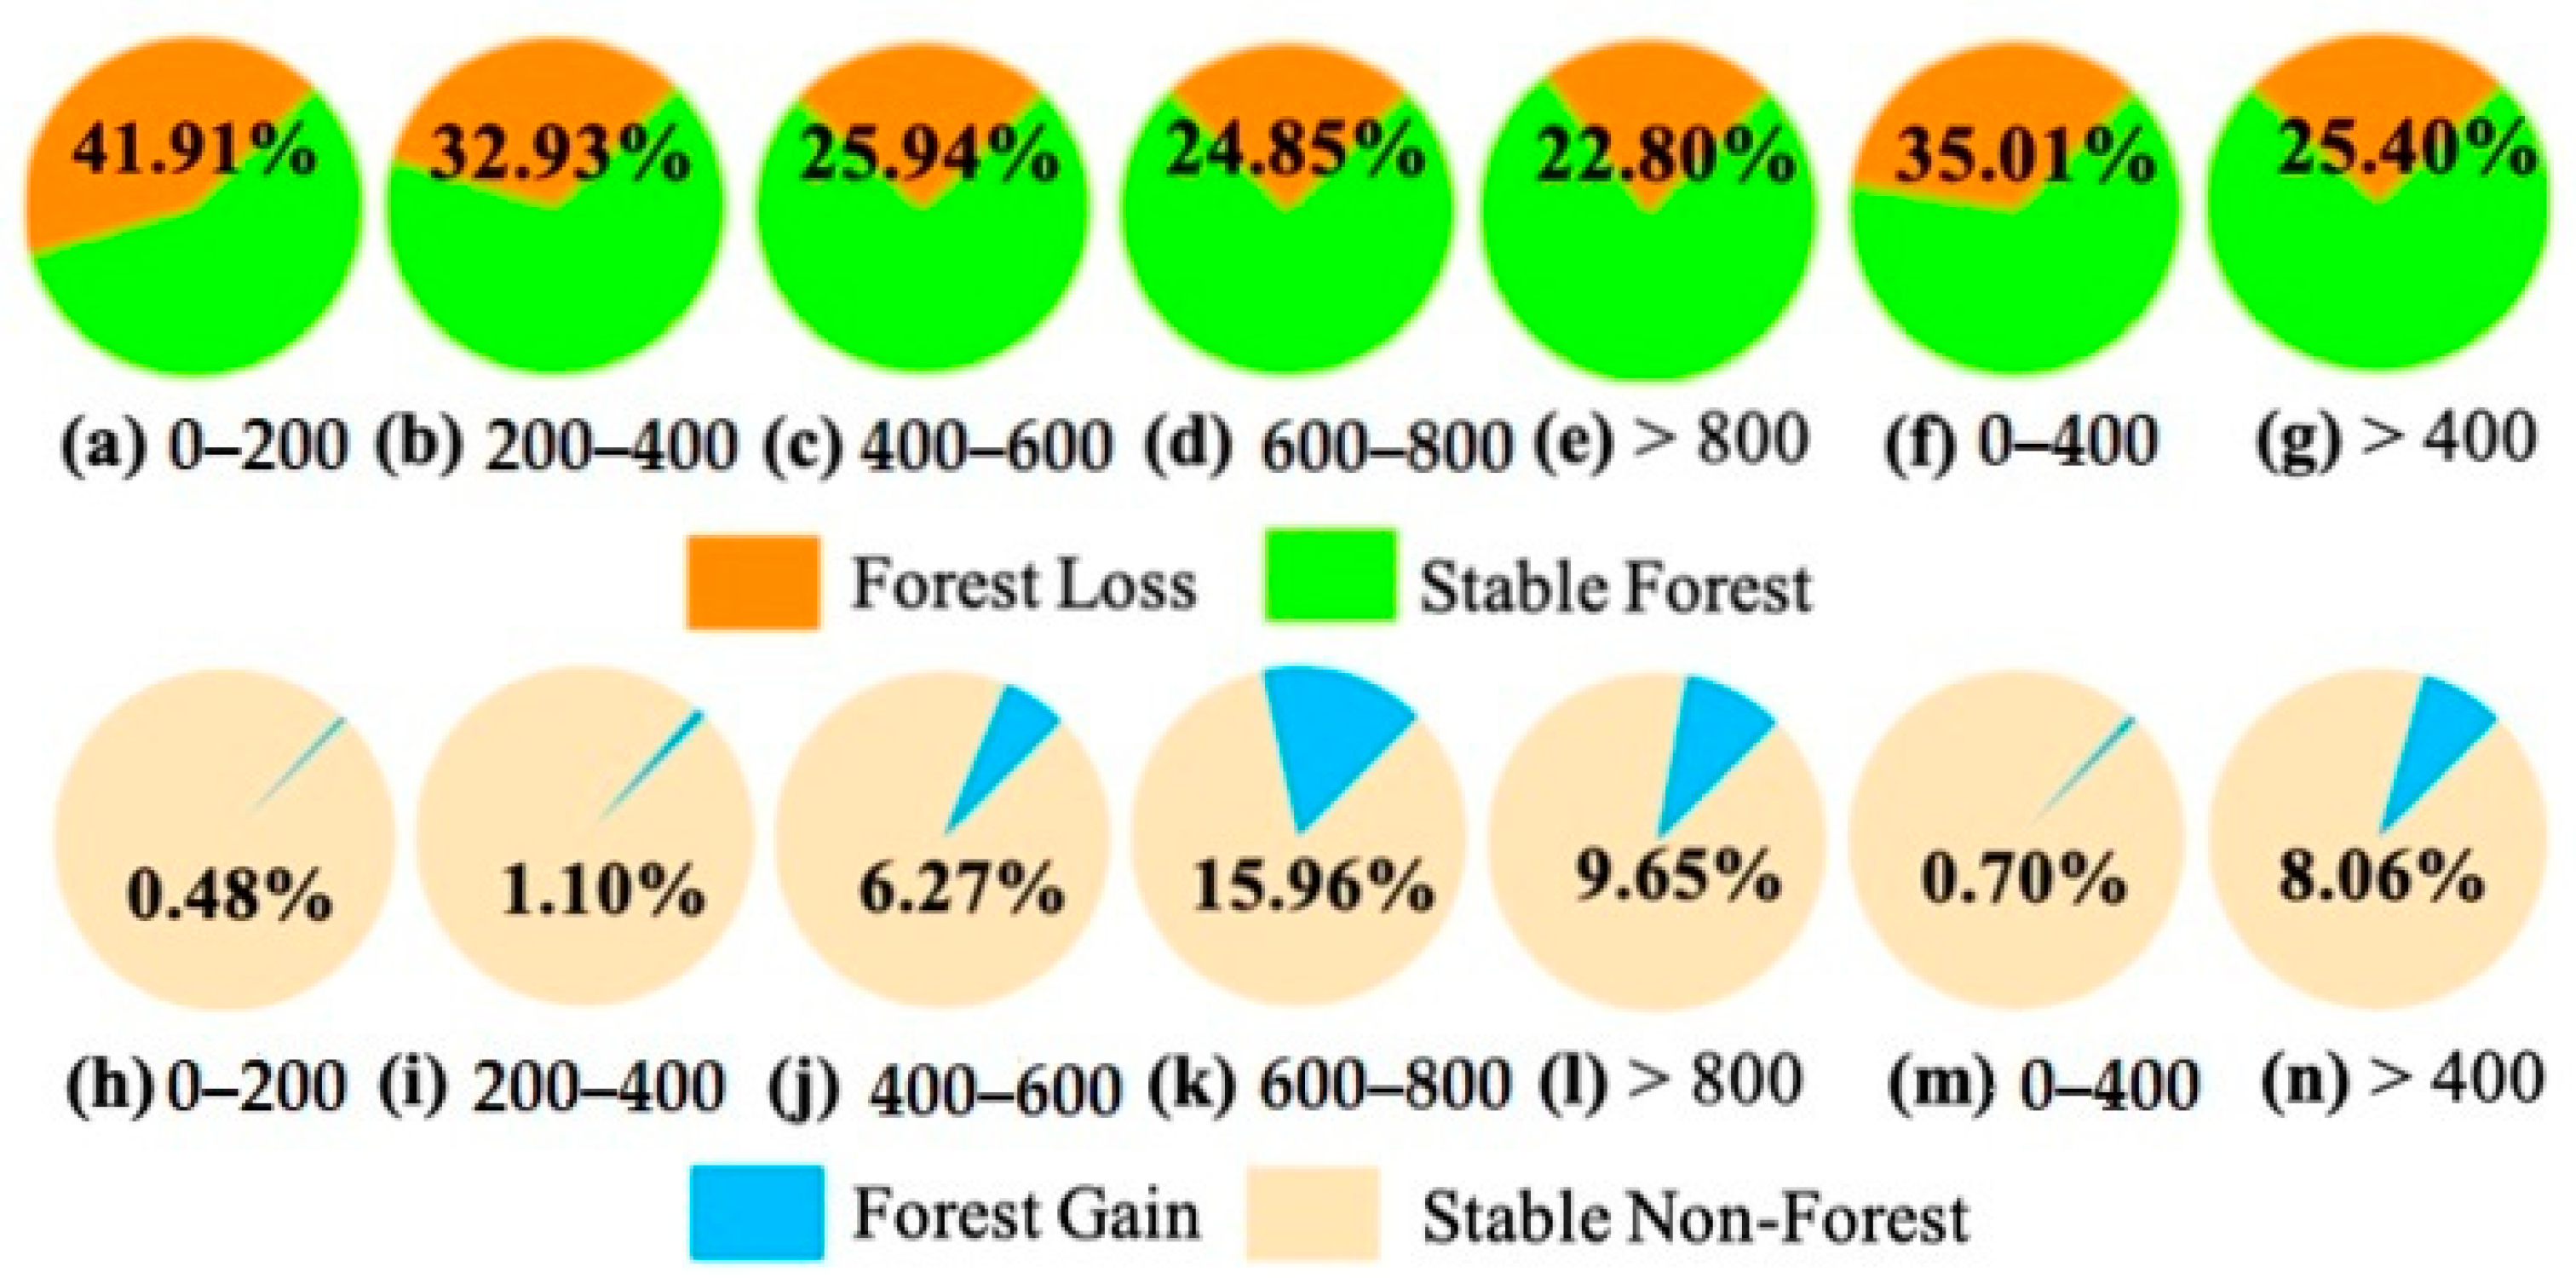
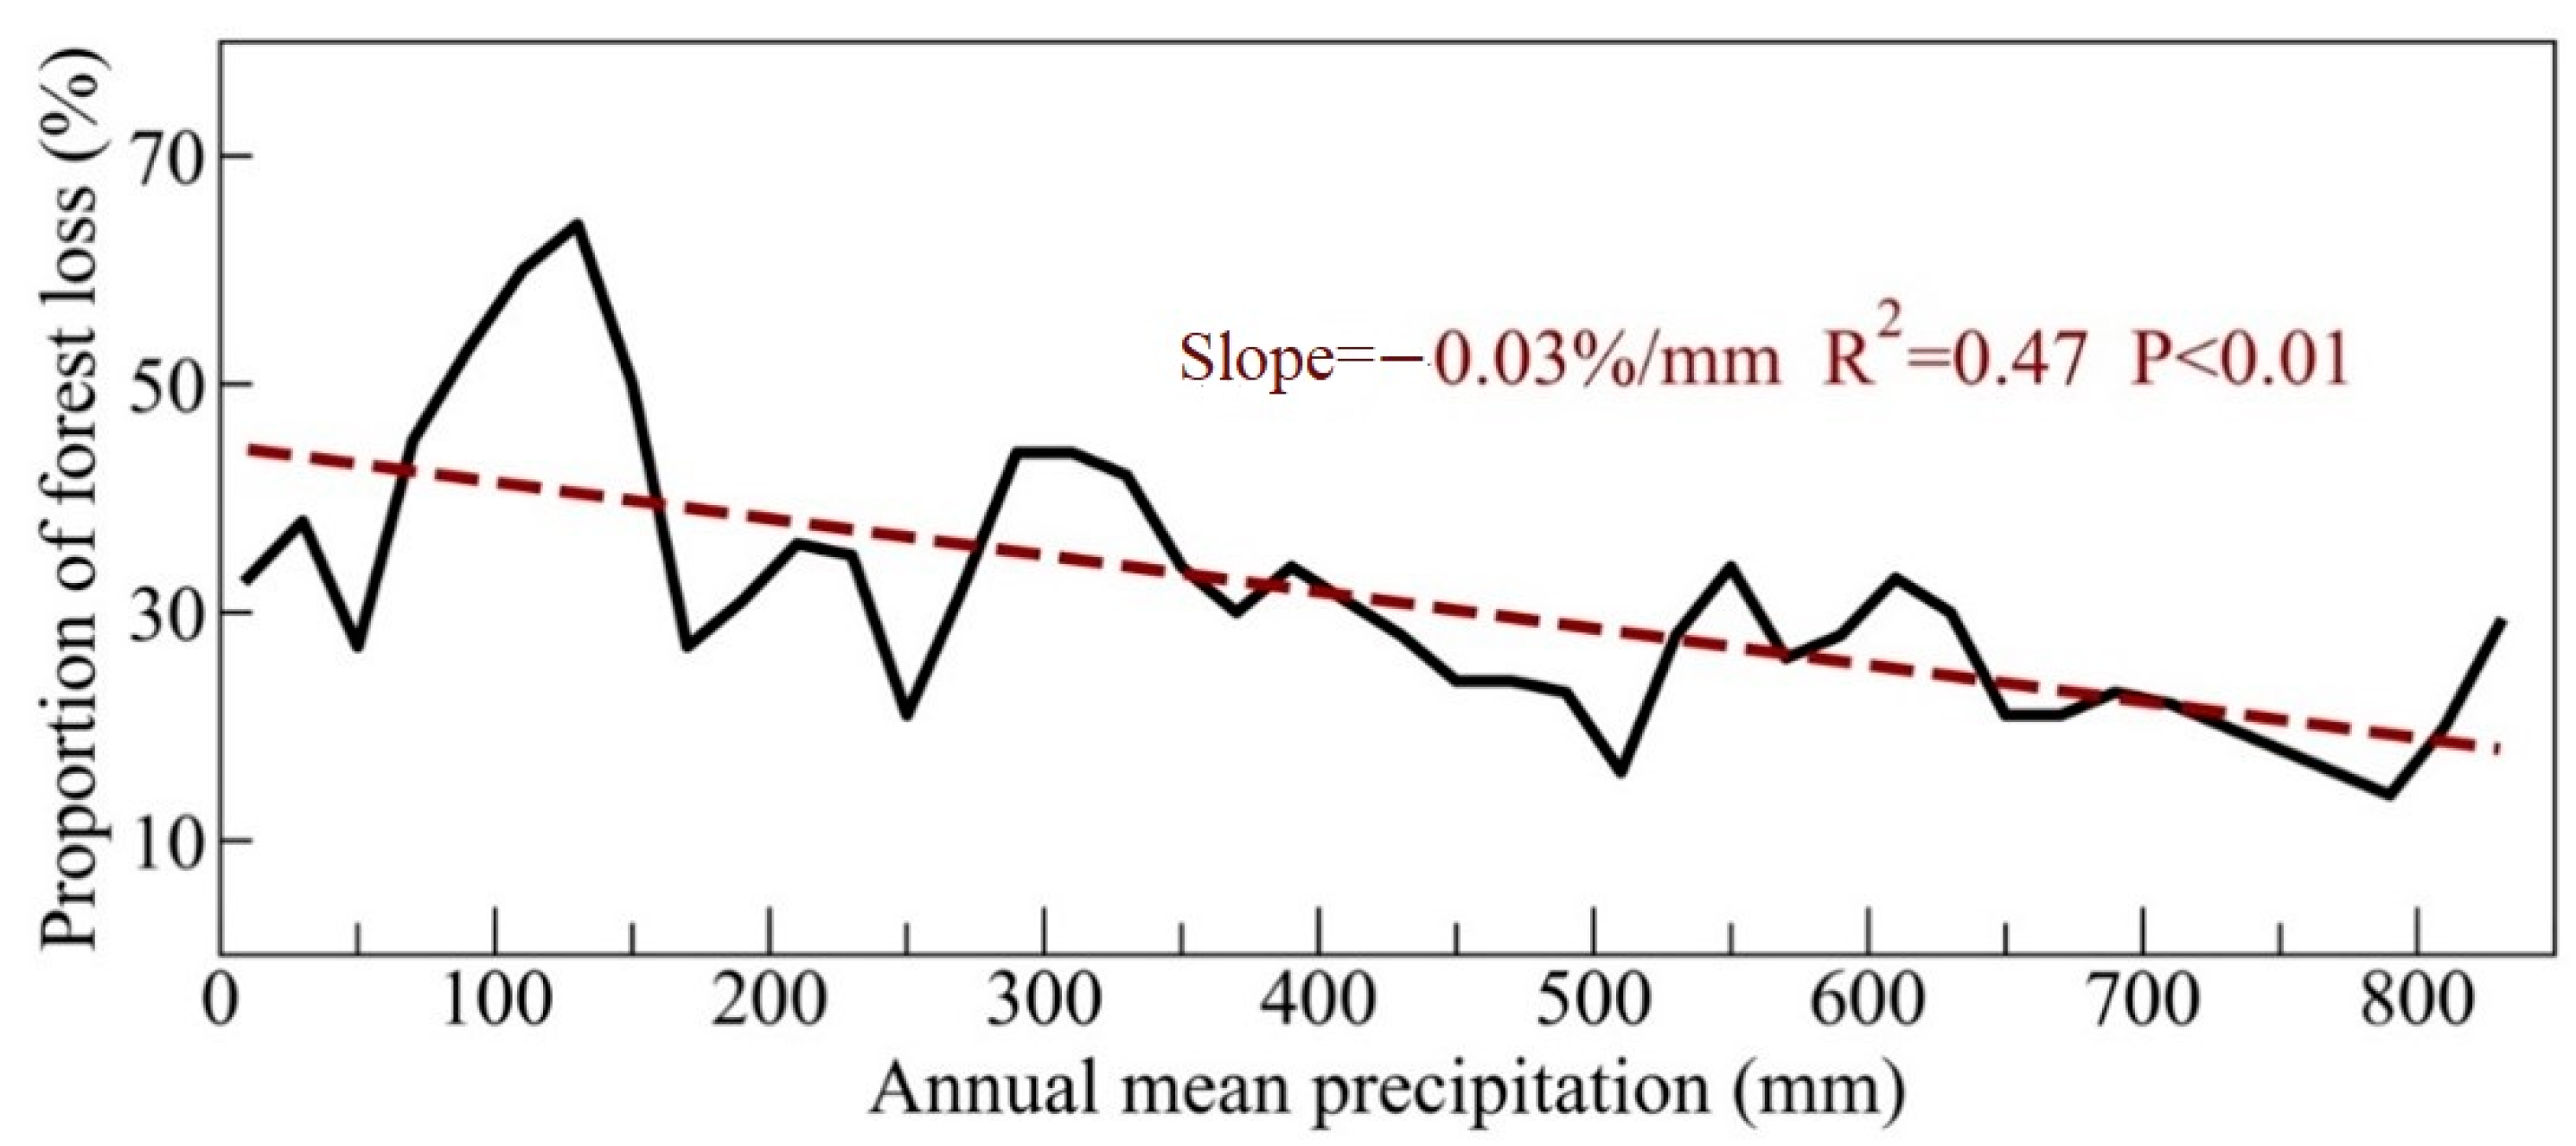
3.4. Forest Changes by Different Precipitation Zones during 2007–2017
4. Discussion
4.1. Forest Mapping Based on PALSAR and Landsat Data Integration in Northern China
4.2. Forest Gain and Loss in Northern China during 2007–2017
4.3. Implication of the PALSAR/Landsat-Based Forest Maps for Forest Management in Northern China
5. Conclusions
Supplementary Materials
Author Contributions
Funding
Institutional Review Board Statement
Informed Consent Statement
Data Availability Statement
Acknowledgments
Conflicts of Interest
References
- Chen, C.; Park, T.; Wang, X.; Piao, S.; Xu, B.; Chaturvedi, R.K.; Fuchs, R.; Brovkin, V.; Ciais, P.; Fensholt, R.; et al. China and India lead in greening of the world through land-use management. Nat. Sustain. 2019, 2, 122–129. [Google Scholar] [CrossRef] [PubMed]
- Huang, S.; Kong, J. Assessing land degradation dynamics and distinguishing human-induced changes from climate factors in the Three-North Shelter forest region of China. ISPRS Int. J. Geo Inf. 2016, 5, 158. [Google Scholar] [CrossRef] [Green Version]
- Lü, Y.; Zhang, L.; Feng, X.; Zeng, Y.; Fu, B.; Yao, X.; Li, J.; Wu, B. Recent ecological transitions in China: Greening, browning and influential factors. Sci. Rep. 2015, 5, 8732. [Google Scholar] [CrossRef] [PubMed]
- Foley, J.A.; DeFries, R.; Asner, G.P.; Barford, C.; Bonan, G.; Carpenter, S.R.; Chapin, F.S.; Coe, M.T.; Daily, G.C.; Gibbs, H.K.; et al. Global Consequences of Land Use. Science 2005, 309, 570–574. [Google Scholar] [CrossRef] [PubMed] [Green Version]
- Zhu, J.; Zheng, X.; Wang, G.; Wu, B.; Liu, S.; Yan, C.; Li, Y.; Sun, Y.; Yan, Q.; Zeng, Y.J.B. Assessment of the world largest afforestation program: Success, failure, and future directions. bioRxiv 2017, 105619. [Google Scholar] [CrossRef] [Green Version]
- Qiu, B.; Chen, G.; Tang, Z.; Lu, D.; Wang, Z.; Chen, C.; Sensing, R. Assessing the Three-North Shelter Forest Program in China by a novel framework for characterizing vegetation changes. ISPRS J. Photogramm. Remote Sens. 2017, 133, 75–88. [Google Scholar] [CrossRef]
- Duan, H.; Yan, C.; Tsunekawa, A.; Song, X.; Li, S.; Xie, J. Assessing vegetation dynamics in the Three-North Shelter Forest region of China using AVHRR NDVI data. Environ. Earth Sci. 2011, 64, 1011–1020. [Google Scholar] [CrossRef]
- State Forestry and Grassland Ad-ministration. 40-Year Comprehensive Evaluation Report of the Three-North Shelterbelt Forest Program; State Forestry and Grassland Administration: Beijing, China, 2018. [Google Scholar]
- Niu, Q.; Xiao, X.; Zhang, Y.; Qin, Y.; Dang, X.; Wang, J.; Zou, Z.; Doughty, R.; Brandt, M.; Tong, X.; et al. Ecological engineering projects increased vegetation cover, production, and biomass in semiarid and subhumid Northern China. Land Degrad. Dev. 2019, 30, 1620–1631. [Google Scholar] [CrossRef] [Green Version]
- He, B.; Chen, A.; Wang, H.; Wang, Q. Dynamic Response of Satellite-Derived Vegetation Growth to Climate Change in the Three North Shelter Forest Region in China. Remote Sens. 2015, 7, 9998–10016. [Google Scholar] [CrossRef] [Green Version]
- Wang, X.; Zhang, C.; Hasi, E.; Dong, Z. Has the Three Norths Forest Shelterbelt Program solved the desertification and dust storm problems in arid and semiarid China? J. Arid. Environ. 2010, 74, 13–22. [Google Scholar] [CrossRef]
- Song, L.-N.; Zhu, J.-J.; Yan, Q.-L. Review on the shelter forest decline. Chin. J. Ecol. 2009, 28, 1684–1690. [Google Scholar]
- Cao, S. Why Large-Scale Afforestation efforts in China Have Failed to Solve the Desertification Problem; ACS Publications: Washington, DC, USA, 2008. [Google Scholar]
- Loveland, T.R.; Reed, B.C.; Brown, J.F.; Ohlen, D.O.; Zhu, Z.; Yang, L.; Merchant, J.W. Development of a global land cover characteristics database and IGBP DISCover from 1 km AVHRR data. Int. J. Remote Sens. 2000, 21, 1303–1330. [Google Scholar] [CrossRef]
- Hansen, M.C.; DeFries, R.S. Detecting Long-term Global Forest Change Using Continuous Fields of Tree-Cover Maps from 8-km Advanced Very High Resolution Radiometer (AVHRR) Data for the Years 1982? Ecosystems 2004, 7, 695–716. [Google Scholar] [CrossRef]
- Hansen, M.C.; Stehman, S.V.; Potapov, P.V.; Loveland, T.R.; Townshend, J.R.; DeFries, R.S.; Pittman, K.W.; Arunarwati, B.; Stolle, F.; Steininger, M.K.; et al. Humid tropical forest clearing from 2000 to 2005 quantified by using multitemporal and multiresolution remotely sensed data. Proc. Natl. Acad. Sci. USA 2008, 105, 9439–9444. [Google Scholar] [CrossRef] [PubMed] [Green Version]
- Hansen, M.C.; DeFries, R.S.; Townshend, J.R.; Carroll, M.; DiMiceli, C.; Sohlberg, R.A. Global percent tree cover at a spatial resolution of 500 m: First results of the MODIS vegetation continuous fields algorithm. Earth Interact. 2003, 7, 1–15. [Google Scholar] [CrossRef] [Green Version]
- Friedl, M.A.; Sulla-Menashe, D.; Tan, B.; Schneider, A.; Ramankutty, N.; Sibley, A.; Huang, X. MODIS Collection 5 global land cover: Algorithm refinements and characterization of new datasets. Remote Sens. Environ. 2010, 114, 168–182. [Google Scholar] [CrossRef]
- Kim, D.-H.; Sexton, J.O.; Noojipady, P.; Huang, C.; Anand, A.; Channan, S.; Feng, M.; Townshend, J.R. Global, Landsat-based forest-cover change from 1990 to 2000. Remote Sens. Environ. 2014, 155, 178–193. [Google Scholar] [CrossRef] [Green Version]
- Hansen, M.C.; Potapov, P.V.; Moore, R.; Hancher, M.; Turubanova, S.A.; Tyukavina, A.; Thau, D.; Stehman, S.; Goetz, S.J.; Loveland, T.R.; et al. High-resolution global maps of 21st-century forest cover change. Science 2013, 342, 850–853. [Google Scholar] [CrossRef] [Green Version]
- Chen, B.; Xiao, X.; Li, X.; Pan, L.; Doughty, R.; Ma, J.; Dong, J.; Qin, Y.; Zhao, B.; Wu, Z.; et al. A mangrove forest map of China in 2015: Analysis of time series Landsat 7/8 and Sentinel-1A imagery in Google Earth Engine cloud computing platform. ISPRS J. Photogramm. Remote Sens. 2017, 131, 104–120. [Google Scholar] [CrossRef]
- Midekisa, A.; Holl, F.; Savory, D.J.; Andrade-Pacheco, R.; Gething, P.W.; Bennett, A.; Sturrock, H.J.W. Mapping land cover change over continental Africa using Landsat and Google Earth Engine cloud computing. PLoS ONE 2017, 12, e0184926. [Google Scholar] [CrossRef]
- Woodcock, C.E.; Allen, R.; Anderson, M.; Belward, A.; Bindschadler, R.; Cohen, W.; Gao, F.; Goward, S.N.; Helder, D.; Helmer, E.; et al. Free Access to Landsat Imagery. Science 2008, 320, 1011a. [Google Scholar] [CrossRef] [PubMed]
- Townshend, J.R.; Masek, J.G.; Huang, C.; Vermote, E.F.; Gao, F.; Channan, S.; Sexton, J.O.; Feng, M.; Narasimhan, R.; Kim, D.; et al. Global characterization and monitoring of forest cover using Landsat data: Opportunities and challenges. Int. J. Digit. Earth 2012, 5, 373–397. [Google Scholar] [CrossRef] [Green Version]
- Jin, S.; Yang, L.; Danielson, P.; Homer, C.G.; Fry, J.; Xian, G. A comprehensive change detection method for updating the National Land Cover Database to circa. Remote Sens. Environ. 2013, 132, 159–175. [Google Scholar] [CrossRef] [Green Version]
- Homer, C.; Dewitz, J.; Yang, L.; Jin, S.; Danielson, P.; Xian, G.; Coulston, J.; Herold, N.; Wickham, J.; Megown, K.; et al. Completion of the 2011 National Land Cover Database for the conterminous United States–representing a decade of land cover change information. Photogramm. Eng. Remote Sens. 2015, 81, 345–354. [Google Scholar]
- Asner, G.P. Cloud cover in Landsat observations of the Brazilian Amazon. Int. J. Remote Sens. 2001, 22, 3855–3862. [Google Scholar] [CrossRef]
- Bastin, J.-F.; Berrahmouni, N.; Grainger, A.; Maniatis, D.; Mollicone, D.; Moore, R.; Patriarca, C.; Picard, N.; Sparrow, B.; Abraham, E.M.; et al. The extent of forest in dryland biomes. Science 2017, 356, 635–638. [Google Scholar] [CrossRef] [Green Version]
- Shimada, M. Long-term stability of L-band normalized radar cross section of Amazon rainforest using the JERS-1 SAR. Can. J. Remote Sens. 2005, 31, 132–137. [Google Scholar] [CrossRef]
- Thapa, R.B.; Itoh, T.; Shimada, M.; Watanabe, M.; Takeshi, M.; Shiraishi, T. Evaluation of ALOS PALSAR sensitivity for characterizing natural forest cover in wider tropical areas. Remote Sens. Environ. 2014, 155, 32–41. [Google Scholar] [CrossRef]
- Reiche, J.; Verbesselt, J.; Hoekman, D.H.; Herold, M. Fusing Landsat and SAR time series to detect deforestation in the tropics. Remote Sens. Environ. 2015, 156, 276–293. [Google Scholar] [CrossRef]
- Shimada, M.; Itoh, T.; Motooka, T.; Watanabe, M.; Shiraishi, T.; Thapa, R.; Lucas, R. New global forest/non-forest maps from ALOS PALSAR data (2007–2010). Remote Sens. Environ. 2014, 155, 13–31. [Google Scholar] [CrossRef]
- Pantze, A.; Santoro, M.; Fransson, J.E. Change detection of boreal forest using bi-temporal ALOS PALSAR backscatter data. Remote Sens. Environ. 2014, 155, 120–128. [Google Scholar] [CrossRef]
- Dong, J.; Xiao, X.; Sheldon, S.; Biradar, C.; Duong, N.D.; Hazarika, M.K. A comparison of forest cover maps in Mainland Southeast Asia from multiple sources: PALSAR, MERIS, MODIS and FRA. Remote Sens. Environ. 2012, 127, 60–73. [Google Scholar] [CrossRef]
- Motohka, T.; Shimada, M.; Uryu, Y.; Setiabudi, B. Using time series PALSAR gamma nought mosaics for automatic detection of tropical deforestation: A test study in Riau, Indonesia. Remote Sens. Environ. 2014, 155, 79–88. [Google Scholar] [CrossRef]
- Jin, H.; Mountrakis, G.; Stehman, S.V.; Sensing, R. Assessing integration of intensity, polarimetric scattering, interferometric coherence and spatial texture metrics in PALSAR-derived land cover classification. ISPRS J. Photogramm. Remote Sens. 2014, 98, 70–84. [Google Scholar]
- Whittle, M.; Quegan, S.; Uryu, Y.; Stüewe, M.; Yulianto, K. Detection of tropical deforestation using ALOS-PALSAR: A Sumatran case study. Remote Sens. Environ. 2012, 124, 83–98. [Google Scholar] [CrossRef]
- Qin, Y.; Xiao, X.; Wang, J.; Dong, J.; Ewing, K.; Hoagland, B.; Hough, D.J.; Fagin, T.D.; Xiao, X.; Geissler, G.L.; et al. Mapping Annual Forest Cover in Sub-Humid and Semi-Arid Regions through Analysis of Landsat and PALSAR Imagery. Remote Sens. 2016, 8, 933. [Google Scholar] [CrossRef] [Green Version]
- Chen, B.; Xiao, X.; Ye, H.; Ma, J.; Doughty, R.; Li, X.; Zhao, B.; Wu, Z.; Sun, R.; Dong, J.; et al. Mapping Forest and Their Spatial–Temporal Changes From 2007 to 2015 in Tropical Hainan Island by Integrating ALOS/ALOS-2 L-Band SAR and Landsat Optical Images. IEEE J. Sel. Top. Appl. Earth Obs. Remote Sens. 2018, 3, 852–867. [Google Scholar] [CrossRef]
- Zhu, Z.; Liu, S.; Di, X. Desertification and Its Control in China; Science Press: Beijing, China, 1989; Volume 54, pp. 5–20. [Google Scholar]
- Shimada, M.; Ohtaki, T.; Sensing, R. Generating large-scale high-quality SAR mosaic datasets: Application to PALSAR data for global monitoring. IEEE J. Sel. Top. Appl. Earth Obs. Remote Sens. 2010, 3, 637–656. [Google Scholar] [CrossRef]
- Rosenqvist, A.; Shimada, M.; Ito, N.; Watanabe, M.; Sensing, R. ALOS PALSAR: A Pathfinder Mission for Global-Scale Monitoring of the Environment. IEEE Trans. Geosci. Remote Sens. 2007, 45, 3307–3316. [Google Scholar] [CrossRef]
- Shimada, M.; Isoguchi, O.; Tadono, T.; Isono, K.; Sensing, R. PALSAR Radiometric and Geometric Calibration. IEEE Trans. Geosci. Remote Sens. 2009, 47, 3915–3932. [Google Scholar] [CrossRef]
- Parker, J.A.; Kenyon, R.V.; Troxel, D.E. Comparison of Interpolating Methods for Image Resampling. IEEE Trans. Med. Imaging 1983, 2, 31–39. [Google Scholar] [CrossRef] [PubMed]
- Foga, S.; Scaramuzza, P.L.; Guo, S.; Zhu, Z.; Dilley, R.D.; Beckmann, T.; Schmidt, G.L.; Dwyer, J.L.; Hughes, M.J.; Laue, B. Cloud detection algorithm comparison and validation for operational Landsat data products. Remote Sens. Environ. 2017, 194, 379–390. [Google Scholar] [CrossRef] [Green Version]
- FAO. Global Forest Resources Assessment 2010: Main Report; Food and Agriculture Organization of the United Nations (FAO): Rome, Italy, 2010. [Google Scholar]
- Zhou, H.; Xu, F.; Dong, J.; Yang, Z.; Zhao, G.; Zhai, J.; Qin, Y.; Xiao, X. Tracking Reforestation in the Loess Plateau, China after the “Grain for Green” Project through Integrating PALSAR and Landsat Imagery. Remote Sens. 2019, 11, 2685. [Google Scholar] [CrossRef] [Green Version]
- Yang, Z.; Dong, J.; Qin, Y.; Ni, W.; Zhao, G.; Chen, W.; Chen, B.; Kou, W.; Wang, J.; Xiao, X. Integrated Analyses of PALSAR and Landsat Imagery Reveal More Agroforests in a Typical Agricultural Production Region, North China Plain. Remote Sens. 2018, 10, 1323. [Google Scholar] [CrossRef] [Green Version]
- Gamon, J.A.; Field, C.B.; Goulden, M.L.; Griffin, K.L.; Hartley, A.E.; Joel, G.; Penuelas, J.; Valentini, R. Relationships Between NDVI, Canopy Structure, and Photosynthesis in Three Californian Vegetation Types. Ecol. Appl. 1995, 5, 28–41. [Google Scholar] [CrossRef] [Green Version]
- Olofsson, P.; Foody, G.M.; Herold, M.; Stehman, S.V.; Woodcock, C.E.; Wulder, M.A. Good practices for estimating area and assessing accuracy of land change. Remote Sens. Environ. 2014, 148, 42–57. [Google Scholar] [CrossRef]
- Mayaux, P.; Eva, H.; Gallego, J.; Strahler, A.H.; Herold, M.; Agrawal, S.; Naumov, S.; De Miranda, E.E.; Di Bella, C.M.; Ordoyne, C.; et al. Validation of the global land cover 2000 map. IEEE Trans. Geosci. Remote Sens. 2006, 44, 1728–1739. [Google Scholar] [CrossRef] [Green Version]
- Yang, Y.; Xiao, P.; Feng, X.; Li, H.; Sensing, R. Accuracy assessment of seven global land cover datasets over China. ISPRS J. Photogramm. Remote Sens. 2017, 125, 156–173. [Google Scholar] [CrossRef]
- Bey, A.; Sánchez-Paus Díaz, A.; Maniatis, D.; Marchi, G.; Mollicone, D.; Ricci, S.; Bastin, J.-F.; Moore, R.; Federici, S.; Rezende, M.; et al. Collect Earth: Land Use and Land Cover Assessment through Augmented Visual Interpretation. Remote Sens. 2016, 8, 807. [Google Scholar] [CrossRef] [Green Version]
- Gong, P.; Wang, J.; Yu, L.; Zhao, Y.; Zhao, Y.; Liang, L.; Niu, Z.; Huang, X.; Fu, H.; Liu, S.; et al. Finer resolution observation and monitoring of global land cover: First mapping results with Landsat TM and ETM+ data. Int. J. Remote Sens. 2012, 34, 2607–2654. [Google Scholar] [CrossRef] [Green Version]
- Chen, J.; Chen, J.; Liao, A.; Cao, X.; Chen, L.; Chen, X.; He, C.; Han, G.; Peng, S.; Lu, M.; et al. Global land cover mapping at 30m resolution: A POK-based operational approach. ISPRS J. Photogramm. Remote Sens. 2015, 103, 7–27. [Google Scholar] [CrossRef] [Green Version]
- Liu, J.; Liu, M.; Tian, H.; Zhuang, D.; Zhang, Z.; Zhang, W.; Tang, X.; Deng, X. Spatial and temporal patterns of China’s cropland during 1990–2000: An analysis based on Landsat TM data. Remote Sens. Environ. 2005, 98, 442–456. [Google Scholar] [CrossRef]
- Liu, J.; Kuang, W.; Zhang, Z.; Xu, X.; Qin, Y.; Ning, J.; Zhou, W.; Zhang, S.; Li, R.; Yan, C.; et al. Spatiotemporal characteristics, patterns, and causes of land-use changes in China since the late 1980s. J. Geogr. Sci. 2014, 24, 195–210. [Google Scholar] [CrossRef]
- Sexton, J.O.; Noojipady, P.; Song, X.-P.; Feng, M.; Song, D.-X.; Kim, D.-H.; Anand, A.; Huang, C.; Channan, S.; Pimm, S.L.; et al. Conservation policy and the measurement of forests. Nat. Clim. Chang. 2016, 6, 192–196. [Google Scholar] [CrossRef]
- Wang, F.; Pan, X.; Gerlein-Safdi, C.; Cao, X.; Wang, S.; Gu, L.; Wang, D.; Lu, Q. Vegetation restoration in N orthern China: A contrasted picture. Land Degrad. Dev. 2020, 31, 669–676. [Google Scholar] [CrossRef]
- Feng, X.; Fu, B.; Piao, S.; Wang, S.; Ciais, P.; Zeng, Z.; Lü, Y.; Zeng, Y.; Li, Y.; Jiang, X.; et al. Revegetation in China’s Loess Plateau is approaching sustainable water resource limits. Nat. Clim. Chang. 2016, 6, 1019–1022. [Google Scholar] [CrossRef]
- Hansen, M.C.; Townshend, J.R.G.; DeFries, R.S.; Carroll, M. Estimation of tree cover using MODIS data at global, continental and regional/local scales. Int. J. Remote Sens. 2005, 26, 4359–4380. [Google Scholar] [CrossRef]
- Wang, G.; Liu, G.; Zhou, S. Research Advance of Soil Dried Layer on Loess Plateau. J. Soil Water Conserv. 2003, 6, 156–159. [Google Scholar]
- Cui, X.; Sui, P.; Xie, G.; Gao, W. Soil Water Effect and Productivity in Poplar and Wheat–Corn Agroforestry Systems. Sci. Agric. Sin. 2006, 39, 758–763. [Google Scholar]
- Su, Y. Review of 25-year’s result of three northern regions shelter forest system project, China. China Sci. Cult. 2004, 3, 42–44. [Google Scholar]
- Feng, H.; Zhang, M. Global land moisture trends: Drier in dry and wetter in wet over land. Sci. Rep. 2015, 5, 18018. [Google Scholar] [CrossRef] [PubMed]
- Chou, C.; Neelin, J.D.; Chen, C.-A.; Tu, J.-Y. Evaluating the “Rich-Get-Richer” Mechanism in Tropical Precipitation Change under Global Warming. J. Clim. 2009, 22, 1982–2005. [Google Scholar] [CrossRef]
- Chou, C.; Chiang, J.C.H.; Lan, C.-W.; Chung, C.-H.; Liao, Y.-C.; Lee, C.-J. Increase in the range between wet and dry season precipitation. Nat. Geosci. 2013, 6, 263–267. [Google Scholar] [CrossRef]
- Liu, H.; Park Williams, A.; Allen, C.D.; Guo, D.; Wu, X.; Anenkhonov, O.A.; Liang, E.; Sandanov, D.V.; Yin, Y.; Qi, Z.; et al. Rapid warming accelerates tree growth decline in semi-arid forests of Inner Asia. Glob. Chang. Biol. 2013, 19, 2500–2510. [Google Scholar] [CrossRef] [PubMed]


| Forest Products | Forest Definition | Spatial Resolution | Classification Algorithms | Data Resources | References |
|---|---|---|---|---|---|
| JAXA F/NF | Tree height ≥ 5 m Canopy cover ≥ 10% | 25 m | Decision Tree | PALSAR | [32] |
| FROM-GLC | Tree height ≥ 3 m Canopy cover ≥ 15% | 30 m | Supervised Classification | Landsat | [54] |
| Globe Land30 | Canopy cover ≥ 10% | 30 m | Pixel-Object-Knowledge (POK)-based approach | Landsat, HJ-1 | [55] |
| NLCD-China | Canopy cover ≥ 10% | 100 m | Visual interpretation approach | Landsat, CBERS, HJ-1 and HJ-1A | [56] |
| PALSAR/Landsat-based map | Tree height ≥ 5 m Canopy cover ≥ 10% | 30 m | Decision Tree | PALSAR/PALSAR-2, Landsat | This study |
| Forest Products | Land Cover Types | UA | PA | OA | Kappa | Consistency |
|---|---|---|---|---|---|---|
| PALSAR/Landsat | Forest | 80% ± 3% | 56% ± 6% | 96% ± 1% | 0.66 | - |
| Non-Forest | 97% ± 1% | 99% ± 0% | ||||
| GlobeLand30 | Forest | 88% ± 3% | 31% ± 3% | 89% ± 1% | 0.43 | 47.47% |
| Non-Forest | 90% ± 1% | 99% ± 0% | 93.06% | |||
| FROM-GLC | Forest | 87% ± 3% | 30% ± 3% | 89% ± 1% | 0.42 | 50.54% |
| Non-Forest | 89% ± 1% | 99% ± 0% | 93.38% | |||
| NLCD-China | Forest | 77% ± 4% | 28% ± 3% | 89% ± 1% | 0.37 | 46.28% |
| Non-Forest | 89% ± 1% | 98% ± 0% | 93.27% | |||
| JAXA F/NF | Forest | 84% ± 3% | 26% ± 2% | 87% ± 1% | 0.29 | 44.40% |
| Non-Forest | 87% ± 1% | 99% ± 0% | 93.64% |
| Class | Reference | ||||||||
|---|---|---|---|---|---|---|---|---|---|
| 1 | 2 | 3 | 4 | Wi | UA | PA | OA | ||
| Map | 1 | 317 | 4 | 18 | 86 | 0.03 | 75% ± 5% | 74% ± 18% | 98% ± 1% |
| 2 | 4 | 356 | 20 | 51 | 0.01 | 83% ± 4% | 80% ± 8% | ||
| 3 | 11 | 2 | 370 | 47 | 0.04 | 86% ± 3% | 89% ± 9% | ||
| 4 | 2 | 1 | 1 | 374 | 0.92 | 98% ± 1% | 99% ± 0% | ||
| Total | 334 | 363 | 409 | 558 | |||||
| 0–200 mm | 200–400 mm | 400–600 mm | 600–800 mm | >800 mm | 0–400 mm | >400 mm | |
|---|---|---|---|---|---|---|---|
| Total area | 1,873,238 | 1,027,372 | 844,123 | 255,323 | 6649 | 2,900,611 | 1,106,096 |
| Forest in 2007 (percentage 1) | 4818 (0.26%) | 15,985 (1.56%) | 99,704 (11.81%) | 87,356 (34.21%) | 2181 (32.80%) | 20,803 (0.72%) | 189,241 (17.11%) |
| Forest in 2017 (percentage 2) | 11,718 (0.63%) | 21,865 (2.13%) | 120,525 (14.28%) | 92,458 (36.21%) | 2114 (31.79%) | 33,583 (1.16%) | 215,097 (19.45%) |
| Forest gain (percentage 3) | 8919 (0.48%) | 11,144 (1.10%) | 46,683 (6.27%) | 26,810 (15.96%) | 431 (9.65%) | 20,063 (0.70%) | 73,924 (8.06%) |
| Forest loss (percentage 4) | 2019 (41.91%) | 5263 (32.93%) | 25,862 (25.94%) | 21,708 (24.85%) | 497 (22.80%) | 7283 (35.01%) | 48,067 (25.40%) |
| Net change (percentage 5) | 6899 (143.19%) | 5880 (36.78%) | 20,820 (20.88%) | 5102 (5.84%) | −66 (3.03%) | 12,780 (61.43%) | 8919 (4.71%) |
Publisher’s Note: MDPI stays neutral with regard to jurisdictional claims in published maps and institutional affiliations. |
© 2021 by the authors. Licensee MDPI, Basel, Switzerland. This article is an open access article distributed under the terms and conditions of the Creative Commons Attribution (CC BY) license (http://creativecommons.org/licenses/by/4.0/).
Share and Cite
Li, H.; Xu, F.; Li, Z.; You, N.; Zhou, H.; Zhou, Y.; Chen, B.; Qin, Y.; Xiao, X.; Dong, J. Forest Changes by Precipitation Zones in Northern China after the Three-North Shelterbelt Forest Program in China. Remote Sens. 2021, 13, 543. https://0-doi-org.brum.beds.ac.uk/10.3390/rs13040543
Li H, Xu F, Li Z, You N, Zhou H, Zhou Y, Chen B, Qin Y, Xiao X, Dong J. Forest Changes by Precipitation Zones in Northern China after the Three-North Shelterbelt Forest Program in China. Remote Sensing. 2021; 13(4):543. https://0-doi-org.brum.beds.ac.uk/10.3390/rs13040543
Chicago/Turabian StyleLi, Han, Fu Xu, Zhichao Li, Nanshan You, Hui Zhou, Yan Zhou, Bangqian Chen, Yuanwei Qin, Xiangming Xiao, and Jinwei Dong. 2021. "Forest Changes by Precipitation Zones in Northern China after the Three-North Shelterbelt Forest Program in China" Remote Sensing 13, no. 4: 543. https://0-doi-org.brum.beds.ac.uk/10.3390/rs13040543