
Multi-Scale Attentive Aggregation for LiDAR Point Cloud Segmentation


1
School of Remote Sensing and Information Engineering, Wuhan University, 129 Luoyu Road, Wuhan 430079, China
2
Department of Physical Geography, Faculty of Geoscience, Utrecht University, Princetonlaan 8, 3584 CB Utrecht, The Netherlands
*
Author to whom correspondence should be addressed.
Remote Sens. 2021, 13(4), 691; https://0-doi-org.brum.beds.ac.uk/10.3390/rs13040691
Submission received: 29 December 2020
/
Revised: 29 January 2021
/
Accepted: 8 February 2021
/
Published: 14 February 2021
Abstract
:Semantic segmentation of LiDAR point clouds has implications in self-driving, robots, and augmented reality, among others. In this paper, we propose a Multi-Scale Attentive Aggregation Network (MSAAN) to achieve the global consistency of point cloud feature representation and super segmentation performance. First, upon a baseline encoder-decoder architecture for point cloud segmentation, namely, RandLA-Net, an attentive skip connection was proposed to replace the commonly used concatenation to balance the encoder and decoder features of the same scales. Second, a channel attentive enhancement module was introduced to the local attention enhancement module to boost the local feature discriminability and aggregate the local channel structure information. Third, we developed a multi-scale feature aggregation method to capture the global structure of a point cloud from both the encoder and the decoder. The experimental results reported that our MSAAN significantly outperformed state-of-the-art methods, i.e., at least 15.3% mIoU improvement for scene-2 of CSPC dataset, 5.2% for scene-5 of CSPC dataset, and 6.6% for Toronto3D dataset.
1. Introduction
1.1. Background
Point clouds contain 3-dimensional (3D) information. Benefitting from the progress of modern sensor technology, high-quality point clouds can be obtained relatively easily. In computer vision and remote sensing, point clouds can be obtained by four main techniques including photogrammetric methods, Light Detection and Ranging (LiDAR) systems, Red Green Blue-Depth (RGB-D) cameras, and Synthetic Aperture Radar (SAR).
LiDAR point clouds are widely used in many 3D understanding tasks nowadays, such as classification, semantic segmentation, object detection; among them, semantic segmentation of LiDAR point clouds is a crucial step toward high-level 3D point cloud understanding, which has significant implication in automatic driving, robotics, augmented reality (AR), smart city, among others. In this work, we focus on developing effective deep learning-based models for the semantic segmentation of LiDAR points clouds, improving from recent developments outlined in the review section below.
1.2. Reviews
Most conventional segmentation methods design and extract handcrafted features such as geographic features, spatial attribution of 3D shapes, histogram statistic from point clouds, and then apply machine learning methods such as Support Vector Machine (SVM) [1], Random Forest (RF) [2], Conditional Random Field (CRF) [3], and Markov Random Field (MRF) [4] to model the designed features for segmenting. Handcrafted features rely on prior knowledge of designers, introduce additional uncertainties from hyper-parameter settings and possess limited generality. Recently, with the emergence of open-source point cloud datasets and the rapid development of GPU technology, deep learning-based methods have dominated the field of point cloud semantic segmentation, which automatically learn high-level semantic representations end-to-end.
Convolutional Neural Network (CNN) has been seen widely in applications, e.g., in image processing, video analysis, and natural language processing [5]. However, conventionally, CNN can only process structural data such as images and cannot be directly applied to unordered and unstructured point clouds. To apply CNN to 3D point clouds, point clouds have been transformed to structural data using multi-view representation [6,7], spherical representation [8,9,10], volumetric representation [11,12,13], lattice representation [14,15], and hybrid representation [16,17]. However, this kind of method confronts problems in memory consumption and inaccurate expression, among others.
Currently, the mainstream technology is those methods that directly process unstructured point clouds, which can be separated into four categories: point-wise MLP methods, point convolution methods, RNN-based methods, and graph-based methods [18].
Point-wise MLP methods. These methods apply shared-MLPs as basic units. The pioneer of this kind of method is PointNet [19]. PointNet applies MLPs and symmetric pooling function to learn global features of input points. However, global features cannot capture local structural information and relations between points, which limits the ability of the network. PointNet++ [20] divides the point cloud into a set of small point clouds and extracts local features by using PointNet as a basic unit. Inspired by and based on PointNet and PointNet++, some modules are further introduced to learn local features better. [21] proposed a PointSIFT module to achieve orientation encoding and scale awareness to adapt to eight orientations and patterns of different scales. PointWeb [22] proposed an Adaptive Feature Adjustment (AFA) module to learn relationships among local neighboring points. RandLA-Net [23] proposed an efficient and lightweight network to process 3D point clouds by applying random down-sampling to boost efficiency and save memory, introducing a local geometric feature extraction module to capture geometric information, and utilizing an attentive pooling module to aggregate local features.
Point convolution methods. Efficient convolutional operations are proposed for point clouds. PointCNN [24] learned an X-transformation from the input points, which could weight input features associated with the points and permute the points into a latent and potentially canonical order. KPConv [25] proposed a new convolutional operation, KPConv, where the weights of convolutional kernels were assigned to the input points close to them based on the Euclidean distances.
RNN-based methods. These methods are applied to capture intrinsic contextual features of point clouds. [26] proposed a point-wise pyramid pooling module to capture local coarse-to-fine structures and utilizes two-directional hierarchical RNNs to obtain spatial long-range discrepancies.
Graph-based methods. These methods focus on capturing potential shapes and geometric structures. SPG [27] defined point clouds as a set of simple shapes and super-points and generated directed graphs to capture structural and contextual information. GACNet [28] proposed a graph attention convolution to learn features from local regions selectively, with learnable shapes of kernels to adapt to objects with different shapes.
Despite the current progress of point cloud segmentation, further improvements are envisioned. First, the attention mechanism [29,30], which has been shown to be effective for the global balance and consistency of the encoder and decoder features in recent image segmentation [31,32], has not been applied to point cloud segmentation methods. Refs. [20,22,23,24,25,28] only apply the traditional skip connection, i.e., a concatenation operation, to combine encoder and decoder, which results in a semantic gap between the feature layers. Second, the multi-scale convolutional features are critical for grasping the entire structure of a point cloud, but most of the recent methods [20,21,22,23,24,25,27,28] only focus on the structures of input format and the encoder but neglect multi-scale information fusion in the decoder. The accuracy of point cloud segmentation is expected to improve with a careful design of considering the attention modules and the multi-scale information fusion. In addition, the details of CNN structures can also be improved towards better local feature representation.
1.3. Our Works
In this paper, we propose a Multi-Scale Attentive Aggregation Network (MSAAN) for LiDAR point cloud semantic segmentation to address the above-mentioned limitations. Our contributions are summarized as follows.
- (1)
- An Attentive Skip Connection (ASC) module based on the attention mechanism was proposed to replace the traditional skip connection to bridge the semantic gap between point cloud features in the encoder and decoder.
- (2)
- A multi-scale aggregation was introduced to fuse point-cloud features of different scales not only from the decoder but also from the encoder.
- (3)
- A Channel Attentive Enhancement (CAE) module was introduced to the local spatial encoding module of RandLA-Net [23] to further increase the representation ability of local features.
- (4)
- Our MSAAN significantly outperformed state-of-art methods on the CSPC and Toronto3D datasets with at least 5% on mean intersection over union (mIoU) score.
2. Methods
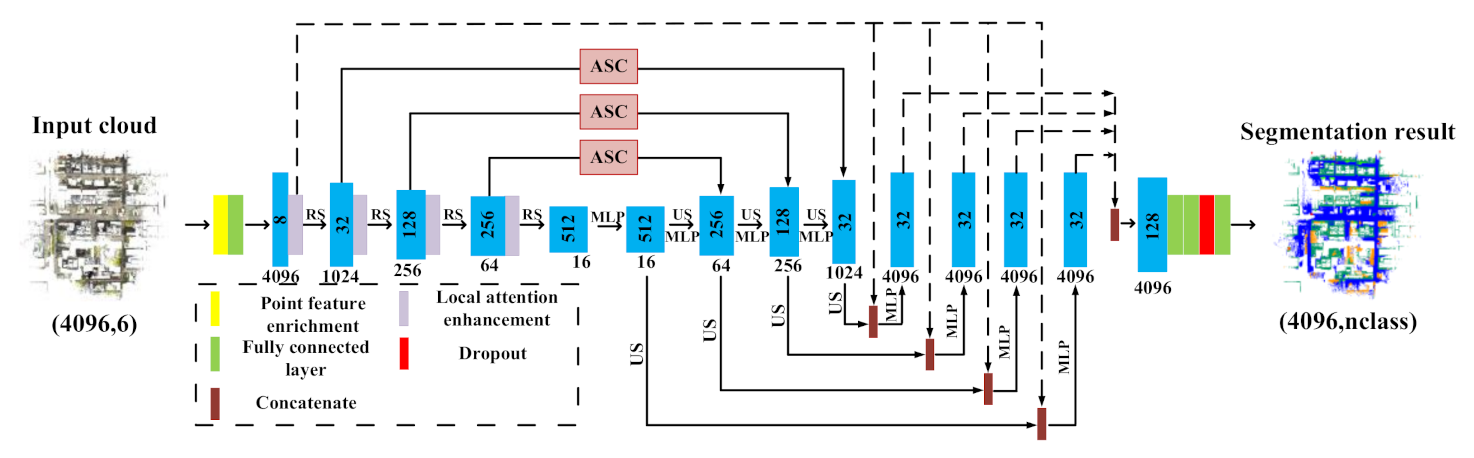
The proposed Multi-Scale Attentive Aggregation Network (MSAAN) accessed the large-scale point clouds as a single input and predicted a segmentation map that assigns each point to a category. MSAAN was developed on top of the recent RandLA-Net [23]. Several key adjustments are made for improvements. The framework, an encoder-decoder style structure, is shown in Figure 1 and detailed in Section 2.1. The input data was firstly processed by a Point Feature Enrichment (PFE) module, which is detailed in Section 2.2. Each layer of encoder passes through a Local Attention Enhancement (LAE) module and the output features were then randomly sampled for learning efficiently the local features of the point cloud, as detailed in Section 2.3. In Section 2.4, we fused the encoder and decoder features at the same scale by a proposed Attentive Skip Connection (ASC) module to obtain more balanced and distinctive semantic information instead of a common skip connection. We describe our multi-scale output aggregation for fusing features from different scales in Section 2.5.
2.1. Backbone of the Encoder
We followed the strategy of RandLA-Net [23], which sampled the whole point cloud probabilistically. At each batch of the learning loop, only one point with the minimum probability was selected and taken as a center point to query N points from a pre-constructed K-D tree based on the Euclidean distance; all of them constituted the input data, denoted as F∈RN×d (Figure 1), where d is the number of observational values of each point, for example, that d equals 6 typically indicates the longitude, latitude, and altitude (x, y, z) which form the coordinate and three color bands R, G, B. The probability of these selected N points was then be enlarged to ensure new points would be selected. This way quickly and evenly samples the point clouds and avoids segmenting an object into many parts, which has been demonstrated superior to those previous studies [20,21,22,24], which take sliced local patches as the network input. The input data F was passed through the PFE layer to obtain a new richer feature FE∈RN×[(d + 3)*K], where 3 was the number of values determining the coordinate, and K represented the number of nearest points and indicates the information of neighbor points was integrated into the features of the current point. Typically, N is far greater than K, in this work, N = 4096 and K = 16. FE then passed through a fully connected layer to obtain the input point cloud feature Fin∈RN×8 for the encoder. The backbone network consisted of layers of four scales. In the encoder, the features passed through the LAE and the random sampling layer, the latter created the next scale with the down-sampling rate a quarter.
2.2. PFE (Point Feature Enrichment) Module
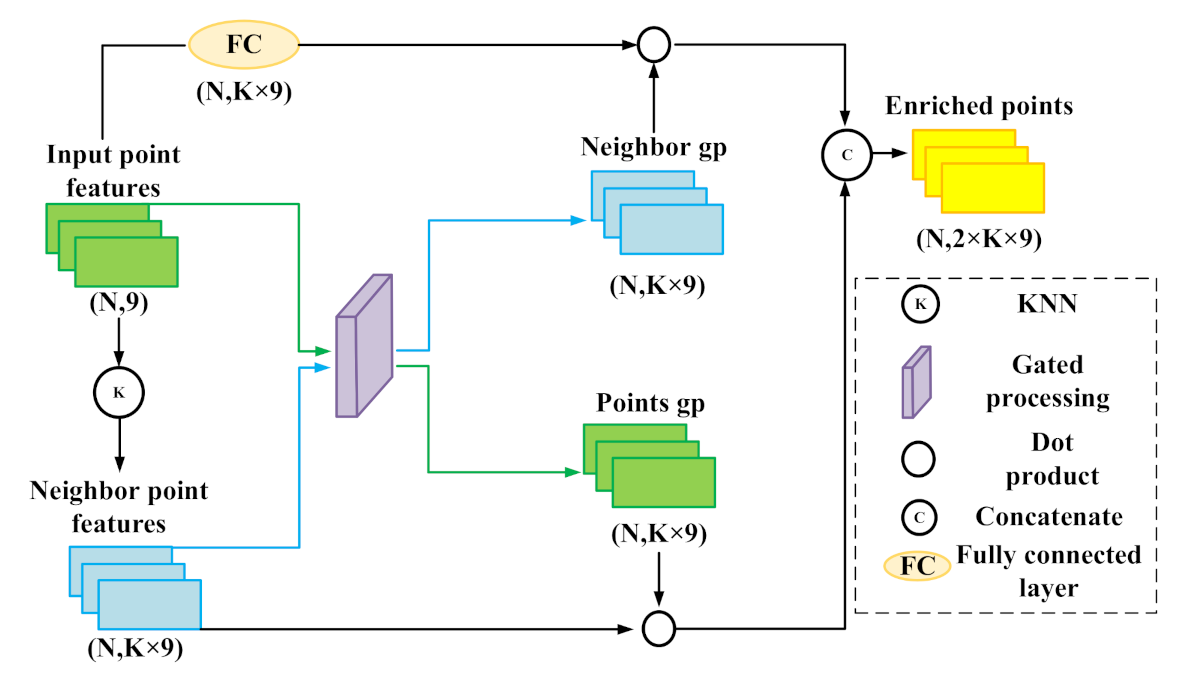
We applied a PFE module [33] as the preprocessor of the original input data. The PFE layer applies a gated fusion strategy to enrich the input data of the segmentation network by incorporating information of the current point and its neighboring points. The PFE module is illustrated in Figure 2, (please refer to [33] for a detailed description).
2.3. LAE (Local Attention Enhancement) Module
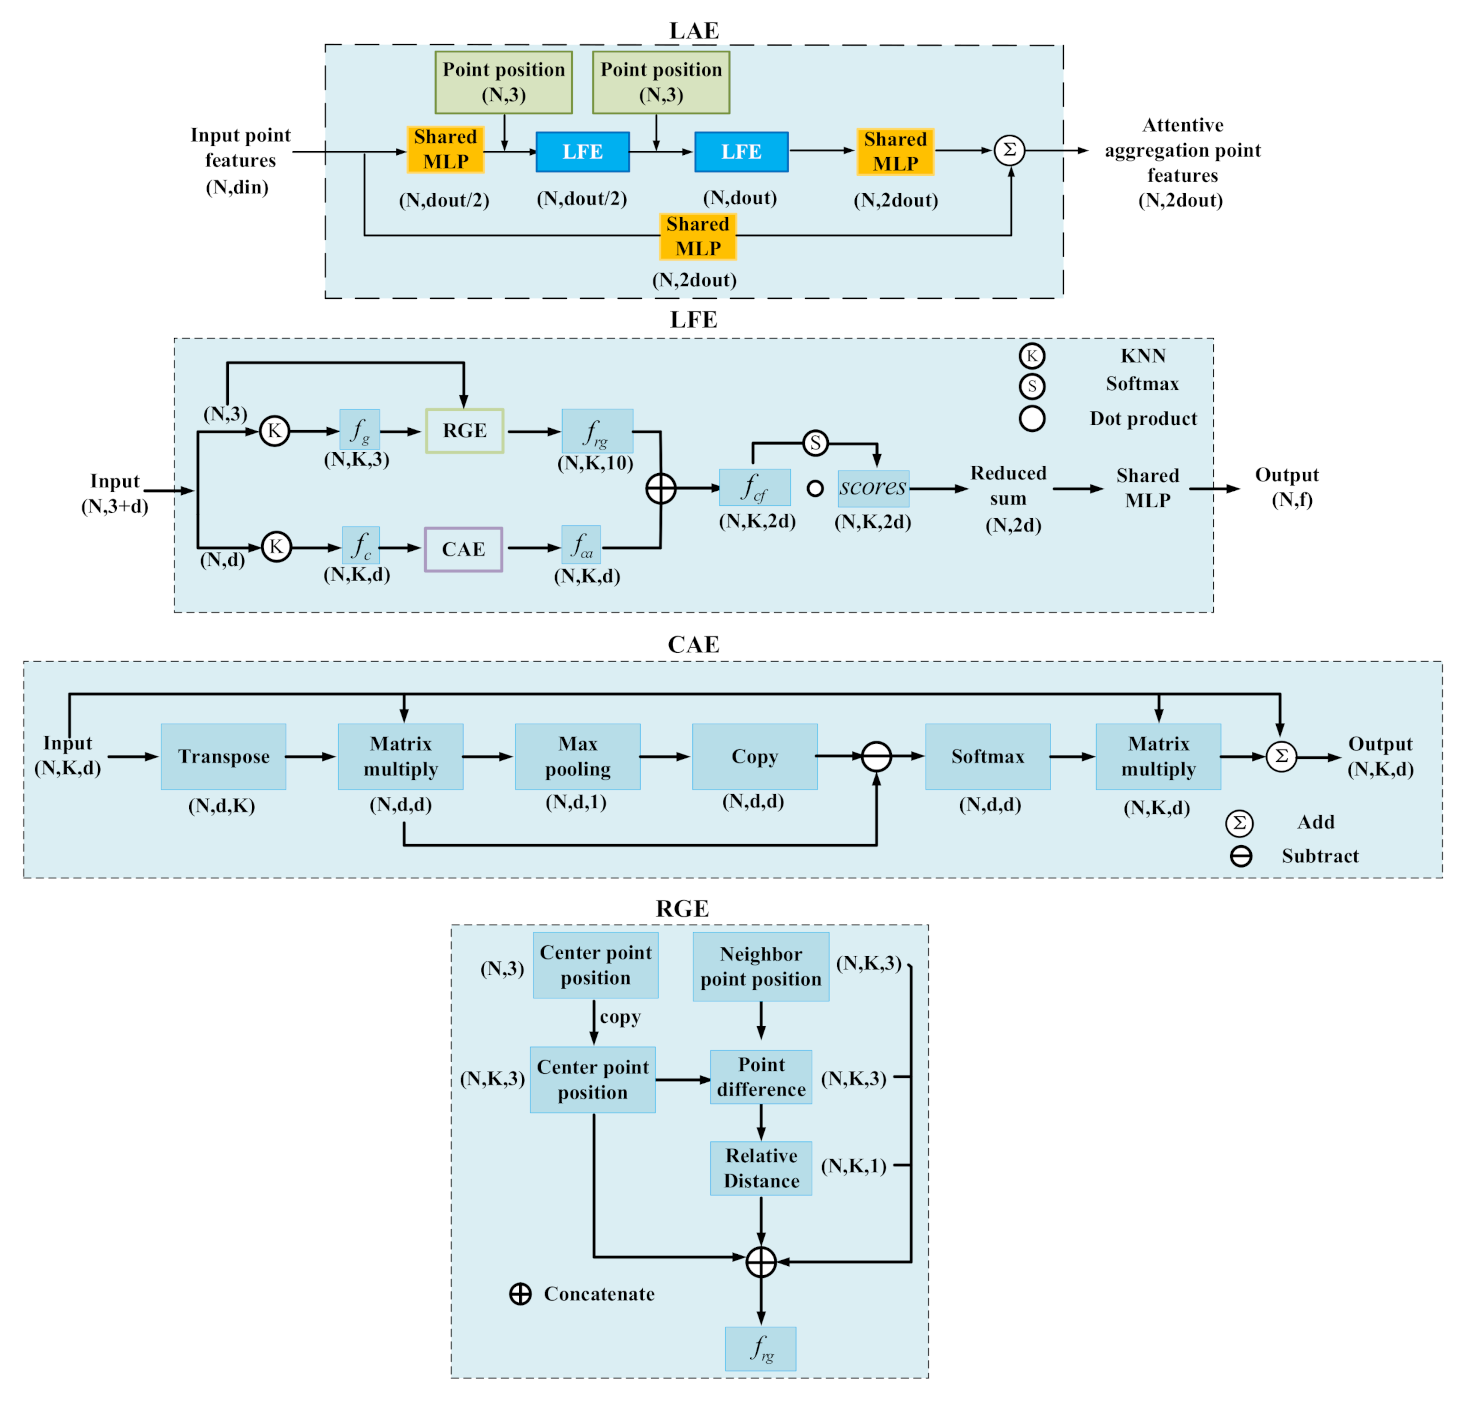
The original LAE module was proposed by [23]. In this paper, we revised the LAE structure by adding a channel attentive enhancement (CAE) branch into the second branch of the Local Feature Enhancement (LFE) layer. The original LAE only extracts relative geographic features to obtain the spatial structure of the point cloud, the introduction of CAE captures the discrepancies of different channels and re-balances them along the channel direction. The structure of the revised LAE is illustrated in Figure 3. We mainly introduced the newly added CAE and referred to [23] for detailed descriptions of the other parts such as LFE and Relative Geographic Extraction (RGE). CAE was constructed as follows. Firstly, we obtained the feature map F∈RN×K×d of K neighboring points of N input points and transposed F as B∈RN×d×K. The third dimension of the multiplication result of F and B is reduced to 1 with a max pooling operation and restored to d with a copy operation. The multiplication result of F and B is subtracted from it. Then, we obtain the attentive weight matrix W∈RN×d×d by the following operation:
The weight W was used to update F:
2.4. ASC (Attentive Skip Connection) Module
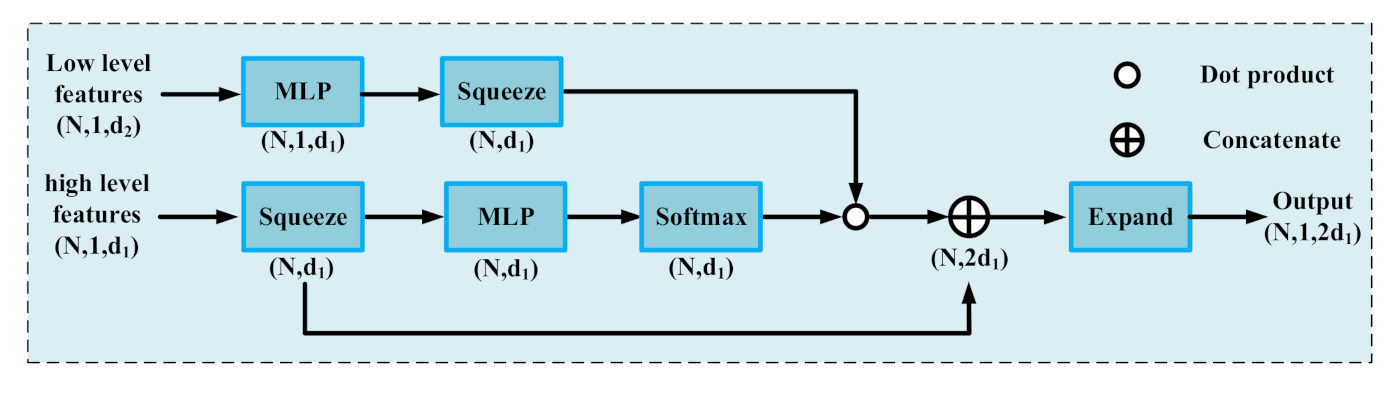
Inspired by [34], we proposed an ASC module for balancing the encoder and decoder features. The ASC module bridges the semantic gap between features in encoder and decoder to achieve a better feature representation with global consistency. The module is detailed in Figure 4. The low-level features here present features in the encoder stage, and the high-level features present features of the decoder stage at the same scale. We computed attentive scores of the high-level features with a squeeze, an MLP, and a softmax operation, the scores were multiplied with the low-level features that had passed through an MLP and been squeezed. Finally, we concatenated the attentive low-level features and the squeezed high-level features as the final output of this module after an expansion operation.
2.5. Multi-Scale Aggregation
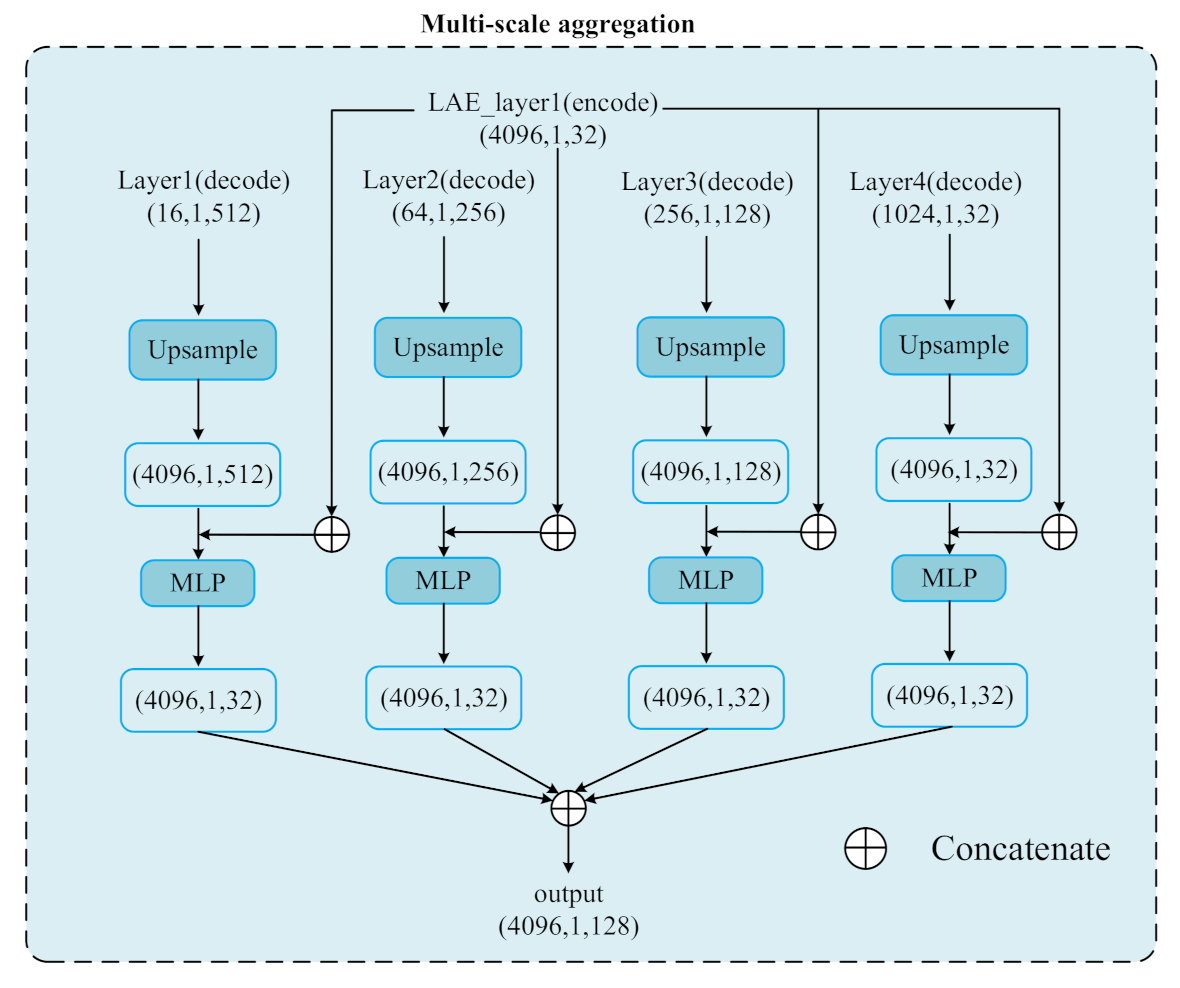
The multi-scale feature aggregation of the decoder has been proved effective in image segmentation but not in point cloud segmentation. We proposed our aggregation method for point cloud segmentation, which is different from the commonly-used strategies in image processing, which only utilize the information of the decoder [35,36]. It is worth noting that the encoder information was introduced into image segmentation very recently [37]. In this work, we first upsampled the features of each scale in the decoder to the spatial dimension of the input, then concatenated them with the output features of the first LAE layer in the encoder. The concatenated features passed through an MLP, a fully connected layer without spatial dimension reduction, to obtain new features with 32 channels. The new features at four scales were concatenated to form a 128-d feature map, as shown in Figure 5. The map was then compressed with two fully connected layers, a dropout layer, and a fully connected layer to output the categories, as shown in Figure 1.
3. Experiments and Analysis
3.1. Experiment Design
CSPC (Complex Scene Point Cloud dataset) is the most recent point cloud dataset for semantic segmentation of large-scale outdoor scenes, covering five urban and rural scenes where scene-1 shows a simple street, scene-2 shows a busy urban street, scene-3 shows a busy urban street at night, scene-4 shows a campus, and scene-5 shows a rural street. This dataset includes 68 million points, including six objects: ground, car, building, vegetation, bridge, and pole. The point numbers of each category are listed in Table 1. Every point is attached to six property values, three for positions and three for RGB colors.
Toronto3D covers a street of 1000 m length, including four areas, L001, L002, L003, and L004, and 78.3 million points. Every point possesses the information of 3D position, RGB color, intensity, GPS time, scan angle rank, and category. There are eight categories including road, road marking, natural, building, utility line, pole, car, and fence. The point numbers of each category are listed in Table 2.
We applied three representative metrics, Intersection over Union (IoU) of each class, mean IoU (mIoU), and Overall Accuracy (OA) to evaluate the performances of our method and the methods to be compared. The mIoU was considered as the main index.
We set K to 16 in the K nearest searching and N to 4096 in each batch. The training epochs of CSPC and Toronto3D were both set to 100. The learning rate was set to 0.01. Our algorithm was implemented with TensorFlow 1.11 and CUDA 9.0 on Ubuntu 16.04 system. An Nvidia 1080 TI 11 G GPU is used. The source code is available at http://gpcv.whu.edu.cn/data/, accessed on 8 February 2021.
3.2. Experiments and Analysis
CSPC Dataset. We set scene-1, scene-3, and scene-4 as training sets, while scene-2 and scene-5 were testing sets. We compared our method with SnapNet [40], 3D-CNN [41], DeepNet [42], PointNet++ [20], KPConv [25], and RandLA-Net [23]. The results are shown in Table 3 and Table 4. First, our methods sweepingly and significantly outperformed the baseline and third-best RandLA-Net. The introduction of the attentive skip connection, the multi-scale aggregation, and the Channel Attentive Enhancement (CAE) branch in LAE lead to improvements of 15.3% and 5.2% on mIoU with scene-2 and scene-5. Second, our method outperformed the second-best KPConv 10.2% and 3.0% on mIoU. KPConv proposed a convolutional operation named KPConv to capture local features whose weights were defined by a set of convolution kernels. By contrast, our method processes the complete grid by random sampling and multi-scale feature aggregation, which firmly grasps the global information at each learning loop. Third, there was a large dissimilarity in performance between the earlier studies, including SnapNet, 3D CNN, and DeepNet, PointNet++, and the recent RandLA-Net, and ours (Table 3 and Table 4). The earlier ones have much worse performance, for example, the mIoU scores were at least 20% lower than the recent scores. SnapNet, which projects 3D point cloud into 2D images of multi-views and uses deep learning-based methods to segment these images to realize the segmentation of point cloud performed the worst. PointNet++ applies point-wise MLPs to extract local features. 3D-CNN transforms point cloud to sparse voxels as the inputs of a 3D CNN for segmenting. DeepNet transforms 3D point cloud into voxels as well. All of them lack the ability to grasp the complete and global point cloud structure. In addition, our method shows strength in identifying sparse points, as indicated by the significant improvement in performance in classifying poles and bridges.
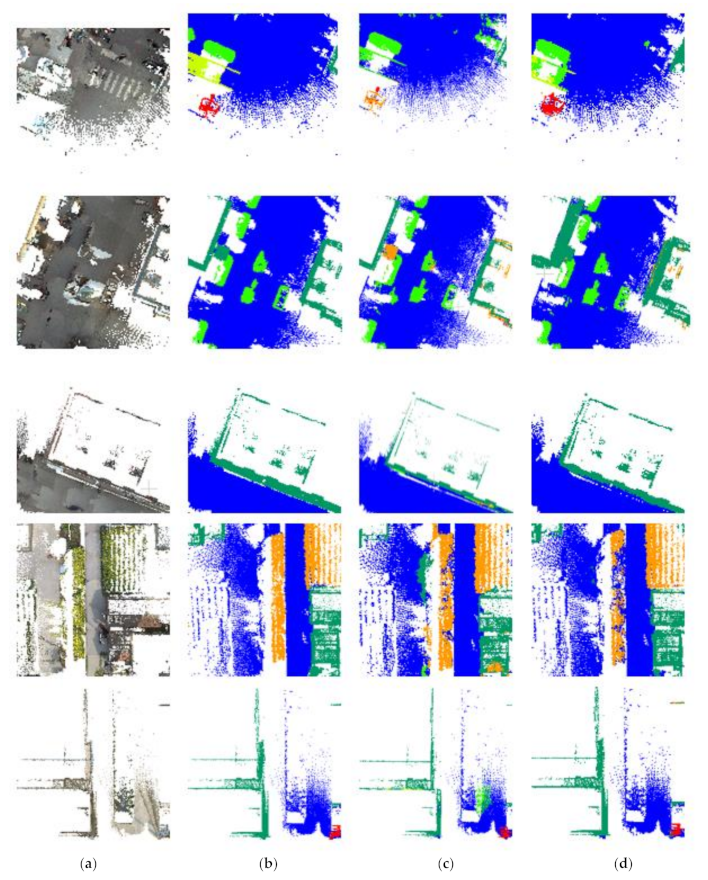
We list some predicted samples of local regions in Figure 6, to demonstrate the difference between our results and the baseline RandLA-Net. The details reveal a better performance of our method.
Toronto3D Dataset. We used the L001, L003, and L004 as the training set and the L002 as the test set. We compared our method with PointNet++ [20], DGCNN [43], KPConv [25], MS-PCNN [44], TG-Net [45], and RandLA-Net [23]. DGCNN proposes a dubbed edge convolution acting on graphs. MS-PCNN uses dynamic point-wise convolutional operations in multiple scales for point cloud segmentation. TGNet proposes a graph convolution function named TGConv to extract point features of neighbors. The results are shown in Table 5. Conclusions like in the CSPC Dataset can be drawn. Our method exceeded the second-best RandLA-Net 6.6% and the rest methods by at least 15% on mIoU. Compared with RandLA-Net, our method improved on three evaluation metrics, especially the IoU of road marking, pole, car, and fence improved over 10 percent.
3.3. Ablation Study
To better understand the effect and influence of each proposed module, the Multi-Scale Aggregation (MS), the Channel Attention (CA), and the Attentive Skip Connection (ASC), we conducted an ablation study. Specifically, we gradually added MS, CA, and ASC to the backbone network, i.e., the second-best RandLA-Net, to evaluate the model performance. From Table 6, it is observed that the introduction of MS, the combination of MS and CA, and the combination of MS, CA, and ASC have made the mIoU score increase 5%, 6.4%, and 11.7%, respectively. This demonstrated the effectiveness of all of the introduced modules, and MS and ASC are both the main contributors, each of which contributed to 5% mIoU improvement. The reason behind such significant progress can be concluded as: a multi-scale aggregation made up for the lack of critical point cloud information fusion in both of the encoder and decoder of original RandLA-Net, and an attentive skip connection instead of an arbitrary concatenation reweights and balances the features from the encoders and the decoders to achieve a global consistency of feature representation. The multi-scale aggregation for both encoder and decoder and the attention mechanism for the encoder-decoder fusion provide useful references for the future design of the point cloud segmentation model.
The RandLA-Net+MS (decoder) indicates the multi-scale aggregation is only executed at the multi-scale features of the decoder [36], whereas our multi-scale aggregation utilizes information both from encoder and decoder. Our method gets 1.7% mIoU improvement, showing the effectiveness of integrating low-level features into the global final feature representation.
4. Conclusions
We proposed an MSAAN (Multi-Scale Attentive Aggregation Network) for large-scale point cloud semantic segmentation. Three contributions were made. First, we proposed an attentive skip connection (ASC) module to replace the commonly used concatenation to balance the encoder and decoder features of the same scales. Second, we introduced a channel attentive enhancement (CAE) module to boost the local feature discriminability and aggregate the local channel structure information. Finally, we fused the multi-scale features of the network to achieve global consistency. The experimental results on the CSPC dataset and Toronto dataset proved the effectiveness of our method. The attention mechanism plays an important and even indispensable role in modern CNN-based image feature representation. Our work further extends the application of the attention modules in point cloud processing.
Author Contributions
Conceptualization, X.G. and S.J.; methodology, X.G. and S.J.; writing—original draft preparation, X.G. and S.J.; writing—review and editing, S.J., M.L., and L.Z.; supervision, S.J.; funding acquisition, S.J. All authors have read and agreed to the published version of the manuscript.
Funding
This work was supported by the National Key Research and Development Program of China (Grant No. 2018YFB0505003).
Conflicts of Interest
The authors declare no conflict of interest.
References
- Zhang, J.X.; Lin, X.G.; Ning, X.G. SVM-based classification of segmented airborne LiDAR point clouds in urban areas. Remote Sens. 2013, 5, 3749–3775. [Google Scholar] [CrossRef] [Green Version]
- Chehata, N.; Li, G.; Mallet, C. Airborne LiDAR feature selection for urban classification using random forests. Geomat. Inf. Sci. Wuhan Univ. 2009, 38, 207–212. [Google Scholar]
- Zhuang, Y.; Liu, Y.; He, G.; Wang, W. Contextual classification of 3D laser points with conditional random fields in urban environments. In Proceedings of the IEEE International Conference on Intelligent Robots and Systems, Hamburg, Germany, 28 September–2 October 2015; pp. 3908–3913. [Google Scholar]
- Lu, Y.; Rasmussen, C. Simplified Markov random fields for efficient semantic labeling of 3D point clouds. In Proceedings of the IEEE International Conference on Intelligent Robots and Systems, Vilamoura, Portugal, 7–12 October 2012; pp. 2690–2697. [Google Scholar]
- LeCun, Y.; Bengio, Y.; Hinton, G. Deep learning. Nature 2015, 521, 436–444. [Google Scholar] [CrossRef] [PubMed]
- Lawin, F.J.; Danelljan, M.; Tosteberg, P.; Bhat, G.; Khan, F.S.; Felsberg, M. Deep projective 3D semantic segmentation. In Proceedings of the 17th International Conference on Computer Analysis of Images and Patterns, Ystad, Sweden, 22–24 August 2017; pp. 95–107. [Google Scholar]
- Boulch, A.; Saux, B.L.; Audebert, N. Unstructured point cloud semantic labeling using deep segmentation networks. In Eurographics Workshop on 3D Object Retrieval; The Eurographics Association: Geneva, Switzerland, 2017. [Google Scholar]
- Wu, B.; Wan, A.; Yue, X.; Keutzer, K. SqueezeSeg: Convolutional Neural Nets with Recurrent CRF for Real-Time Road-Object Segmentation from 3D LiDAR Point Cloud. arXiv 2017, arXiv:1710.07368. [Google Scholar]
- Wu, B.; Zhou, X.; Zhao, S.; Yue, X.; Keutzer, K. SqueezeSegV2: Improved Model Structure and Unsupervised Domain Adaptation for Road-Object Segmentation from a LiDAR Point Cloud. arXiv 2018, arXiv:1809.08495. [Google Scholar]
- Milioto, A.; Vizzo, I.; Behley, J.; Stachniss, C. RangeNet ++: Fast and Accurate LiDAR Semantic Segmentation. In Proceedings of the 2019 IEEE/RSJ International Conference on Intelligent Robots and Systems (IROS), Macau, China, 3–8 November 2019; pp. 4213–4220. [Google Scholar]
- Meng, H.Y.; Gao, L.; Lai, Y.; Manocha, D. VV-Net: Voxel Vaenet with Group Convolutions for Point Cloud Segmentation. arXiv 2018, arXiv:1811.04337. [Google Scholar]
- Rethage, D.; Wald, J.; Sturm, J.; Navab, N.; Tombari, F. Fully-convolutional point networks for large-scale point clouds. In Proceedings of the European Conference on Computer Vision (ECCV), Munich, Germany, 8–14 September 2018; pp. 596–611. [Google Scholar]
- Graham, B.; Engelcke, M.; van der Maaten, L. 3D Semantic Segmentation with Submanifold Sparse Convolutional Networks. In Proceedings of the IEEE Computer Vision and Pattern Recognition CVPR, Salt Lake City, UT, USA, 18–22 June 2018. [Google Scholar]
- Su, H.; Jampani, V.; Sun, D.; Maji, S.; Kalogerakis, V.; Yang, M.-H.; Kautz, J. SPLATNet: Sparse lattice networks for point cloud processing. In Proceedings of the IEEE Conference on Computer Vision and Pattern Recognition, Salt Lake City, UT, USA, 19–21 June 2018. [Google Scholar]
- Rosu, R.A.; Schutt, P.; Quenzel, J.; Behnke, S. Latticenet: Fast Point Cloud Segmentation Using Permutohedral Lattices. arXiv 2019, arXiv:1912.05905. [Google Scholar]
- Dai, A.; Nießner, M. 3dmv: Joint 3d-multi-view prediction for 3d semantic scene segmentation. In Proceedings of the European Conference on Computer Vision (ECCV), Munich, Germany, 8–14 September 2018; pp. 452–468. [Google Scholar]
- Jaritz, M.; Gu, J.; Su, H. Multi-view Pointnet for 3D Scene Understanding. In Proceedings of the IEEE/CVF International Conference on Computer Vision (ICCVW), Seoul, Korea, 1 October 2019; pp. 3995–4003. [Google Scholar]
- Guo, Y.; Wang, H.; Hu, Q.; Liu, H.; Liu, L.; Bennamoun, M. Deep Learning for 3D Point Clouds: A Survey. IEEE Trans. Pattern Anal. and Mach. Intell. 2020. [Google Scholar] [CrossRef]
- Qi, C.R.; Su, H.; Mo, K.; Guibas, L.J. PointNet: Deep learning on point sets for 3D classification and segmentation. In Proceedings of the IEEE conference on computer vision and pattern recognition, Honolulu, HI, USA, 21–26 July 2017. [Google Scholar]
- Qi, C.R.; Yi, L.; Su, H.; Guibas, L.J. PointNet++: Deep hierarchical feature learning on point sets in a metric space. In Proceedings of the Neural Information Processing Systems (NIPS), Long Beach, CA, USA, 3–9 December 2017. [Google Scholar]
- Jiang, M.; Wu, Y.; Zhao, T.; Zhao, Z.; Lu, C. PointSIFT: A SIFT-like Network Module for 3D Point Cloud Semantic Segmentation. arXiv 2018, arXiv:1807.00652. [Google Scholar]
- Zhao, H.; Jiang, L.; Fu, C.W.; Jia, J. PointWeb: Enhancing local neighborhood features for point cloud processing. In Proceedings of the IEEE Conference on Computer Vision and Pattern Recognition (CVPR), Long Beach, CA, USA, 16–20 June 2019; pp. 5565–5573. [Google Scholar]
- Hu, Q.; Yang, B.; Xie, L.; Rosa, S.; Guo, Y.; Wang, Z.; Trigoni, N.; Markham, A. RandLA-Net: Efficient Semantic Segmentation of Large-Scale Point Clouds. In Proceedings of the IEEE/CVF Conference on Computer Vision and Pattern Recognition, Seattle, WA, USA, 16–18 June 2020; pp. 11108–11117. [Google Scholar]
- Li, Y.Y.; Bu, R.; Sun, M.C.; Wu, W.; Di, X.H.; Chen, B.Q. PointCNN: Convolution on X-Transformed Points. Adv. Neur. Inf. 2018, 31, 820–830. [Google Scholar]
- Thomas, H.; Qi, C.R.; Deschaud, J.-E.; Marcotegui, B.; Goulette, F.; Guibas, L.J. KPConv: Flexible and Deformable Convolution for Point Clouds. arXiv 2019, arXiv:1904.08889. [Google Scholar]
- Ye, X.; Li, J.; Huang, H.; Du, L.; Zhang, X. 3D Recurrent neural networks with context fusion for point cloud semantic segmentation. In Computer Vision—ECCV 2018; Ferrari, V., Hebert, M., Sminchisescu, C., Weiss, Y., Eds.; Springer International Publishing: Cham, Switzerland, 2018; pp. 415–430. [Google Scholar]
- Landrieu, L.; Simonovsky, M. Large-scale point cloud semantic segmentation with superpoint graphs. In Proceedings of the IEEE Conference on Computer Vision and Pattern Recognition, Salt Lake City, UT, USA, 18–23 June 2018; pp. 4558–4567. [Google Scholar]
- Wang, L.; Huang, Y.; Hou, Y.; Zhang, S.; Shan, J. Graph Attention Convolution for Point Cloud Semantic Segmentation. In Proceedings of the IEEE Conference on Computer Vision and Pattern Recognition, Long Beach, CA, USA, 16–20 June 2019; pp. 10296–10305. [Google Scholar]
- Bello, I.; Zoph, B.; Vaswani, A.; Shlens, J.; Le, Q.V. Attention augmented convolutional networks. In Proceedings of the IEEE International Conference on Computer Vision, Seoul, Korea, 27–28 October 2019; pp. 3286–3295. [Google Scholar]
- Chen, L.; Zhang, H.; Xiao, J.; Nie, L.; Shao, J.; Liu, W.; Chua, T.-S. Sca-cnn: Spatial and channel-wise attention in convolutional networks for image captioning. In Proceedings of the IEEE Conference on Computer Vision and Pattern Recognition, Honolulu, HI, USA, 21–26 July 2017; pp. 5659–5667. [Google Scholar]
- Li, H.; Xiong, P.; An, J.; Wang, L. Pyramid attention network for semantic segmentation. arXiv 2018, arXiv:1805.10180. [Google Scholar]
- Fan, L.; Wang, W.C.; Zha, F.; Yan, J. Exploring new backbone and attention module for semantic segmentation in street scenes. IEEE Access 2018, 6, 71566–71580. [Google Scholar] [CrossRef]
- Wang, X.; He, J.; Ma, L. Exploiting Local and Global Structure for Point Cloud Semantic Segmentation with Contextual Point Representations. In Proceedings of the Conference on Neural Information Processing Systems (NeurIPS), Vancouver, BC, Canada, 8–15 December 2019; pp. 4573–4583. [Google Scholar]
- Jia, M.; Li, A.; Wu, Z. A Global Point-Sift Attention Network for 3d Point Cloud Semantic Segmentation. In Proceedings of the International Geoscience and Remote Sensing Symposium, Yokohama, Japan, 28 July–2 August 2019; pp. 5065–5068. [Google Scholar]
- Ji, S.; Wei, S.; Lu, M. A scale robust convolutional neural network for automatic building extraction from aerial and satellite imagery. Int. J. Remote Sens. 2018, 40, 3308–3322. [Google Scholar] [CrossRef]
- Wei, S.; Ji, S.; Lu, M. Toward Automatic Building Footprint Delineation from Aerial Images Using CNN and Regularization. IEEE Trans. Geosci. Remote Sens. 2020, 58, 2178–2189. [Google Scholar] [CrossRef]
- Pintore, G.; Agus, M.; Gobbetti, E. AtlantaNet: Inferring the 3D Indoor Layout from a Single 360 Image Beyond the Manhattan World Assumption. In Proceedings of the European Conference on Computer Vision (ECCV), Glasgow, UK, 23–28 August 2020. [Google Scholar]
- Tong, G.; Li, Y.; Chen, D.; Sun, Q.; Cao, W.; Xiang, G. CSPC-Dataset: New LiDAR Point Cloud Dataset and Benchmark for Large-scale Semantic Segmentation. IEEE Access 2020, 8, 87695–87718. [Google Scholar] [CrossRef]
- Tan, W.; Qin, N.; Ma, L.; Li, Y.; Du, J.; Cai, G.; Yang, K.; Li, J. Toronto-3D: A Large-scale Mobile LiDAR Dataset for Semantic Segmentation of Urban Roadways. arXiv 2020, arXiv:2003.08284. [Google Scholar]
- Boulch, A.; Guerry, J.; Le Saux, B.; Audebert, N. SnapNet: 3D point cloud semantic labeling with 2D deep segmentation networks. Comput. Graph. 2017, 71, 189–198. [Google Scholar] [CrossRef]
- Huang, J.; You, S. Point cloud labeling using 3D Convolutional Neural Network. In Proceedings of the 2016 23rd International Conference on Pattern Recognition (ICPR), Cancún, Mexico, 4–8 December 2016; pp. 2670–2675. [Google Scholar]
- Hackel, T.; Savinov, N.; Ladicky, L.; Wegner, J.D.; Schindler, K.; Pollefeys, M. Semantic3D.net: A new Large-scale Point Cloud Classification Benchmark. arXiv 2017, arXiv:1704.03847. [Google Scholar] [CrossRef] [Green Version]
- Wang, Y.; Sun, Y.B.; Liu, Z.W.; Sarma, S.E.; Bronstein, M.M.; Solomon, J.M. Dynamic Graph CNN for Learning on Point Clouds. Acm Trans. Graphic 2019, 38, 1–12. [Google Scholar] [CrossRef] [Green Version]
- Ma, L.F.; Li, Y.; Li, J.; Tan, W.K.; Yu, Y.T.; Chapman, M. Multi-scale Point-wise Convolutional Neural Networks for 3D Object Segmentation from LiDAR Point Clouds in Large-scale Environments. IEEE Trans. Intell. Transport. Syst. 2019, 99, 1–16. [Google Scholar] [CrossRef]
- Li, Y.; Ma, L.; Zhong, Z.; Cao, D.; Li, J. TGNet: Geometric Graph CNN on 3D Point Cloud Segmentation. IEEE Trans. Geosci. Remote Sens. 2020, 58, 3588–3600. [Google Scholar] [CrossRef]
Figure 1.
The framework of the proposed Multi-Scale Attentive Aggregation Network (MSAAN). The numbers in and below the blue block are the channel number of features and the point number of inputs, respectively. RS, US, MLP, and “nclass” are for random sampling, up-sampling, multi-layer perceptron, and the number of classes, respectively.

Figure 2.
Point feature enrichment module (cited from [33]). The first number in the bracket is the point number, and the second is the feature number.
Figure 2.
Point feature enrichment module (cited from [33]). The first number in the bracket is the point number, and the second is the feature number.

Figure 3.
The LAE module and the LFE module. The CAE is our newly added module in the second branch of LFE. N is the number of input points, and K is the number of neighbor points of each point.
Figure 3.
The LAE module and the LFE module. The CAE is our newly added module in the second branch of LFE. N is the number of input points, and K is the number of neighbor points of each point.

Figure 4.
ASC module. N is the number of input points, d1 is the number of high-level features from the decoder, and d2 is the feature number of corresponding low-level features from the encoder.
Figure 4.
ASC module. N is the number of input points, d1 is the number of high-level features from the decoder, and d2 is the feature number of corresponding low-level features from the encoder.

Figure 5.
Multi-scale aggregation module. The input is the output features of the first LAE layer of the encoder. Layer1 (decoder) indicates the first layer of the decoder with the lowest spatial resolution.
Figure 5.
Multi-scale aggregation module. The input is the output features of the first LAE layer of the encoder. Layer1 (decoder) indicates the first layer of the decoder with the lowest spatial resolution.

Figure 6.
The visual examples in CSPC Dataset. (a–d) represent point cloud with RGB, ground truth, the prediction results of RandLA-Net, and ours.
Figure 6.
The visual examples in CSPC Dataset. (a–d) represent point cloud with RGB, ground truth, the prediction results of RandLA-Net, and ours.


Table 1.
Number of points in each scene and each category in the CSPC.
| Scenes | Ground | Building | Car | Bridge | Vegetation | Pole | Total |
|---|---|---|---|---|---|---|---|
| Scene-1 | 6,082,987 | 9,032,520 | 651,442 | 0 | 641,970 | 24,034 | 16,433,953 |
| Scene-2 | 4,358,082 | 3,992,075 | 525,815 | 90,637 | 257,708 | 43,930 | 9,268,247 |
| Scene-3 | 8,736,662 | 599,645 | 469,273 | 97,712 | 163,830 | 46,579 | 15,510,510 |
| Scene-4 | 10,282,388 | 835,169 | 71,577 | 0 | 5,116,352 | 8285 | 16,323,771 |
| Scene-5 | 5,332,925 | 4,197,404 | 34,960 | 0 | 322,488 | 49,397 | 9,937,174 |
Table 2.
Point counts of each category in each section of the Toronto3D dataset (thousand).
| Section | Road | Road Marking | Natural | Building | Utility Line | Pole | Car | Fence |
|---|---|---|---|---|---|---|---|---|
| L001 | 11,178 | 433 | 1408 | 6037 | 210 | 263 | 1564 | 83 |
| L002 | 6353 | 301 | 1942 | 866 | 84 | 155 | 199 | 24 |
| L003 | 20,587 | 786 | 1908 | 11,672 | 332 | 408 | 1969 | 300 |
| L004 | 3738 | 281 | 1310 | 525 | 37 | 71 | 200 | 4 |
Table 3.
Segmentation results evaluated on IoU of each category, mIoU, and OA in scene-2 of CSPC.
| Network | Ground | Building | Car | Vegetation | Pole | Bridge | mIoU | OA |
|---|---|---|---|---|---|---|---|---|
| SnapNet [40] | 42.8 | 43.9 | 6.0 | 10.8 | 0.0 | 0.0 | 17.3 | 54.8 |
| PointNet++ [20] | 46.9 | 47.7 | 5.9 | 0.5 | 0.0 | 0.0 | 16.8 | 56.9 |
| 3D CNN [41] | 78.2 | 90.5 | 1.3 | 5.4 | 0.5 | 0.2 | 19.2 | 58.4 |
| DeepNet [42] | 79.9 | 35.3 | 8.7 | 8.6 | 0.3 | 0.0 | 22.2 | 61.2 |
| KPConv [25] | 94.1 | 87.8 | 66.6 | 77.5 | 0.0 | 0.0 | 54.3 | 93.6 |
| RandLA-Net [23] | 85.6 | 84.3 | 48.6 | 63.6 | 11.5 | 1.4 | 49.2 | 87.7 |
| Ours | 89.7 | 88.2 | 61.0 | 63.2 | 20.6 | 64.0 | 64.5 | 91.9 |
Table 4.
The segmentation results evaluated on IoU of each category, mIoU, and OA in scene-5 of the CSPC.
Table 4.
The segmentation results evaluated on IoU of each category, mIoU, and OA in scene-5 of the CSPC.
| Network | Ground | Building | Car | Vegetation | Pole | Bridge | mIoU | OA |
|---|---|---|---|---|---|---|---|---|
| SnapNet [40] | 40.2 | 38.4 | 0.2 | 8.4 | 0.0 | - | 17.5 | 52.3 |
| PointNet++ [20] | 47.2 | 48.0 | 5.9 | 0.6 | 0.0 | - | 20.3 | 57.1 |
| 3D CNN [41] | 71.0 | 56.5 | 1.3 | 9.1 | 1.5 | - | 27.9 | 69.9 |
| DeepNet [42] | 71.3 | 44.9 | 0.9 | 10.6 | 0.5 | - | 25.6 | 63.3 |
| KPConv [25] | 87.5 | 88.7 | 63.2 | 54.8 | 0.0 | - | 58.8 | 92.4 |
| RandLA-Net [23] | 90.6 | 89.3 | 32.9 | 48.0 | 22.1 | - | 56.6 | 92.7 |
| Ours | 92.0 | 90.9 | 39.2 | 52.0 | 34.7 | - | 61.8 | 93.9 |
Table 5.
The segmentation results evaluated on IoU of each category, mIoU, and OA of Toronto3D dataset.
Table 5.
The segmentation results evaluated on IoU of each category, mIoU, and OA of Toronto3D dataset.
| Network | Road | Road Mark | Natural | Utility Line | Building | Pole | Car | Fence | mIoU | OA |
|---|---|---|---|---|---|---|---|---|---|---|
| PointNet++ [20] | 91.4 | 7.6 | 89.8 | 68.6 | 74.0 | 59.5 | 54.0 | 7.5 | 56.6 | 91.2 |
| DGCNN [43] | 90.6 | 0.4 | 81.3 | 47.1 | 64.0 | 53.9 | 49.3 | 7.3 | 49.6 | 89.0 |
| KPConv [25] | 90.2 | 0.0 | 86.8 | 81.1 | 86.8 | 73.1 | 42.9 | 21.6 | 60.3 | 91.7 |
| MS-PCNN [44] | 91.2 | 3.5 | 90.5 | 62.3 | 77.3 | 68.5 | 53.6 | 17.1 | 58.0 | 91.5 |
| TGNet [45] | 91.4 | 10.6 | 91.0 | 68.3 | 76.9 | 66.3 | 54.1 | 8.2 | 58.3 | 91.6 |
| RandLA [23] | 93.8 | 49.0 | 93.4 | 79.6 | 83.5 | 62.7 | 76.8 | 8.5 | 68.4 | 93.5 |
| Ours | 96.1 | 59.9 | 94.4 | 85.8 | 85.4 | 77.0 | 83.7 | 17.7 | 75.0 | 95.9 |
Table 6.
The ablation study results of CSPC dataset. Scene 1, 3, and 4 consisted of the training set and scene 2 and 5 consisted of the testing set. RandLA: RandLA-Net; MS: Multi-Scale Aggregation; CA: Channel Attention; ASC: Attentive Skip Connection.
Table 6.
The ablation study results of CSPC dataset. Scene 1, 3, and 4 consisted of the training set and scene 2 and 5 consisted of the testing set. RandLA: RandLA-Net; MS: Multi-Scale Aggregation; CA: Channel Attention; ASC: Attentive Skip Connection.
| Network | Ground | Building | Car | Vegetation | Pole | Bridge | mIoU | OA |
|---|---|---|---|---|---|---|---|---|
| RandLA | 85.6 | 84.3 | 48.6 | 63.6 | 11.5 | 1.4 | 49.2 | 87.7 |
| RandLA + MS (decoder) | 88.5 | 88.5 | 47.6 | 59.0 | 23.6 | 7.9 | 52.5 | 91.2 |
| RandLA + MS (ours) | 89.1 | 88.1 | 49.6 | 53.1 | 19.7 | 25.8 | 54.2 | 91.2 |
| RandLA + MS + CA | 91.8 | 85.2 | 67.6 | 38.5 | 42.1 | 8.3 | 55.6 | 91.0 |
| RandLA + MS + CA + ASC | 92.0 | 90.7 | 71.0 | 69.7 | 33.9 | 8.4 | 60.9 | 94.1 |
Publisher’s Note: MDPI stays neutral with regard to jurisdictional claims in published maps and institutional affiliations. |
© 2021 by the authors. Licensee MDPI, Basel, Switzerland. This article is an open access article distributed under the terms and conditions of the Creative Commons Attribution (CC BY) license (http://creativecommons.org/licenses/by/4.0/).
Share and Cite
MDPI and ACS Style
Geng, X.; Ji, S.; Lu, M.; Zhao, L. Multi-Scale Attentive Aggregation for LiDAR Point Cloud Segmentation. Remote Sens. 2021, 13, 691. https://0-doi-org.brum.beds.ac.uk/10.3390/rs13040691
AMA Style
Geng X, Ji S, Lu M, Zhao L. Multi-Scale Attentive Aggregation for LiDAR Point Cloud Segmentation. Remote Sensing. 2021; 13(4):691. https://0-doi-org.brum.beds.ac.uk/10.3390/rs13040691
Chicago/Turabian StyleGeng, Xiaoxiao, Shunping Ji, Meng Lu, and Lingli Zhao. 2021. "Multi-Scale Attentive Aggregation for LiDAR Point Cloud Segmentation" Remote Sensing 13, no. 4: 691. https://0-doi-org.brum.beds.ac.uk/10.3390/rs13040691
Note that from the first issue of 2016, this journal uses article numbers instead of page numbers. See further details here.