
Beamforming of LOFAR Radio-Telescope for Passive Radiolocation Purposes
by
 , and
, and
Aleksander Droszcz
1, 
Konrad Jędrzejewski
1,* ,
,
Julia Kłos
1,
Krzysztof Kulpa
1 and
Mariusz Pożoga
2 1
Institute of Electronic Systems, Faculty of Electronics and Information Technology, Warsaw University of Technology, Nowowiejska 15/19, 00-665 Warsaw, Poland
2
Space Research Centre of Polish Academy of Sciences, Bartycka Str. 18A, 00-716 Warsaw, Poland
*
Author to whom correspondence should be addressed.
Remote Sens. 2021, 13(4), 810; https://0-doi-org.brum.beds.ac.uk/10.3390/rs13040810
Submission received: 31 December 2020
/
Revised: 13 February 2021
/
Accepted: 17 February 2021
/
Published: 23 February 2021
(This article belongs to the Special Issue Selected Papers of Microwave and Radar Week (MRW 2020))
Abstract
:This paper presents the results of investigations on the beamforming of a low-frequency radio-telescope LOFAR which can be used as a receiver in passive coherent location (PCL) radars for aerial and space object detection and tracking. The use of a LOFAR radio-telescope for the passive tracking of space objects can be a highly cost-effective solution due to the fact that most of the necessary equipment needed for passive radiolocation already exists in the form of LOFAR stations. The capability of the radiolocation of planes by a single LOFAR station in Borowiec is considered to be ‘proof of concept’ for future research focused on the localization of space objects. Beam patterns of single sets of LOFAR antennas (known as tiles), as well as for the entire LOFAR station, are presented and thoroughly discussed in the paper. Issues related to grating lobes in LOFAR beam patterns are also highlighted. A beamforming algorithm used for passive radiolocation purposes, exploiting data collected by a LOFAR station, is also discussed. The results of preliminary experiments carried out with real signals collected by the LOFAR station in Borowiec, Poland confirm that the appropriate beamforming can significantly increase the radar’s detection range, as well as the detection’s certainty.
1. Introduction
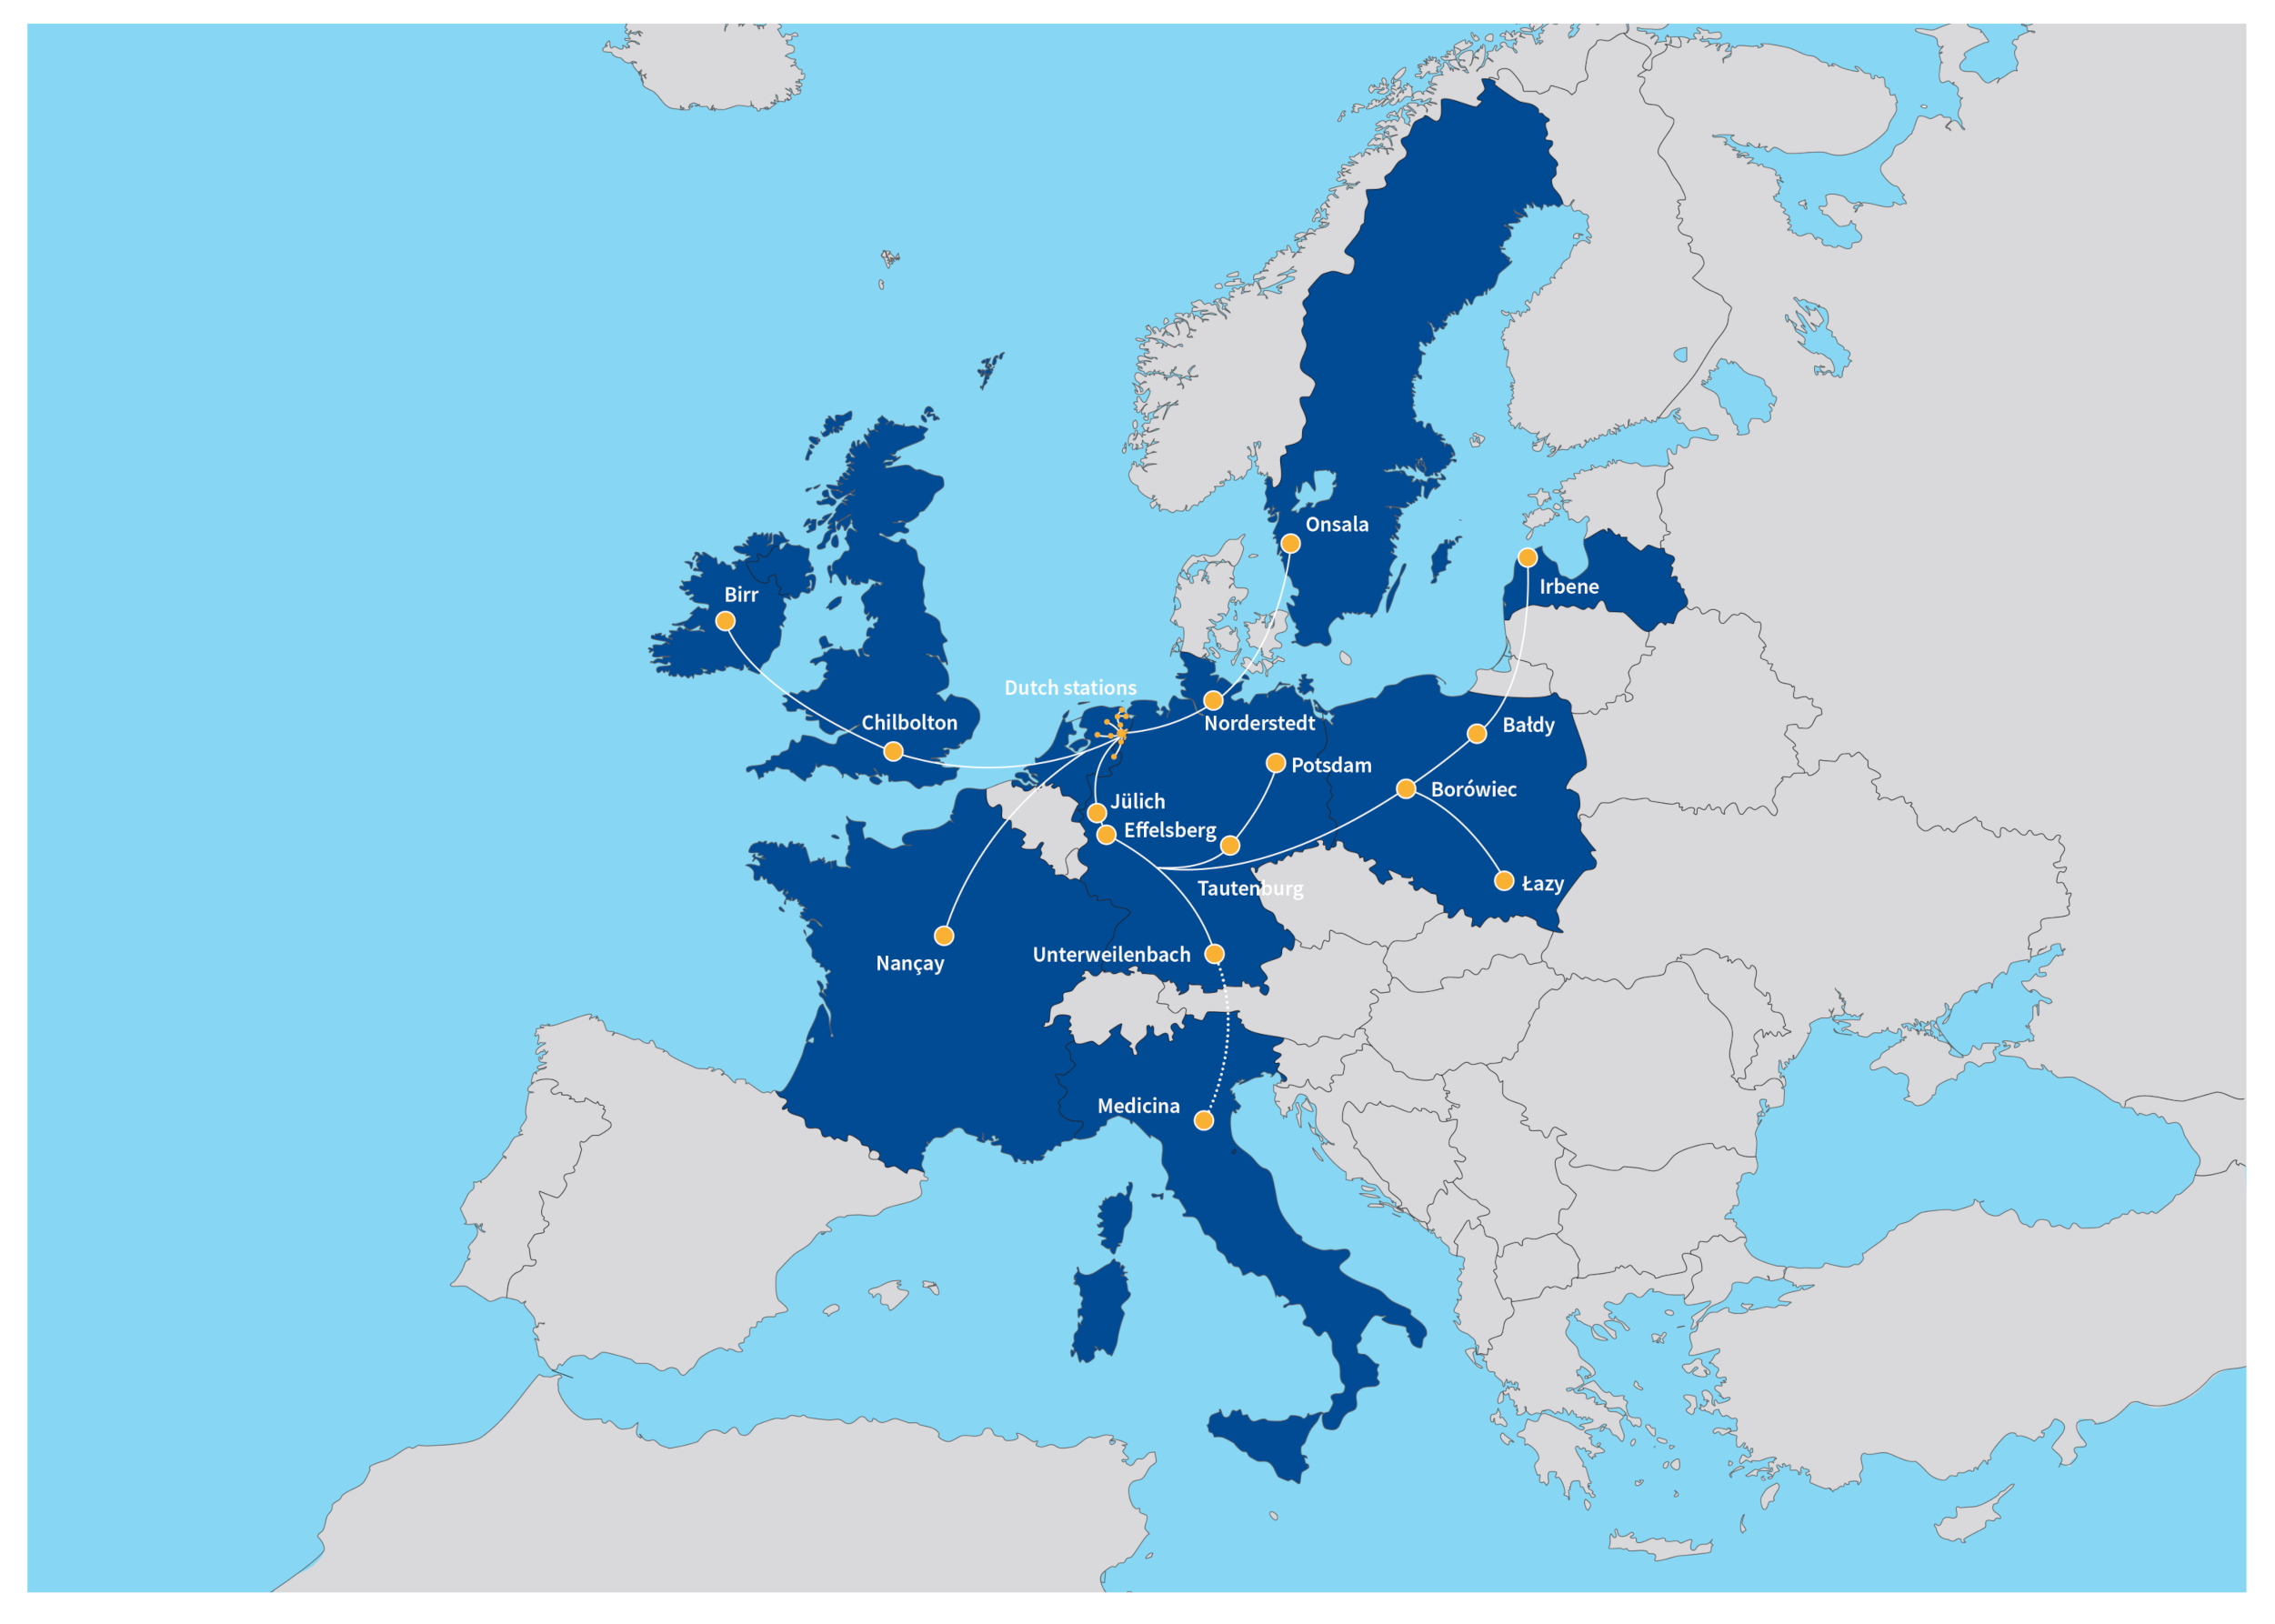
LOw-Frequency ARray for radio astronomy (LOFAR) is an international network of multi-antenna radio-telescopes operating at low frequencies (below 250 MHz) that was constructed and designed by the Dutch astronomical agency ASTRON, the Netherlands Institute for Radio Astronomy. LOFAR consists of 52 stations spread across Europe, most of which are in the Netherlands (38 stations). The stations located in the Netherlands are divided into core and remote stations located in an area with a radius of several dozen kilometers. Stations outside the Netherlands are known as International and are located in Germany (6), Poland (3), France (1), Sweden (1), the United Kingdom (1), Ireland (1), and Latvia (1) [1]. Figure 1 shows the distribution of LOFAR stations on the map of Europe. The main scientific goal of the construction of LOFAR was to create opportunities for the observation of the epochs of reionization, deep extragalactic surveys, transient radio phenomena, pulsars, ultra high-energy cosmic rays, cosmic magnetism, solar physics, and space weather [2]. This paper is devoted to a new idea of the use of a LOFAR station and its beamforming for passive radiolocation purposes, and is an extension of a paper originally presented in 2020 at the 21st International Radar Symposium (IRS) [3]. Another paper [4] on this topic, which focuses more on passive radiolocation techniques, was also presented during the 21st International Radar Symposium in 2020.
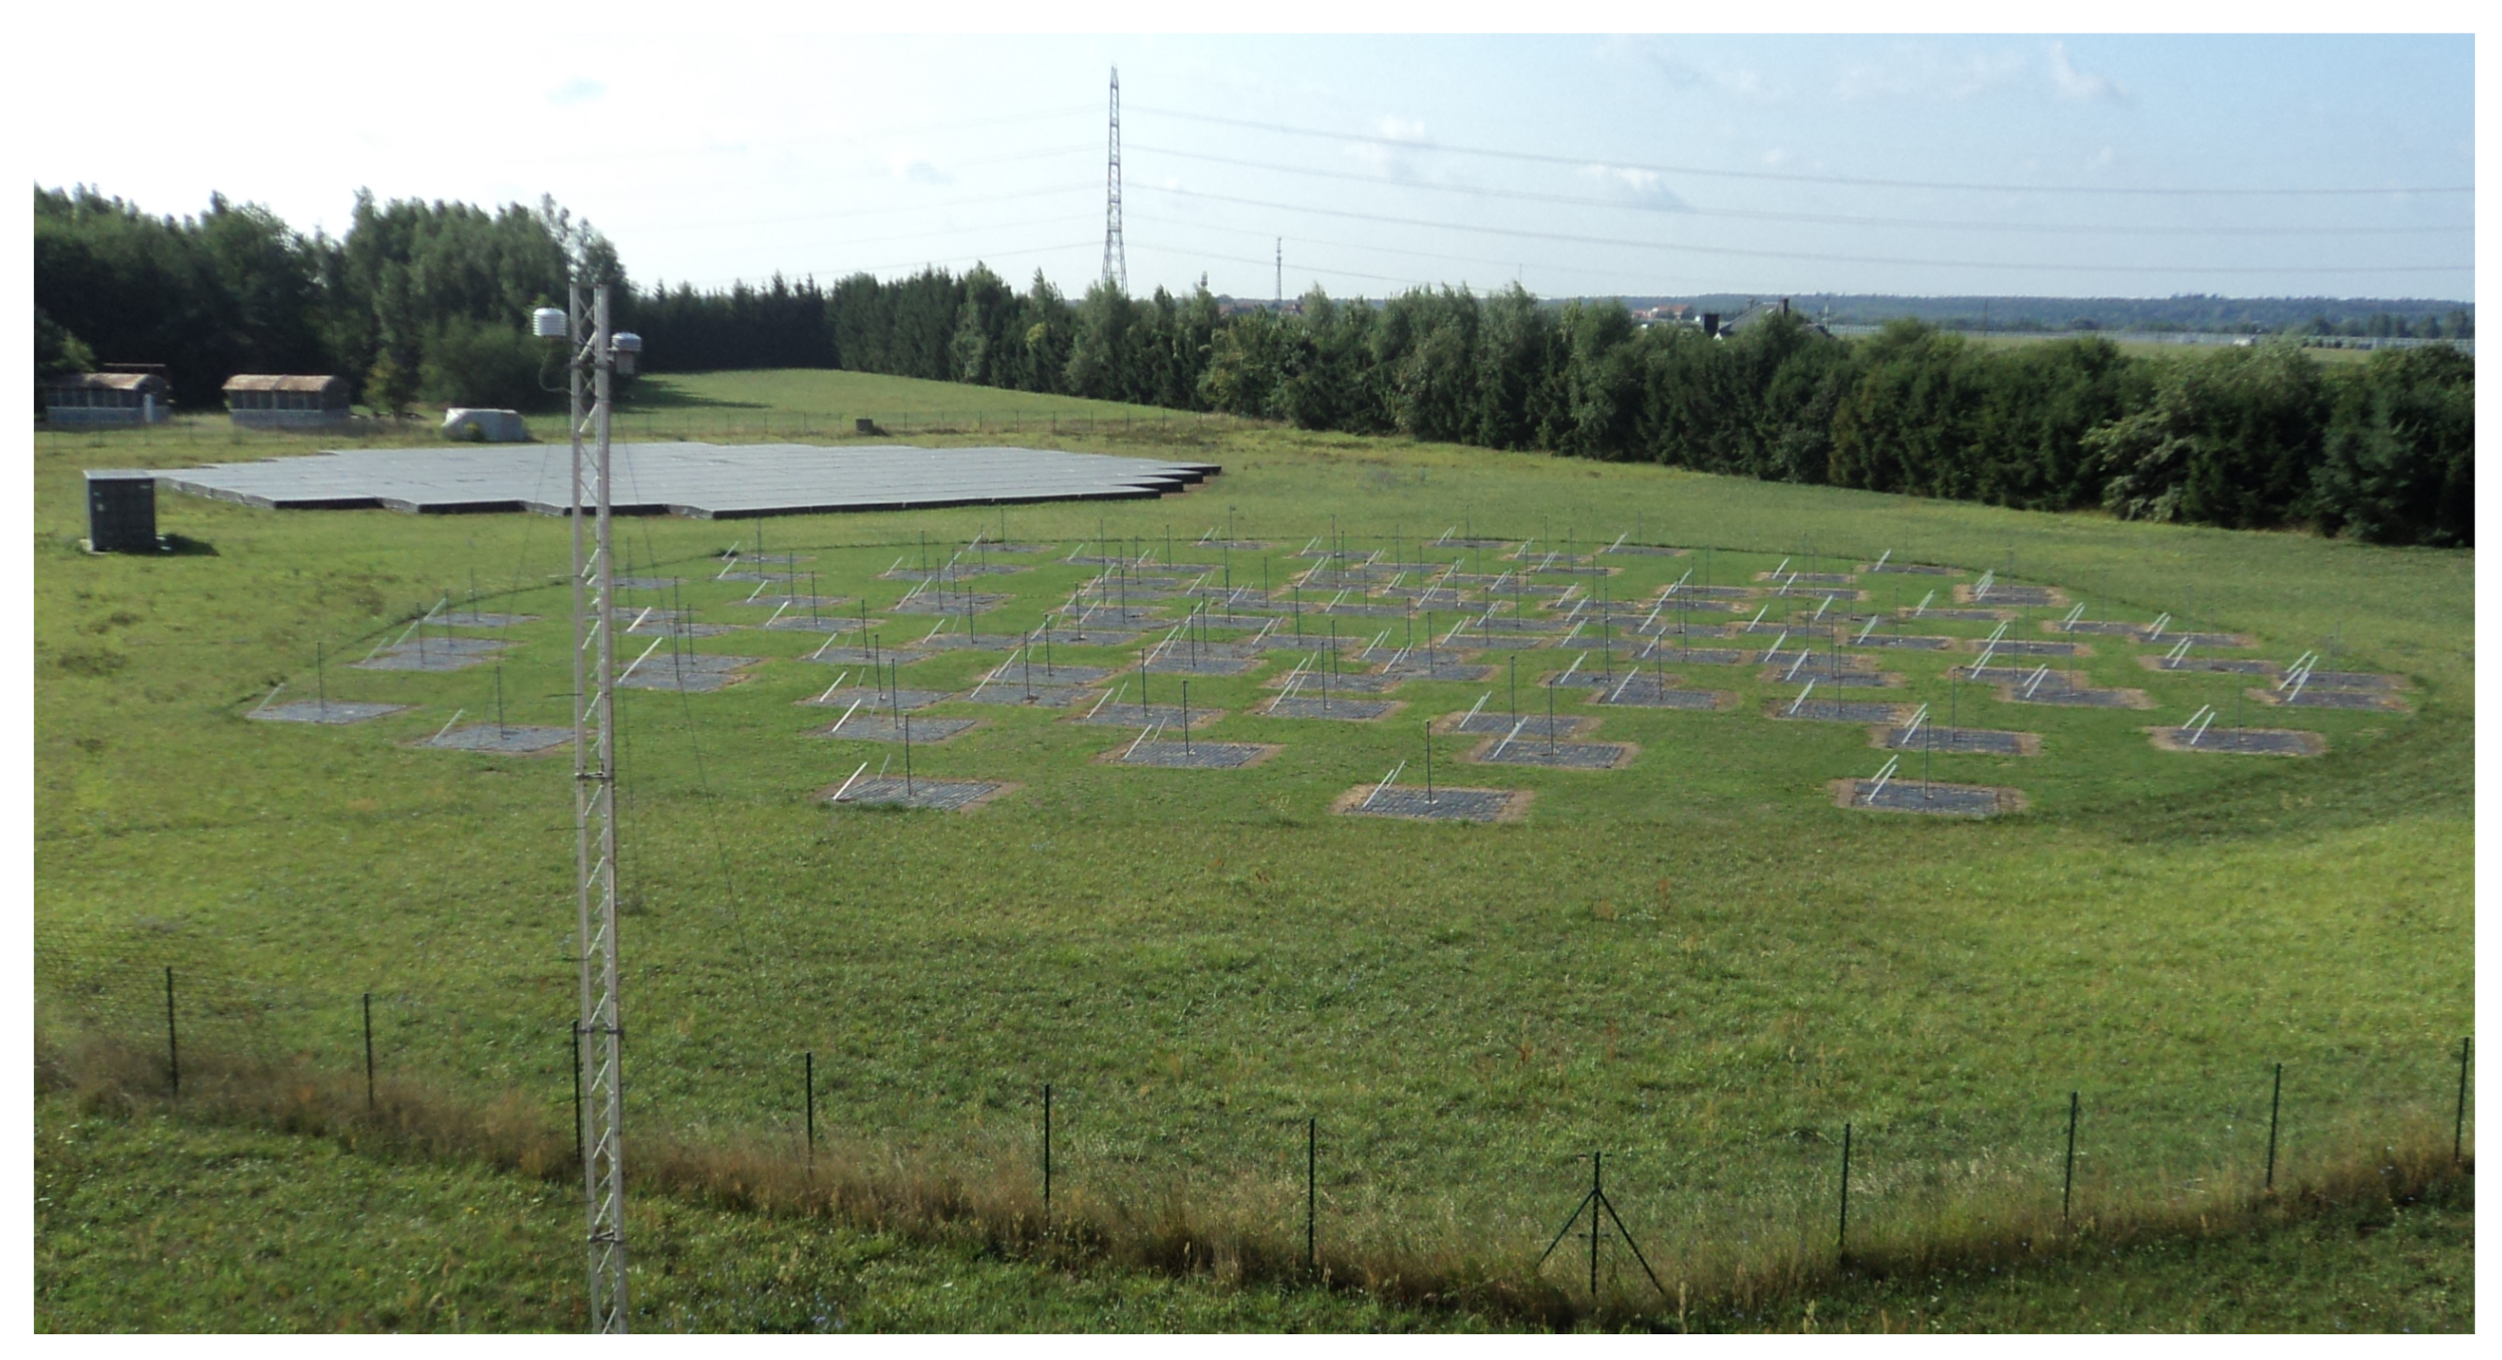
Each LOFAR station consists of two separated antenna fields receiving signals in different frequency ranges: low-frequency band antennas (LBAs) operating in a frequency range 10–90 MHz, and high-frequency antennas (HBAs) operating in the frequency range 110–250 MHz [1,5]. Due to the fact that the receiver frequency range covers the same bands which commercial transmitters like DAB and DVB-T use to broadcast their signals, the LOFAR antenna can be used not only for radio astronomy, but also for passive radiolocation purposes. The HBAs consist of 1536 dual-pol dipoles organized in 96 tiles, each of which is made up of a (16) dipole grid. The LBA and HBA fields of one LOFAR station located in Borowiec, Poland are presented in Figure 2. The LBA field is in the foreground, while in the background the HBA field is visible with its characteristic square tiles. The basic objective of LOFAR antennas is to receive radio-astronomic signals with the usage of beamforming [1]. The beamforming, i.e., spatial filtering, aims to suppress signals arriving from undesirable directions while amplifying signals from desired directions. The LOFAR radio-telescopes use a combination of analog and digital beamforming.
A LOFAR station may be used as a receiver for a passive coherent locator (PCL) to localize aerial or space objects. The idea of passive radar (PCL) is that a target is illuminated by a powerful commercial broadcast or telecommunication transmitter, and the receiving antenna receives the echo signal reflected from a target. In passive radars, unlike in active radars, there is no dedicated transmitter, and the radar uses third-party transmitters (called illuminators of opportunity) as sources of illumination [6]. To detect and estimate target parameters, the direct signal from the transmitter is compared with the echo signal reflected from a target [7,8].
In the case presented here, when the receiver is the LOFAR HBA, the transmitter has to operate in the frequency band 110–250 MHz, and nowadays digital radio (DAB) or digital television VHF DVB-T (TV channels 6–12) operate in this frequency range. The DAB and VHF transmitters are equipped with transmitting antennas that direct most of the power towards the ground. They usually have omnidirectional azimuth characteristics and relatively narrow elevation beams directed almost parallel to the Earth’s surface. The beam width is usually a few or a dozen degrees with vertical characteristics without directional zeros, in order to obtain relatively even illumination without distant blind zones. Therefore, for the detection of aerial targets, the transmitter close to a LOFAR station should be selected, which illuminates only the zone at low altitude. For observing space objects, a distant or very distant transmitter (at a distance 1000–3000 km from a receiver) should be selected.
For passive coherent localization, the passive radar should acquire two signals: a reference signal received directly from the transmitter, and a surveillance signal containing the echo from the target of interest. The echo signal is time-delayed and a Doppler-shifted copy of the transmitted one [9]. Time delay is caused by the different lengths of the direct (transmitter to LOFAR) and indirect (transmitter-target-LOFAR) signal paths, while the Doppler shift is caused by the relative motion of the target towards the transmitter and the receiver (time changes of indirect path length). The target detection is based on a calculation of the cross-ambiguity function and the detection of its peaks. It is equivalent to the correlation of the reference signal with the echo signal after the correction of time and the Doppler shift of the target echo.
Passive radiolocation through the usage of LOFAR stations and broadcasting transmitters seems to be a highly cost-effective solution due to the fact that most of the necessary equipment already exists. The only need is to process existing LOFAR measurements for passive radiolocation purposes. In this paper, receiving and enhancing echoes from planes by a single LOFAR station in Borowiec is considered. The work, whose results are presented in this paper, was one of the first stages of the proof of the concept for creating a more complex passive location system for space object monitoring based on multiple LOFAR stations, aimed to provide space surveillance for Europe in the near future.
In the experiments described in this paper, the Digital Audio Broadcasting (DAB+) signal at carrier frequency was used for passive radiolocation using the LOFAR system. Therefore, HBAs were used in the experiment. DAB+ signals have a wider band than analog Frequency Modulation (FM) radio signals, which can be useful for signal-to-noise ratio (SNR) and resolution of the passive radar [8]. Furthermore, the popularity of DAB+ transmission in Europe has increased over recent years [10], thus a passive radar system based on DAB+ signals can be easily adapted to a passive radar system using more than one LOFAR station in the future.
The LOFAR system allows two types of registrations: narrowband registrations for real-time processing, and wideband registrations which can be used in post-processing [1]. In this paper, the attention was fully focused on wideband registrations. In the case of international LOFAR stations, the HBA field contains 96 tiles. Each tile is a planar antenna array. Every tile of a LOFAR station has independent analog beamforming based on phase shifters [1]. The authors of this paper had access to digital signals from all tiles, which were products of analog beamforming from all independent tiles. Next, a phase-shift algorithm [11] was implemented and tested for digital beamforming based on products of analog beamforming from the tiles.
The paper is organized as follows. In Section 2, the construction and properties of the LOFAR station in Borowiec—where the experiments were conducted—is discussed. Additionally in Section 2, the theory of signal processing for LOFAR tiles and whole stations is presented. The beam patterns of single HBAs, tiles, and a whole station are shown in Section 3. Drawing beam patterns is an effective way of showing from which directions the given antenna array enhances or suppresses signals. Moreover, in Section 3 the presence of grating lobes in beam patterns is discussed. In Section 4, an accurate analysis of the registration of the DAB+ signal by the LOFAR station in Borowiec is conducted. Cross-ambiguity functions after a constant false alarm rate (CFAR) algorithm without spatial filtering and using the Phase-Shift algorithm were plotted. The presented results confirm that the discussed methods can amplify desirable echoes, which makes it possible to increase radar range and detection reliability.
2. LOFAR Antennas as Sensors of Passive Radiolocation System
2.1. LOFAR Station Array
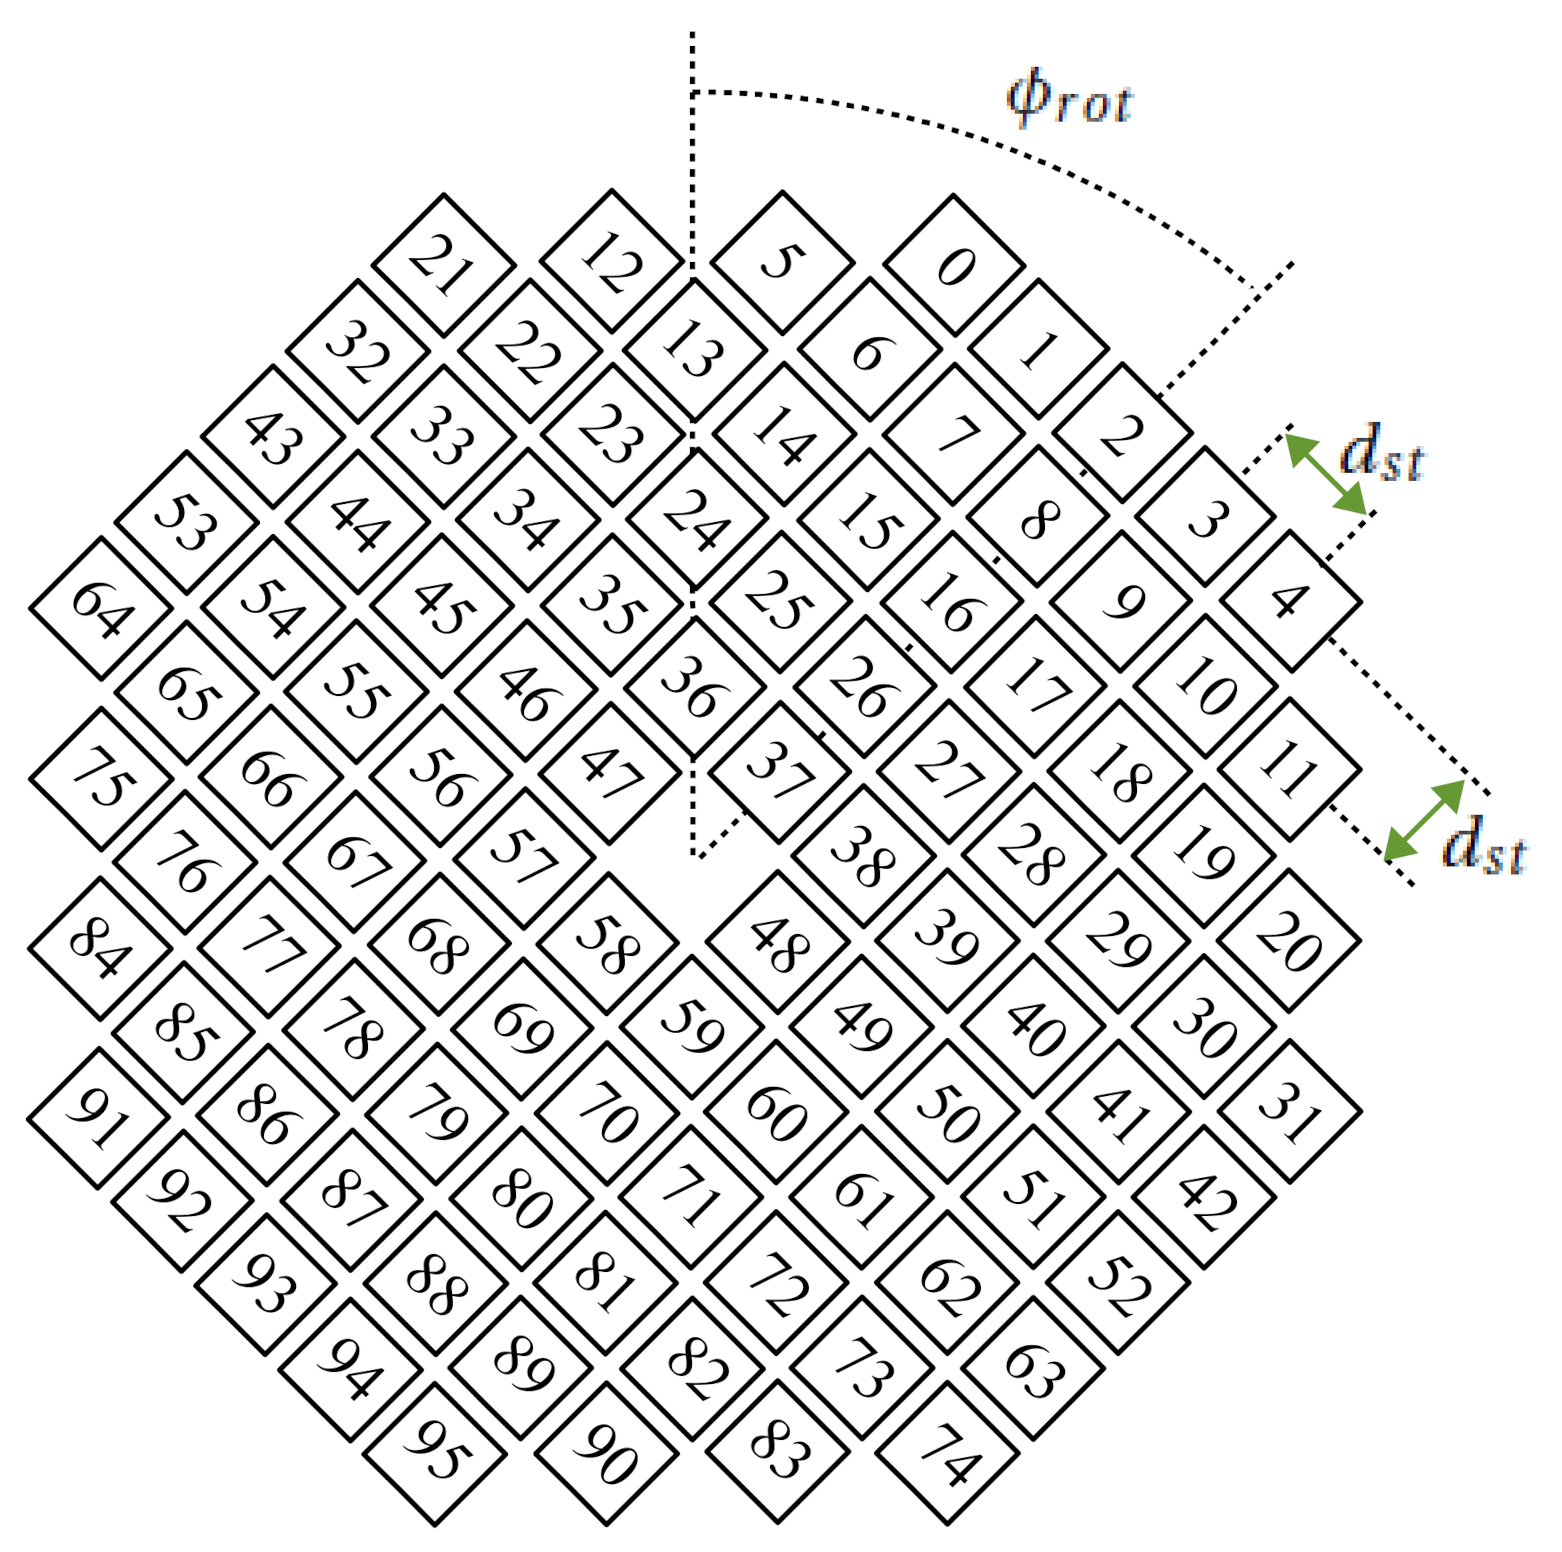
Figure 3 shows the distribution of LOFAR HBA tiles for the LOFAR station in Borowiec, Poland. The distance between the centers of the two neighboring tiles is [1]. In Figure 3, the rotation of tiles from the north is equal to as is in the case of the LOFAR station in Borowiec. Tiles are numbered from 0 to 95. From the digital signal processing perspective, each tile can be treated as an individual subarray providing two signals in two orthogonal polarizations. All analog signals from the tiles are sent to the dedicated receivers where they are filtered according to the selected band and sampled by 192 analog-to-digital converters with the sampling frequency 200 MHz (or 160 MHz) and 12 bit resolution.
2.2. LOFAR Tile Subarray
As was mentioned in the introduction of this paper, the LOFAR HBA tile is a planar antenna (dipole) array. Each antenna element is a pair of crossed dipoles with two outputs (for two wave polarizations), which are connected to analog phase shifters separated for both polarizations. Each tile has two analog outputs connected to analog–digital converters. For the sake of simplicity, for the remainder of the article tiles consisting of dipoles with only one polarization will be considered.
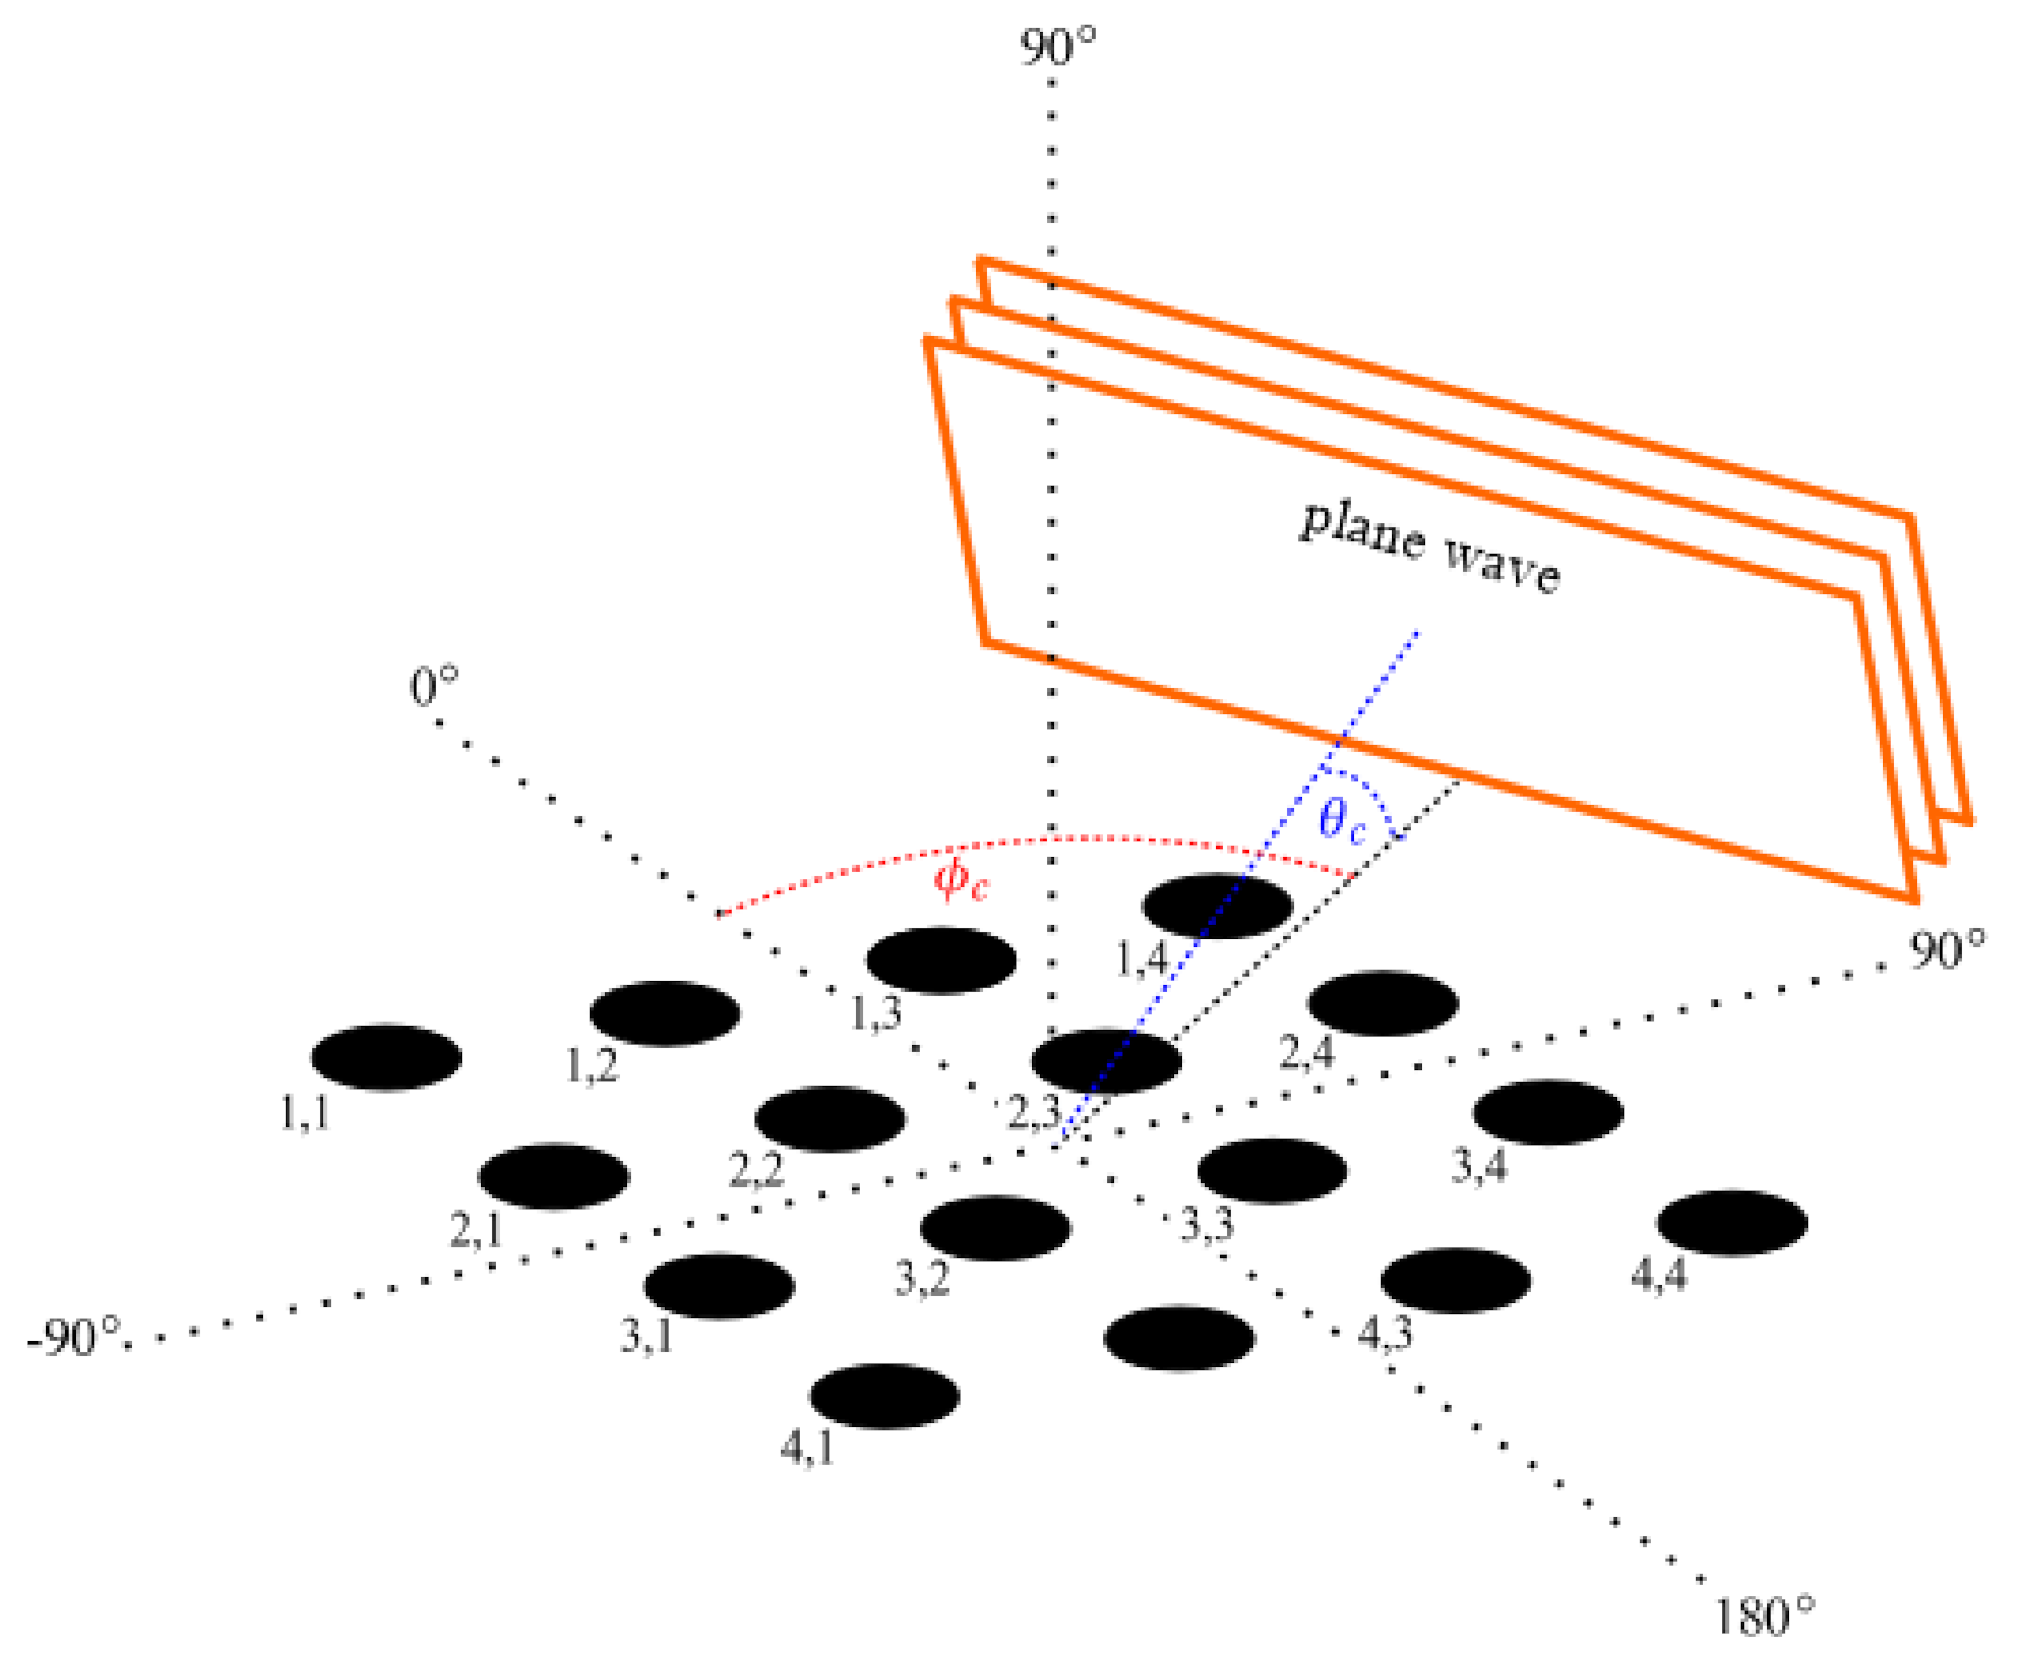
An arrangement of the dipole pairs in a single tile is presented in Figure 4. The LOFAR tiles can be considered as Uniform Rectangular Arrays (URAs), which means that the dipoles are uniformly spaced in a single tile [1]. The distance between two adjacent dipoles is [1]. An approaching plane wave from azimuth and elevation relative to a tile is also shown in Figure 4.
3. Beamforming of LOFAR for Passive Coherent Location
3.1. Single HBA
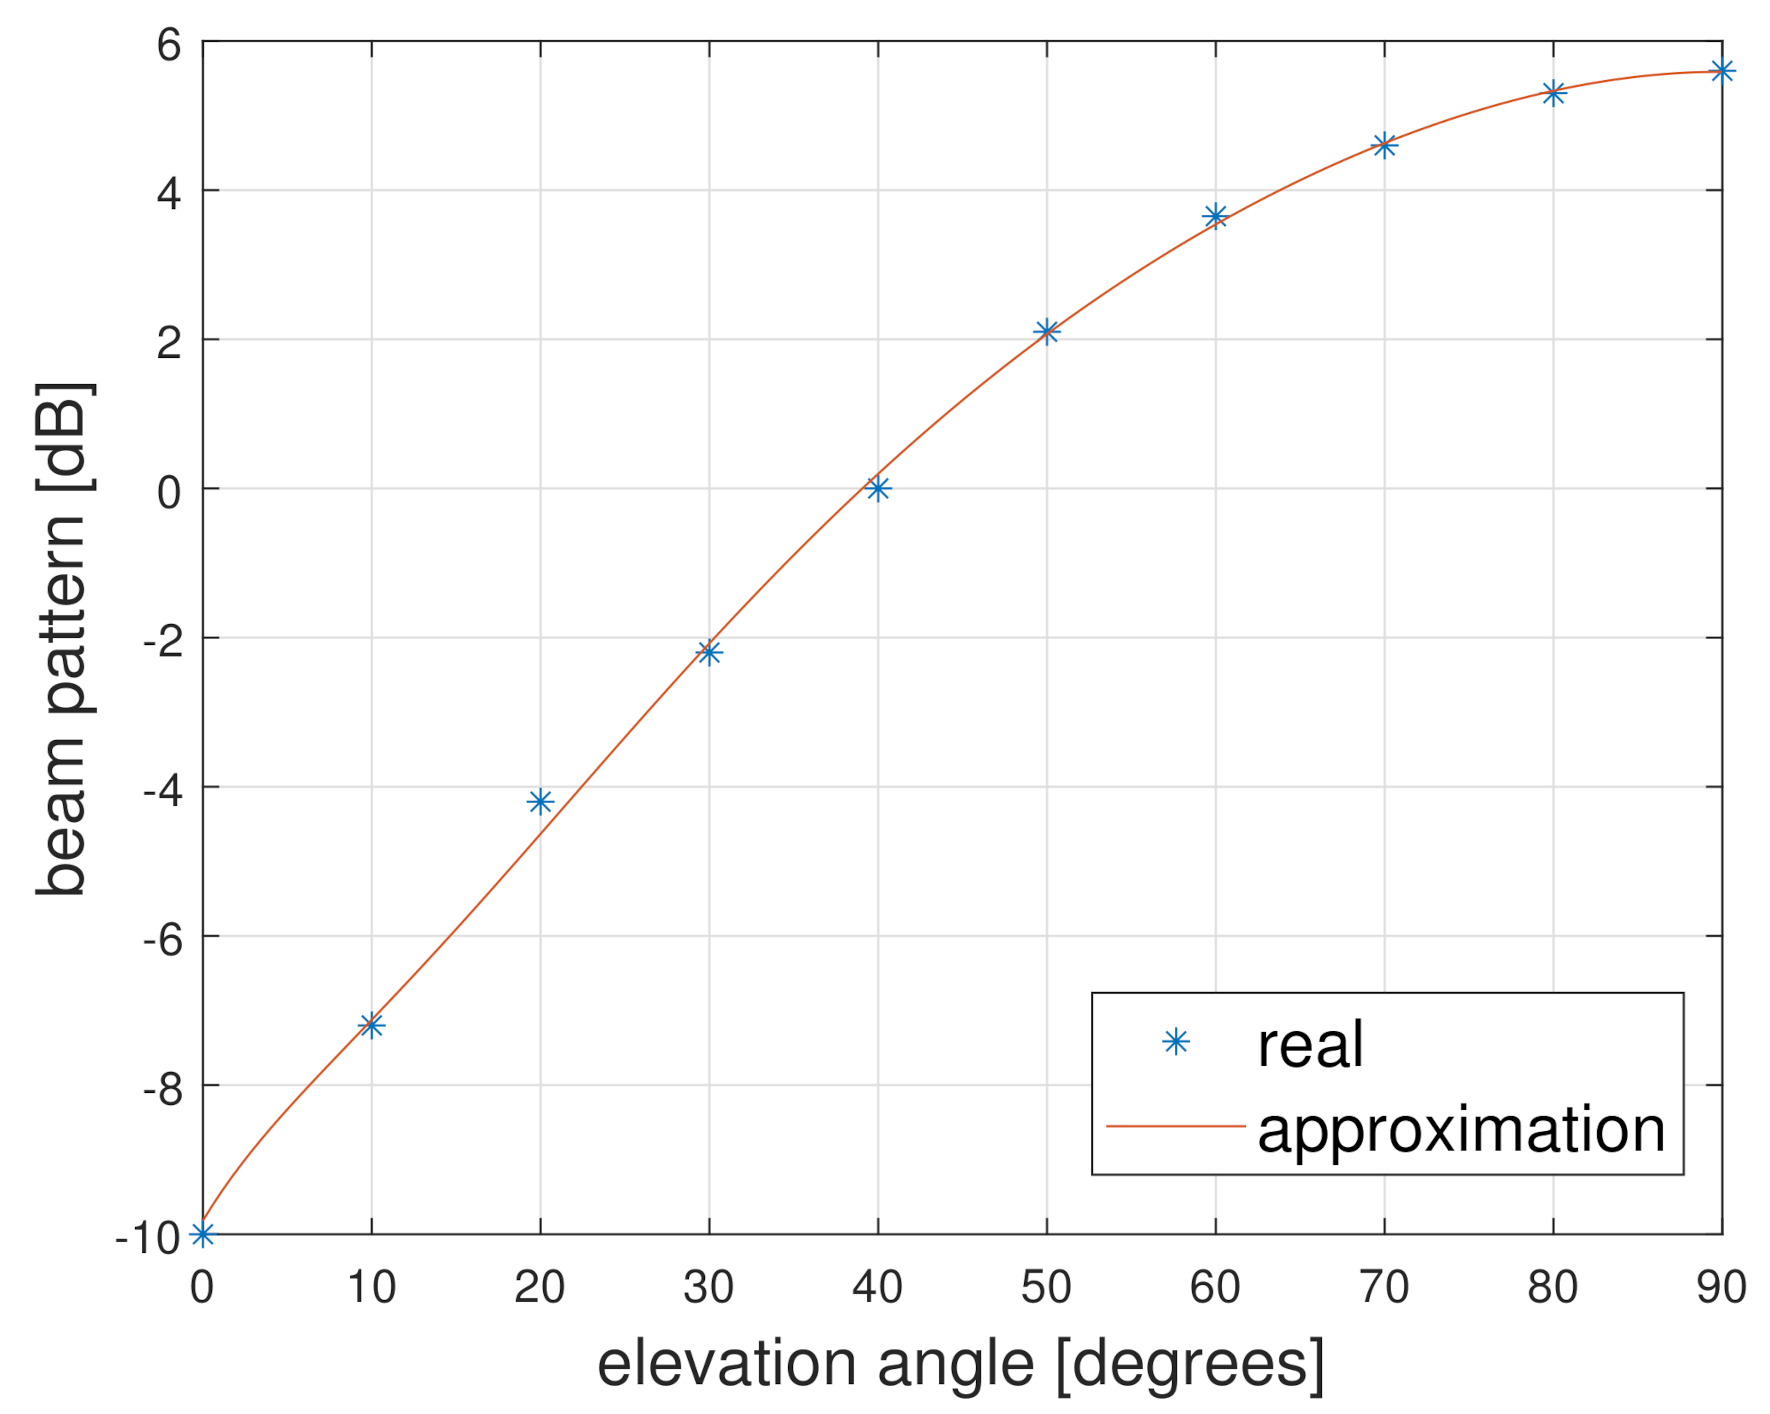
Due to the fact that the LOFAR system was designed for radio astronomy, signals approaching from the zenith are received in the most efficient way by a single HBA. In other words, the gain of a single HBA decreases as the elevation angle of an upcoming signal declines [1]. At the same time, the antenna gain does not depend significantly on the azimuth angle of the upcoming signal. The results of the measurements of the elevation characteristic for the single HBA, for the frequency 240 MHz, with a step of ten degrees, were presented in [12]. To take into account the elevation characteristic of a single antenna at any elevation angle, an approximation of this characteristic was performed. In Figure 5, the approximation of the elevation characteristics calculated from 10 measured points of the tile beam pattern in elevation for the carrier frequency of an upcoming signal equal to is presented. The approximation was created with a 4th order polynomial.
3.2. Single LOFAR Tile
Time delays of an approaching narrowband signal with an azimuth , an elevation relative to the tile and with a carrier wavelength can be represented as phase delays. The phase delay of that signal at the input of the HBA in the mth row and in the nth column, relative to the phase of that signal in the HBA in the 1st row and in the 1st column is
The beam pattern of an unsteered tile can be expressed as
where M and N are equal to 4 for the HBA tile.
Figure 6 shows the unsteered beam pattern for a LOFAR tile at the frequency which corresponds to the carrier frequency of the DAB+ signal used in the experiments whose results are presented in this paper. All figures presenting beam patterns in this paper were prepared for the same frequency. In order to facilitate the quantitative analysis of the beam pattern, its vertical cut at azimuth is shown in Figure 7. The width of the main lobe is about and the highest side lobes are about lower than the main lobe.
LOFAR tiles can be steered by analog phase shifters. For desirable direction and the beam pattern of a steered tile can be written as
where
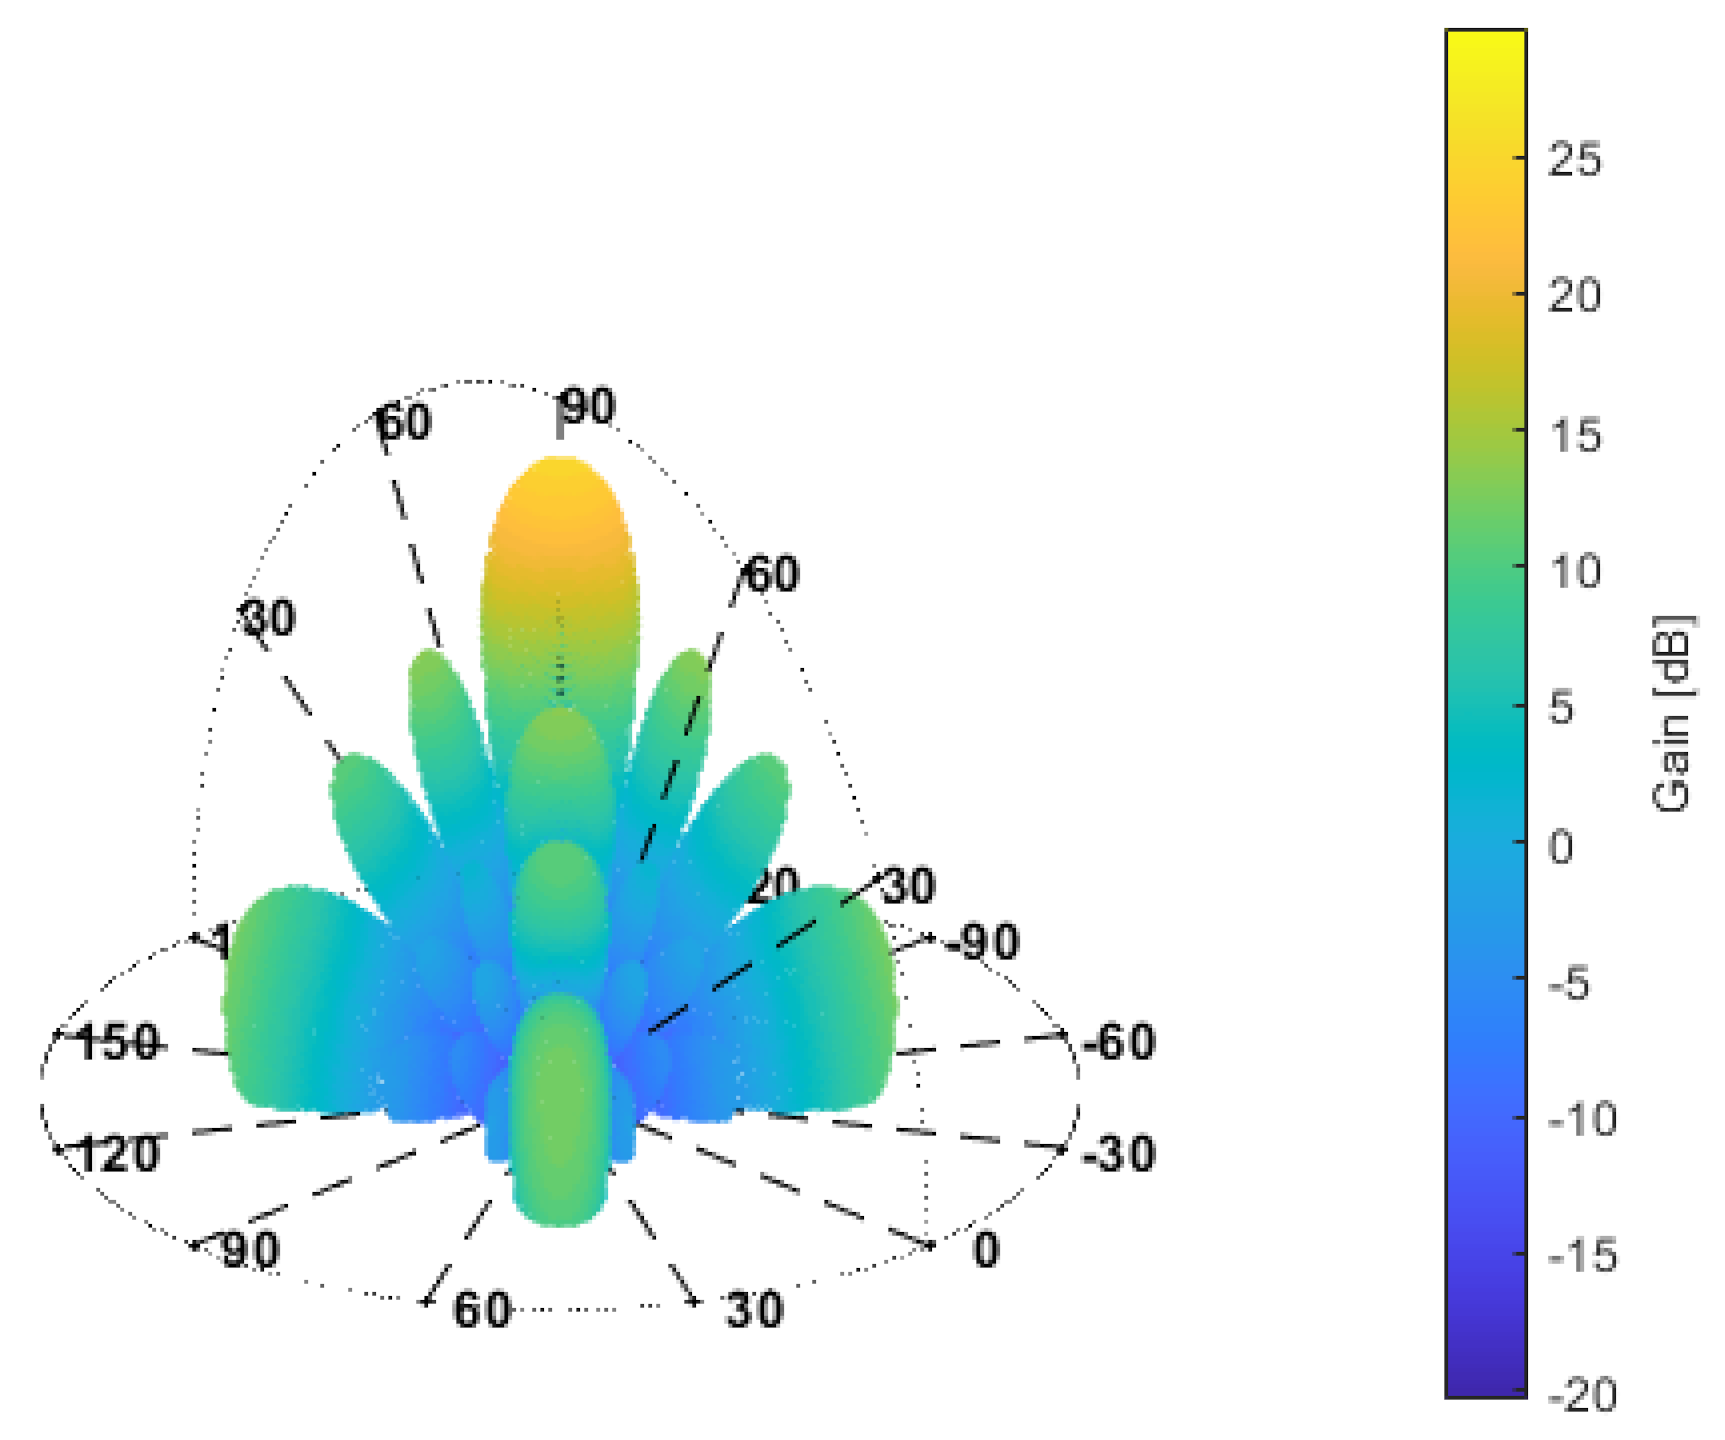
In Figure 8, a beam pattern of a LOFAR tile with the beam steered at and is shown. These angle values correspond to the azimuth and elevation of one of the airplanes considered in the field experiments, whose results are presented in Section 4.
Apart from the main lobe in the desirable direction, a few grating lobes can be seen in the beam pattern. Grating lobes in the steered beam patterns occur when the following condition is not fulfilled [13]:
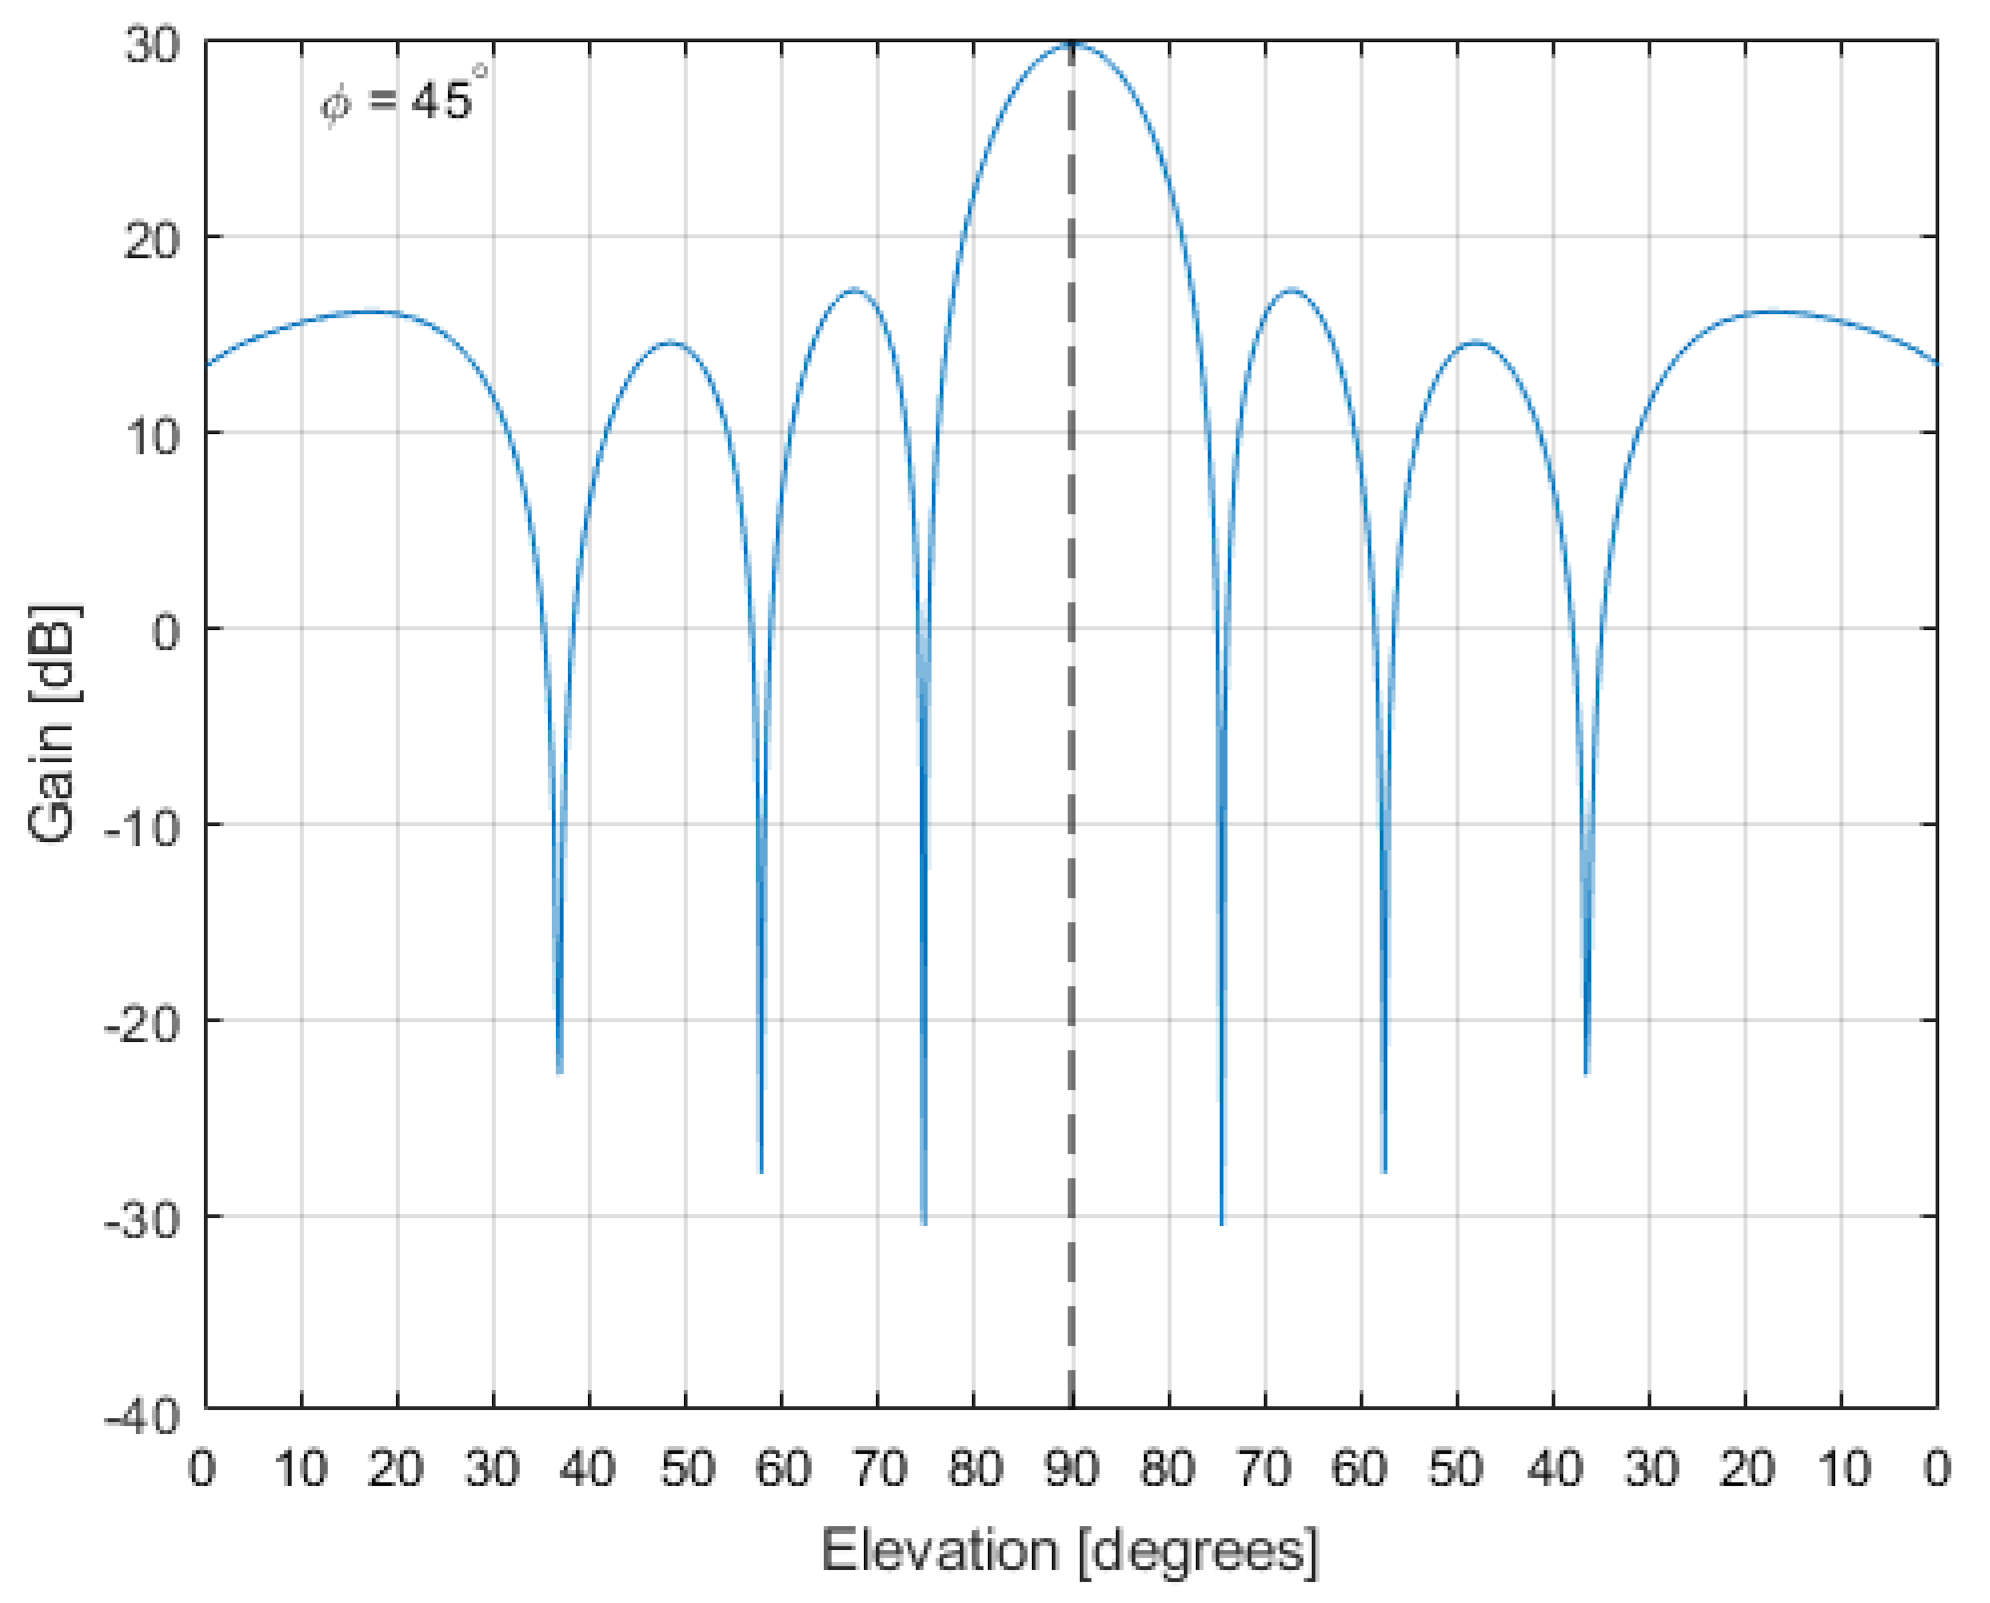
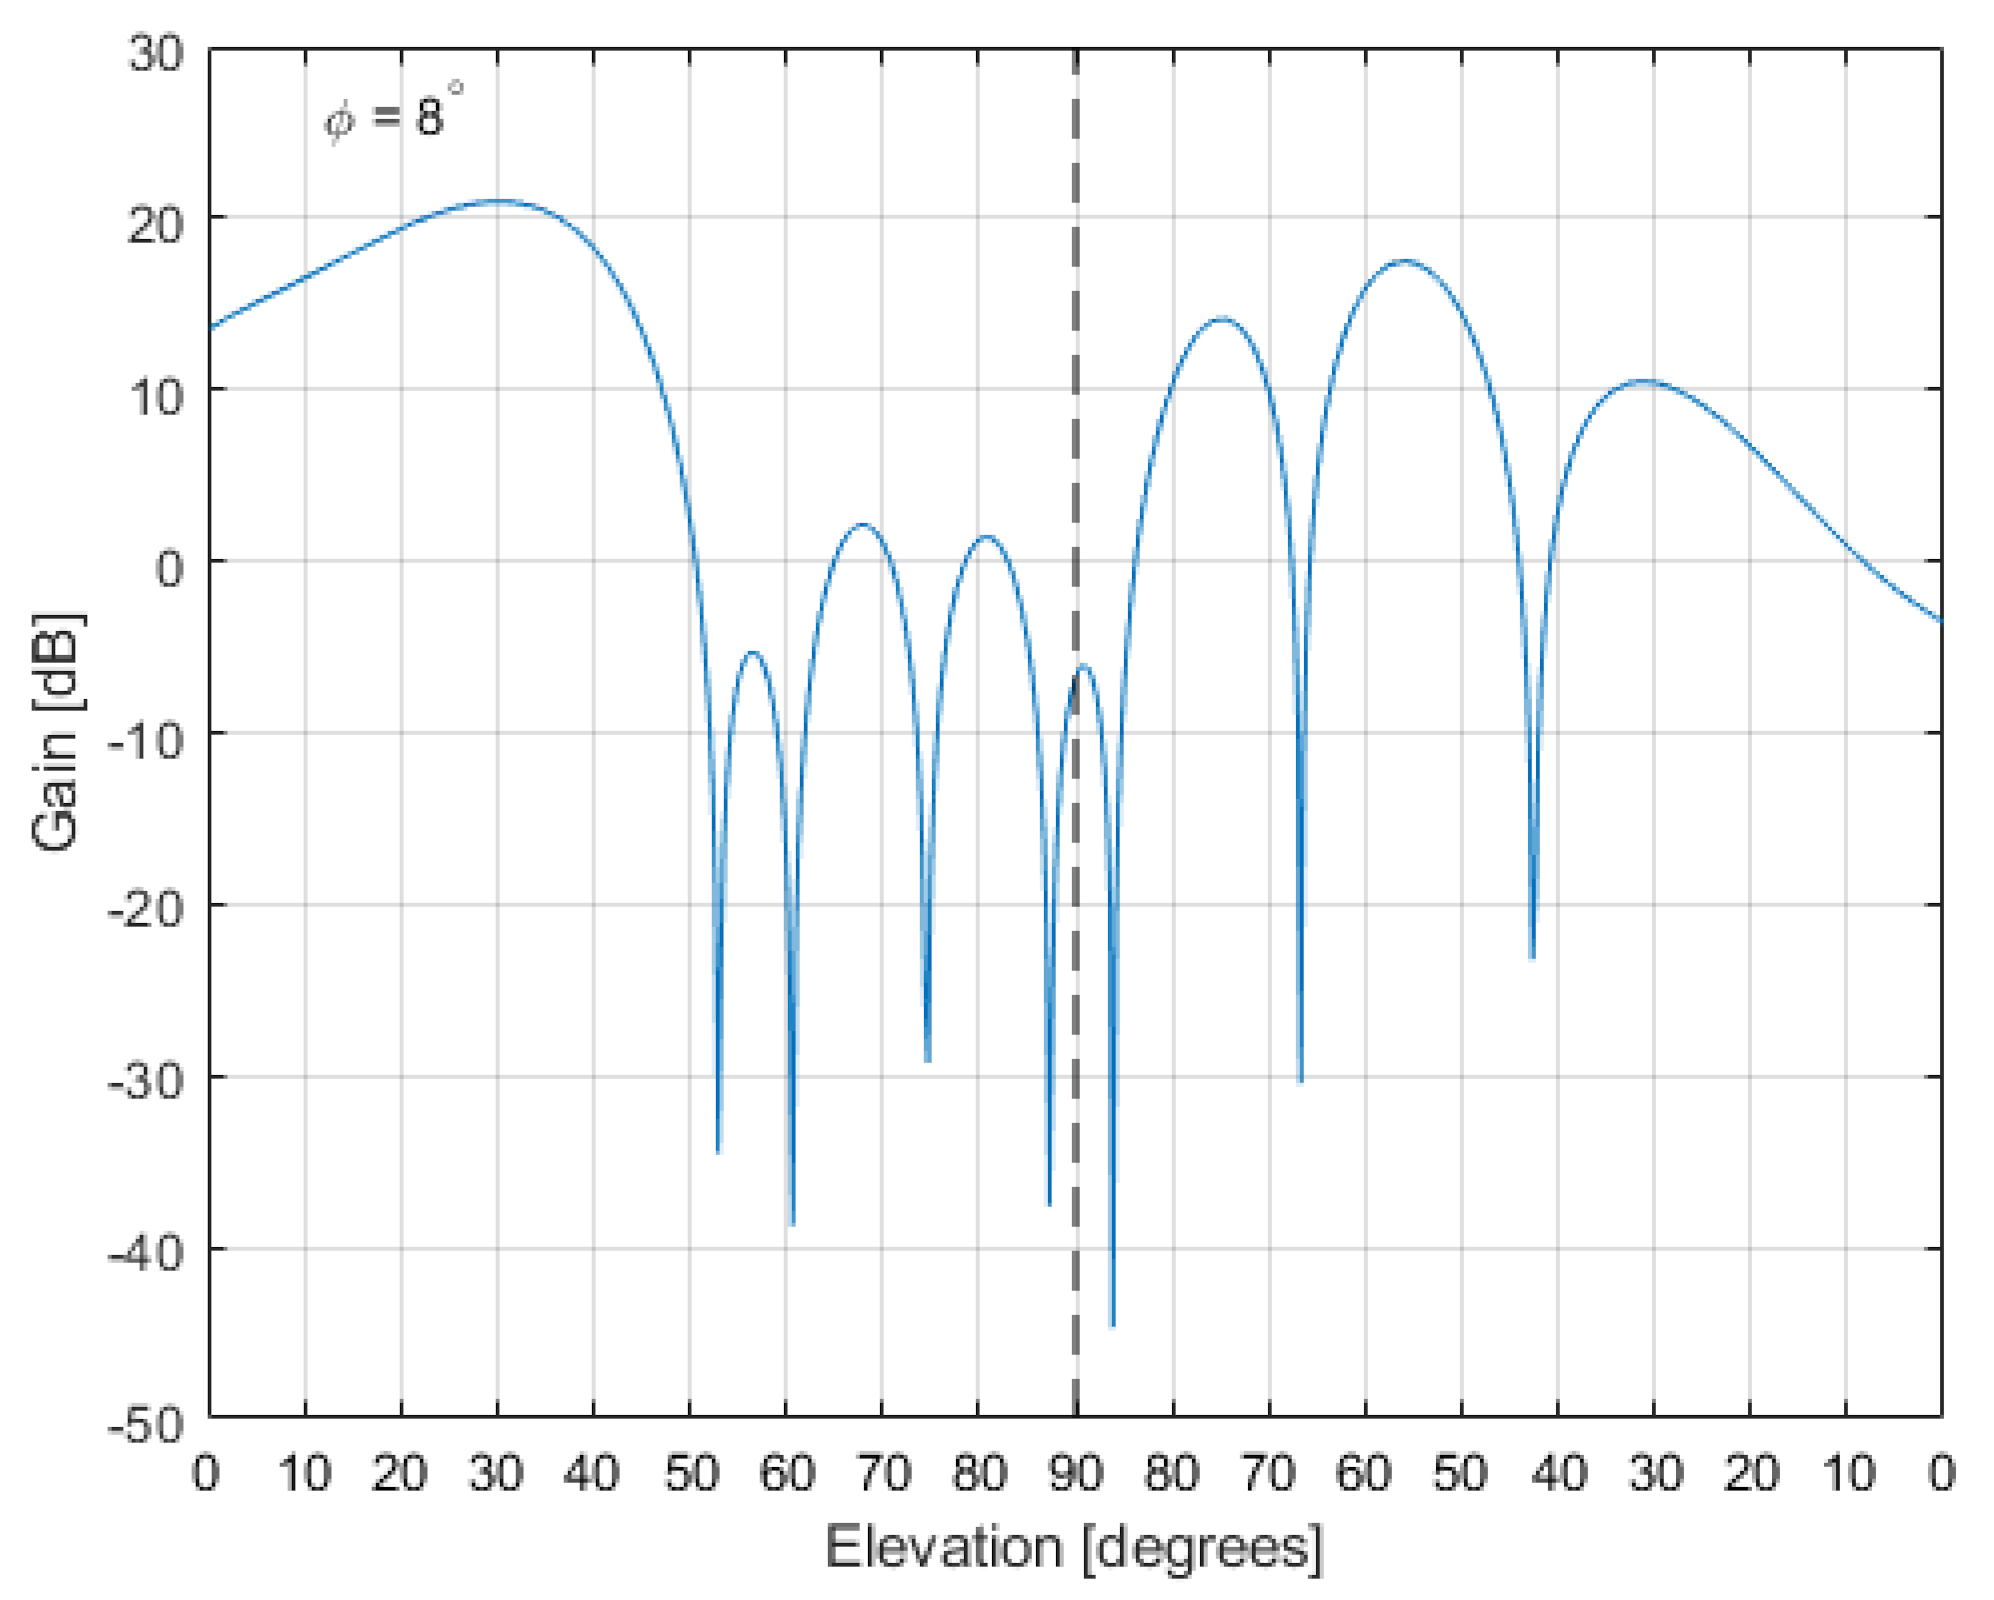
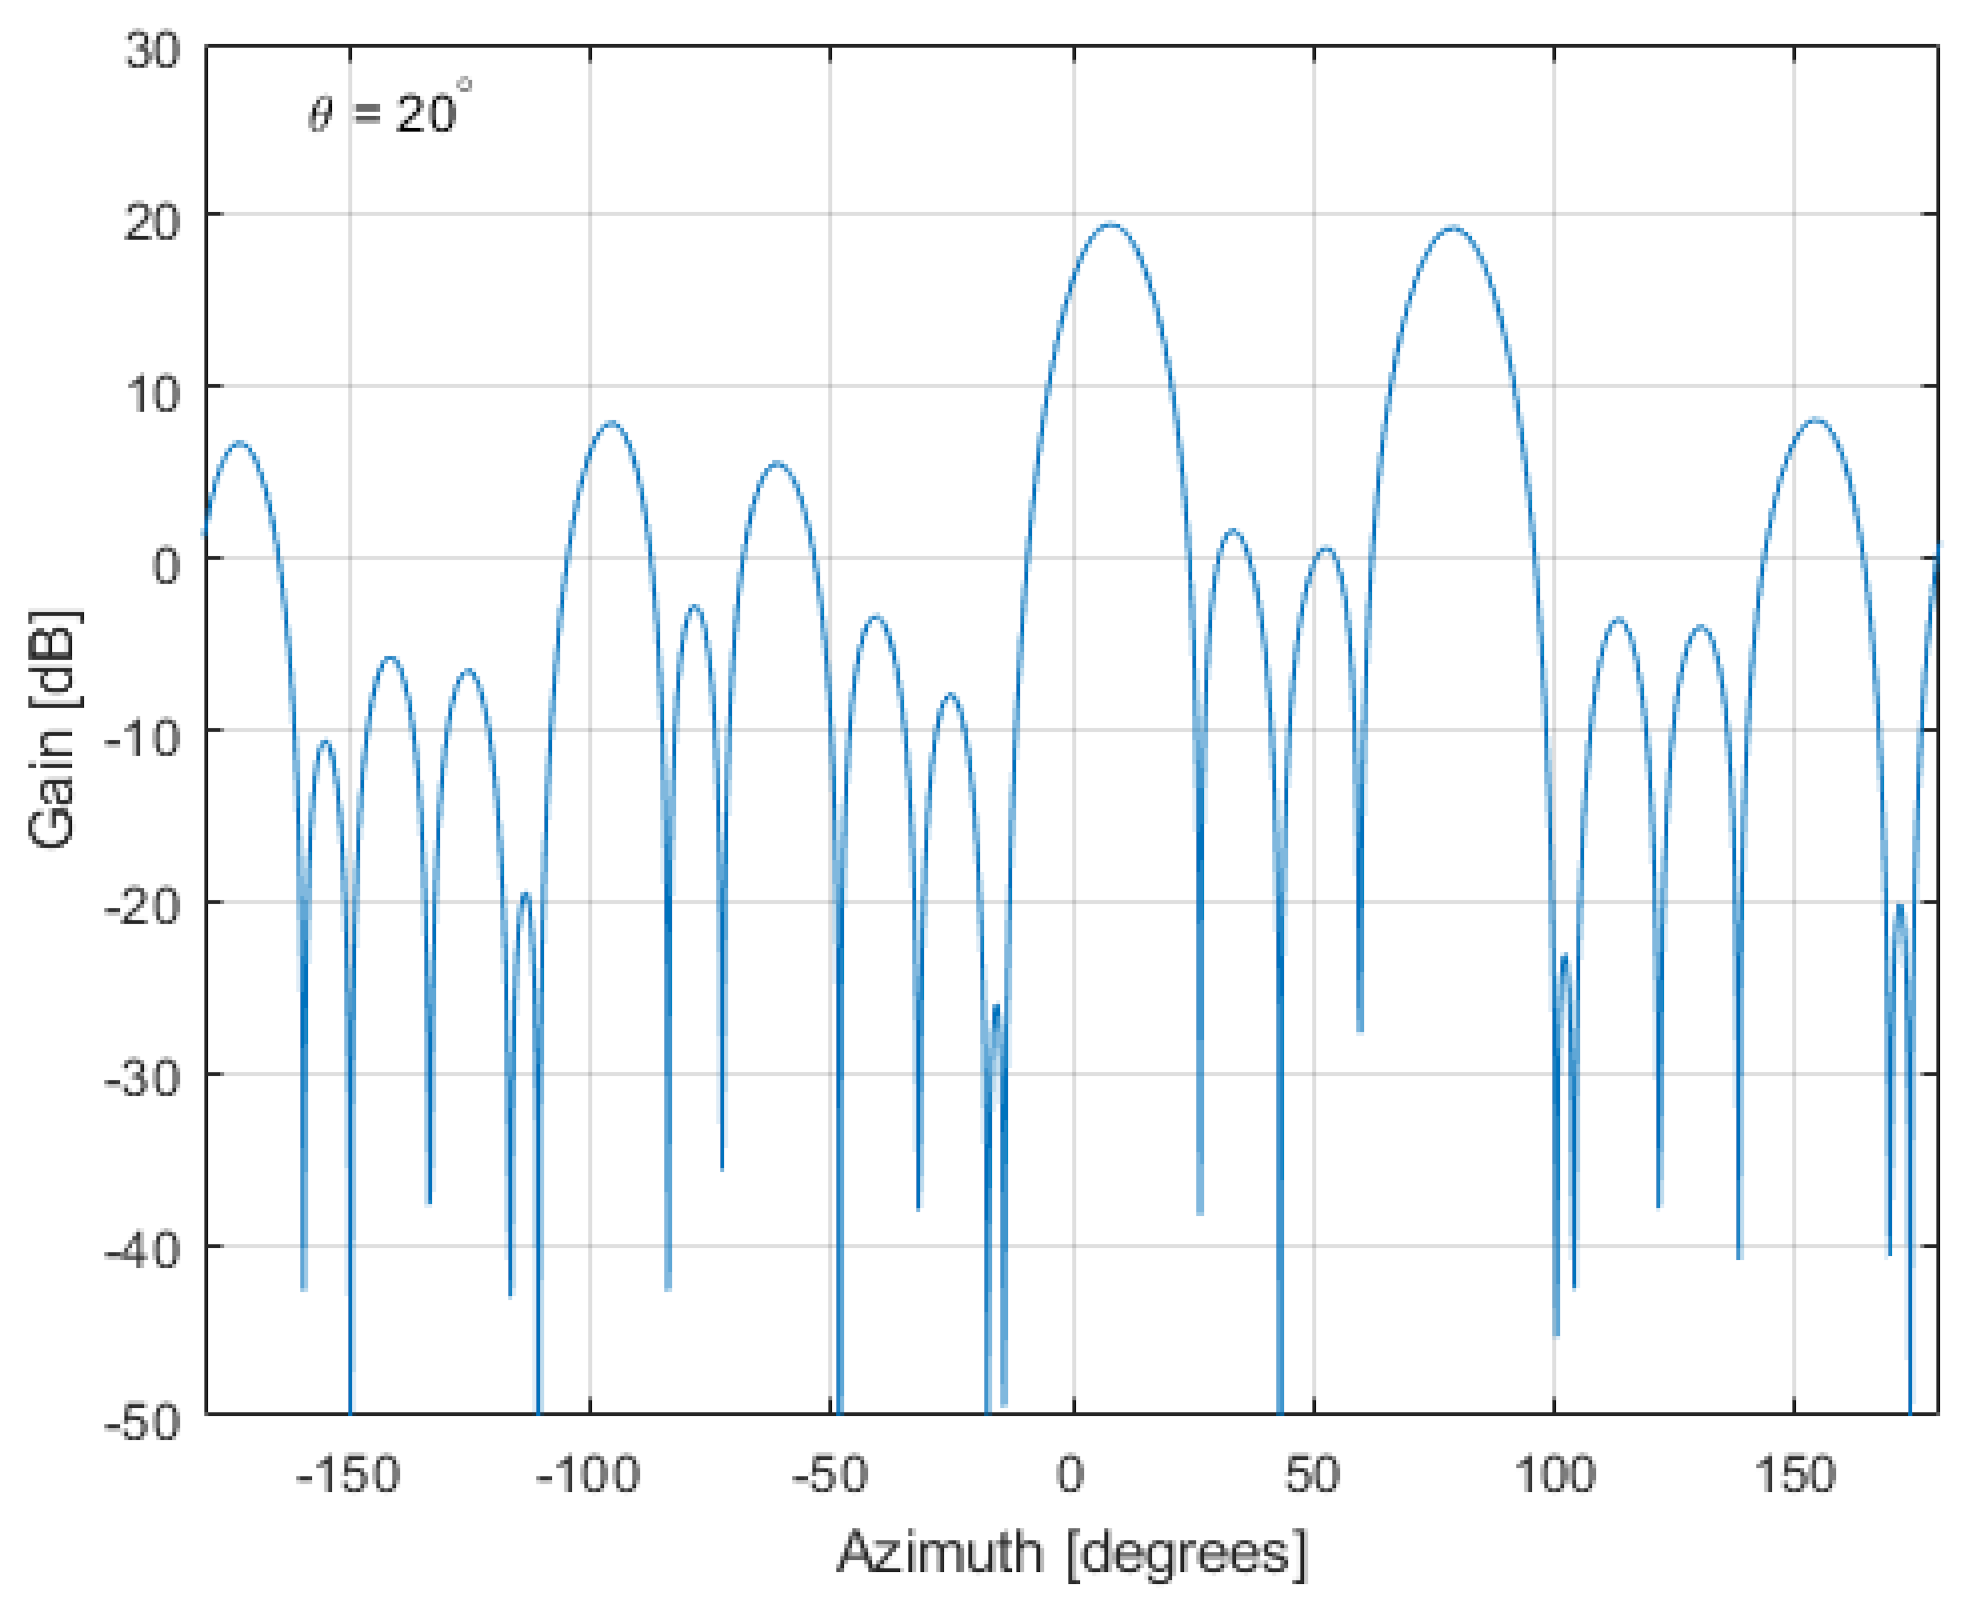
The grating lobes in the LOFAR tile’s beam pattern can be even higher than a main lobe due to the directivity of a single HBA described in the previous point. This phenomenon, which can be seen in Figure 8, occurs when a grating lobe has a higher elevation angle than a main lobe. Figure 9 and Figure 10 show the vertical and horizontal cuts of this beam pattern at azimuth and at elevation, respectively. In Figure 9, it is apparent that the main lobe around is very wide and its maximum is about . On the other hand, in Figure 10 the grating lobe for about is comparable to the main lobe for .
3.3. LOFAR Station
As was mentioned before, the output of a single HBA tile is the analog signal that serves as the input of the analog-to-digital converter and can be treated as the output of a single antenna element. The signal samples from many tiles can be further processed using digital beamforming methods. The formula for the beam pattern of an unsteered LOFAR station can be written as follows:
where
and D is a set of ordered pairs (compare to Figure 3):
An unsteered beam pattern of the LOFAR station is presented in Figure 11 and its vertical cut at azimuth is shown in Figure 12. The main lobe width is about , therefore it is approximately 8 times more selective than main lobes in the beam patterns of the single LOFAR tile. Moreover, the highest side lobes of the beam pattern of the entire LOFAR station are about lower than the main lobe. Thus, the difference between the main lobe and the highest side lobes for the LOFAR station is bigger than the difference for the single tile by about (compare to Figure 7).
Digital beamforming for the entire LOFAR station is possible using, for example, the Phase-Shift algorithm. This algorithm is an efficient beamformer for narrowband signals due to its independence from the sampling rate [11].
The Phase-Shift algorithm can be described in a similar way as the representation of phase shifts made by analog phase shifters in particular tiles. To steer a beam in the desired direction of angles and , output signals from tiles have to be multiplied successively by complex coefficients from a steering vector :
thus, in matrix notation the Phase-Shift algorithm can be written as
where is the matrix with signals from every tile in its successive columns. For this case, the formula for the beam pattern of the steered LOFAR station is as follows:
where
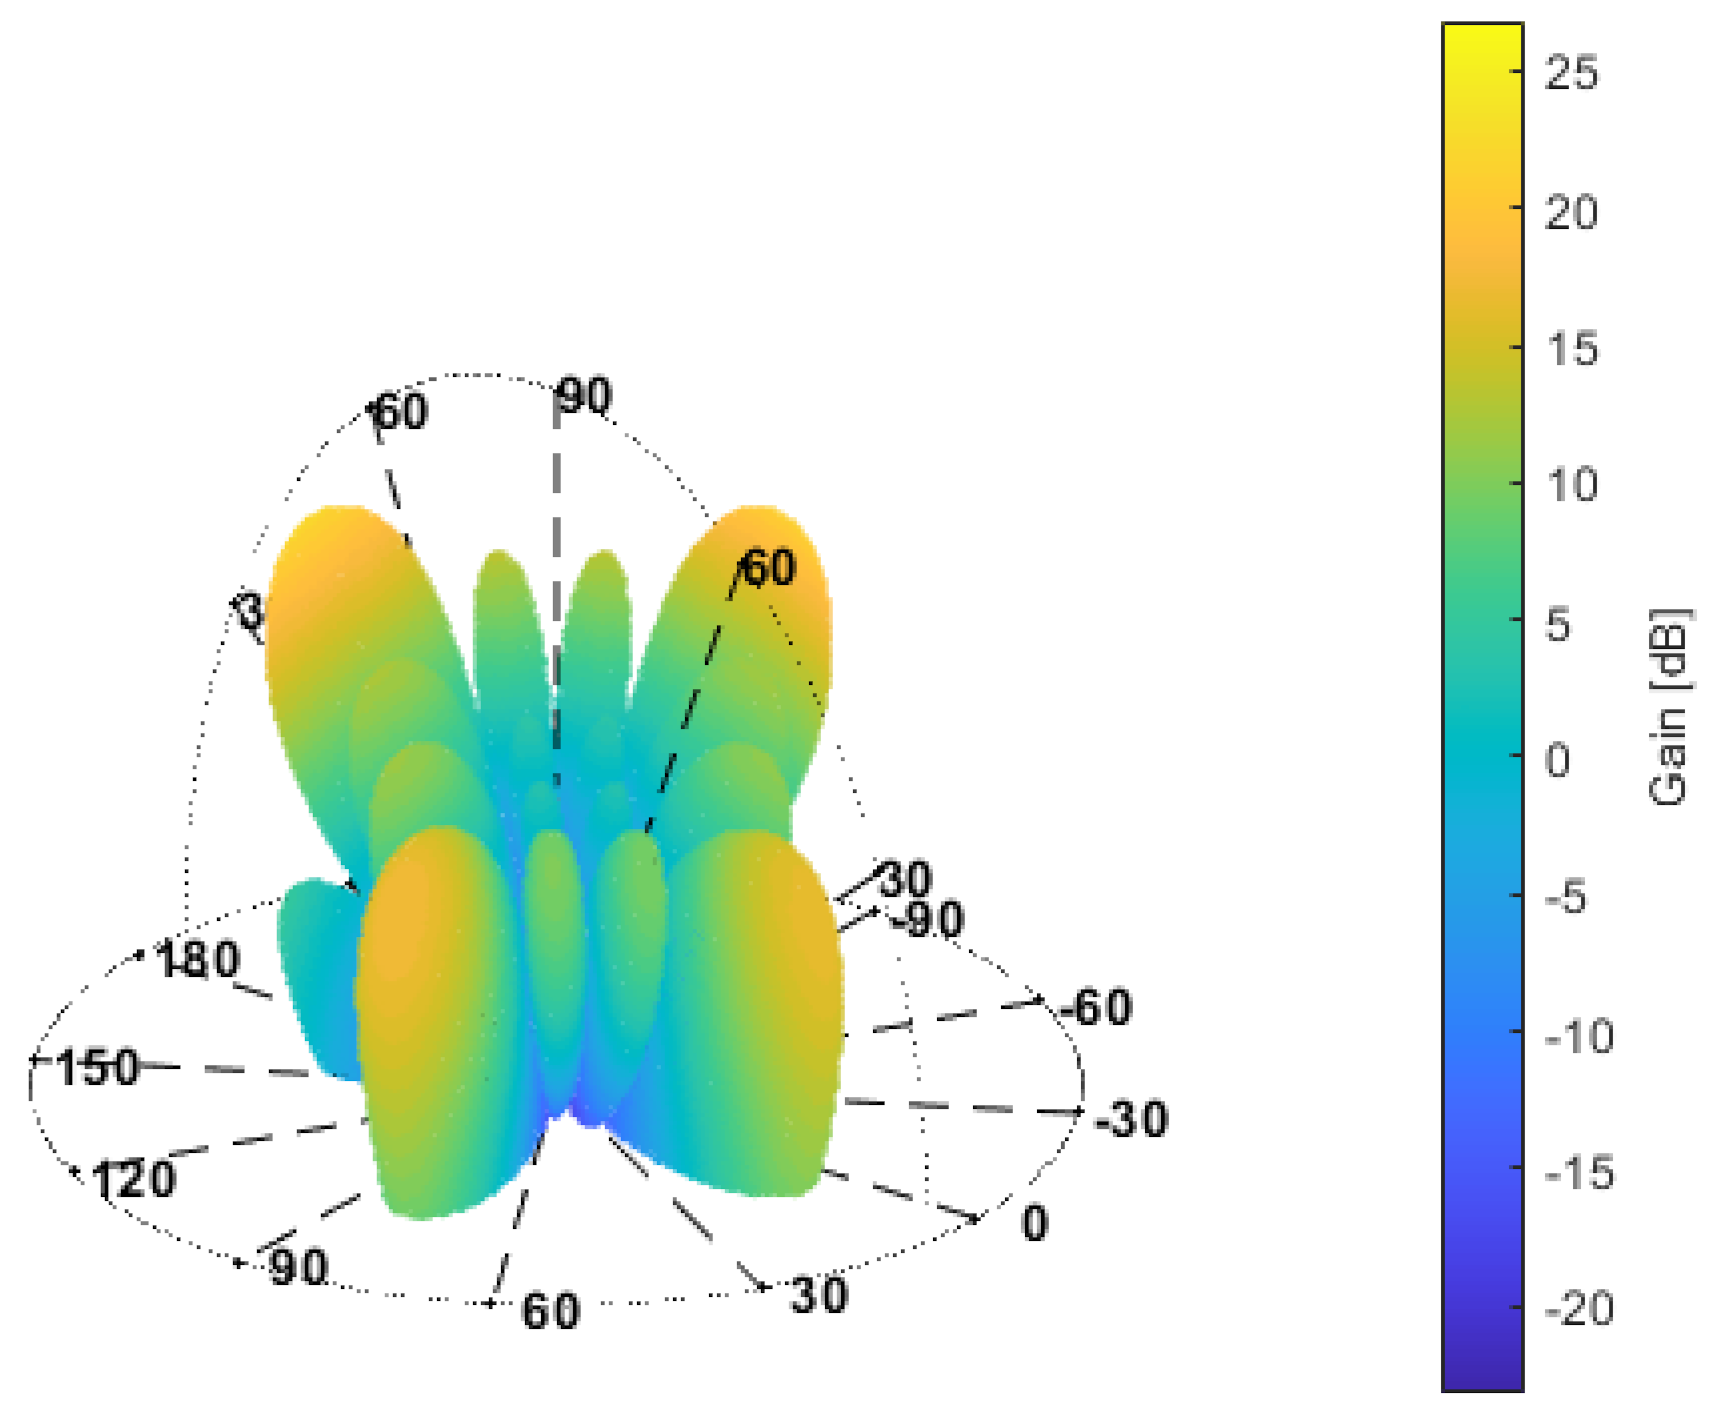
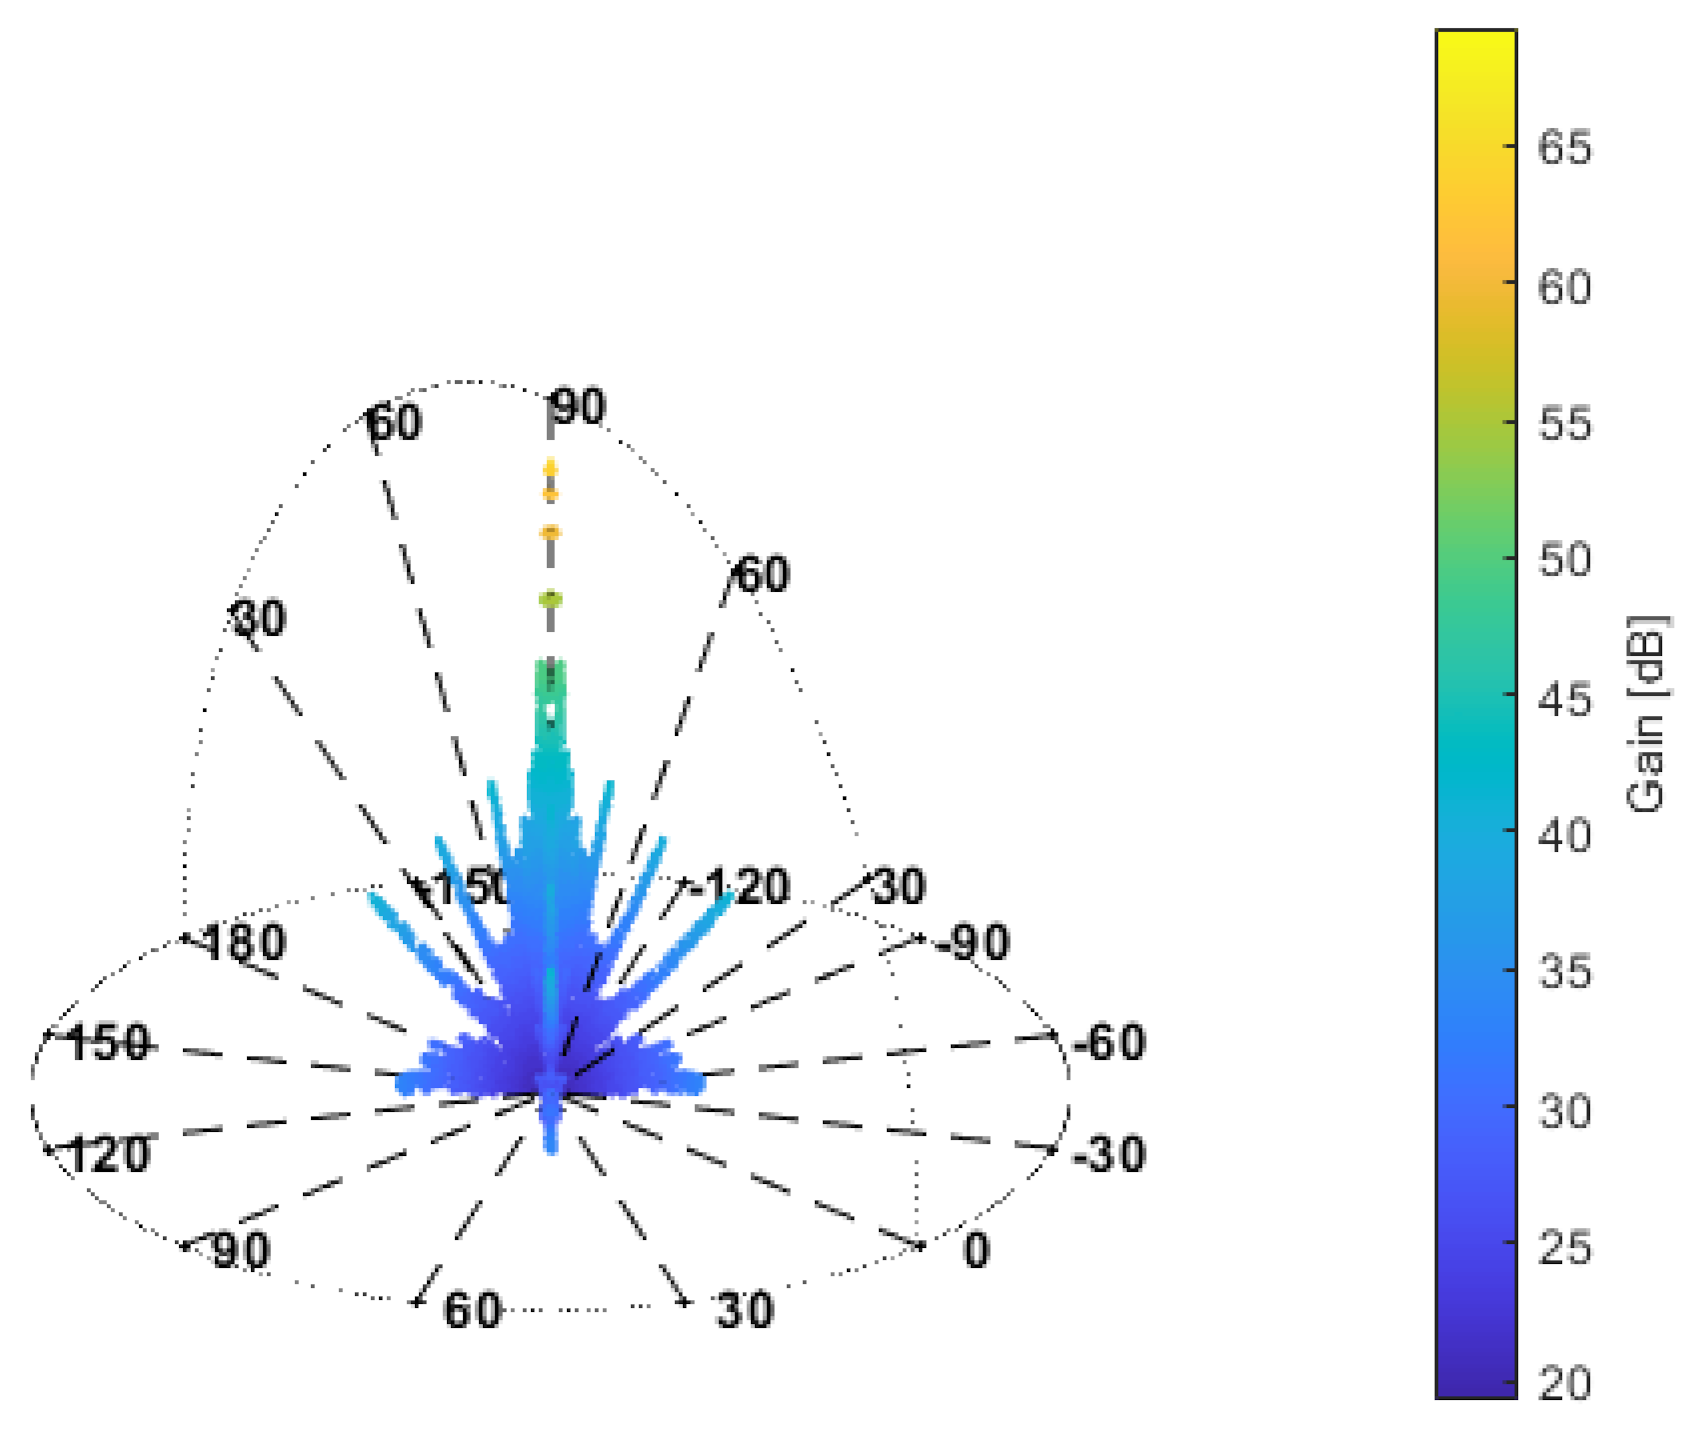
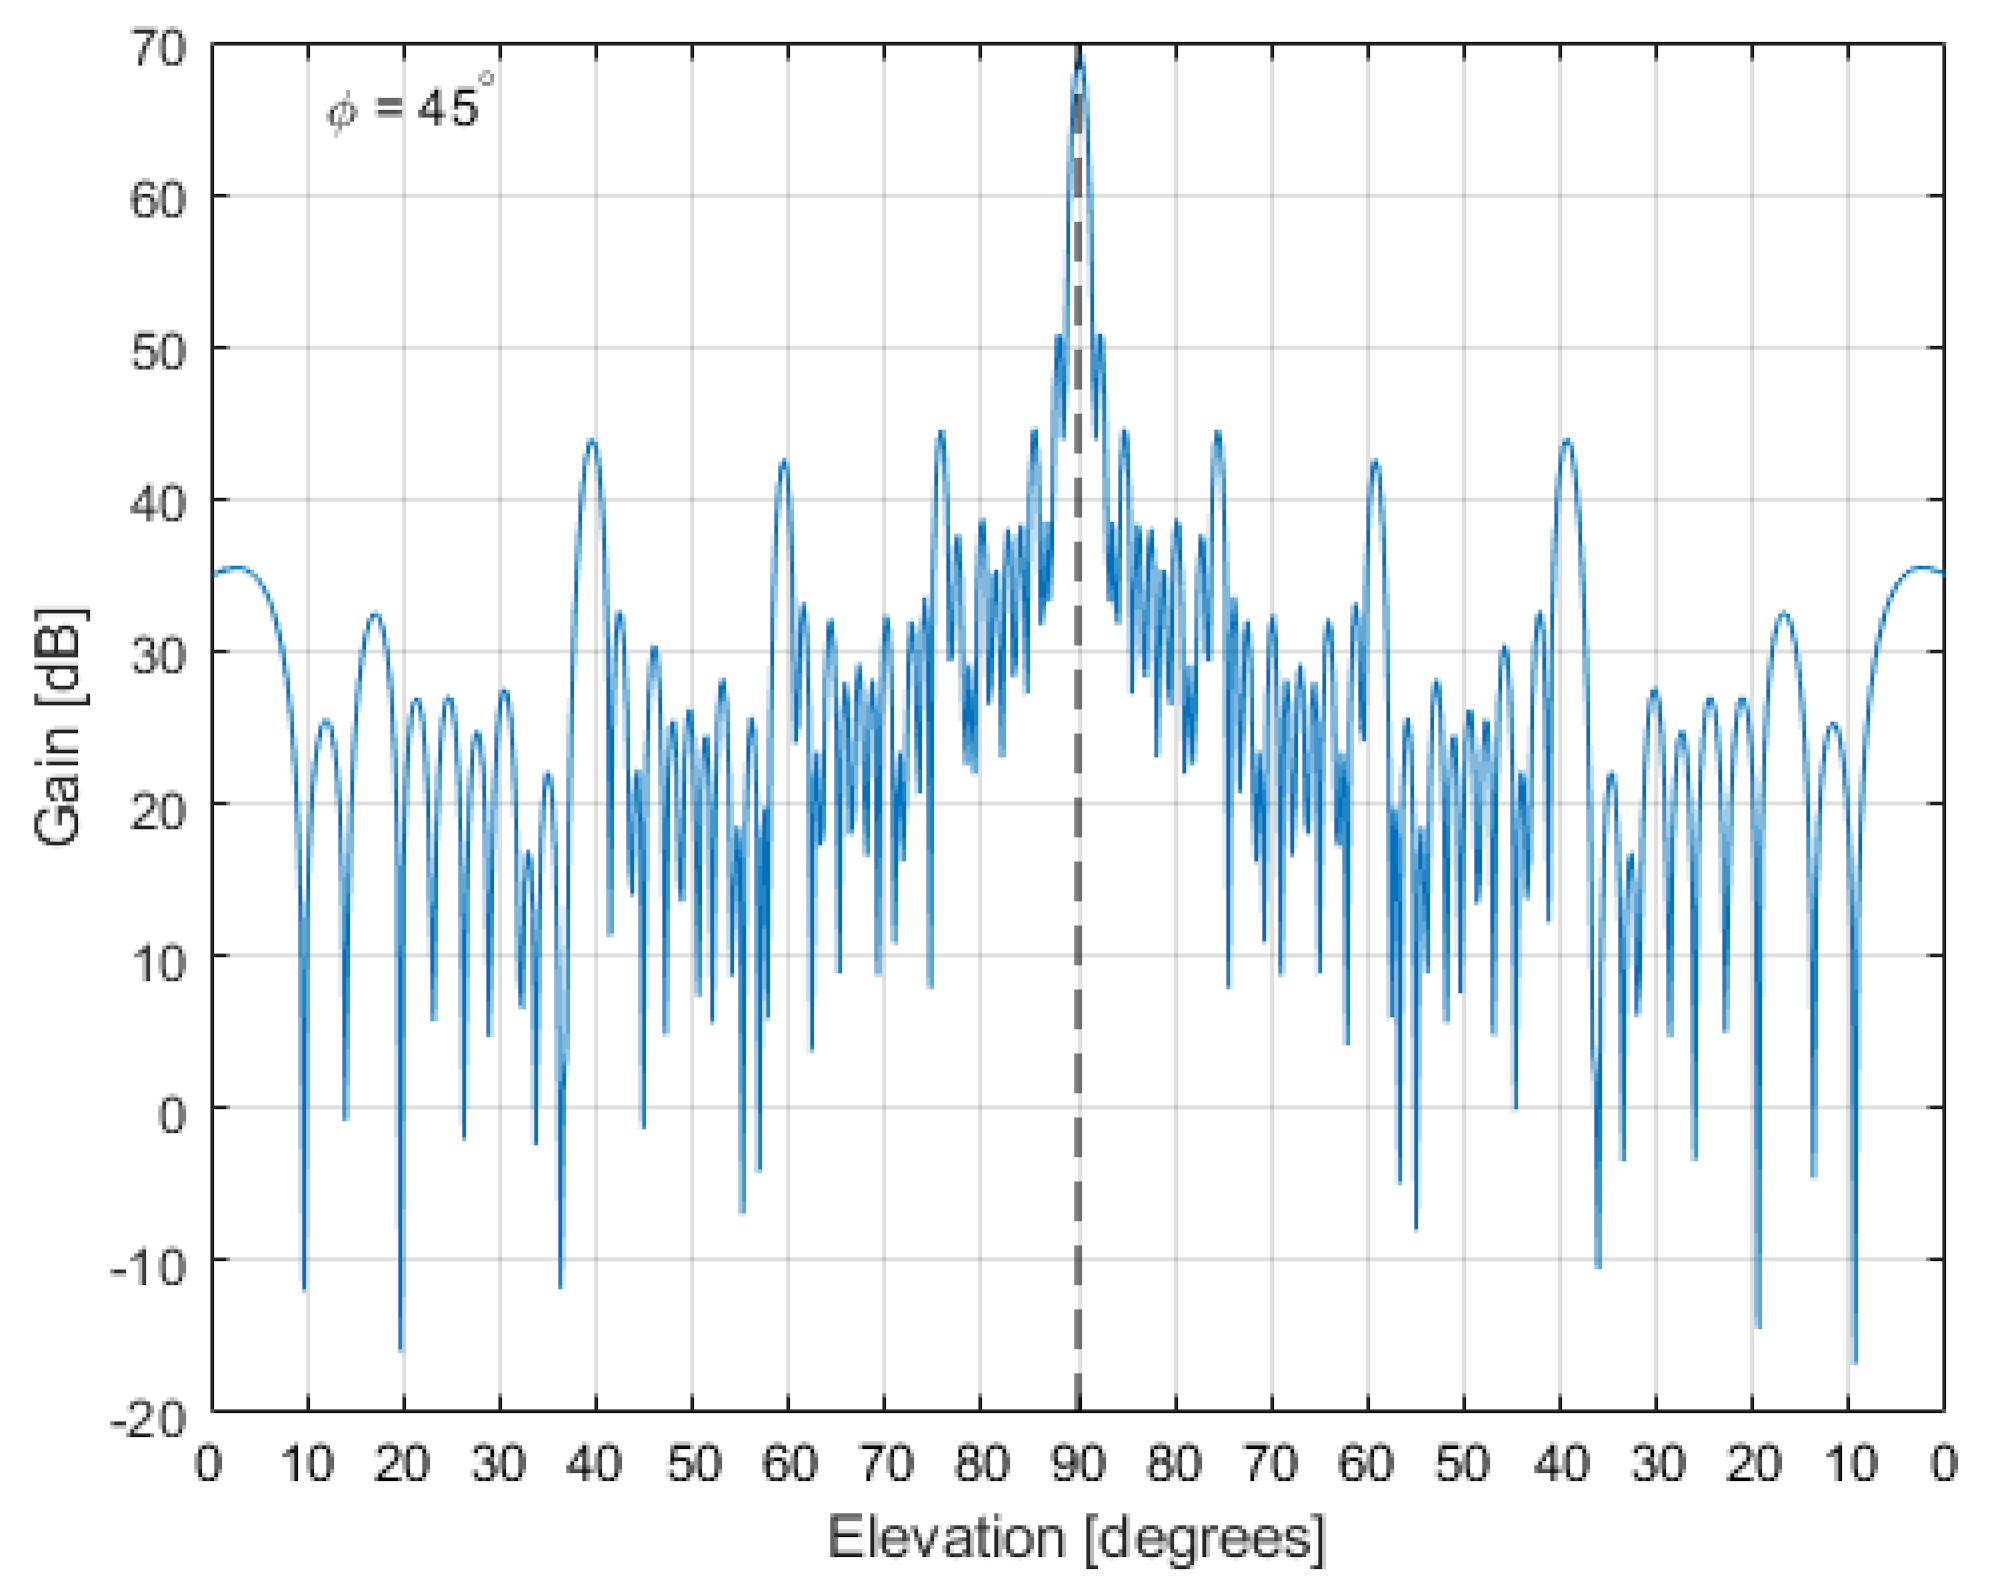
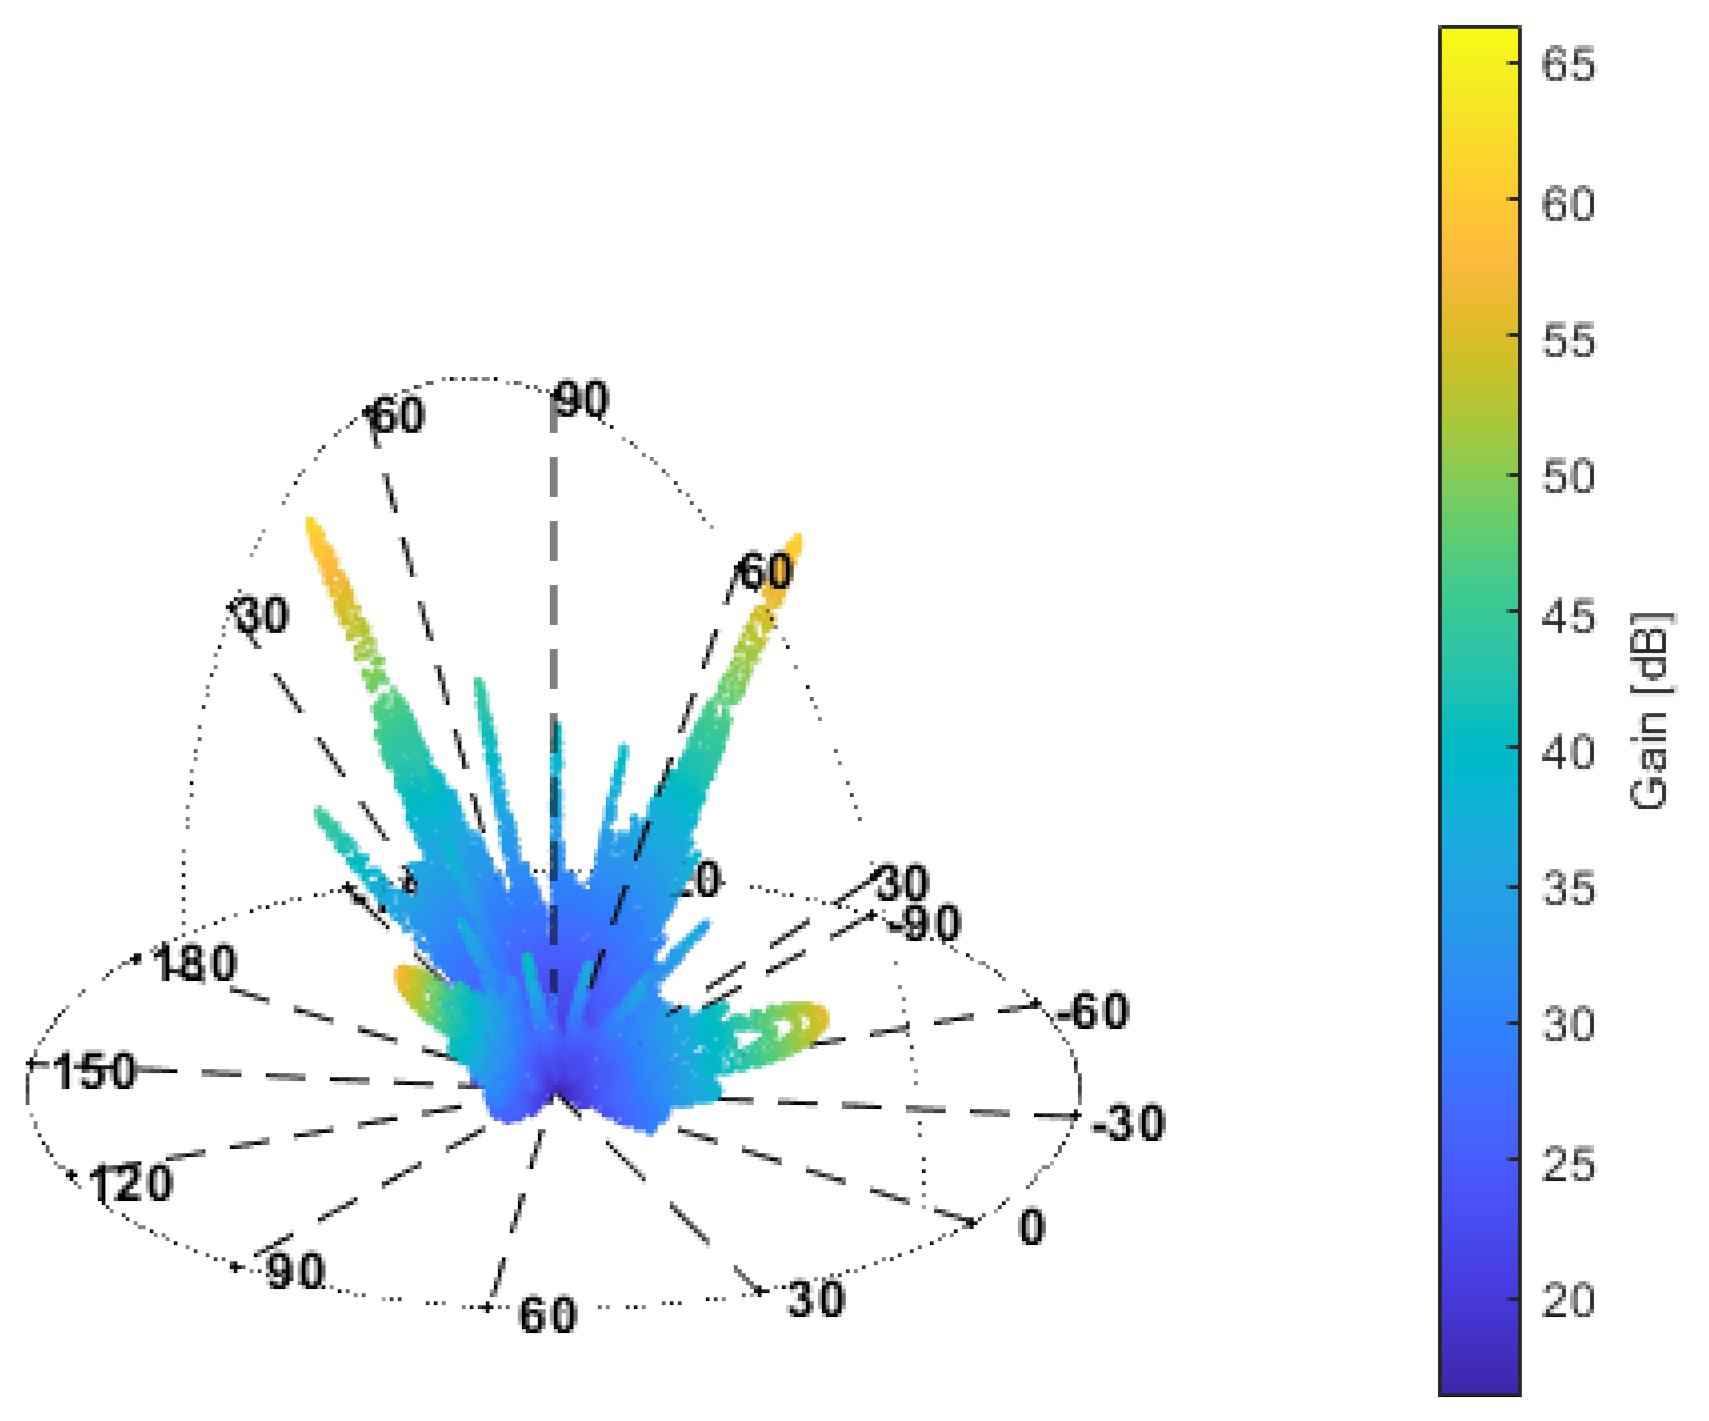
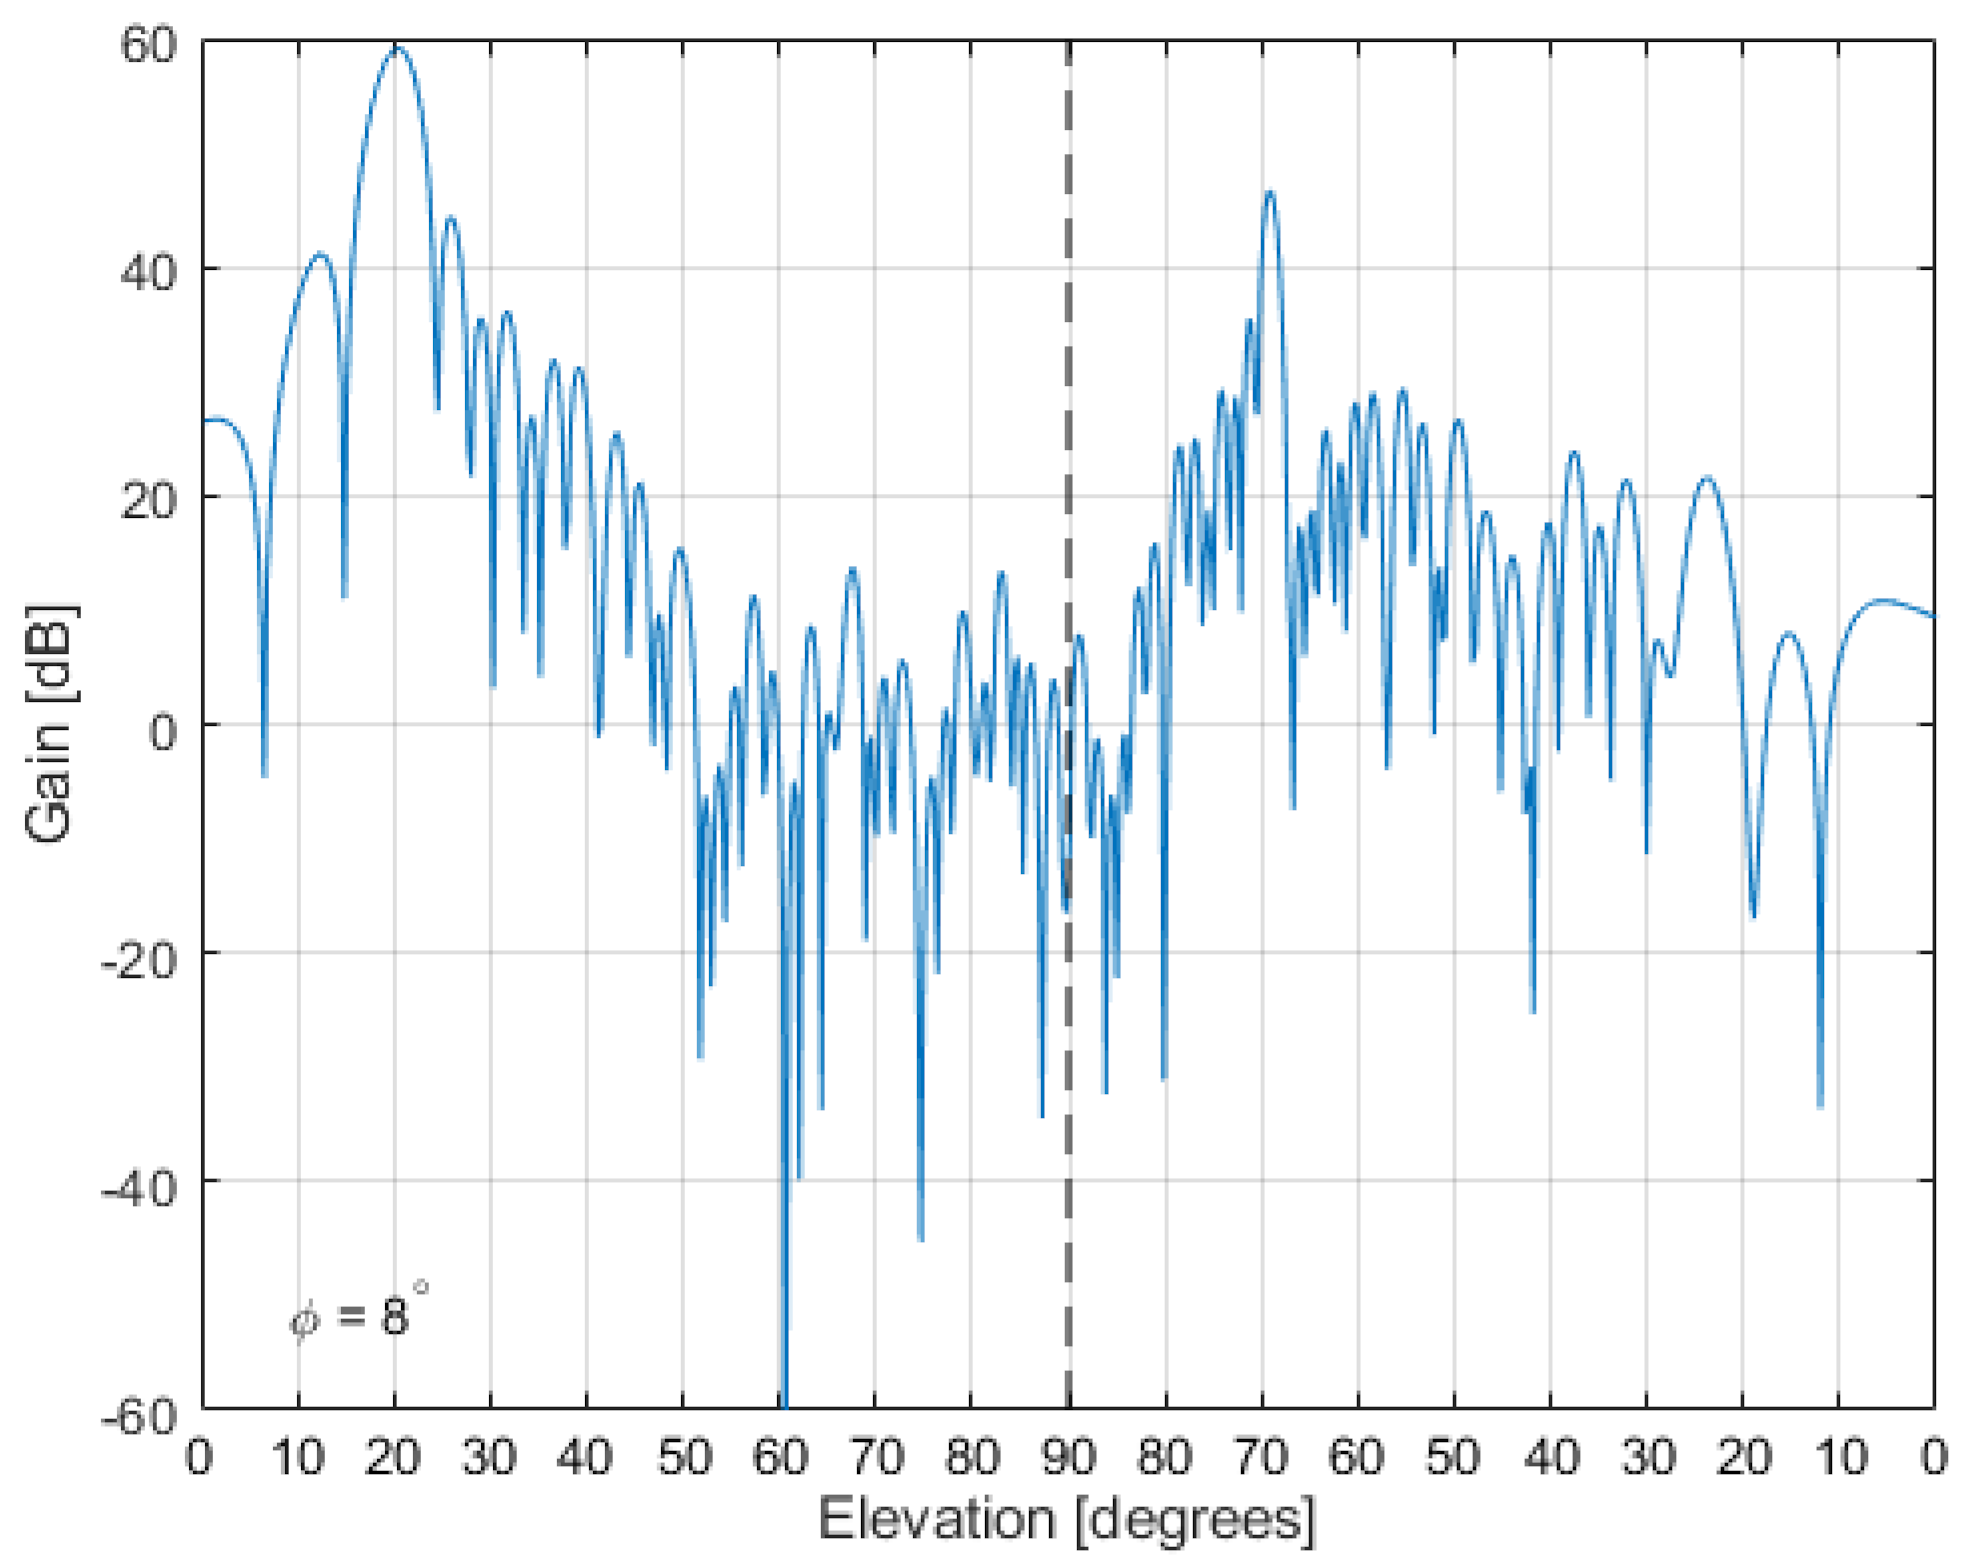
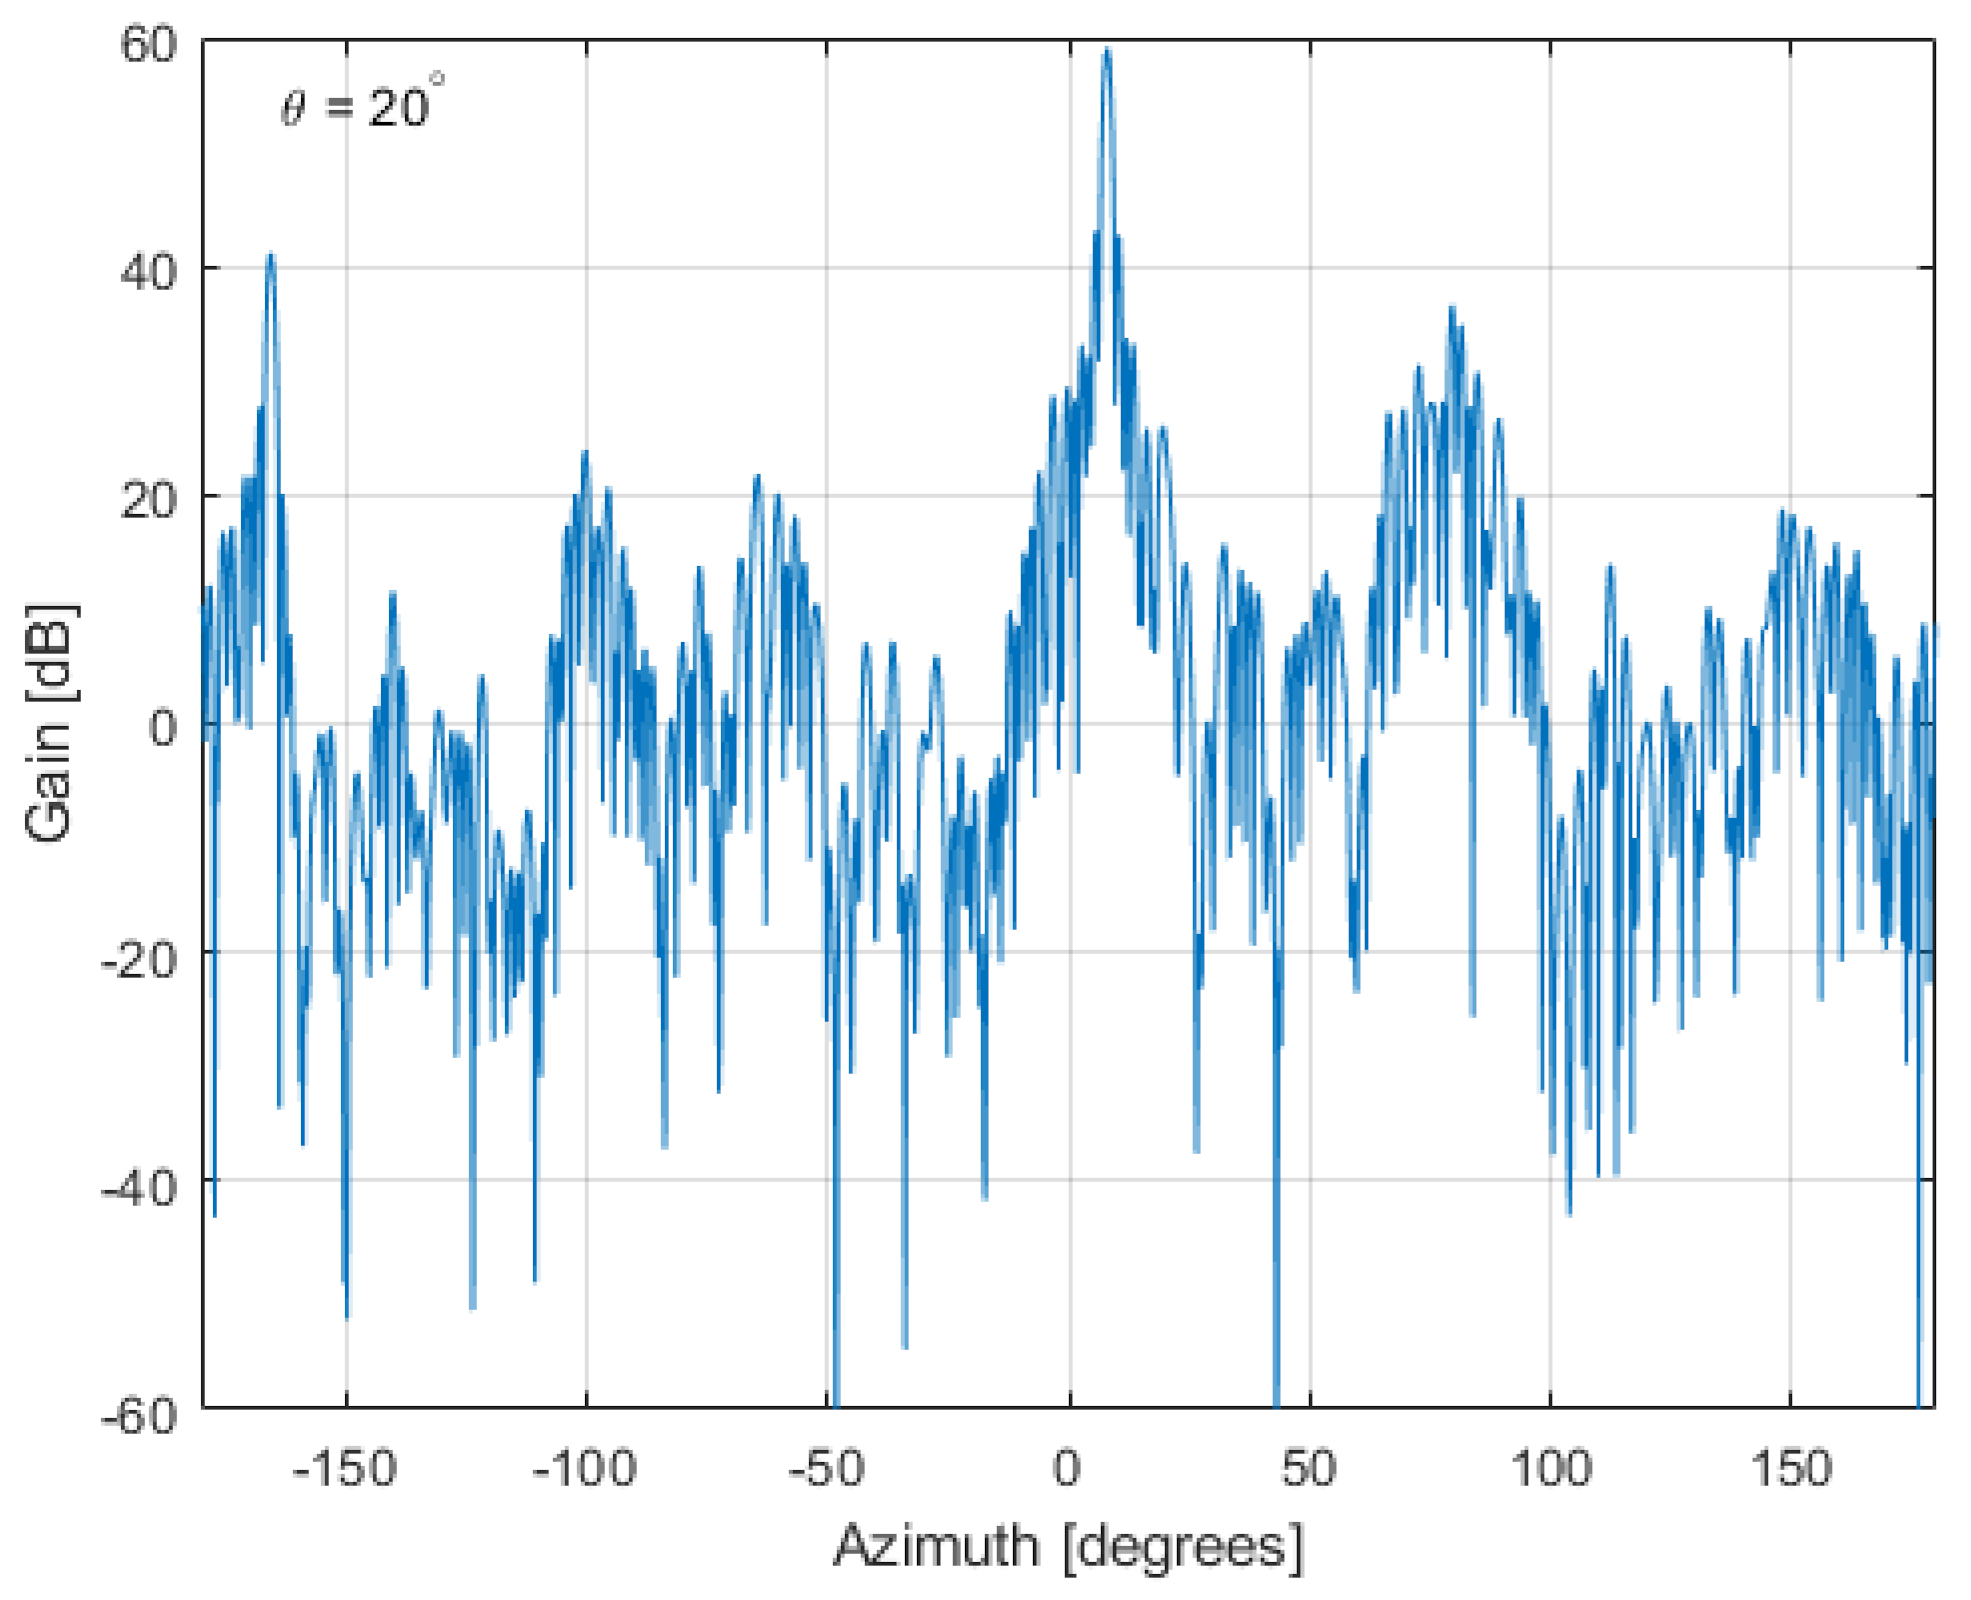
A beam pattern of the LOFAR station steered at and is presented in Figure 13. Figure 14 and Figure 15 show the vertical and horizontal cuts of this beam pattern at azimuth and at elevation, respectively (compare to Figure 9 and Figure 10 obtained for the single tile).
As can be seen in Figure 13, the grating lobes are still an issue in the LOFAR station beam patterns, but their width is significantly lower than for the single tile (compare to Figure 8). It should be noted that in the case of passive radars, the grating lobes do not have a direct impact on the determination of the target position as in the case of radars with rotating antennas. If an object is in the grating lobe it will be detected, but further signal processing will indicate its correct position. Of course, there are some losses in detection range in the main lobe related to the grating lobes. To reduce the impact of grating lobes, it is advised to combine output signals from different stations [1]. Different LOFAR stations have different rotations of tiles in the horizontal plane, which results in the grating lobes in different directions. In radio-astronomy, the problem of high grating lobes is solved by adding signals from different stations. As the grating lobes from different LOFAR stations are directed at different angles and do not overlap, the combination of beams from different LOFAR stations results in a reduction of the grating lobes originating from individual LOFAR stations Section 2.7.2 in [1]). On the other hand, in passive radars, localization of targets is mostly based not on the angular measurements but on the intersection of ellipsoids created by different transmitter–receiver pairs (see Section 4) [14,15,16]. The angular information helps in selecting the proper ellipsoids cross-section from among many others, but is not usually used directly in Kalman filtering. In such a selection, it is worth considering cross-sections both in the main lobe and also the highest side lobes. In the case when the extended Kalman filter is used with angular data input, the multi-hypothesis association will solve this problem, since only data from one beam (main or side lobes) will form a new track or fit to an existing one as an update. The hypothetical plots originating from the other lobes will be out of the association gate.
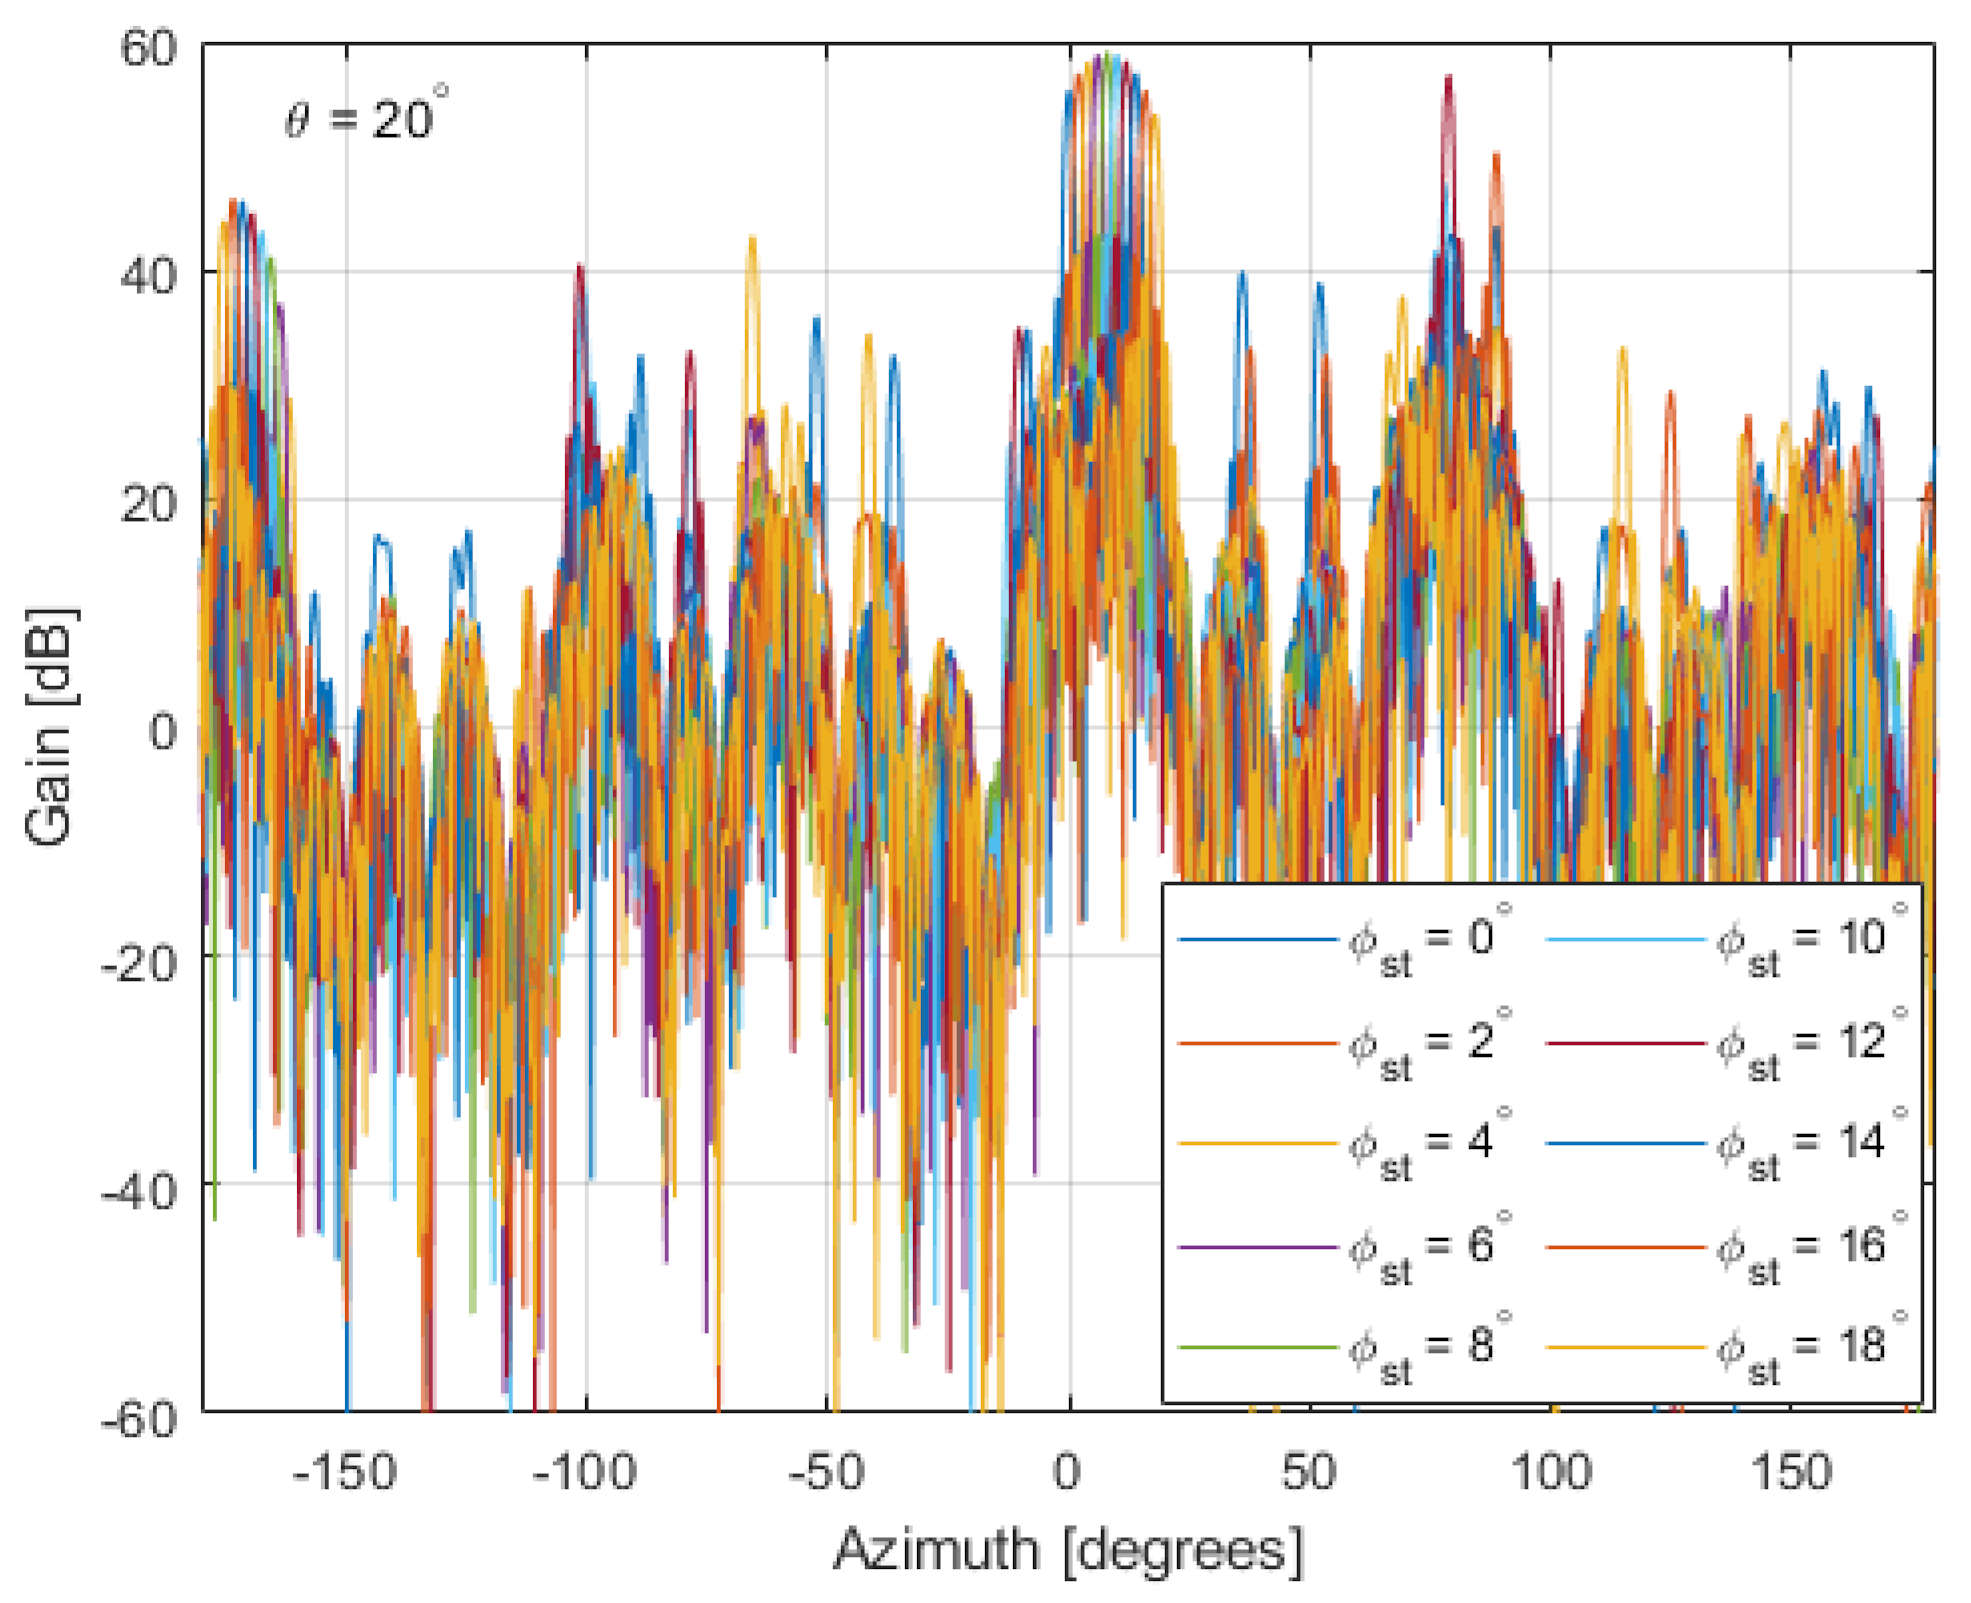
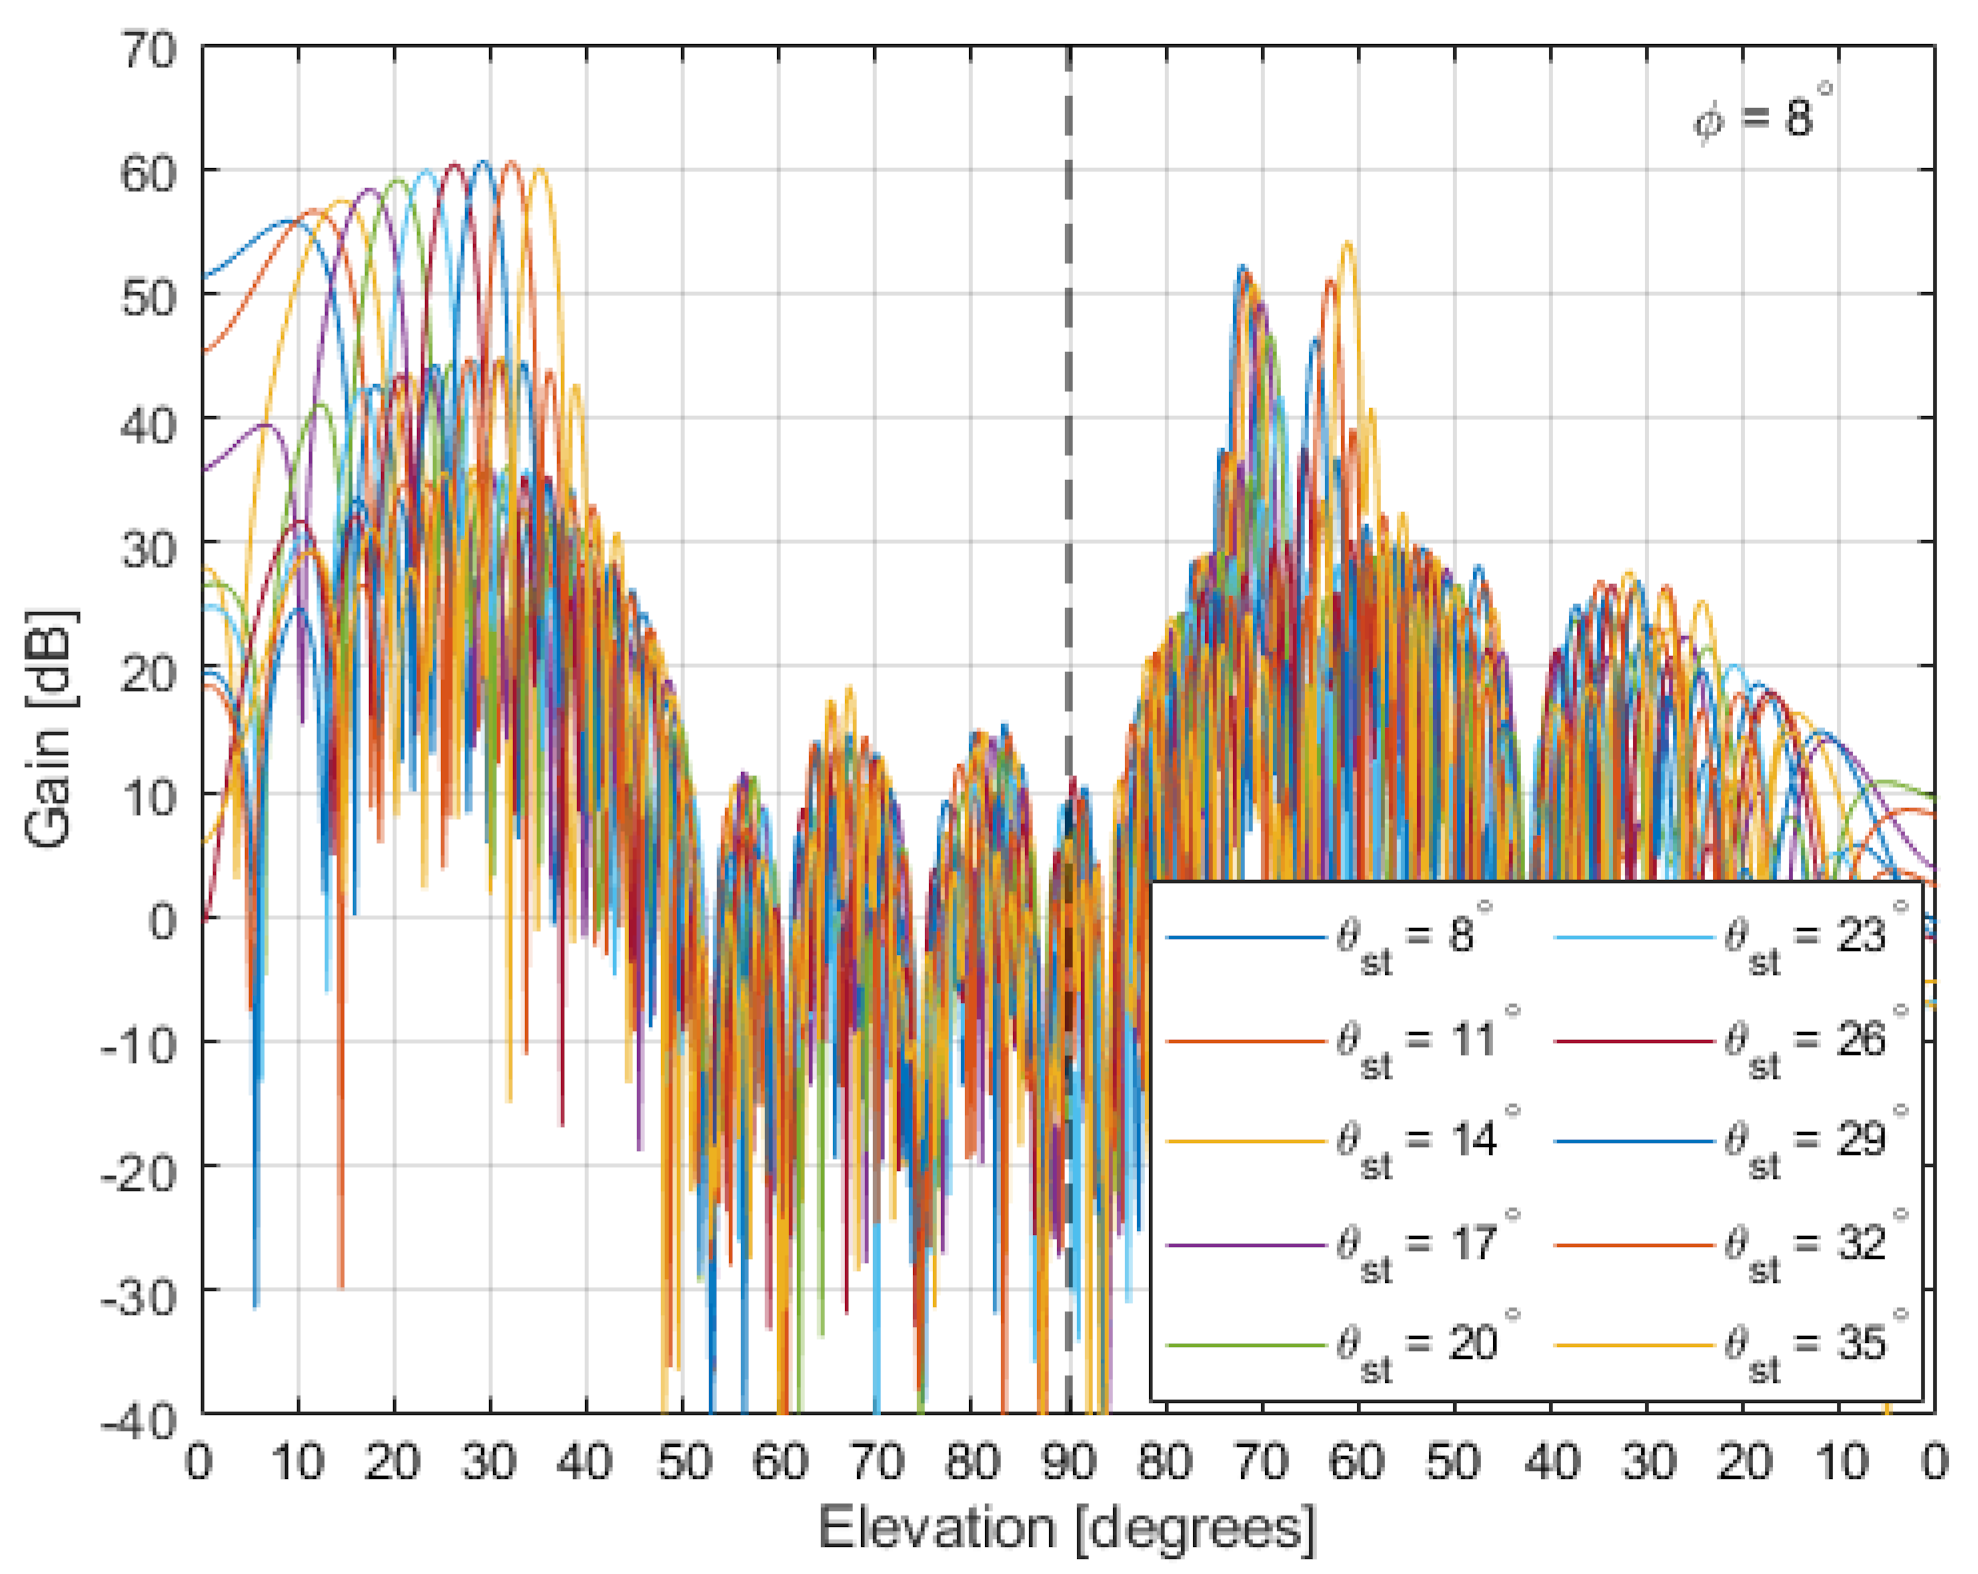
Considerations regarding the beam shape in a passive radiolocation system using an LOFAR station as a receiver lead to issues related to appropriate time-effective methods for searching the space of interest with many digital beams. Such methods are widely used in beam steering radars [17,18,19]. They consist in the creation of many multiple receiving beams for different azimuths and elevation angles in order to cover the area of interest. Since the LOFAR antenna beams at high-band are controlled partially by analogue phase shifters and partially via digital beam-forming, it is possible to create several beams forming an ellipsoidal shape in the azimuth-elevation plane. The signals from each beam should be processed in parallel, thereby increasing the observation angle. This idea is illustrated in Figure 16, which shows the azimuthal cuts of multi-beam patterns of the LOFAR station with the single set of analogue delay line settings and the center beam steered at the elevation and azimuth of the target SWR160, and (compare to Section 4). The same approach can be applied in elevation and exemplary elevation cuts of beam patterns, which are presented in Figure 17. The area of interest may be scanned for many sets of azimuth and elevation angles, and the density of scanned angles can be set and updated arbitrarily, depending on the requirements and the situation in the observed space. Of course, beams are traditionally separated in such manner that their characteristics intersect at −3 dB, which is associated with up to 3 dB detection losses. It is possible to have denser beam patterns with an intersection at −1 dB or even less, but the inclusion of each additional beam increases the computational requirements of the signal processing. In the presented case, it is possible to cover the angular area of deg.
One of the goals of this research was to verify if it is possible to detect space targets with such large antennas using the Passive Coherent Location concept and illumination from DAB or DVB-T transmitters. In the experience of the authors, airplanes can be detected by a simple 6 dB antenna at distances over 300 km, using 1 s integration time [20]. The LOFAR station has an antenna gain of over 36 dB, and it is possible to extend the integration time up to 100 s. The detection range can then be increased more than 10 times, up to 3000 km. Of course, signal processing needs to be more advanced when it is necessary to incorporate both the range and Doppler migration effects into the processing schema [21].
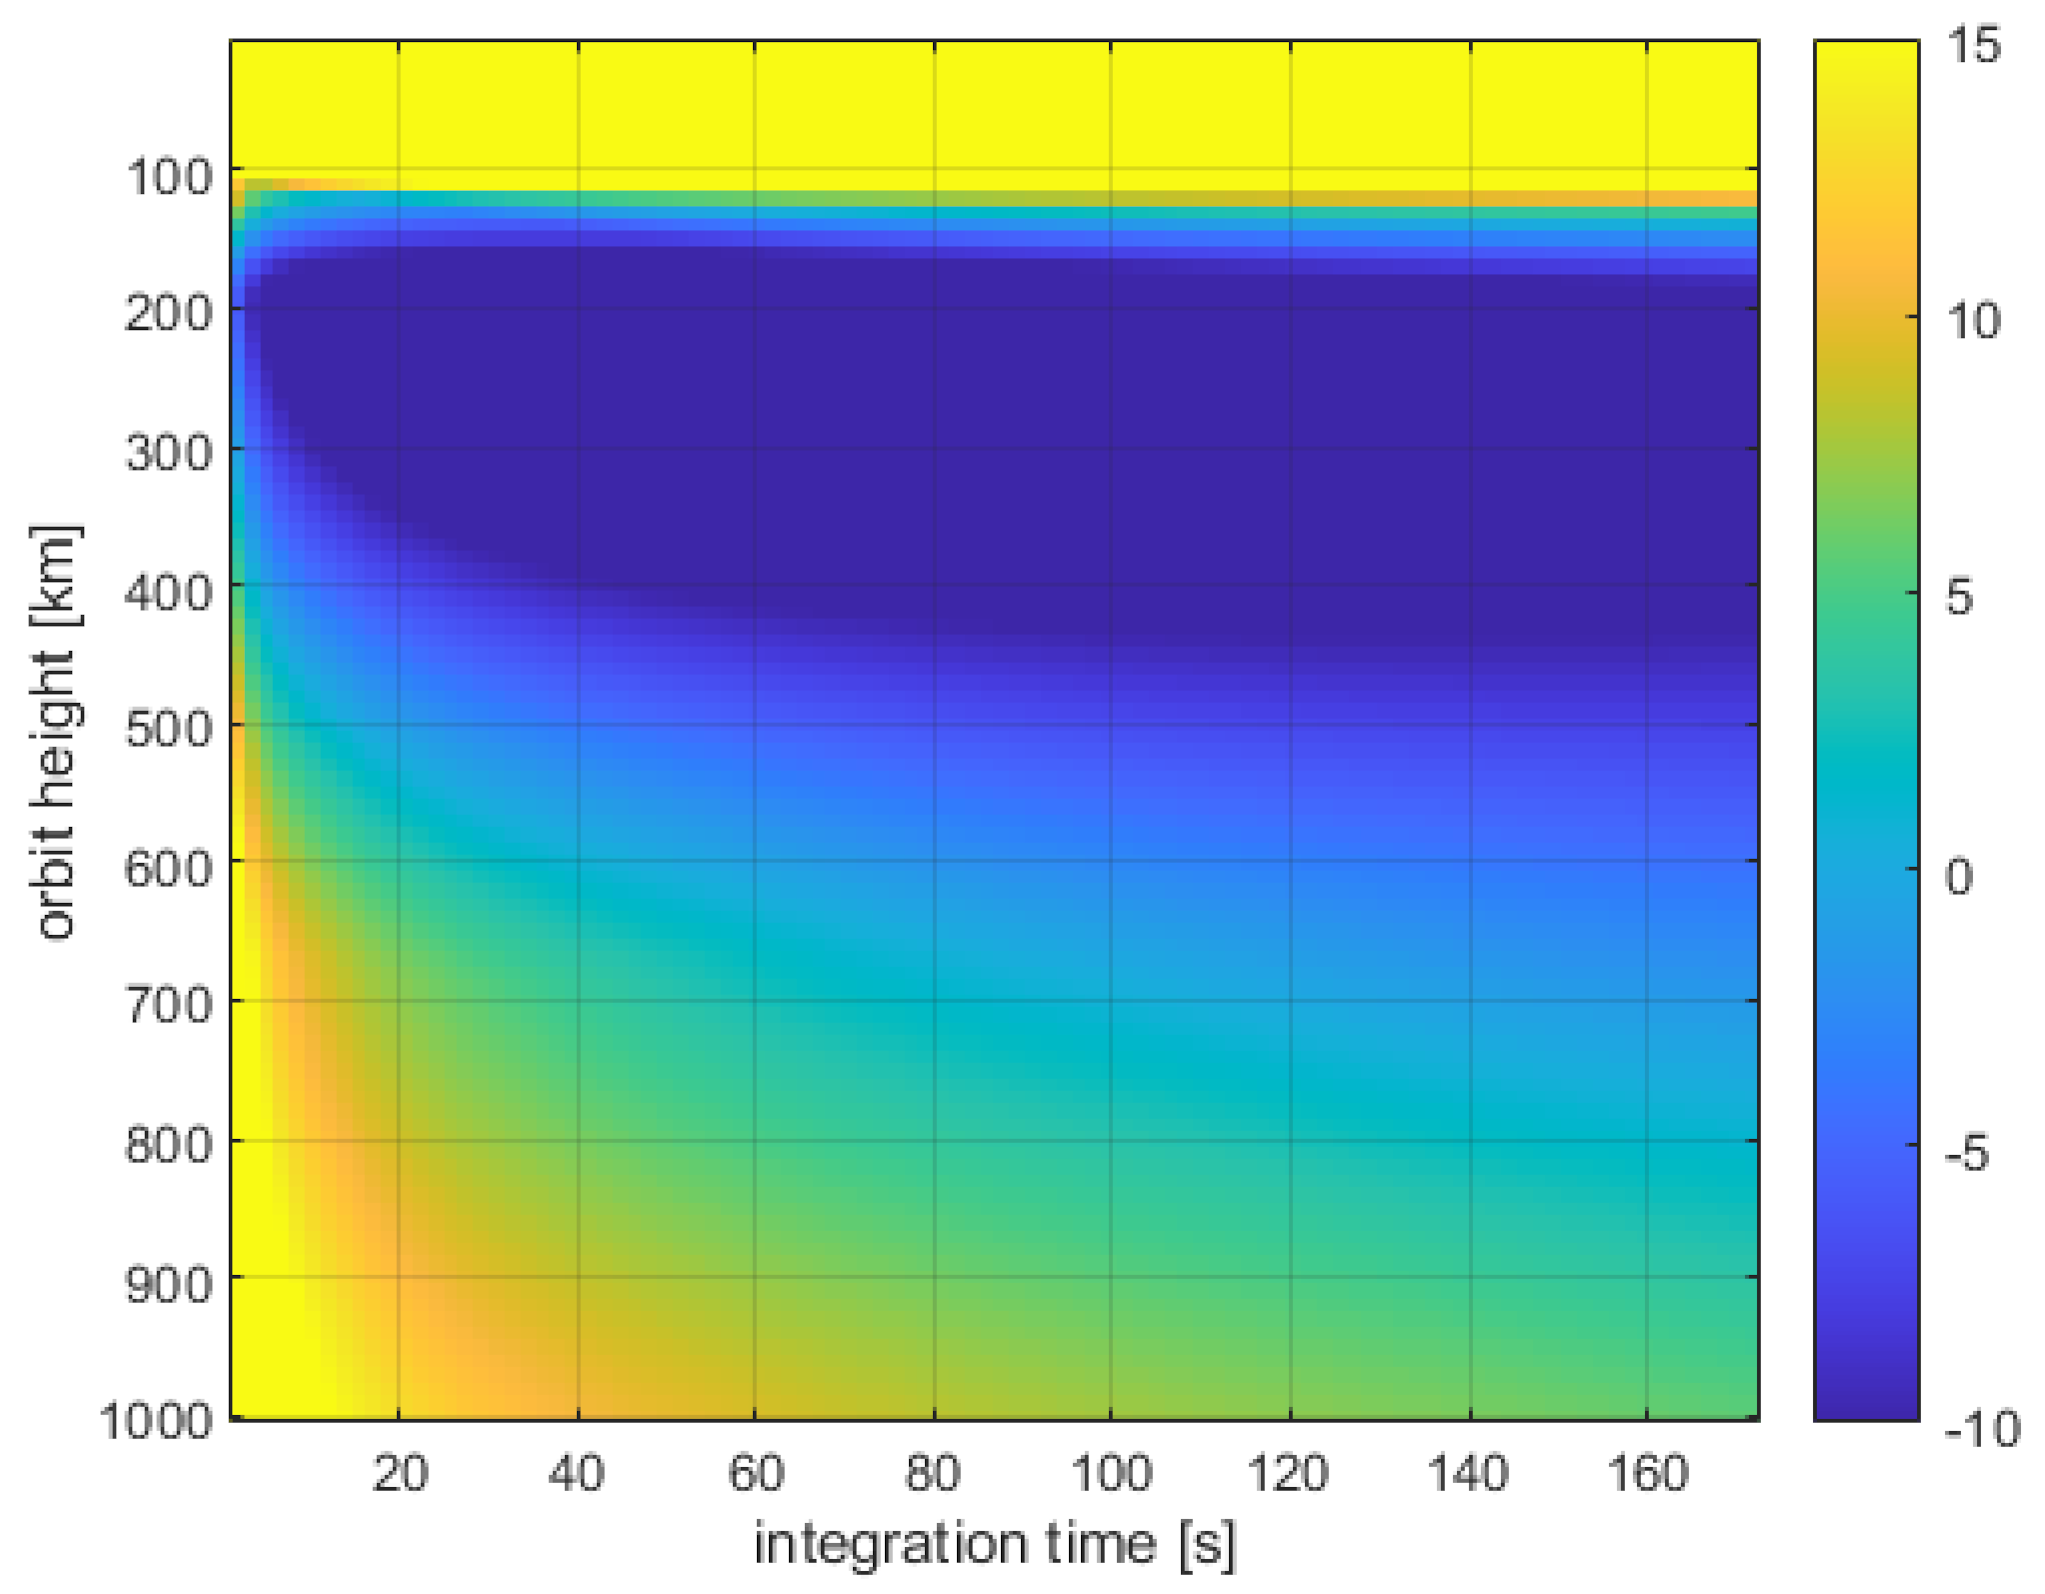
Since most transmitters have a relatively narrow vertical beam, it would be necessary to use distant transmitters. A possible detectable radar cross-section for the LOFAR-based passive radar using a DAB transmitter with 10 kW EIRP located at the distance of 1600 km from the LOFAR receiver is presented in Figure 18. The small satellites have radar cross-sections below −10 dBsm (0.1 ), medium-sized ones up to 0 dBsm (1 ), and large ones up to 10 dBsm (10 ). As one can notice, by using a 10 s integration time it would be possible to detect large and medium-sized satellites with orbits up to 600 km. Even better results can be obtained if the transmitter is more powerful or located at greater distances.
4. Experiment with Real Signals
4.1. Description of the Experiment
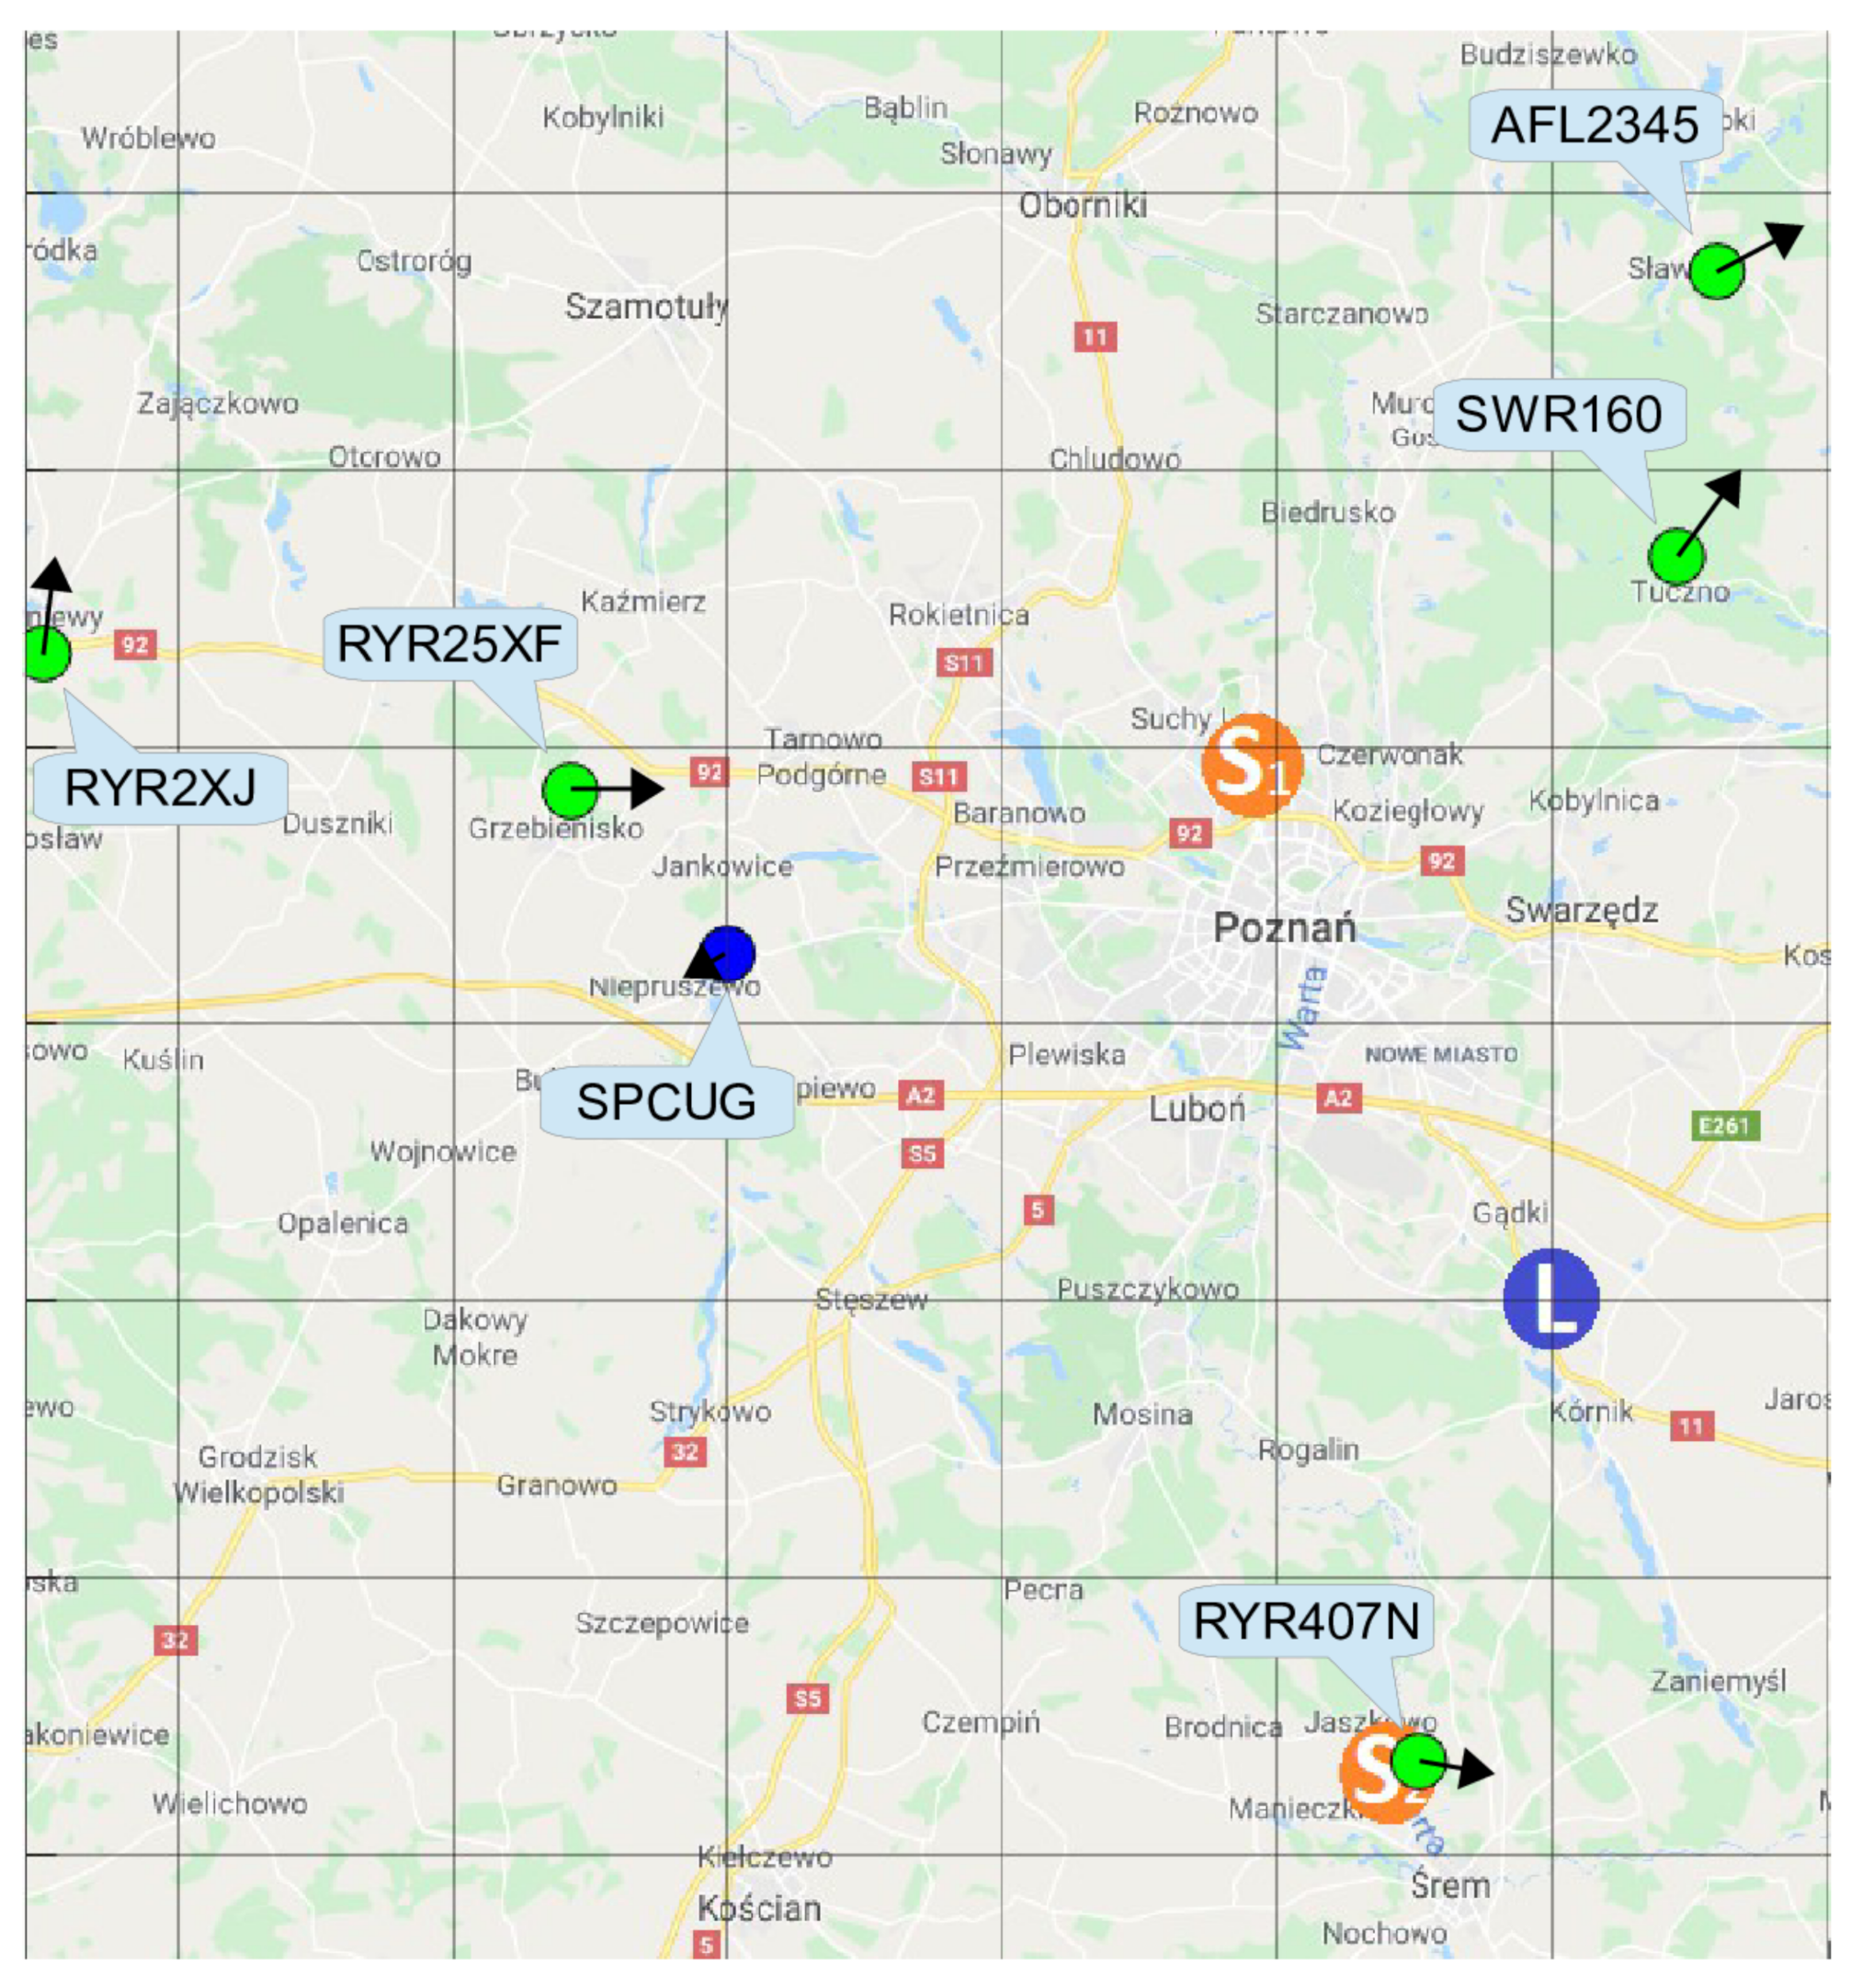
Field experiments aimed at a practical verification of the idea of employing an LOFAR station as the receiver in a passive radiolocation system were carried out on 16 April 2019 in Borowiec, Poland using the LOFAR station PL610. The results presented below concern the registration of signals performed at 14:37:07 (LMT). At that moment, airplanes around Borowiec were located, as shown in Figure 19. Figure 19 was created on the basis of data from the service flightradar24 [22]. The same registration was analyzed in [4] in the context of target parameter estimation without digital beamforming.
During the experiment, the analog phase shifters in most of the tiles were set in such a way as to form an analog beam in the direction , , except for tiles no. 0, 1, 45 and 46 (compare to Figure 3). In this direction, there is an air corridor above Kobylnica, where the occurrence of planes is frequent. Tile nos. 0 and 45 were steered at the DAB+ transmitter in Srem (marked as in Figure 19) to get the reference signal. Tiles no. 1 and 46 were steered at the DAB+ transmitter in Piatkowo (marked as in Figure 19) to get another reference signal. Since both the DAB+ transmitters work in the single frequency network (SFN), the signal from the transmitter in Srem was chosen as the reference signal because of its greater power.
In order to illustrate the potential resulting from the beamforming of a LOFAR station for target detection, the analysis of the results for planes SWR160 and RYR2XJ is focused on in this article. Due to the chosen desired direction , of the beamforming in most of the tiles, the echo from the plane SWR160 was enhanced both by analog and digital beamforming. In the case of the plane RYR2XJ, it was checked, whether with the appropriate digital beamforming, if it is possible to increase the detection range even when the analog beam is steered in a slightly different direction than the location of the target. Detailed results of the enhancement of echoes from other planes shown in Figure 19 are not considered in the paper because they are similar to results obtained for the planes SWR160 and RYR2XJ. In the case of the echo from the plane RYR2XJ, which was too far to analyze without digital beamforming [4], it was demonstrated that a bistatic range can be enhanced (with the beamforming) as to detect objects with a bistatic range over . The SWR160 plane was at about , and the plane RYR2XJ was at about , relative to the LOFAR station in Borowiec at that time.
To detect the planes, the cross-ambiguity functions (CAF) [7,8] with a CPI (coherent processing time [23]) equal to were computed. However, it should be stressed that before CAF computation, the direct signal transmitted by the illuminator of opportunity, which is also present in the surveillance signal, should be removed. Typically in passive radiolocation, the power of the direct component originating from leakage via the side lobes of the surveillance beam significantly exceeds the power of the echo components [23]). Consequently, echoes of targets are not visible in CAF plots. This type of interference is known as a direct-path interference (DPI). Another reason that prevents the acquisition of clear target echoes stems from the clutter reflection from stationary or slow-moving clutter sources. The clutter components can be treated as delayed copies of the reference (direct-path) signal either with no Doppler shift, or with a small Doppler shift [23]). The power of the clutter components is also usually greater than the power of the target echoes, which consequently makes them invisible in CAF plots. Both the direct-path and clutter components can be removed using adaptive methods such as adaptive filtering [24,25,26], or the CLEAN algorithm [27,28]. In the experiment presented here, the adaptive methods based on a block lattice filter were used, both for cases without Doppler and with Doppler-spread clutter removal [8].
The computed CAF values were then processed by the CFAR algorithm, and after thresholding the detections of the targets were obtained [8]. The applied CFAR algorithm compares the level of every cell to its averaged neighborhood. That neighborhood is assumed to be the estimated power of noise . If the level of a particular cell is higher than the threshold T of its averaged neighborhood , then it is considered to be the detected echo of a target [8]. In this paper, was assumed.
The correction of range cell migration with time-scaling based on linear approximation [29] was also used with different time-scaling factors for different velocities [23]. This was due to the fact that for time integration , most objects were fast enough to migrate between more than one cell. In other words, the condition [23]
where c is the speed of light, is the bandwidth of the signal in a baseband, and is the bistatic velocity of an object, is not fulfilled for bistatic velocities higher than . In the experiment described in this paper, there were objects with a bistatic velocity over , so without correction their power would spread across a few cells and their SNR would decrease [21].
4.2. Results of the Experiment
In the first phase of the studies, the cross-ambiguity function of the surveillance signal (after the adaptive removal of direct-path and clutter components) received by one tile (no. 2) with the reference signal received by tile no. 0 was calculated. After this, the CFAR processing described previously was conducted, and the results are presented in the form of a so-called range-velocity map (both range and velocity are in the bistatic sense [7,8]) in Figure 20.
The values of CAF in Figure 20 refer to the signal-to-noise-ratio (SNR) of the echoes. In contrast to the results presented in [4], for the higher CFAR threshold T the echoes from planes RYR25XF and RYR407N were not detected. The strongest echo of Srem’s DAB+ signal from the SWR160 plane was detected (marked as SWR160,1). The echo from the SWR160 plane of the same DAB+ signal transmitted from Piatkowo at the same frequency can also be seen in the cross-ambiguity function in Figure 20 (marked as SWR160,2). Therefore, the echo from Piatkowo was correlated with the reference from Srem, so its actual bistatic range is about smaller than in Figure 20 due to the difference in distance between LOFAR and the particular transmitters [4]. In Figure 20, one can also see another small peak at a bistatic range of about 80 km. This corresponds to another AFL2345 plane that was flying northeast of the SWR160 aircraft at the time of registration (compare to Figure 19).
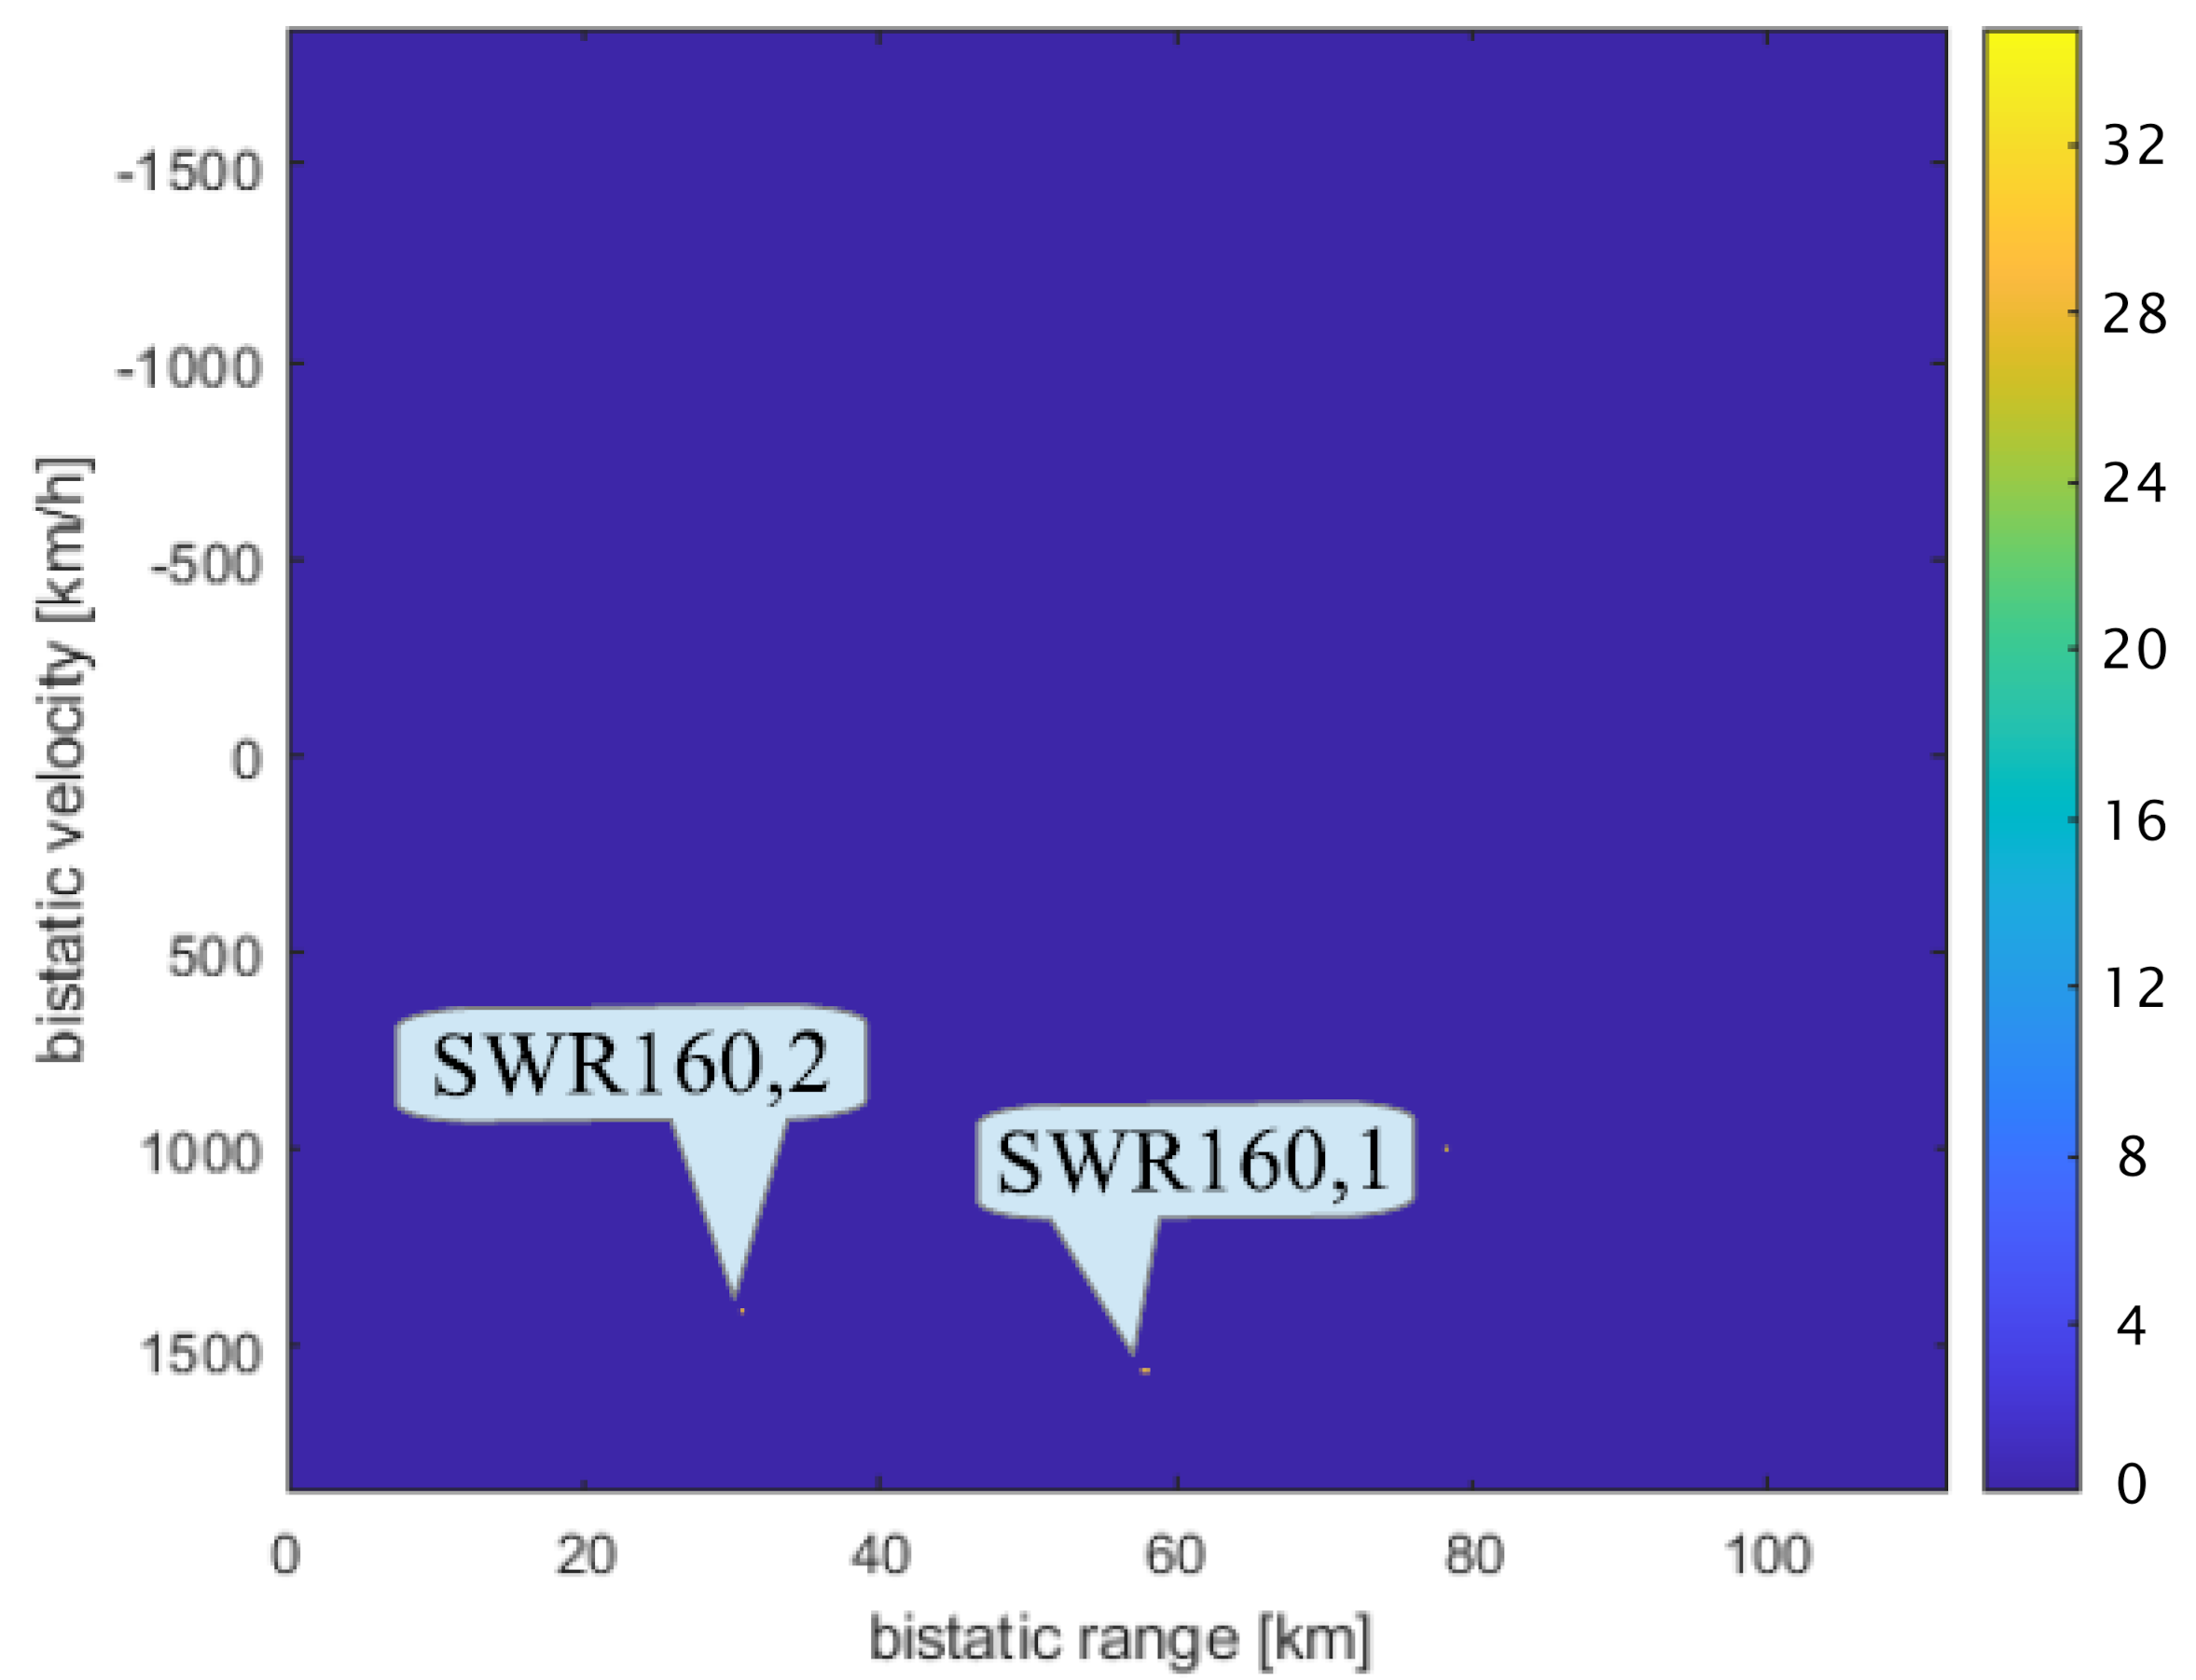
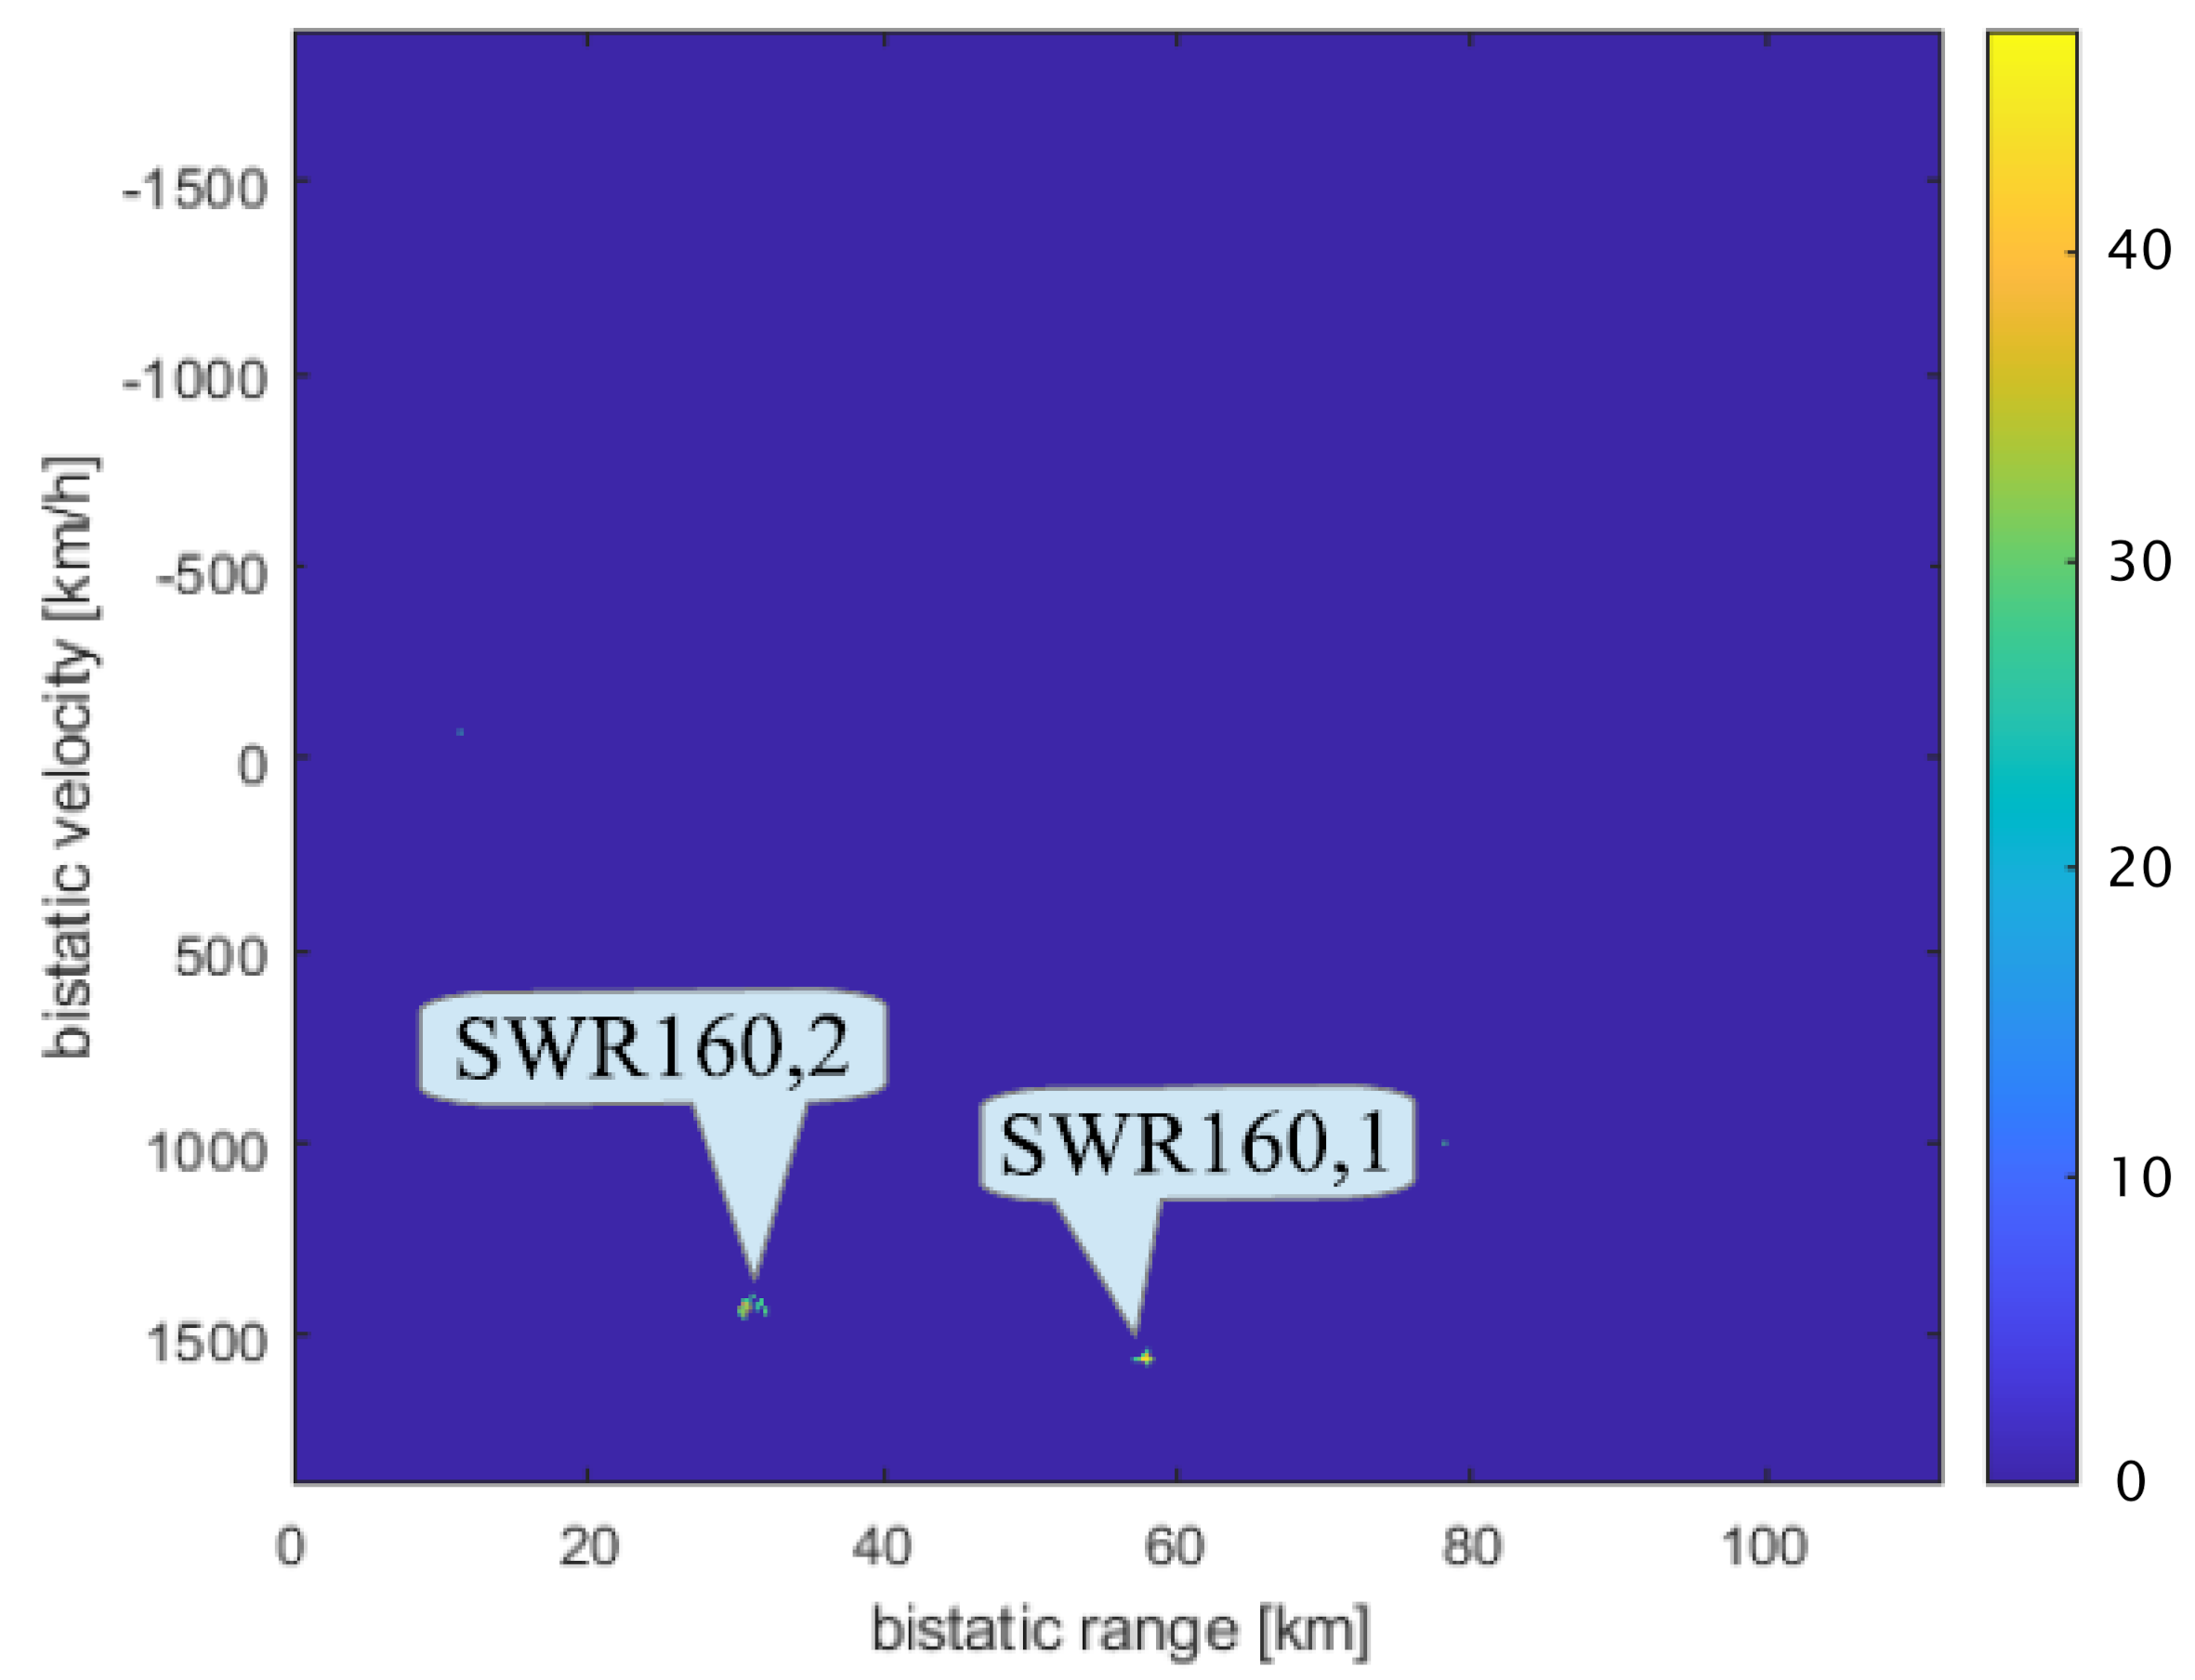
In the next stage of the studies, the signals registered by 64 tiles were beamformed, and the cross-ambiguity function was calculated on the basis of the beamformed surveillance signal. The CAF after the CFAR is presented in Figure 21. The beam was steered using the Phase-Shift algorithm described in Section 3 in the direction of the SWR160 plane.
The exact value of the desirable direction was , . More powerful echoes of DAB+ signals reflected from the SWR160 plane can be seen in Figure 21. In the context of the SNR, the ’s echo from Srem increased by over , and the ’s echo from Piatkowo increased by over in comparison to the echoes registered by one tile. The results of the measurements of the bistatic parameters (range and velocity ) of the SWR160 plane are presented in Table 1. For comparison, the table also shows the bistatic range and velocity of the SWR160 plane calculated for the same moment on the basis of data from flightradar24 [22].
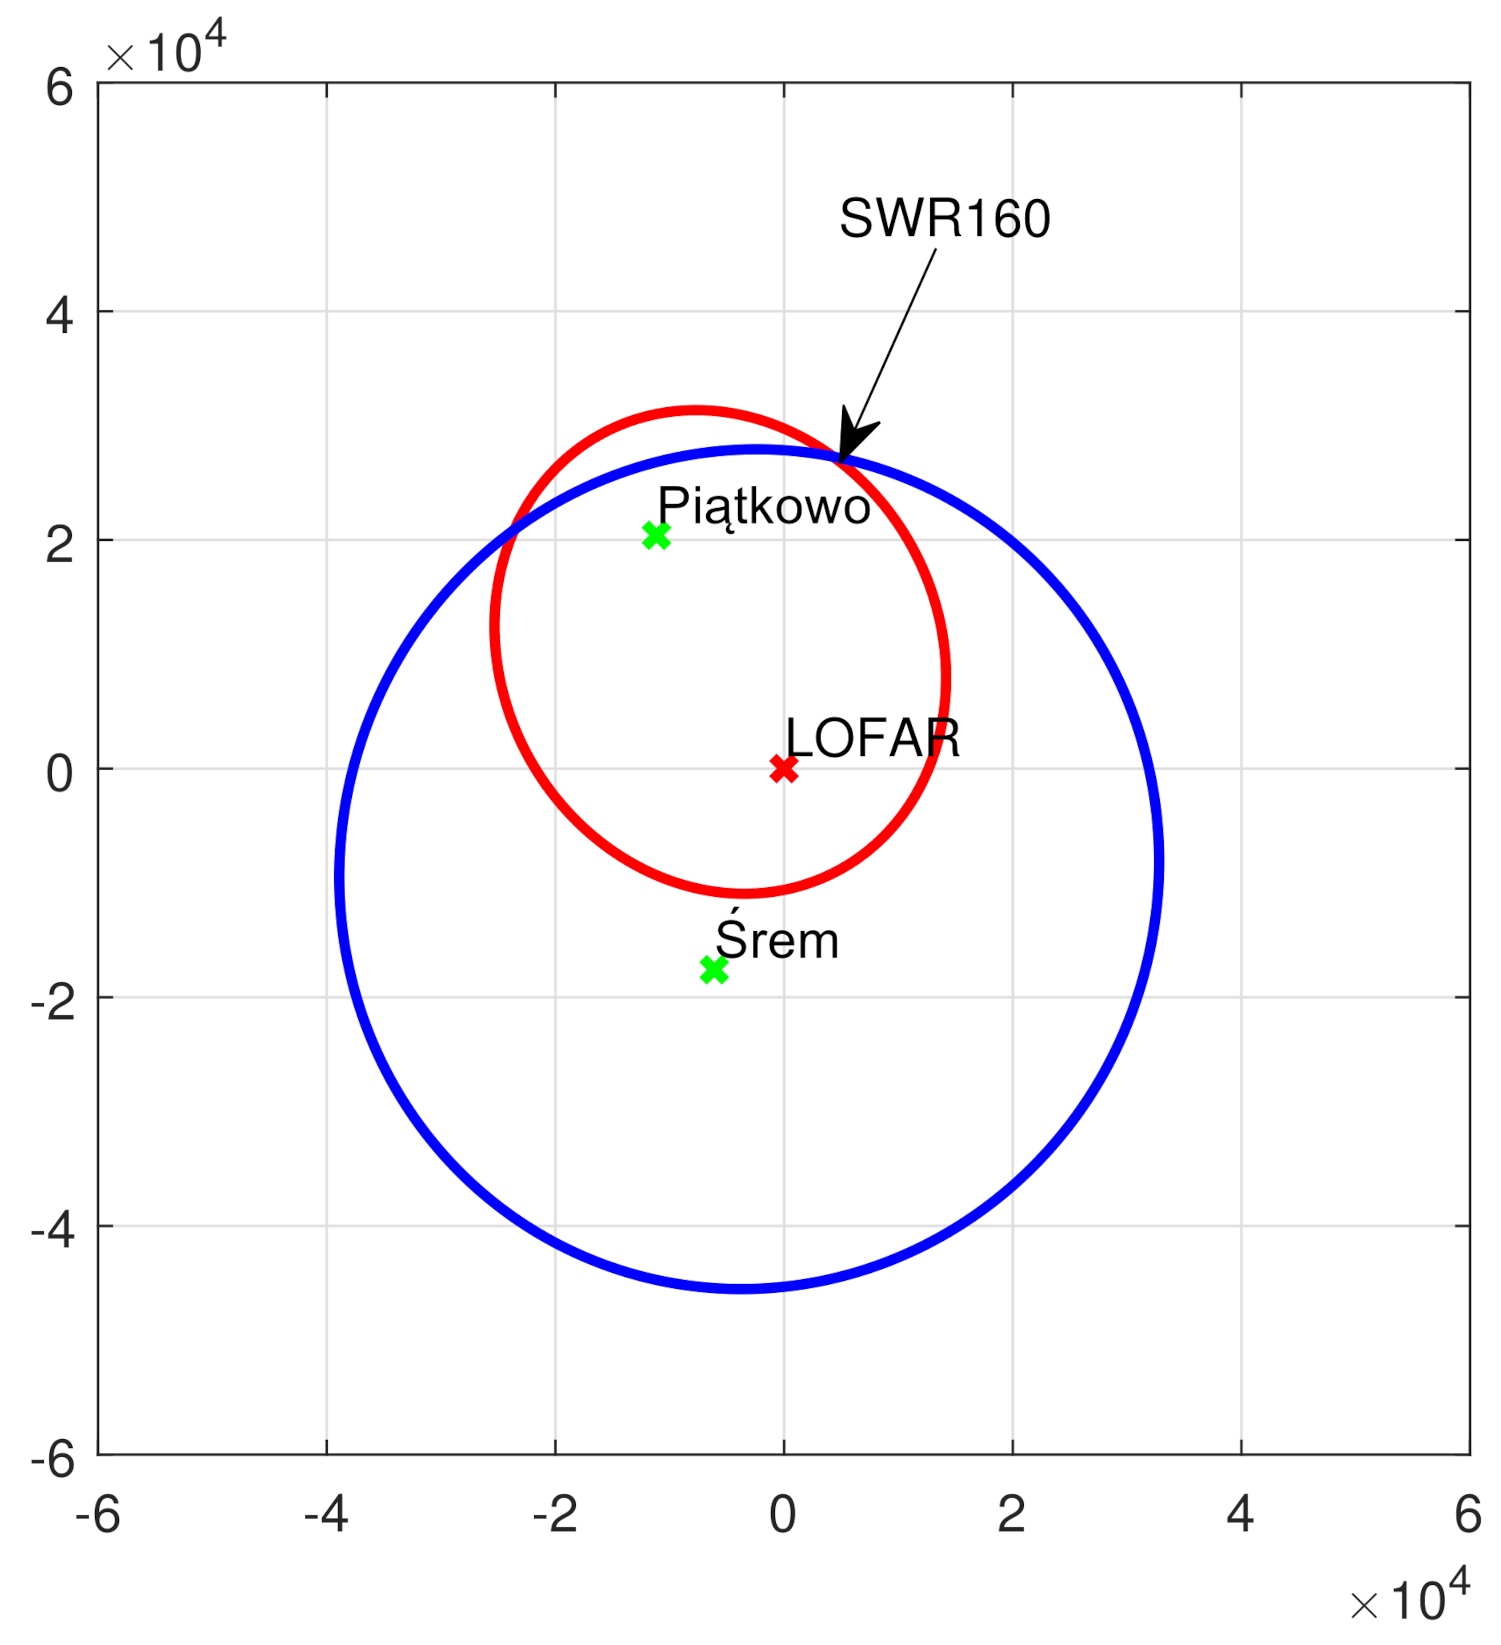
In the case of the bistatic radar, the bistatic range defines the bistatic ellipsoid on which the target can be located. The foci of the ellipsoid are in the positions of the transmitter and the receiver. The intersection of three ellipsoids, constructed on the basis of at least three transmitter–receiver pairs, determines the location of the target [7,8]. In this case, only two transmitter–receiver pairs were used. Therefore, the estimation of the target distance and azimuth was performed using the information about the target altitude from flightradar24, and the problem was reduced to a two-dimensional case, i.e., to find the intersection of two ellipses.
In Figure 22, two ellipses computed on the basis of the SWR160 plane bistatic ranges from two transmitter stations (Srem—blue, and Piatkowo—red) are shown (in meters).
One ellipse is a set of points that have the same bistatic range from the LOFAR station and the transmitter [4]. The intersection point of two ellipses, marked with an arrow in Figure 22, is the estimated point of the SWR160 plane’s location in two-dimensional space. The position of the LOFAR station (receiver) is in the center of the coordinate system. The estimated parameters of the unambiguous SWR160 plane’s location (range from the LOFAR station and azimuth angle relative to that station ) based on the measurements are presented in Table 2, where they are compared with the real parameters and computed on the basis of the data from flightradar24. The results shown in Table 1 and Table 2 confirm that the detected echoes refer to the SWR160 plane, and that the estimation of its parameters is relatively accurate.
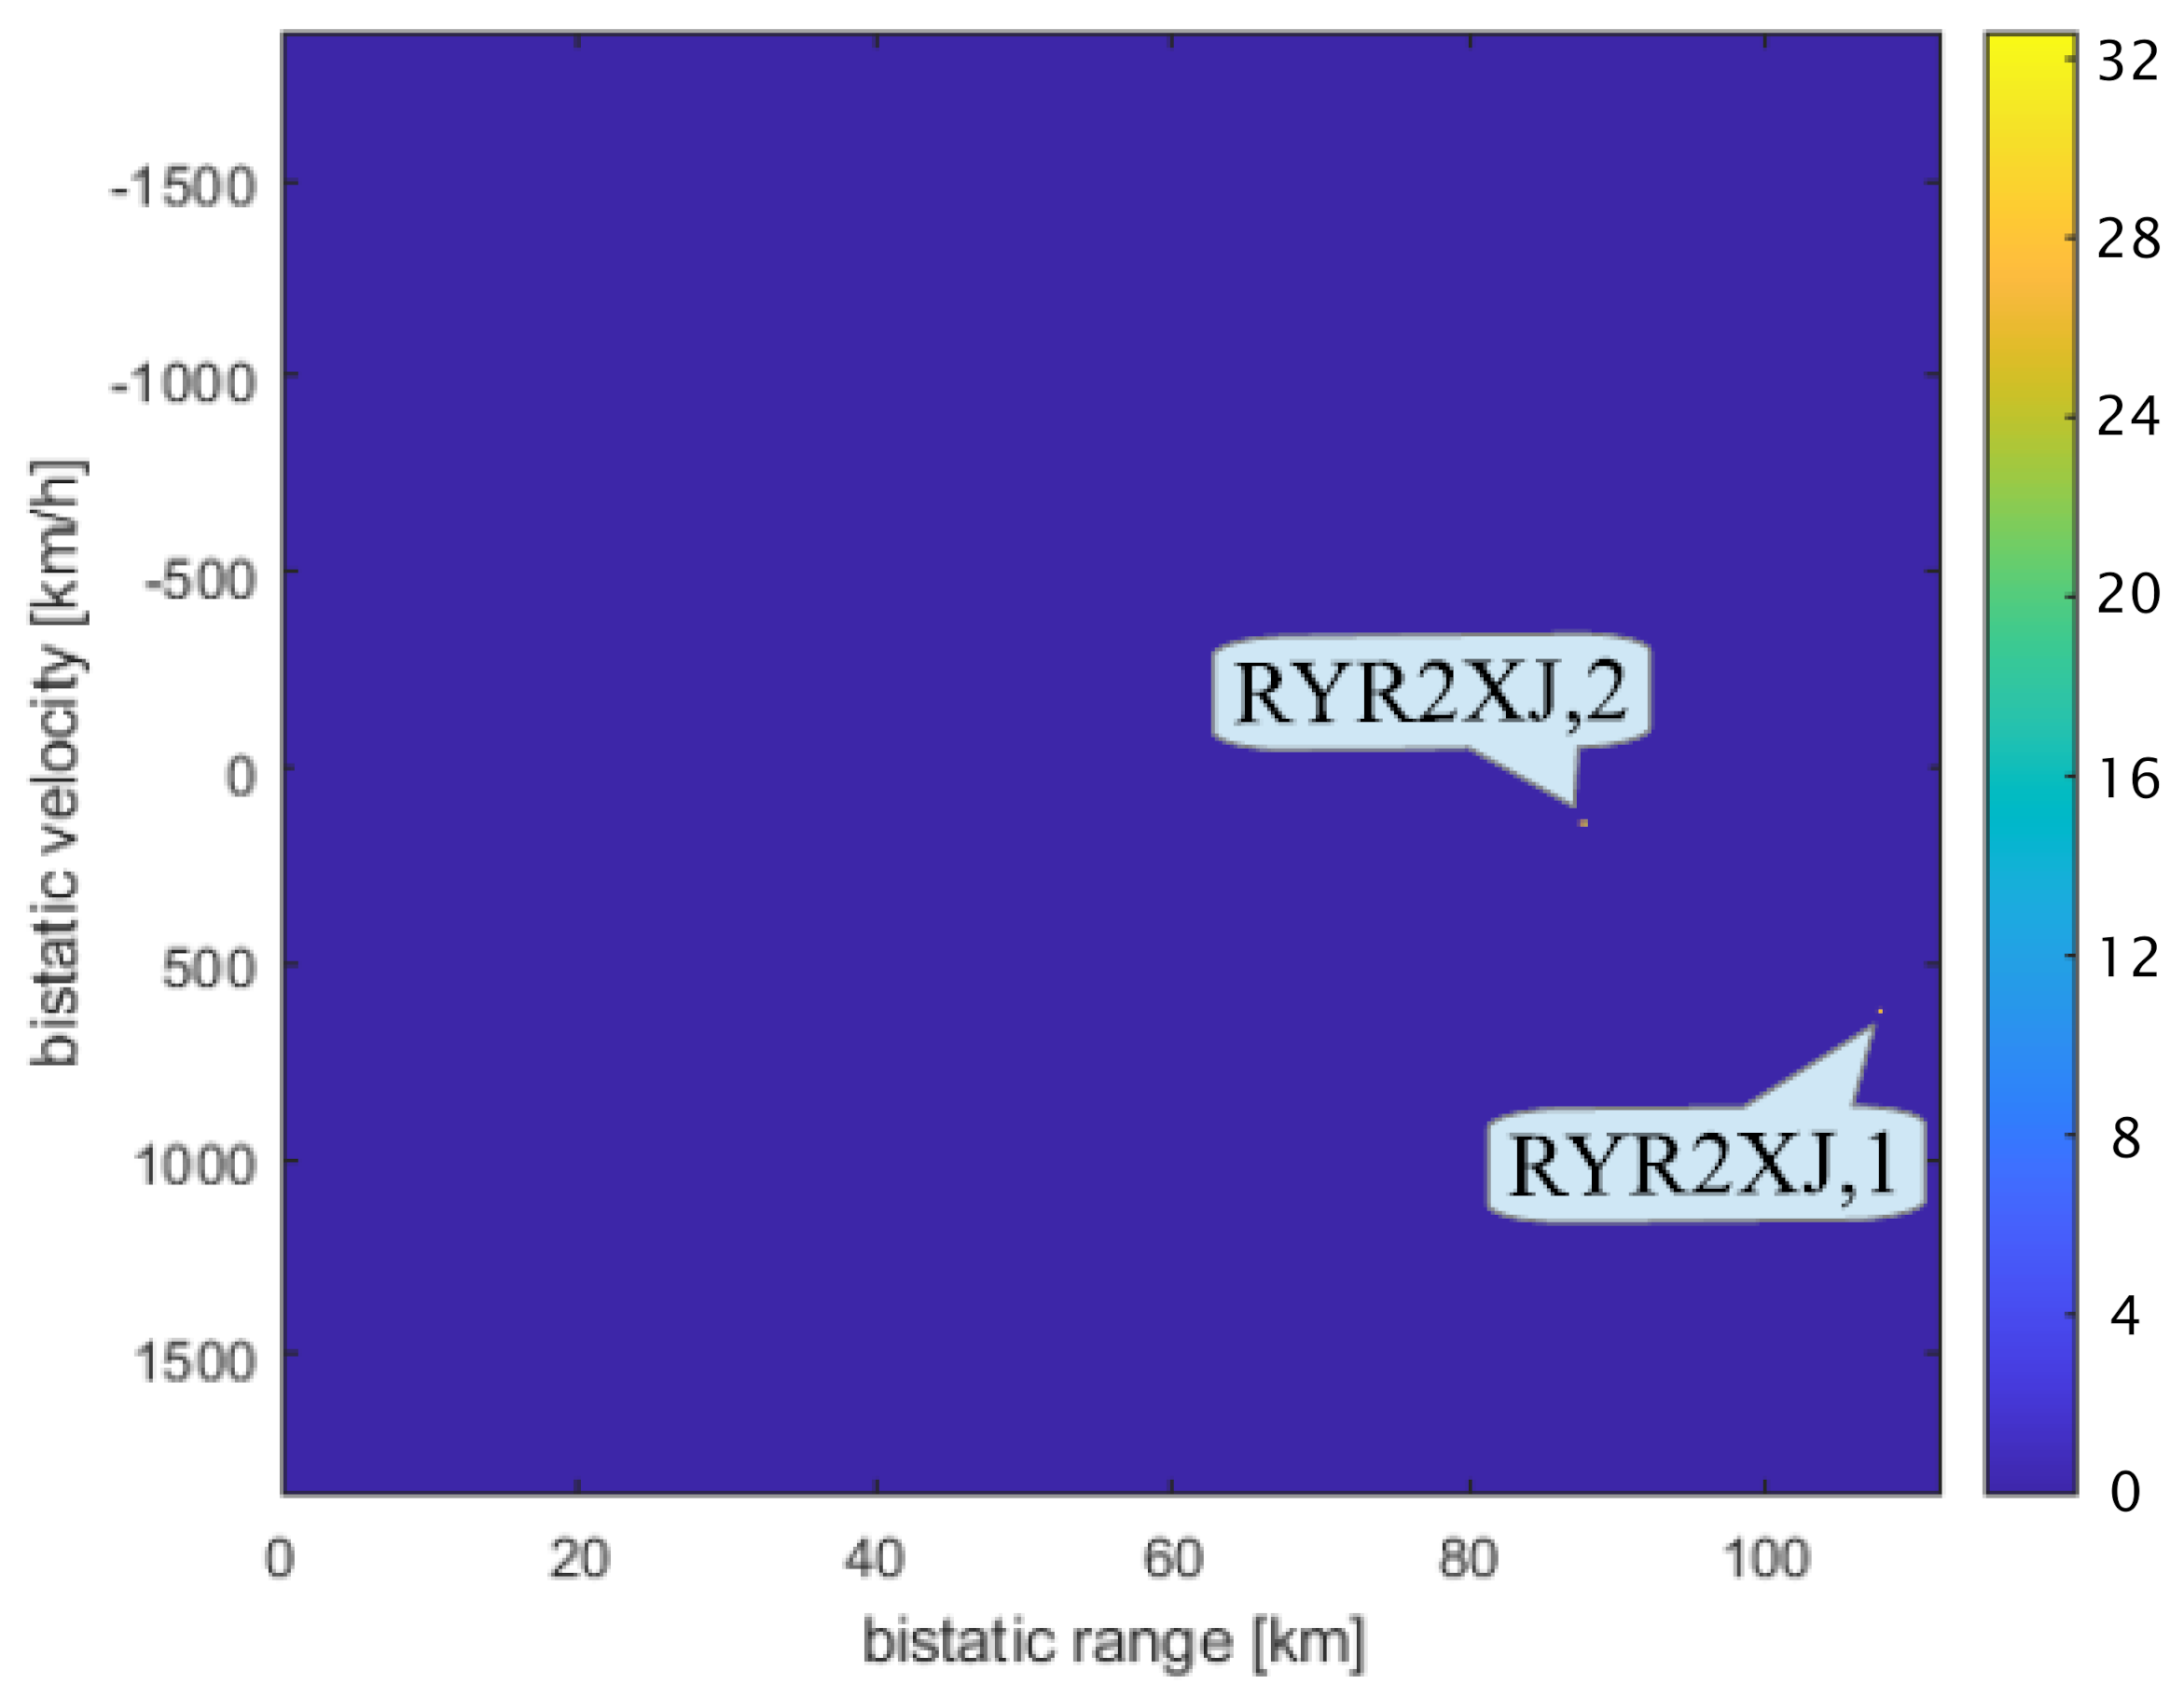
The next set of results is related to the steering of the beam in the direction where the more distant plane can be expected, i.e., approximately towards the RYR2XJ plane. In this case, the detection of echoes without beamforming is impossible and only proper beam directing enables the detection. Similarly to what was done previously, the cross-ambiguity function after the CFAR obtained for beamforming, aimed in this case at the RYR2XJ plane, is shown in Figure 23. The exact value of the desirable direction was , . As shown in Figure 23, although the echoes from the RYR2XJ plane were not detected even with a lower CFAR threshold T in [4], both echoes from Srem (marked as RYR2XJ,1) and Piatkowo (marked as RYR2XJ,2) could be detected using the Phase-Shift algorithm.
In Table 3, analogous results to those in Table 1 for the RYR2XJ plane are presented. Furthermore, in the cross-ambiguity function presented in Figure 23 there are no other detections except the RYR2XJ due to the suppression of other echoes from undesirable directions and a higher value of the CFAR threshold T.
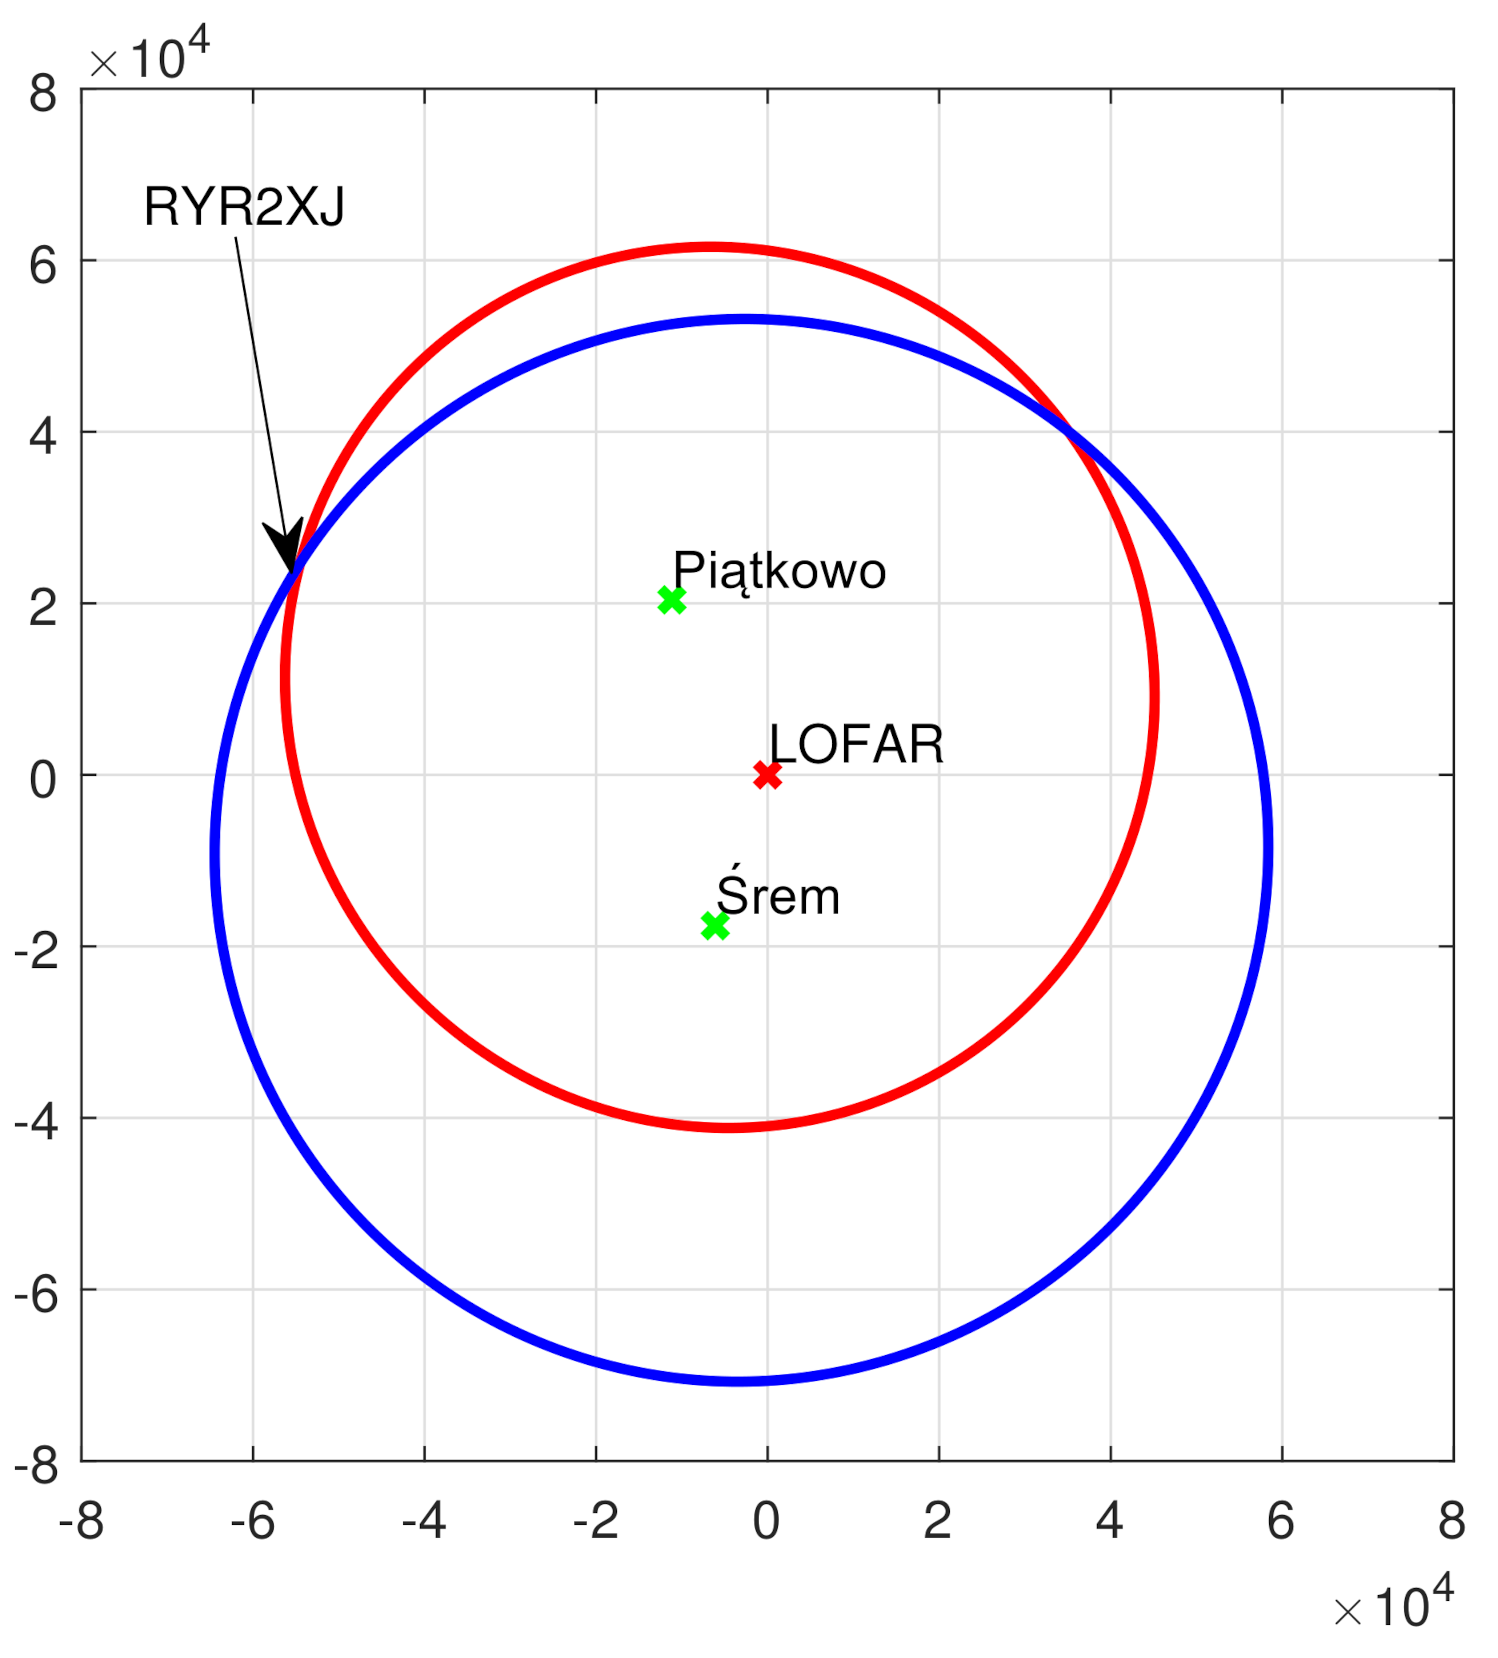
The ellipses computed in this case on the basis of the RYR2XJ plane’s bistatic ranges from two transmitter–receiver pairs are shown (in meters) in Figure 24, and the corresponding results of the RYR2XJ plane’s distance and azimuth estimation are presented in Table 2. Similarly to the case of the SWR160 plane, both Table 3 and Table 4 confirm that the results of passive radiolocation are very close to the results computed on the basis of the flightradar24 data.
5. Discussion and Conclusions
The results of the preliminary experiments confirmed that application of the beamforming algorithm can significantly increase the capabilities of the passive radiolocation system based on a LOFAR station as the receiver. The comparison of the estimated target parameters with results calculated on the basis of data delivered by the application flightradar24 shows the relatively high accuracy of the estimation of target parameters, i.e., range, velocity, and azimuth, although the methods used for their calculation were basic. In the future, the employment of more sophisticated methods is planned. It is worth noting that the parameters calculated on the basis of flightradar24 data are generally not considered to be very accurate. This is mainly due to the fact that the files with flightradar24 data are provided at relatively long intervals and must be interpolated at the given moment when the measurement by means of a LOFAR station is carried out. Moreover, the accuracy of the transponders which send the data regarding flights is also limited. Therefore, some differences between target parameters determined by passive radiolocation and those calculated from flightradar24 data were observed. The results of the experiment regarding the enhancement of the echoes from the RYR2XJ plane confirm that the digital beamforming applied to the signals received by LOFAR tiles may increase the target detection range, and it is possible to detect an object that would not be detected without the beamforming. Moreover, the application of the digital beamforming algorithm enables an increase of the CFAR threshold, which results in the decrease of the false alarm probability.
It should be emphasized that one of the key techniques, without which it would be impossible to obtain correct results, was the adaptive cancellation of the direct signal emitted by the transmitter from the surveillance signal. A suitable application of this method is crucial in passive radiolocation systems. On the other hand, the proper removal of the ground clutter and Doppler-spread clutter is very important for the results achieved. Both techniques allow one to solve the so-called masking effects and enhance the echo signal-to-noise ratio in cross-ambiguity functions (range-velocity maps) [25,30].
To the best of the authors’ knowledge, the presented results of studies on the beamforming of a LOFAR station for the passive radiolocation of aerial objects are the first to be achieved in this field. The results of the conducted experiments, a selected part of which were presented in the paper, allow one to conclude that the appropriate beamforming can enable the development of a passive radiolocation system based on LOFAR infrastructure. Such a system could detect both aerial targets, such as airplanes, and space objects at low orbits. In the case of space objects at orbital altitudes, the use of illuminators of opportunity very distant from the LOFAR station is required. The commercial illuminators usually have a narrow beam in the vertical plane and do not emit high power towards satellites. Elevation beamwidth is usually within a few degrees, so only distant transmitters have satellites in their main (vertical) lobe. The orbits of 400–1000 km are illuminated by transmitters at distances of 2500–3500 km. On the other hand, for the aerial objects, the illuminators located near the LOFAR station should be used.
In considering the use of the LOFAR stations to detect or track space objects in low orbits, such as satellites or space debris, it will be necessary to significantly increase the integration time to extend the radar detection range due to the necessity for very distant illuminators of opportunity. A detailed theoretical analysis shows that the range of 10–100 s of integration is sufficient for the detection of medium-sized or large satellites at orbits up to 1000 km. Such long integration times would require tracking of the satellite by a single beam, or the use of multi-beam processing. The objects in space could be detected mostly over the nadir to obtain the shortest possible distance from the satellite to the receiver. In such cases, the antenna gain is the highest and the beam-width is narrower.
The experiments carried out so far using the infrastructure of the LOFAR station as part of a passive radiolocation system allow the formulation of further research goals, the implementation of which may lead to the construction of a fully functional passive radiolocation system. In particular, the conducted experiments were based on broadband signals recorded by the LOFAR station in the so-called TBB record mode [5]. During the standard operation of the LOFAR station, the signals are recorded in relatively narrow 195.3125 kHz subbands. The subbands covering the band of the interesting signal transmitted by an illuminator of opportunity (e.g., DAB+) can be used for the signal reconstruction using polyphase filters. This mode of LOFAR operation can be used in the future for developing a potential real-time radiolocation system, e.g., working in parallel with astronomical observations.
Another area of research will be devoted to the reduction of the impact of grating lobes on passive radar signal processing. The deliberate use of grating lobes of beam patterns, both the single tile and the entire LOFAR station, should also be investigated. The commencement of work on the possibilities of fusing information from multiple LOFAR stations is also being considered, which could increase the passive radiolocation system’s capabilities, especially for the radiolocation of space objects. Individual LOFAR stations are connected by high-speed fiber optic links, which can be exploited to send the radiolocation data.
Author Contributions
Conceptualization, K.J. and K.K.; methodology, A.D., K.J. and K.K.; software, A.D., J.K., K.J. and M.P.; validation, A.D., K.J., J.K. and M.P.; formal analysis, A.D., K.J. and J.K.; investigation, A.D., K.J., J.K. and M.P.; resources, M.P.; data curation, A.D., J.K., M.P. and K.J.; writing—original draft preparation, A.D.; writing—review and editing, K.J., A.D., J.K., K.K. and M.P.; visualization, A.D. and M.P.; supervision, K.J. and K.K.; project administration, K.J.; funding acquisition, K.J. and M.P. All authors read and agreed to the published version of the manuscript.
Funding
This work was partially funded by the Ministry of Science and Higher Education (MSHE), Poland, in the frame of the 6/E-73/SPUB/SP/2019.
Institutional Review Board Statement
Not applicable.
Informed Consent Statement
Not applicable.
Data Availability Statement
Data available on request.
Acknowledgments
We thank the Ministry of Science and Higher Education (MSHE), Poland for granting funds for the Polish contribution to the International LOFAR Telescope (MSHE decision no. DIR/WK/2016/2017/05-1).
Conflicts of Interest
The authors declare no conflict of interest.
Abbreviations
The following abbreviations are used in this manuscript:
| LOFAR | Low-Frequency Array for radio astronomy |
| PCL | Passive coherent location |
| ASTRON | the Netherlands Institute for Radio Astronomy |
| LBA | Low Band Antennas |
| HBA | High Band Antennas |
| DAB | Digital Audio Broadcasting |
| VHF | Very high frequency |
| DVB-T | Digital Video Broadcasting–Terrestrial |
| FM | Frequency modulation |
| SNR | Signal-to-Noise Ratio |
| CFAR | Constant False Alarm Rate |
| URA | Uniform Rectangular Array |
| LMT | Local Mean Time |
| SFN | Single Frequency Network |
| CAF | Cross-Ambiguity Function |
| CPI | Coherent Processing Time |
| TBB | Transient Buffer Board |
References
- Heald, G.; McKean, J.; Pizzo, R. Low Frequency Radio Astronomy and the LOFAR Observatory, Lectures from the Third LOFAR Data Processing School Editors; Springer: Cham, Switzerland, 2018. [Google Scholar]
- Dąbrowski, B.P.; Krankowski, A.; Błaszkiewicz, L.; Rothkaehl, H. Prospects for solar and space weather research with polish part of the LOFAR telescope. Acta Geophys. 2016, 64, 825–840. [Google Scholar] [CrossRef]
- Droszcz, A.; Kłos, J.; Jędrzejewski, K.; Kulpa, K.; Pożoga, M. Beamforming of LOFAR radio telescope antennas used as sensors in passive radiolocation system. In Proceedings of the 2020 21st International Radar Symposium (IRS), Warsaw, Poland, 5–8 October 2020; IEEE: New York, NY, USA, 2020; pp. 323–327. [Google Scholar]
- Kłos, J.; Droszcz, A.; Jędrzejewski, K.; Kulpa, K.; Pożoga, M. On the possibility of using LOFAR radio telescope for passive radiolocation. In Proceedings of the 2020 21st International Radar Symposium (IRS), Warsaw, Poland, 5–8 October 2020; IEEE: New York, NY, USA, 2020; pp. 73–76. [Google Scholar]
- Virtanen, I.I. Station Data Cookbook. Available online: https://lofar.ie/wp-content/uploads/2018/03/station_data_cookbook_v1.2.pdf (accessed on 25 October 2020).
- Griffiths, H. Bistatic and Multistatic Radar; IEE Military Radar Seminar: Shrivenham, UK, 2004. [Google Scholar]
- Griffiths, H.; Baker, C. An Introduction to Passive Radar; Artech House radar library, Artech House: Norwood, MA, USA, 2017. [Google Scholar]
- Malanowski, M. Signal Processing for Passive Bistatic Radar; Artech House radar library, Artech House: Norwood, MA, USA, 2019. [Google Scholar]
- Richards, M.A.; Scheer, J.; Holm, W.A.; Melvin, W.L. Principles of Modern Radar; Scitech Publishing: Edison, NJ, USA, 2010. [Google Scholar]
- WorldDAB Global Summary. Available online: https://www.worlddab.org/public_document/file/916/Global_Summary_30.08.17.pdf (accessed on 25 October 2020).
- Mucci, R. A comparison of efficient beamforming algorithms. IEEE Trans. Acoust. Speech Signal Process. 1984, 32, 548–558. [Google Scholar] [CrossRef]
- Zimmerman, N. Analysis of LOFAR High Band Antenna Design. Available online: https://www.haystack.mit.edu/edu/reu/2003/files/neil/neil.pdf (accessed on 25 October 2020).
- Van Trees, H. Optimum Array Processing: Part IV of Detection, Estimation, and Modulation Theory; John Wiley and Sons: New York, NY, USA, 2002. [Google Scholar]
- Malanowski, M.; Kulpa, K. Two Methods for Target Localization in Multistatic Passive Radar. IEEE Trans. Aerosp. Electron. Syst. 2012, 48, 572–580. [Google Scholar] [CrossRef]
- Malanowski, M.; Kulpa, K.; Suchozebrski, R. Two-stage tracking algorithm for passive radar. In Proceedings of the 2009 12th International Conference on Information Fusion, Seatle, WA, USA, 6–9 July 2009; pp. 1800–1806. [Google Scholar]
- Wielgo, M.; Rzewuski, S.; Misiurewicz, J.; Kurowska, A.; Malanowski, M. Multistatic tracking experiment with a WiFiRAD passive radar. In Proceedings of the 2015 18th International Conference on Information Fusion (Fusion), Washington, DC, USA, 6–9 July 2015; pp. 629–635. [Google Scholar]
- Cao, D.; Li, T.; Kang, P.; Liu, H.; Zhou, S.; Su, H. Single-pulse multi-beams operation of phased array radar. In Proceedings of the 2016 CIE International Conference on Radar (RADAR), Guangzhou, China, 10–13 October 2016; pp. 1–4. [Google Scholar]
- Tonnaer, A. Dual axis multi-beam radars. In Proceedings of the 2013 International Conference on Radar, Adelaide, SA, Australia, 9–12 September 2013; pp. 412–416. [Google Scholar]
- Cox, P.B.; van Rossum, W.L. Analysing Multibeam, Cooperative, Ground Based Radar in a Bistatic Configuration. In Proceedings of the 2020 IEEE International Radar Conference (RADAR), Washington, DC, USA, 27 April–1 May 2020; pp. 912–917. [Google Scholar]
- Malanowski, M.; Kulpa, K.S.; Samczynski, P.; Misiurewicz, J.; Kulpa, J. Long range FM-based passive radar. In Proceedings of the IET International Conference on Radar Systems (Radar 2012), Glasgow, UK, 22–25 October 2012; pp. 1–4. [Google Scholar]
- Kulpa, K.S.; Misiurewicz, J. Stretch Processing for Long Integration Time Passive Covert Radar. In Proceedings of the 2006 CIE International Conference on Radar, Shanghai, China, 16–19 October 2006; pp. 1–4. [Google Scholar]
- Flightradar24. Available online: https://www.flightradar24.com (accessed on 21 January 2020).
- Malanowski, M.; Kulpa, K. Correction of range cell migration with FIR filter for passive radar. In Proceedings of the 2018 IEEE Radar Conference (RadarConf18), Oklahoma City, OK, USA, 23–27 April 2018; IEEE: New York, NY, USA, 2018; pp. 1123–1128. [Google Scholar]
- Kulpa, K. Adaptive clutter rejection in bi-static CW radar. In Proceedings of the 2004 International Radar Symposium, Warsaw, Poland, 17-21 May 2004; pp. 61–66. [Google Scholar]
- Malanowski, M. Comparison of adaptive methods for clutter removal in PCL radar. In Proceedings of the 2006 International Radar Symposium, Krakow, Poland, 24–26 May 2006; pp. 1–4. [Google Scholar]
- Kulpa, K. Simple sea clutter canceller for noise radar. In Proceedings of the International Radar Symposium, Krakow, Poland, 24–26 May 2006; pp. 299–302. [Google Scholar]
- Kulpa, K. The CLEAN type algorithms for radar signal processing. In Proceedings of the 2008 Microwaves, Radar and Remote Sensing Symposium, Kiev, Ukraine, 22–24 September 2008; IEEE: New York, NY, USA, 2008; pp. 152–157. [Google Scholar]
- Kulpa, K. Signal Processing in Noise Waveform Radar; Artech House radar library, Artech House: Norwood, MA, USA, 2013. [Google Scholar]
- Misiurewicz, J. Resampling methods for stretch processing in PCL radars. Photonics Applications in Astronomy, Communications, Industry, and High-Energy Physics Experiments 2007. Int. Soc. Opt. Photonics 2007, 6937, 693733. [Google Scholar]
- Kulpa, K.; Czekała, Z. Masking effect and its removal in PCL radar. IEE Proc. Radar Sonar Navig. 2005, 152, 174–178. [Google Scholar] [CrossRef]
Figure 1.
Locations of existing and planned LOw-Frequency ARray (LOFAR) stations in Europe. Credit: Netherlands Institute for Radio Astronomy ASTRON.
Figure 1.
Locations of existing and planned LOw-Frequency ARray (LOFAR) stations in Europe. Credit: Netherlands Institute for Radio Astronomy ASTRON.

Figure 2.
LOFAR PL610 station, Borowiec.

Figure 3.
Distribution of LOFAR tiles in the LOFAR station in Borowiec.

Figure 4.
Plane wave approaching a LOFAR tile.

Figure 5.
Approximation of the elevation beam pattern for a single high-frequency band antenna (HBA), for created with a 4th order polynomial.
Figure 5.
Approximation of the elevation beam pattern for a single high-frequency band antenna (HBA), for created with a 4th order polynomial.

Figure 6.
Unsteered beam pattern for a LOFAR tile.

Figure 7.
Vertical cut at azimuth of the unsteered beam pattern for the LOFAR tile.

Figure 8.
Beam pattern of the LOFAR tile with the beam steered at and .

Figure 9.
Vertical cut at azimuth of the beam pattern of the LOFAR tile with the beam steered at and .
Figure 9.
Vertical cut at azimuth of the beam pattern of the LOFAR tile with the beam steered at and .

Figure 10.
Horizontal cut at elevation of the beam pattern of the LOFAR tile with the beam steered at and .
Figure 10.
Horizontal cut at elevation of the beam pattern of the LOFAR tile with the beam steered at and .

Figure 11.
Unsteered beam pattern of a LOFAR station.

Figure 12.
Vertical cut at azimuth of the unsteered beam pattern of the LOFAR station.

Figure 13.
Beam pattern of the LOFAR station with the beam steered at and .

Figure 14.
Vertical cut at azimuth of the beam pattern of the LOFAR station with the beam steered at and .
Figure 14.
Vertical cut at azimuth of the beam pattern of the LOFAR station with the beam steered at and .

Figure 15.
Horizontal cut at elevation of the beam pattern of the LOFAR station with the beam steered at and .
Figure 15.
Horizontal cut at elevation of the beam pattern of the LOFAR station with the beam steered at and .

Figure 16.
Horizontal cuts at elevation of the beam patterns of the LOFAR station with the digital beams steered at different and .
Figure 16.
Horizontal cuts at elevation of the beam patterns of the LOFAR station with the digital beams steered at different and .

Figure 17.
Vertical cuts at azimuth of the beam patterns of the LOFAR station with the digital beams steered at different and .
Figure 17.
Vertical cuts at azimuth of the beam patterns of the LOFAR station with the digital beams steered at different and .

Figure 18.
Detected target cross-section in dBsm versus integration time and orbit height.

Figure 19.
Map with planes around the LOFAR station in Borowiec at the moment of the registration, L—the LOFAR station in Borowiec, —the broadcasting station in Piatkowo, —the broadcasting station in Srem.
Figure 19.
Map with planes around the LOFAR station in Borowiec at the moment of the registration, L—the LOFAR station in Borowiec, —the broadcasting station in Piatkowo, —the broadcasting station in Srem.

Figure 20.
Cross-ambiguity function for the surveillance signal acquired by one tile.

Figure 21.
Cross-ambiguity function for the beam steered in the direction of the SWR160 plane.

Figure 22.
Two ellipses computed based on the SWR160 plane’s bistatic ranges from two transmitter stations.
Figure 22.
Two ellipses computed based on the SWR160 plane’s bistatic ranges from two transmitter stations.

Figure 23.
Cross-ambiguity function for the beam steered in the direction of the RYR2XJ plane.

Figure 24.
Two ellipses computed based on the RYR2XJ plane’s bistatic ranges from two transmitter stations.
Figure 24.
Two ellipses computed based on the RYR2XJ plane’s bistatic ranges from two transmitter stations.


Table 1.
Bistatic range and velocity measured for SWR160 plane.
| Transmitter | [km] | [km] | [km/h] | [km/h] |
|---|---|---|---|---|
| Srem | 57.2 | 57.9 | 1565 | 1561 |
| Piatkowo | 25.5 | 25.8 | 1418 | 1423 |
Table 2.
Distance and azimuth of the SWR160 plane’s location in relation to the LOFAR station.
| Plane | [km] | [km] | [] | [] |
|---|---|---|---|---|
| SWR160 | 27.2 | 27.6 | 8.9 | 9.7 |
Table 3.
Bistatic range and velocity measured for RYR2XJ plane.
| Transmitter | [km] | [km] | [km/h] | [km/h] |
|---|---|---|---|---|
| Srem | 107.2 | 107.6 | 637 | 626 |
| Piatkowo | 83.1 | 82.9 | 146 | 145 |
Table 4.
Distance and azimuth of the RYR2XJ plane’s location in relation to the LOFAR station.
| Plane | [km] | [km] | [] | [] |
|---|---|---|---|---|
| RYR2XJ | 59.7 | 59.6 | −67.0 | −65.6 |
Publisher’s Note: MDPI stays neutral with regard to jurisdictional claims in published maps and institutional affiliations. |
© 2021 by the authors. Licensee MDPI, Basel, Switzerland. This article is an open access article distributed under the terms and conditions of the Creative Commons Attribution (CC BY) license (http://creativecommons.org/licenses/by/4.0/).
Share and Cite
MDPI and ACS Style
Droszcz, A.; Jędrzejewski, K.; Kłos, J.; Kulpa, K.; Pożoga, M. Beamforming of LOFAR Radio-Telescope for Passive Radiolocation Purposes. Remote Sens. 2021, 13, 810. https://0-doi-org.brum.beds.ac.uk/10.3390/rs13040810
AMA Style
Droszcz A, Jędrzejewski K, Kłos J, Kulpa K, Pożoga M. Beamforming of LOFAR Radio-Telescope for Passive Radiolocation Purposes. Remote Sensing. 2021; 13(4):810. https://0-doi-org.brum.beds.ac.uk/10.3390/rs13040810
Chicago/Turabian StyleDroszcz, Aleksander, Konrad Jędrzejewski, Julia Kłos, Krzysztof Kulpa, and Mariusz Pożoga. 2021. "Beamforming of LOFAR Radio-Telescope for Passive Radiolocation Purposes" Remote Sensing 13, no. 4: 810. https://0-doi-org.brum.beds.ac.uk/10.3390/rs13040810
Note that from the first issue of 2016, this journal uses article numbers instead of page numbers. See further details here.