
Selecting Optimal Combination of Data Channels for Semantic Segmentation in City Information Modelling (CIM)


Abstract
:
1. Introduction
2. Materials and Methodology
2.1. Paradigms for Semantic Segmentation
2.2. Study Materials
2.3. Methodology
2.4. Experiment Arrangement
3. Results
4. Discussion
5. Conclusions
Author Contributions
Funding
Institutional Review Board Statement
Informed Consent Statement
Data Availability Statement
Conflicts of Interest
References
- Stojanovski, T. City Information Modelling (CIM) and Urban Design. City Model. GIS 2018, 36, 506–516. [Google Scholar]
- Xu, X.; Ding, L.; Luo, H.; Ma, L. From Building iInformation Modeling to City Information Modeling. J. Inf. Technol. Construct. 2014, 19, 292–307. [Google Scholar]
- Lu, Q.; Lee, S. Image-Based Technologies for Constructing As-Is Building Information Models for Existing Buildings. J. Comput. Civ. Eng. 2017, 31, 04017005. [Google Scholar] [CrossRef]
- Golparvar-Fard, M.; Bohn, J.; Teizer, J.; Savarese, S.; Peña-Mora, F. Evaluation of image-based modeling and laser scanning accuracy for emerging automated performance monitoring techniques. Autom. Constr. 2011, 20, 1143–1155. [Google Scholar] [CrossRef]
- Kim, S.; Kim, S.; Lee, D.E. 3D Point Cloud and BIM-Based Reconstruction for Evaluation of Project by As-Planned and As-Built. Remote Sens. 2020, 12, 1457. [Google Scholar] [CrossRef]
- Badenko, V.; Fedotov, A.; Zotov, D.; Lytkin, S.; Volgin, D.; Garg, R.D.; Min, L. Scan-to-BIM Methodology Adapted for Different Application. Photogramm. Remote Sens. Spat. Inf. Sci. 2019, 42, 24–25. [Google Scholar] [CrossRef] [Green Version]
- Bernat, M.; Janowski, A.; Rzepa, S.; Sobieraj, A.; Szulwic, J. Studies on the use of terrestrial laser scanning in the maintenance of buildings belonging to the cultural heritage. In Proceedings of the 14th Geoconference on Informatics, Geoinformatics and Remote Sensing, SGEM, ORG, Albena, Bulgaria, 17–26 June 2014; pp. 307–318. [Google Scholar]
- Yang, R.; Su, L.; Zhao, X.; Wan, H.; Sun, J. Representative band selection for hyperspectral image classification. J. Vis. Commun. Image Represent 2017, 48, 396–403. [Google Scholar] [CrossRef]
- Li, Y.; Majumder, A.; Zhang, H.; Gopi, M. Optimized multi-spectral filter array based imaging of natural scenes. Sensors 2018, 18, 1172. [Google Scholar] [CrossRef] [PubMed] [Green Version]
- Abdalla, A.; Cen, H.; Abdel-Rahman, E.; Wan, L.; He, Y. Color Calibration of Proximal Sensing RGB Images of Oilseed Rape Canopy via Deep Learning Combined with K-Means Algorithm. Remote Sens. 2019, 11, 3001. [Google Scholar] [CrossRef] [Green Version]
- Bhuiyan, M.A.E.; Witharana, C.; Liljedahl, A.K.; Jones, B.M.; Daanen, R.; Epstein, H.E.; Kent, K.; Griffin, C.G.; Agnew, A. Understanding the Effects of Optimal Combination of Spectral Bands on Deep Learning Model Predictions: A Case Study Based on Permafrost Tundra Landform Mapping Using High Resolution Multispectral Satellite Imagery. J. Imaging 2020, 6, 97. [Google Scholar] [CrossRef]
- Park, J.H.; Inamori, T.; Hamaguchi, R.; Otsuki, K.; Kim, J.E.; Yamaoka, K. RGB Image Prioritization Using Convolutional Neural Network on a Microprocessor for Nanosatellites. Remote Sens. 2020, 12, 3941. [Google Scholar] [CrossRef]
- Pierdicca, R.; Paolanti, M.; Matrone, F.; Martini, M.; Morbidoni, C.; Malinverni, E.S.; Frontoni, E.; Lingua, A.M. Point cloud semantic segmentation using a deep learning framework for cultural heritage. Remote Sens. 2020, 12, 1005. [Google Scholar] [CrossRef] [Green Version]
- Alshawabkeh, Y. Linear feature extraction from point cloud using color information. Herit. Sci. 2020, 8, 28. [Google Scholar] [CrossRef]
- Meyer, G.P.; Charland, J.; Hegde, D.; Laddha, A.; Vallespi-Gonzalez, C. Sensor fusion for joint 3d object detection and semantic segmentation. In Proceedings of the IEEE/CVF Conference on Computer Vision and Pattern Recognition Workshops, Seattle, WA, USA, 14–19 June 2020. [Google Scholar]
- Lawin, F.J.; Danelljan, M.; Tosteberg, P.; Bhat, G.; Khan, F.S.; Felsberg, M. Proceedings of the Deep projective 3D semantic segmentation. International Conference on Computer Analysis of Images and Patterns, Ystad, Sweden, 22–24 August 2017; Springer: Cham, Switzerland, 2017; pp. 95–107. [Google Scholar]
- Guo, Y.; Wang, H.; Hu, Q.; Liu, H.; Liu, L.; Bennamoun, M. Deep learning for 3d point clouds: A survey. In IEEE Transactions on Pattern Analysis and Machine Intelligence; IEEE: New York, NY, USA, 2020. [Google Scholar]
- Hu, Q.; Yang, B.; Xie, L.; Rosa, S.; Markham, A. RandLA-Net: Efficient Semantic Segmentation of Large-Scale Point Clouds. In Proceedings of the 2020 IEEE/CVF Conference on Computer Vision and Pattern Recognition (CVPR), Seattle, WA, USA, 14–19 June 2020. [Google Scholar]
- Boulch, A.; Guerry, Y.; Le Saux, B.; Audebert, N. SnapNet: 3D point cloud semantic labeling with 2D deep segmentation networks. Comput. Graph. 2018, 71, 189–198. [Google Scholar] [CrossRef]
- Hackel, T.; Savinov, N.; Ladicky, L.; Wegner, J.D.; Schindler, K.; Pollefeys, M. Semantic3D.net: A new large-scale point cloud classification benchmark. arXiv 2017, arXiv:1704.03847. [Google Scholar] [CrossRef] [Green Version]
- Gull, S.F. Skilling. October. Maximum entropy method in image processing. In IEE Proceedings F Communications, Radar and Signal Processing; IET Digital Library: Guangzhou, China, 1984; Volume 131, pp. 646–659. [Google Scholar]
- Ronneberger, O.; Fischer, P.; Brox, T. U-net: Convolutional networks for biomedical image segmentation. In Proceedings of the International Conference on Medical Image Computing and Computer-Assisted Intervention, Munich, Germany, 5–9 October 2015; pp. 234–241. [Google Scholar]
- He, K.; Zhang, X.; Ren, S.; Sun, J. Deep residual learning for image recognition. In Proceedings of the IEEE Computer Society Conference on Computer Vision and Pattern Recognition, Las Vegas, NV, USA, 27–30 June 2016; pp. 770–778. [Google Scholar]
- Sandler, M.; Howard, A.; Zhu, M.; Zhmoginov, A.; Chen, L.C. Inverted Residuals and Linear Bottlenecks: Mobile Networks for Classification, Detection and Segmentation. In Proceedings of the IEEE Computer Society Conference on Computer Vision and Pattern Recognition, Salt Lake City, UT, USA, 18–22 June 2018; pp. 4510–4520. [Google Scholar]
- Chollet, F. Xception: Deep learning with depthwise separable convolutions. In Proceedings of the 30th IEEE Conference on Computer Vision and Pattern Recognition, CVPR 2017, Las Vegas, NV, USA, 27–30 June 2016; pp. 1800–1807. [Google Scholar]
- Hand, D.J. Data clustering: Theory, algorithms, and applications by guojun gan, chaoqun ma, jianhong wu. Int. Stat. Rev. 2010, 76, 141. [Google Scholar] [CrossRef]
- Szegedy, C.; Ioffe, S.; Vanhoucke, V.; Alemi, A.A. Inception-v4, inception-ResNet and the impact of residual connections on learning. In Proceedings of the 31st AAAI Conference on Artificial Intelligence, AAAI 2017, Francisco, CA, USA, 4–9 February 2017; pp. 4278–4284. [Google Scholar]
- Xu, Z.; Zhang, W.; Zhang, T.; Li, J. Hrcnet: High-resolution context extraction network for semantic segmentation of remote sensing images. Remote Sens. 2021, 13, 71. [Google Scholar] [CrossRef]
- Wang, J.; Sun, K.; Cheng, T.; Jiang, B.; Xiao, B. Deep High-Resolution Representation Learning for Visual Recognition. In IEEE Transactions on Pattern Analysis and Machine Intelligence; IEEE: New York, NY, USA, 2018. [Google Scholar]
- Zhao, H.; Shi, J.; Qi, X.; Wang, X.; Jia, J. Pyramid scene parsing network. In Proceedings of the 30th IEEE Conference on Computer Vision and Pattern Recognition, CVPR 2017, Honolulu, HI, USA, 21–26 July 2017; pp. 6230–6239. [Google Scholar]
- Zhao, H.; Zhang, Y.; Liu, S.; Shi, J.; Loy, C.C.; Lin, D.; Jia, J. Psanet: Point-wise spatial attention network for scene parsing. In Proceedings of the European Conference on Computer Vision (ECCV), Munich, Germany, 8–14 September 2018; pp. 267–283. [Google Scholar]
- Tchapmi, L.; Choy, C.; Armeni, I.; Gwak, J.; Savarese, S. SEGCloud: Semantic segmentation of 3D point clouds. In Proceedings of the 2017 International Conference on 3D Vision, 3DV 2017, Qingdao, China, 10–12 October 2017; Institute of Electrical and Electronics Engineers Inc.: New York, NY, USA, 2017; pp. 537–547. [Google Scholar] [CrossRef] [Green Version]
- Thomas, H.; Goulette, F.; Deschaud, J.E.; Marcotegui, B.; Gall, Y.L. Semantic classification of 3d point clouds with multiscale spherical neighborhoods. In Proceedings of the 2018 International Conference on 3D Vision, 3DV 2018, Verona, Italy, 5–8 September 2018; Institute of Electrical and Electronics Engineers Inc.: New York, NY, USA, 2018; pp. 390–398. [Google Scholar] [CrossRef] [Green Version]
- Contreras, J.; Denzler, J. Edge-Convolution Point Net for Semantic Segmentation of Large-Scale Point Clouds. In Proceedings of the International Geoscience and Remote Sensing Symposium (IGARSS), Yokohama, Japan, 28 July–2 August 2019; Institute of Electrical and Electronics Engineers Inc.: New York, NY, USA, 2019; pp. 5236–5239. [Google Scholar] [CrossRef]
- Zhang, Z.; Hua, B.S.; Yeung, S.K. ShellNet: Efficient point cloud convolutional neural networks using concentric shells statistics. In Proceedings of the IEEE International Conference on Computer Vision, Thessaloniki, Greece, 23–25 September 2019; Institute of Electrical and Electronics Engineers Inc.: New York, NY, USA, 2019; pp. 1607–1616. [Google Scholar] [CrossRef] [Green Version]
- Wang, F.; Zhuang, Y.; Gu, H.; Hu, H. OctreeNet: A Novel Sparse 3-D Convolutional Neural Network for Real-Time 3-D Outdoor Scene Analysis. IEEE Trans. Autom. Sci. Eng. 2020, 17, 735–747. [Google Scholar] [CrossRef]
- Wang, L.; Huang, Y.; Hou, Y.; Zhang, S.; Shan, J. Graph attention convolution for point cloud semantic segmentation. In Proceedings of the IEEE Computer Society Conference on Computer Vision and Pattern Recognition; IEEE Computer Society: Washington, DC, USA, 2019; pp. 10288–10297. [Google Scholar] [CrossRef]
- Wu, B.; Xu, C.; Dai, X.; Wan, A.; Zhang, P.; Tomizuka, M.; Keutzer, K.; Vajda, P. Visual transformers: Token-based image representation and processing for computer vision. arXiv 2020, arXiv:2006.03677. [Google Scholar]


| Index | Preview | Name | Number of Points | Description | Train/Test |
|---|---|---|---|---|---|
| 1 |  | bildstein1 | 29,302,501 | church in bildstein | Train |
| 2 |  | bildstein3 | 23,765,246 | church in bildstein | Test |
| 3 |  | bildstein5 | 24,671,679 | church in bildstein | Train |
| 4 |  | domfountain1 | 35,494,386 | cathedral in feldkirch | Train |
| 5 |  | domfountain2 | 35,188,343 | cathedral in feldkirch | Test |
| 6 |  | domfountain3 | 35,049,972 | cathedral in feldkirch | Train |
| 7 |  | untermaederbrunnen1 | 16,658,648 | fountain in balgach | Train |
| 8 |  | untermaederbrunnen3 | 19,767,991 | fountain in balgach | Test |
| 9 |  | neugasse | 50,109,087 | neugasse in st. gallen | Test |
| 10 |  | sg27_1 | 161,044,280 | railroad tracks | Train |
| 11 |  | sg27_2 | 248,351,425 | town square | Train |
| 12 |  | sg27_4 | 280,994,028 | village | Test |
| 13 |  | sg27_5 | 218,269,204 | crossing | Train |
| 14 |  | sg27_9 | 222,908,898 | soccer field | Train |
| 15 |  | sg28_4 | 258,719,795 | town | Train |
| Index | 1 | 2 | 3 | 4 | 5 | 6 | 7 |
| Combination | 8 Channels | RGB | XYZD | IXYZD | IRGB | IRGBX | IRGBY |
| Index | 8 | 9 | 10 | 11 | 12 | 13 | - |
| Combination | IRGBZ | IRGBD | RGBX | RGBY | RGBZ | RGBD | - |
| Base Channels | Additional Channels | Improvement on mIoU | Improvement on OA |
|---|---|---|---|
| RGB | +Intensity | 1.95% | 1.43% |
| XYZD | +Intensity | 4.47% | 6.06% |
| RGBX | +Intensity | 1.87% | 0.63% |
| RGBY | +Intensity | 3.17% | 0.21% |
| RGBZ | +Intensity | 1.50% | 1.54% |
| RGBD | +Intensity | 6.46% | 1.74% |
| AVE | 3.24% | 2.01% | |
| RGB | +X | −3.69% | −1.52% |
| IRGB | +X | −1.90% | −3.85% |
| AVE | −2.84% | −2.69% | |
| RGB | +Y | −3.62% | −3.60% |
| IRGB | +Y | −2.31% | −4.43% |
| AVE | −2.97% | −4.05% | |
| RGB | +Z | −0.47% | −3.47% |
| IRGB | +Z | −0.72% | −3.36% |
| AVE | −0.63% | −3.46% | |
| RGB | +D | 0.77% | −2.00% |
| IRGB | +D | 5.47% | −1.88% |
| AVE | 3.08% | −2.00% | |
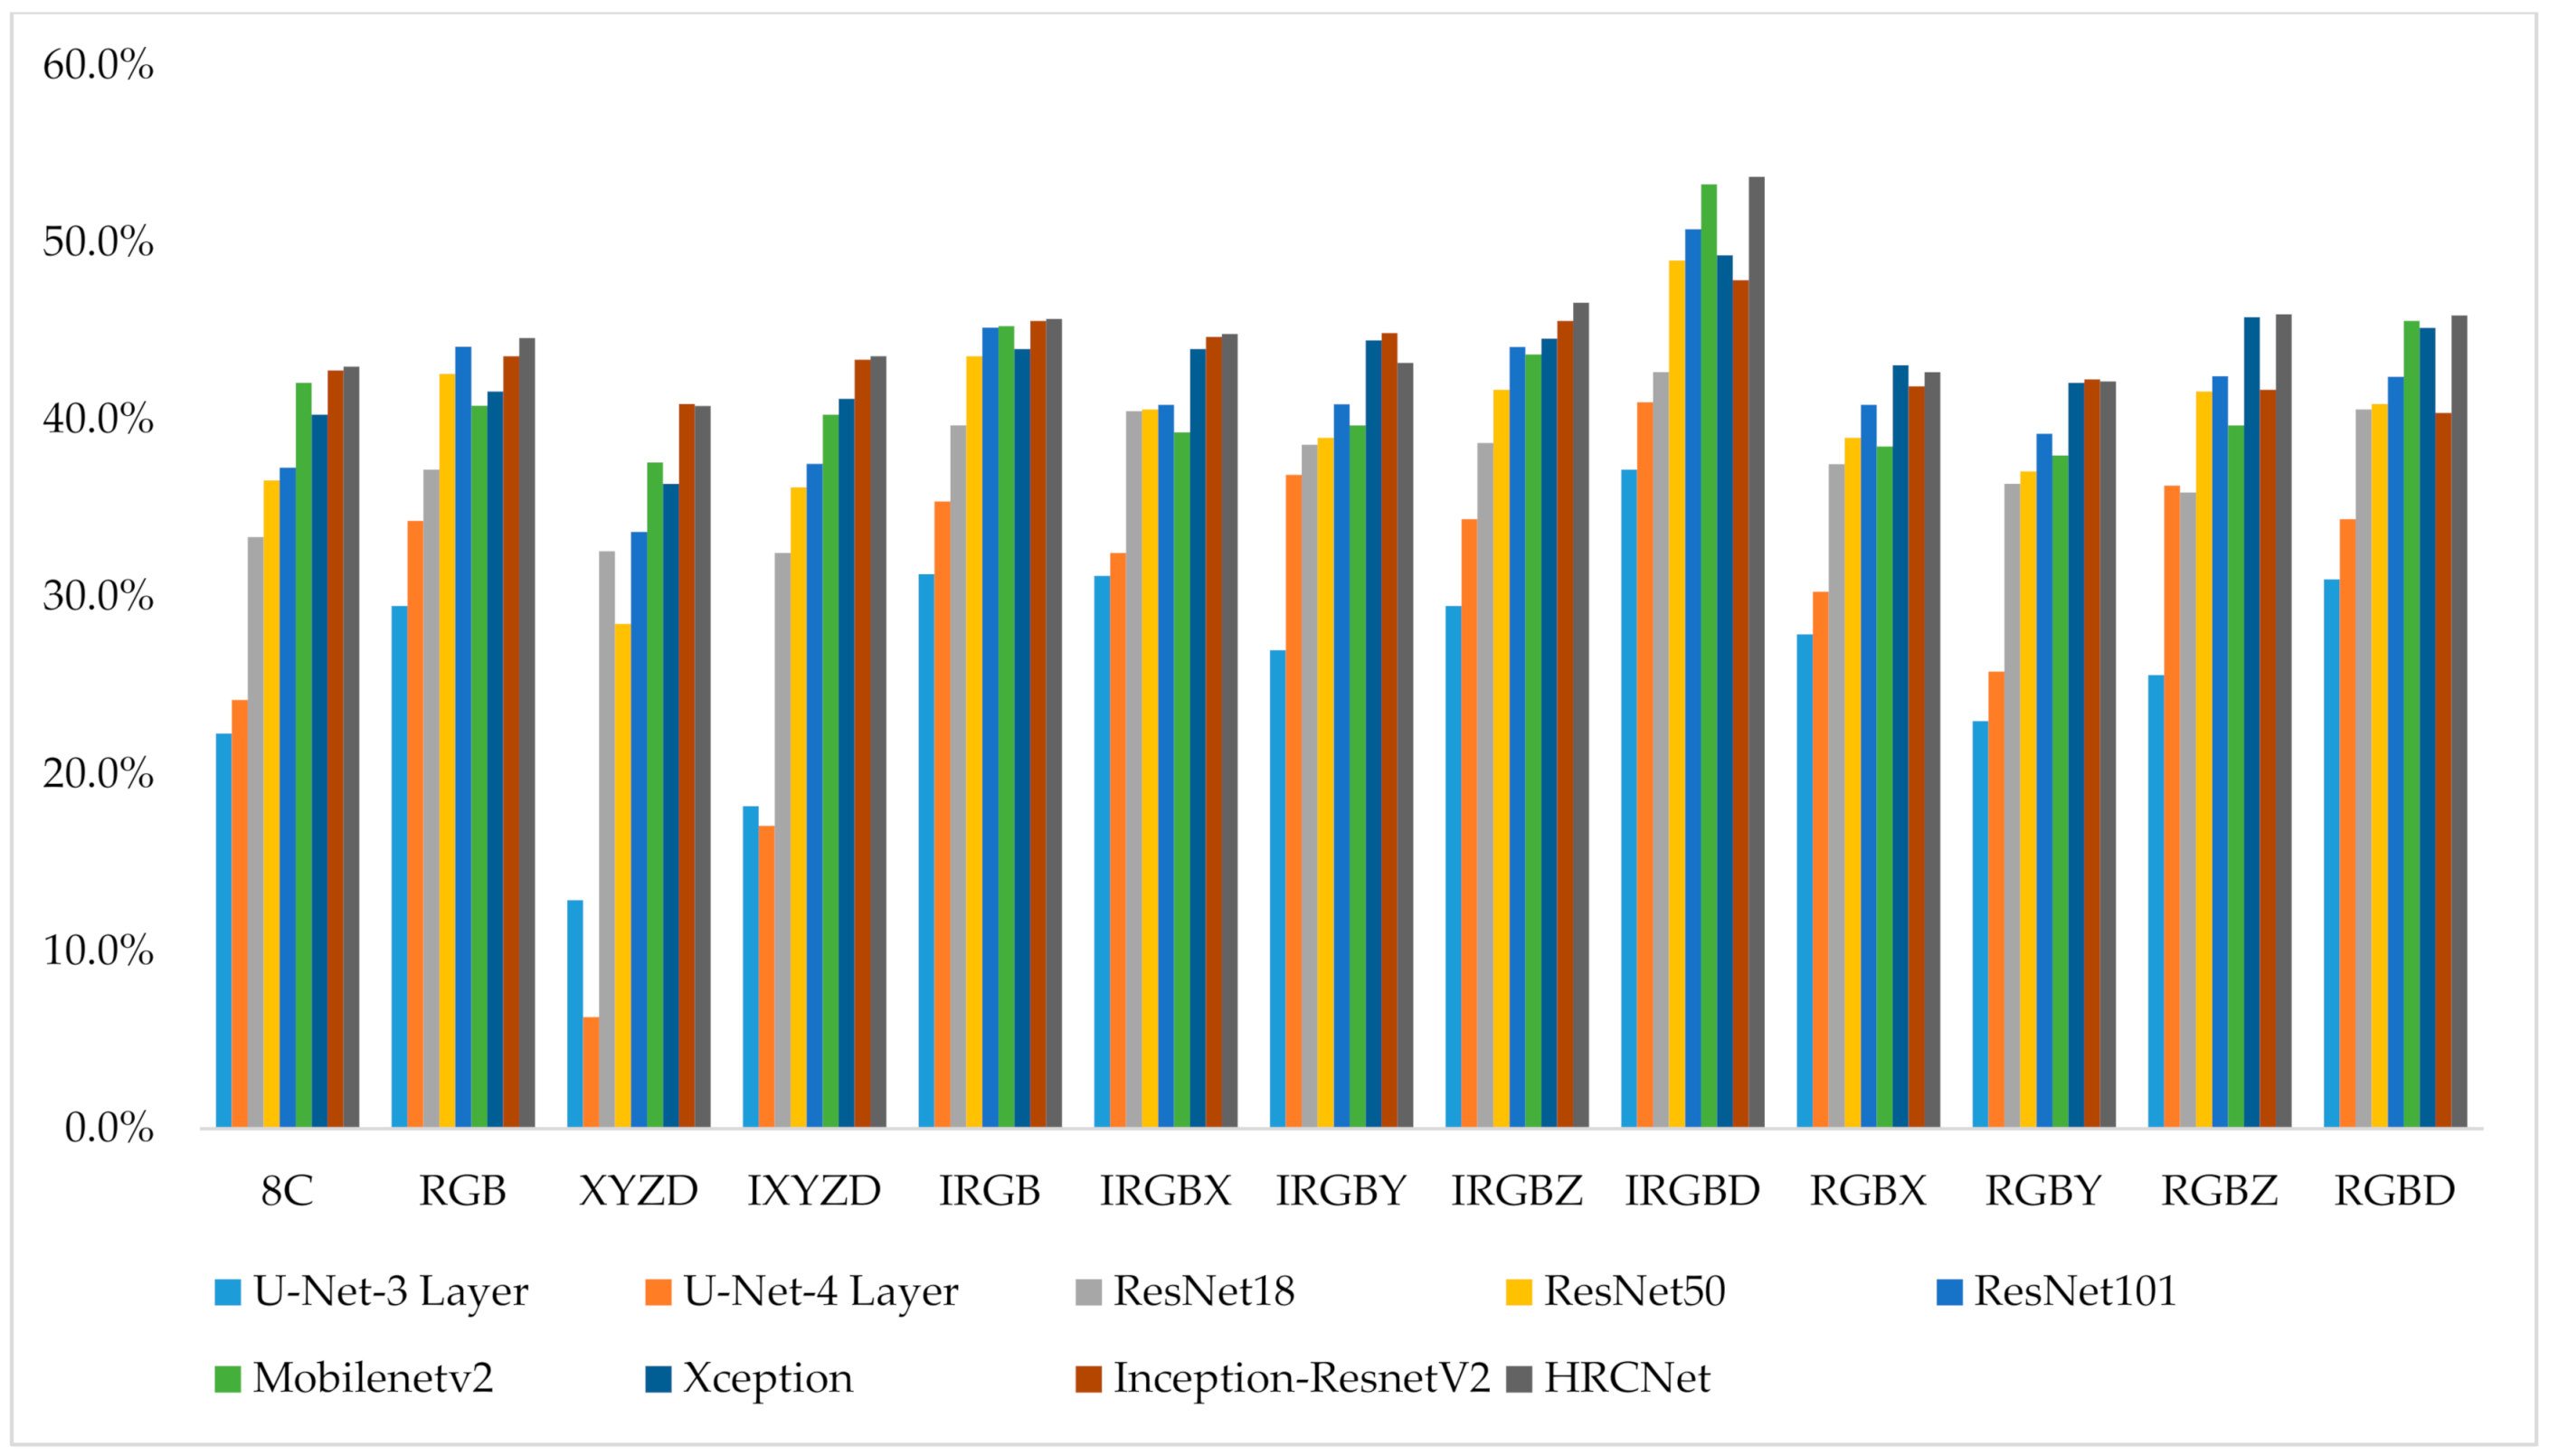
| 8C | RGB | XYZD | IXYZD | IRGB | IRGBX | IRGBY | IRGBZ | IRGBD | RGBX | RGBY | RGBZ | RGBD | |
|---|---|---|---|---|---|---|---|---|---|---|---|---|---|
| U-Net-3 Layer | 22.3% | 29.5% | 12.9% | 18.2% | 31.3% | 31.2% | 27.0% | 29.5% | 37.2% | 27.9% | 23.0% | 25.6% | 31.0% |
| U-Net-4 Layer | 24.2% | 34.3% | 6.3% | 17.1% | 35.4% | 32.5% | 36.9% | 34.4% | 41.0% | 30.3% | 25.8% | 36.3% | 34.4% |
| ResNet18 | 33.4% | 37.2% | 32.6% | 32.5% | 39.7% | 40.5% | 38.6% | 38.7% | 42.7% | 37.5% | 36.4% | 35.9% | 40.6% |
| ResNet50 | 36.6% | 42.6% | 28.5% | 36.2% | 43.6% | 40.6% | 39.0% | 41.7% | 49.0% | 39.0% | 37.1% | 41.6% | 40.9% |
| ResNet101 | 37.3% | 44.1% | 33.7% | 37.5% | 45.2% | 40.8% | 40.9% | 44.1% | 50.8% | 40.9% | 39.2% | 42.5% | 42.4% |
| Mobilenetv2 | 42.1% | 40.8% | 37.6% | 40.3% | 45.3% | 39.3% | 39.7% | 43.7% | 53.3% | 38.5% | 38.0% | 39.7% | 45.6% |
| Xception | 40.3% | 41.6% | 36.4% | 41.2% | 44.0% | 44.0% | 44.5% | 44.6% | 49.3% | 43.1% | 42.1% | 45.8% | 45.2% |
| Inception-ResnetV2 | 42.8% | 43.6% | 40.9% | 43.4% | 45.6% | 44.7% | 44.9% | 45.6% | 47.9% | 41.9% | 42.3% | 41.7% | 40.4% |
| HRCNet | 43.0% | 44.6% | 40.8% | 43.6% | 45.7% | 44.8% | 43.2% | 46.6% | 53.7% | 42.7% | 42.2% | 46.0% | 45.9% |
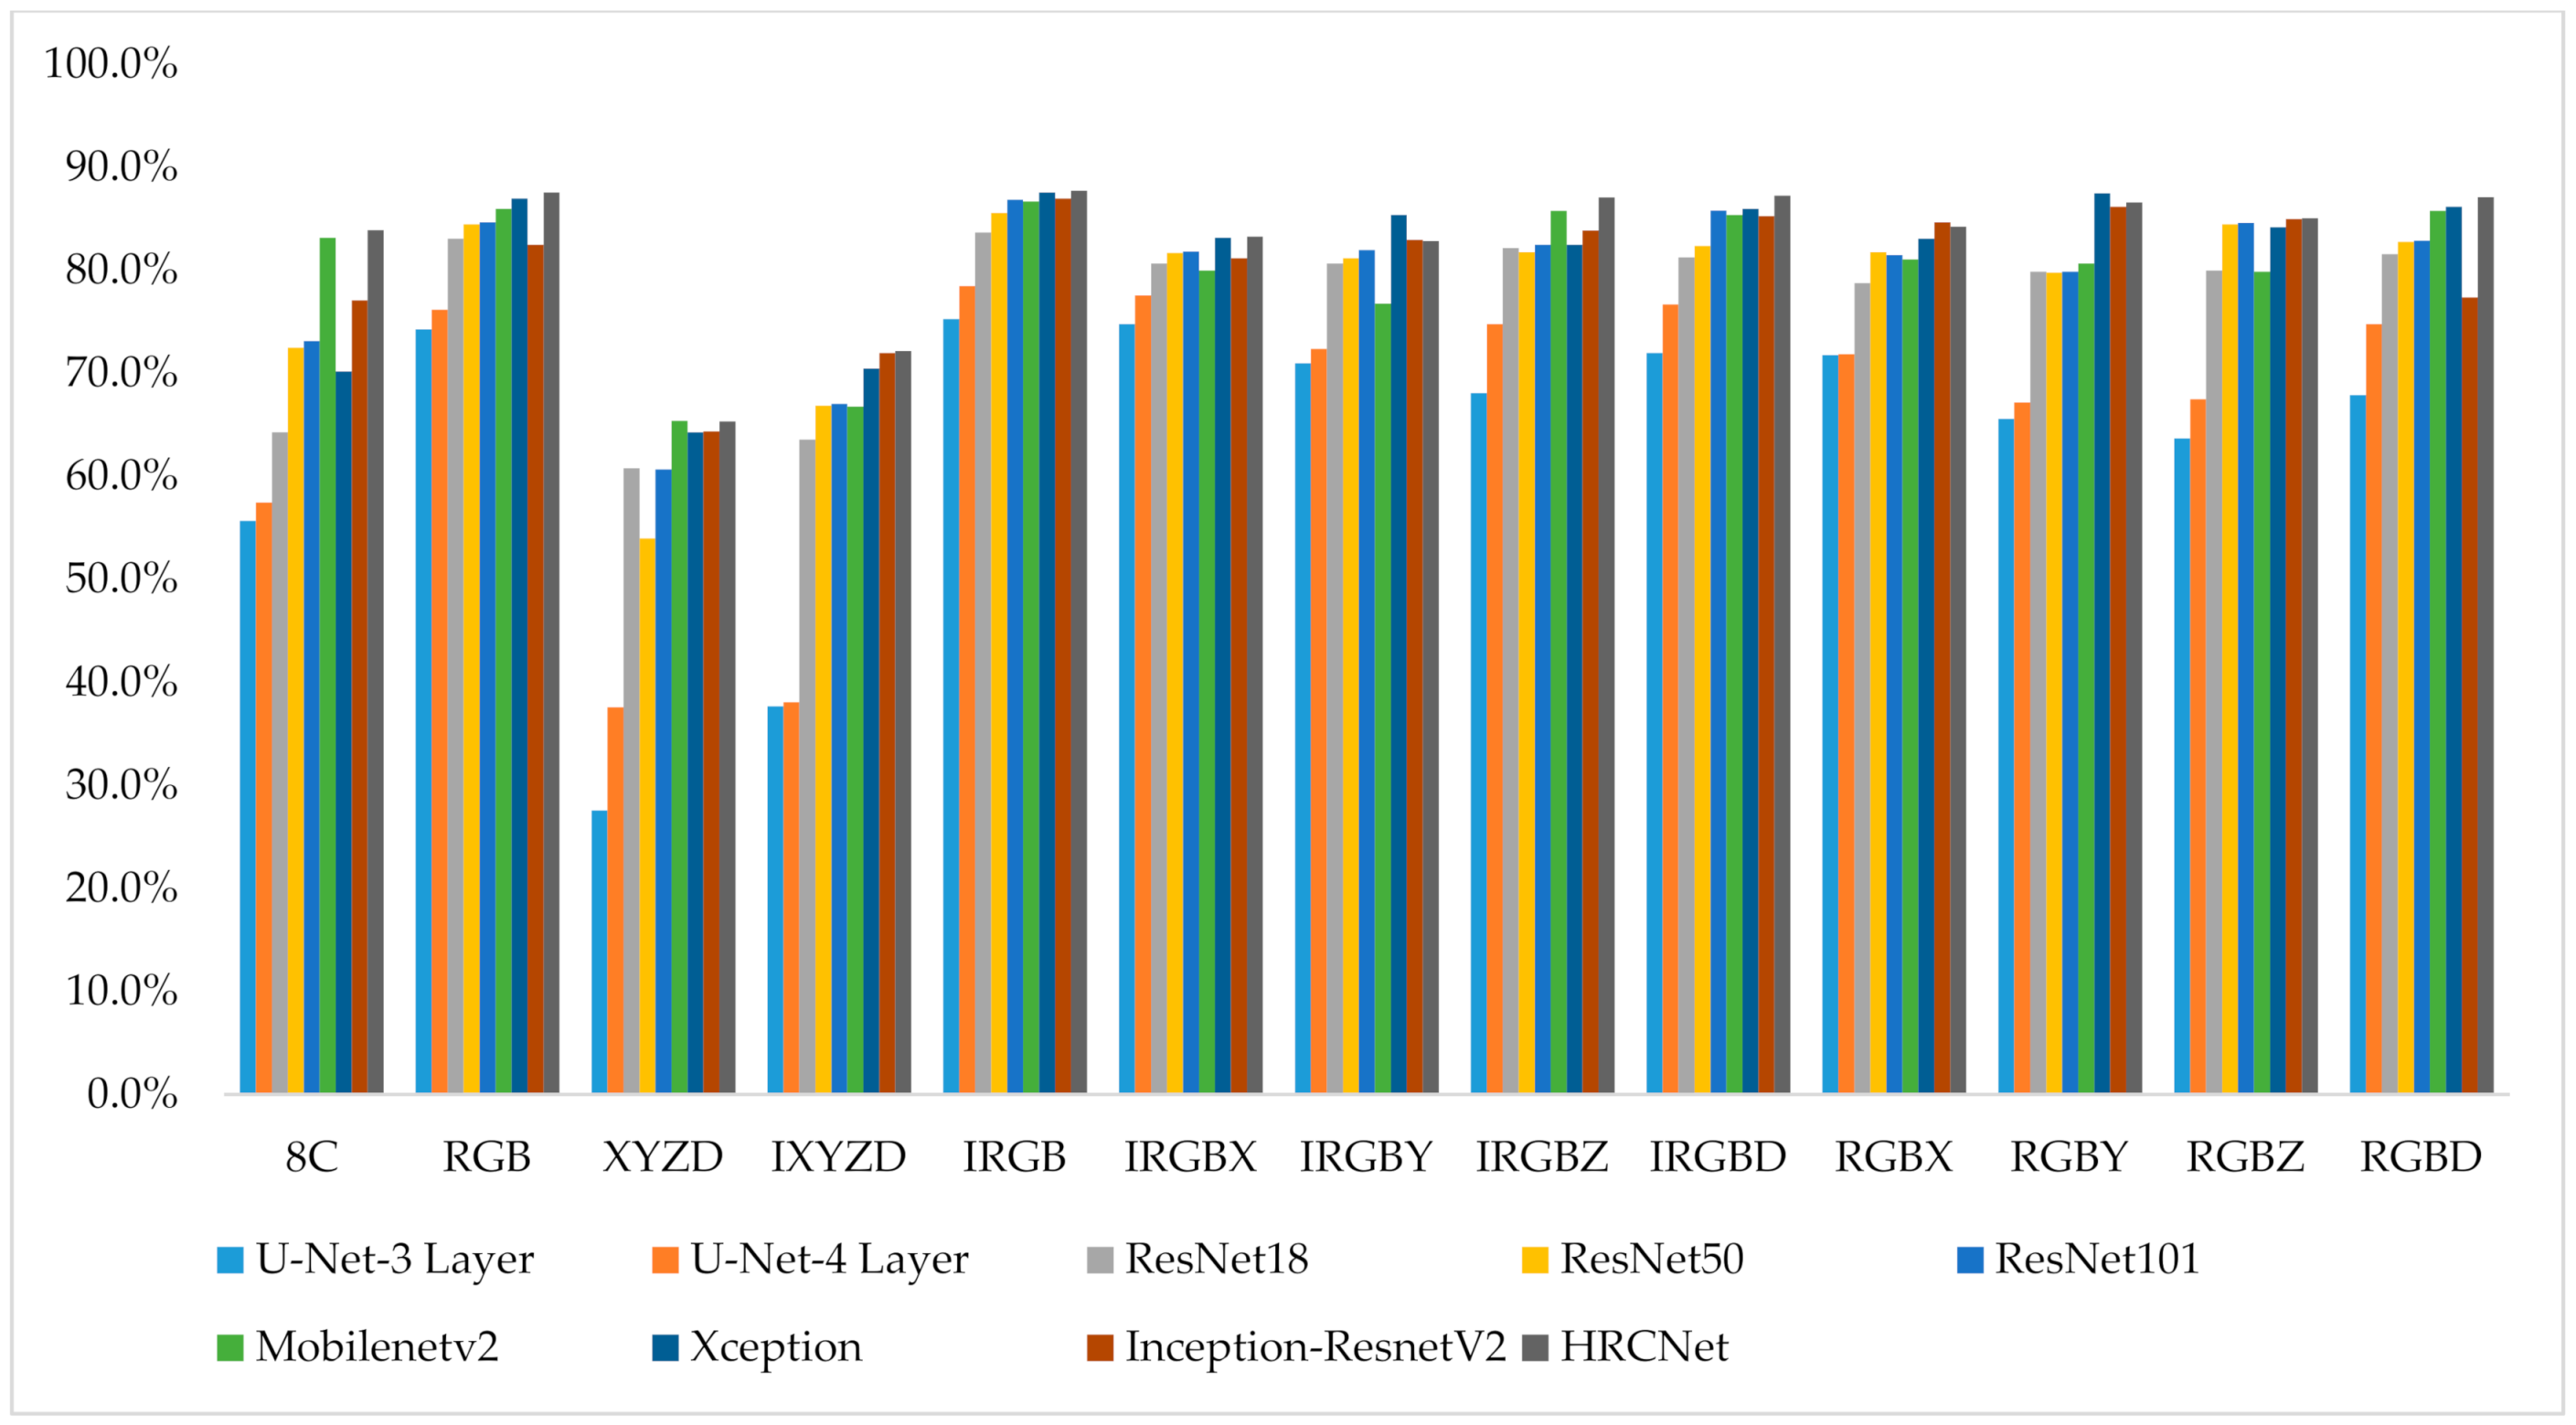
| 8C | RGB | XYZD | IXYZD | IRGB | IRGBX | IRGBY | IRGBZ | IRGBD | RGBX | RGBY | RGBZ | RGBD | |
|---|---|---|---|---|---|---|---|---|---|---|---|---|---|
| U-Net-3 Layer | 55.7% | 74.3% | 27.6% | 37.7% | 75.3% | 74.8% | 71.0% | 68.1% | 72.0% | 71.8% | 65.6% | 63.7% | 67.9% |
| U-Net-4 Layer | 57.5% | 76.2% | 37.6% | 38.1% | 78.5% | 77.6% | 72.4% | 74.8% | 76.7% | 71.9% | 67.2% | 67.5% | 74.8% |
| ResNet18 | 64.3% | 83.1% | 60.8% | 63.6% | 83.7% | 80.7% | 80.7% | 82.2% | 81.3% | 78.8% | 79.9% | 80.0% | 81.6% |
| ResNet50 | 72.5% | 84.5% | 54.0% | 66.9% | 85.6% | 81.7% | 81.2% | 81.8% | 82.4% | 81.8% | 79.8% | 84.5% | 82.8% |
| ResNet101 | 73.2% | 84.7% | 60.7% | 67.1% | 86.9% | 81.9% | 82.0% | 82.5% | 85.8% | 81.5% | 79.9% | 84.6% | 82.9% |
| Mobilenetv2 | 83.2% | 86.0% | 65.4% | 66.8% | 86.7% | 80.0% | 76.8% | 85.8% | 85.4% | 81.1% | 80.7% | 79.9% | 85.8% |
| Xception | 70.2% | 87.0% | 64.3% | 70.5% | 87.6% | 83.2% | 85.4% | 82.5% | 86.0% | 83.1% | 87.5% | 84.2% | 86.2% |
| Inception-ResnetV2 | 77.1% | 82.5% | 64.4% | 72.0% | 87.0% | 81.2% | 83.0% | 83.9% | 85.3% | 84.7% | 86.2% | 85.0% | 77.4% |
| HRCNet | 83.9% | 87.6% | 65.3% | 72.2% | 87.8% | 83.3% | 82.9% | 87.1% | 87.3% | 84.3% | 86.6% | 85.1% | 87.1% |
| 1 | 2 | 3 | 4 | 5 | 6 | 7 | 8 | 9 | 10 | 11 | 12 | 13 | |
|---|---|---|---|---|---|---|---|---|---|---|---|---|---|
| U-Net-3 Layer | IRGBD | IRGB | IRGBX | RGBD | RGB | IRGBZ | RGBX | IRGBY | RGBZ | RGBY | 8C | IXYZD | XYZD |
| U-Net-4 Layer | IRGBD | IRGBY | RGBZ | IRGB | IRGBZ | RGBD | RGB | IRGBX | RGBX | RGBY | 8C | IXYZD | XYZD |
| ResNet18 | IRGBD | RGBD | IRGBX | IRGB | IRGBZ | IRGBY | RGBX | RGB | RGBY | RGBZ | 8C | XYZD | IXYZD |
| ResNet50 | IRGBD | IRGB | RGB | IRGBZ | RGBZ | RGBD | IRGBX | IRGBY | RGBX | RGBY | 8C | IXYZD | XYZD |
| ResNet101 | IRGBD | IRGB | RGB | IRGBZ | RGBZ | RGBD | IRGBY | RGBX | IRGBX | RGBY | IXYZD | 8C | XYZD |
| Mobilenetv2 | IRGBD | RGBD | IRGB | IRGBZ | 8C | RGB | IXYZD | IRGBY | RGBZ | IRGBX | RGBX | RGBY | XYZD |
| Xception | IRGBD | RGBZ | RGBD | IRGBZ | IRGBY | IRGB | IRGBX | RGBX | RGBY | RGB | IXYZD | 8C | XYZD |
| Inception-ResnetV2 | IRGBD | IRGB | IRGBZ | IRGBY | IRGBX | RGB | IXYZD | 8C | RGBY | RGBX | RGBZ | XYZD | RGBD |
| HRCNet | IRGBD | IRGBZ | RGBZ | RGBD | IRGB | IRGBX | RGB | IXYZD | IRGBY | 8C | RGBX | RGBY | XYZD |
| 1 | 2 | 3 | 4 | 5 | 6 | 7 | 8 | 9 | 10 | 11 | 12 | 13 | |
|---|---|---|---|---|---|---|---|---|---|---|---|---|---|
| U-Net-3 Layer | IRGB | IRGBX | RGB | IRGBD | RGBX | IRGBY | IRGBZ | RGBD | RGBY | RGBZ | 8C | IXYZD | XYZD |
| U-Net-4 Layer | IRGB | IRGBX | IRGBD | RGB | IRGBZ | RGBD | IRGBY | RGBX | RGBZ | RGBY | 8C | IXYZD | XYZD |
| ResNet18 | IRGB | RGB | IRGBZ | RGBD | IRGBD | IRGBX | IRGBY | RGBZ | RGBY | RGBX | 8C | IXYZD | XYZD |
| ResNet50 | IRGB | RGB | RGBZ | RGBD | IRGBD | IRGBZ | RGBX | IRGBX | IRGBY | RGBY | 8C | IXYZD | XYZD |
| ResNet101 | IRGB | IRGBD | RGB | RGBZ | RGBD | IRGBZ | IRGBY | IRGBX | RGBX | RGBY | 8C | IXYZD | XYZD |
| Mobilenetv2 | IRGB | RGB | IRGBZ | RGBD | IRGBD | 8C | RGBX | RGBY | IRGBX | RGBZ | IRGBY | IXYZD | XYZD |
| Xception | IRGB | RGBY | RGB | RGBD | IRGBD | IRGBY | RGBZ | IRGBX | RGBX | IRGBZ | IXYZD | 8C | XYZD |
| Inception-ResnetV2 | IRGB | RGBY | IRGBD | RGBZ | RGBX | IRGBZ | IRGBY | RGB | IRGBX | RGBD | 8C | IXYZD | XYZD |
| HRCNet | IRGB | RGB | IRGBD | RGBD | IRGBZ | RGBY | RGBZ | RGBX | 8C | IRGBX | IRGBY | IXYZD | XYZD |
| Year | mIoU (%) | OA (%) | Man-Made | Natural | High Veg | Low Veg | Buildings | Hard Scape | Scanning Art | Cars | ||
|---|---|---|---|---|---|---|---|---|---|---|---|---|
| Point/discretization-based Methods | SEGCloud [32] | 2017 | 61.3 | 88.1 | 83.9 | 66.0 | 86.0 | 40.5 | 91.1 | 30.9 | 27.5 | 64.3 |
| RF MSSF [33] | 2018 | 62.7 | 90.3 | 87.6 | 80.3 | 81.8 | 36.4 | 92.2 | 24.1 | 42.6 | 56.6 | |
| Edge-Con. [34] | 2019 | 59.5 | 87.9 | 84.5 | 70.9 | 76.6 | 26.1 | 91.4 | 18.6 | 56.5 | 51.4 | |
| ShellNet [35] | 2019 | 69.3 | 93.2 | 96.3 | 90.4 | 83.9 | 41.0 | 94.2 | 34.7 | 43.9 | 70.2 | |
| OctreeNet [36] | 2020 | 59.1 | 89.9 | 90.7 | 82.0 | 82.4 | 39.3 | 90.0 | 10.9 | 31.2 | 46.0 | |
| GACNet [37] | 2020 | 70.8 | 91.9 | 86.4 | 77.7 | 88.5 | 60.6 | 94.2 | 37.3 | 43.5 | 77.8 | |
| RandLA-Net [18] | 2020 | 77.4 | 94.8 | 95.6 | 91.4 | 86.6 | 51.5 | 95.7 | 51.5 | 69.8 | 76.8 | |
| Projection-based Methods | DeePr3SS [16] | 2017 | 58.5 | 88.9 | 85.6 | 83.2 | 74.2 | 32.4 | 89.7 | 18.5 | 25.1 | 59.2 |
| SnapNet [19] | 2017 | 59.1 | 88.6 | 82.0 | 77.3 | 79.7 | 22.9 | 91.1 | 18.4 | 37.3 | 64.4 | |
| XJTLU(Ours) | 2021 | 63.5 | 89.4 | 85.4 | 74.4 | 74.6 | 31.9 | 93.0 | 25.2 | 41.5 | 82.0 |
Publisher’s Note: MDPI stays neutral with regard to jurisdictional claims in published maps and institutional affiliations. |
© 2021 by the authors. Licensee MDPI, Basel, Switzerland. This article is an open access article distributed under the terms and conditions of the Creative Commons Attribution (CC BY) license (https://creativecommons.org/licenses/by/4.0/).
Share and Cite
Cai, Y.; Huang, H.; Wang, K.; Zhang, C.; Fan, L.; Guo, F. Selecting Optimal Combination of Data Channels for Semantic Segmentation in City Information Modelling (CIM). Remote Sens. 2021, 13, 1367. https://0-doi-org.brum.beds.ac.uk/10.3390/rs13071367
Cai Y, Huang H, Wang K, Zhang C, Fan L, Guo F. Selecting Optimal Combination of Data Channels for Semantic Segmentation in City Information Modelling (CIM). Remote Sensing. 2021; 13(7):1367. https://0-doi-org.brum.beds.ac.uk/10.3390/rs13071367
Chicago/Turabian StyleCai, Yuanzhi, Hong Huang, Kaiyang Wang, Cheng Zhang, Lei Fan, and Fangyu Guo. 2021. "Selecting Optimal Combination of Data Channels for Semantic Segmentation in City Information Modelling (CIM)" Remote Sensing 13, no. 7: 1367. https://0-doi-org.brum.beds.ac.uk/10.3390/rs13071367