
Landslide and Wildfire Susceptibility Assessment in Southeast Asia Using Ensemble Machine Learning Methods


1
State Key Laboratory of Earth Surface Processes and Resource Ecology, Beijing Normal University, Beijing 100875, China
2
Academy of Disaster Reduction and Emergency Management, Faculty of Geographical Science, Beijing Normal University, Beijing 100875, China
*
Author to whom correspondence should be addressed.
Remote Sens. 2021, 13(8), 1572; https://0-doi-org.brum.beds.ac.uk/10.3390/rs13081572
Submission received: 26 March 2021
/
Revised: 12 April 2021
/
Accepted: 14 April 2021
/
Published: 18 April 2021
(This article belongs to the Special Issue Advances in Remote Sensing Systems for Disaster Management and Risk Mitigation)
Abstract
:Southeast Asia (SEA) is a region affected by landslide and wildfire; however, few studies on susceptibility modeling for the two hazards together have been conducted for this region, and the intersection and the uncertainty of the two hazards are rarely assessed. Thus, the intersection of landslide and wildfire susceptibility and the spatial uncertainty of the susceptibility maps were studied in this paper. Reliable landslide and wildfire susceptibility maps are necessary for disaster management and land use planning. This work used three advanced ensemble machine learning algorithms: RF (Random Forest), GBDT (Gradient Boosting Decision Tree) and AdaBoost (Adaptive Boosting) to assess the landslide and wildfire susceptibility for SEA. A geo-database was established with 2759 landslide locations, 1633 wildfire locations and 18 predictor variables in total. The performances of the models were assessed using the overall classification accuracy (ACC), Precision, the area under the ROC (receiver operating curve) (AUC) and confusion matrix values. The results showed RF performs superior in both landslide (ACC = 0.81, Precision = 0.78 and AUC= 0.89) and wildfire (ACC= 0.83, Precision = 0.83 and AUC = 0.91) susceptibility modeling, followed by GBDT and AdaBoost. The overall superiority of RF over other models indicates that it is potentially an efficient model for landslide and wildfire susceptibility mapping. The landslide and wildfire susceptibility were obtained using the RF model. This paper also conducted an overlay analysis of the two hazards. The uncertainty of the susceptibility was further assessed using the coefficient of variation (CV). Additionally, the distance to roads is relatively important in both landslide and wildfire susceptibility, which is the most important in landslides and the second most important in wildfires. The result of this paper is useful for mastering the whole situation of hazard susceptibility and proves that RF is a robust model in the hazard susceptibility assessment in SEA.
1. Introduction
Southeast Asia, one of the most natural disaster-prone regions in the world, numerous natural hazards such as floods, earthquakes and heatwaves happen here every year [1,2,3,4]. The landscape in mainland SEA is characterized by mountainous areas [5]. Landslide is a main geological hazard in SEA, having damaging impacts on the safety of life and property [6,7,8]. Additionally, wildfires are frequent in SEA, particularly in Indonesia, and the forests of SEA are represented as increasingly at-risk to fire [9,10]. The extent and severity of wildfire increased with the viability of the climate, and the fire susceptibility in SEA increased [11,12,13]. Wildfires can cause various impacts, including a loss of biodiversity, loss of assets and damage to natural resources and agriculture areas [14,15].
Hazard susceptibility maps are crucial for determining the most susceptible areas where hazards are likely to occur, and multiple studies have implemented landslide and wildfire susceptibility assessment [8,16,17,18]. Research about susceptibility modeling is mainly related to a single hazard. There are plenty of studies focusing on landslides and wildfires separately. Besides, the most current hazard susceptibility studies for landslides and wildfires of SEA were restricted in small regions on a small scale. For example, research has been undertaken on landslide susceptibility assessments for Cameron, in the Highlands area in Malaysia [19,20], in Central Vietnam [21,22] and the north part of Vietnam [23], in the Kelantan River Basin and Peninsular Malaysia [24]. Ngoc Thach et al. [25] analyzed the spatial pattern of fire risk of Thuan Chau in Vietnam, and Tehrany et al. [26] predicted the forest fire susceptibility at the Lao Cai region of Vietnam. Prasertsri and Littidej [27] analyzed the risk of wildfire-prone areas in Thailand. Miettinen et al. [13] assessed the spatiotemporal distribution of vegetation fires in Peninsular Malaysia. Thoha et al. [28] determined the spatial and temporal distributions of forest and land fires in North Sumatera Province, Indonesia. Additionally, landslides and wildfires are often measured separately, while two or more hazards usually cause more severe damage than a single one to human lives, natural resources, the ecosystem and infrastructures.
Precipitation and temperature are expected to increase in SEA, and the increases in rainfall are likely to increase the frequency of landslides in sloping zones, while warm weather may raise the incidence of fire in the forest [29]. Besides, increasing levels of human activities in the mountain forest areas are also likely to increase the incidence of landslides and wildfires [27,29,30]. The soil reinforcement provided by trees can reduce the landslide incidence [31,32,33]. In temperate and tropical Asia, the intensified risk of forest dieback and wildfires are likely to heighten the landslides [29]. SEA is characterized by a high number of mountain ranges and steepness of the landscape [34], where 2.1 million km2 of forests are located [35]. In the mountain zones with steep landscapes and high vegetation covers, landslides and wildfires are both prone to occurrence. Throughout Asia, landslides are often triggered by intense storms and rainfall, while wildfires mostly occur in dry regions [29]. The wildfires can cause hillslope erosion and have an impact on sediment movement, which may cause landslides or debris flow [36]. Di Napoli et al. [37] considered wildfire as a new triggering factor of landlisde susceptibility and found out that the wildfire factor contributes significantly to the final results, and the susceptible areas and the percentage of high landslide susceptibility increased when considering the wildfire as an aditional conditioning factor. It is worth studying the two hazards in conjunction to see whether some zones in SEA are susceptible to both hazards.
A wide range of techniques has been developed for hazard susceptibility modeling and mapping. In general, there are mainly four types of approach for assessing the hazard susceptibility: opinion-driven models, physical-based models, statistical models and machine learning (ML) models [8,17,38]. Lately, machine learning has become the keystone in solving the spatial modeling problem in the field of natural hazards [8,39]. Herein, the ensemble machine learning algorithms, combining multiple individual classifiers together, are demonstrated to have improved results [23,40,41], in which Boosting and Bagging are two representative techniques of ensemble machine learning. Various studies have shown that Random Forest (RF), Gradient Boosting Decision Tree (GBDT) and Adaptive Boosting (AdaBoost) perform well in hazard susceptibility modeling and mapping [23,41,42,43,44]. AdaBoost is the most widely used Boosting algorithm involving an adaptive resampling method with enhanced predictive ability [40,45]. GBDT is also a representative Boosting algorithm, which is an iterative decision tree algorithm, and the results of all trees are aggregated as the final result with high precision [40,46]. The GBDT model has often been implemented for various hazard susceptibility mappings [47,48]. RF, based on Bagging and random feature selection, is a popular machine learning method and is known to provide high accuracy rates [17,49]. Several studies have successfully carried out studies on landslides and wildfire susceptibility modeling and mapping using RF [8,50], GBDT [46,47] and AdaBoost [26,43,51].
However, uncertainties in the susceptibility information can cause undesirable social costs [52], while the spatial uncertainty of the susceptibility map yielded by the models is rarely evaluated. It is crucial to quantifying the uncertainty for the reliability of the susceptibility map, so that the susceptibility map can provide reliable scientific information that can support the identification of hazard-prone areas [52,53]. To overcome the above limitations, landslides and wilfires were studied together for SEA based on machine learing models, and the spatial uncertainty of the susceptibility maps was evaluated to ensure the reliability of the model.
In this paper, three advanced ensemble machine learning techniques, namely RF, GBDT and AdaBoost, were employed to construct the susceptibility models for landslides and wildfires using the geological, topographical and meteorological conditioning factors in SEA. The input datasets were randomly and repeatedly portioned into 70% training set and 30% testing set. The models were compared using accuracy statistics, and the most reliable and suitable model was chosen for generating susceptibility maps for SEA. This work overlaid the two natural hazards together to find out the intersection between them. Then, the uncertainty of the landslide and fire susceptibility maps were analyzed. The main objectives of this paper are to develop a suitable model for landslide and wildfire susceptibility assessment and generate reliable landslide and wildfire susceptibility maps and evaluate the uncertainty of the susceptibility map. The acquired results in this paper could provide support for decision-makers and planners to make suitable future development schemes.
2. Materials and Methods
The materials used in this paper mainly involve the conditioning factor and the hazard inventories. Machine learning methods should be incorporated with the historical hazard inventory and the dependent factors to develop a rational model for the susceptibility assessment. Three advanced ensemble machine learning methods were employed (i.e., GBDT, RF and AdaBoost).
2.1. Study Area
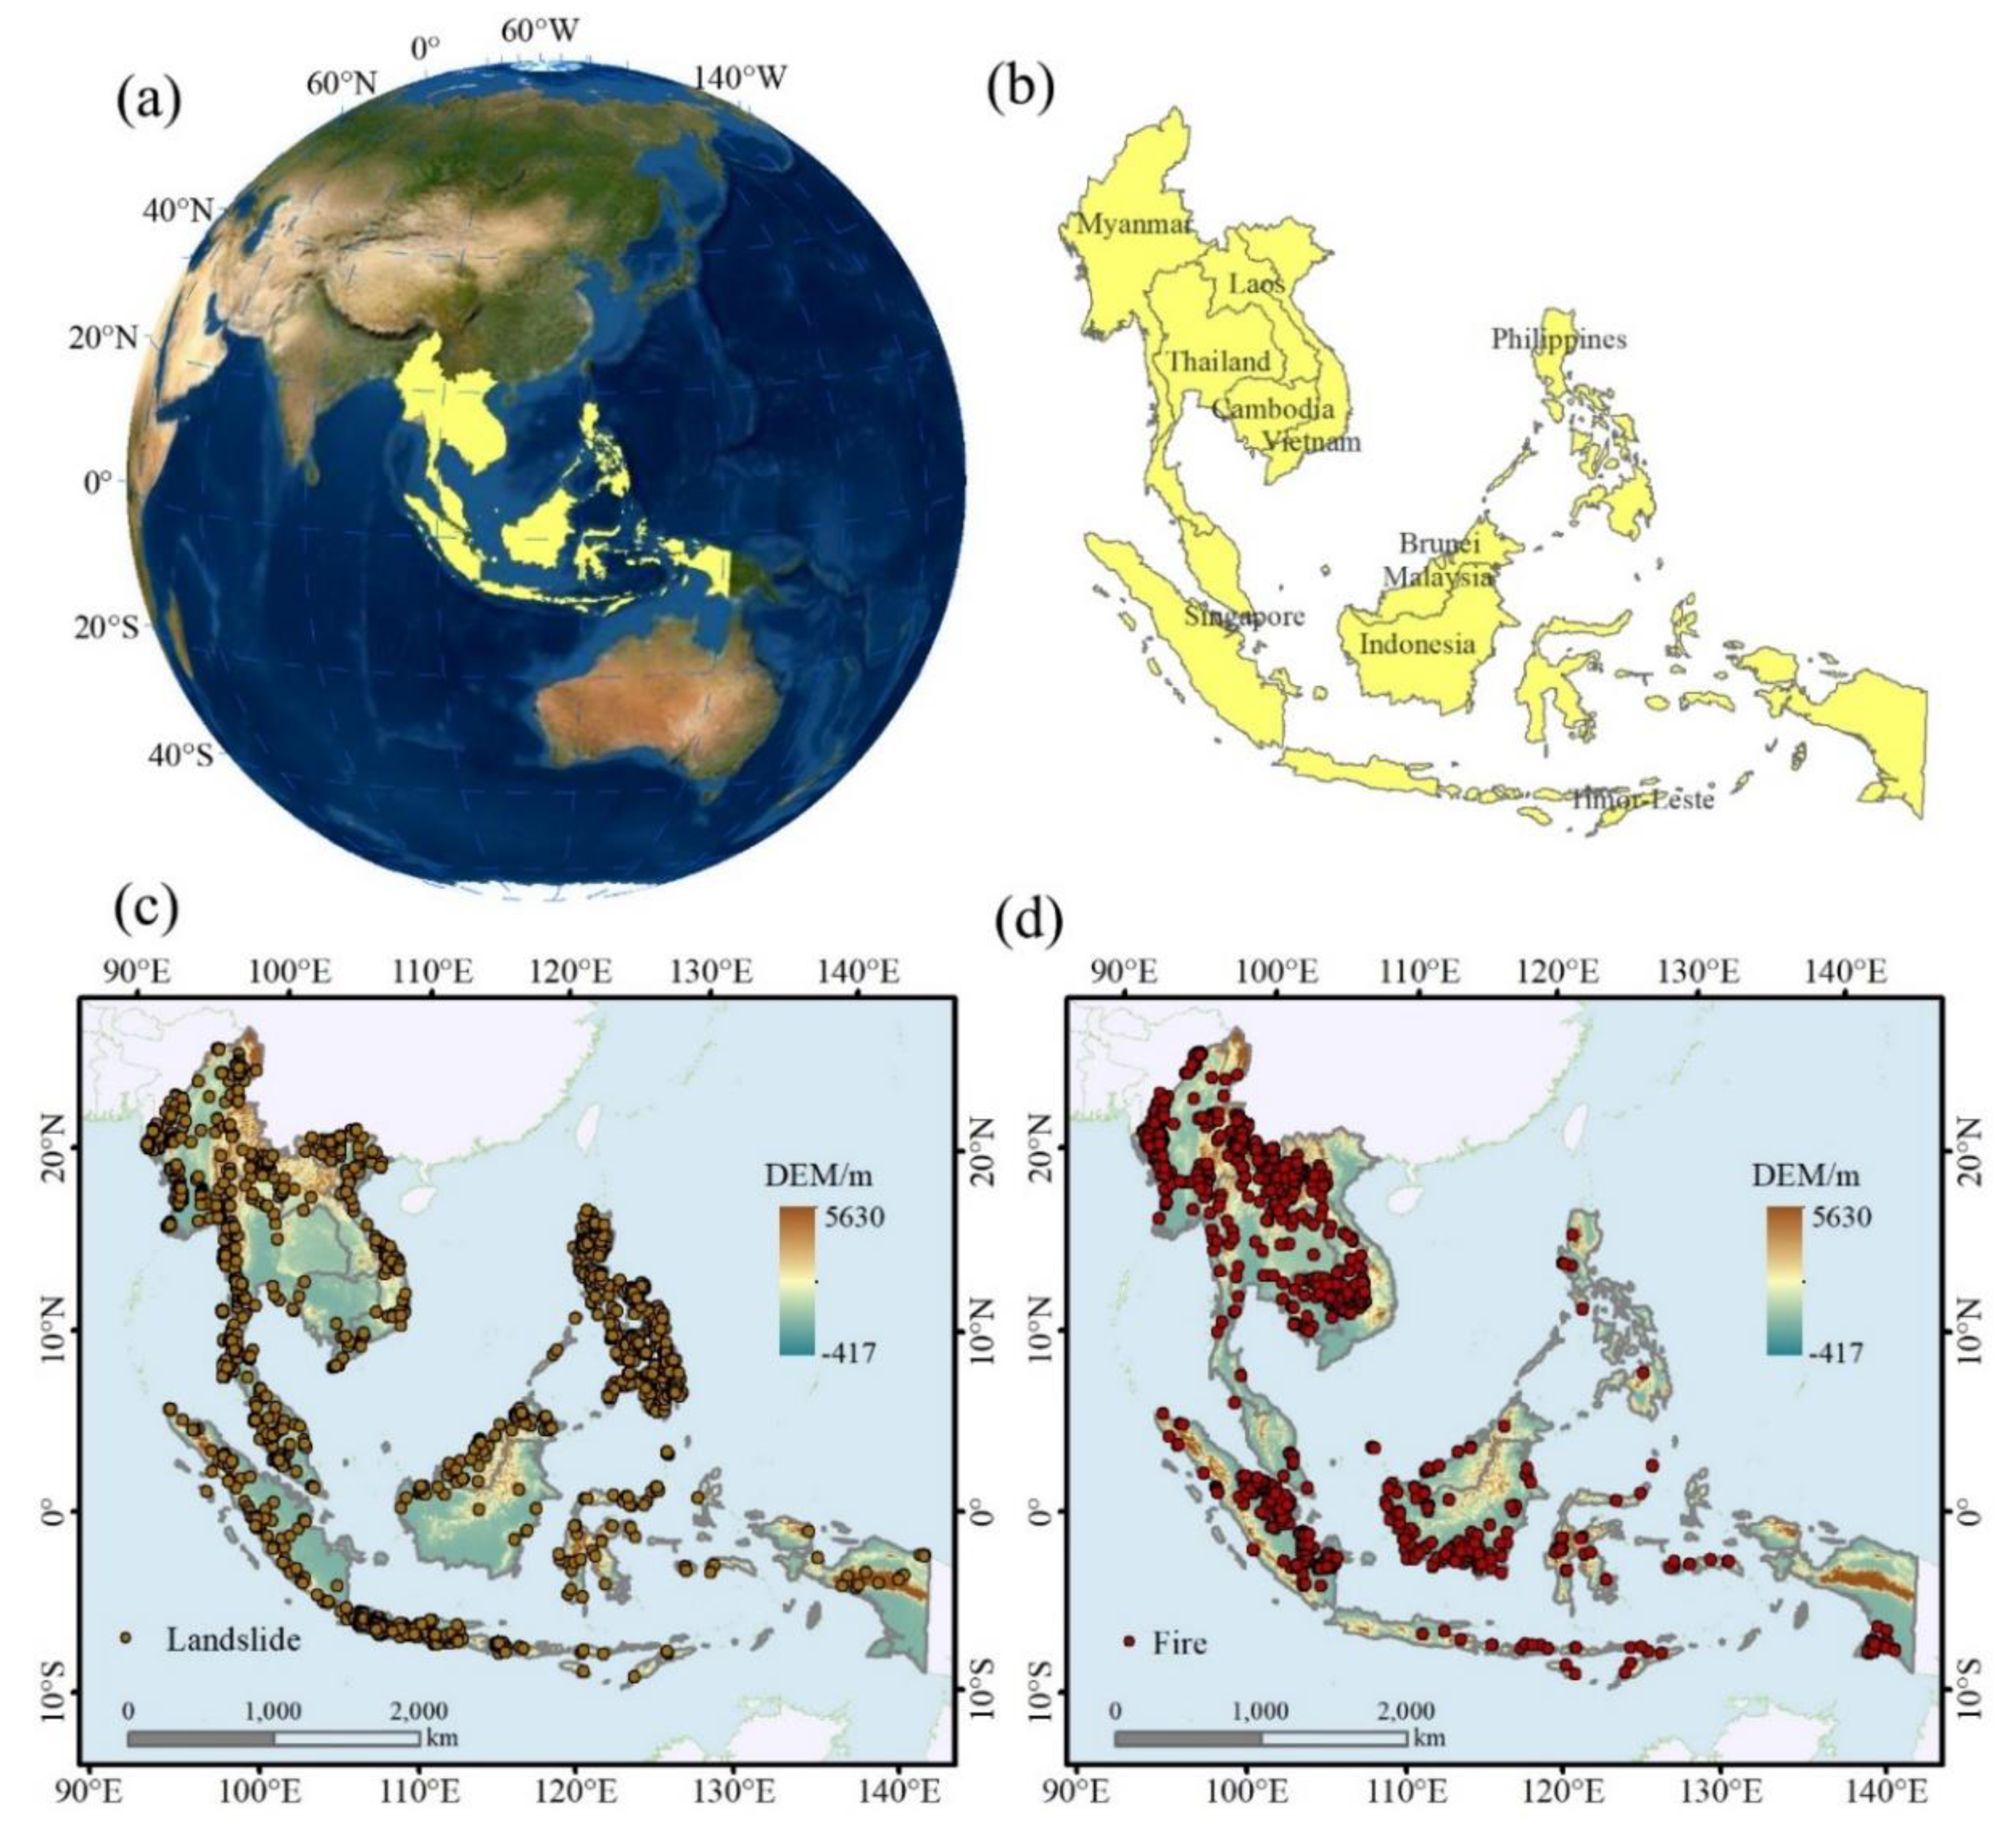
Southeast Asia is located on several plates and lies between the Indian and Pacific Oceans, covering about 4.5 million km2 (Figure 1). SEA includes 11 countries: Brunei, Cambodia, East Timor, Indonesia, Laos, Malaysia, Myanmar, Philippines, Singapore, Thailand and Vietnam. Southeast Asia is one of the most disaster-prone areas in the world [54], where earthquakes, volcano eruptions, tsunami and seasonal typhoons occur. The vast majority of SEA falls within the warm, humid tropics with plentiful rainfall. The climates in SEA are dominated by the tropical monsoon climate, tropical dry and wet monsoon climates and tropical rainforest climate. SEA is 80% mountains and hills, and the region has high temperatures and abundant rainfall most of the time [55,56].
As a consequence, landslides are prone to happening. Landslides, usually triggered by heavy rains and seismic activities, are very common in SEA, where large number of mountains and steep landscapes exist. Located in an active seismic area, deadly landslides almost happen in Indonesia and the Philippines every year. The landslide disaster happening in SEA in 2006 was regarded as the deadliest one worldwide, which resulted in 1126 deaths [9].
Vegetation fires are a common phenomenon in many regions in the world, including SEA [57]. Wildfires in SEA are destructive. They happen particularly frequently in Indonesia (Sumatra and Borneo) [9]. The impact of wildfires is not exclusive to the regions where fires happen. The ashes from fires can spread expansively to other places, causing tremendous immediate and long-term effects. The 1997 Indonesian wildfire was one of the worst forest fires in recorded history, engulfing over 12 million acres of Indonesia [9,58].
2.2. Data Preparation
The quantitative assessment of landslide and wildfire susceptibility includes two aspects of data: landslide and wildfire occurrences and geo-environmental and antropogenic predisposing factors.
2.2.1. Hazard Inventories
Disaster inventories, showing the locations of existing disasters, include landslide and fire inventories. The MODIS Collection 6 fire archive was used in this paper for wildfire susceptibility model construction [57,59]. MODIS hotspots have been adopted by many researchers for susceptibility mapping [60,61]. The fire products were downloaded from Fire Information for Resource Management System (FIRMS). This product provides confidence levels of fire pixels, and we discarded all fires with confidence criteria less than 100%. Specific to this research, we collected fire data from 2010 to 2019, and the total number of fire points was 1633.
Landslide inventories were obtained from the Global Landslide Catalogue (GLC) established by Kirschbaum [62]. The GLC was compiled from online disaster databases, scientific reports and other sources available, mainly consisting of landslides triggered by rainfall [63]. Two thousand seven hundred and fifty-nine landslide events within the study area with a spatial accuracy of 1 km or better within SEA were selected.
Unbalanced numbers of positive and negative samples led to a bad performance of the model [64]; thus, we randomly sampled nonhazard points in the disaster-free zones with the same number as the hazard points to ensure the reliability of the susceptibility assessment. The whole hazard dataset, including the positive and negative samples (i.e., the presence and absence of the landslide or fire), was divided into a training dataset and testing dataset.
Before assessing the hazard susceptibility, the conditioning factors and disaster inventories were prepared in the database. All the data used for extracting the conditioning factors for landslides and wildfires, as well as the hazard inventories, are listed in Table 1.
2.2.2. Conditioning Factors
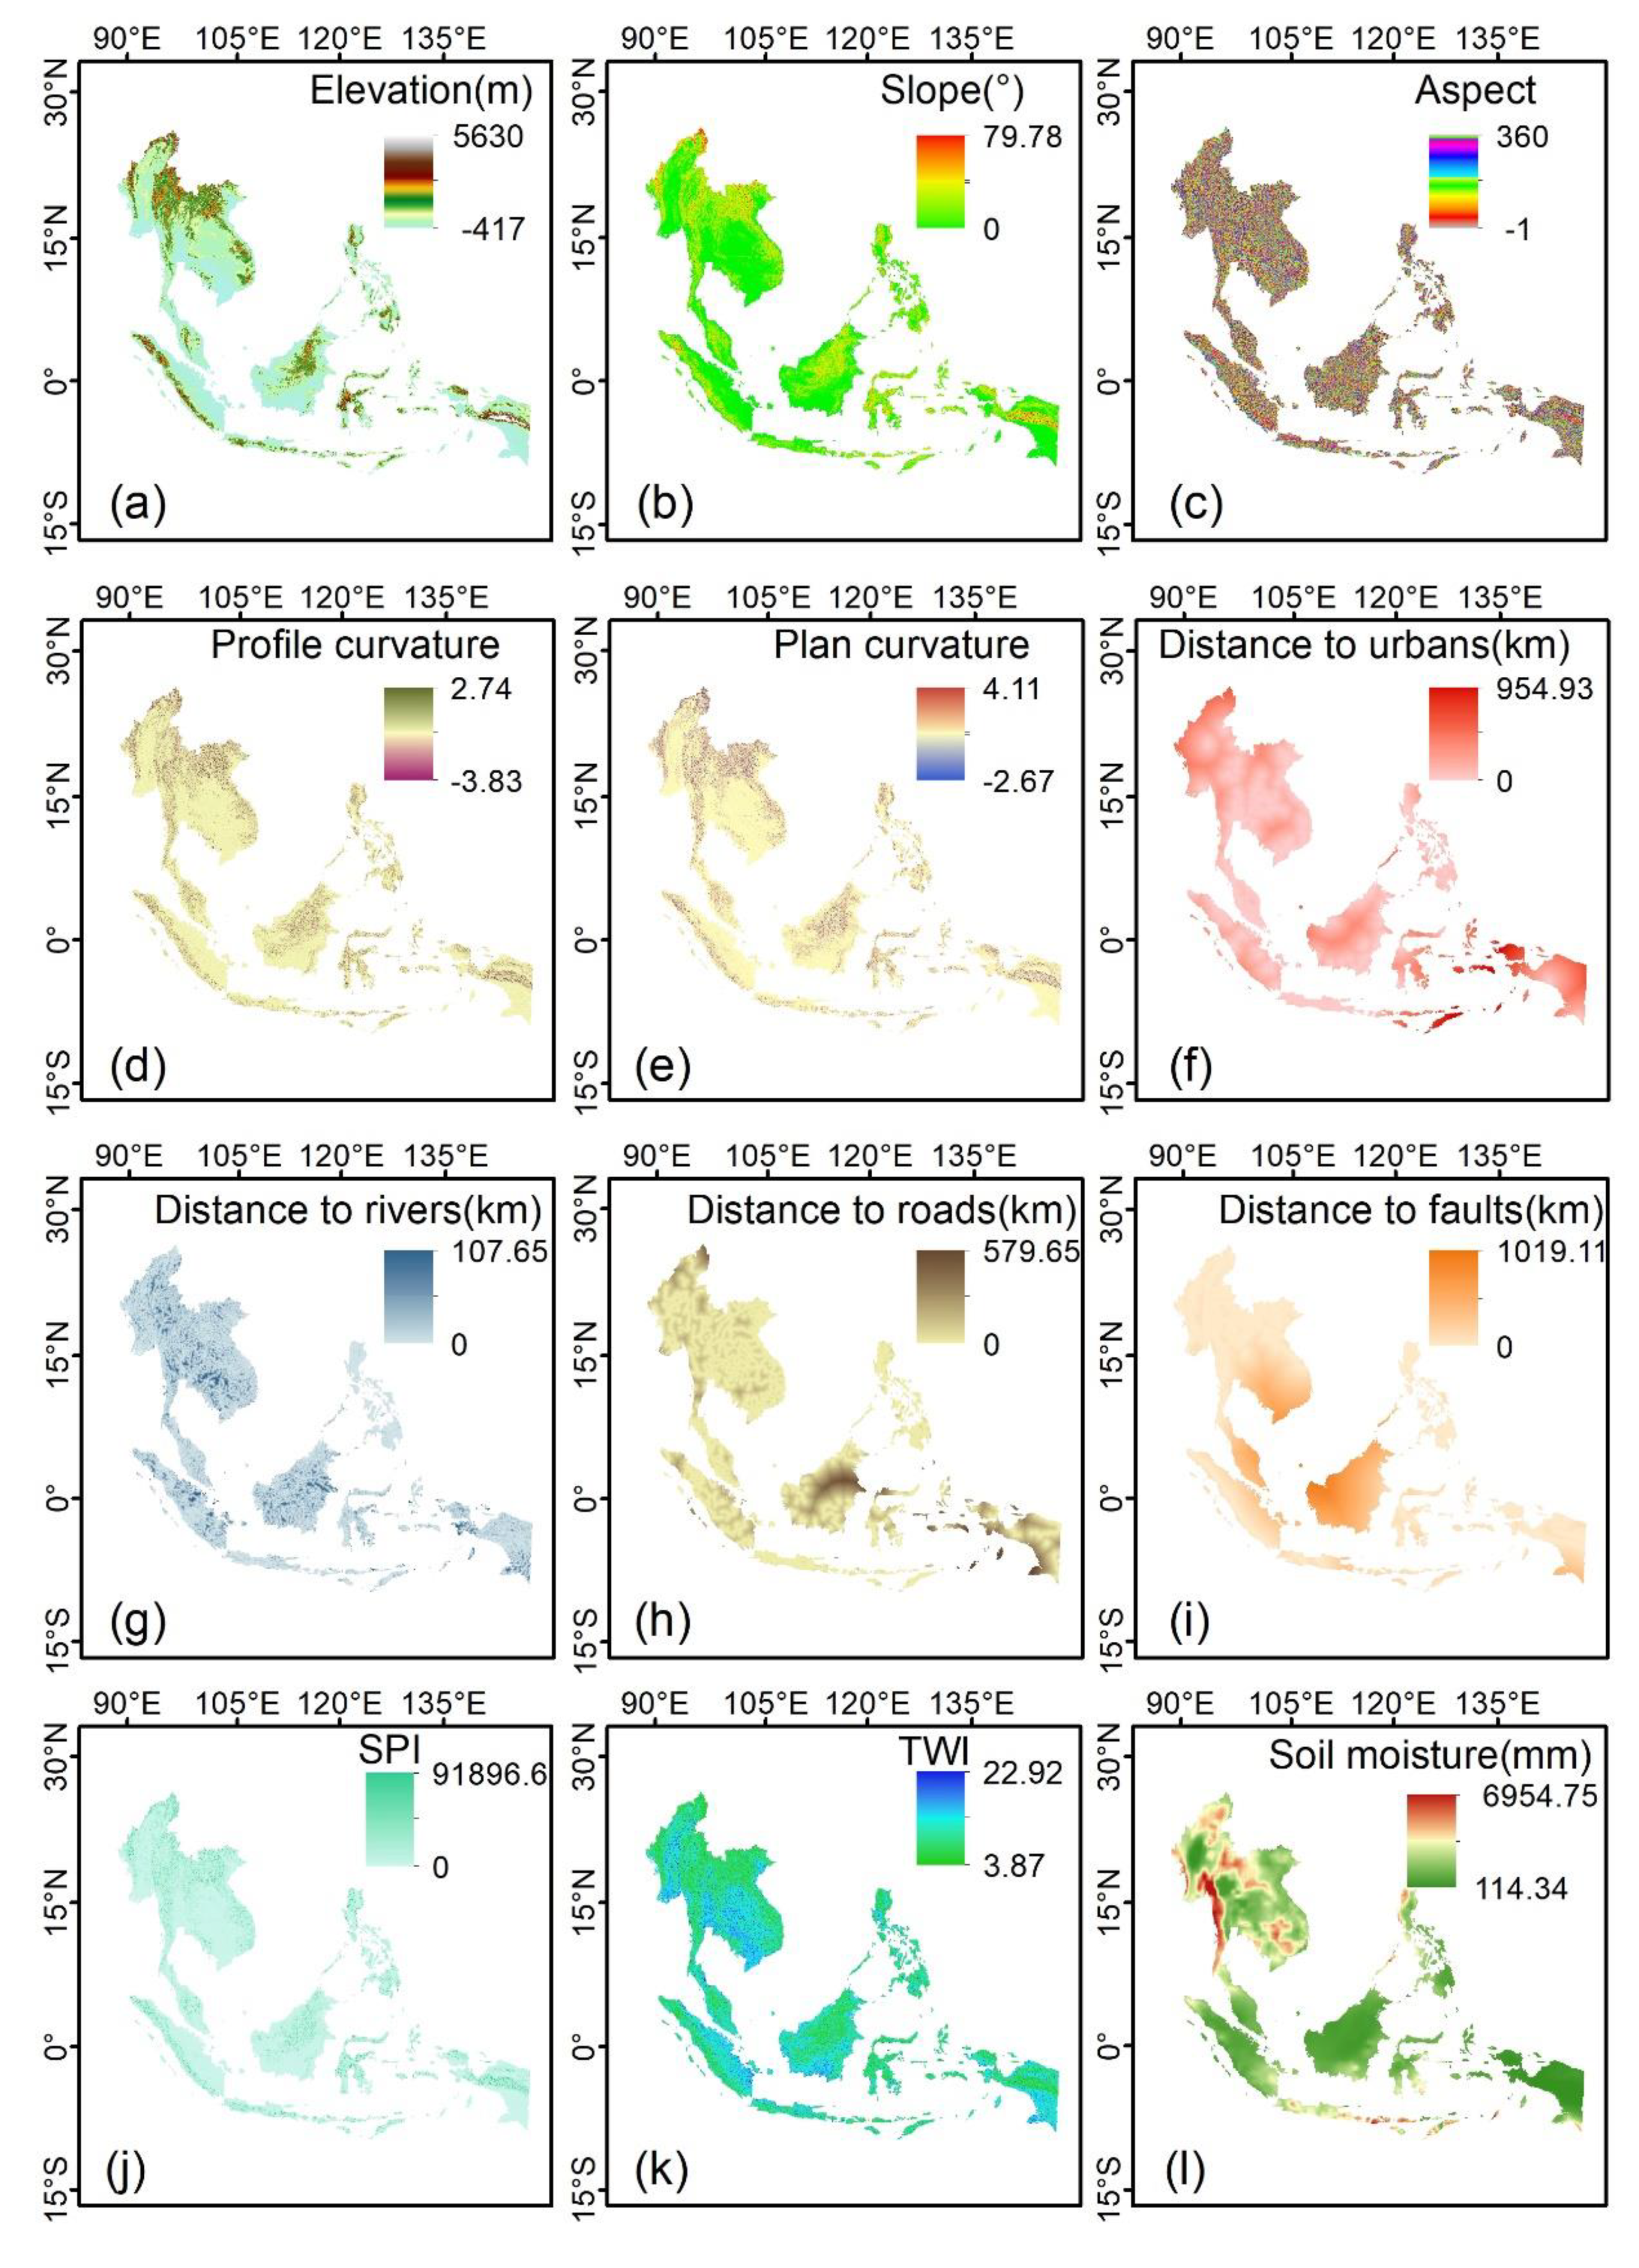
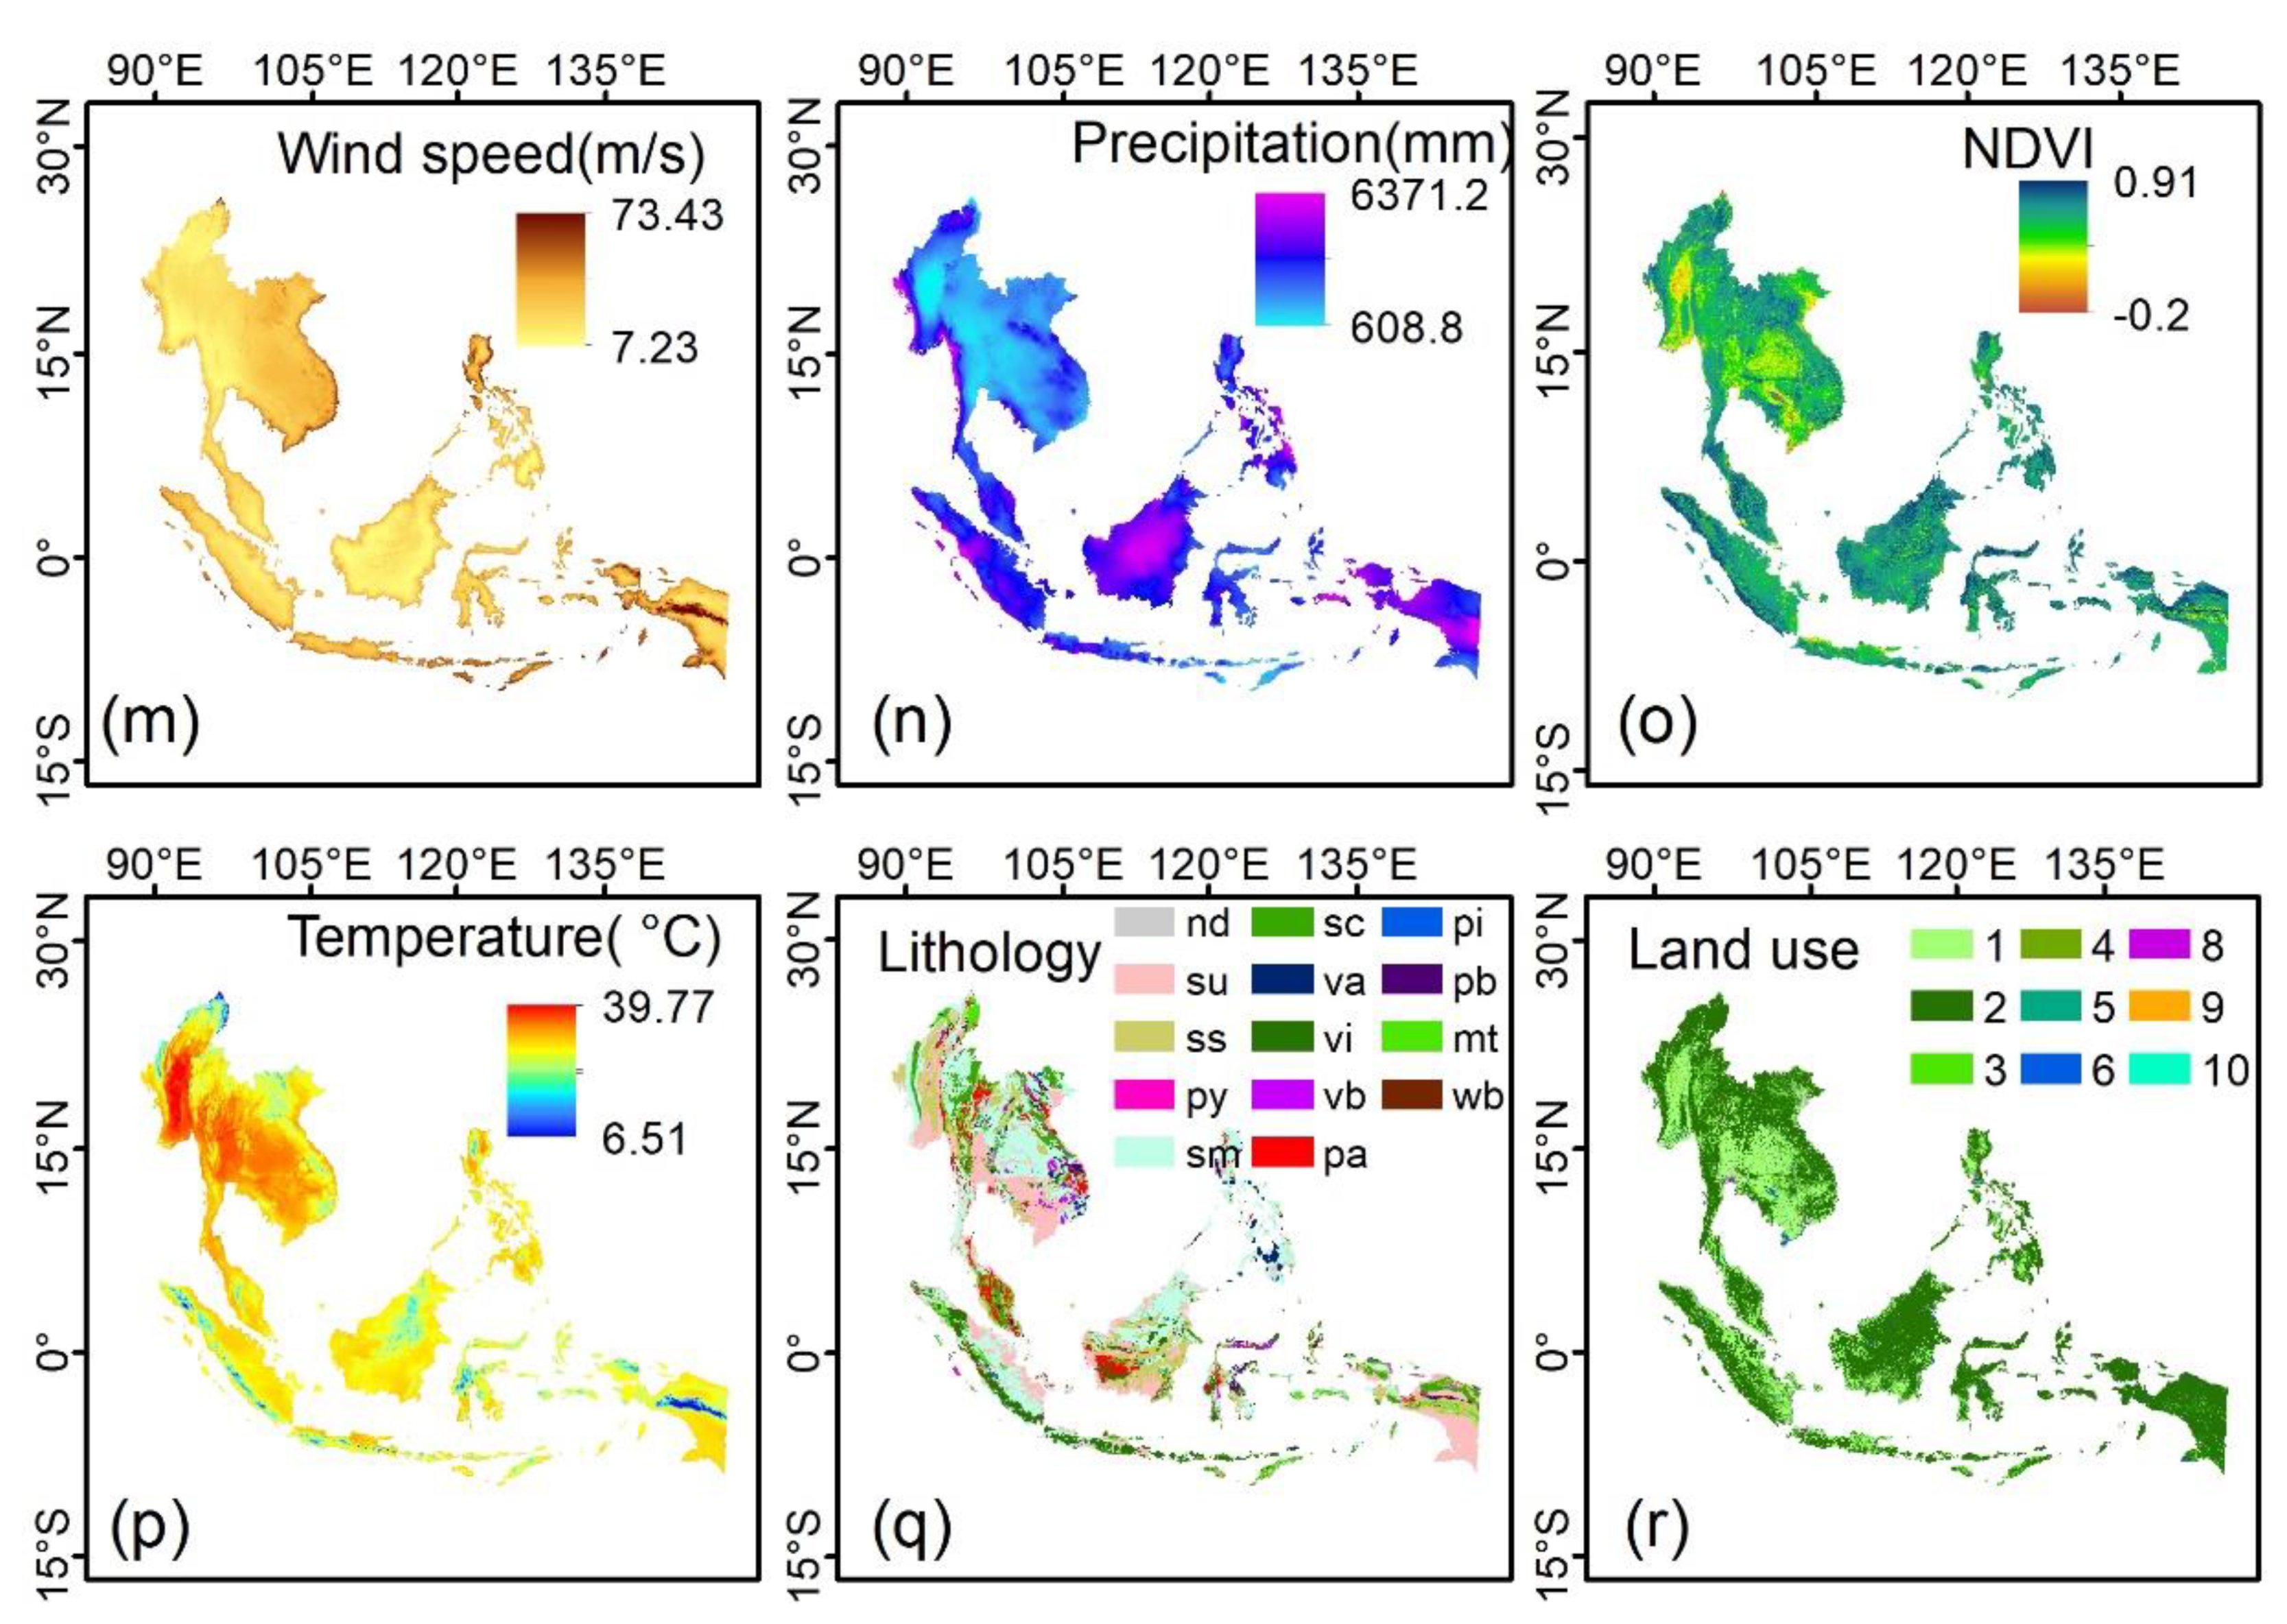
Conditioning factors are crucial for hazard susceptibility modeling and mapping. The factors were selected considering the characteristics of SEA, and data availability referring to the information collected from the literature [8,17,25,26,72]. In this paper, 18 conditioning factors in total were chosen for the hazard susceptibility assessment—namely, elevation, slope, aspect, plan curvature, profile curvature, TWI (Topographic Wetness Index), SPI (Stream Power Index), NDVI (Normalized Difference Vegetation Index), annual mean precipitation, annual mean maximum temperature, soil moisture, wind speed, lithology, land use, distance to roads, distance to rivers, distance to faults and distance to urban areas (Figure 2). The temperature, precipitation, windspeed and NDVI factors are the annual mean values. The separate conditioning factors used for landslides and wildfires are listed in Table 2. A database containing 18 factors and hazard inventories based on the geographic information system (GIS) was generated. All thematic layers are projected using coordinate system UTM zone 50N with a Datum of WGS 1984, and the spatial resolution is 1 km×1 km. The factors have categorical (i.e., lithology and land use) and continuous data. Some factors are pertinent to determining both hazards, and some of these are relevant to one hazard (Table 2) and were, thus, only incorporated into the risk models for which they were relevant. The relationship between hazard and nonhazard with the conditioning factors is shown in Supplementary Figures S1 and S2.
2.2.3. Multicollinearity Test for the Conditioning Factors
Multicollinearity checking of conditioning factors is necessary for the studies of susceptibility mapping, since the multicollinearity may disturb the prediction and cause some error in the results [73,74]. Multicollinearity happens when input datasets are highly correlated, which can cause erroneous modeling [17]. Variance Inflation Factors (VIF) and Tolerance (TOL) were used to detect and quantify the multicollinearity [17,75]. VIF < 10 or TOL > 0.1 denoted a problem of multicollinearity [76,77]. As a result, there were no multicollinearities among the factors selected for each hazard (Supplementary Tables S1 and S2). The low VIF and high TOL values of the factors indicated that the conditioning factors for each hazard were properly selected.
2.3. Methods
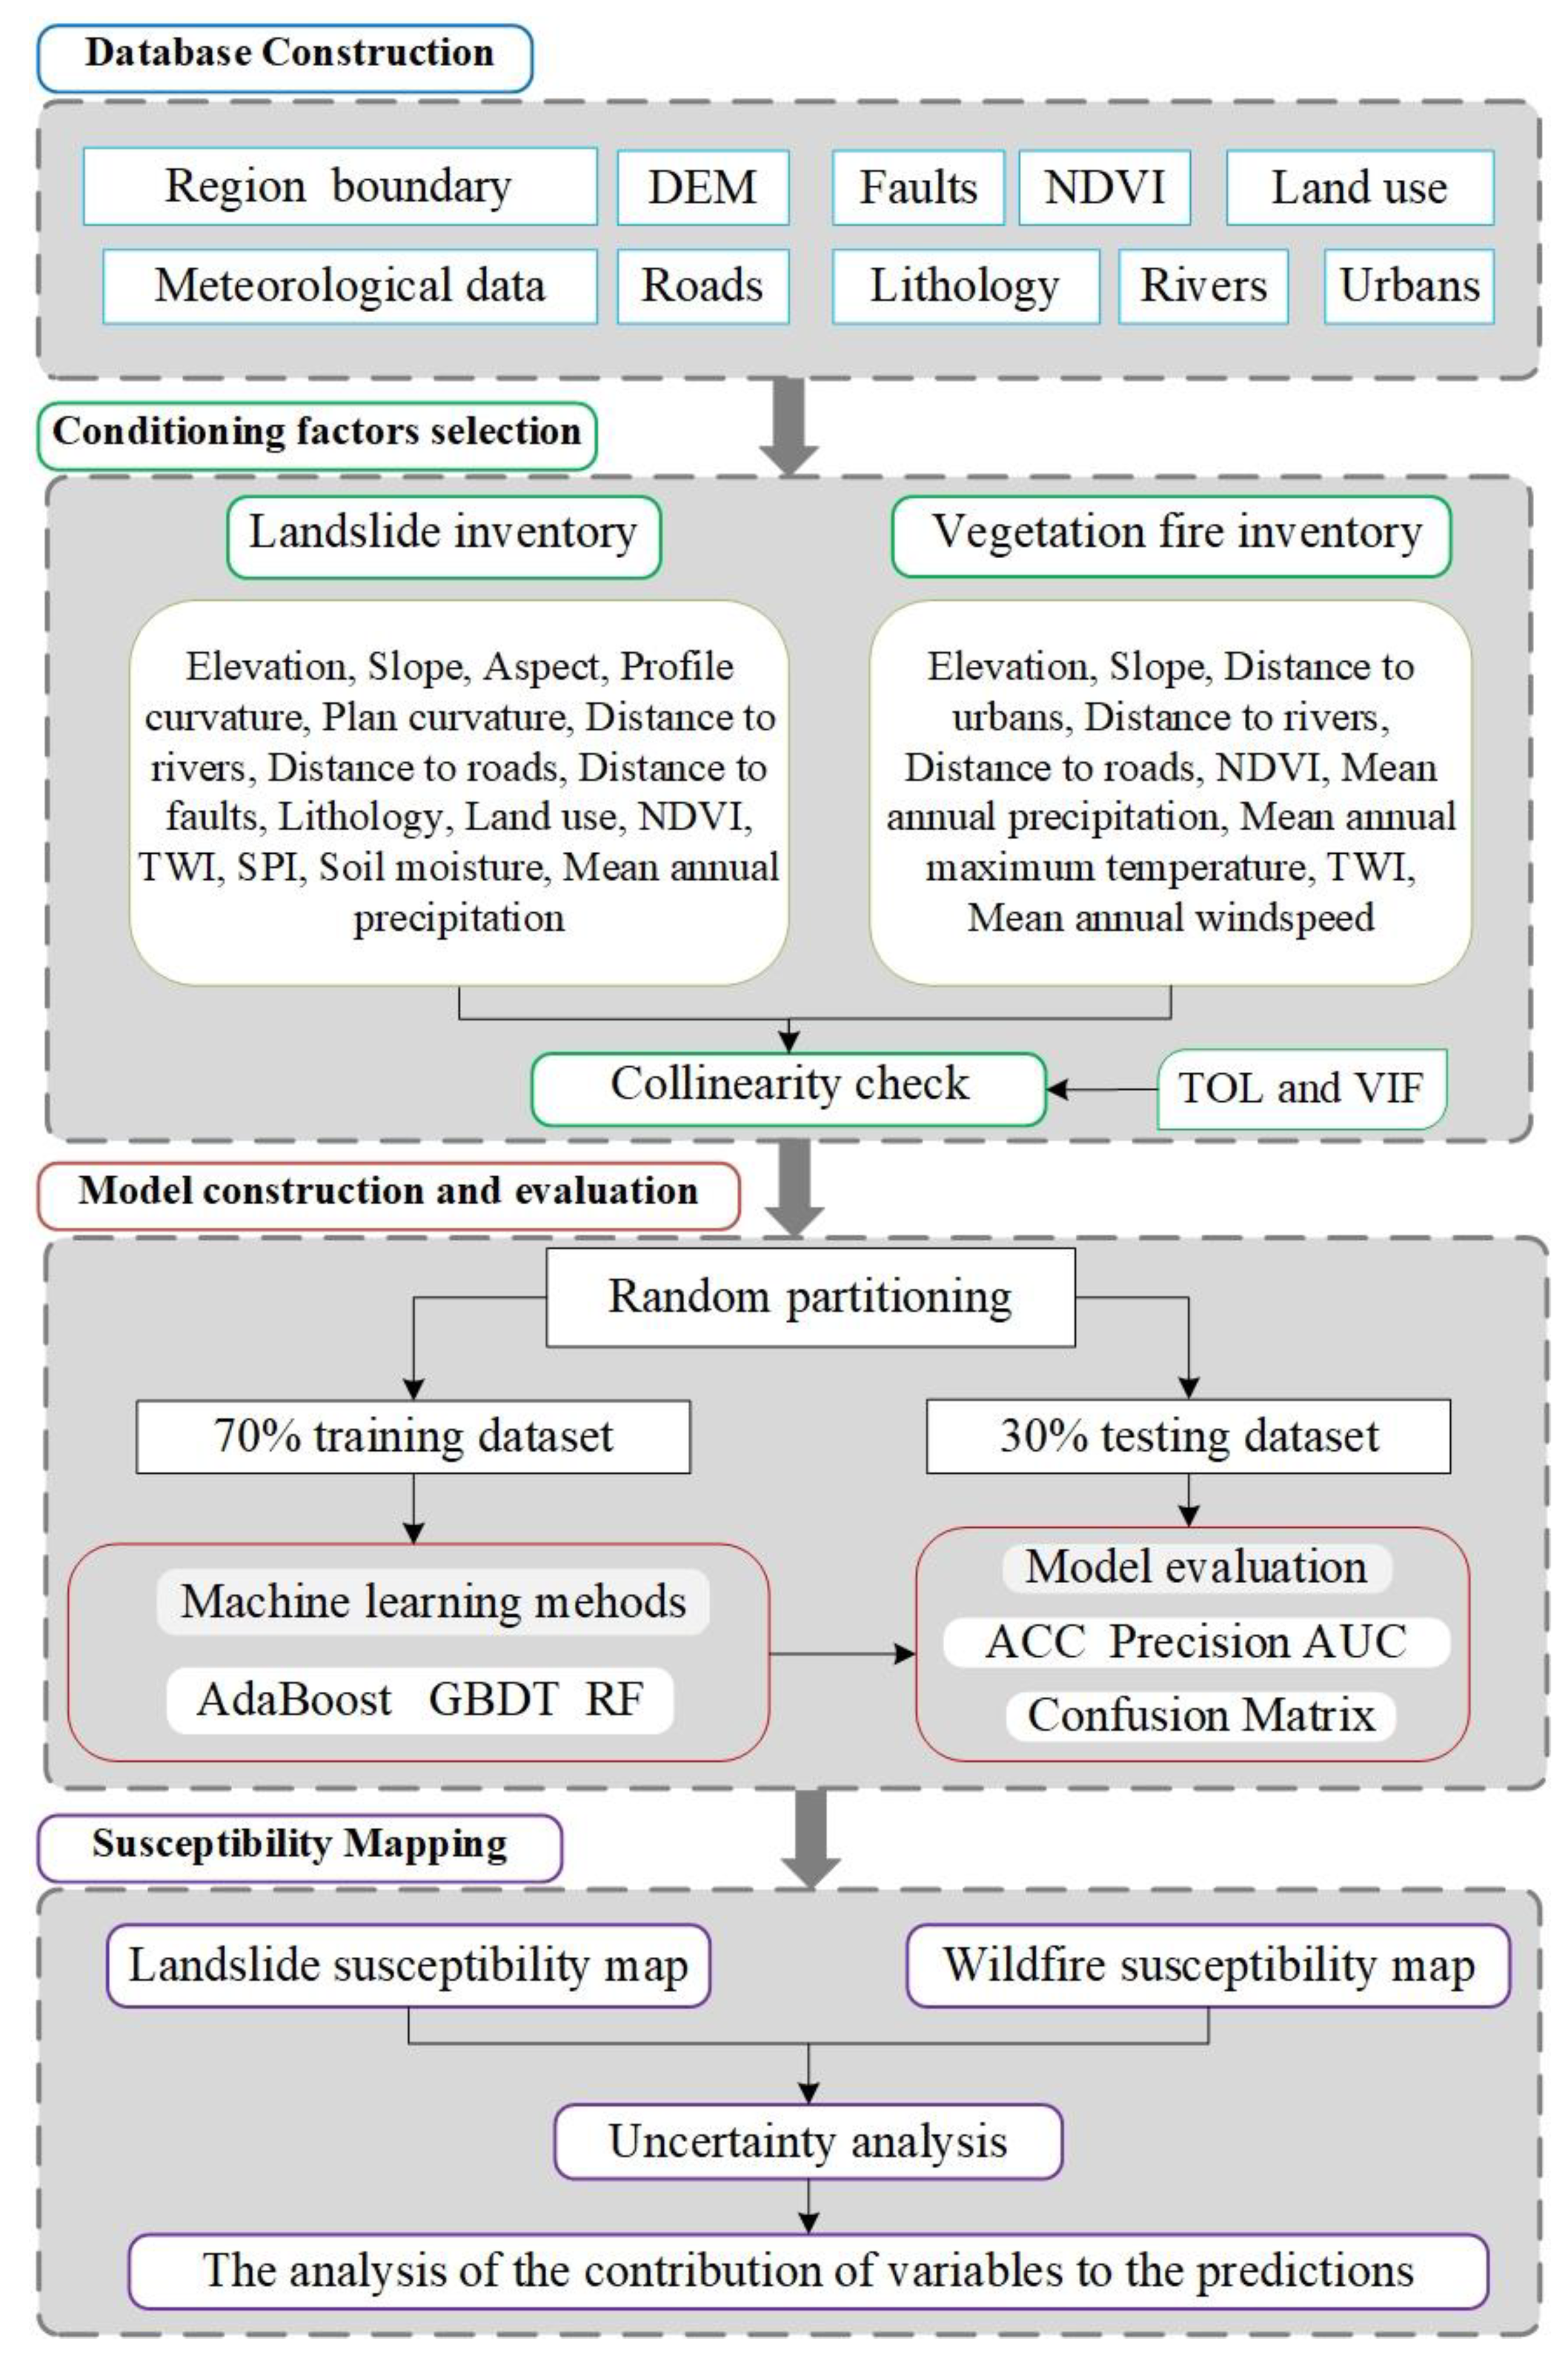
Three different ensemble machine learning methods—specifically, AdaBoost, GBDT and RF—were adopted for our research. The scheme of the hazard susceptibility modeling and mapping are presented in Figure 3, and the main procedures are described as follows.
- (1)
- Firstly, we constructed a spatial database collecting the basic environmental data, as well as the landslide and fire inventories.
- (2)
- Secondly, we used the prepared data to extract conditioning factors from the environmental data for landslide and wildfire susceptibility modeling separately. Then, a multicollinearity test on those factors was performed using VIF and TOL.
- (3)
- Thirdly, we randomly portioned the dataset into a training dataset and testing dataset. The dataset was first shuffled and then split randomly into training (70%) and testing (30%) data in Python.The target class value (i.e., hazard point) is 1 if the samples are disaster-positive; otherwise, the class value is set to “0”. The ratio between training and validation is 70% and 30% [8,64,78]. The models were run 30 times with different hazard data combinations using AdaBoost, GBDT and RF, and, every time, the input data were split into 70% for training and 30% for testing. After developing the models, evaluation of the model accuracy and comparison between models was implemented, using AUC, Precison, ACC and confusion matrix statistics.
- (4)
- Next, the model predictive capability was compared, and the best-performed model was used to generate the susceptibility maps for the two hazards. Then, we carried out an overlay analysis to evaluate the susceptibility of the two hazards. Additionally, we computed the CV to assess the uncertainty of the results. The susceptibility map intersected with the uncertainty map based on a matrix-based method to assess the reliability of the best model. Additonally, the relative importance of every conditioning factor for each hazard was obtained.
Machine learning methods should be incorporated with the historical hazard inventory and geo-environmental factors to develop a rational model for the susceptibility assessment. Three advanced ensemble machine learning methods were employed for hazard susceptibility mapping, including AdaBoost, GBDT and RF. All the algorithms were implemented based on Python language. Depictions of the three machine learning methods are presented as follows.
2.3.1. AdaBoost
AdaBoost was introduced by Freund and Schapire [79]. AdaBoost is the most popular boosting approach, involving the application and an adaptive resampling technique and having enhanced predictive capability, as it controls bias and variance [45,51]. It is an iterative algorithm dealing with binary classification. The basic idea of AdaBoost is to train several different weak classifiers for the training dataset and then combine these weak classifiers to form a strong classifier. Weak classifiers with low error rates account for a larger proportion of the final classifier. First, the weight values are assigned to instances in the training dataset, and then, the weights are replaced during the iterations by reducing the weights of correct classified samples and increasing the weights of wrong classified samples in the last iteration [44]. When optimal weights have been assigned, the learning process ends to obtain the best performance of the base classifier [44]. AdaBoost can adaptively adjust the weak errors of the weak classifier and form a stronger final classifier by combing the weak classifiers; the accuracy of the strong classifier is based on those weak classifiers. This process can reduce the bias and variance and, thus, improve the classification ability and have higher effectiveness [51]. Different from other methods, it also increases the weight of the samples that are misclassified during training and then learns again to continuously improve the accuracy. AdaBoost is sensitive to the outliers, so that outliers may affect the accuracy of the final learner. In this paper, we set the maximum number of iterations as 500 and the learning rate as 0.8, and we used the classification effect of the sample set as the weight of the weak classifier.
2.3.2. Gradient Boosting Decision Tree
GDBT is an ensemble machine learning method combining multiple decision trees based on the Boosting concept [46]. It continuously improves the prediction accuracy through interactions. A new decision tree was established in the gradient direction of the reducing residuals in each iteration [80]. The basic idea of GBDT is to build several weak classifiers and finally combine them to form a strong classifier after multiple iterations. Each iteration is to improve the previous results and reduce the residuals of the previous model. The overall performance of GBDT becomes better, because the errors of the decision trees are compensated by each other [48]. GBDT belongs to Boosting ensemble learning. Compared with the AdaBoost algorithm, GBDT is improved by calculating the negative gradients instead of adjusting the weights of the misclassified samples [81]. Different from the AdaBoost algorithm, the weak classifiers of GBDT are dependent and connected [82]. The prediction results are finalized based on the sum of the weak classifiers. GDBT is one of the best algorithms fitting the real distributions and has a strong generalization ability and can be used for classification problems [81]. The maximum number of iterations was set to 100, and the learning rate is 1 when taking the data into account.
2.3.3. Random Forest
RF [83] belongs to ensemble learning methods aggregating a bunch of CART decision trees for classification and prediction. RF is the most common bagging model, combining bagging ensemble learning and the random subspace method, which is resistant to overfitting [8]. In the classification problem, different subsamples of the datasets and different subsamples of features are used to train several decision trees, and majority voting defines the class [75]. Subsamples of the dataset are produced using the bootstrap resampling method [64]. RF is one of the most frequently used machine learning algorithms in multiclassification and prediction research [77]. The input data for RF do not need to be scaled, transformed or modified, and RF can resist outliers in predictive variables and automatically deal with missing values [8]. In the process of classification, RF can also get the importance of every input factor by the Information Gain (IG), Gain Rate, Gini Index or the chi-square test.
2.4. Factor Importance
The mean decrease Gini Index of RF was used to determine the relative importance of the variables. The factor importance is of vital importance for identifying the contribution of each factor and, hence, determining their role in the model [8]. The random forest technique was utilized to evaluate the relative importance of all the conditioning factors [8,73]. Natural hazards are generally influenced by multiple conditioning factors. Therefore, measuring the relative importance of the conditioning factors is crucial for understanding the hazard risk patterns [84,85].
2.5. Model Performance and Accuracy Assessment
In this paper, hazard susceptibility modeling and mapping is a classification problem, with binary outcomes of the presence and absence of hazards, meaning that measurements assessing the model performance by evaluating the prediction results and accuracy are important [17]. In the literature, the overall accuracy (ACC), precision and the area under the ROC curve (AUC) are considered the main metrics by which to evaluate the overall results [8,17,86]. In addition, the confusion matrix is also implemented as a further metric to evaluate the model performances quantitatively and graphically.
In classification problems, each class is either positive (hazard) or negative (nonhazard). ACC is a statistical index of the model’s overall performance, which is defined as the percentage of correctly classified samples (Equation (1)). Precision can be regarded as a measure of exactness, which indicates the percentage of samples predicted as positive are exactly positive (Equation (2)). The AUC is a useful accuracy statistic for the susceptibility analysis [8,87]. The 30% testing data that were not used previously in the model establishment process were employed to evaluate the model capability. ACC depicts the number of correctly classified samples of both hazard occurrence and nonoccurrence, ranging from 0 to 1, and the larger the AUC values, the better the model performs. The AUC can be interpreted as follows as reflecting the model performance: excellent (0.9–1), very good (0.8–0.9), good (0.7–0.8), medium (0.6–0.7) and poor (0.5–0.6) [17,88]. In addition, the contingency/four-fold plot summarizing the numbers of TP, TN, FP and FN is used to graphically evaluate the model predictive ability [89,90], and the larger proportion of TP and TN indicates a better model.
The mathematical Expression (1) for ACC and Expression (2) for Precision are:
where ACC is the overall accuracy, and Precision denotes the fraction of true landslide instances among the samples classified as positive. TP (true positive) and TN (true negative) are the number of hazard and nonhazard samples that are correctly classified, respectively. Conversely, FP (false positive) and FN (false negative) are the hazard and nonhazard samples that have been falsely classified, respectively.
3. Results
The results of this paper primarily include comparing the performances of the susceptibility models, generating susceptibility maps for landslides and wildfires, evaluating the uncertainty of the susceptibility maps and analyzing the relative importance of the conditioning factors for landslides and wildfires.
3.1. Evaluation of the Models
According to the accuracy measures in Table 3, the RF model had the best performance in both the landslide and wildfire susceptibility assessments, followed by GBDT and AdaBoost. RF has the highest ACC, Precision and AUC values (ACC = 0.81, Precision = 0.78 and AUC = 0.89 in landslides and ACC = 0.83, Precision = 0.83 and AUC = 0.91 in wildfires). A higher AUC means a higher model accuracy. As can be seen from Table 3, the AUC values of all three models are greater than 0.8, indicating that the three machine learning models performed well in the landslide and wildfire susceptibility modeling. The three accuracy measures have the same order of model performance. Compared with RF and GBDT, AdaBoost has the lowest accuracy values in landslides (ACC 0.77, Precision 0.75 and AUC 0.86) and wildfires (ACC 0.74, Precision 0.72 and AUC 0.81). In addition, AdaBoost performed better in landslides than wildfires, while GBDT and RF are better in wildfires. Overall, RF performed well in the landslide susceptibility assessment and performed excellently in the wildfire susceptibility assessment.
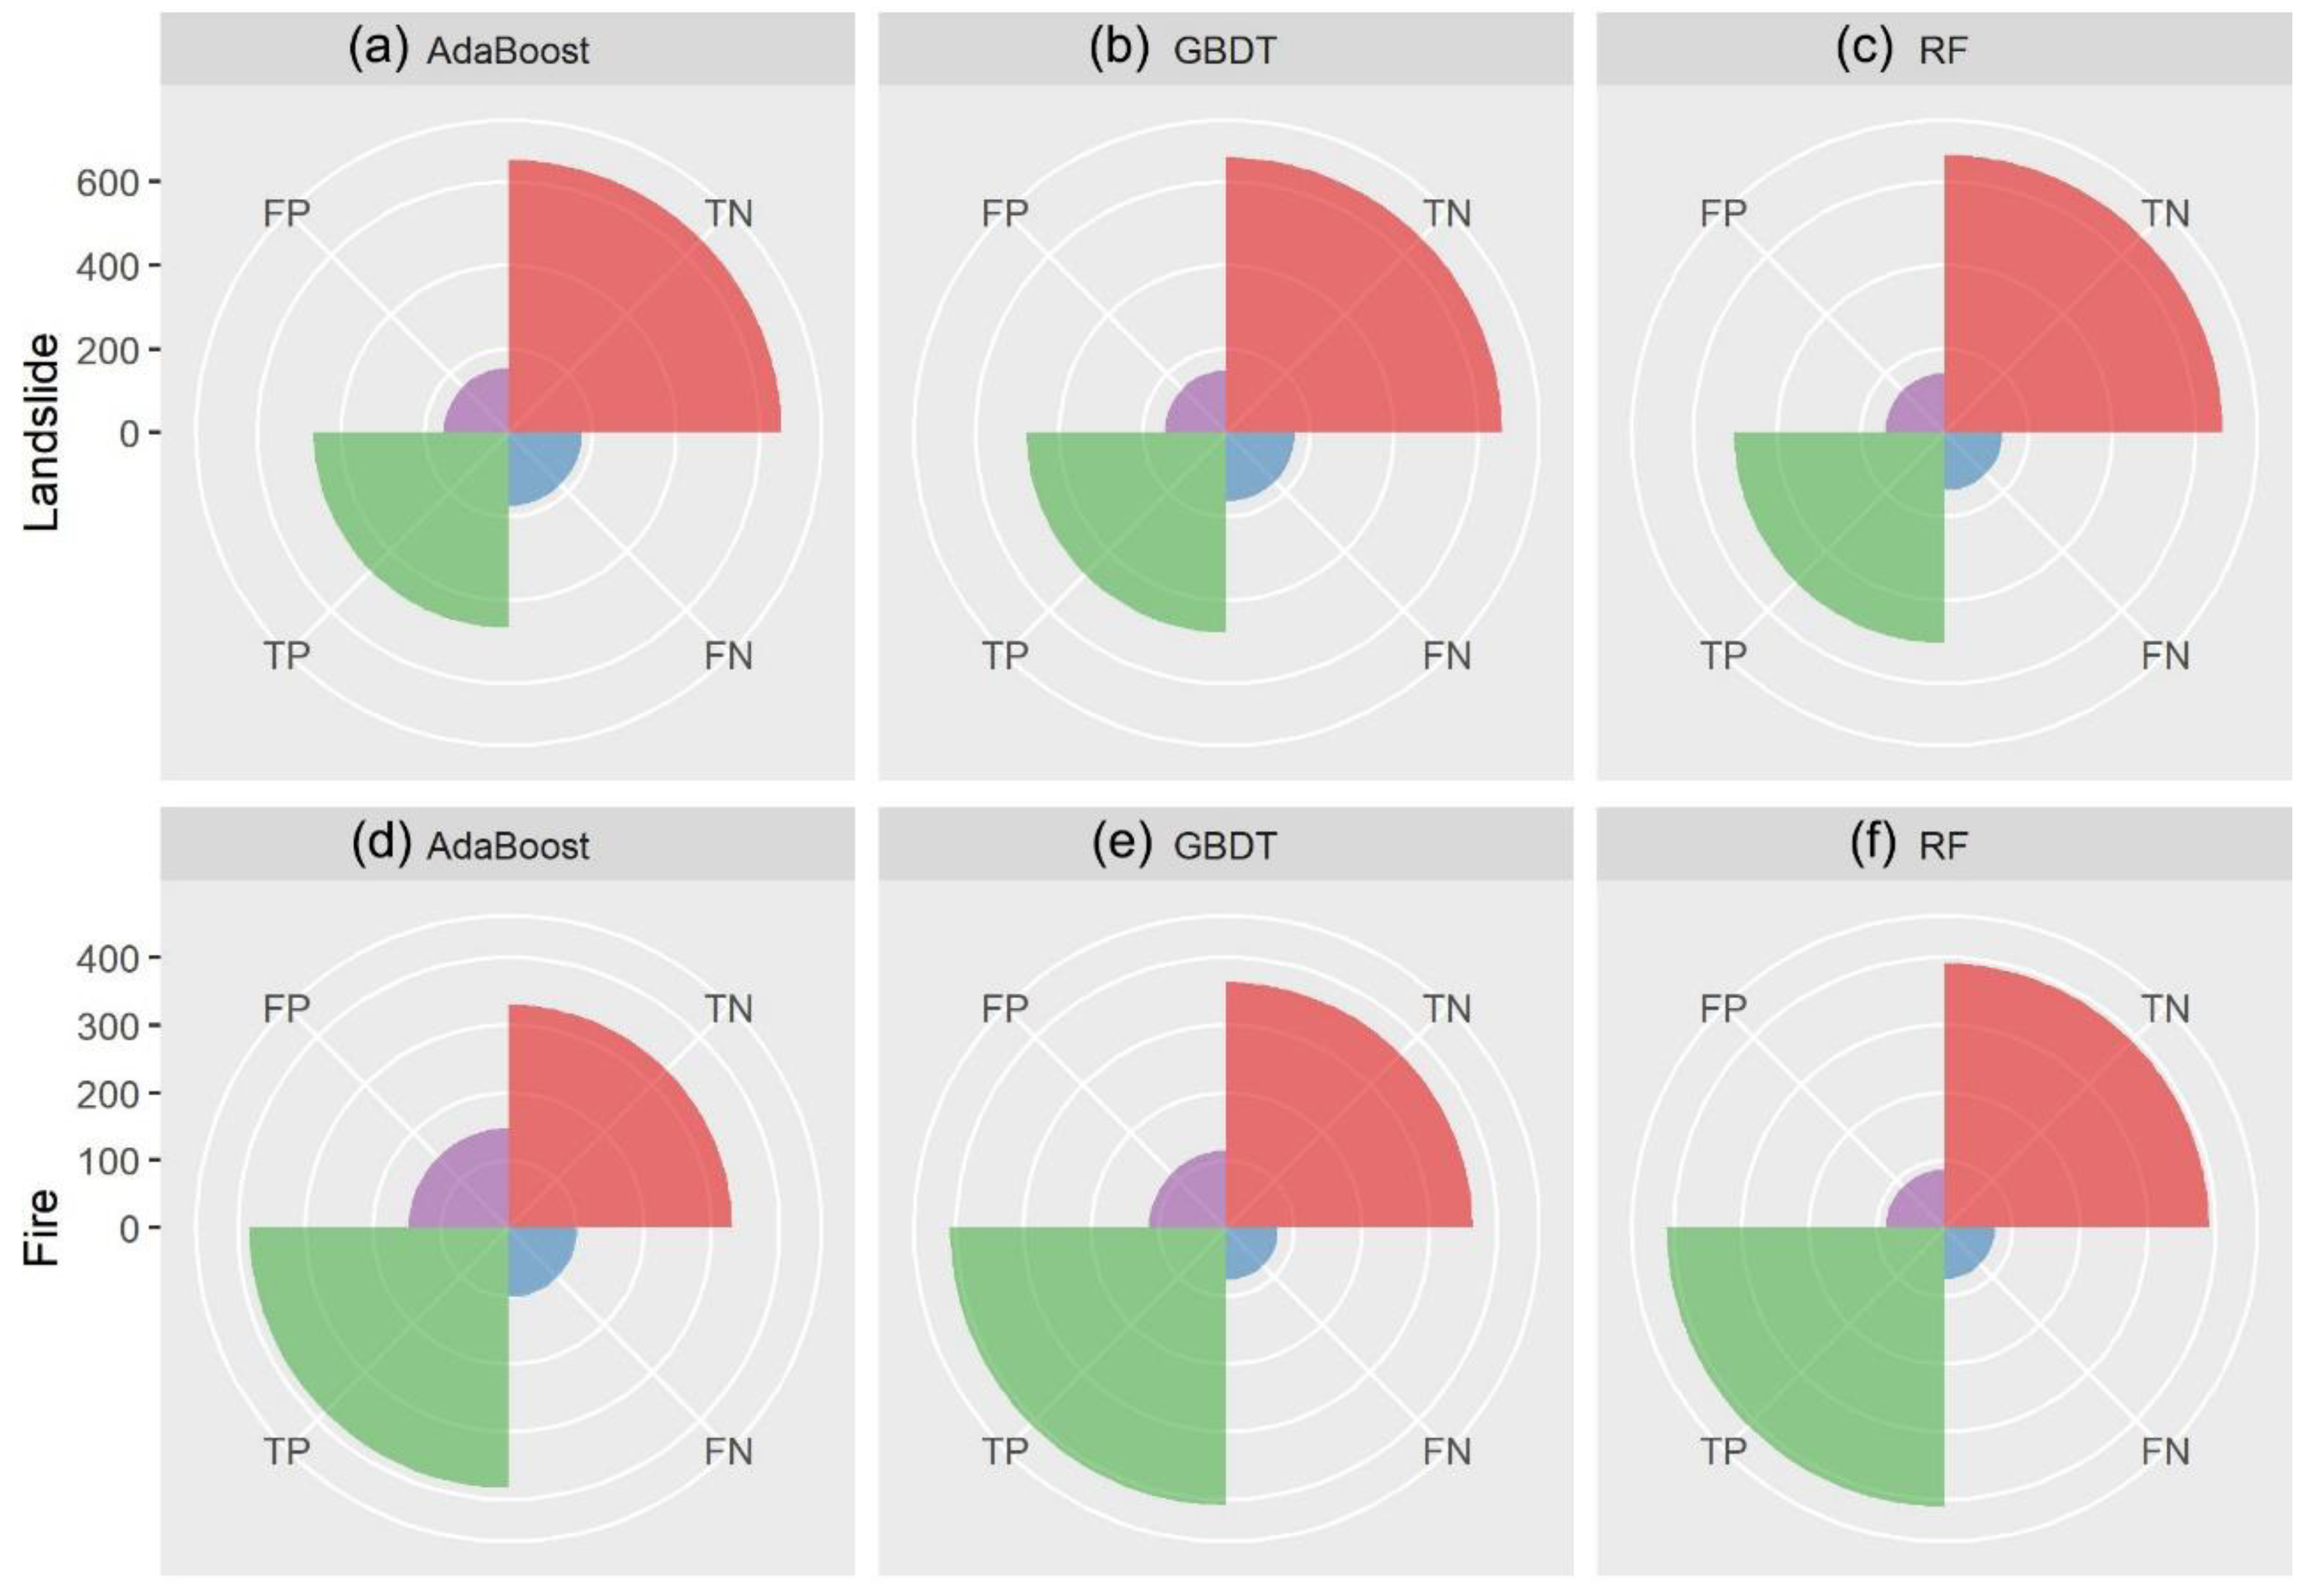
The results demonstrated that RF exhibited the best performance among the three ensemble machine learning methods for the two hazards, determining that the RF model is more predictive than GBDT and AdaBoost in landslide and wildfire susceptibility modeling and mapping. The results of the contingency plot of the confusion matrix statistics confirmed that RF is the best model among the three machine learning models (Figure 4). RF performed better in wildfires than in landslides. The gap in the performances between landslides and wildfires may be induced by the difference in data quality. The RF model exhibited good generalization capability. In addition, Figure 4 shows the specific percentages of TN, TP, FN and FP, giving a more detailed accuracy evaluation. FP refers to the nonhazard locations that are wrongly predicted as the hazard, while FN is the hazard locations that are wrongly predicted as nonhazard. TP and TN are the samples that are correctly predicted. In Figure 4, the TN and TP account for large portions in all the models in landslides and wildfires, while the mispredicted samples (FP and FN) in landslides and wildfires account for smaller parts. RF have the least FN and FP, demonstrating the high accuracy of the RF model.
3.2. Susceptibility Maps
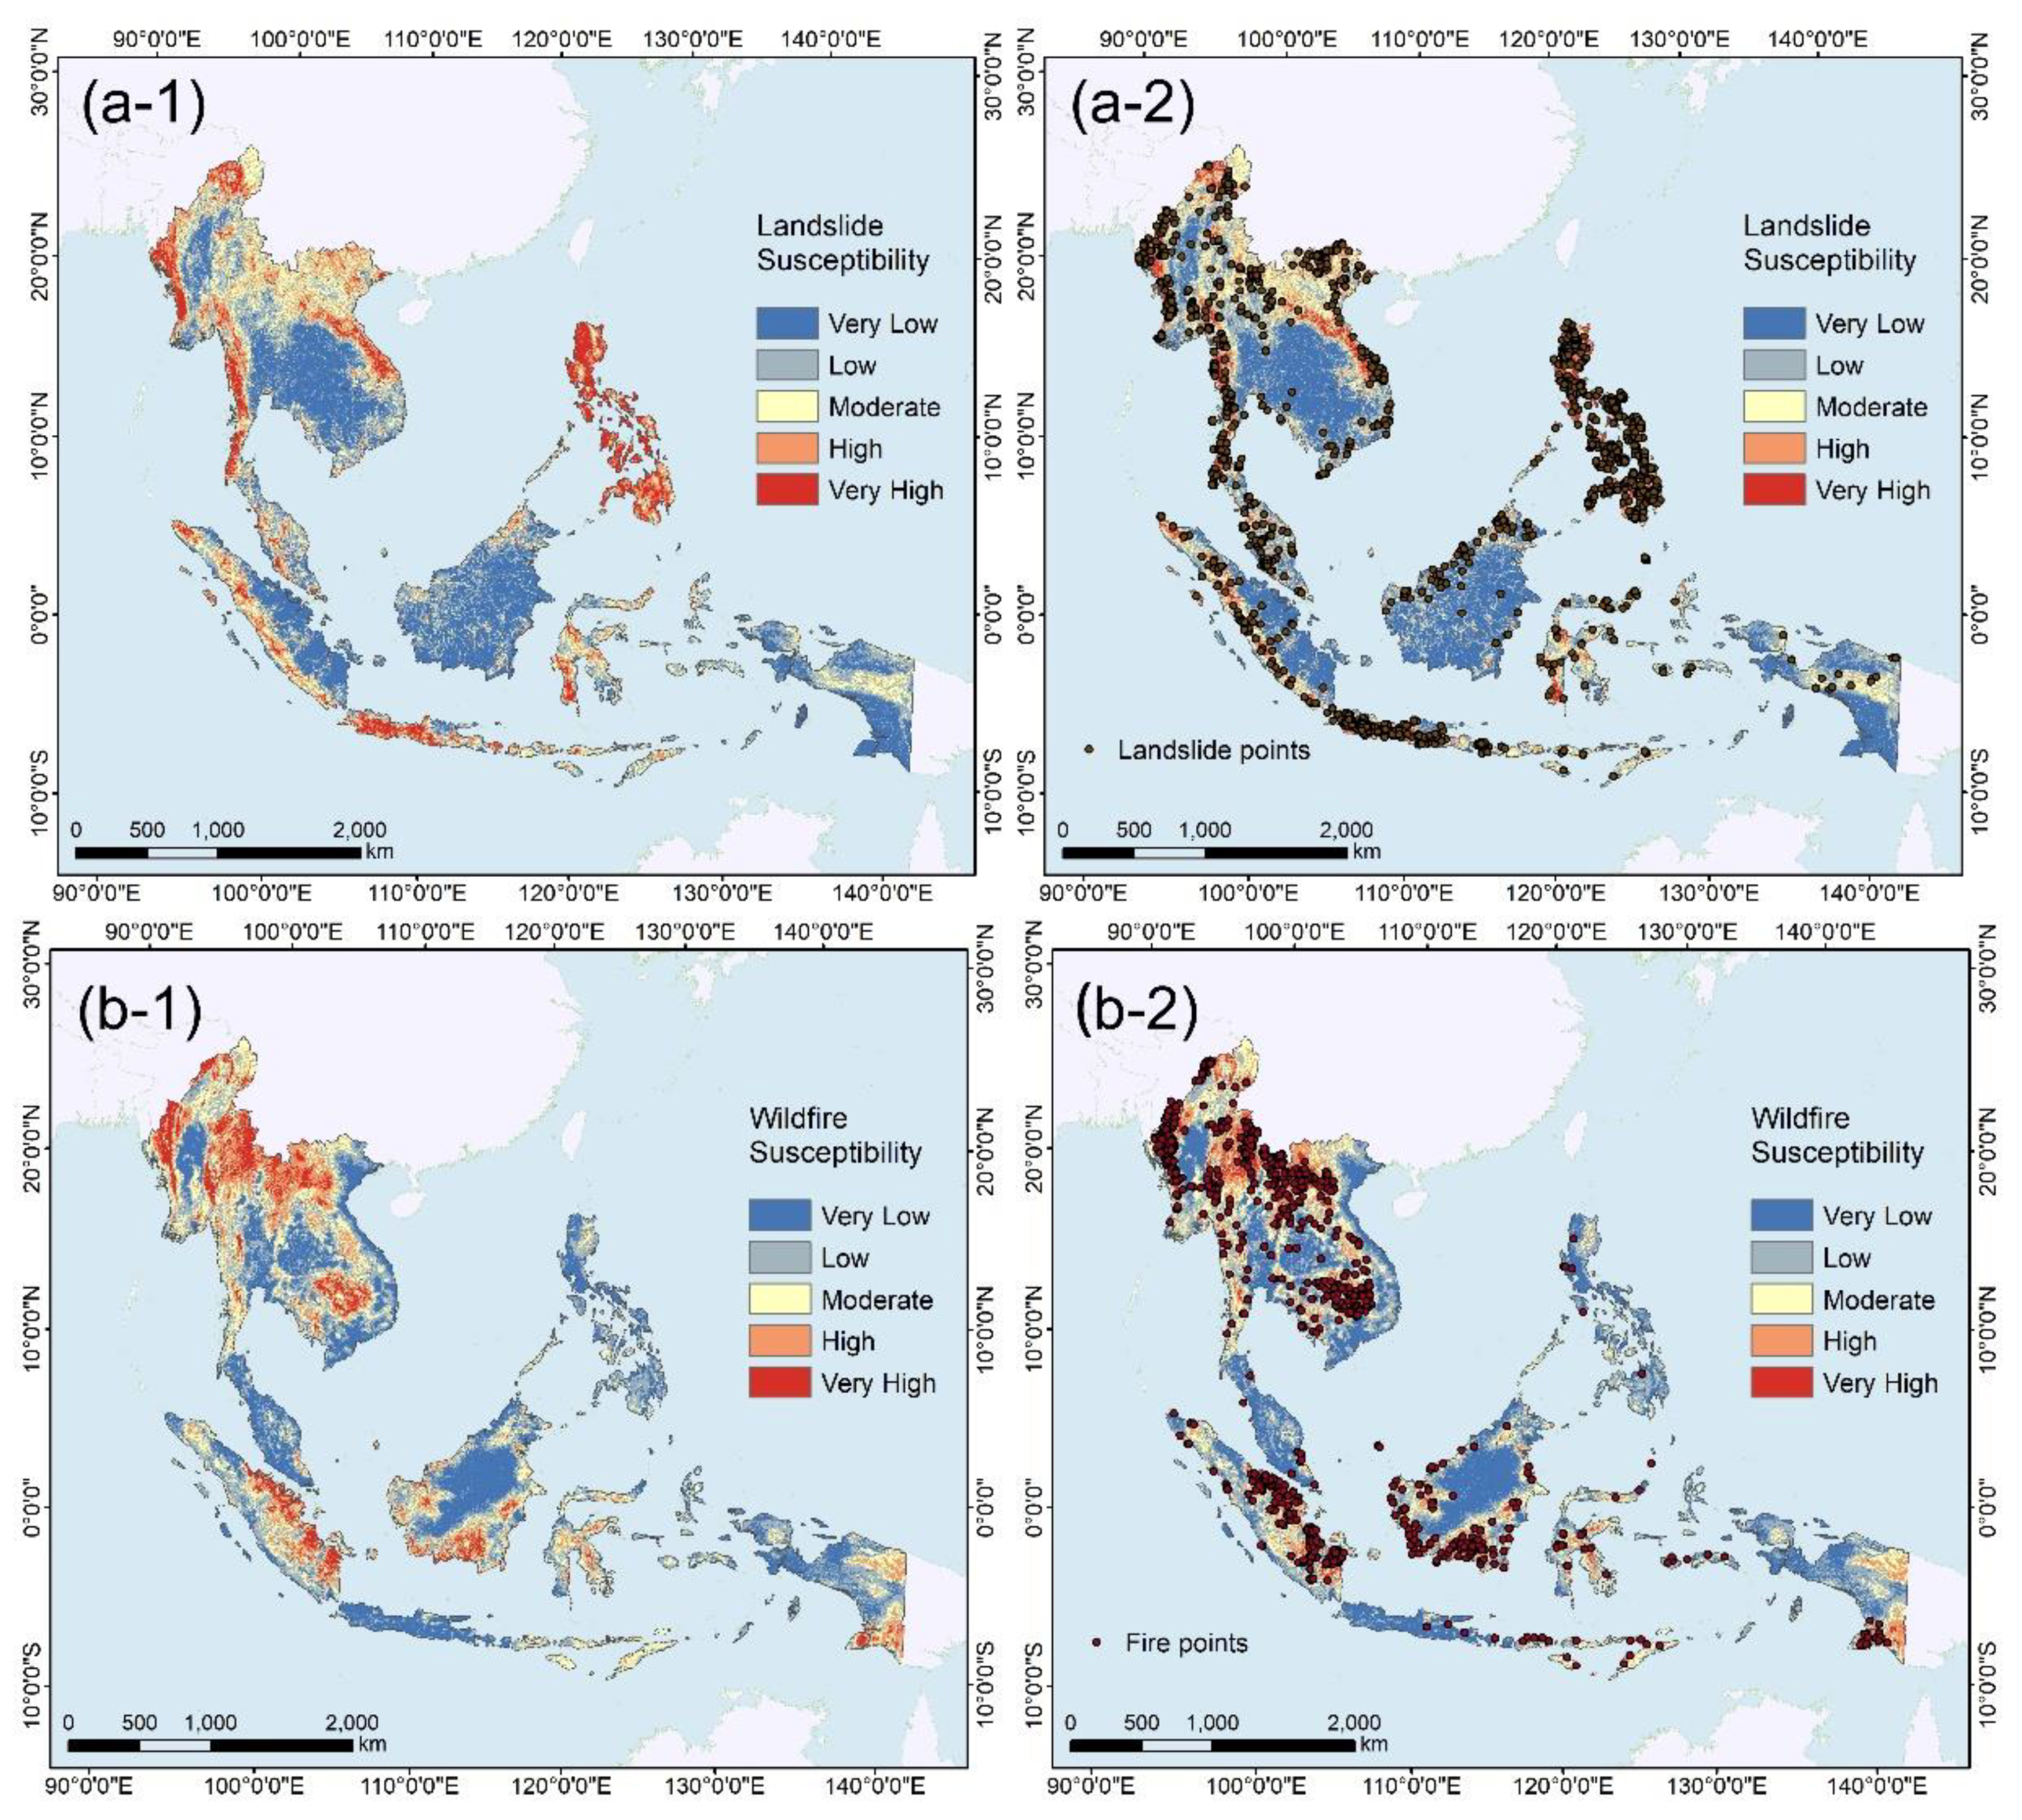
After obtaining the best model for the three hazards, the best performed RF model was applied to produce the susceptibility of the three hazards (Figure 5). The Natural Breaks classification method was employed to categorize the susceptibility map into five groups, including very low, low, moderate, high and very high [8,17,77]. The intervals of very low, low, moderate, high and very high for landslide susceptibility were 0–0.13, 0.14–0.28, 0.29–0.43, 0.44–0.62 and 0.63–1, respectively and, for wildfires, the intervals were 0–0.17, 0.18–0.31, 0.32–0.47, 0.48–0.67 and 0.68–1.
The susceptibility maps show a fairly good spatial distribution of the high susceptible areas. Most of the hazard points are within the areas with very high susceptibility, indicating the reliability of the susceptibility maps. The landslide susceptibility is high in the Philippines, the west of Myanmar, the middle of Vietnam and Lao and the southwestern parts of Indonesia near the Indian Ocean. Wildfires need dry environmental conditions. The wildfires in the Philippines are relatively low. The wildfires in Myanmar are relatively severe and are also serious in the northern area of Lao. Cambodia also has high wildfire susceptibility. Additionally, the wildfire susceptibilities in Sumatra and Borneo of Indonesia are relatively high.
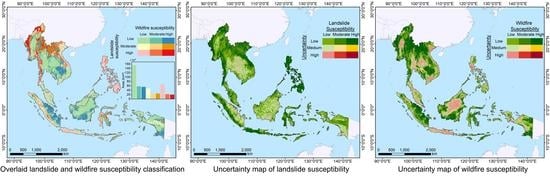
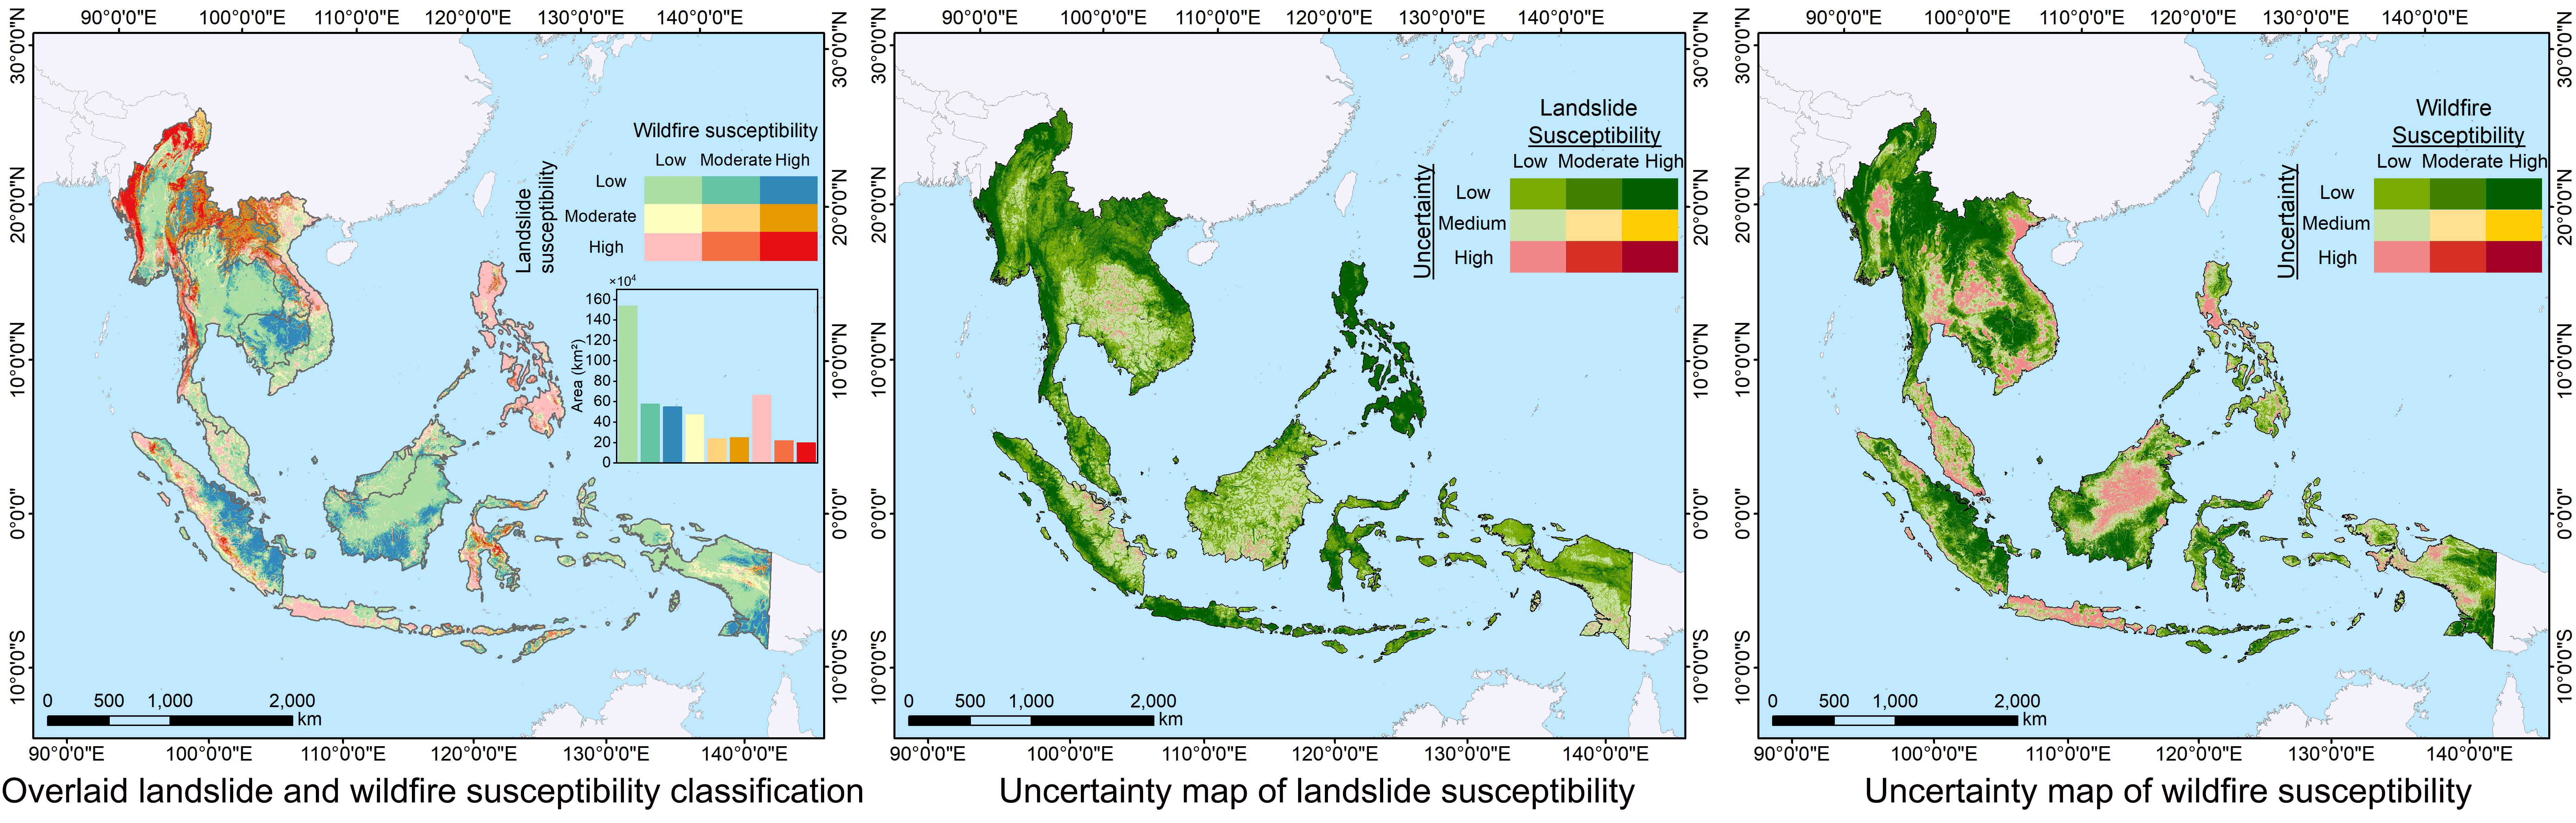
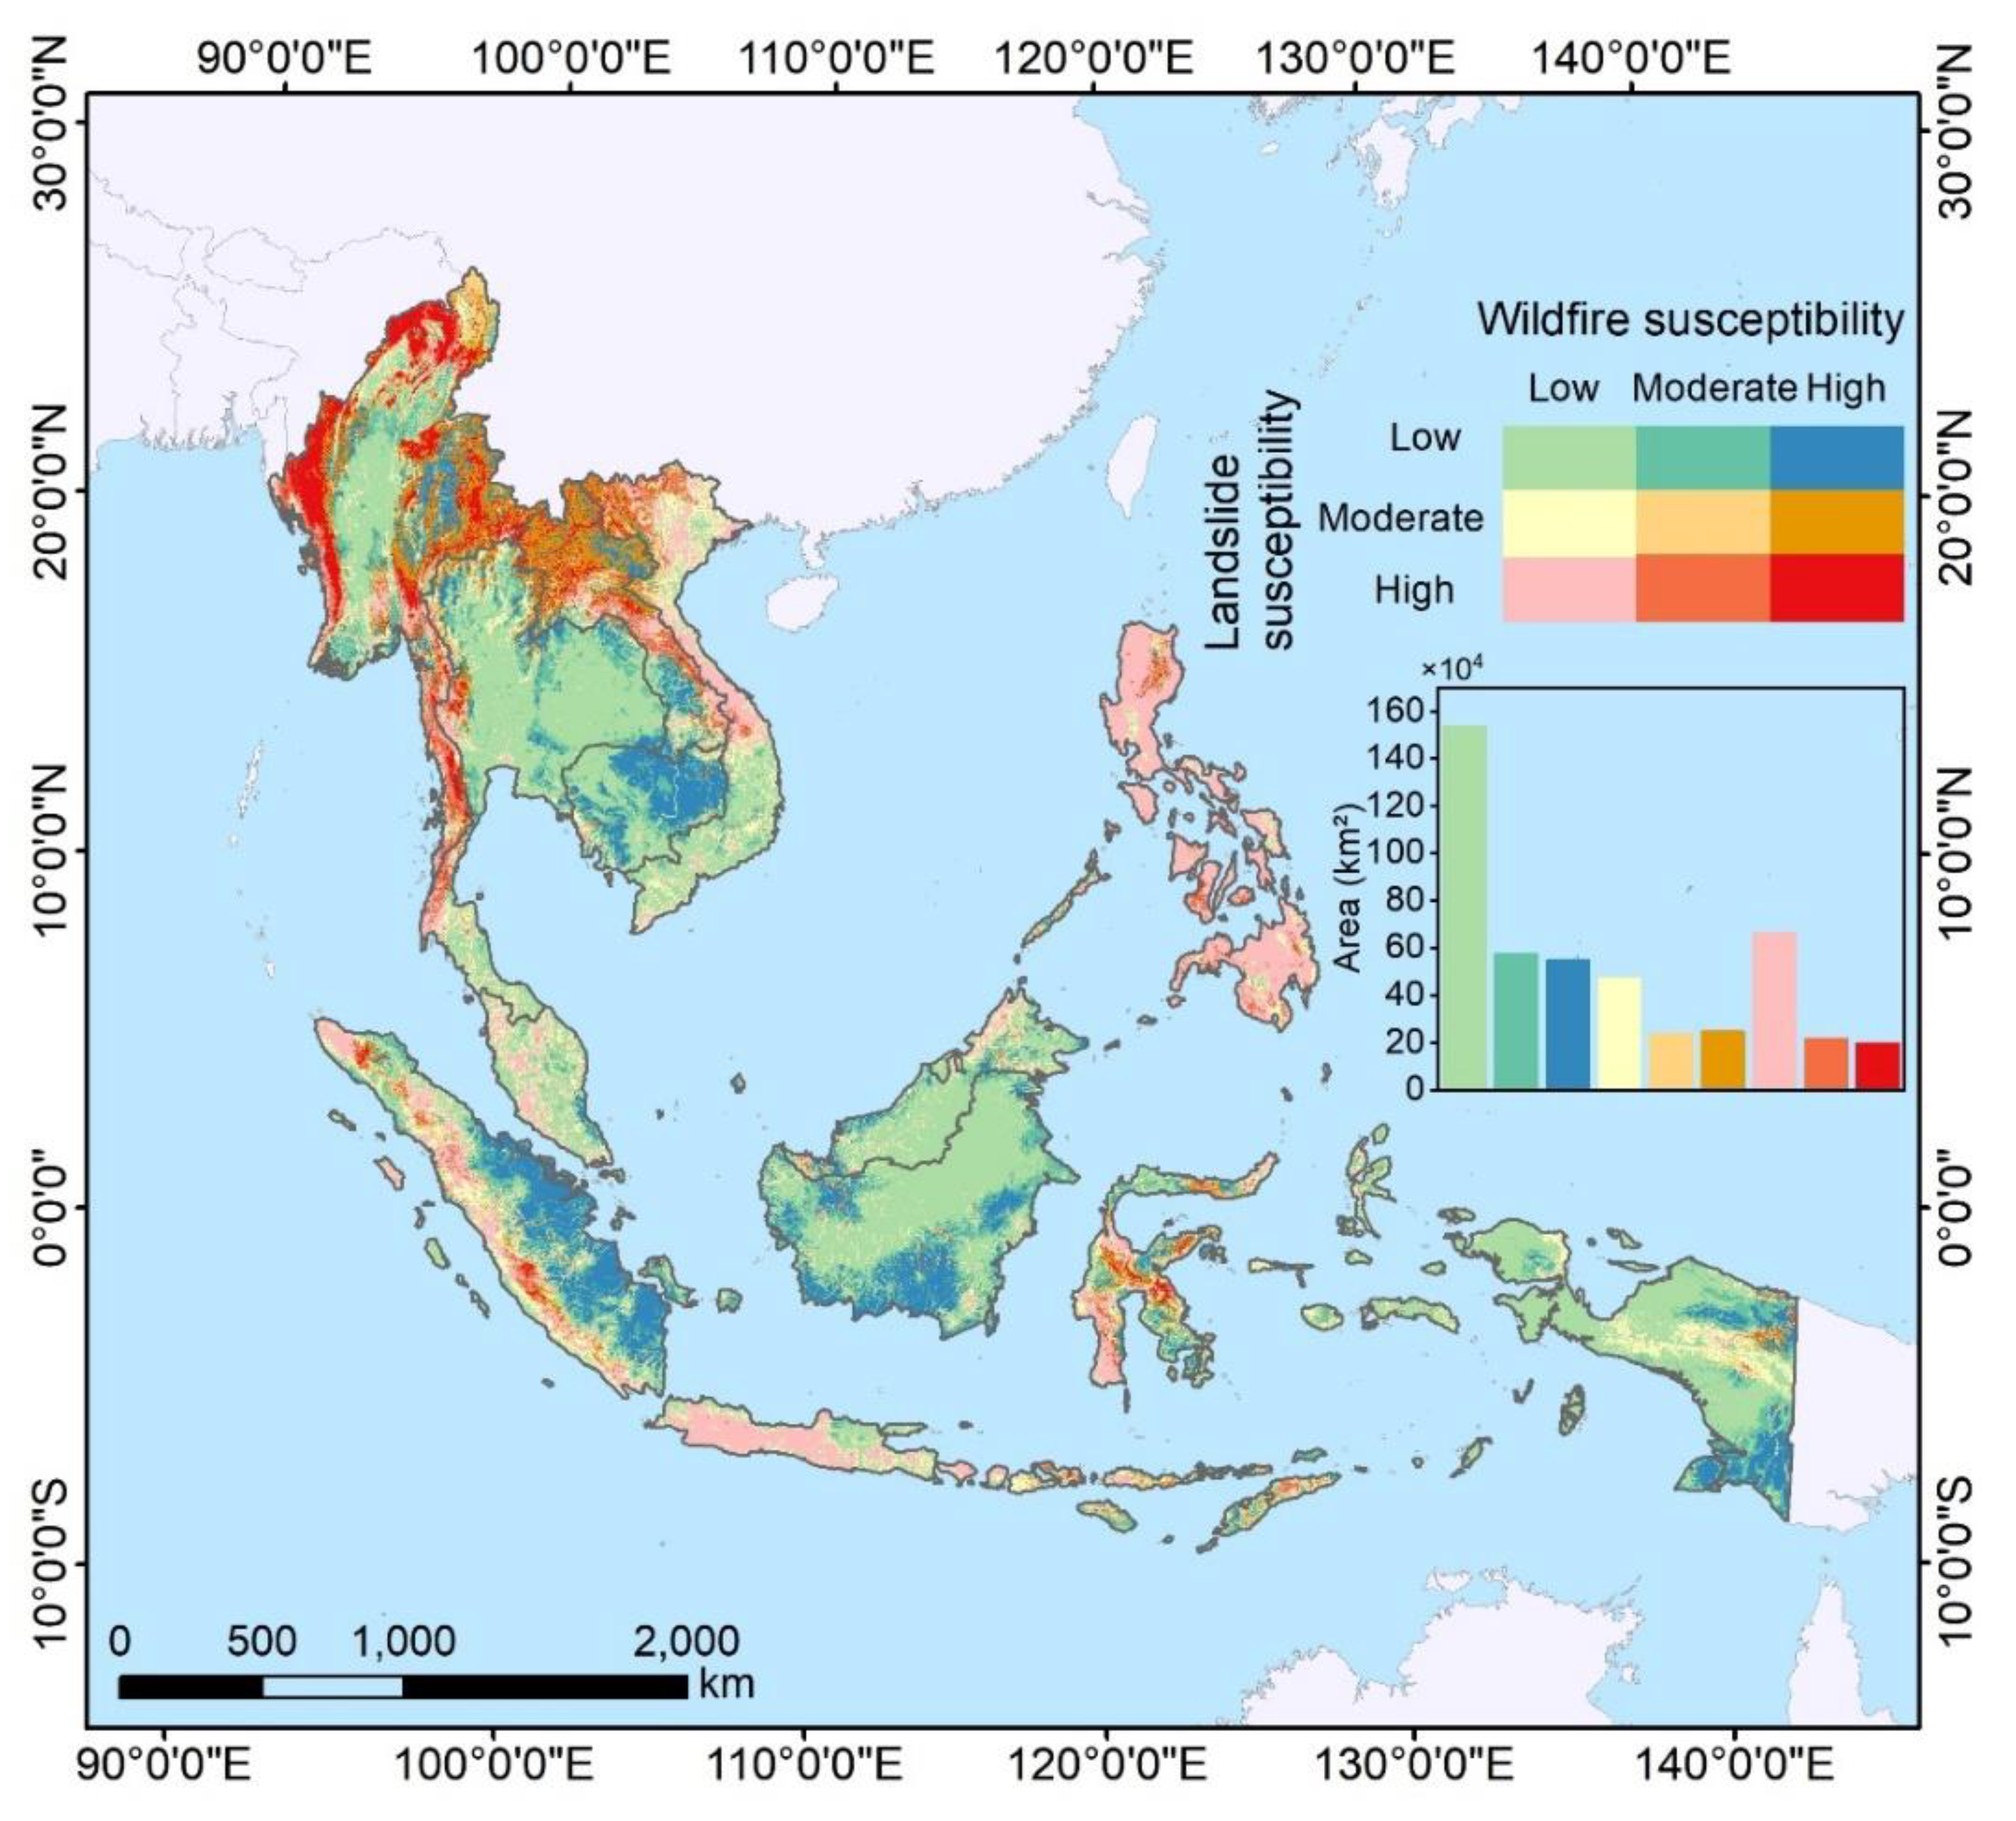
As previously reported, the susceptibility maps were divided into five classes. Here, we carried out an aggregation to make the intersection map clear and distinguishable—namely, the low class includes low and very low, while the high contains high and very high. Subsequently, an intersection operation between the landslide and wildfire susceptibility maps was performed. A multihazard susceptible map (Figure 6) combing landslides and wildfires was derived by the interaction between the three integrating classes of the susceptibility of landslides and wildfires. The resulting maps showed the classification scheme of low, moderate and high susceptible areas between landslides and wildfires. The majority of the regions have low susceptibility in both landsides and wildfires. The Philippines is highly susceptible to landslides but not very susceptible to wildfires. The western part of Myanmar showed a high susceptibility to both landslides and wildfires. Landslide susceptibility is high in the Philippines, the middle of Vietnam and the southern costal of Indonesia, while the wildfire susceptibility is low. Those regions in the middle and east parts of Indonesia and northwestern Cambodia show a high susceptibility to wildfires but a low susceptibility to landslides. The west of Myanmar is highly susceptible to both wildfires and landslides. From the bar chart, which summarizes the areas of different combination classes, it can be seen that the areas with low susceptibility in both hazards account for the majority, followed by areas with high landslide susceptibility and low wildfire susceptibility, and areas where both of the hazard susceptibilities are high make up the least proportion, confirming the statistical analyses on the maps.
3.3. Uncertainty of the RF Model
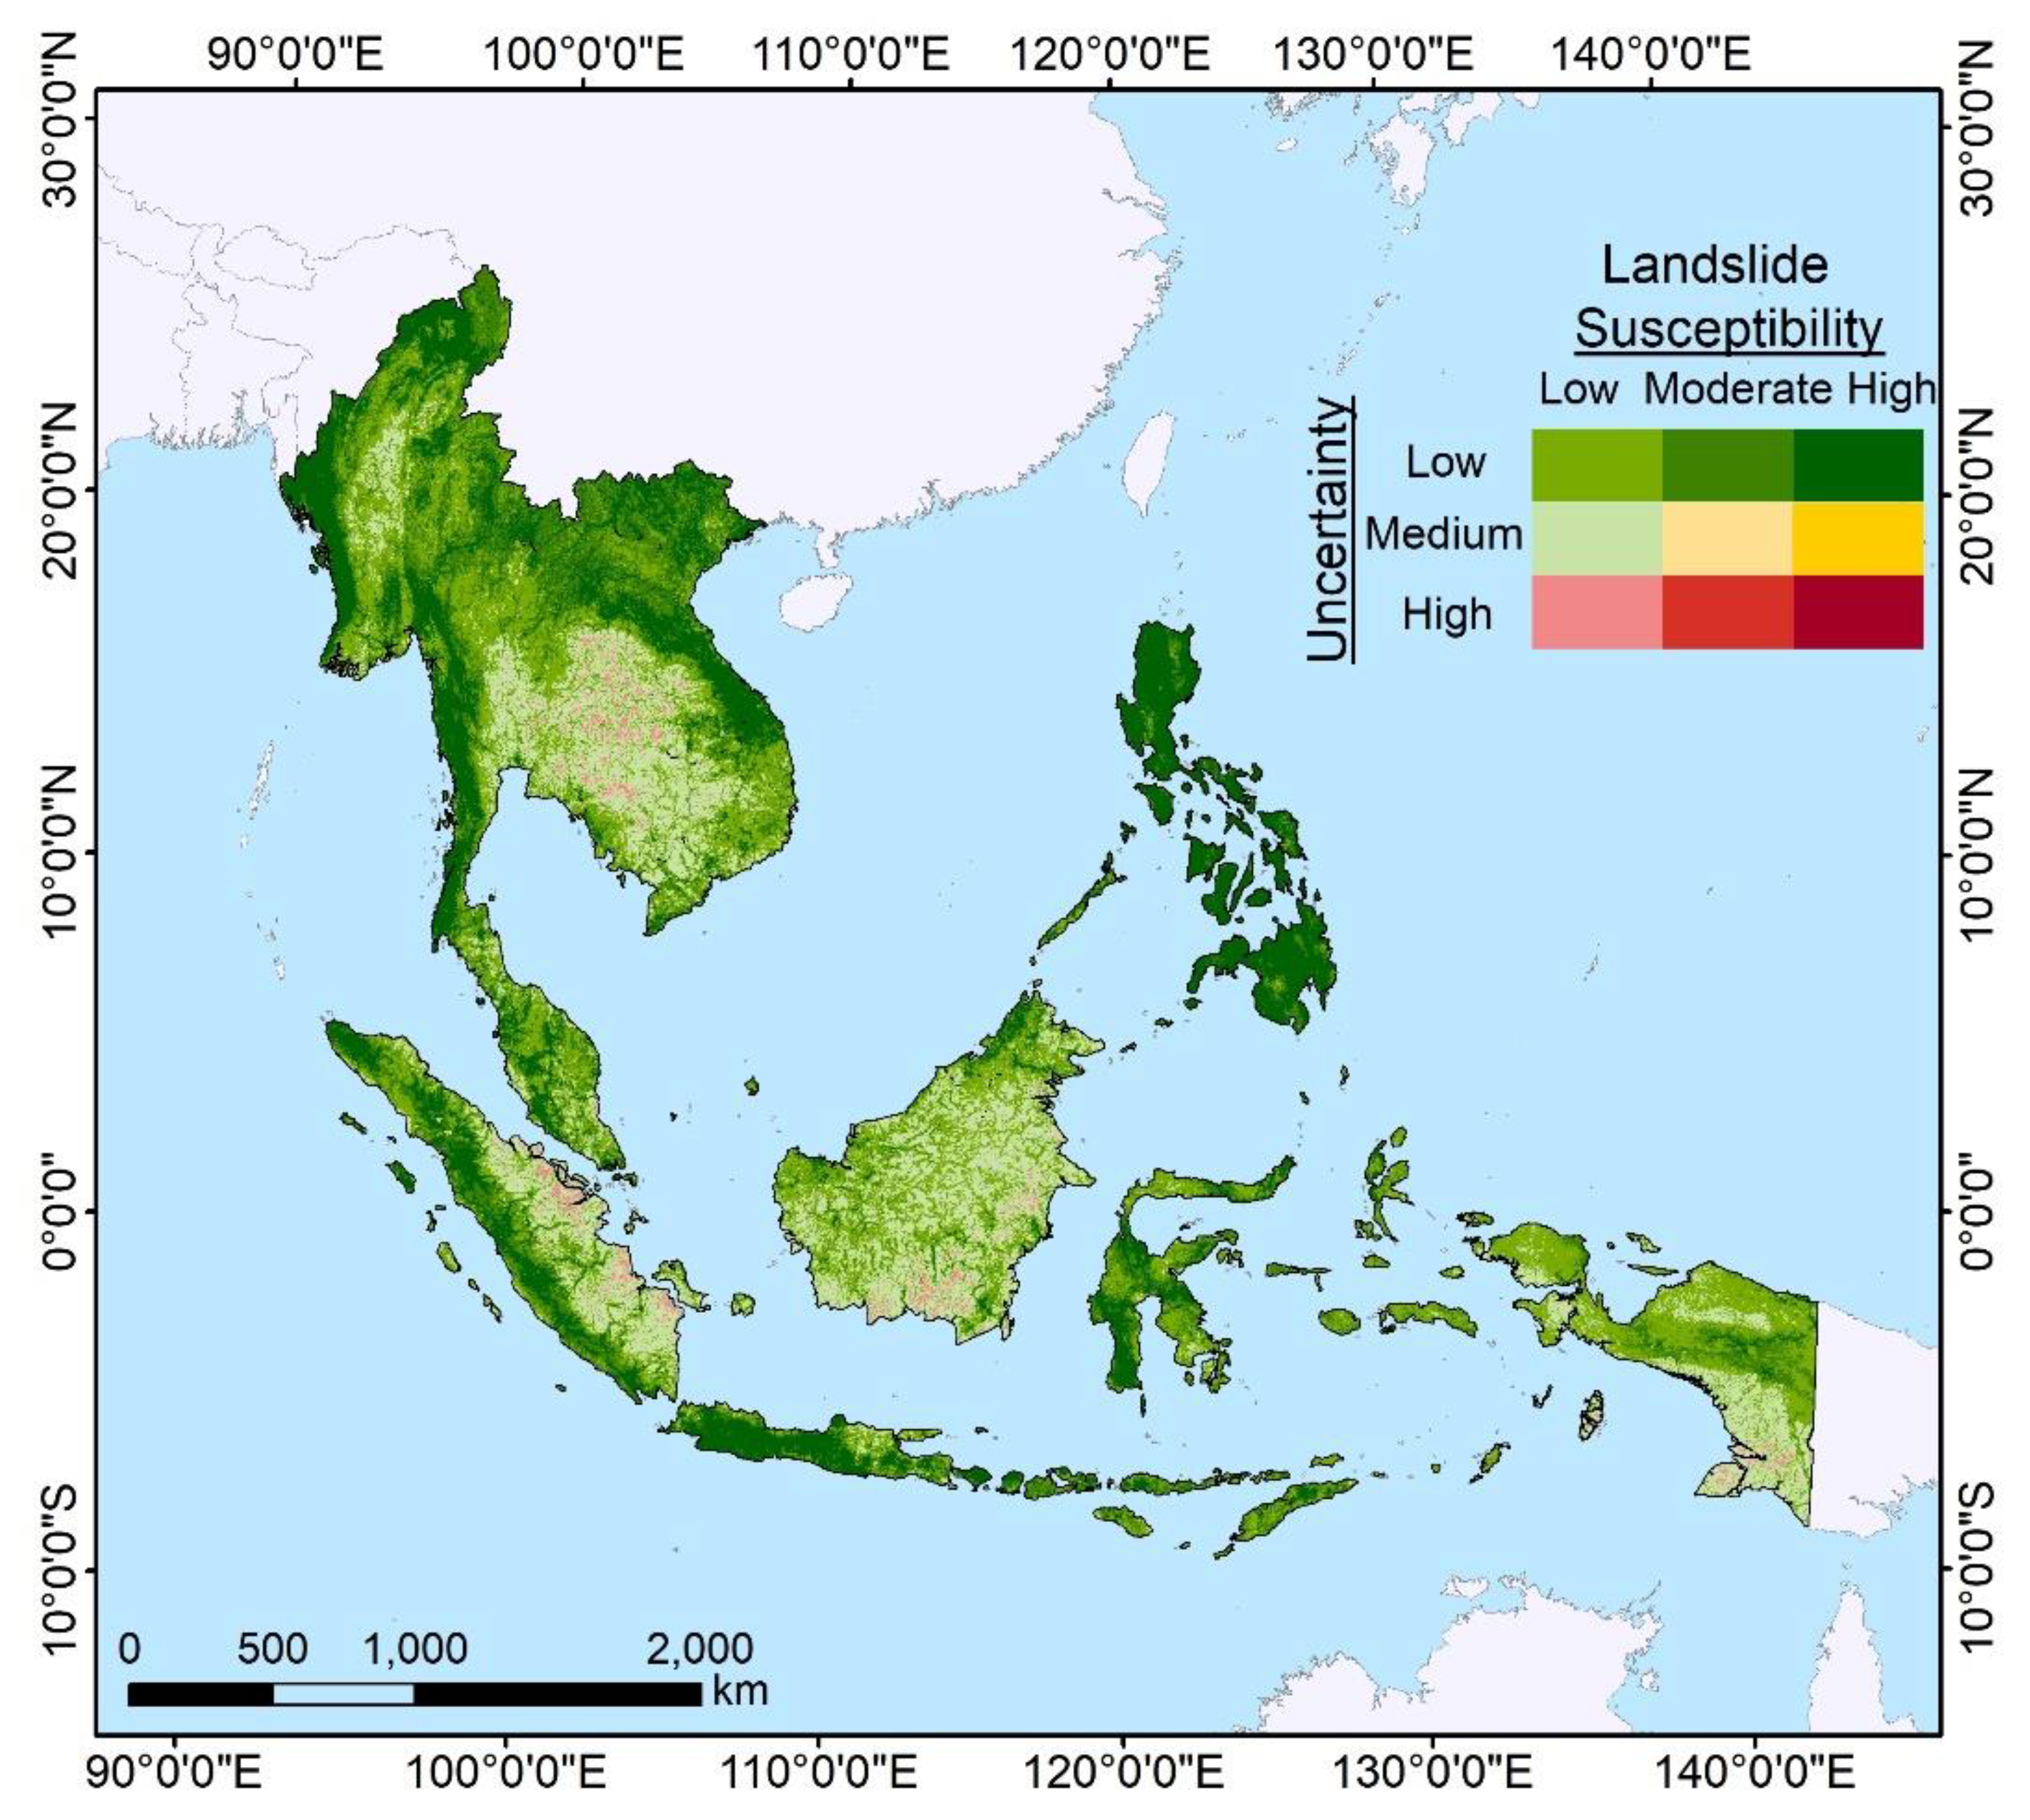
To assess the uncertainty of the susceptibility maps generated by the RF, the coefficient of variation (CV) was computed. The CV is a measure of uncertainty of the model [52,53]. In this work, the uncertainty map interacted with the susceptibility to delineate the uncertainty within each susceptibility class. In this way, the reliability of the RF model was assessed. The uncertainty is high when the CV exhibits high scores, while the lower the score, the better are the results of the model. The CV values were subdivided into five classes using the Natural Breaks method, and the first two classes were considered as low uncertainties while the last two were classified as high uncertainties, while the third class was a medium uncertainty. As can be seen from Figure 7, most of the region showed low uncertainty in the susceptibility map. Areas with high uncertainty were only identified where the landslide susceptibility was low. Most of the landslide points (about 93.95%) fell into the class with low uncertainty and high susceptibility, confirming how the RF model correctly identified the potential landslide areas with a low uncertainty level. In addition, none of the landslides fell into the high susceptibility class with high uncertainty. Only 1.27% of the landslides fell into the low susceptibility class (with low and medium uncertainty). Few regions show high uncertainty and those regions with high uncertainty were mainly distributed in the low landslide susceptibility category.
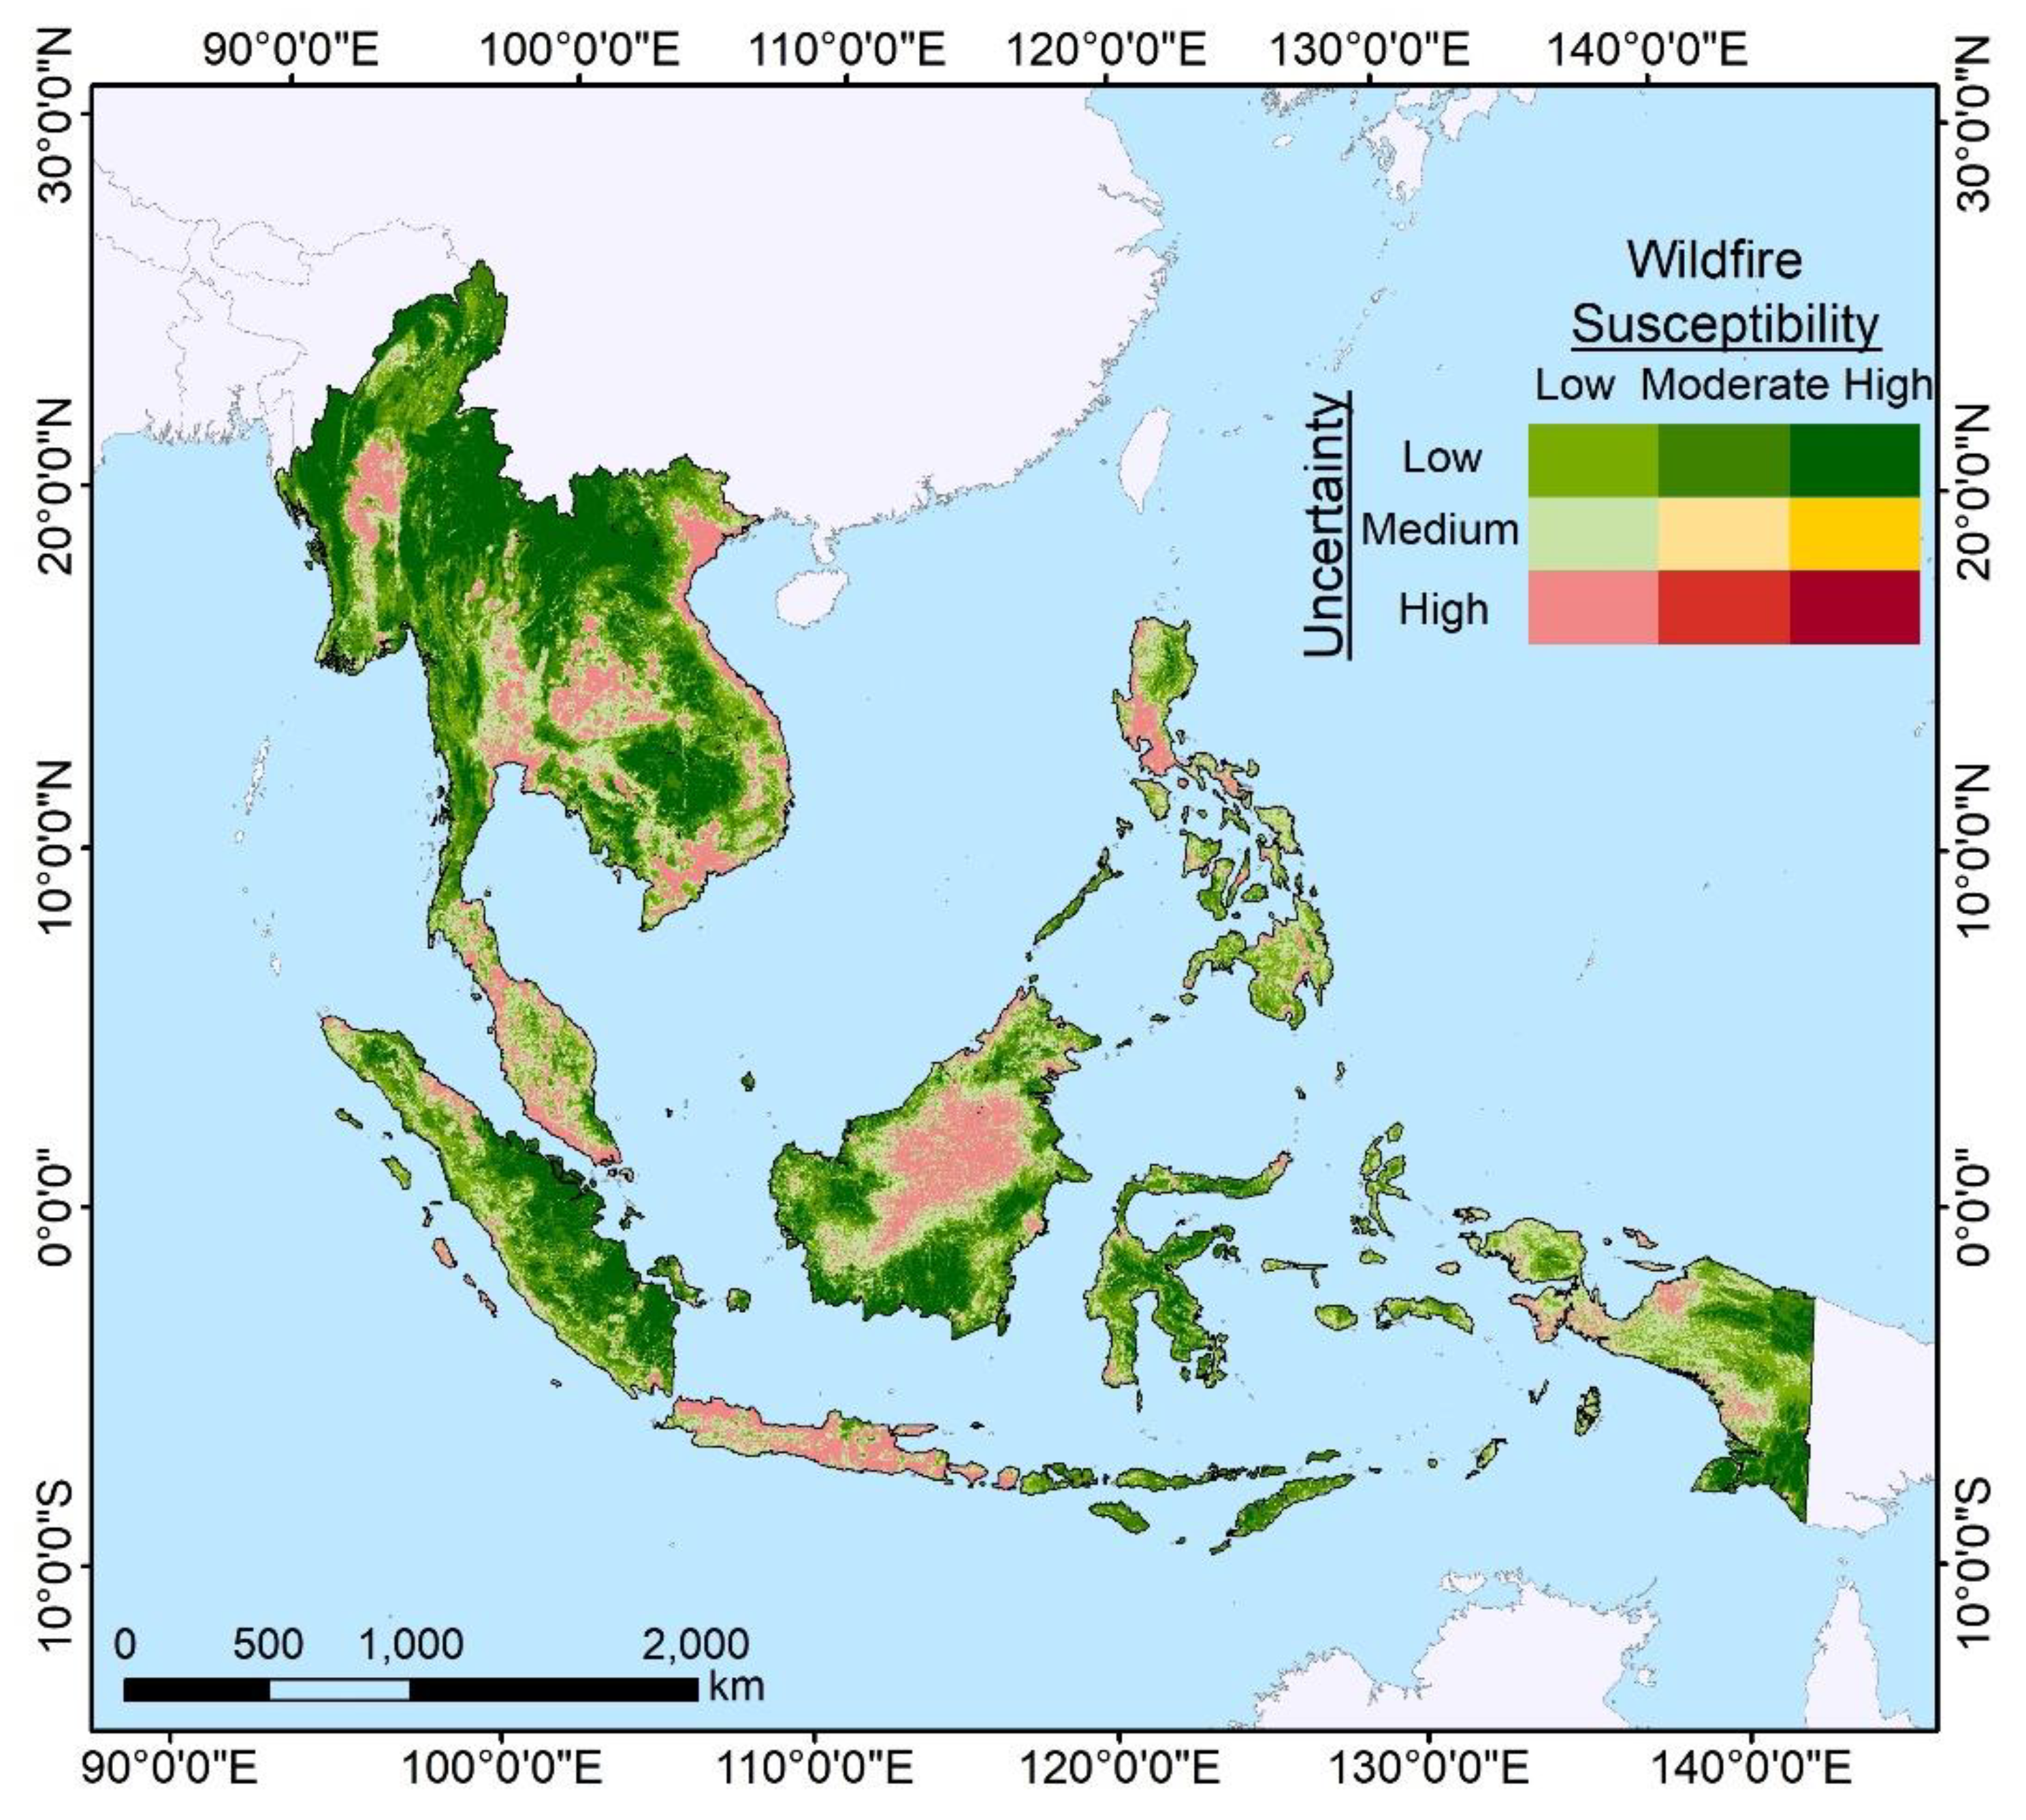
Only pixels characterized by low wildfire susceptibility showed high variability (Figure 8). Areas with high wildfire susceptibility and medium or high uncertainty were hard to recognize. The majority of the fire points fell into the highly wildfire-susceptible class with low uncertainty (91.06%), demonstrating the reliability of the wildfire susceptibility map obtained by the RF model. The fire points that fell into the low susceptibility classes with medium and high uncertainty were about 0.24%. About 4.72% of the fire points fell into the high susceptibility class with medium uncertainty. Only 1.90% of the fire points were in the high susceptibility class with high uncertainty. It was hard to recognize areas with high wildfire susceptibility presenting medium and high uncertainty. Most of the highly susceptible areas showed a low uncertainty level.
The graphs presented in Figure 9 confirmed the uncertainty maps. It was shown in Figure 9a that the largest areas were those with low uncertainty for landslides. Therefore, highly landslide-susceptible areas have low values of uncertainty. As can be seen from the graph in Figure 9b, most of the areas showed low uncertainty, confirming how the RF model correctly identified the potential wildfire areas. It can be observed from Figure 9b that the majority of the zones were those with low uncertainty. Low wildfire susceptibility with medium and high uncertainty also accounted for a large portion.
In general, the uncertainty maps gave more powerful support to evaluate the landslide- and wildfire-susceptible regions of SEA, along with the susceptibility maps. Figure 9 represents the areas for each combination class. Landslide and wildfire uncertainty maps have similar characteristics. The low uncertainty level was the majority in both landslides and wildfires, while there were more pixels with high uncertainty in the low susceptibility class of wildfires. In landslides, the low susceptibility with low uncertainty accounted for the most, while, in wildfires, the low susceptibility with medium uncertainty was the largest. Although landslides and wildfires both have good reliability in the highly susceptible areas, the landslide susceptibility map was more reliable than that of wildfires in the low susceptibility class.
3.4. Factor Contribution Analysis
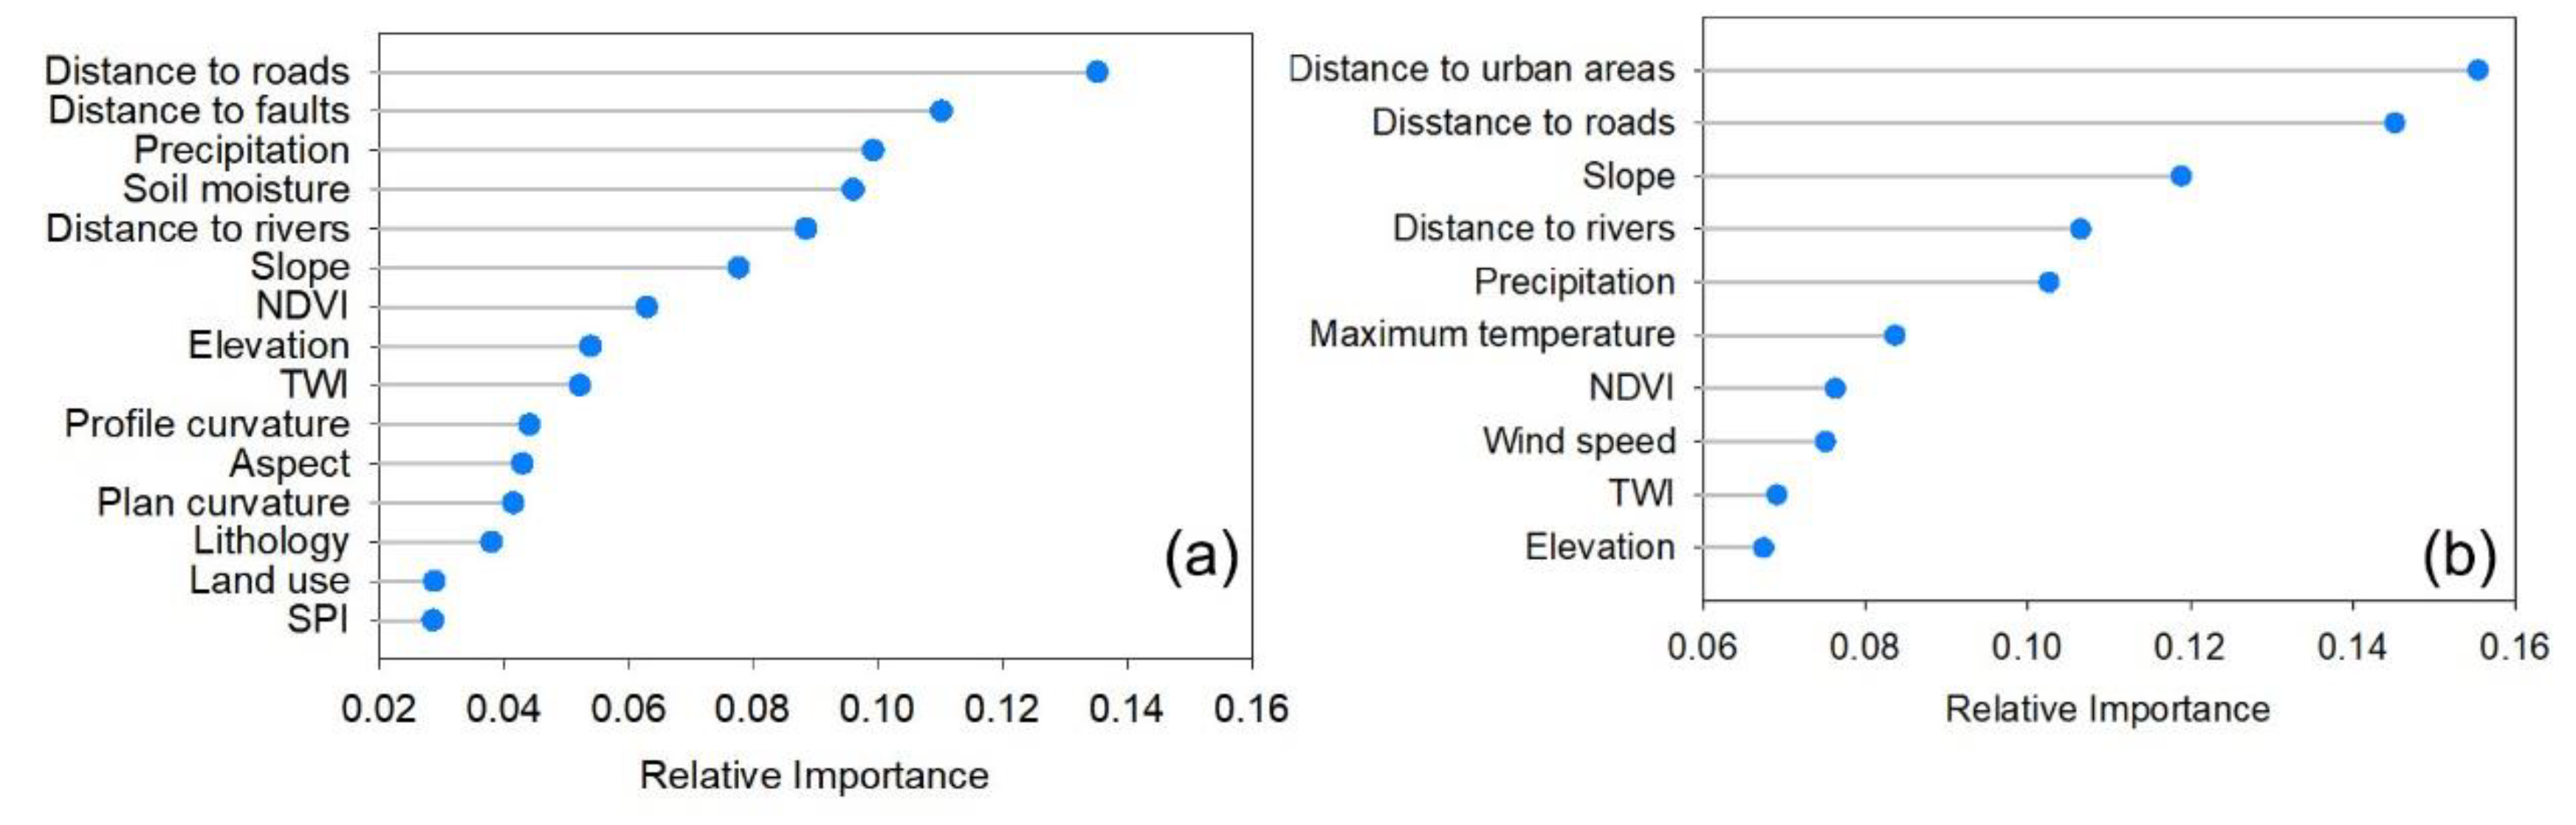
The relative importance of each conditioning factor for the susceptibility modeling was obtained using RF. The results revealed that the distance to roads, distance to faults and precipitation are the three most powerful factors to predict landslide risks (Figure 10a), while the SPI and land use seemed to have the least importance for landslide susceptibility modeling. Earthquakes and rainfall are frequent in SEA; it is reasonable that the distance to faults and precipitation are important. Earthquakes will make faults rupture; combined with the impact of precipitation, landslides are prone to occurring. For wildfire susceptibility modeling, it is mostly determined by the distance to urban areas, distance to roads and slopes, while the TWI and elevation are the least important factors (Figure 10b).
Comparing the two hazards, it can be found that the distance to roads has great importance for both the landslide and wildfire susceptibility assessments. Additionally, the distance to rivers, precipitation and slope also have great contributions to both hazards. However, elevation and the TWI are of medium importance for landslides, while these two factors have the least importance in wildfires.
4. Discussion
Landlide and wildfire susceptibility mapping is a hot topic. It is critical in the prediction and reduction of future landslide and wildfire occurences. The primary purpose of the present study was to produce satisfactory hazard susceptibility maps using ensemble machine learning approaches for SEA. In this discussion section, the factor contribution of the two hazards, the model comparision and the sampling methods for nonhazard samples are mainly discussed.
4.1. Contribution of Driving Factors
The analysis in this work showed that the distance to roads, distance to faults and precipitation were the most effective factors in determining the landslide potential in SEA. The relative importance of the conditioning factors to landslide modeling was dependent on the characteristics of the study area [91]. The landslide inventory data consisted of rainfall-induced data, so precipitation played a relatively important role in landslide susceptibility modeling. There were various external triggers for landslide occurrences, such as heavy rains, earthquakes, volcanoes, deforestations, road constructions and other natural or human-made processes [8,30,92,93]. Landslides are generally measured as a natural occurrence, but studies have shown that most landslides are frequently initiated by anthropological activities [29,30,94].
There are a lot of natural factors governing fire occurrences, such as fuel type, topography, vegetation, climate and drought [13,57,95]. Besides the natural triggering, most of the fires in SEA are initiated by humans [27,57]. As we can observe from the relative importance (Figure 10), the distance to roads plays a big role in both landslides and wildfires. What is more, the distance to urban areas is the most important for wildfire. The two factors are related to human activities that have a direct relationship with susceptibility (Figures S1 and S2), which may indicate that the human activity impacts the occurrence of landslides and wildfires.
Vast regions in SEA are undergoing a transformation process due to human interference [12], and these changes may create a hazard-prone environment. Anthropogenic factors are crucial for landslide and wildfire occurrences.
4.2. Comparison between the Ensemble Machine Learning Methods
The applied approaches, RF, GDBT and AdaBoost, are the prevailing ensemble machine learning algorithms in the field of data mining [17,30,96]. The results showed that the RF model outperformed the other two models in both landslide and wildfire susceptibility modeling, and the exceptional potential of the RF model has been supported by other related research [8,49,90]. AdaBoost, GBDT and RF are all tree-based algorithms that collect several single classifiers to improve their accuracy. The differences between RF and the other two models mainly exist in the particular framework and procedure [77]. RF is based on the Bagging idea, while GBDT and AdaBoost are of the Boosting family [35]. This can indicate that the Bagging strategy may be more suitable for landslide and wildfire susceptibility modeling in SEA. In general, RF can produce more accurate results in landslides and wildfires for SEA. The RF algorithm is believed to be the most suitable ensemble machine learning model when dealing with classification issues [77].
Besides, RF demonstrates robust and accurate performances on complicated data when there are noisy variables [75]. The RF model can provide high accuracy rates concerning outliers in predictors. The randomness of RF is reflected in two aspects: one is the random selection of training samples, and the other is the random selection of the split attribute at each node [17]. Considering the model performance and efficiency, RF is suitable for the susceptibility assessment in SEA.
4.3. Comparison of Different Sampling Strategies
Two techniques have been applied to generate nonhazard data as negative samples in the literature [64]: (1) the Buffer-controlled sampling (BCS) method and (2) the target space exteriorization sampling (TSES) method. BSC is a widely used method for sampling absent data for the hazard susceptibility [97,98]. In BCS, the negative samples are randomly generated in the buffer zone, which is a certain distance away from the presence of the disaster. In this work, we devised four strategies according to the BCS method and the two-buffer method proposed by [99] for sampling the negative samples (Table 4).
The two-buffer method, as depicted by Zhu et al. [99]. The inner buffer around a hazard location serves as a round polygon simulating the area where the hazard happens, and the outer buffer surrounding the hazard points was created to sample the nonhazard points. Random points were sampled from between the inner and outer buffers as a nonhazard observation.
The ACC, Precision and AUC were used to evaluate the model performance using the proposed sampling methods. As we can see (Table 5), strategy IV always has the best accuracy in whichever model for both landslides and wildfires. Using different buffer distances to generate negative samples has a different influence on the conditions of different models and hazard types. Nowicki Jessee et al. [100] tested a range of buffer radii, and the results showed that their model is not sensitive to the buffer radii, and the values do not significantly influence the model. However, we had different results. This may be because of the model difference and the difference in the extent of the study area.
4.4. Limitations and Future Works
The present paper also encountered some limitations. In this work, the ensemble machine learning methods were implemented 30 times (Please see Figures S3–S8 for the ROC plots), using different combinations of training and testing sets each time. The final susceptibility maps from the RF model were the average of the results. The reliability was assessed intersecting the susceptibility map with the uncertainty obtained by the CV. This paper evaluated the uncertainty of the RF model using CV maps. Most of the regions have low uncertainty for both landslides and wildfires (Figure 9), and all the highly susceptible regions have low uncertainty. However, there are still a few lowly susceptible areas with high uncertainty, especially for wildfires. It is worth more effort on the reduction of the uncertainty of those areas. In addition, the CV values could not consider uncertainties from the conditioning factors [53].
SEA’s weather is tropical, which is mostly hot and humid with high temperatures and high annual precipitation amounts [55,56]. Intense precipitation could cause landslides, and high temperatures could provide a dry environment for fire occurrences. SEA has often been affected by weather-related natural disasters [55]. Since the climate change can intensify the extreme weather, weather-related hazards may be more frequent in the future, and the variability of the climate will pose a great challenge for susceptibility modeling. It is essential to know the spatial distribution of susceptible areas for disaster prevention. Climate changes should be considered when assessing the regional susceptibility of landslides and wildfires. In addition, wildfires are influenced by the vetegtation types and vegetation phenology that are dominated by the seasons [101]. The vegetation types should be considered in assessing the wildfire susceptibility in future works. The model for wildfire susceptibility in different seasons performed differently [101]. Thus, the seasonality of the wildfire should also be considered in future works when assessing the wildfire susceptibility. Futrthermore, wildfires play an unfavorable role in the landslide susceptibility assessment, which can increase the predisposition towards the territory instability [37]. Future works focusing on the deeper relationship between landslides and wildfires should be done.
5. Conclusions
This paper developed landslide and wildfire susceptibility models for SEA using three well-accepted ensemble learning methods (AdaBoost, GBDT and RF).
- (1)
- This research compared the model performance using various measures and found out that RF is the best model in both landslide and wildfire susceptibility modeling and mapping. Then, the separate susceptibility maps for landslides and wildfires were generated using the best-performed RF model, in which the majority of actual hazard points fell within the very highly susceptible areas.
- (2)
- The resulting maps of each hazard were overlaid to develop the intersection map, and the regions that were highly susceptible to both landslides and wildfires accounted for a small portion.
- (3)
- The CV was used to evaluate the uncertainty of landslide and wildfire susceptibility spatial distribution. In general, the uncertainty was low, and there was no high-level uncertainty in the highly susceptible areas in either landslides or wildfires.
- (4)
- Through the factor importance analysis, it was found that the distance to roads and distance to faults were, relatively, the two most important factors for landslide susceptibility. For wildfires, the distance to urban areas was the most important, followed by the distance to roads and slope.
This study foucsed on the uncertainty of the susceptibility map, while the uncertainty of the conditioning factors was not considered. The model performance needs to be improved to obtain higher accuracy and lower uncertainty in the future. Additionally, the deeper relationship between landslides and wildfires should be studied in future works. The landslide and wildfire susceptibility with high reliability provided an understanding of the two hazards for SEA, which, therefore, may help to raise an awareness of the highly susceptible zones. Susceptibility maps can help in identifying regions where landslides and wildfires are susceptible, and the results can be useful for land use planning and disaster prevention and mitigation.
Supplementary Materials
The following are available online at https://0-www-mdpi-com.brum.beds.ac.uk/article/10.3390/rs13081572/s1, Figure S1: The relationship between the conditioning factors and landslides. Figure S2: The relationship between the conditioning factors and wildfires. Figure S3: ROC curves for landslide susceptibility using AdaBoost. Figure S4: ROC curves for wildfire susceptibility using AdaBoost. Figure S5: ROC curves for landslide susceptibility using GBDT. Figure S6: ROC curves for wildfire susceptibility using GBDT. Figure S7: ROC curves for landslide susceptibility using RF. Figure S8: ROC curves for wildfire susceptibility using RF. Table S1: Multicollinearity analysis of the landslide conditioning factors. Table S2: Multicollinearity analysis of the wildfire conditioning factors.
Author Contributions
Conceptualization, Q.H. and Z.J.; methodology, Q.H. and Z.J.; validation, Q.H. and Z.J.; formal analysis, Q.H.; resources, Q.H. and Z.J.; data curation, Q.H. and Z.J.; writing—original draft preparation, Q.H.; writing—review and editing, Q.H., Z.J., M.W. and K.L.; visualization, Q.H.; supervision, M.W. and K.L. and funding acquisition, M.W. All authors have read and agreed to the published version of the manuscript.
Funding
This research was funded by the Resilience Assessment and Management of Urban Infrastructure in Response to Risks, grant number 72091512.
Acknowledgments
We would like to thank the editor and reviewers for their comments. We also show our great appreciation for the scholars who provided the data used in this work. We also truly appreciate Saini Yang for providing the course “Simulation” at Beijing Normal University, which gave the theory support for this work.
Conflicts of Interest
The authors declare no conflict of interest.
References
- An, Y.; Tan, X.; Gu, B.; Zhu, K. Flood Risk Assessment Using the CV-TOPSIS Method for the Belt and Road Initiative: An Empirical Study of Southeast Asia. Ecosyst. Health Sustain. 2020, 6, 1765703. [Google Scholar] [CrossRef]
- Bandibas, J.; Takarada, S. Mobile Application and a Web-Based Geographic Information System for Sharing Geological Hazards Information in East and Southeast Asia. J. Geogr. Inf. Syst. 2019, 11, 309–320. [Google Scholar] [CrossRef] [Green Version]
- Li, Z.; Deng, X.; Zhang, Y. Evaluation and Convergence Analysis of Socio-Economic Vulnerability to Natural Hazards of Belt and Road Initiative Countries. J. Clean. Prod. 2021, 282, 125406. [Google Scholar] [CrossRef]
- Rich, G.J.; Sirikantraporn, S. (Jill) Posttraumatic Growth and Resilience in Southeast Asia. In Resistance, Resilience, and Recovery from Disasters: Perspectives from Southeast Asia; Regina, M., Hechanova, M.C., Waelde, L., Eds.; Community, Environment and Disaster Risk Management; Emerald Publishing Limited: Bingle, UK, 2020; Volume 21, pp. 143–158. ISBN 978-1-83909-791-1. [Google Scholar]
- Yin, S. Biomass Burning Spatiotemporal Variations over South and Southeast Asia. Environ. Int. 2020, 145, 106153. [Google Scholar] [CrossRef] [PubMed]
- Hidayat, R.; Sutanto, S.J.; Hidayah, A.; Ridwan, B.; Mulyana, A. Development of a Landslide Early Warning System in Indonesia. Geosciences 2019, 9, 451. [Google Scholar] [CrossRef] [Green Version]
- Aditian, A.; Kubota, T.; Shinohara, Y. Comparison of GIS-Based Landslide Susceptibility Models Using Frequency Ratio, Logistic Regression, and Artificial Neural Network in a Tertiary Region of Ambon, Indonesia. Geomorphology 2018, 318, 101–111. [Google Scholar] [CrossRef]
- Youssef, A.M.; Pourghasemi, H.R. Landslide Susceptibility Mapping Using Machine Learning Algorithms and Comparison of Their Performance at Abha Basin, Asir Region, Saudi Arabia. Geosci. Front. 2021, 12, 639–655. [Google Scholar] [CrossRef]
- Samphantharak, K. Natural Disaster and Economic Development in Southeast Asia; Social Science Research Network: Rochester, NY, USA, 2019. [Google Scholar]
- Smith, W.; Dressler, W.H. Forged in Flames: Indigeneity, Forest Fire and Geographies of Blame in the Philippines. Postcolonial Stud. 2020, 23, 527–545. [Google Scholar] [CrossRef]
- Ba, A.D.; Beeson, M. Contemporary Southeast Asia: The Politics of Change, Contestation, and Adaptation; Macmillan International Higher Education: London, UK, 2017; ISBN 978-1-137-59621-5. [Google Scholar]
- Taufik, M.; Setiawan, B.I.; Van Lanen, H.A.J. Increased Fire Hazard in Human-Modified Wetlands in Southeast Asia. Ambio 2019, 48, 363–373. [Google Scholar] [CrossRef]
- Miettinen, J.; Shi, C.; Liew, S.C. Fire Distribution in Peninsular Malaysia, Sumatra and Borneo in 2015 with Special Emphasis on Peatland Fires. Environ. Manag. 2017, 60, 747–757. [Google Scholar] [CrossRef]
- Sagala, S.; Sitinjak, E.; Yamin, D. Fostering Community Participation to Wildfire. In Wildfire Hazards, Risks and Disasters; Elsevier: Amsterdam, The Netherlands, 2015; pp. 123–144. ISBN 978-0-12-410434-1. [Google Scholar]
- Hartiningtias, D.; Fulé, P.Z.; Gunawan, A.A. Wildfire Effects on Forest Structure of Pinus Merkusii in Sumatra, Indonesia. For. Ecol. Manag. 2020, 457, 117660. [Google Scholar] [CrossRef]
- Leuenberger, M.; Parente, J.; Tonini, M.; Pereira, M.G.; Kanevski, M. Wildfire Susceptibility Mapping: Deterministic vs. Stochastic Approaches. Environ. Model. Softw. 2018, 101, 194–203. [Google Scholar] [CrossRef]
- Merghadi, A.; Yunus, A.P.; Dou, J.; Whiteley, J.; ThaiPham, B.; Bui, D.T.; Avtar, R.; Abderrahmane, B. Machine Learning Methods for Landslide Susceptibility Studies: A Comparative Overview of Algorithm Performance. Earth Sci. Rev. 2020, 207, 103225. [Google Scholar] [CrossRef]
- Hong, H.; Jaafari, A.; Zenner, E.K. Predicting Spatial Patterns of Wildfire Susceptibility in the Huichang County, China: An Integrated Model to Analysis of Landscape Indicators. Ecol. Indic. 2019, 101, 878–891. [Google Scholar] [CrossRef]
- Tien Bui, D.; Shahabi, H.; Shirzadi, A.; Chapi, K.; Alizadeh, M.; Chen, W.; Mohammadi, A.; Ahmad, B.B.; Panahi, M.; Hong, H.; et al. Landslide Detection and Susceptibility Mapping by AIRSAR Data Using Support Vector Machine and Index of Entropy Models in Cameron Highlands, Malaysia. Remote Sens. 2018, 10, 1527. [Google Scholar] [CrossRef] [Green Version]
- Shahabi, H.; Hashim, M. Landslide Susceptibility Mapping Using GIS-Based Statistical Models and Remote Sensing Data in Tropical Environment. Sci. Rep. 2015, 5, 9899. [Google Scholar] [CrossRef] [Green Version]
- Meinhardt, M.; Fink, M.; Tünschel, H. Landslide Susceptibility Analysis in Central Vietnam Based on an Incomplete Landslide Inventory: Comparison of a New Method to Calculate Weighting Factors by Means of Bivariate Statistics. Geomorphology 2015, 234, 80–97. [Google Scholar] [CrossRef]
- Nguyen, V.-T.; Tran, T.H.; Ha, N.A.; Ngo, V.L.; Nadhir, A.-A.; Tran, V.P.; Duy, N.M.; Amini, A.; Prakash, I.; Ho, L.S.; et al. GIS Based Novel Hybrid Computational Intelligence Models for Mapping Landslide Susceptibility: A Case Study at Da Lat City, Vietnam. Sustainability 2019, 11, 7118. [Google Scholar] [CrossRef] [Green Version]
- Pham, B.T.; Nguyen-Thoi, T.; Qi, C.; Phong, T.V.; Dou, J.; Ho, L.S.; Le, H.V.; Prakash, I. Coupling RBF Neural Network with Ensemble Learning Techniques for Landslide Susceptibility Mapping. CATENA 2020, 195, 104805. [Google Scholar] [CrossRef]
- Hashim, M.; Misbari, S.; Pour, A.B. Landslide Mapping and Assessment by Integrating Landsat-8, PALSAR-2 and GIS Techniques: A Case Study from Kelantan State, Peninsular Malaysia. J. Indian Soc. Remote Sens. 2018, 46, 233–248. [Google Scholar] [CrossRef]
- Ngoc Thach, N.; Bao-Toan Ngo, D.; Xuan-Canh, P.; Hong-Thi, N.; Hang Thi, B.; Nhat-Duc, H.; Dieu, T.B. Spatial Pattern Assessment of Tropical Forest Fire Danger at Thuan Chau Area (Vietnam) Using GIS-Based Advanced Machine Learning Algorithms: A Comparative Study. Ecol. Inform. 2018, 46, 74–85. [Google Scholar] [CrossRef]
- Tehrany, M.S.; Jones, S.; Shabani, F.; Martínez-Álvarez, F.; Tien Bui, D. A Novel Ensemble Modeling Approach for the Spatial Prediction of Tropical Forest Fire Susceptibility Using LogitBoost Machine Learning Classifier and Multi-Source Geospatial Data. Theor. Appl. Climatol. 2019, 137, 637–653. [Google Scholar] [CrossRef]
- Prasertsri, N.; Littidej, P. Spatial Environmental Modeling for WildfireProgression Accelerating Extent AnalysisUsing Geo-Informatics. Pol. J. Environ. Stud. 2020, 29, 3249–3261. [Google Scholar] [CrossRef]
- Thoha, A.S.; Sofyan, M.; Ahmad, A.G. Spatio-Temporal Distribution of Forest and Land Fires in Labuhanbatu Utara District, North Sumatera Province, Indonesia. IOP Conf. Ser. Earth Environ. Sci. 2020, 454, 12081. [Google Scholar] [CrossRef]
- Forbes, K.; Broadhead, J.; Brardinoni, A.D.; Gray, D.; Stokes, B.V. Forests and Landslides: The Role of Trees and Forests in the Prevention of Landslides and Rehabilitation of Landslide-Affected Areas in Asia Second Edition. Rap. Publ. 2013, 8–35. Available online: https://www.unisdr.org/preventionweb/files/53056_i3245e.pdf (accessed on 26 March 2021).
- Nachappa, T.G.; Ghorbanzadeh, O.; Gholamnia, K.; Blaschke, T. Multi-Hazard Exposure Mapping Using Machine Learning for the State of Salzburg, Austria. Remote Sens. 2020, 12, 2757. [Google Scholar] [CrossRef]
- Zeng, Z.; Estes, L.; Ziegler, A.D.; Chen, A.; Searchinger, T.; Hua, F.; Guan, K.; Jintrawet, A.; Wood, E.F. Highland Cropland Expansion and Forest Loss in Southeast Asia in the Twenty-First Century. Nat. Geosci. 2018, 11, 556–562. [Google Scholar] [CrossRef]
- Estoque, R.C.; Ooba, M.; Avitabile, V.; Hijioka, Y.; DasGupta, R.; Togawa, T.; Murayama, Y. The Future of Southeast Asia’s Forests. Nat. Commun. 2019, 10, 1829. [Google Scholar] [CrossRef] [PubMed] [Green Version]
- Zeng, Z.; Gower, D.B.; Wood, E.F. Accelerating Forest Loss in Southeast Asian Massif in the 21st Century: A Case Study in Nan Province, Thailand. Glob. Change Biol. 2018, 24, 4682–4695. [Google Scholar] [CrossRef]
- Miettinen, J.; Stibig, H.-J.; Achard, F. Remote Sensing of Forest Degradation in Southeast Asia—Aiming for a Regional View through 5–30 m Satellite Data. Glob. Ecol. Conserv. 2014, 2, 24–36. [Google Scholar] [CrossRef]
- Zhang, Y.; Zhu, Z.; Liu, Z.; Zeng, Z.; Ciais, P.; Huang, M.; Liu, Y.; Piao, S. Seasonal and Interannual Changes in Vegetation Activity of Tropical Forests in Southeast Asia. Agric. For. Meteorol. 2016, 224, 1–10. [Google Scholar] [CrossRef]
- Cannon, S.H.; Reneau, S.L. Conditions for Generation of Fire-Related Debris Flows, Capulin Canyon, New Mexico. Earth Surf. Process. Landf. 2000, 25, 1103–1121. [Google Scholar] [CrossRef]
- Di Napoli, M.; Marsiglia, P.; Di Martire, D.; Ramondini, M.; Ullo, S.L.; Calcaterra, D. Landslide Susceptibility Assessment of Wildfire Burnt Areas through Earth-Observation Techniques and a Machine Learning-Based Approach. Remote Sens. 2020, 12, 2505. [Google Scholar] [CrossRef]
- Sameen, M.I.; Pradhan, B.; Lee, S. Application of Convolutional Neural Networks Featuring Bayesian Optimization for Landslide Susceptibility Assessment. CATENA 2020, 186, 104249. [Google Scholar] [CrossRef]
- Jazebi, S.; de León, F.; Nelson, A. Review of Wildfire Management Techniques—Part I: Causes, Prevention, Detection, Suppression, and Data Analytics. IEEE Trans. Power Deliv. 2020, 35, 430–439. [Google Scholar] [CrossRef]
- Liang, Z.; Wang, C.; Khan, K.U.J. Application and Comparison of Different Ensemble Learning Machines Combining with a Novel Sampling Strategy for Shallow Landslide Susceptibility Mapping. Stoch. Environ. Res. Risk Assess. 2020. [Google Scholar] [CrossRef]
- Kadavi, P.R.; Lee, C.-W.; Lee, S. Application of Ensemble-Based Machine Learning Models to Landslide Susceptibility Mapping. Remote Sens. 2018, 10, 1252. [Google Scholar] [CrossRef] [Green Version]
- Al-Abadi, A.M. Mapping Flood Susceptibility in an Arid Region of Southern Iraq Using Ensemble Machine Learning Classifiers: A Comparative Study. Arab. J. Geosci. 2018, 11, 218. [Google Scholar] [CrossRef]
- Hong, H.; Liu, J.; Bui, D.T.; Pradhan, B.; Acharya, T.D.; Pham, B.T.; Zhu, A.-X.; Chen, W.; Ahmad, B.B. Landslide Susceptibility Mapping Using J48 Decision Tree with AdaBoost, Bagging and Rotation Forest Ensembles in the Guangchang Area (China). CATENA 2018, 163, 399–413. [Google Scholar] [CrossRef]
- Pham, B.T.; Tien Bui, D.; Prakash, I.; Dholakia, M.B. Hybrid Integration of Multilayer Perceptron Neural Networks and Machine Learning Ensembles for Landslide Susceptibility Assessment at Himalayan Area (India) Using GIS. CATENA 2017, 149, 52–63. [Google Scholar] [CrossRef]
- Bui, D.T.; Tsangaratos, P.; Ngo, P.-T.T.; Pham, T.D.; Pham, B.T. Flash Flood Susceptibility Modeling Using an Optimized Fuzzy Rule Based Feature Selection Technique and Tree Based Ensemble Methods. Sci. Total Environ. 2019, 668, 1038–1054. [Google Scholar] [CrossRef]
- Wang, Y.; Feng, L.; Li, S.; Ren, F.; Du, Q. A Hybrid Model Considering Spatial Heterogeneity for Landslide Susceptibility Mapping in Zhejiang Province, China. CATENA 2020, 188, 104425. [Google Scholar] [CrossRef]
- Sachdeva, S.; Bhatia, T.; Verma, A.K. GIS-Based Evolutionary Optimized Gradient Boosted Decision Trees for Forest Fire Susceptibility Mapping. Nat. Hazards 2018, 92, 1399–1418. [Google Scholar] [CrossRef]
- Liang, W.; Luo, S.; Zhao, G.; Wu, H. Predicting Hard Rock Pillar Stability Using GBDT, XGBoost, and LightGBM Algorithms. Mathematics 2020, 8, 765. [Google Scholar] [CrossRef]
- Towfiqul Islam, A.R.M.; Talukdar, S.; Mahato, S.; Kundu, S.; Eibek, K.U.; Pham, Q.B.; Kuriqi, A.; Linh, N.T.T. Flood Susceptibility Modelling Using Advanced Ensemble Machine Learning Models. Geosci. Front. 2021, 12, 101075. [Google Scholar] [CrossRef]
- Valdez, M.C.; Chang, K.-T.; Chen, C.-F.; Chiang, S.-H.; Santos, J.L. Modelling the Spatial Variability of Wildfire Susceptibility in Honduras Using Remote Sensing and Geographical Information Systems. Geomat. Nat. Hazards Risk 2017, 8, 876–892. [Google Scholar] [CrossRef] [Green Version]
- Wu, Y.; Ke, Y.; Chen, Z.; Liang, S.; Zhao, H.; Hong, H. Application of Alternating Decision Tree with AdaBoost and Bagging Ensembles for Landslide Susceptibility Mapping. CATENA 2020, 187, 104396. [Google Scholar] [CrossRef]
- Kim, H.G.; Lee, D.K.; Park, C.; Ahn, Y.; Kil, S.-H.; Sung, S.; Biging, G.S. Estimating Landslide Susceptibility Areas Considering the Uncertainty Inherent in Modeling Methods. Stoch. Environ. Res. Risk Assess. 2018, 32, 2987–3019. [Google Scholar] [CrossRef]
- Di Napoli, M.; Carotenuto, F.; Cevasco, A.; Confuorto, P.; Di Martire, D.; Firpo, M.; Pepe, G.; Raso, E.; Calcaterra, D. Machine Learning Ensemble Modelling as a Tool to Improve Landslide Susceptibility Mapping Reliability. Landslides 2020, 17, 1897–1914. [Google Scholar] [CrossRef]
- Tembata, K.; Takeuchi, K. Floods and Exports: An Empirical Study on Natural Disaster Shocks in Southeast Asia. Econ. Disasters Clim. Change 2019, 3, 39–60. [Google Scholar] [CrossRef] [Green Version]
- Kamworapan, S.; Surussavadee, C. Evaluation of CMIP5 Global Climate Models for Simulating Climatological Temperature and Precipitation for Southeast Asia. Adv. Meteorol. 2019, 2019, 1–18. [Google Scholar] [CrossRef]
- Zhang, Y.; Hou, X. Characteristics of Coastline Changes on Southeast Asia Islands from 2000 to 2015. Remote Sens. 2020, 12, 519. [Google Scholar] [CrossRef] [Green Version]
- Vadrevu, K.P.; Lasko, K.; Giglio, L.; Schroeder, W.; Biswas, S.; Justice, C. Trends in Vegetation Fires in South and Southeast Asian Countries. Sci. Rep. 2019, 9, 7422. [Google Scholar] [CrossRef]
- Jayachandran, S. Air Quality and Early-Life Mortality Evidence from Indonesia’s Wildfires. J. Hum. Resour. 2009, 44, 916–954. [Google Scholar] [CrossRef] [Green Version]
- Vetrita, Y.; Cochrane, M.A. Fire Frequency and Related Land-Use and Land-Cover Changes in Indonesia’s Peatlands. Remote Sens. 2020, 12, 5. [Google Scholar] [CrossRef] [Green Version]
- Ghorbanzadeh, O.; Valizadeh Kamran, K.; Blaschke, T.; Aryal, J.; Naboureh, A.; Einali, J.; Bian, J. Spatial Prediction of Wildfire Susceptibility Using Field Survey GPS Data and Machine Learning Approaches. Fire 2019, 2, 43. [Google Scholar] [CrossRef] [Green Version]
- Venkatesh, K.; Preethi, K.; Ramesh, H. Evaluating the Effects of Forest Fire on Water Balance Using Fire Susceptibility Maps. Ecol. Indic. 2020, 110, 105856. [Google Scholar] [CrossRef]
- Kirschbaum, D.; Stanley, T.; Zhou, Y. Spatial and Temporal Analysis of a Global Landslide Catalog. Geomorphology 2015, 249, 4–15. [Google Scholar] [CrossRef]
- Stanley, T.; Kirschbaum, D.B. A Heuristic Approach to Global Landslide Susceptibility Mapping. Nat. Hazards 2017, 87, 145–164. [Google Scholar] [CrossRef] [Green Version]
- Huang, Y.; Zhao, L. Review on Landslide Susceptibility Mapping Using Support Vector Machines. CATENA 2018, 165, 520–529. [Google Scholar] [CrossRef]
- Van Zyl, J.J. The Shuttle Radar Topography Mission (SRTM): A Breakthrough in Remote Sensing of Topography. Acta Astronaut. 2001, 48, 559–565. [Google Scholar] [CrossRef]
- Abatzoglou, J.T.; Dobrowski, S.Z.; Parks, S.A.; Hegewisch, K.C. TerraClimate, a High-Resolution Global Dataset of Monthly Climate and Climatic Water Balance from 1958–2015. Sci. Data 2018, 5, 170191. [Google Scholar] [CrossRef] [Green Version]
- Chen, B.; Xu, B.; Zhu, Z.; Yuan, C.; Suen, H.P.; Guo, J.; Xu, N.; Li, W.; Zhao, Y.; Yang, J. Stable Classification with Limited Sample: Transferring a 30-m Resolution Sample Set Collected in 2015 to Mapping 10-m Resolution Global Land Cover in 2017. Sci. Bull. 2019, 64, 370–373. [Google Scholar]
- Styron, R.; Pagani, M. The GEM Global Active Faults Database. Earthq. Spectra 2020, 36, 160–180. [Google Scholar] [CrossRef]
- Mapping Global Urban Boundaries from the Global Artificial Impervious Area (GAIA) Data-IOPscience. Available online: https://0-iopscience-iop-org.brum.beds.ac.uk/article/10.1088/1748–9326/ab9be3/meta (accessed on 7 April 2021).
- Hartmann, J.; Moosdorf, N. The New Global Lithological Map Database GLiM: A Representation of Rock Properties at the Earth Surface. Geochem. Geophys. Geosystems 2012, 13. [Google Scholar] [CrossRef]
- Juang, C.S.; Stanley, T.A.; Kirschbaum, D.B. Using Citizen Science to Expand the Global Map of Landslides: Introducing the Cooperative Open Online Landslide Repository (COOLR). PLoS ONE 2019, 14, e0218657. [Google Scholar] [CrossRef] [Green Version]
- Sze, J.S.; Jefferson, L.J.S. Evaluating the Social and Environmental Factors behind the 2015 Extreme Fire Event in Sumatra, Indonesia. Environ. Res. Lett. 2019, 14, 15001. [Google Scholar] [CrossRef]
- Pourghasemi, H.R.; Sadhasivam, N.; Kariminejad, N.; Collins, A.L. Gully Erosion Spatial Modelling: Role of Machine Learning Algorithms in Selection of the Best Controlling Factors and Modelling Process. Geosci. Front. 2020, 11, 2207–2219. [Google Scholar] [CrossRef]
- Chen, X.; Chen, W. GIS-Based Landslide Susceptibility Assessment Using Optimized Hybrid Machine Learning Methods. Catena 2021, 196, 104833. [Google Scholar] [CrossRef]
- Dou, J.; Yunus, A.P.; Tien Bui, D.; Merghadi, A.; Sahana, M.; Zhu, Z.; Chen, C.-W.; Khosravi, K.; Yang, Y.; Pham, B.T. Assessment of Advanced Random Forest and Decision Tree Algorithms for Modeling Rainfall-Induced Landslide Susceptibility in the Izu-Oshima Volcanic Island, Japan. Sci. Total Environ. 2019, 662, 332–346. [Google Scholar] [CrossRef]
- Khosravi, K.; Shahabi, H.; Pham, B.T.; Adamowski, J.; Shirzadi, A.; Pradhan, B.; Dou, J.; Ly, H.-B.; Gróf, G.; Ho, H.L. A Comparative Assessment of Flood Susceptibility Modeling Using Multi-Criteria Decision-Making Analysis and Machine Learning Methods. J. Hydrol. 2019, 573, 311–323. [Google Scholar] [CrossRef]
- Chen, W.; Li, Y.; Xue, W.; Shahabi, H.; Li, S.; Hong, H.; Wang, X.; Bian, H.; Zhang, S.; Pradhan, B.; et al. Modeling Flood Susceptibility Using Data-Driven Approaches of Naïve Bayes Tree, Alternating Decision Tree, and Random Forest Methods. Sci. Total Environ. 2020, 701, 134979. [Google Scholar] [CrossRef]
- Zhao, X.; Chen, W. Optimization of Computational Intelligence Models for Landslide Susceptibility Evaluation. Remote Sens. 2020, 12, 2180. [Google Scholar] [CrossRef]
- Freund, Y.; Schapire, R.E. A Decision-Theoretic Generalization of On-Line Learning and an Application to Boosting. J. Comput. Syst. Sci. 1997, 55, 119–139. [Google Scholar] [CrossRef] [Green Version]
- Liang, Z.; Wang, C.; Duan, Z.; Liu, H.; Liu, X.; Ullah Jan Khan, K. A Hybrid Model Consisting of Supervised and Unsupervised Learning for Landslide Susceptibility Mapping. Remote Sens. 2021, 13, 1464. [Google Scholar] [CrossRef]
- Song, Y.; Niu, R.; Xu, S.; Ye, R.; Peng, L.; Guo, T.; Li, S.; Chen, T. Landslide Susceptibility Mapping Based on Weighted Gradient Boosting Decision Tree in Wanzhou Section of the Three Gorges Reservoir Area (China). ISPRS Int. J. Geo Inf. 2019, 8, 4. [Google Scholar] [CrossRef] [Green Version]
- Wang, F.; Jiang, D.; Wen, H.; Song, H. Adaboost-Based Security Level Classification of Mobile Intelligent Terminals. J. Supercomput. 2019, 75, 7460–7478. [Google Scholar] [CrossRef]
- Breiman, L. Random Forests. Mach. Learn. 2001, 45, 5–32. [Google Scholar] [CrossRef] [Green Version]
- Pourghasemi, H.R.; Gayen, A.; Edalat, M.; Zarafshar, M.; Tiefenbacher, J.P. Is Multi-Hazard Mapping Effective in Assessing Natural Hazards and Integrated Watershed Management? Geosci. Front. 2020, 11, 1203–1217. [Google Scholar] [CrossRef]
- Conoscenti, C.; Ciaccio, M.; Caraballo-Arias, N.A.; Gómez-Gutiérrez, Á.; Rotigliano, E.; Agnesi, V. Assessment of Susceptibility to Earth-Flow Landslide Using Logistic Regression and Multivariate Adaptive Regression Splines: A Case of the Belice River Basin (Western Sicily, Italy). Geomorphology 2015, 242, 49–64. [Google Scholar] [CrossRef]
- Chen, W.; Chen, Y.; Tsangaratos, P.; Ilia, I.; Wang, X. Combining Evolutionary Algorithms and Machine Learning Models in Landslide Susceptibility Assessments. Remote Sens. 2020, 12, 3854. [Google Scholar] [CrossRef]
- Mathew, J.; Jha, V.K.; Rawat, G.S. Landslide Susceptibility Zonation Mapping and Its Validation in Part of Garhwal Lesser Himalaya, India, Using Binary Logistic Regression Analysis and Receiver Operating Characteristic Curve Method. Landslides 2009, 6, 17–26. [Google Scholar] [CrossRef]
- Pourghasemi, H.R.; Kariminejad, N.; Amiri, M.; Edalat, M.; Zarafshar, M.; Blaschke, T.; Cerda, A. Assessing and Mapping Multi-Hazard Risk Susceptibility Using a Machine Learning Technique. Sci. Rep. 2020, 10, 1–11. [Google Scholar]
- Rossi, M.; Reichenbach, P. LAND-SE: A Software for Statistically Based Landslide Susceptibilityzonation, Version 1.0. Geosci. Model. Dev. 2016, 9, 3533–3543. [Google Scholar] [CrossRef] [Green Version]
- Choubin, B.; Moradi, E.; Golshan, M.; Adamowski, J.; Sajedi-Hosseini, F.; Mosavi, A. An Ensemble Prediction of Flood Susceptibility Using Multivariate Discriminant Analysis, Classification and Regression Trees, and Support Vector Machines. Sci. Total Environ. 2019, 651, 2087–2096. [Google Scholar] [CrossRef]
- Pourghasemi, H.R.; Rahmati, O. Prediction of the Landslide Susceptibility: Which Algorithm, Which Precision? CATENA 2018, 162, 177–192. [Google Scholar] [CrossRef]
- Wilde, M.; Günther, A.; Reichenbach, P.; Malet, J.-P.; Hervás, J. Pan-European Landslide Susceptibility Mapping: ELSUS Version 2. J. Maps 2018, 14, 97–104. [Google Scholar] [CrossRef] [Green Version]
- Pham, B.T.; Bui, D.T.; Prakash, I. Bagging Based Support Vector Machines for Spatial Prediction of Landslides. Environ. Earth Sci. 2018, 77, 1–17. [Google Scholar] [CrossRef]
- Lima, P.; Steger, S.; Glade, T.; Tilch, N.; Schwarz, L.; Kociu, A. Landslide Susceptibility Mapping at National Scale: A First Attempt for Austria. In Proceedings of the Advancing Culture of Living with Landslides, Ljubljana, Slovenia, 29 May–2 June 2017; Mikos, M., Tiwari, B., Yin, Y., Sassa, K., Eds.; Springer International Publishing: Cham, Switzerland, 2017; pp. 943–951. [Google Scholar]
- Field, R.D.; van der Werf, G.R.; Shen, S.S.P. Human Amplification of Drought-Induced Biomass Burning in Indonesia since 1960. Nat. Geosci. 2009, 2, 185–188. [Google Scholar] [CrossRef]
- Tilloy, A.; Malamud, B.D.; Winter, H.; Joly-Laugel, A. A Review of Quantification Methodologies for Multi-Hazard Interrelationships. Earth Sci. Rev. 2019, 196, 102881. [Google Scholar] [CrossRef]
- Xiao, C.; Tian, Y.; Shi, W.; Guo, Q.; Wu, L. A New Method of Pseudo Absence Data Generation in Landslide Susceptibility Mapping with a Case Study of Shenzhen. Sci. China Technol. Sci. 2010, 53, 75–84. [Google Scholar] [CrossRef]
- Miao, Y.M.; Zhu, A.X.; Yang, L.; Bai, S.B.; Liu, J.Z.; Deng, Y. Sensitivity of BCS for Sampling Landslide Absence Data in Landslide Susceptibility Assessment. Mt. Res. Dev. 2016, 34, 432–441. [Google Scholar]
- Zhu, J.; Baise, L.G.; Thompson, E.M. An Updated Geospatial Liquefaction Model for Global ApplicationAn Updated Geospatial Liquefaction Model for Global Application. Bull. Seismol. Soc. Am. 2017, 107, 1365–1385. [Google Scholar] [CrossRef]
- Nowicki Jessee, M.A.; Hamburger, M.W.; Allstadt, K.; Wald, D.J.; Robeson, S.M.; Tanyas, H.; Hearne, M.; Thompson, E.M. A Global Empirical Model for Near-Real-Time Assessment of Seismically Induced Landslides. J. Geophys. Res. Earth Surf. 2018, 123, 1835–1859. [Google Scholar] [CrossRef] [Green Version]
- Tonini, M.; D’Andrea, M.; Biondi, G.; Degli Esposti, S.; Trucchia, A.; Fiorucci, P. A Machine Learning-Based Approach for Wildfire Susceptibility Mapping. The Case Study of the Liguria Region in Italy. Geosciences 2020, 10, 105. [Google Scholar] [CrossRef] [Green Version]
Figure 1.
The location of the study area and the distribution of (c) landslide and (d) wildfire points. (a) The location of Southeast Asia on the globe. (b) Sovereign states in Southeast Asia.
Figure 1.
The location of the study area and the distribution of (c) landslide and (d) wildfire points. (a) The location of Southeast Asia on the globe. (b) Sovereign states in Southeast Asia.

Figure 2.
Conditioning factors used in this paper: (a) elevation, (b) slope angle, (c) aspect, (d) plan curvature, (e) profile curvature, (f) distance to urban areas, (g) distance to rivers, (h) distance to roads, (i) distance to faults, (j) SPI, (k) TWI, (l) soil moisture, (m) wind speed, (n) mean annual precipitation, (o) NDVI, (p) mean annual maximum temperature, (q) lithology and (r) land use. NOTE: In (q): su, Unconsolidated sediments; ss, Siliciclastic sedimentary rocks; py, Pyroclastics; sm, Mixed sedimentary rocks; sc, Carbonate sedimentary rocks; ev, Evaporites; va, Acid volcanic rocks; vi, Intermediate volcanic rocks; vb, Basic volcanic rocks; pa, Acid plutonic rocks; pi, Intermediate plutonic rocks; pb, Basic plutonic rocks; mt, Metamorphics; wb, Water Bodies; ig, Ice and Glaciers and nd, No Data. In (r): (1) Cropland, (2) Forest, (3) Grassland, (4) Shrubland, (5) Wetland, (6) Water, (7) Tundra, (8) Impervious surface, (9) Bareland and (10) Snow/Ice.


Figure 3.
Flow chart of the landslide and wildfire susceptibility modeling and mapping in this paper.
Figure 3.
Flow chart of the landslide and wildfire susceptibility modeling and mapping in this paper.

Figure 4.
Contingency plots summarizing the confusion matrix values, (a–c) landslides and (d–f) wildfires.
Figure 4.
Contingency plots summarizing the confusion matrix values, (a–c) landslides and (d–f) wildfires.

Figure 5.
Susceptibility map using the RF model: (a) landslides and (b) wildfires.

Figure 6.
Overlaid landslide and wildfire susceptibility classification using the RF model for Southeast Asia.
Figure 6.
Overlaid landslide and wildfire susceptibility classification using the RF model for Southeast Asia.

Figure 7.
Uncertainty map intersecting the landslide susceptibility with the CV.

Figure 8.
Uncertainty map intersecting the wildfire susceptibility with the CV.

Figure 9.
Graph summarizing the areas of different combinations of the intersection between susceptibility and uncertainty ((a) landslides and (b) wildfires). The legend in the bar charts is constistent with those in Figure 7 and Figure 8.

Figure 10.
The relative importance of the conditioning factors ((a) landslides and (b) wildfires).


Table 1.
Summary of the data sources used in this paper.
| No | Dataset | Source | Reference |
|---|---|---|---|
| 1 | DEM | SRTM Data (http://srtm.csi.cgiar.org/srtmdata/ accessed on 26 March 2021) | [65] |
| 2 | Climate | TerraClimate (http://www.climatologylab.org/terraclimate.html accessed on 26 March 2021) | [66] |
| 3 | Land coverage | FROM-GLC 2017v1(http://0-data-ess-tsinghua-edu-cn.brum.beds.ac.uk/ accessed on 26 March 2021) | [67] |
| 4 | Road | OMS (https://www.openstreetmap.org/) Primary and motorway | OpenStreetMap |
| 5 | Fault | GEM Global Active Faults (https://github.com/GEMScienceTools/gem-global-active-faults accessed on 26 March 2021) | [68] |
| 6 | River | OSM (https://www.openstreetmap.org/ accessed on 26 March 2021) | OpenStreetMap |
| 7 | Urban areas | http://0-data-ess-tsinghua-edu-cn.brum.beds.ac.uk/ accessed on 26 March 2021 | [69] |
| 8 | Lithology | Global Lithological Map Database v1.0 (https://doi.pangaea.de/10.1594/PANGAEA.788537 accessed on 26 March 2021) | [70] |
| 9 | NDVI | https://lpdaac.usgs.gov/products/mod13q1v006/ accessed on 26 March 2021 | MODIS MOD13Q1 |
| 10 | Landslide | https://maps.nccs.nasa.gov/arcgis/apps/MapAndAppGallery/index.html?appid=574f26408683485799d02e857e5d9521 accessed on 26 March 2021 | [71] |
| 11 | Fire location | https://firms.modaps.eosdis.nasa.gov/ accessed on 26 March 2021 | MODIS MCD14DL |
Table 2.
Separate factors used for landslide and wildfire susceptibility modeling.
| Factors | Landslide | Wildfire |
|---|---|---|
| Elevation | √ | √ |
| Slope | √ | √ |
| Aspect | √ | - |
| Plan curvature | √ | - |
| Profile curvature | √ | - |
| Distance to urbans | - | √ |
| Distance to rivers | √ | √ |
| Distance to roads | √ | √ |
| Distance to faults | √ | - |
| NDVI | √ | √ |
| Precipitation | √ | √ |
| Temperature | - | √ |
| Wind speed | - | √ |
| Soil moisture | √ | - |
| Lithology | √ | - |
| Land use | √ | - |
| TWI | √ | √ |
| SPI | √ | - |
Table 3.
Evaluation matrix on the performances of the different models for the two hazards.
| Hazards | Models | ACC | Precision | AUC |
|---|---|---|---|---|
| Landslide | AdaBoost | 0.77 | 0.75 | 0.86 |
| GBDT | 0.78 | 0.76 | 0.87 | |
| RF | 0.81 | 0.78 | 0.89 | |
| Fire | AdaBoost | 0.74 | 0.72 | 0.81 |
| GBDT | 0.80 | 0.78 | 0.88 | |
| RF | 0.83 | 0.83 | 0.91 |
Table 4.
Nonhazard sampling strategies.
| Strategy | Description |
|---|---|
| I | Buffer 5–10 km |
| II | Buffer 10–15 km |
| III | Buffer 15–20 km |
| IV | The whole region minus the 5-km buffer |
Table 5.
Model performance using different nonhazard sampling strategies.
| Hazard | Strategy | RF | GBDT | AdaBoost | ||||||
|---|---|---|---|---|---|---|---|---|---|---|
| ACC | Precision | AUC | ACC | Precision | AUC | ACC | Precision | AUC | ||
| Landslide | I | 0.69 | 0.71 | 0.72 | 0.67 | 0.68 | 0.71 | 0.67 | 0.66 | 0.7 |
| II | 0.70 | 0.70 | 0.75 | 0.69 | 0.68 | 0.73 | 0.67 | 0.65 | 0.72 | |
| III | 0.73 | 0.72 | 0.8 | 0.71 | 0.70 | 0.78 | 0.68 | 0.65 | 0.75 | |
| IV | 0.78 | 0.76 | 0.87 | 0.77 | 0.75 | 0.86 | 0.76 | 0.74 | 0.85 | |
| Wildfire | I | 0.66 | 0.60 | 0.84 | 0.65 | 0.64 | 0.69 | 0.64 | 0.64 | 0.67 |
| II | 0.71 | 0.70 | 0.78 | 0.68 | 0.67 | 0.73 | 0.61 | 0.61 | 0.66 | |
| III | 0.76 | 0.79 | 0.82 | 0.70 | 0.70 | 0.77 | 0.63 | 0.63 | 0.66 | |
| IV | 0.84 | 0.83 | 0.9 | 0.81 | 0.79 | 0.89 | 0.74 | 0.73 | 0.82 | |
Publisher’s Note: MDPI stays neutral with regard to jurisdictional claims in published maps and institutional affiliations. |
© 2021 by the authors. Licensee MDPI, Basel, Switzerland. This article is an open access article distributed under the terms and conditions of the Creative Commons Attribution (CC BY) license (https://creativecommons.org/licenses/by/4.0/).
Share and Cite
MDPI and ACS Style
He, Q.; Jiang, Z.; Wang, M.; Liu, K. Landslide and Wildfire Susceptibility Assessment in Southeast Asia Using Ensemble Machine Learning Methods. Remote Sens. 2021, 13, 1572. https://0-doi-org.brum.beds.ac.uk/10.3390/rs13081572
AMA Style
He Q, Jiang Z, Wang M, Liu K. Landslide and Wildfire Susceptibility Assessment in Southeast Asia Using Ensemble Machine Learning Methods. Remote Sensing. 2021; 13(8):1572. https://0-doi-org.brum.beds.ac.uk/10.3390/rs13081572
Chicago/Turabian StyleHe, Qian, Ziyu Jiang, Ming Wang, and Kai Liu. 2021. "Landslide and Wildfire Susceptibility Assessment in Southeast Asia Using Ensemble Machine Learning Methods" Remote Sensing 13, no. 8: 1572. https://0-doi-org.brum.beds.ac.uk/10.3390/rs13081572
Note that from the first issue of 2016, this journal uses article numbers instead of page numbers. See further details here.