Article

Monitoring Subsidence in Urban Area by PSInSAR: A Case Study of Abbottabad City, Northern Pakistan

1
Key Laboratory of Metallogenic Prediction of Nonferrous Metals and Geological Environment Monitoring, Ministry of Education, School of Geosciences and Info-Physics, Central South University, Changsha 410083, China
2
Key State Laboratory of Information Engineering in Surveying, Mapping, and Remote Sensing (LIESMARS), Wuhan University, Wuhan 430079, China
3
National Engineering Research Center for Geographic Information System (NERCGIS), School of Geography, China University of Geosciences, Wuhan 430074, China
*
Author to whom correspondence should be addressed.
Submission received: 22 February 2021 / Revised: 13 April 2021 / Accepted: 19 April 2021 / Published: 23 April 2021

Abstract

:
Globally, major cities are experiencing fast settlement growth, which threatens the equilibrium of socio-ecosystems. In Pakistan, Abbottabad city in particular is experiencing fast urban growth. The main source of daily water usage for the population in these types of cities is groundwater (tube–wells). Excessive pumping and the high need for ground water for the local community are affecting the subsurface sustainability. In this study, the persistent scatterer interferometry synthetic aperture radar (PSInSAR) technique with synthetic aperture radar (SAR) images acquired from the Sentinel-1 were used to monitor ground subsidence in Abbottabad City, Northern Pakistan. To estimate the ground subsidence in Abbottabad City, SARPROZ software was employed to process a series of Sentinel-1 images, acquired from March 2017 to September 2019, along both descending and ascending orbit tracks. The subsidence observed in the results shows a significant increase from 2017 to 2019. The subsidence map shows that, during 2017, the subsidence was −30 mm/year and about −85 mm/year in 2018. While during 2019, the subsidence reached −150 mm/year. Thus, it has seen that, in the study area, the subsidence during these years increased with mean subsidence 60 mm/year. The overall trend of subsidence showed considerably high values in the center of the city, while areas away from the center of the city experienced low subsidence. Overall, the adopted methodology can be used successfully for detecting, mapping, and monitoring land surfaces vulnerable to subsidence. This will facilitate efficient planning, designing of surface infrastructure, and mitigation management of subsidence-induced hazards.

1. Introduction

Ground subsidence is a major concern throughout the world for responsible authorities addressing geohazard risks [1]. There are many factors that influence ground subsidence, including some natural and anthropogenic phenomena [2,3]. One of the most reported factors responsible for subsidence are, for example, the excessive extraction of groundwater [4], underground construction, and mining [5,6]. Globally, people are shifting from rural to urban areas for better job opportunities and to access standard life facilities. These uncontrolled and unplanned growths in a region are affecting the natural resources. The demand for daily water exploitation is increasing and, as a result, excessive extraction of groundwater is causing ground subsidence [2,7,8,9].
Various traditional techniques have been used and described previously to measure subsidence. Previously used subsidence monitoring techniques are usually point-based, i.e., leveling, global positioning systems (GPS) [10], ground-based observation field data, etc. Recently, ground-based observation analysis has been replaced by spaced-based observations, with the advantages of enough information collection in short intervals of time, cost-effectiveness, and it is independent of weather conditions. The first method introduced to monitor ground subsidence was interferometric synthetic aperture radar (InSAR), which has been employed successfully with significant accuracy effectiveness covering areas from hundreds to thousands of square kilometers per interferogram [11]. The basic principal of InSAR is the acquisition of synthetic aperture radar (SAR) images of the targeted region to obtain ground surface information and its patterns of deformation. Information is extracted from the signals transmitted by the SAR system to the surface and its scatter back from various objects on the surface. The phase (distance between satellite antenna and target object) and amplitude (determined from surface roughness, terrain slopes, etc.) of reflected signals are used to calculate information about various objects on the surface [12,13]. This approach has been successfully used for the application of landslide analysis [13], subsidence influenced by the extraction of groundwater [14], deformation caused by mining [14], and the management of urban growth [15]. In previous studies, differential interferometric synthetic aperture radar (DInSAR) has been successfully used to generate high spatial resolution deformation maps across wide areas, with an accuracy range of centimeters to millimeters [6,11]. The effectiveness of DInSAR techniques in monitoring land subsidence has been proved in many applications [12,13], which shows that ground subsidence caused by excessive extraction of groundwater is a common geohazard impacting urban areas worldwide [16]. DInSAR has been widely used in many studies to analyze the temporal evolution of land subsidence in urban areas induced by natural and anthropogenic factors [15,17], and the compaction of subsurface layers [18]. However, the temporal decorrelation and atmospheric disturbances largely affect the quality of interferograms using the DInSAR technique [19].
In InSAR research, a significant development has produced to reduce the limitations of DInSAR. A reliable deformation map can be derived from a multi-image framework by analyzing the spatial–temporal development of so-called permanent scatterers (PS) [20]. To improve the accuracy in conventional InSAR deformation analysis, the PSInSAR technique uses unique characteristics of anomalies caused by atmospheric delay and backscattering of certain PS on the surface. Thus, PSInSAR can modify and improve the measurement of deformations, from 10–20 mm to 2–3 mm [20]. PSInSAR has a wide range of applications in monitoring geohazards, such as mapping displacements induced by seismic activities, landslides, volcanic swelling, ground subsidence caused by groundwater extraction, underground mining activities, and subway tunnel construction [5,21,22]. Similar research has been widely conducted in urban areas using the PSInSAR technique to monitor ground subsidence using Sentinel-1 data in Algeria [23], Beijing [24,25], London [26], Los Angeles [27], Mashhad (Middle East) [28], coastal areas of Africa [29], Spain [30], etc.
Ground subsidence is a serious issue in many cities of Pakistan, especially Abbottabad City [8], which has a population of around two million and hosts many educational institutions, including medical, engineering, and military institutes. To facilitate urban growth, various water supply projects have been launched by the local government in coordination with the Japanese government [31]. Deep bore-wells for water supply have disturbed subsurface water levels [8]. Furthermore, the main drainage for water flow has been blocked by unplanned construction, which leads to contamination and blockage of water outflows [8]. In order to avoid serious disasters caused by ground subsidence in the future. This study was conducted to monitor ground subsidence in Abbottabad City, Northern Pakistan, during period of 31 March 2017 to 17 September 2019, and from 10 February 2017 to 21 December 2019, with both descending and ascending tracks, respectively. As one target area can be seen by the satellite from different positions with the incidence angle range between vertical (~23°) and horizontal (~45°) [32] in the East–West direction, ascending and descending track images are used to help to improve visualization and better understand deformation from various directions [33]. Furthermore, our study evaluates the capability of using the PSInSAR technique for ground subsidence analyses in an urban area [34,35,36,37].

2. A Case Study of Abbottabad City

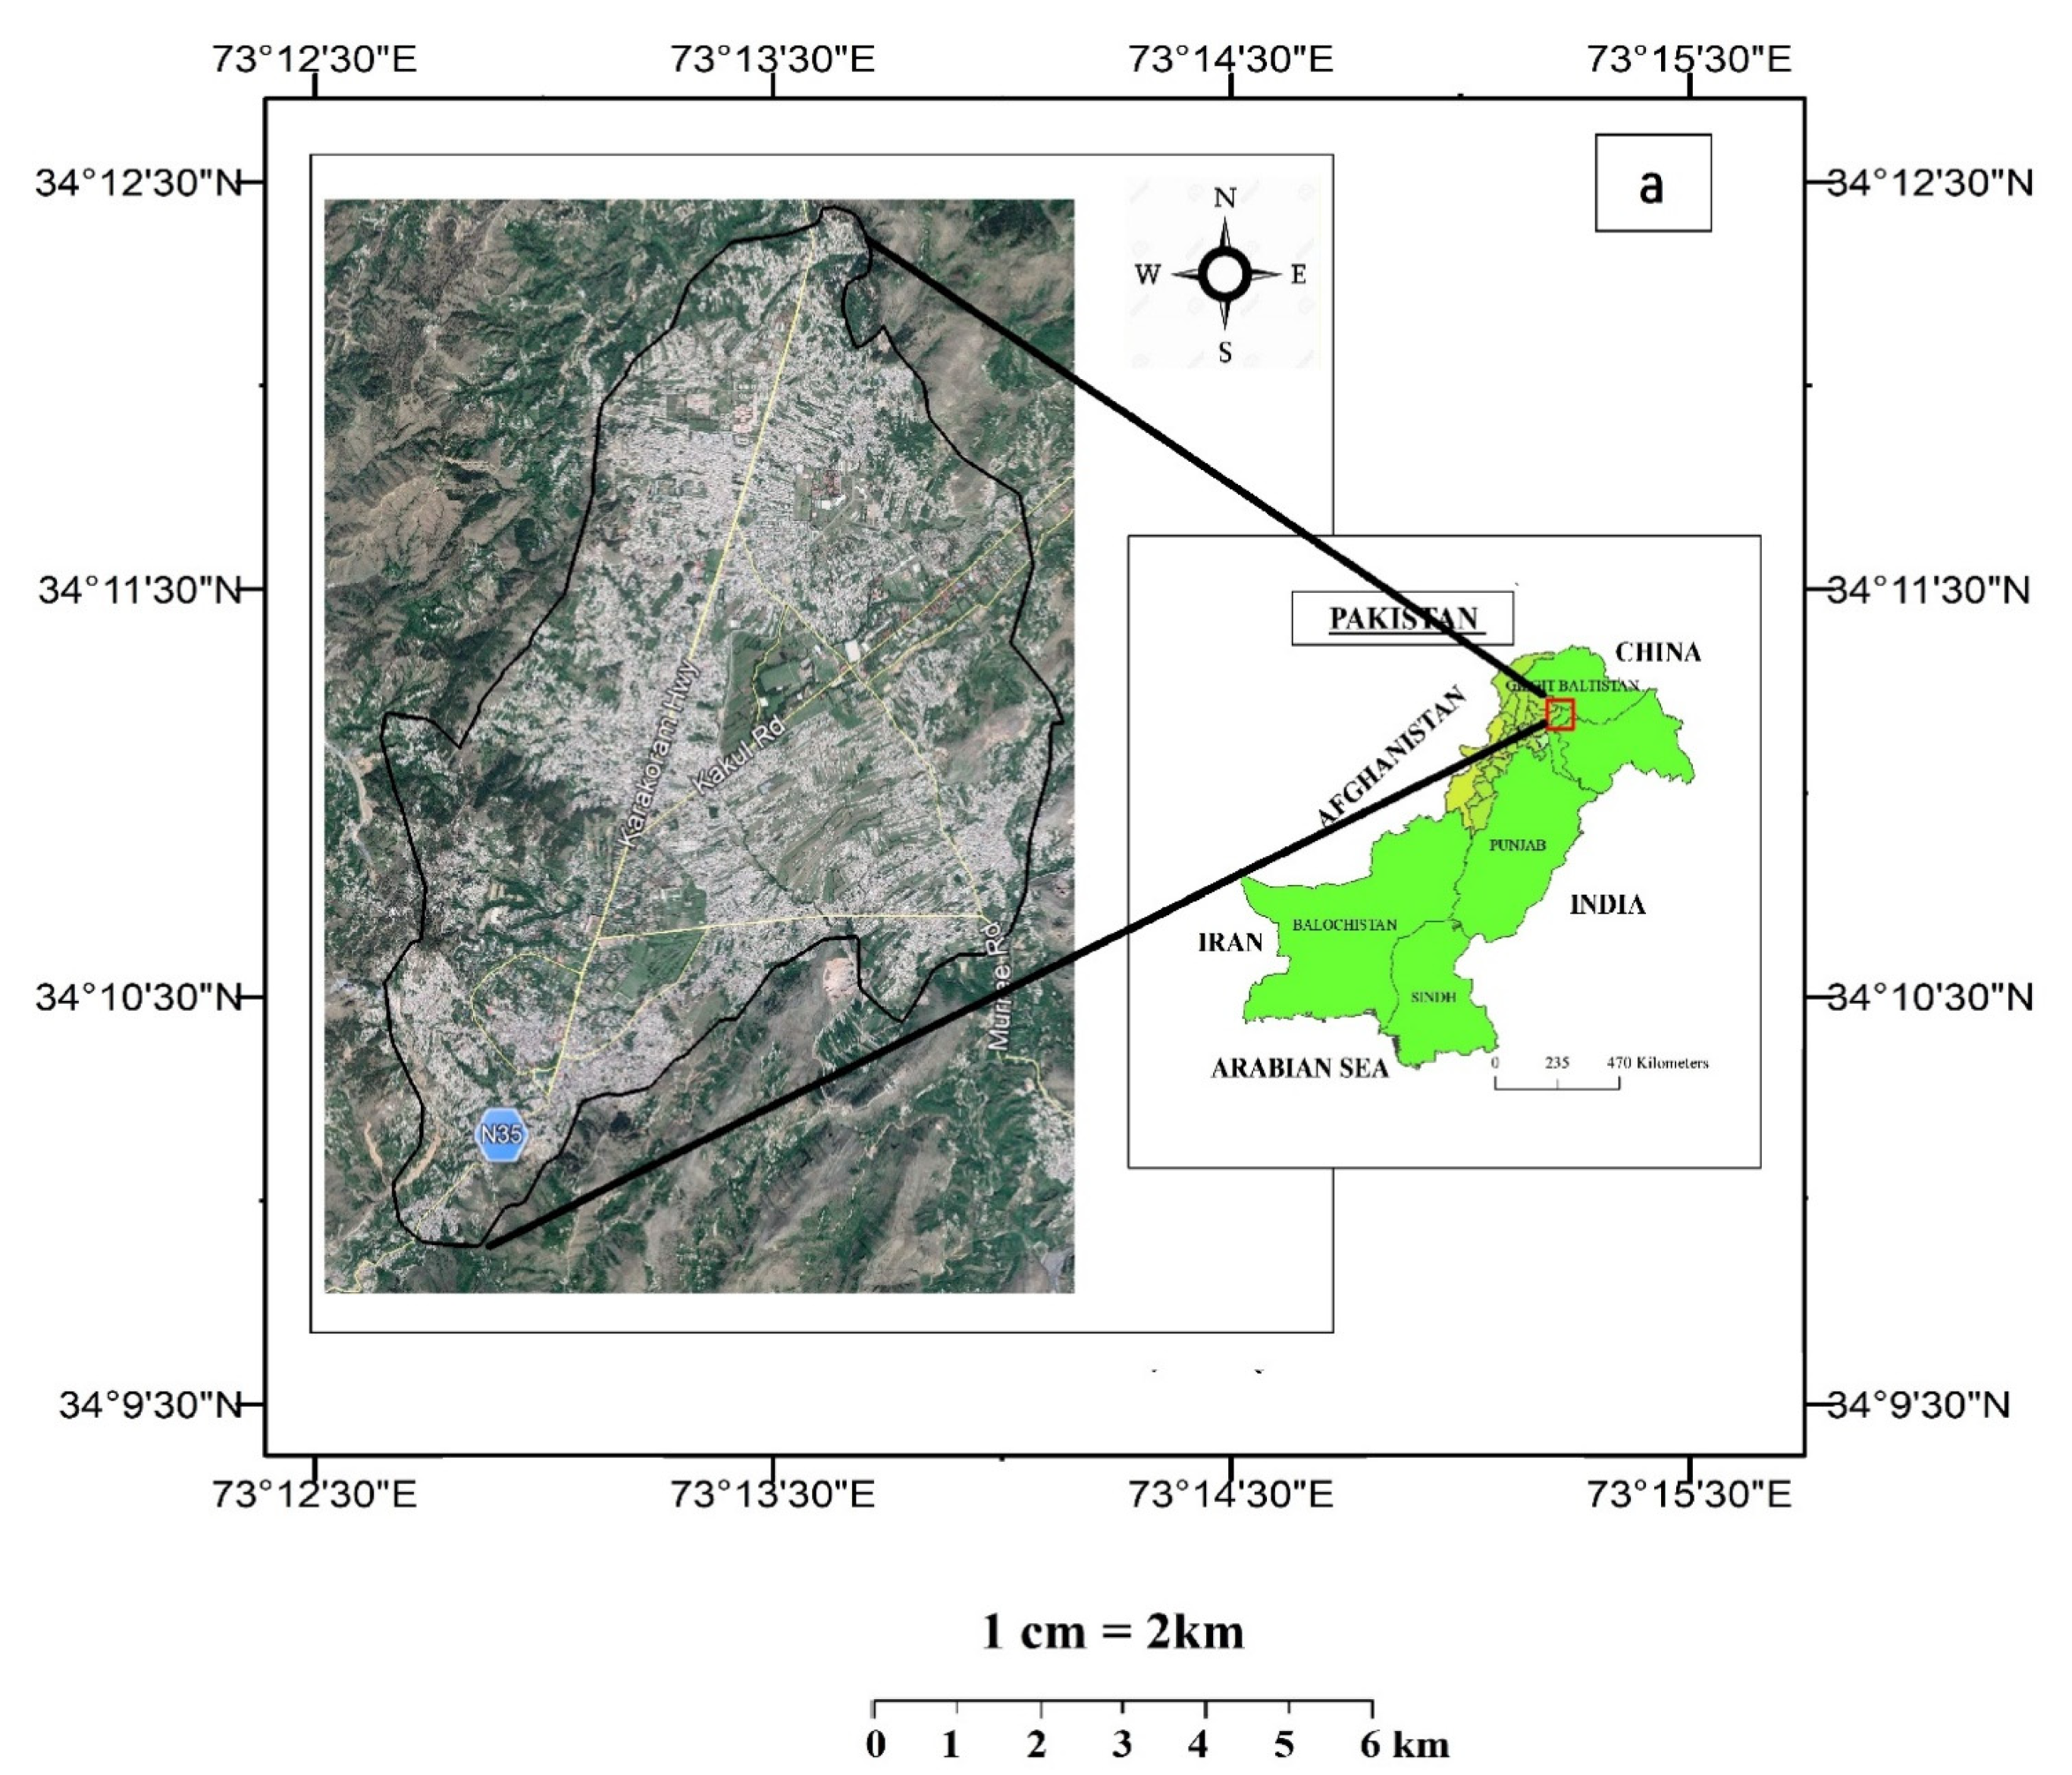
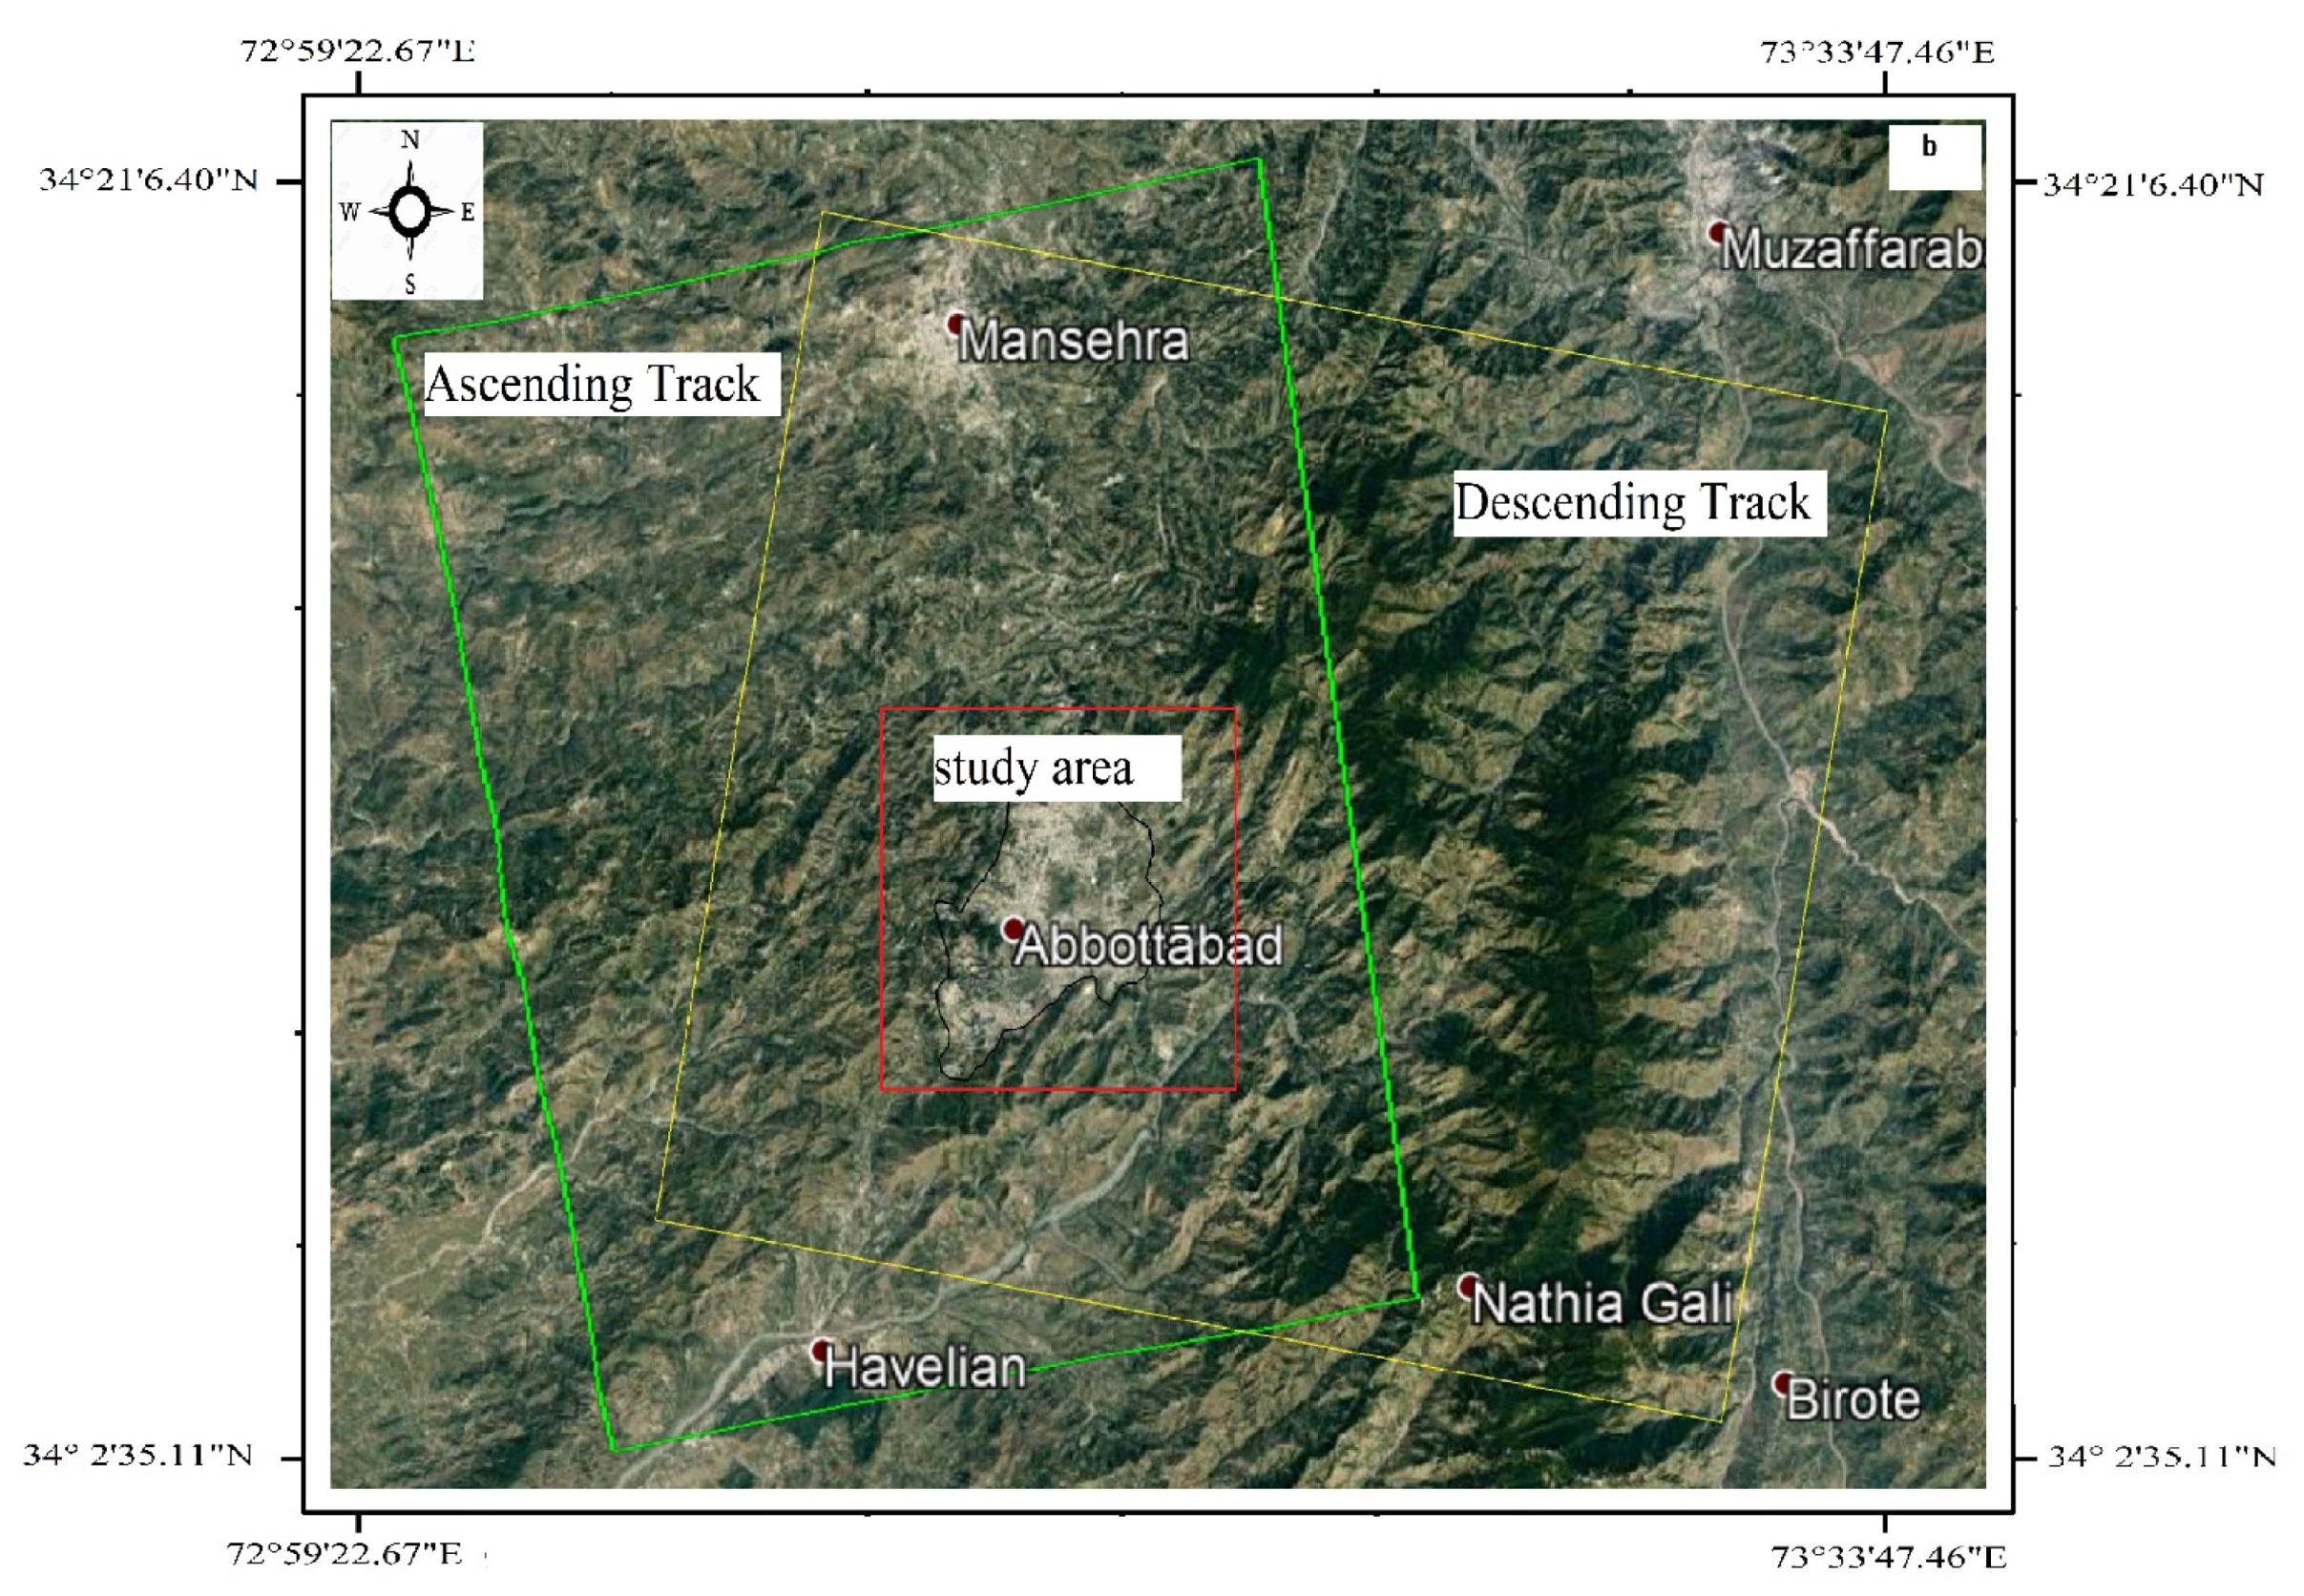
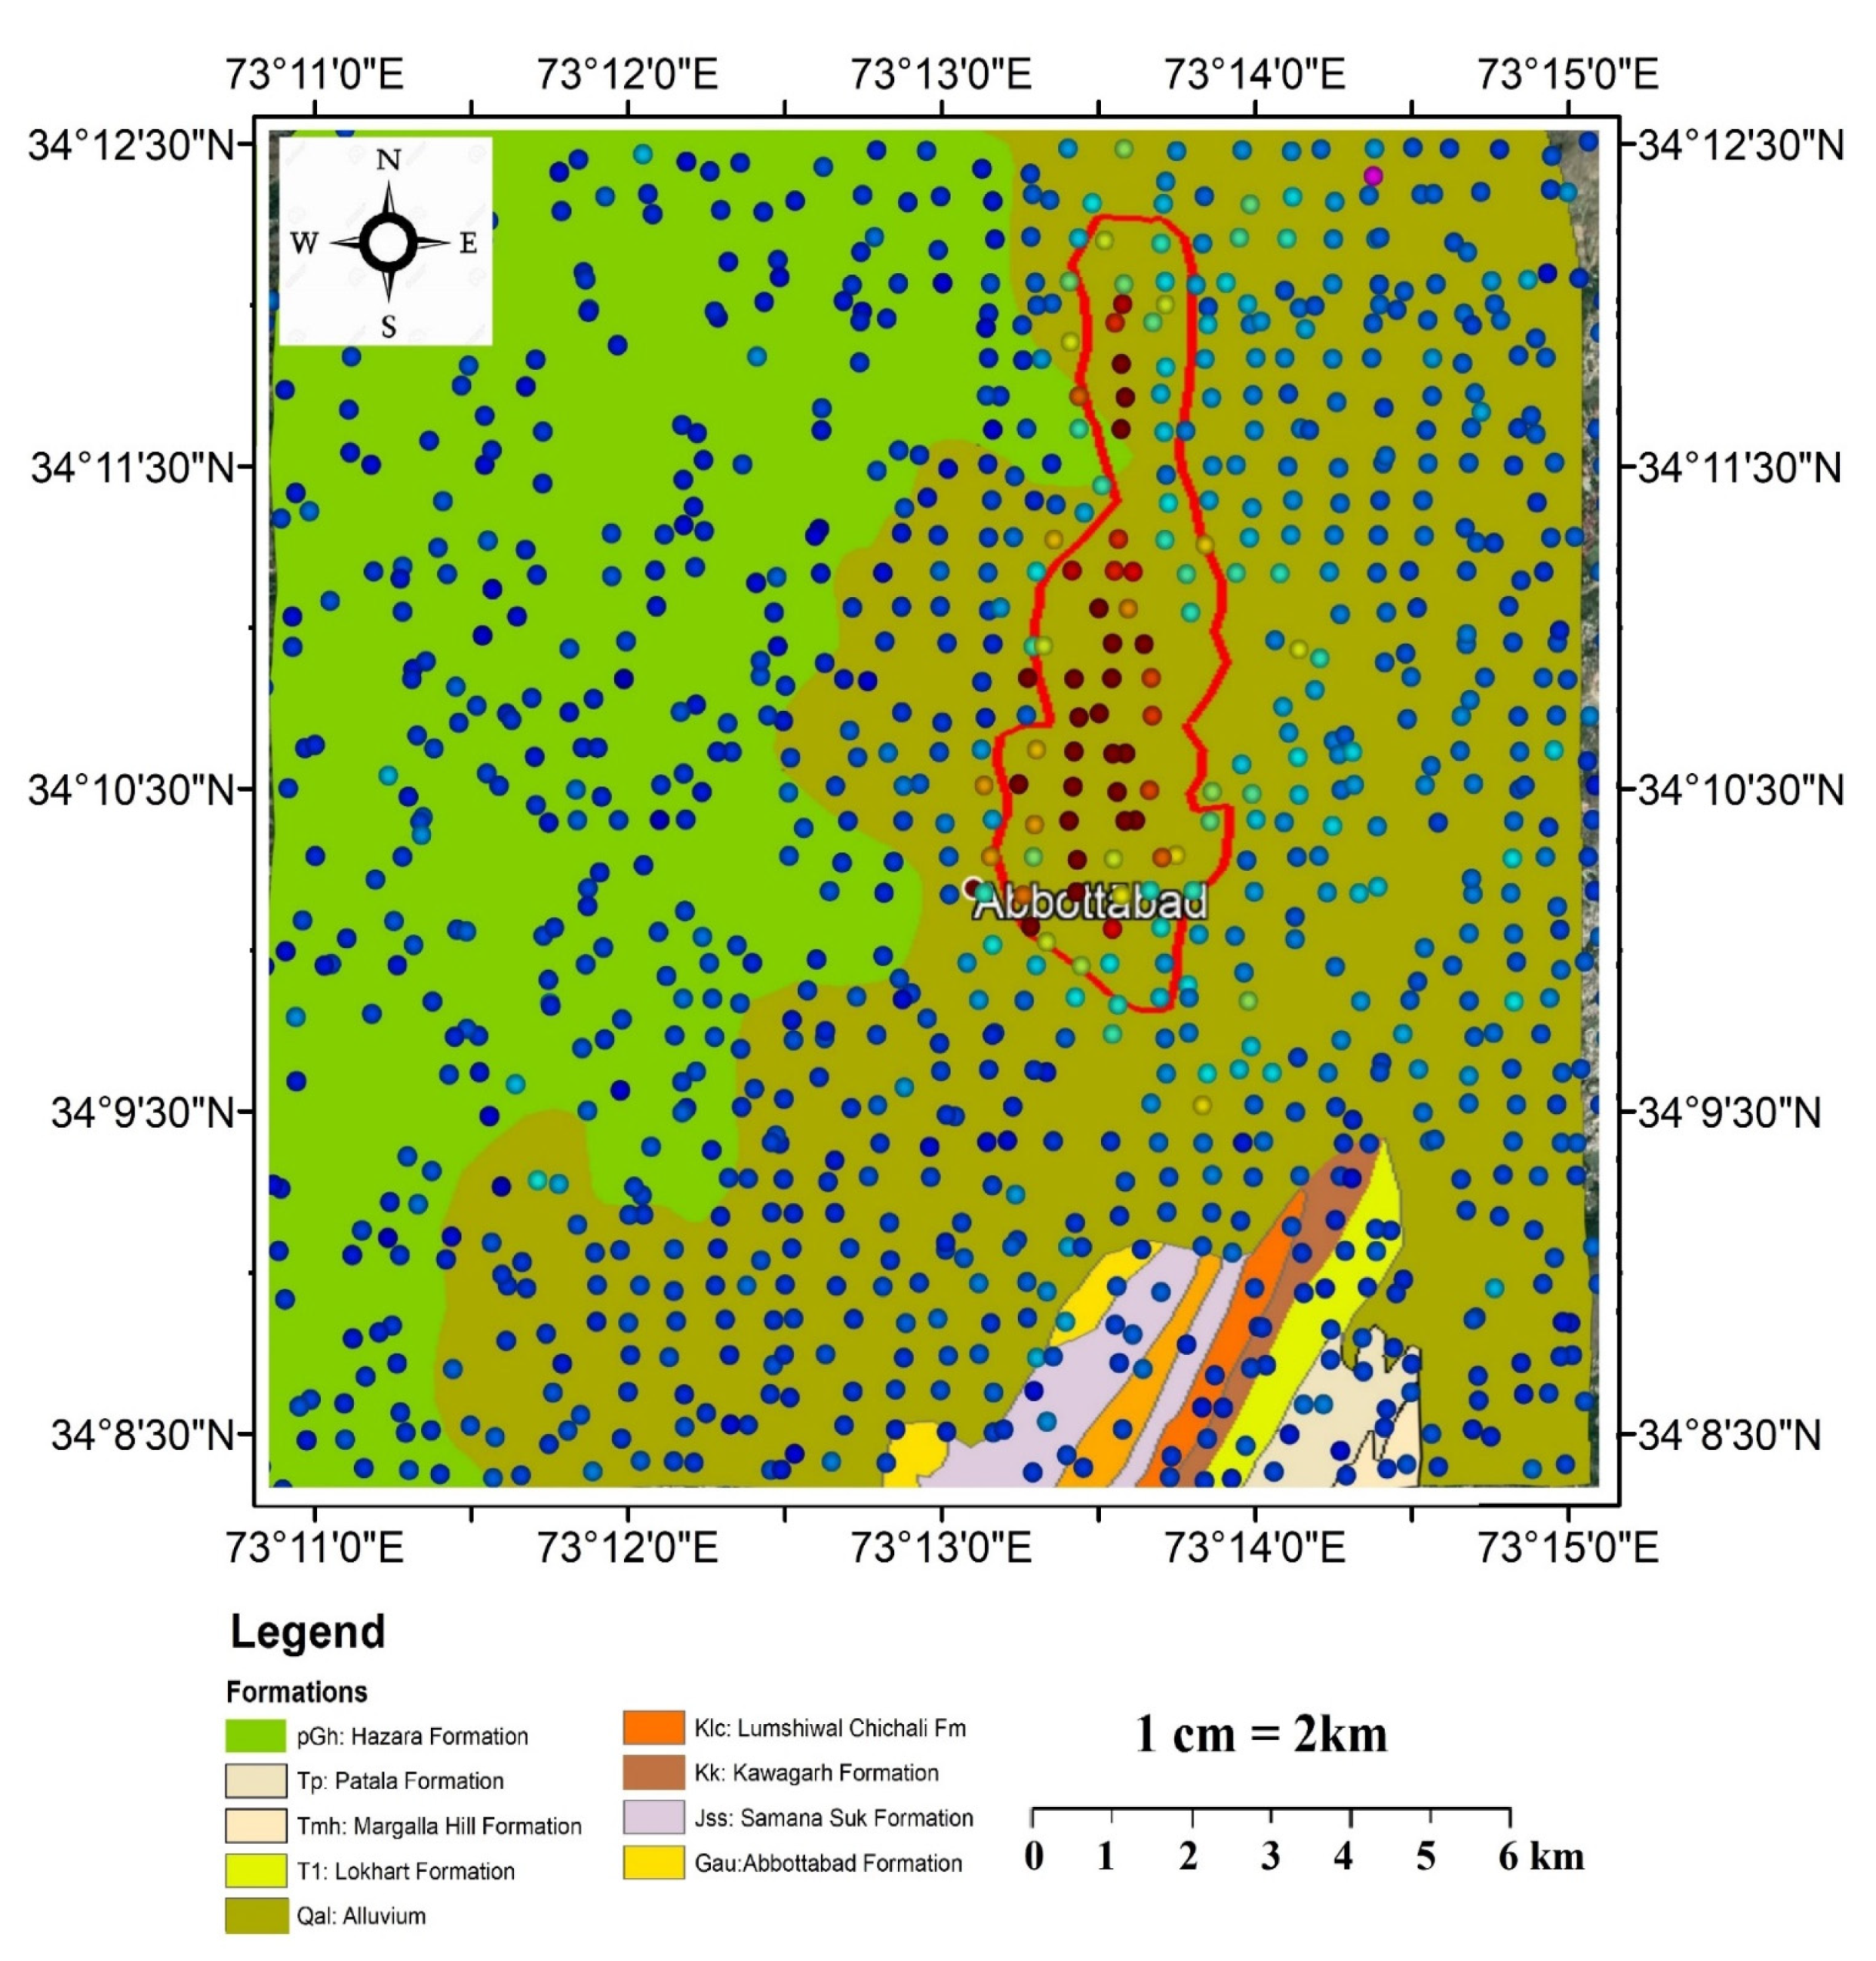
2.1. Geographical Location of Study Area

The study area is the center of Abbottabad City, with latitudes 34.15° to 34.23° N and longitudes of 73.20° to 73.28° E; according to the Survey of Pakistan, the elevation is 1125 m in topographic sheet 43F/04 and 43/08 (Figure 1). This city is amongst the northernmost cities of Pakistan and is located nearest to the Himalayan plate boundary in the Lesser Himalayas. Our study area lies in the Lesser Himalayan Region, and was affected by deadly earthquakes on 8 October 2005 [38]. The earthquake influenced the whole region and caused 230,000 casualties and caused severe destruction to infrastructure [39]. It is important to study the geological and tectonic features within this region.

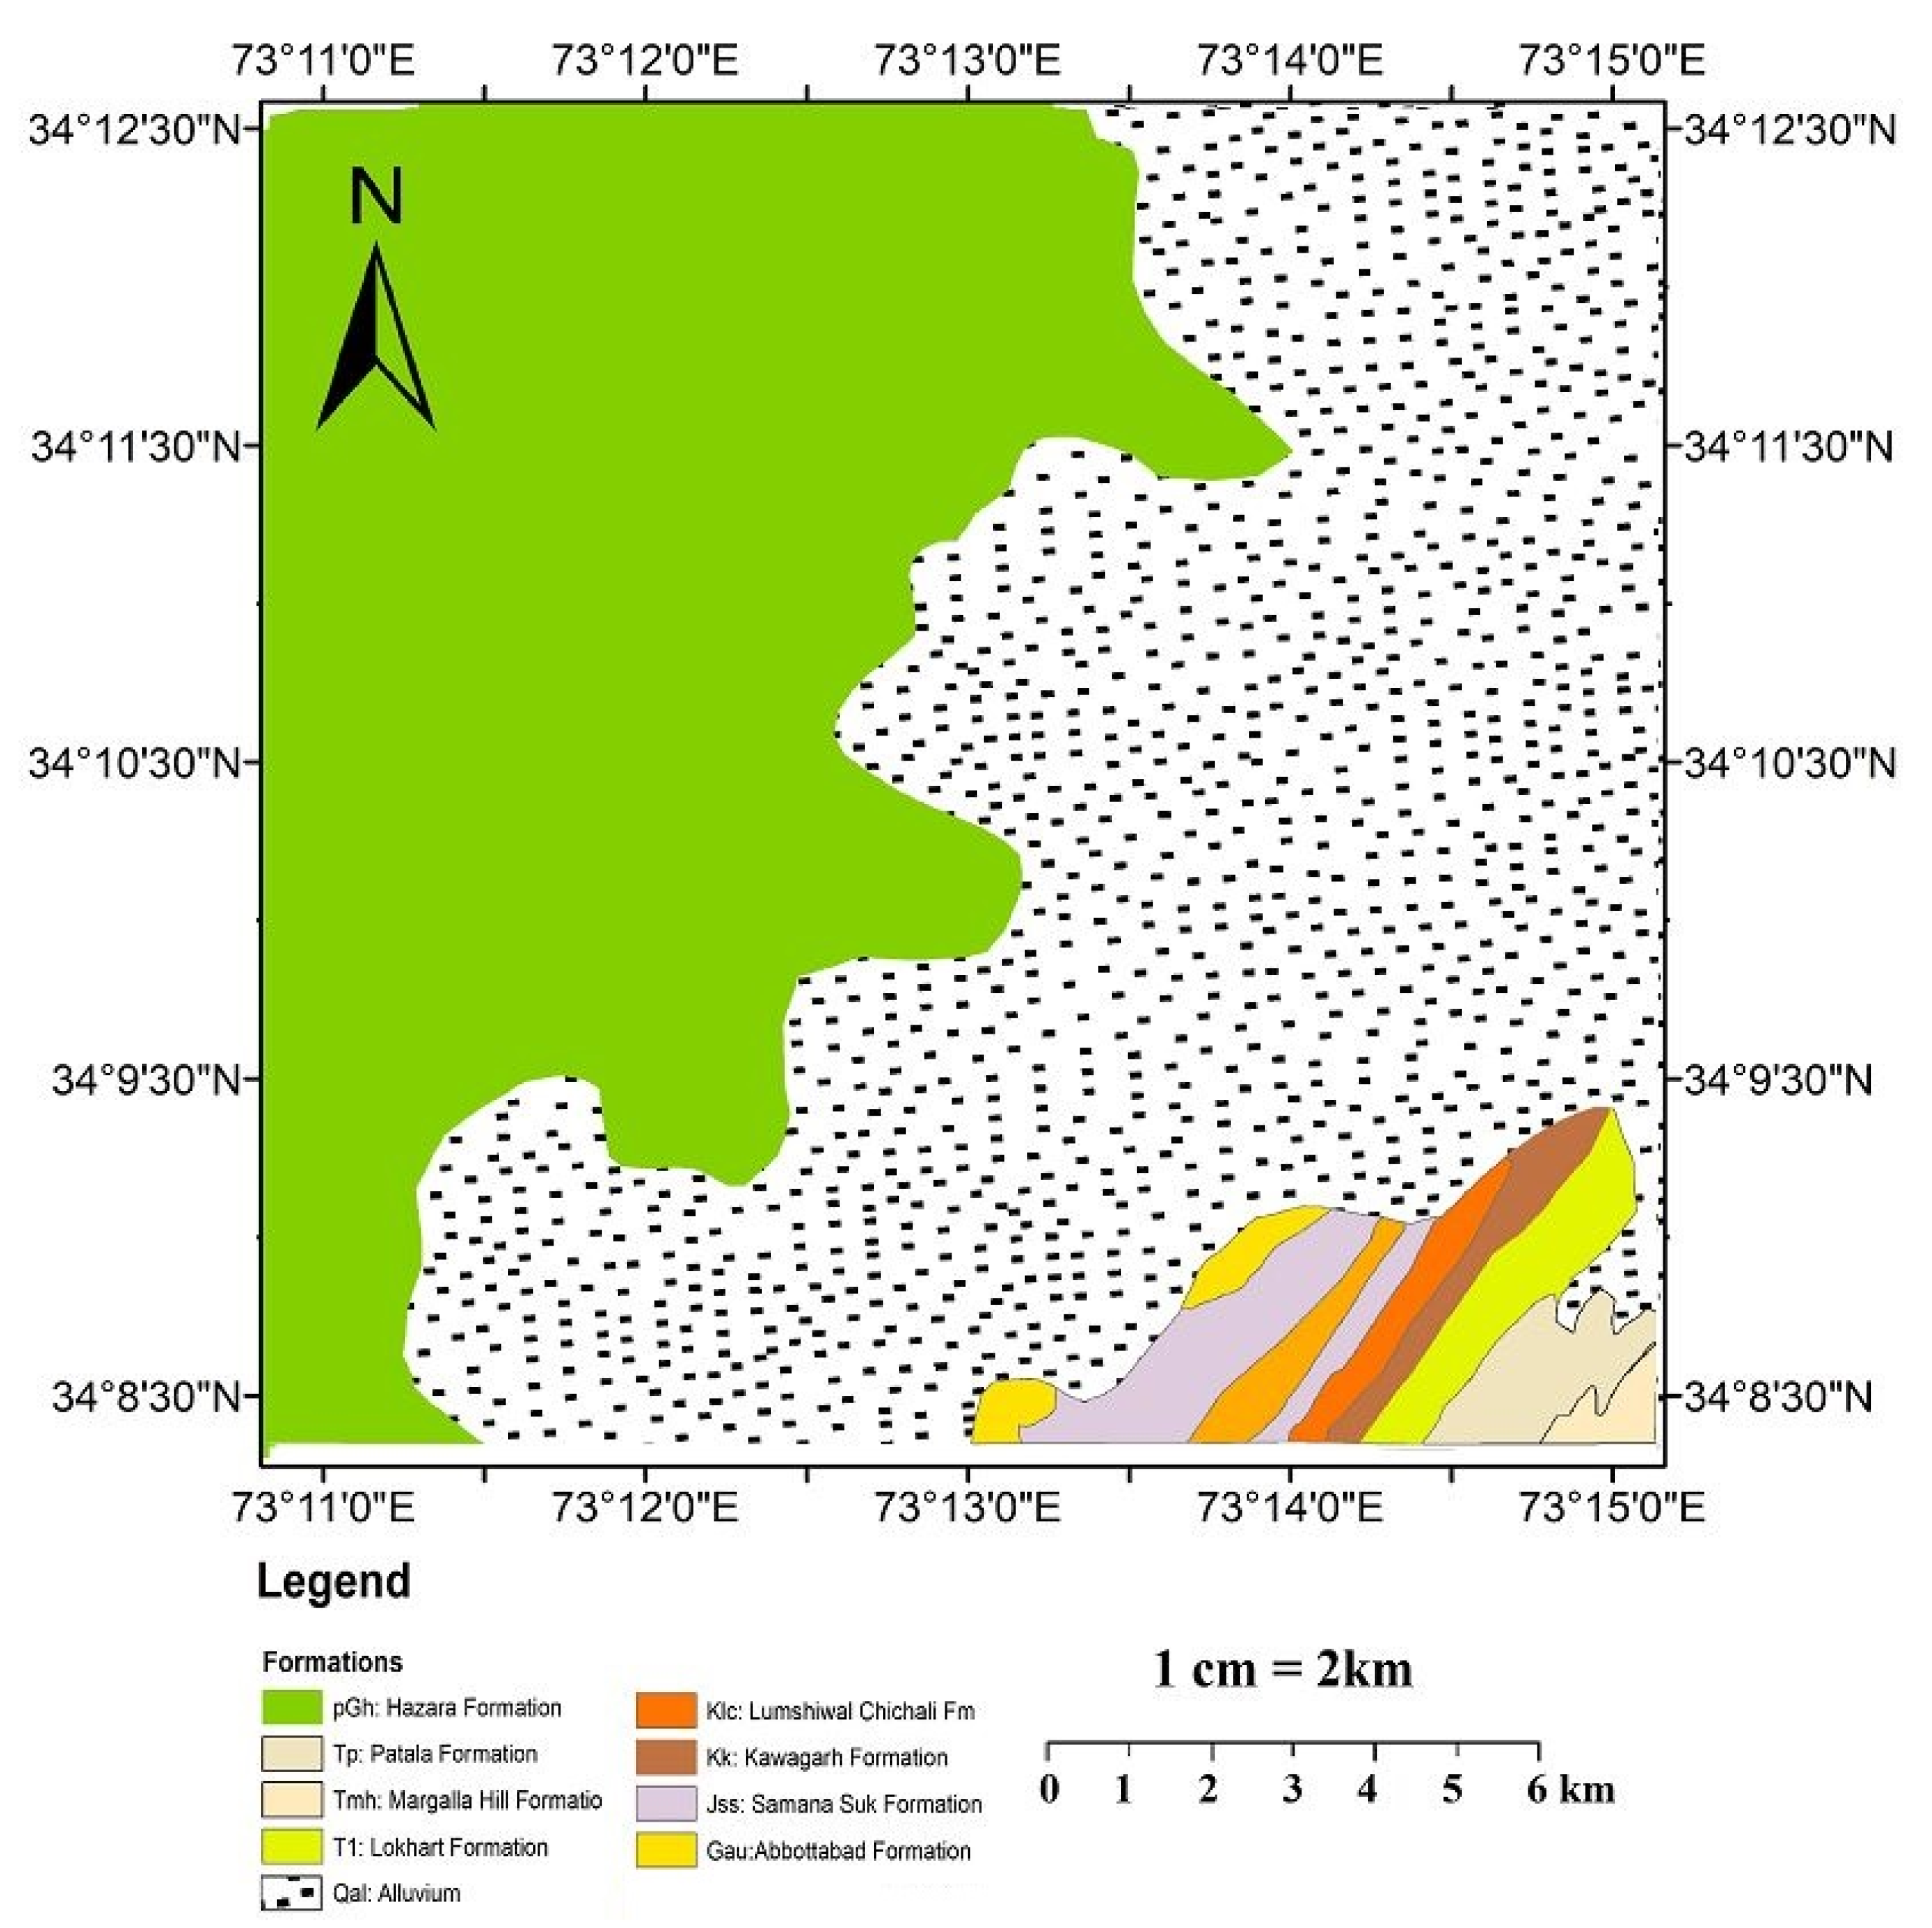
2.2. Geological Background of the Study Area

Abbottabad City is an intra-montane basin, occupying a low land region between ridges. Different streams originate from the surrounding mountains and flow into the relatively open and broad basin of the city. The southern exit of the basin is a narrow gorge, which is the western part of the Sirban Hill. The depositional setting and geomorphic features of the Abbottabad basin are characterized by thick quaternary alluvial deposits as this basin is fed by several streams [40].
The main lithostratigraphic units in the study area are the Hazara Formation, Patala Formation, Margala Hill Formation, Lockhart Formation, Quaternary Alluvium, Lumshiwal Chichali Formation, Kawagarh Formation, Samana Suk Formation and Abbottabad Formation [41]. A geological map of Abbottabad is shown in Figure 2. Details of the lithological units are given in the sections below.

2.2.1. Hazara Formation

This formation was also called “Attock Slate” by Wynne (1878), which is exposed in the study area and are considered the oldest sedimentary deposits [42]. It consists of shales, argillite, sandstone, siltstones and limestone units. On a fresh surface, it has a dark greenish–gray color while weather surfaces are light gray. The deposition environment of the Hazara Formation is deep marine [43].

2.2.2. Patala Formation

This formation consists of dark-to-grey shales with coal seams. The sandstone and limestone have interbedded the shales. At different levels, this formation has been found to contain selenite and marcasite nodules [44].

2.2.3. Margala Hill Formation

This formation is predominantly nodular limestone with intercalation of shale and marls. This limestone largely contains foraminifera (12 cm to 26 cm in length and a width of 32 cm). In massive limestone, large calcite veins can be found [44]. The argillaceous materials surround the nodules.

2.2.4. Lockhart Formation

The Lockhart Formation is also known as Lockhart limestone. In this formation, shales dominate in the middle part, while the top and base is thin limestone with marl bands. The shales are olive green while the nodular limestones are grayish yellow and marl intercalation is found in some of the literature.

2.2.5. Quaternary Alluvium

This consists of loess and unconsolidated deposits of streams. The main locality of quaternary alluvium is the Haripur District, a lowland of the Abbottabad Region, and Manshera and Shinkirai, which are upland areas [40]. These deposits are interlayered and with gravels and sand, marking a reworking process.

2.2.6. Lumshiwal and Chichali Formations

Lumshiwal sandstone and Chichali Formations are located in the study area and, more particularly in Hazara Region, do not have a very thick bed and that is why they are often reported together in some previous studies [42]. The Chichali Formation mostly consists of organic black shales, which are soft and thinly laminated in the study area. Here, the shales in the Chichali Formation show a resemblance to Spiti Shale in India. However, in the main locality, the outcrops are sandstone with belemnites.
The Lumshiwal sandstone overlies the Chichali Formation. It mostly contains quartz grains embedded in a black shale matrix with minor glauconite. The rock units are mostly calcareous with soft and crumble texture and medium grain size [42].

2.2.7. Kawagarh Formation

This formation is well exposed in Kala Chitta Mountain Range and mostly consists of limestone from the Cretaceous age. This formation is also known as Kawagarh Limestone [42]. It is less exposed in our study and is densely covered by timber and brush.

2.2.8. Samana Suk Formation

The rock units included in this formation are mostly dark gray limestone, located in the west of Kohat, particularly in the Parachinar Area [42]. This formation is considered a sequence from the Jurassic age. In our study area, it is widespread to Gari Habibullah and the Abbottabad Region.

2.2.9. Abbottabad Formation

The Abbottabad group is termed “Infra-Trias” and was primarily described by Middlemiss in 1896. It has rocks such as conglomerates, sandstones, shales, and limestones, with thicknesses of about 2250 feet [45]. The rocks were later named the Abbottabad Formation by Marks and Muhammad Ali [45]. With the addition of a new formation (the Hazira Formation), Gardezi and Ghazanfar in 1995 [46] termed it the “Abbottabad group”. Based on the maximum development location, it is now known as the Abbottabad Formation and overlies the Hazara group with a basal conglomerate deposit marking a break in the deposition at the bottom of the Hazara group. This is followed by a thick sequence of sandstones, interbedded shales, orthoquartzites, arenaceous dolomites, dolomites, volcanic materials, quartz breccia, siltstones, and silty shales, and hematitic mudstones.

3. Dataset and Methodology

3.1. Datasets and Data Processing

In our study, we used SAR images from the Sentinel-1 C-band, acquired along both descending and ascending orbit tracks [47]. In the range direction, this sensor has a ground resolution of about 5 m, while in the azimuth direction it is about 20 m. This sensor has different modes of acquisitions, including stripmap (SM), interferometric wide (IW), extra-wide swath (EW), and wave (Wave), by comparing the IW mode with other acquisition modes, it has been observed that IW needs more data processing for co-registration of images with a high accuracy of up to 0.001 pixels [23].
For this study, 73 images from the descending track, from 31 March 2017 to 17 September 2019 (track number 107) and 79 images from the ascending track, from 10 February 2017 to 21 December 2019 (track number 100) were obtained. All images were obtained in the IW acquisition mode. The IW mode of Sentinel-1 covers a single scene with an area coverage of 250 km2. The single scene is divided into three sub-swaths with the terrain observation by progressive scan (TOPS) mode. SAR images have a high spatial and temporal resolution with a short revisiting time, making it possible to investigate subsidence phenomena from space [48]. For this analysis, SARPROZ software [49] was used, which is commercial software and is very useful for SAR/InSAR data analyses [23].

3.2. Methodology

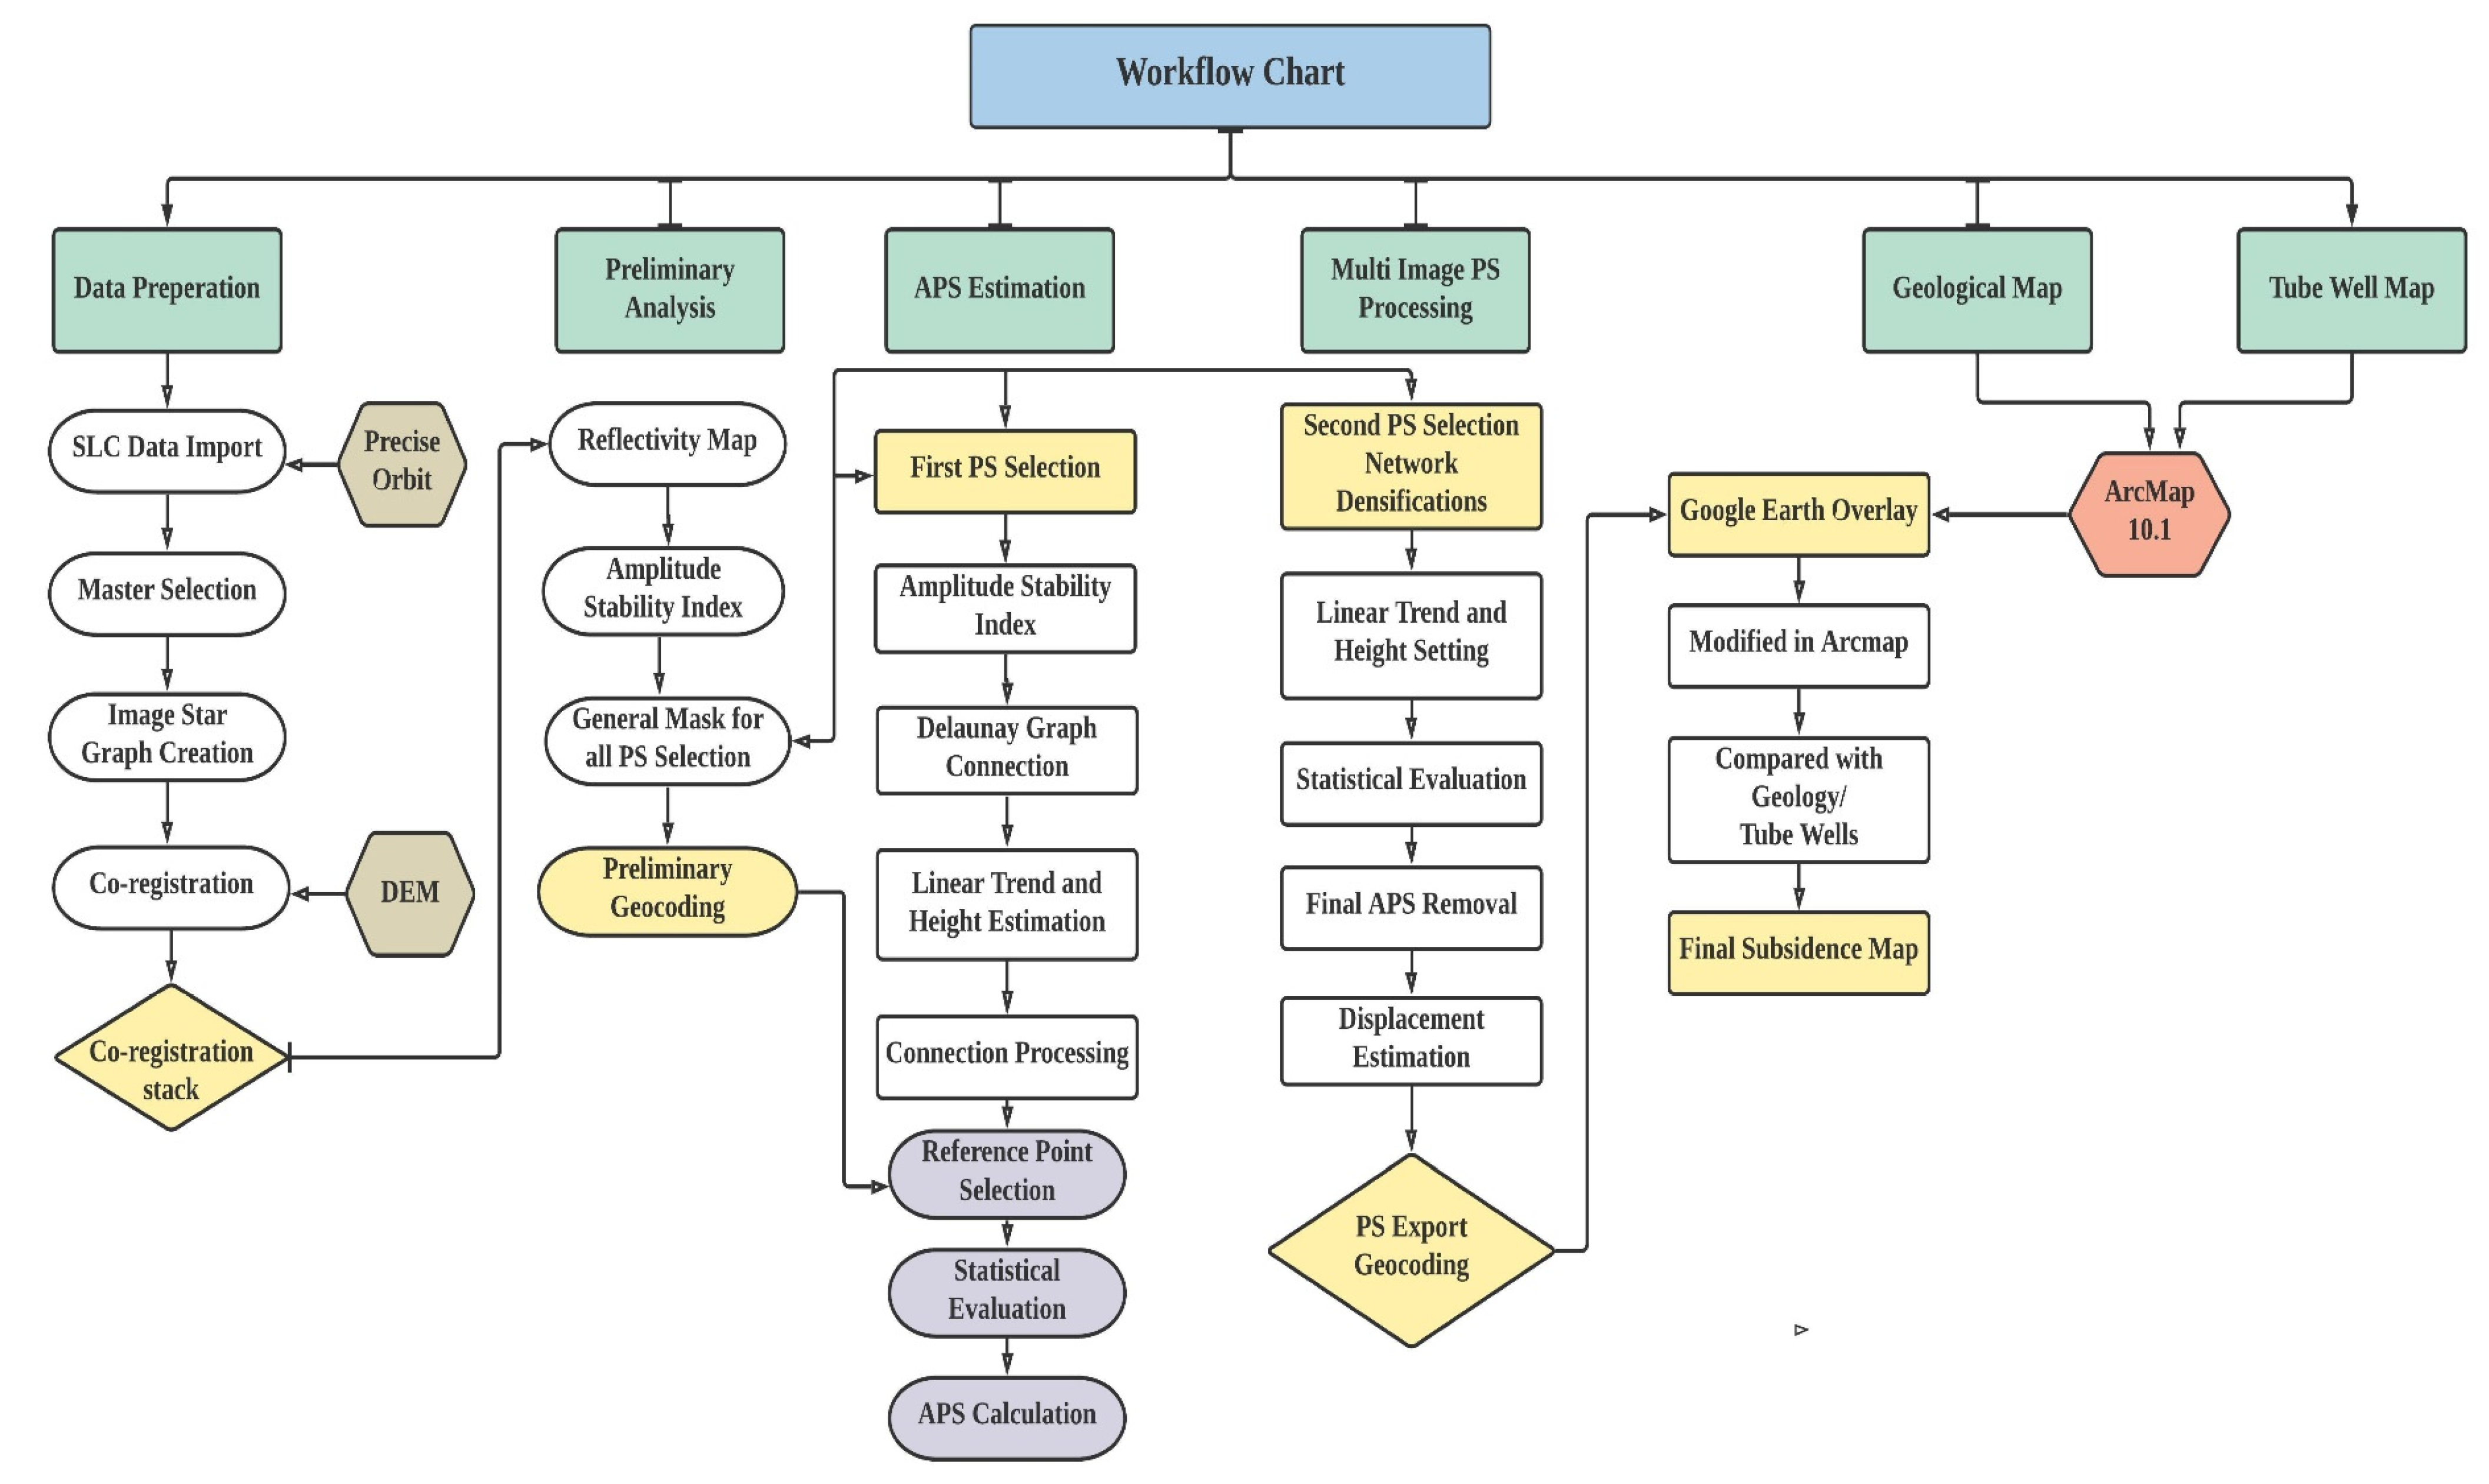
3.2.1. Workflow of PSInSAR

Our PSInSAR procedure involved data preparation, preliminary analysis, atmosphere phase screen (APS) estimation, and multi-image PS processing. The overall processing steps are given in Figure 3.

3.2.2. Data Preparation

In data preparation, processing steps include importing single look complex (SLC) data with precise orbits. Here, images were selected with the same orbits, both ascending and descending. However, both ascending and descending images cannot be processed at the same time. In the following step, polarization of images was selected based on orbit information and slave and master images were selected. This was very important step, where orbit and track information were geo-located on Google Earth to remove SAR images of different tracks or area coverages. Images with less track difference were taken to reduce errors. At first, the master image was extracted covering the study area and then the slave images covering the same common area, according to the master image, were extracted. Here, a star graph between the master image and the slave image was created (Figure 4). During co-registration step a specific area has been considered and being co-registered [23].

3.2.3. Preliminary Analysis

Atmospheric phase screen (APS), orbit errors, etc., were estimated and eliminated. After this, the phase stability was assessed. The values of absolute amplitude were mostly insensitive for creating disturbances in processing [50]. Thus, it was expected that, during all these acquisitions, the pixels will of a similar amplitude and will have smaller phase dispersions. In SARPROZ processing, PS is selected based on the amplitude stability index (ASI).
ASI = 1 D A   = 1 σ A / m A
Where D A   is the amplitude dispersion, m A represents amplitude mean deviation in time, and the standard deviation in time is given by σ A .

3.2.4. Atmosphere Phase Screen (APS) Estimation

The SAR images during acquisition are influenced by various atmospheric phase delays and, often, signal delays occur, such as radar signals being delayed by aerosol particles [23]. To avoid these disturbances in the resultant data, various spatial temporal filters are used to estimate APS [51]. At this stage, APS results are eliminated while the topographic height effects and linear velocities of deformations are estimated from the remaining phases [23]. For this purpose, the selection of an appropriate threshold, ASI > 0.75, is recommended reference for the selection of the first PSs. ASI > 0.6 was chosen in our case study for the selection of PSs. This strict parameter selection satisfies allowing only a small amount of PS points, but this is necessary for the estimation of the correct APS. At this stage, after the selection of the first PS, it is needed to establish a reference network by using Delaunay triangulation to connect PSs. This step is followed by elimination of the estimated linear model (linear displacement velocities and residual height) and by using an inversion graph to estimate APS from the phase residual. It is also important to determine one reference point here and fix its velocity. After the graph inversion and removal of APS, temporal coherence analysis of PSs was used to estimate the quality of APS, which gave a suitable output with a coherence higher than 0.7 (Figure 5).

3.2.5. Multi-Image Sparse Point Processing

In this step, the second order PS points were selected. At this stage, in order to obtained dense PS points, ASI > 0.6 criteria were selected. Here, the same parameters and reference points were used for the removal of APS as used when processing APS estimation. Finally, all PS points were geocoded and overlaid over Google Earth and only those PS points with coherence greater than 0.7 were selected for the final subsidence map [50].

3.2.6. Post-Processing Spatiotemporal Analysis

The detected deformation areas were finally transformed into an external reference system, i.e., geographic coordinates. The derived ground deformation map and geological map were overlaid and inputted into ArcGIS for further analysis. The GIS analysis consisted of integration of PSInSAR results with a geological [38] and tube-well location [8] map to interpret and validate the detected subsidence areas, which could then be compared with the geological background of Abbottabad. The result from previous steps were then combined with different information layers in ArcGIS. These layers were used to interpret the geological formations and tube-well location in the study area and its relationship with subsidence, estimated from PSInSAR.

4. Results and Analysis

For the deformation monitoring in this area, we used PSInSAR, as described above, implemented in SARPROZ, which could allow us to detect deformation areas in Abbottabad City. The stable points, defined by a stability threshold range (from −5 to 5 mm/year) are shown in green. For calculating and identifying motions in the area, a stable point is selected as a reference point to compare with the motions of other points in the area, since the movement is monitored according to the reference point in PSInSAR. While performing this approach, temporal coherence needed to be enough for further processing. PS points with temporal coherence bigger than 0.7 were considered as trustworthy points with less probability of error [23].
For the measurement of the motion along the line of sight (LOS), using PS points, it was observed that the movement away from the sensor was negative and is represented in the red. Other stable points that represent relatively no movement are located within the study area and are shown in Figure 5 (blue to light blue), points that showed comparatively high movement compared to the blue dots but a lower movement compared to red dots are marked as yellow to dark yellow and orange. The subsidence in Abbottabad was observed to be ranging from −25 to −50 mm/year (Figure 6). Scatter plot results show that there was an obvious subsidence in Abbottabad City.
The subsidence map obtained from both descending (track number 107) and ascending (track number 100) tracks during the time period of analyses showed sufficient PS points in the study area (Figure 7). The subsidence maps are superimposed over Google Earth in the study area. In the study area, a dense points cloud can be seen in Figure 7a,b; here, the results in both the ascending and descending tracks show that most of the area is stable (marked in blue), which are relatively upland or hilly terrains. While the main settlement areas along the main road are shown in red, highlighting the relatively high subsidence area. The color ramp (red = high, blue = stable, yellow/light green = low) representing movement and the relative stability of the PS points.
Figure 7 shows that subsidence in the study area ranges from 0 to approximately −30 mm, where the red color shows a subsidence of about −30 mm. Here the (a) represents subsidence in the descending track and (b) represent subsidence in the ascending track.
The final subsidence map obtained from both the descending (31 March 2017 to 17 September 2019) and ascending (10 February 2017 to 21 December 2019) tracks are visualized to determine subsidence trends of various PS points during the study time period (Figure 8). The graph in (a) in Figure 8 demonstrates the subsidence in the study area during 2017, which ranged from 0 to −30 mm per year. The graph in (b) in Figure 8 shows subsidence of the same PS points during 2018. There are notable fluctuations in the readings, but the average subsidence is nearly 18 mm per year during 2018. From Figure 8b we can see that the subsidence ranges approximately from −5 mm per year to −85 mm per year. During 2019, the range of subsidence was from −25 to −150 mm per year as shown in Figure 8c. These graphic representations show that the subsidence increased approximately −55 to −60 mm per year from 2017 to 2019.
Figure 8a shows the ground subsidence in 2017. Figure 8b shows the ground subsidence in 2018. Figure 8c shows the ground subsidence in 2019. The x-axis in the figure represent PS points in the study area, while the y-axis represents the subsidence.
In the study area, five PS points (P1, P2, P3, P4, and P5) from the subsidence area were selected within the descending and ascending results (Figure 9a,b). Here, the PS points highlight the relative movement and stability (red = high, blue = stable, yellow/light green = low) compared to the surroundings. Analyses of the subsidence along these five PS points are shown in Figure 10.
The subsidence area is shown with red dots in (Figure 9a,b). The obtained results highlight variations in the ground subsidence from place to place during the analysis periods. The subsidence along these points (P1, P2, P3, P4, and P5) are plotted in Figure 10. Here, P1 lies on southernmost part of the study area where subsidence reached −104.4 mm, points P2, P3, and P4 lie generally in the central part of the study area where subsidence reached −132.2 mm, −184.1 mm, and −160.7 mm, respectively, during the study analysis period. PS point P5 lies in the northern part of study area with a subsidence that reached −75.2 mm during the study time. It is obvious from the results that the subsidence was relatively higher in the central part of city, while it decreased towards northern and southern parts of the city.
The subsidence along these five PS points were analyzed, which show variations in subsidence from 2017 to 2019. The graphic representations of these five points are given in Figure 10. The graphs clearly show that points 2, 3 and 4 have high subsidence and are located in the central part of study area, while point 1 and point 5 have comparatively low subsidence during study period.
In order to analyze the east–west subsidence trend in the study area, an east to west subsidence profile was plotted in the study area. This profile reveals that subsidence is lower (−6.8 mm, −5.9 mm etc.) in the eastern part of the main city (Figure 11b). The major subsidence is apparent in the central part of Abbottabad City, and reached approx. −168 mm (Figure 11b) while the western part of the city experienced low subsidence (−7.8 mm, −5.6 mm, etc.). This observation clearly shows that subsidence is obvious in the center of Abbottabad City during period from 2017 to 2019.
In Figure 11a, the black line illustrates the east–west subsidence profile, where a, b, and c represent subsidence at some specific points. Figure 11b represents a subsidence fluctuation graph of the east–west subsidence profile (x-axis mark PS points, y-axis subsidence). In Figure 11b, the (a), (b), and (c) highlight subsidence at the corresponding specific points, as shown in Figure 11a.
The north–south subsidence trend was also analyzed in the final subsidence map. This subsidence profile suggests that the subsidence was lower (−28 mm, −32.8 mm, etc.) in the northern part of the city and experienced a small increase (−116.8 mm) towards the center, and again decreased (−80.4 mm) as given in graph at point c (Figure 12b). The center of the city shows a high subsidence, approximately −164 mm (Figure 12b). Towards the southern part of the city, the ground subsidence decreases (−17 mm, −11 mm, etc.) again, somewhat less than that in the northernmost point (Figure 12b).
In Figure 12a the black line represents the north–south subsidence profile, where (a), (b), (c), (d), and (e) highlight subsidence at these specific points. Figure 12b represents a subsidence fluctuation graph of the north–south subsidence profile (x-axis represent PS points, y-axis represent subsidence). In Figure 12b the (a), (b), (c), (d), and (e) mark subsidence at the corresponding specific points, as shown in Figure 12a.

5. Discussion

The results obtained during this study suggest that several factors contribute to and are responsible for ground subsidence in Abbottabad City. These causative factors include excessive groundwater extraction to fulfill the needs of people, natural consolidation of quaternary alluvium, and soil loss during rainy seasons, as well as unplanned building construction and the load of infrastructure [8].

5.1. Excessive Ground Water Extraction

One of the possible causative factors responsible for subsidence in the study area is the excessive extraction of groundwater for domestic and commercial uses [52]. Some previous studies have observed impact of excessive ground water with ground subsidence [15,53]. In Pakistan, there is a water crisis and the main sources of daily water usage for people are bore-wells and tube-wells [54]. Due to unplanned settlement growth in major cities [55], water demand has increased and most houses have constructed a bore-well for their needs. Furthermore, several factories owned by private and government agencies, such as chemical and agriculture industries, operate in this city. These industries in particular have high groundwater consumption needs. To fulfill the water needs of the people in this city, the local government has launched water tube-well projects in cooperation with the Japanese government (Japan International Cooperation Agency) [56] to provide sufficient water supply, and which started to supply water regularly in 2015 [57]. It is apparent in the results (Figure 11b and Figure 12b) that ground subsidence is found more in the center of city and that one of possible cause is the presence of a tube-well, as reported in a previous study [8]. The modified tube-well map [8] shows that center of city, with more tube-wells, has experienced more subsidence (Figure 13a,b). Variations in fluid pressure in the subsurface layers, driven by excessive ground water extraction, influence the compaction of the ground surface [8].
In Figure 13a, (a), (b), (c), (d), (e), and (f) represent various locations in the study area showing cracks in the walls of local houses, identified from field photos, as shown in Figure 14a–f. In Figure 13a, the doted circles mark three different locations where the photos were captured. The cracks found in local houses show that the study area experienced subsidence.

5.2. Subsurface Geology

The consolidation properties of soils have been considered as a fundamental reason for subsidence around the world [53]. It has been observed that most of the Abbottabad city has developed over the region with alluvium deposits [38]. In addition to the shale of the Hazara Formation on west side (with less limestone), thick bedded limestone to light grey medium limestone was found in the southern part of the study area. Geological investigation of Abbottabad City also suggested that Abbottabad City was once a stream channel [40], as the basin is characterized by thick quaternary alluvium deposits with angular to sub-angular conglomerates, sandy dolomites of buff, and calcareous shale siltstones, occupying a lowland region between the ridges [45]. Most of city, including institutions, the military academy and other residential and commercial buildings are built on the alluvium deposits and dolomites [40]. The subsurface aquifer layers in the study area were reported in [58]. This study showed that first layer consists of clay, silt with gravels inter-beds, and the thickness in the west was about 30–40 m, and in central area the thickness was about 70–80 m. Gravel comprises the second layer with a thickness up to 40 m in the southern and central parts of the subsidence area. Unconsolidated sediments comprise the third layer and is underlain by bedrocks, with shales covering the western part and limestone and dolomites covering the eastern part [8]. The overgrowth settlement [59] and unplanned constructions blocked the water channels, resulting in water stagnation on roads and streets during rainy seasons (Figure 15) [8]. Different streams originating from the surrounding mountains flow into the relatively broad basin, where drainage blockage causes the water to percolate into the subsurface layers of the basin [40,59] It is noted from the results that subsidence mostly occurred in quaternary alluvium deposits (Figure 16). It is possible that the water percolation into the subsurface, which saturates the subsurface layers, together with the load of infrastructure are responsible for causing subsidence in the study area [8].
Furthermore, the relationship of rainfall and subsidence has also been described in [8,60] and the balance of subsurface aquifers is disturbed by high precipitation. This rate of precipitation can influence subsidence with other causative factors. The high monsoon precipitation in the study area has been reported previously [8]. The refills of subsurface aquifers cause saturation of the subsurface layers and a significant correlation of subsidence in the study area with rainfall has been reported previously [8].
The photos in Figure 15 were taken during the rainy season at different times, which illustrate flooding at various locations on the main road. This road passes through the main city; the subsidence can be seen around the road in Figure 13a,b.
Figure 16 represents the PS points overlaying a geological map of Abbottabad City. Here, the red polygons highlight the subsidence area, which is prominent in the quaternary alluvium deposits. There were enough scatterers in the study area for ground subsidence assessment. The red dots in the polygon mark subsidence in the study area.
PSInSAR is a very useful technique to monitor ground subsidence in an urban area, structure collapse, landslides, mining subsidence, etc. However, some decorrelations and noise effects can influence the final analysis. Meanwhile, our results successfully demonstrated subsidence phenomena in the study area, but it can be further modified with in situ data analysis and other techniques, such as SBAS or Quasi-PS. It is also suggested that, in the future, multi-scale (space-based and ground-based) study should be conducted to thoroughly analyze ground subsidence and to avoid serious damage in this area.

6. Conclusions

In present study, we monitored ground subsidence from March 2017 to September 2019 and highlighted the ability of PSInSAR to monitor time series subsidence in Abbottabad City. All the main processing parameters are well explained and various steps to minimize noise and errors have been employed during processing. Various causative factors have been discussed, including excessive groundwater pumping, soil consolidation, subsurface geology, etc. The subsidence maps of the study area show that Abbottabad City is experiencing an increasing ground subsidence. The results also highlight that the subsidence is relatively higher in the city’s center while subsidence in northern and southern parts of the study area are relatively lower. An overall observation of the study area shows that the subsidence in the center of Abbottabad City reached approximately −184.1 mm, while areas away from the center of the city experienced low subsidence.
This study suggests that significant ground subsidence has been observed in the city center during the analysis period (2017–2019). The most prominent reasons for this seem to be rapid population growth in the last few years with an increasing need of daily-use water (household and industrialization), and exploitation of ground water. In addition, subsurface geology with poor drainage, systems and loading of unauthorized construction are also possible contributing factors causing ground subsidence in the study area.

Author Contributions

All authors contributed to the manuscript and discussed the results. H.L. supervised this research. Data acquisition, methodology processing and conceptualization, R.K. and Z.A. In addition, writing, results discussion were by R.K.; Z.A.; M.B. Finally, all authors contributed to the final revision of manuscript, modifications and recommendations. All authors have read and agreed to the published version of the manuscript.

Funding

This research received no external funding.

Data Availability Statement

For this study, the datasets were obtained from https://asf.alaska.edu, accessed on 22 February 2021; The commercial software used for this analysis are available at https://www.sarproz.com/sarproz-faq, accessed on 22 February 2021.

Acknowledgments

The author is pleased to acknowledge Huan Li and Chen Ting for their suggestions and recommendations. Additionally, we greatly appreciate and are thankful to Daniele Perissin for providing SARPROZ software for this analysis. Author also appreciate Barkat Ullah for his suggestion and recommendations during the writing of the manuscript.

Conflicts of Interest

The authors declare no conflict of interest.

References

  1. Erkens, G.; Sutanudjaja, E.H. Towards a global land subsidence map. Proc. Int. Assoc. Hydrol. Sci. 2015, 372, 83–87. [Google Scholar] [CrossRef] [Green Version]
  2. Tosi, L.; Teatini, P.; Strozzi, T. Natural versus anthropogenic subsidence of Venice. Sci. Rep. 2013. [Google Scholar] [CrossRef] [Green Version]
  3. Gambolati, G.; Teatini, P.; Ferronato, M. Anthropogenic Land Subsidence. In Encyclopedia of Hydrological Sciences; Anderson, M.G., Ed.; Wiley Online Library: Hoboken, NJ, USA, 2005; Volume 158. [Google Scholar]
  4. Castellazzi, P.; Arroyo-Domínguez, N.; Martel, R.; Calderhead, A.I.; Normand, J.C.L.; Gárfias, J.; Rivera, A. Land subsidence in major cities of Central Mexico: Interpreting InSAR-derived land subsidence mapping with hydrogeological data. Int. J. Appl. Earth Obs. Geoinf. 2016. [Google Scholar] [CrossRef]
  5. Roque, D.; Fonseca, A.M.; Henriques, M.J.; Falcão, A.P. A First Approach for Displacement Analysis in Lisbon Downtown Using PS-InSAR. Procedia Technol. 2014. [Google Scholar] [CrossRef] [Green Version]
  6. Xu, Y.S.; Shen, S.L.; Ren, D.J.; Wu, H.N. Analysis of factors in land subsidence in Shanghai: A view based on a strategic environmental assessment. Sustainability 2016. [Google Scholar] [CrossRef] [Green Version]
  7. Arangio, S.; Calò, F.; Di Mauro, M.; Bonano, M.; Marsella, M.; Manunta, M. An application of the SBAS-DInSAR technique for the assessment of structural damage in the city of Rome. Struct. Infrastruct. Eng. 2014. [Google Scholar] [CrossRef]
  8. Shahzad, N.; Ding, X.; Wu, S.; Liang, H. Ground deformation and its causes in abbottabad city, pakistan from sentinel-1a data and mt-insar. Remote Sens. 2020. [Google Scholar] [CrossRef]
  9. Yu, X.; Hu, J.; Sun, Q. Estimating Actual 2D Ground Deformations Induced by Underground Activities with Cross-Heading InSAR Measurements. J. Sensors 2017. [Google Scholar] [CrossRef] [Green Version]
  10. Lingyun, J.; Qingliang, W.; Shuangxu, W. Present-day 3D deformation field of Northeast China, observed by GPS and leveling. Geod. Geodyn. 2014. [Google Scholar] [CrossRef] [Green Version]
  11. Prati, C.; Ferretti, A.; Perissin, D. Recent advances on surface ground deformation measurement by means of repeated space-borne SAR observations. J. Geodyn. 2010. [Google Scholar] [CrossRef] [Green Version]
  12. Bürgmann, R.; Rosen, P.A.; Fielding, E.J. Synthetic Aperture Radar Interferometry to Measure Earth’s Surface Topography and Its Deformation. Annu. Rev. Earth Planet. Sci. 2000. [Google Scholar] [CrossRef]
  13. Le Vine, D.M. Synthetic aperture radiometer systems. IEEE Trans. Microw. Theory Tech. 1999. [Google Scholar] [CrossRef]
  14. Hilley, G.E.; Bürgmann, R.; Ferretti, A.; Novali, F.; Rocca, F. Dynamics of slow-moving landslides from permanent scatterer analysis. Science 2004. [Google Scholar] [CrossRef] [PubMed] [Green Version]
  15. Li, J.; Wang, S.; Michel, C.; Russell, H.A.J. InSAR Measurement of Surface Deformations in South Ontario. Geological Survey of Canada, Open File 8528. 2019. Available online: https://geoscan.nrcan.gc.ca/starweb/geoscan/servlet.starweb?path=geoscan/fulle.web&search1=R=313591 (accessed on 22 February 2021).
  16. Cigna, F.; Osmanoǧlu, B.; Cabral-Cano, E.; Dixon, T.H.; Ávila-Olivera, J.A.; Garduño-Monroy, V.H.; DeMets, C.; Wdowinski, S. Monitoring land subsidence and its induced geological hazard with Synthetic Aperture Radar Interferometry: A case study in Morelia, Mexico. Remote Sens. Environ. 2012. [Google Scholar] [CrossRef]
  17. Stramondo, S.; Saroli, M.; Tolomei, C.; Moro, M.; Doumaz, F.; Pesci, A.; Loddo, F.; Baldi, P.; Boschi, E. Surface movements in Bologna (Po Plain - Italy) detected by multitemporal DInSAR. Remote Sens. Environ. 2007. [Google Scholar] [CrossRef]
  18. Hsu, W.C.; Chang, H.C.; Chang, K.T.; Lin, E.K.; Liu, J.K.; Liou, Y.A. Observing land subsidence and revealing the factors that influence it using a multi-sensor approach in Yunlin County, Taiwan. Remote Sens. 2015. [Google Scholar] [CrossRef] [Green Version]
  19. Zebker, H.A.; Rosen, P.A.; Hensley, S. Atmospheric effects in interferometric synthetic aperture radar surface deformation and topographic maps. J. Geophys. Res. Solid Earth 1997. [Google Scholar] [CrossRef]
  20. Ferretti, A.; Prati, C.; Rocca, F. Permanent scatterers in SAR interferometry. IEEE Trans. Geosci. Remote Sens. 2001. [Google Scholar] [CrossRef]
  21. Galve, J.P.; Castañeda, C.; Gutiérrez, F.; Herrera, G. Assessing sinkhole activity in the Ebro Valley mantled evaporite karst using advanced DInSAR. Geomorphology 2015. [Google Scholar] [CrossRef] [Green Version]
  22. Hutabarat, L.E.; Ilyas, T. Mapping of land subsidence induced by groundwater extraction in urban areas as basic data for sustainability countermeasures. Int. J. Technol. 2017. [Google Scholar] [CrossRef] [Green Version]
  23. Beladam, O.; Balz, T.; Mohamadi, B.; Abdalhak, M. Using ps-insar with sentinel-1 images for deformation monitoring in northeast Algeria. Geosciences 2019, 9, 315. [Google Scholar] [CrossRef] [Green Version]
  24. Yang, Q.; Ke, Y.; Zhang, D.; Chen, B.; Gong, H.; Lv, M.; Zhu, L.; Li, X. Multi-scale analysis of the relationship between land subsidence and buildings: A case study in an eastern Beijing Urban Area using the PS-InSAR technique. Remote Sens. 2018, 10, 1006. [Google Scholar] [CrossRef] [Green Version]
  25. Gao, M.; Gong, H.; Chen, B.; Zhou, C.; Chen, W.; Liang, Y.; Shi, M.; Si, Y. InSAR time-series investigation of long-term ground displacement at Beijing Capital International Airport, China. Tectonophysics 2016. [Google Scholar] [CrossRef]
  26. Milillo, P.; Giardina, G.; DeJong, M.J.; Perissin, D.; Milillo, G. Multi-temporal InSAR structural damage assessment: The London crossrail case study. Remote Sens. 2018, 10, 287. [Google Scholar] [CrossRef] [Green Version]
  27. Khorrami, M.; Alizadeh, B.; Tousi, E.G.; Shakerian, M.; Maghsoudi, Y.; Rahgozar, P. How groundwater level fluctuations and geotechnical properties lead to asymmetric subsidence: A PSInSAR analysis of land deformation over a transit corridor in the Los Angeles metropolitan area. Remote Sens. 2019, 11, 377. [Google Scholar] [CrossRef] [Green Version]
  28. Khorrami, M.; Abrishami, S.; Maghsoudi, Y.; Alizadeh, B.; Perissin, D. Extreme subsidence in a populated city (Mashhad) detected by PSInSAR considering groundwater withdrawal and geotechnical properties. Sci. Rep. 2020, 10, 1–16. [Google Scholar] [CrossRef] [PubMed]
  29. Cian, F.; Blasco, J.M.D.; Carrera, L. Sentinel-1 for monitoring land subsidence of coastal cities in Africa using PSInSAR: A methodology based on the integration of SNAP and staMPS. Geosciences 2019, 9, 124. [Google Scholar] [CrossRef] [Green Version]
  30. Mateos, R.M.; Ezquerro, P.; Luque-Espinar, J.A.; Béjar-Pizarro, M.; Notti, D.; Azañón, J.M.; Montserrat, O.; Herrera, G.; Fernández-Chacón, F.; Peinado, T.; et al. Multiband PSInSAR and long-period monitoring of land subsidence in a strategic detrital aquifer (Vega de Granada, SE Spain): An approach to support management decisions. J. Hydrol. 2017, 553, 71–83. [Google Scholar] [CrossRef]
  31. Usman Mustafa Environmental Fiscal Reform in Abbottabad: Drinking Water. Abbotabbad. 2009. Available online: https://d1wqtxts1xzle7.cloudfront.net/31494291/EFR_Drinking_Water_study.pdf?1372902795=&response-content-disposition=inline%3B+filename%3DHousehold_s_willingness_to_pay_for_safe.pdf&Expires=1612188284&Signature=Dt6JBR9gyBGI~Wm3cWOlS~0ZTwf8DHk7pe6yHHCVBkMc (accessed on 22 February 2021).
  32. Klemm, H.; Quseimi, I.; Novali, F.; Ferretti, A.; Tamburini, A. Monitoring horizontal and vertical surface deformation over a hydrocarbon reservoir by PSInSAR. First Break 2010. [Google Scholar] [CrossRef] [Green Version]
  33. Pepe, A.; Calò, F. A review of interferometric synthetic aperture RADAR (InSAR) multi-track approaches for the retrieval of Earth’s Surface displacements. Appl. Sci. 2017, 7, 1264. [Google Scholar] [CrossRef] [Green Version]
  34. Duan, W.; Zhang, H.; Tang, Y.; Wang, C.; Zeng, X.; Wang, J. Land subsidence monitoring for Beijing-tianjin-hebei region using sentinel-1. In Proceedings of the 2019 SAR in Big Data Era, BIGSARDATA 2019—Proceedings, Beijing, China, 5–6 August 2019; pp. 1–4. [Google Scholar]
  35. Zhou, C.; Lan, H.; Gong, H.; Zhang, Y.; Warner, T.A.; Clague, J.J.; Wu, Y. Reduced rate of land subsidence since 2016 in Beijing, China: Evidence from Tomo-PSInSAR using RadarSAT-2 and Sentinel-1 datasets. Int. J. Remote Sens. 2020. [Google Scholar] [CrossRef]
  36. Hernandez-Marin, M.; Esquivel-Ramirez, R.; Zermeño-De-Leon, M.E.; Guerrero-Martinez, L.; Pacheco-Martinez, J.; Burbey, T.J. Ongoing research on the pumping-induced land deformation in the Aguascalientes Valley: An analysis of the recent data of vertical deformation, groundwater level variations and local seismicity. Proc. of the Int. Assoc. of Hydrol. Sci. 2020, 382, 99–102. [Google Scholar] [CrossRef] [Green Version]
  37. Chang, H.; Liu, H.T.; Tsai, F. Deformation Monitoring and Analysis of Civil Engineering Structures Using InSAR and GIS; Progress of Remote Sensing Technology for Smart Future. 2020. Available online: https://a-a-r-s.org/proceeding/ACRS2019/TuP-6.pdf (accessed on 22 February 2021).
  38. Khan, S.; Waseem, M.; Khan, M.A.; Hussain, Z.; Ahmed, W.; Khaliq, A.H.; Umair, N.B.; Hussain, M.L. Microzonation map of the Abbottabad basin and immediate surroundings. J. Seismol. 2020. [Google Scholar] [CrossRef]
  39. Yakubu, B.I.; Hassan, S.M.; Asiribo, S.O. An Assessment of Spatial Variation of Land Surface Characteristics of Minna, Niger State Nigeria for Sustainable Urbanization Using Geospatial Techniques. Geosfera Indones. 2018. [Google Scholar] [CrossRef]
  40. Hussain, Z.; Khan, S.; Khan, M.A.; Waseem, M.; Ahmed, W. Mapping sediment thickness of the Abbottabad basin, Pakistan. J. Earth Syst. Sci. 2019. [Google Scholar] [CrossRef] [Green Version]
  41. Calkins, J.A.; Offield, T.W.; Abdullah, S.K.M.; Ali, S.T. Geology of the Southern Himalaya in Hazara, Pakistan, and Adjacent Areas. United States Geol. Surv. Prof. Pap. 1975. [Google Scholar] [CrossRef]
  42. Akhtar, S.; Rahim, Y.; Hu, B.; Tsang, H.; Ibrar, K.M.; Ullah, M.F.; Bute, S.I. Stratigraphy and Structure of Dhamtaur Area, District Abbottabad, Eastern Hazara, Pakistan. Open J. Geol. 2019. [Google Scholar] [CrossRef] [Green Version]
  43. Umar, M.; Sabir, M.A.; Farooq, M.; Khan, M.M.S.S.; Faridullah, F.; Jadoon, U.K.; Khan, A.S. Stratigraphic and sedimentological attributes in Hazara Basin Lesser Himalaya, North Pakistan: Their role in deciphering minerals potential. Arab. J. Geosci. 2015. [Google Scholar] [CrossRef]
  44. Ahsan, N.; Chaudhry, M.N. Geology of Hettangian to middle Eocene rocks of Hazara and Kashmir basins, Northwest lesser Himalayas, Pakistan. Geol. Bull. Panjab Univ. 2008, 43, 131–152. [Google Scholar]
  45. Qasim, M.; Asif Khan, M.; Haneef, M. Stratigraphic characterization of the early Cambrian Abbottabad formation in the Sherwan area, Hazara region, N. Pakistan: Implications for early Paleozoic stratigraphic correlation in NW Himalayas, Pakistan. J. Himal. Earth Sci. 2014, 47, 25. [Google Scholar]
  46. Zahid, M.; Ahmad, S.; Rehman, G.; Ali, F. Structural geometry of a part of the southeastern Hazara Fold-Thrust Belt, Pakistan G P S Khyber Pakhtunkhwa. Pakistan J. Hydrocarb. Res. 2009, 19, 19–28. [Google Scholar]
  47. Alaska Satellite Facility. Available online: https://asf.alaska.edu/about-asf/ (accessed on 22 February 2021).
  48. Hanssen, R.F. Radar Interferometry: Data Interpretation and Error Analysis (Remote Sensing and Digital Image Processing); Springer: Amsterdam, The Netherlands, 2001; ISBN 9780792369455. [Google Scholar]
  49. SARPROZ. Available online: https://www.sarproz.com/sarproz-faq (accessed on 22 February 2021).
  50. Fárová, K.; Jelének, J.; Kopačková-Strnadová, V.; Kycl, P. Comparing DInSAR and PSI techniques employed to Sentinel-1 data to monitor highway stability: A case study of a massive Dobkovičky landslide, Czech Republic. Remote Sens. 2019. [Google Scholar] [CrossRef] [Green Version]
  51. Perissin, D. Interferometric SAR multitemporal processing: Techniques and applications. In Remote Sensing and Digital Image Processing; Springer: Berlin/Heidelberg, Germany, 2016; pp. 145–176. [Google Scholar]
  52. Galloway, D.L.; Burbey, T.J. Review: Regional land subsidence accompanying groundwater extraction. Hydrogeol. J. 2011. [Google Scholar] [CrossRef]
  53. Holzer, T.L.; Johnson, A.I. Land subsidence caused by ground water withdrawal in urban areas. GeoJournal 1985. [Google Scholar] [CrossRef]
  54. Meribole, J. The Water Crisis in Pakistan. Available online: https://www.worldwatersolar.com/the-water-crisis-in-pakistan/ (accessed on 22 February 2021).
  55. Ernst & Young ShinNihon LLC Japan International Cooperation Agency (JICA) Ex-Post Project Evaluation 2017: Package IV-5 (Pakistan, Bangladesh). 2018, Volume 5, p. 142. Available online: https://openjicareport.jica.go.jp/pdf/1000040295.pdf (accessed on 22 February 2021).
  56. Nihon Suido Consultants CO.; Japan Techno CO. The District Government Abbottabad North West Frontier Province the Islamic Republic of Pakistan Preparatory Survey Report on the Project for the Improvement of Water Supply System in Abbottabad the Islamic Republic of Pakistan November 2009. Available online: https://openjicareport.jica.go.jp/pdf/11981180_01.pdf (accessed on 22 February 2021).
  57. Japan Gifts Water System to Abbottabad. 2015. Available online: https://www.jica.go.jp/pakistan/english/office/topics/press151015.html (accessed on 22 February 2021).
  58. Ahmed, T.; Pervez, A.; Mehtab, M.; Sherwani, S.K. Assessment of drinking water quality and its potential health impacts in academic institutions of Abbottabad (Pakistan). Desalin. Water Treat. 2015. [Google Scholar] [CrossRef]
  59. Tahir, A.A.; Muhammad, A.; Mahmood, Q.; Ahmad, S.S.; Ullah, Z. Impact of rapid urbanization on microclimate of urban areas of Pakistan. Air Qual. Atmos. Heal. 2015. [Google Scholar] [CrossRef]
  60. Zhang, Y.; Liu, Y.; Jin, M.; Jing, Y.; Liu, Y.; Liu, Y.; Sun, W.; Wei, J.; Chen, Y. Monitoring land subsidence in wuhan city (China) using the SBAS-INSAR method with radarsat-2 imagery data. Sensors 2019. [Google Scholar] [CrossRef] [PubMed] [Green Version]
Figure 1. The geographical location of the study area (a), and area of interest with a footprint of the master area (both ascending and descending tracks) (b).
Remotesensing 13 01651 g001aRemotesensing 13 01651 g001b
Figure 2. Geological map of the study area.
Remotesensing 13 01651 g002
Figure 3. Simplified methodological processing steps.
Remotesensing 13 01651 g003
Figure 4. Star graph showing temporal/perpendicular baseline distribution of data pairs.
Remotesensing 13 01651 g004
Figure 5. The graph between the connections and temporal coherence for descending track data on the right side and ascending on the left side.
Remotesensing 13 01651 g005
Figure 6. The scatter plot of Sentinel-1 data descending track on the right side and ascending on the left side (2017–2019).
Remotesensing 13 01651 g006
Figure 7. Ground subsidence in the study area from the descending track (a) and ascending track (b).
Remotesensing 13 01651 g007
Figure 8. Subsidence fluctuation graphs; (a) 2017, (b) 2018, and (c) 2019.
Remotesensing 13 01651 g008aRemotesensing 13 01651 g008b
Figure 9. PS points (P1, P2, P3, P4, and P5) selected in descending track (a) and ascending track (b).
Remotesensing 13 01651 g009
Figure 10. Subsidence along PS points (P1, P2, P3, P4, and P5) in descending track (x-axis is time 2017–2019. y-axis represents subsidence).
Remotesensing 13 01651 g010aRemotesensing 13 01651 g010b
Figure 11. (a) Subsidence profile from east to west; (b) east–west subsidence trend graph (2017–2019).
Remotesensing 13 01651 g011
Figure 12. (a) Subsidence profile from north to south; (b) north–south subsidence trend graph (2017–2019).
Remotesensing 13 01651 g012
Figure 13. (a) Tube-well location map; (b) subsidence map (2017–2019).
Remotesensing 13 01651 g013
Figure 14. Cracks in the walls and stairs within the study area (af).
Remotesensing 13 01651 g014
Figure 15. Water on the main road (KKH) during raining.
Remotesensing 13 01651 g015
Figure 16. Permanent scatterers on the geological map.
Remotesensing 13 01651 g016
Publisher’s Note: MDPI stays neutral with regard to jurisdictional claims in published maps and institutional affiliations.

