Article

Detection of European Aspen (Populus tremula L.) Based on an Unmanned Aerial Vehicle Approach in Boreal Forests

1
Department of Geographical and Historical Studies, University of Eastern Finland, P.O. Box 111, FI-80101 Joensuu, Finland
2
School of Forest Sciences, University of Eastern Finland, P.O. Box 111, FI-80101 Joensuu, Finland
3
Finnish Environment Institute, Biodiversity Centre, Latokartanonkaari 11, FI-00790 Helsinki, Finland
4
Earth Change Observation Laboratory, Department of Geosciences and Geography, University of Helsinki, P.O. Box 64, FI-00014 Helsinki, Finland
5
Department of Forest Sciences, University of Helsinki, P.O. Box 27, FI-00014 Helsinki, Finland
*
Author to whom correspondence should be addressed.
Submission received: 1 April 2021 / Revised: 26 April 2021 / Accepted: 27 April 2021 / Published: 29 April 2021
(This article belongs to the Special Issue Individual Tree Detection and Characterisation from UAV Data)

Abstract

:
European aspen (Populus tremula L.) is a keystone species for biodiversity of boreal forests. Large-diameter aspens maintain the diversity of hundreds of species, many of which are threatened in Fennoscandia. Due to a low economic value and relatively sparse and scattered occurrence of aspen in boreal forests, there is a lack of information of the spatial and temporal distribution of aspen, which hampers efficient planning and implementation of sustainable forest management practices and conservation efforts. Our objective was to assess identification of European aspen at the individual tree level in a southern boreal forest using high-resolution photogrammetric point cloud (PPC) and multispectral (MSP) orthomosaics acquired with an unmanned aerial vehicle (UAV). The structure-from-motion approach was applied to generate RGB imagery-based PPC to be used for individual tree-crown delineation. Multispectral data were collected using two UAV cameras: Parrot Sequoia and MicaSense RedEdge-M. Tree-crown outlines were obtained from watershed segmentation of PPC data and intersected with multispectral mosaics to extract and calculate spectral metrics for individual trees. We assessed the role of spectral data features extracted from PPC and multispectral mosaics and a combination of it, using a machine learning classifier—Support Vector Machine (SVM) to perform two different classifications: discrimination of aspen from the other species combined into one class and classification of all four species (aspen, birch, pine, spruce) simultaneously. In the first scenario, the highest classification accuracy of 84% (F1-score) for aspen and overall accuracy of 90.1% was achieved using only RGB features from PPC, whereas in the second scenario, the highest classification accuracy of 86 % (F1-score) for aspen and overall accuracy of 83.3% was achieved using the combination of RGB and MSP features. The proposed method provides a new possibility for the rapid assessment of aspen occurrence to enable more efficient forest management as well as contribute to biodiversity monitoring and conservation efforts in boreal forests.

Graphical Abstract

1. Introduction

Tree species composition of a forest plays a significant role in maintaining biodiversity. Mixed-species forests can host greater species richness and provide more important ecosystem services compared to monocultures of conifers [1,2,3,4]. In boreal environments, particularly old deciduous trees have been recognized to promote species richness [5,6]. Accurate identification of tree species is thus essential for effective mapping and monitoring of biodiversity and sustainable forest management [7,8].
European aspen (Populus tremula L.) is a keystone species for biodiversity of boreal forests [9,10]. It has a widespread, but sparse occurrence in North European forest types from dry rocky areas to water-logged sites. Aspen hosts a wide variety of associated and dependent species, such as invertebrates [11,12], epiphytic bryophytes and lichens [13,14], polypores [15], mammals [16], and birds [17,18], many of which are red-listed [1,19] and threatened in Fennoscandia [20,21,22]. Large-diameter aspen trees (>20–25 cm) are the most valuable from an ecological perspective as they can provide suitable habitat for hundreds of species [23,24,25].
There is a lack of spatial and temporal information of aspen occurrence in boreal forests [10,25,26]. This is because aspen is a sparsely occurring deciduous species with low economic value and often pooled with other minor deciduous species in forest resource datasets. Moreover, patchy occurrence of aspen poses challenges for ordinary inventory and mapping methods [27,28,29,30]. From the biodiversity viewpoint, spatially explicit data of aspen abundance, occurrence of old tree individuals, and long-term occurrence dynamics are urgently needed for understanding the current status and predicting the future state of different aspen-associated species and their populations [10,31]. In boreal forests, accurately detected keystone features, such as aspen, can provide cost-effective indicators of biological diversity, ecosystem functions and ecosystem services.
Various remote sensing techniques such as airborne laser scanning (ALS), aerial photogrammetry, and satellite-based approaches have been widely studied for tree species classification at different spatial scales [7,30,31,32,33,34,35,36,37]. Development of Unmanned Aerial Vehicles (UAVs, also referred to as drones) has grown rapidly during the recent decade, including in the field of forestry-oriented applications [38,39,40,41,42]. UAVs can host a wide range of sensors, their operational costs are low, and missions can be flexibly planned [42]. UAV-based very high-resolution data on-demand allow estimating structural parameters of forests with high accuracy and provide detailed information for identification of tree species [43,44,45,46,47,48].
In general, high spatial and temporal resolution UAV imagery provides new opportunities for measuring and mapping various ecological phenomena and enables more efficient management and monitoring of natural resources and biodiversity in addition to direct forestry applications [49,50,51]. For example, Baena et al. [52] used UAV images to identify and quantify keystone tree species and their health in the Pacific Equatorial dry forest, and Michez et al. [53] employed multitemporal UAV imagery to classify deciduous tree species and their health status in critically endangered riparian forests in Belgium. UAVs have also been utilized for detecting non-native and invasive species with potentially adverse effects on biodiversity and ecosystems [54,55,56,57].
UAV-based tree species classification, utilizing hyperspectral imagery and photogrammetric point clouds (PPC) derived from RGB imagery, has been recently studied in boreal forests [58,59,60,61]. The study of Nevalainen et al. [58] performed artificial neural networks and random forest machine-learning methods to detect Scots pine (Pinus sylvestris L.), Norway spruce (Picea abies (L.) Karst), silver birch (Betula pendula), and larch (Larix sibirica) with overall accuracy of around 95%. Nezami et al. [59] achieved 97.6% of accuracy in classification of Scots pine, Norway spruce and silver birch in boreal forest using convolutional neural networks. The results of Tuominen et al. [60] and Saarinen et al. [61] showed that the amount of main tree species Scots pine, Norway spruce, and birch (Betula pendula and pubescens L.) was predicted more accurately compared to aspen due to the low number of observations of the latter within the study area. Fewer studies have been conducted to classify tree species based on UAV multispectral imagery [62,63]. Franklin and Ahmed [64] studied deciduous forest species classification, including quaking aspen (Populus tremuloides) in a Canadian hardwood forest using multispectral UAV imagery. Aspen was classified with high accuracy, but the number of sample trees was very low in the study.
The objective of this study was to assess the possibilities to recognize European aspen at the individual tree level in a boreal forest using high-resolution photogrammetric point cloud and multispectral imagery acquired with UAV. Specifically, we asked the following questions:
(1) How accurately can aspen be discriminated from the main tree species, Scots pine, Norway spruce and birches (B. pendula and pubescens) with the commonly used multispectral UAV cameras?
(2) What are the most important spectral data features to discriminate aspen trees?
To answer these questions, we assessed the performance of different spectral data features, extracted from high-resolution UAV PPC and multispectral orthomosaics using an SVM machine-learning classifier and studied the effect of feature selection for the model performance.

2. Materials and Methods

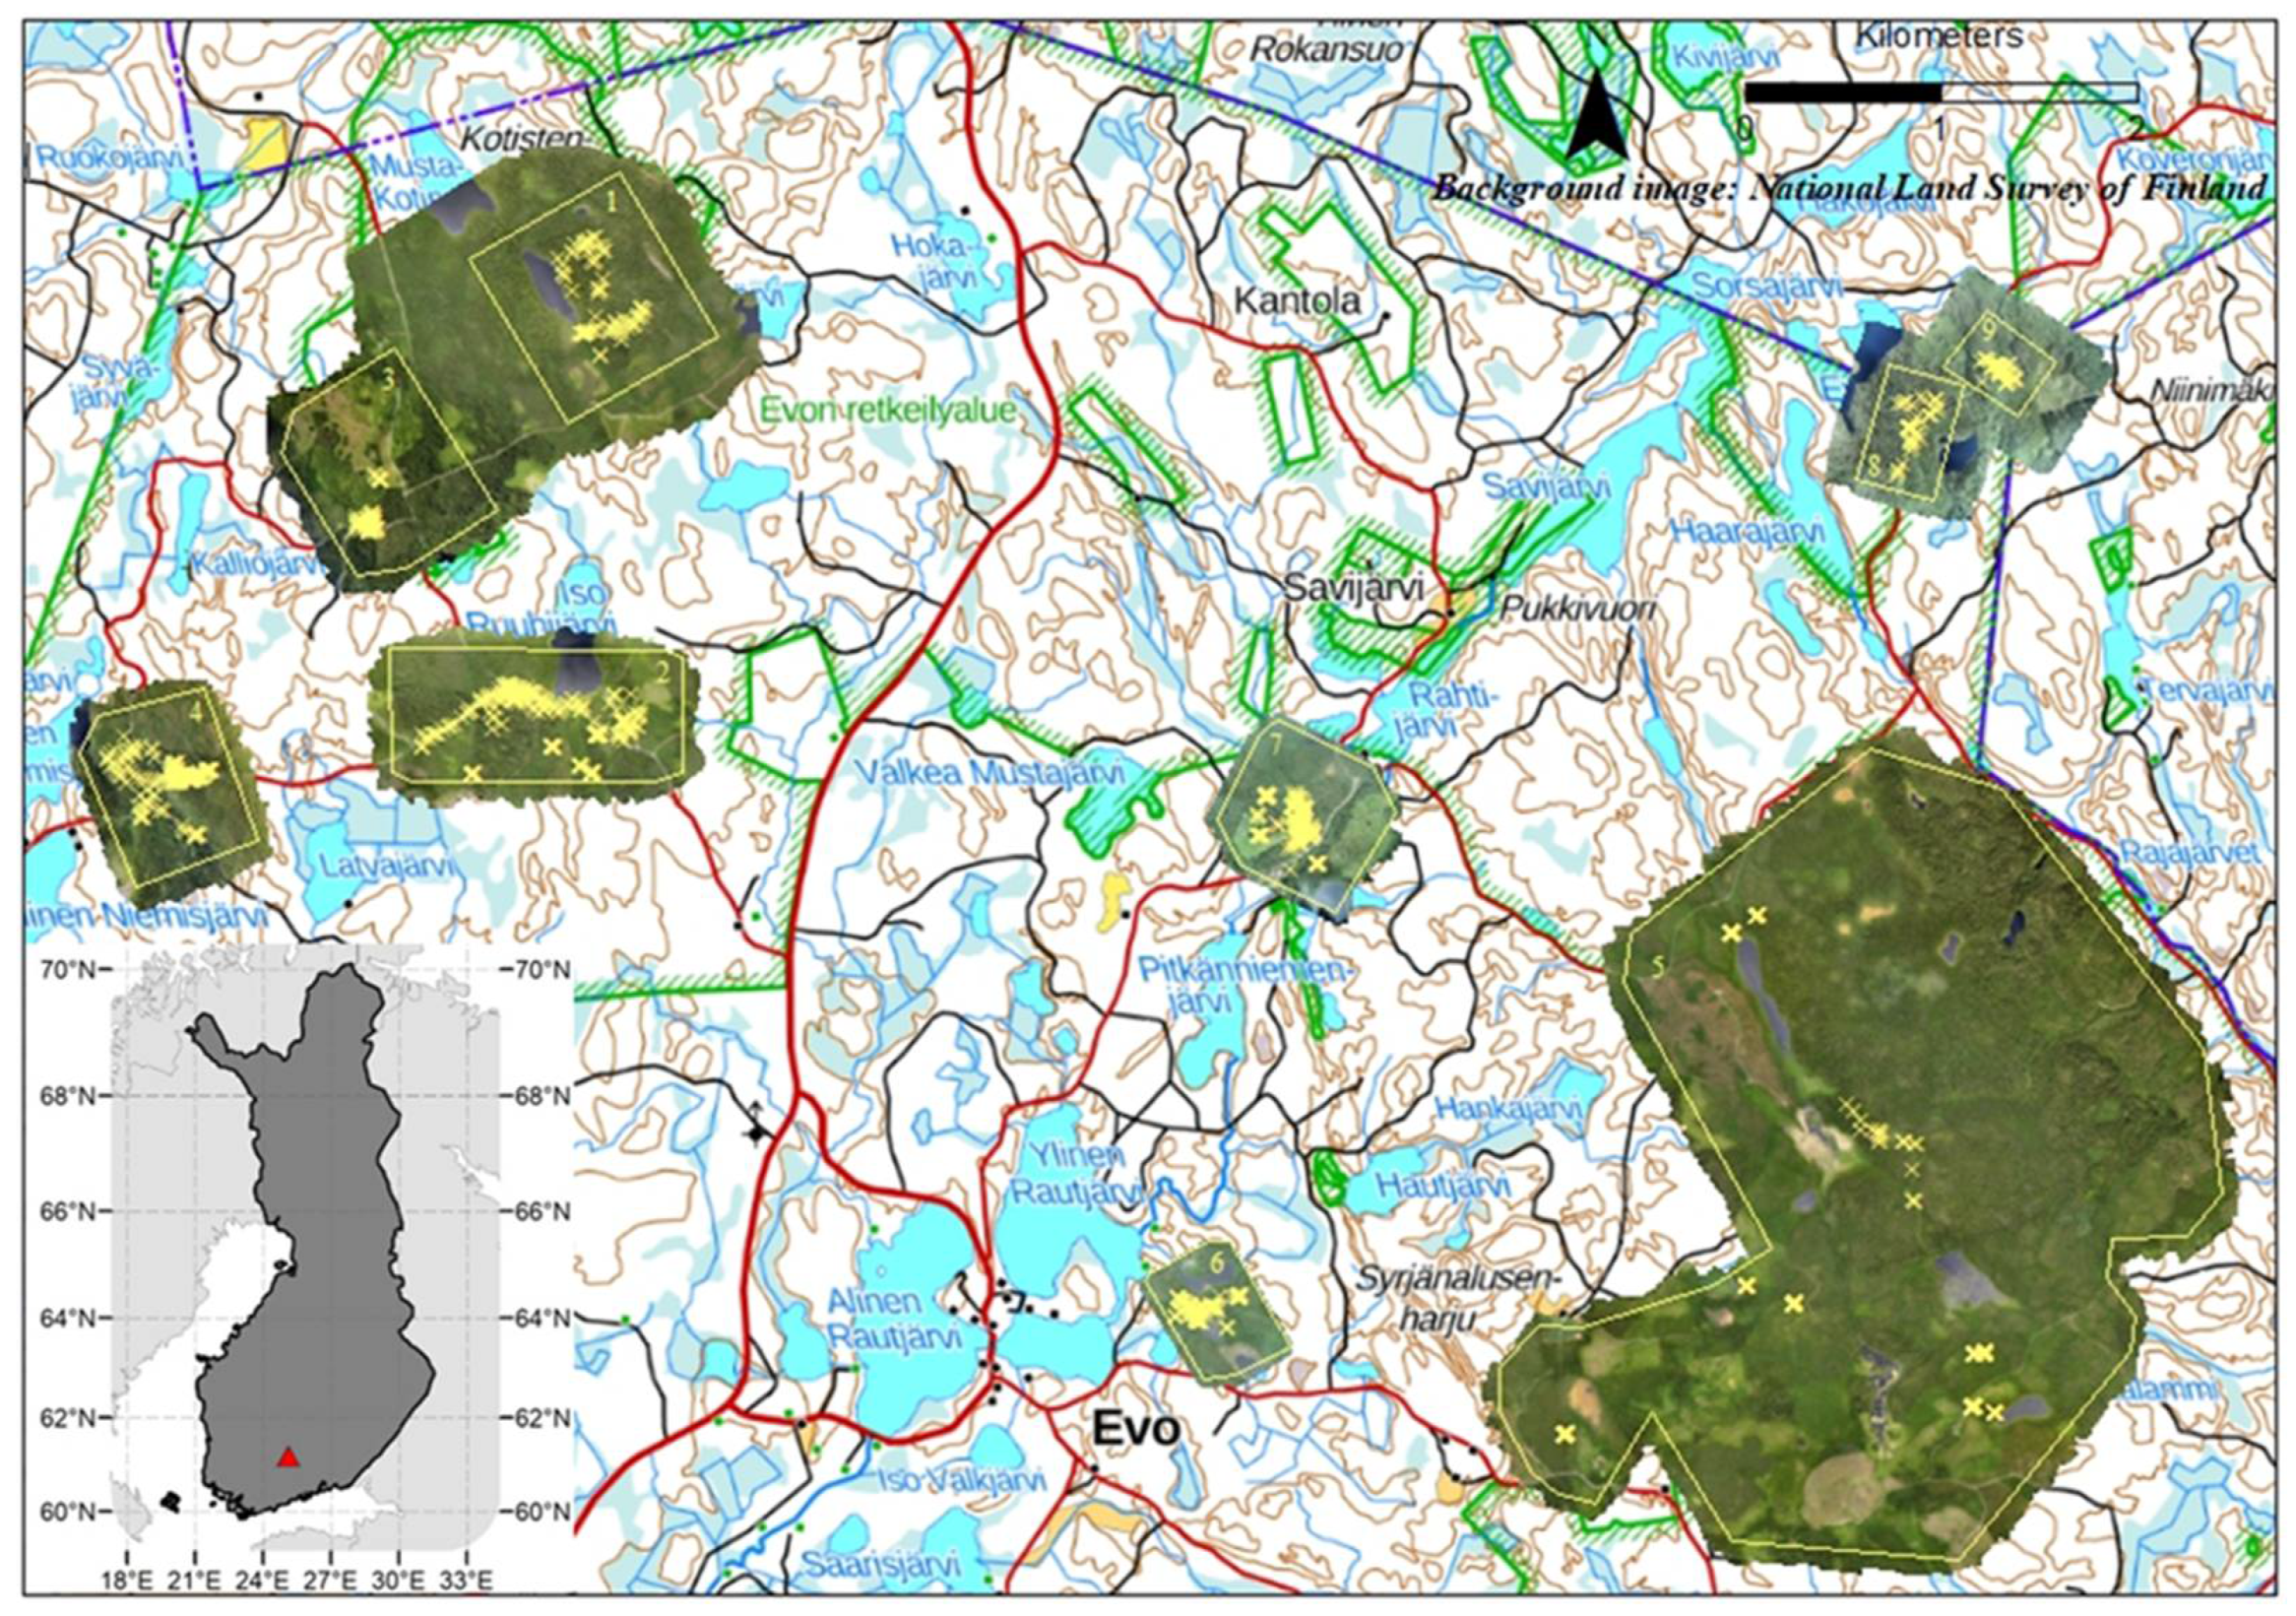
2.1. Study Area and Field Data

The study was conducted in a boreal forest area in the Evo region in the Hämeenlinna municipality (61°11′N. 25°06′E) located in southern Finland (Figure 1). The area includes both managed and protected southern boreal forests. The main tree species are Scots pine (Pinus sylvestris L.), Norway spruce (Picea abies (L.) Karst), silver birch (Betula pendula) and downy birch (Betula pubescens L.). European aspen (Populus tremula L.) has a relatively sparse and scattered occurrence in the area.
Most of the field data were collected simultaneously with the flight campaign in July 2018. Separate field datasets were collected for study areas covered by MicaSense and Sequoia sensors (see chapter 2.2). Field measurements of the main tree species were conducted from 25 circular 9-m radius sample plots situated in semiclosed and fully closed canopy forests. Within each sample plot, tree species, diameter at breast height (DBH), tree height, and tree positions were recorded for all trees with DBH > 45 mm. In order to ensure the crown visibility from the UAV images and to better capture the mature and old-growth aspens, only the living and standing trees with DBH over 200 mm were selected for the analyses. The sparse and clustered occurrence of aspen in the study area led to an unbalanced main tree species proportion in the dataset for an analysis. To ensure a sufficient sample size of main trees species, we measured within the study sites more individual tree species in autumn 2019 as complementary data (Table 1). The locations of trees in the field plots and complementary dataset were measured using Trimble R10 RTK-GPS device using VRS Trimnet network in Finland.

2.2. UAV Data

The complete workflow is presented in Figure 1. UAV RGB and multispectral imagery for the analysis were obtained over the 9 test sites within the study area in July 2018 with leaf-on canopy conditions (Figure 2). The research sites were selected based on visual detection of aspen hotspots in the area, accessibility to the roads, and proximity to the landing spots of the UAVs.
RGB images were collected using an eBee Plus RTK fixed-wing platform (SenseFly SA, Cheseaux-sur-Lausanne, Switzerland) and a multirotor platform Phantom 4 RTK (DJI, Shenzhen, China), both equipped with real-time kinematic (RTK) receiver. The eBee was equipped with a 20 megapixel global shutter S.O.D.A camera with a field of view of 64° (SenseFly SA, Cheseaux-sur-Lausanne, Switzerland). The Phantom 4 had an integrated camera with a field of view of 84° and 1/2.3 CMOS sensor that can capture red–green–blue (RGB) spectral information. The altitude of 130–150 m above ground level resulted in a ground sampling distance (GSD) of 3.9–4.9 cm for the RGB imagery. Images were collected in TIFF format with the camera set in automatic mode at noon under clear sky and calm conditions to minimize wind and shadow effects on images. RGB images acquired with the eBee and Phantom 4 were further pre-processed for precision geotagging in eMotion 3 software (SenseFly SA, Cheseaux-sur-Lausanne, Switzerland) and DJI software (DJI, Shenzhen, China), respectively. The trajectory correction data were obtained online during the flight from Trimnet VRS network in Finland.
Multispectral data were collected using the eBee equipped with a Parrot Sequoia camera (Parrot Drone SAS, Paris, France) and a multirotor platform DJI Matrice 210 (DJI, Shenzhen, China) equipped with MicaSense RedEdge-M camera (MicaSense, Inc., Seattle, WA, USA). The monochromatic multispectral Sequoia camera produces four 1.2-megapixel images in the green (550 nm), red (660 nm), red edge (735 nm) and near infrared (NIR) (790 nm) wavelengths. The MicaSense RedEdge-M sensor (further MicaSense) produces five 1.2-megapixel images in blue (475 nm), green (560 nm), red (668 nm), red edge (717 nm) and NIR (840 nm) wavelengths. In order to improve the radiometric quality of the multispectral data, both cameras were equipped with the irradiance sensors, which were attached on the top of the body to correct the illumination conditions during the flight. Additionally, prior to each flight and right after, the radiometric calibration targets with premeasured reflectance values were used for subsequent radiometric correction of the multispectral images. Ground control points (GCPs) were not used due to the low visibility in the dense forest from the air. Therefore, the absolute spatial accuracy of the multispectral orthomosaics was corrected using manually selected natural objects as GCPs, extracted from the RGB orthomosaics with a typical accuracy of 2 cm in the horizontal direction. The altitude of 140–150 m above ground resulted a GSD of 8.6–14.5 cm for multispectral imagery. The total flight area covered with the UAV is 1819 ha. A full summary of the UAV flight parameters is presented as an Appendix A in Table A1.

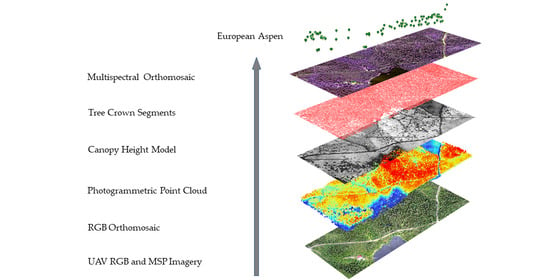
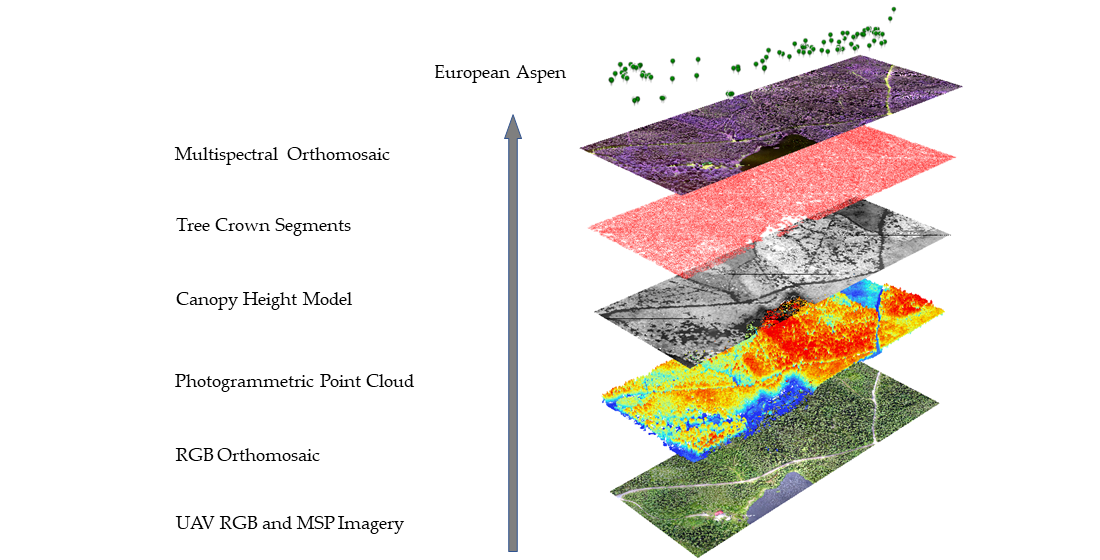
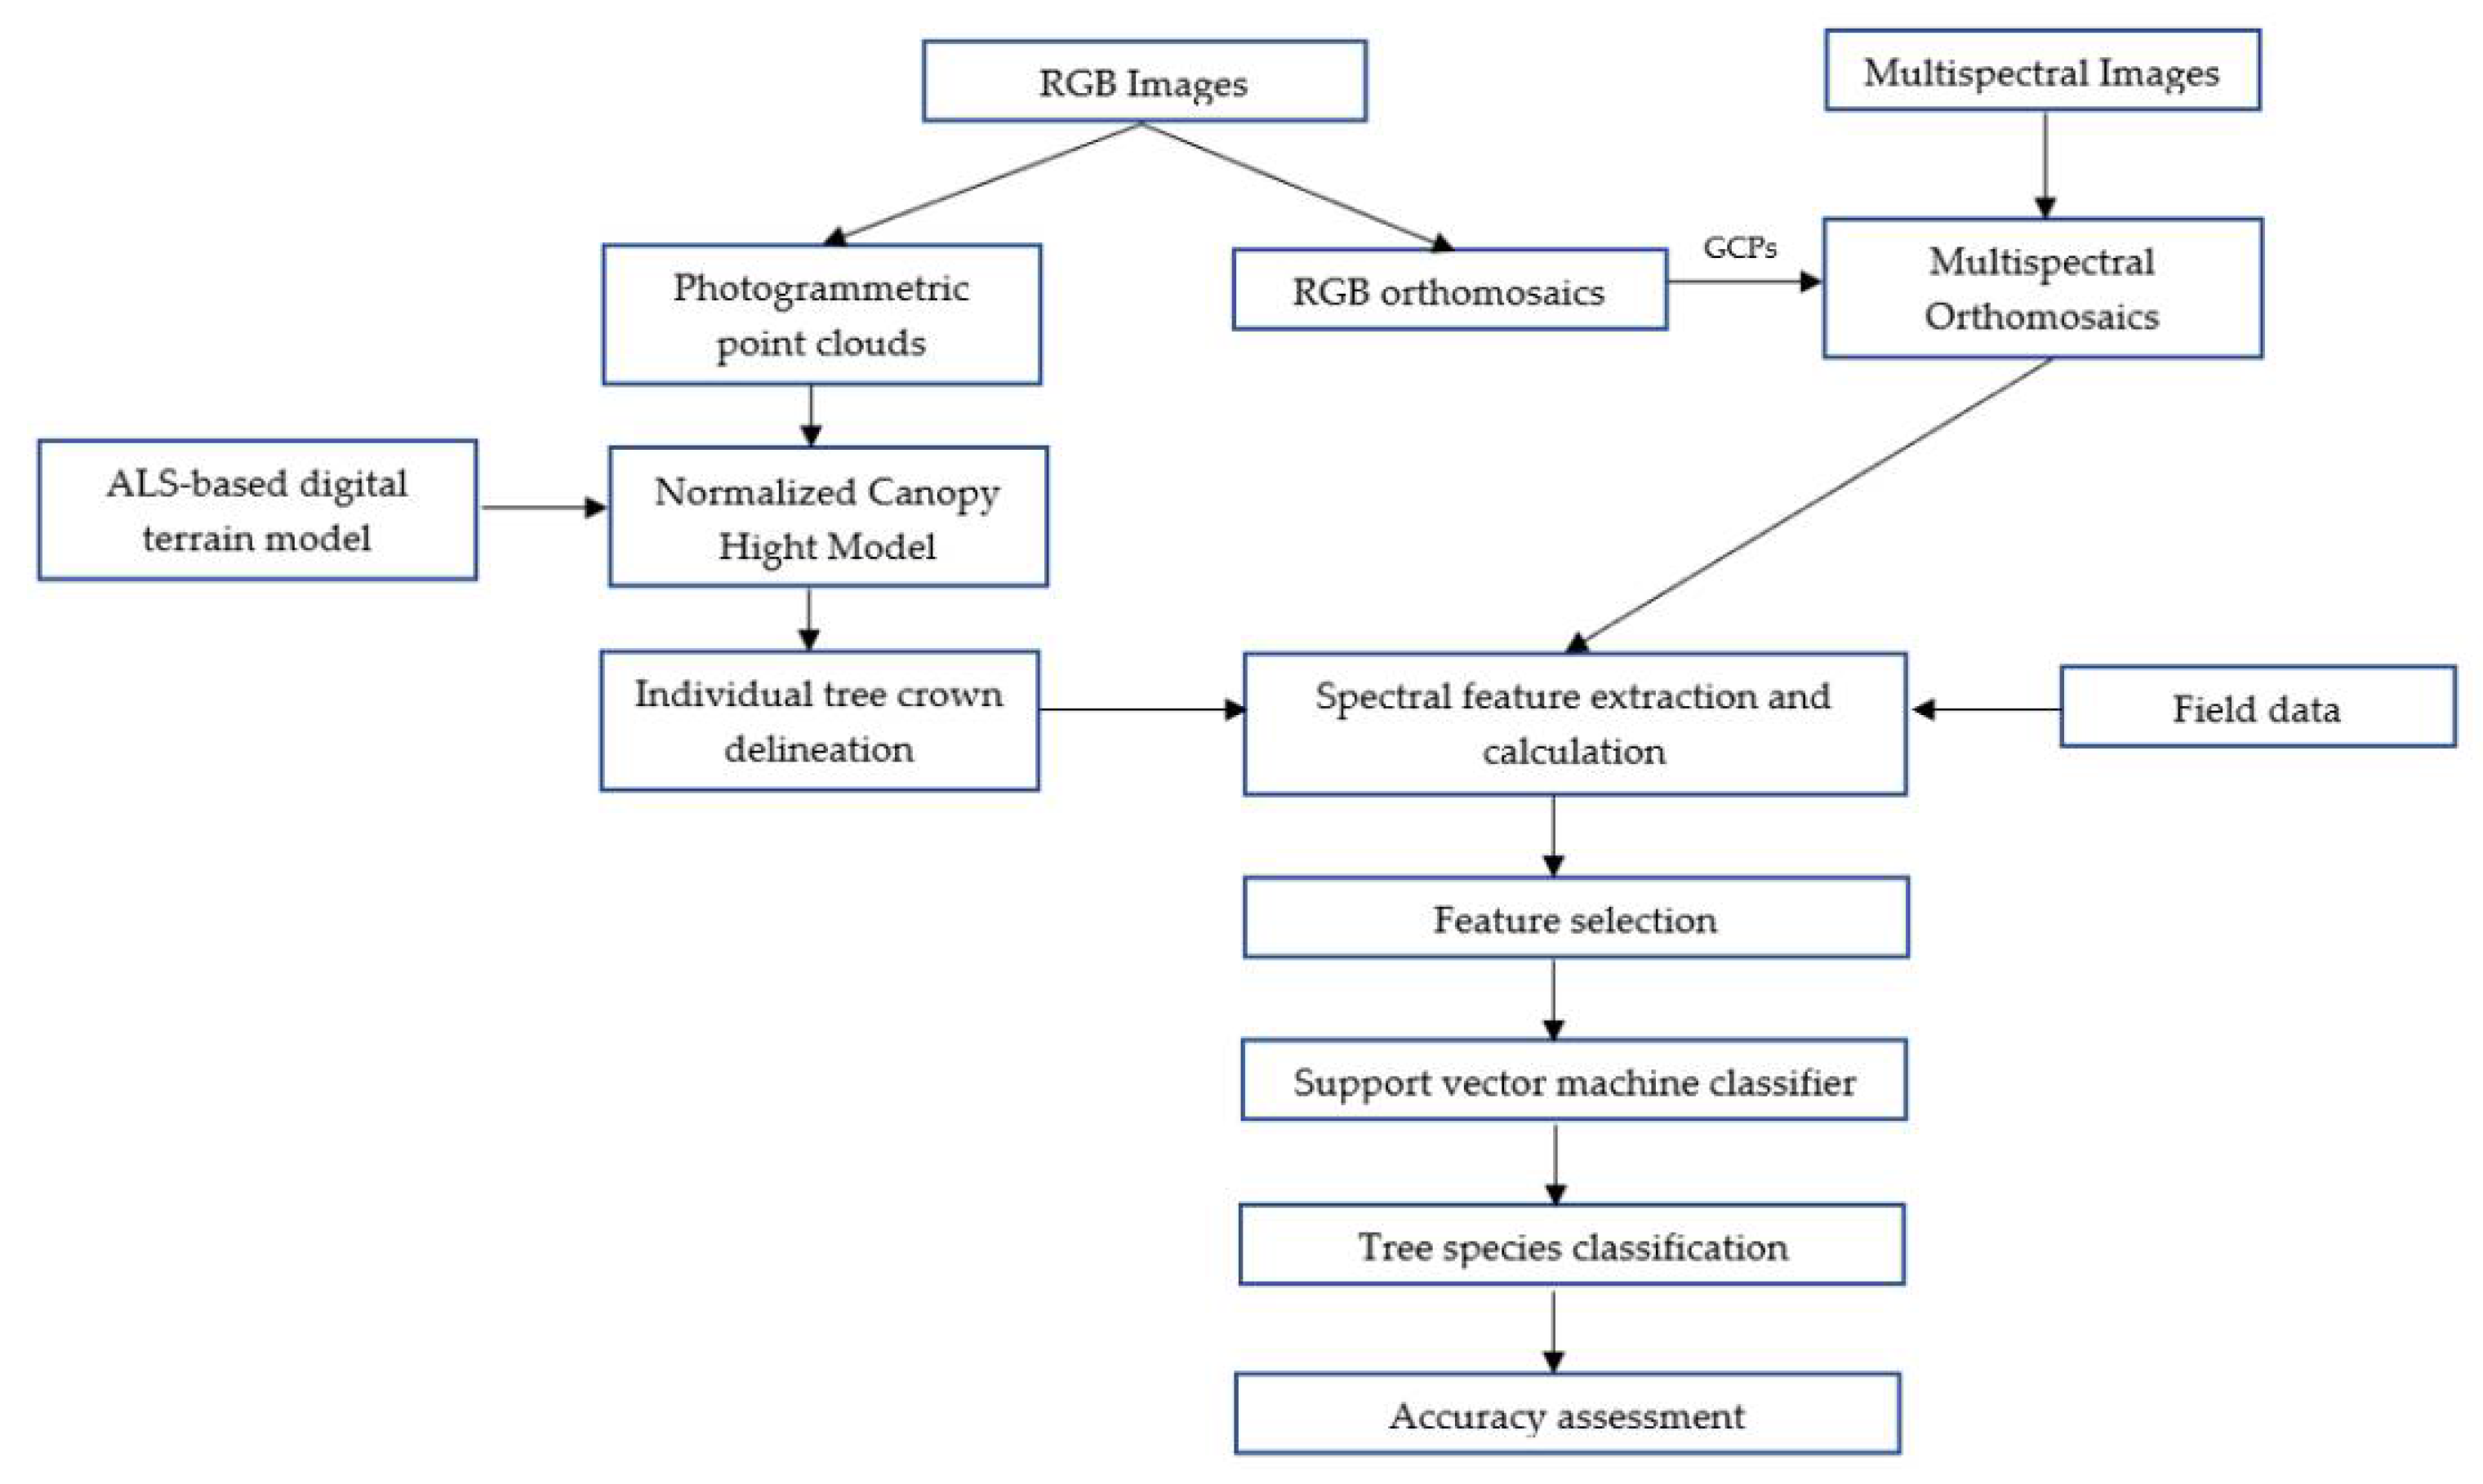
2.3. Calculation of Dense Point Clouds and Image Orthomosaics

The analysis workflow of this study is presented in Figure 2. Processing of the UAV images for generating 3D point clouds and producing orthomosaics was carried out using the Agisoft Metashape software (Agisoft LLC, St. Petersburg, Russia), which is a commercial photogrammetry processing software that uses the Structure from Motion (SfM) approach to reconstruct the environment in 3D from a set of overlapping images and allows generation of dense 3D point clouds and orthomosaics. The standard photogrammetric workflow starts from the image alignment procedure, where images are processed using their full resolution (corresponds to “high quality” settings) to find the orientation and produce the sparse point cloud. During the image alignment, the software performs the camera calibration based on Brown’s distortion model [65]. Based on estimated image positions the software calculates depth information for each image to be combined into a single dense point cloud. During this stage, the software generates PPC using downscaled images to the factor of 4 (corresponds to “high quality” settings) together with a depth filtering mode “Mild” to obtain detailed and accurate geometry without outliers among the points [44,66]. Resulting point cloud included XYZ coordinates and spectral information (i.e., red, green, and blue) for each point. Orthomosaics, geometrically corrected aerial images that are composed from individual still images and stitched together, were produced from multispectral and RGB images, respectively, using the same software and procedure described above. Once the point cloud was generated, it was further used to create orthophotos. RGB orthomosaics were used only for visual verification of field-measured trees and the quality of further individual tree-crown segmentation results. The dense point clouds and multispectral orthomosaics were exported in LAS and TIF formats, respectively, for further processing.

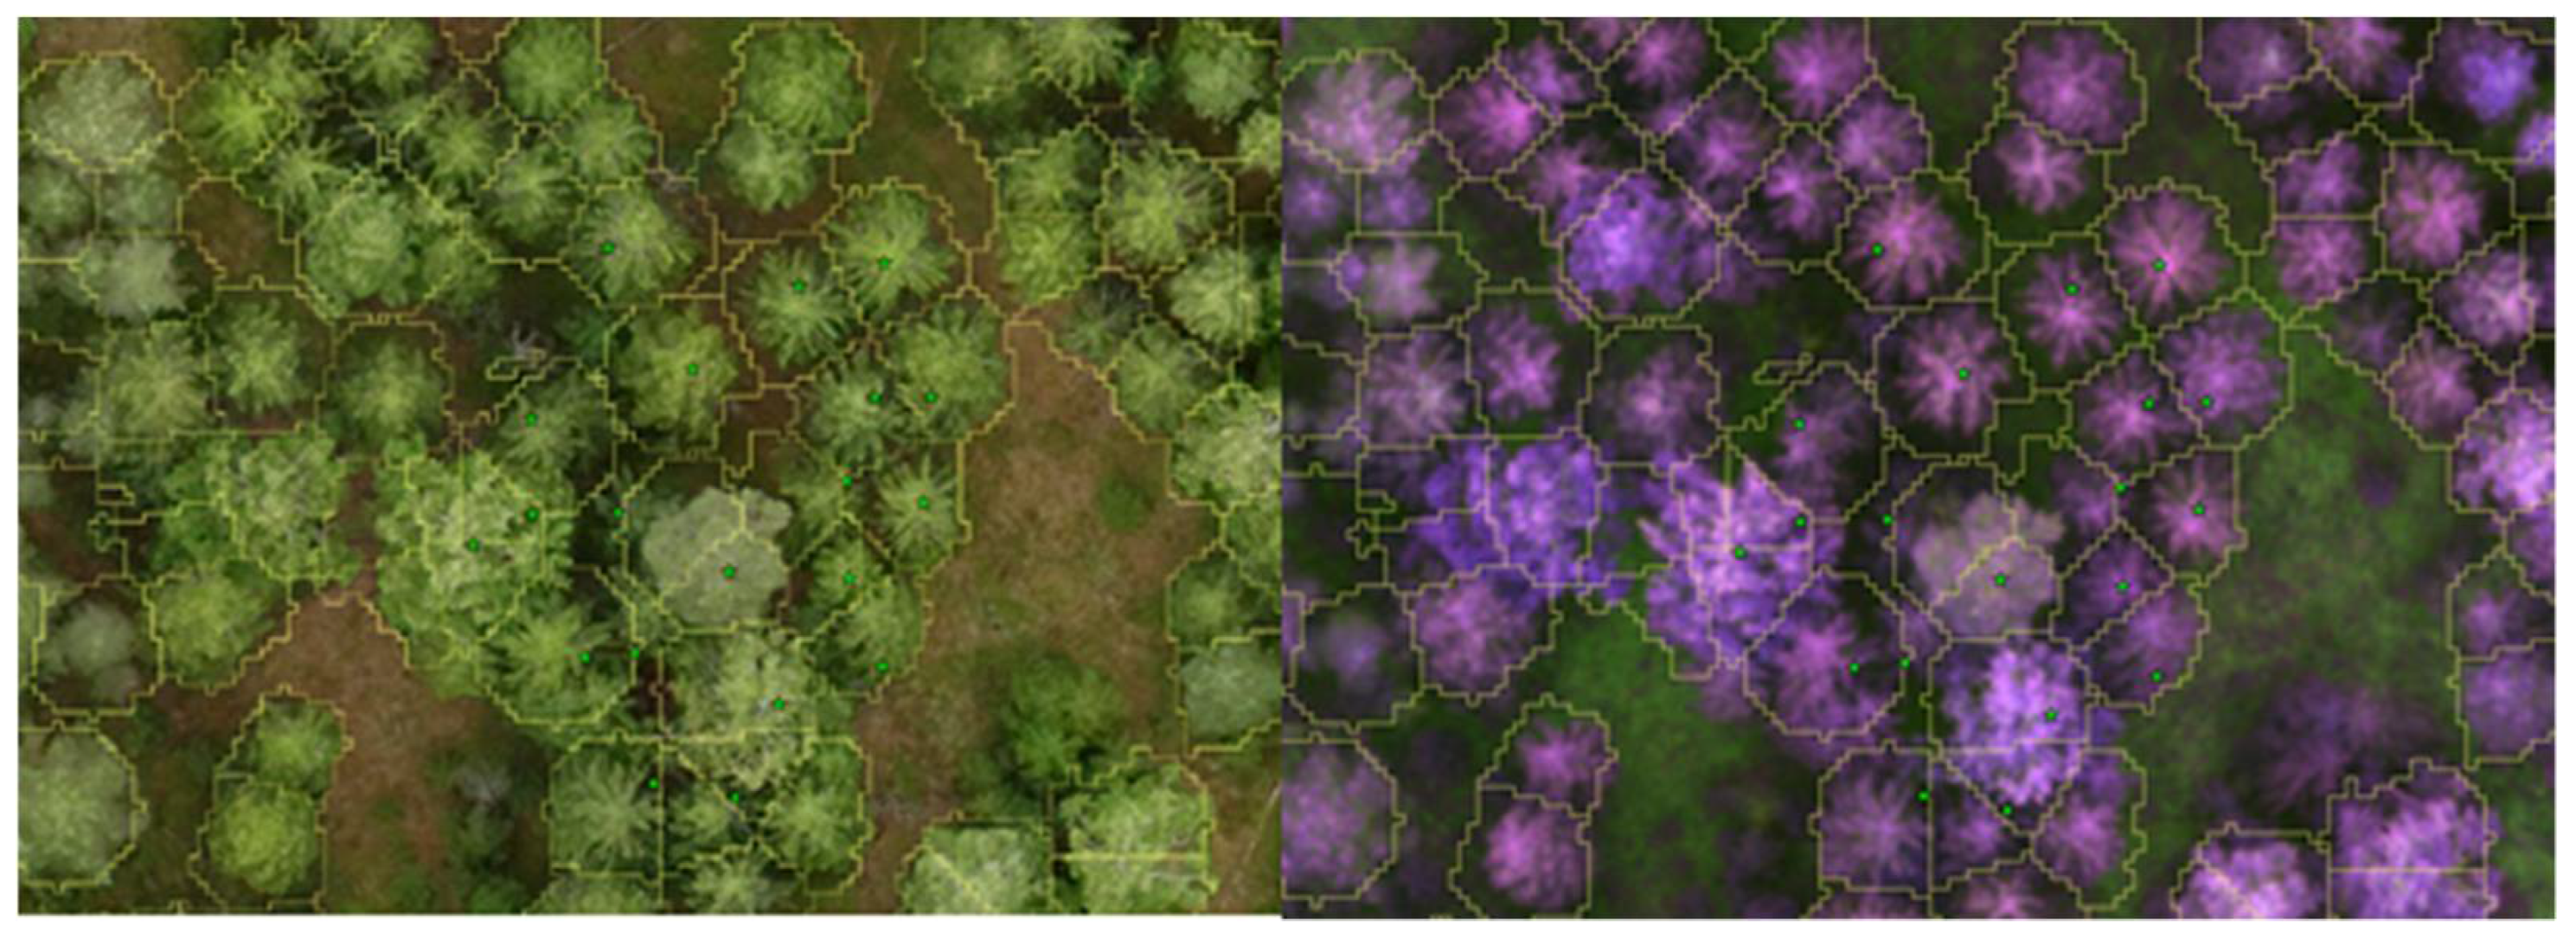
2.4. Individual Tree Detection and Spectral Data Features Extraction

The photogrammetric point cloud from each site was normalized with the publicly available ALS-based digital terrain model (2m) provided by the National Land Survey of Finland. The canopy height model was created using lastools [67]. Individual tree detection (ITD) was performed in R-software [68] using R-package rlidar [69] to detect the location and height of individual trees within the PPC-derived Canopy Height Model (CHM). The algorithm implemented in this function was local maxima with a fixed window size. The maximum value of crown diameter was set to 3 m to capture only the tree top and reduce mixing with nearby tree crowns. Then the created tree segments were overlaid with the multispectral mosaics and field-measured trees to further extract the spectral features of all bands for each corresponding tree top and field measured tree. Only pixels located inside the tree-crown segment were taken into analysis. Some of the tree segments contained multiple field measurements. In case the measurements represented only one tree species, they were included in the analysis. All segments with measurements from multiple tree species were excluded from the analysis. Results of the segmentation were visually assessed against the RGB orthomosaics (Figure 3). In total 30 and 36 spectral features for Sequoia and MicaSense datasets, respectively, were extracted for each individual tree segment and mean, min, max, median and 25%, 75% percentiles of each spectral band were calculated for each segment; a full list of the spectral features is presented as an appendix in Table A2. Before classification, the spectral variables were normalized by dividing the brightness at each band by the sum of all brightness values observed for the same point [70].

2.5. Statistical Analysis

The segment data derived from the RGB point clouds, MicaSense and Sequoia mosaics were imported into statistical software R for classification with the machine learning method SVM. The SVM is implemented in the package caret [71]. We implemented SVM with radial basis function kernel that separates different classes by projecting the original data into new dimensionality such that it becomes easier to separate through linear hyperplanes. SVM is a commonly used method due to its ability to generalize well, even with smaller training samples [72].
Before fitting the SVM models, we applied recursive feature elimination (RFE), a wrapper feature selection algorithm implemented in caret to avoid model overfitting by eliminating unimportant and potentially noisy features [73]. The model was first fit to all predictors in the feature set and predictors were ranked based on their importance to the model. The least important predictor in the feature set was eliminated, and a second model was fitted with the remaining predictors. The iteration continued until no more improvement in model performance could be observed. We used external validation with 10-fold cross-validation as an outer resampling method to the RFE algorithm. Feature selection was applied separately for three different feature sets: spectral features extracted from PPC (hereafter referred as RGB), spectral features extracted from multispectral mosaics (hereafter MSP), and the combination of the two (RGB+MSP). Due to the stochastic nature of the RFE algorithm, we iterated it 21 times to select the final number of features for each model based on median overall accuracy value.
Data partitioning was applied to divide the total of 306 samples of MicaSense and 465 samples of Sequoia datasets into 70% training and 30% testing sets using proportional stratified random sampling [71]. The first set was used only for model training, while the second set was used as an independent hold-out test set for accuracy assessment and feature importance calculations.
After feature selection and data partitioning, separate SVM models were fit with the three alternative feature sets, which were centered and scaled for model training. Furthermore, SVM hyperparameters cost and sigma were optimized with grid search [73] from 15 values ranging from 0.25 to 4096 for cost, and 0.01 to 0.35 for sigma. We iterated training and prediction steps 21 times for each SVM model to get more stable results due to the stochastic nature of the machine-learning algorithm.
We used model class reliance (MCR) implemented in iml r-package [74] to examine which spectral features are important to discriminate aspen from the other common tree species. The MCR is “the highest and lowest degree to which any well-performing model within a given class may rely on a variable of interest for prediction accuracy” [75]. The importance of each feature was assessed by calculating the increase in the model’s classification error after permuting the feature and repeating the permutations 20 times to obtain more stable results. The results can be interpreted as follows. If permuting a feature’s values increases the error, the feature can be considered “important”, but if permutations leave the value unchanged, it is “unimportant”. This is because in the first case, the model relied on the feature for the prediction, and in the latter, because the model ignored it [74]. In practical terms, the MCR value of 2 can be interpreted as heavy model reliance on the feature, while a value closer to 1 signifies less or no reliance [74].
The F1-score, confusion matrices and Cohen’s kappa coefficients were calculated to measure the classification accuracy. F1 score considers harmonic mean of both precision and recall, equivalent to the user’s (UA) and producer’s accuracy (PA) [73], and calculated using following equation:
F 1 = 2 × U A × P A U A + P A
the values range between 0 and 1, with the best value being 1 and the worst being 0.

3. Results

3.1. Accuracy Assessment of the 2-Class Classification Model

The accuracy assessment of the model performance for a 2-class classification approach (aspen vs. other species) after feature selection is presented in Table 2. For the MicaSense dataset, similar results were achieved with only RGB features and a combination of RGB and MSP features (OA = 90.1%, Kappa = 0.76–0.77, F1-score for aspen = 82–84%). Model fitted with only MSP features produced slightly less accurate results (OA = 87.9%, Kappa = 0.72, F1-score for aspen = 81%). The feature selection did not find any features to eliminate from the models fitted with either RGB or MSP features, but for the RGB+MSP model some simplification was observed with four eliminated spectral features.
In a similar fashion, the Sequoia dataset also yielded equally good results with models including only RGB features or a combination of RGB and MSP features (OA = 89.2–89.9%, Kappa = 0.70–0.73, F1-score for aspen = 77–79%). Again, accuracy metrics of the MSP model were considerably worse compared to the other two models (OA = 84.1%, Kappa = 0.57, F1-score for aspen = 68%). The feature selection algorithm eliminated three features from MSP and one feature from RGB+MSP feature sets.
The confusion matrices for the best SVM model using MicaSense and Sequoia datasets are shown on Table 3.

3.2. Accuracy Assessment of the 4-Class Classification Model

Table 4 shows the accuracy assessment of the model performance for a 4-class classification approach (all species as separate classes). In general, the models trained with all spectral data features provided the best results for both datasets (Kappa = 0.75–0.78, OA = 81.3–83.3% and F1-score of aspen = 80–86%). Similar to the 2-class models, the initial feature count was kept for MicaSense and Sequoia models fitted with only RGB features. The feature selection did have an impact on simplifying the models fitted with MSP and RGB+MSP features. Six spectral features were eliminated from the MicaSense MSP model, and seven from the Sequoia model with the same feature set. Eight features were eliminated from the MicaSense RGB+MSP model and four from the Sequoia RGB+MSP model. The confusion matrices for the best SVM model for MicaSense and Sequoia datasets (RGB+MSP features) are shown on Table 5.

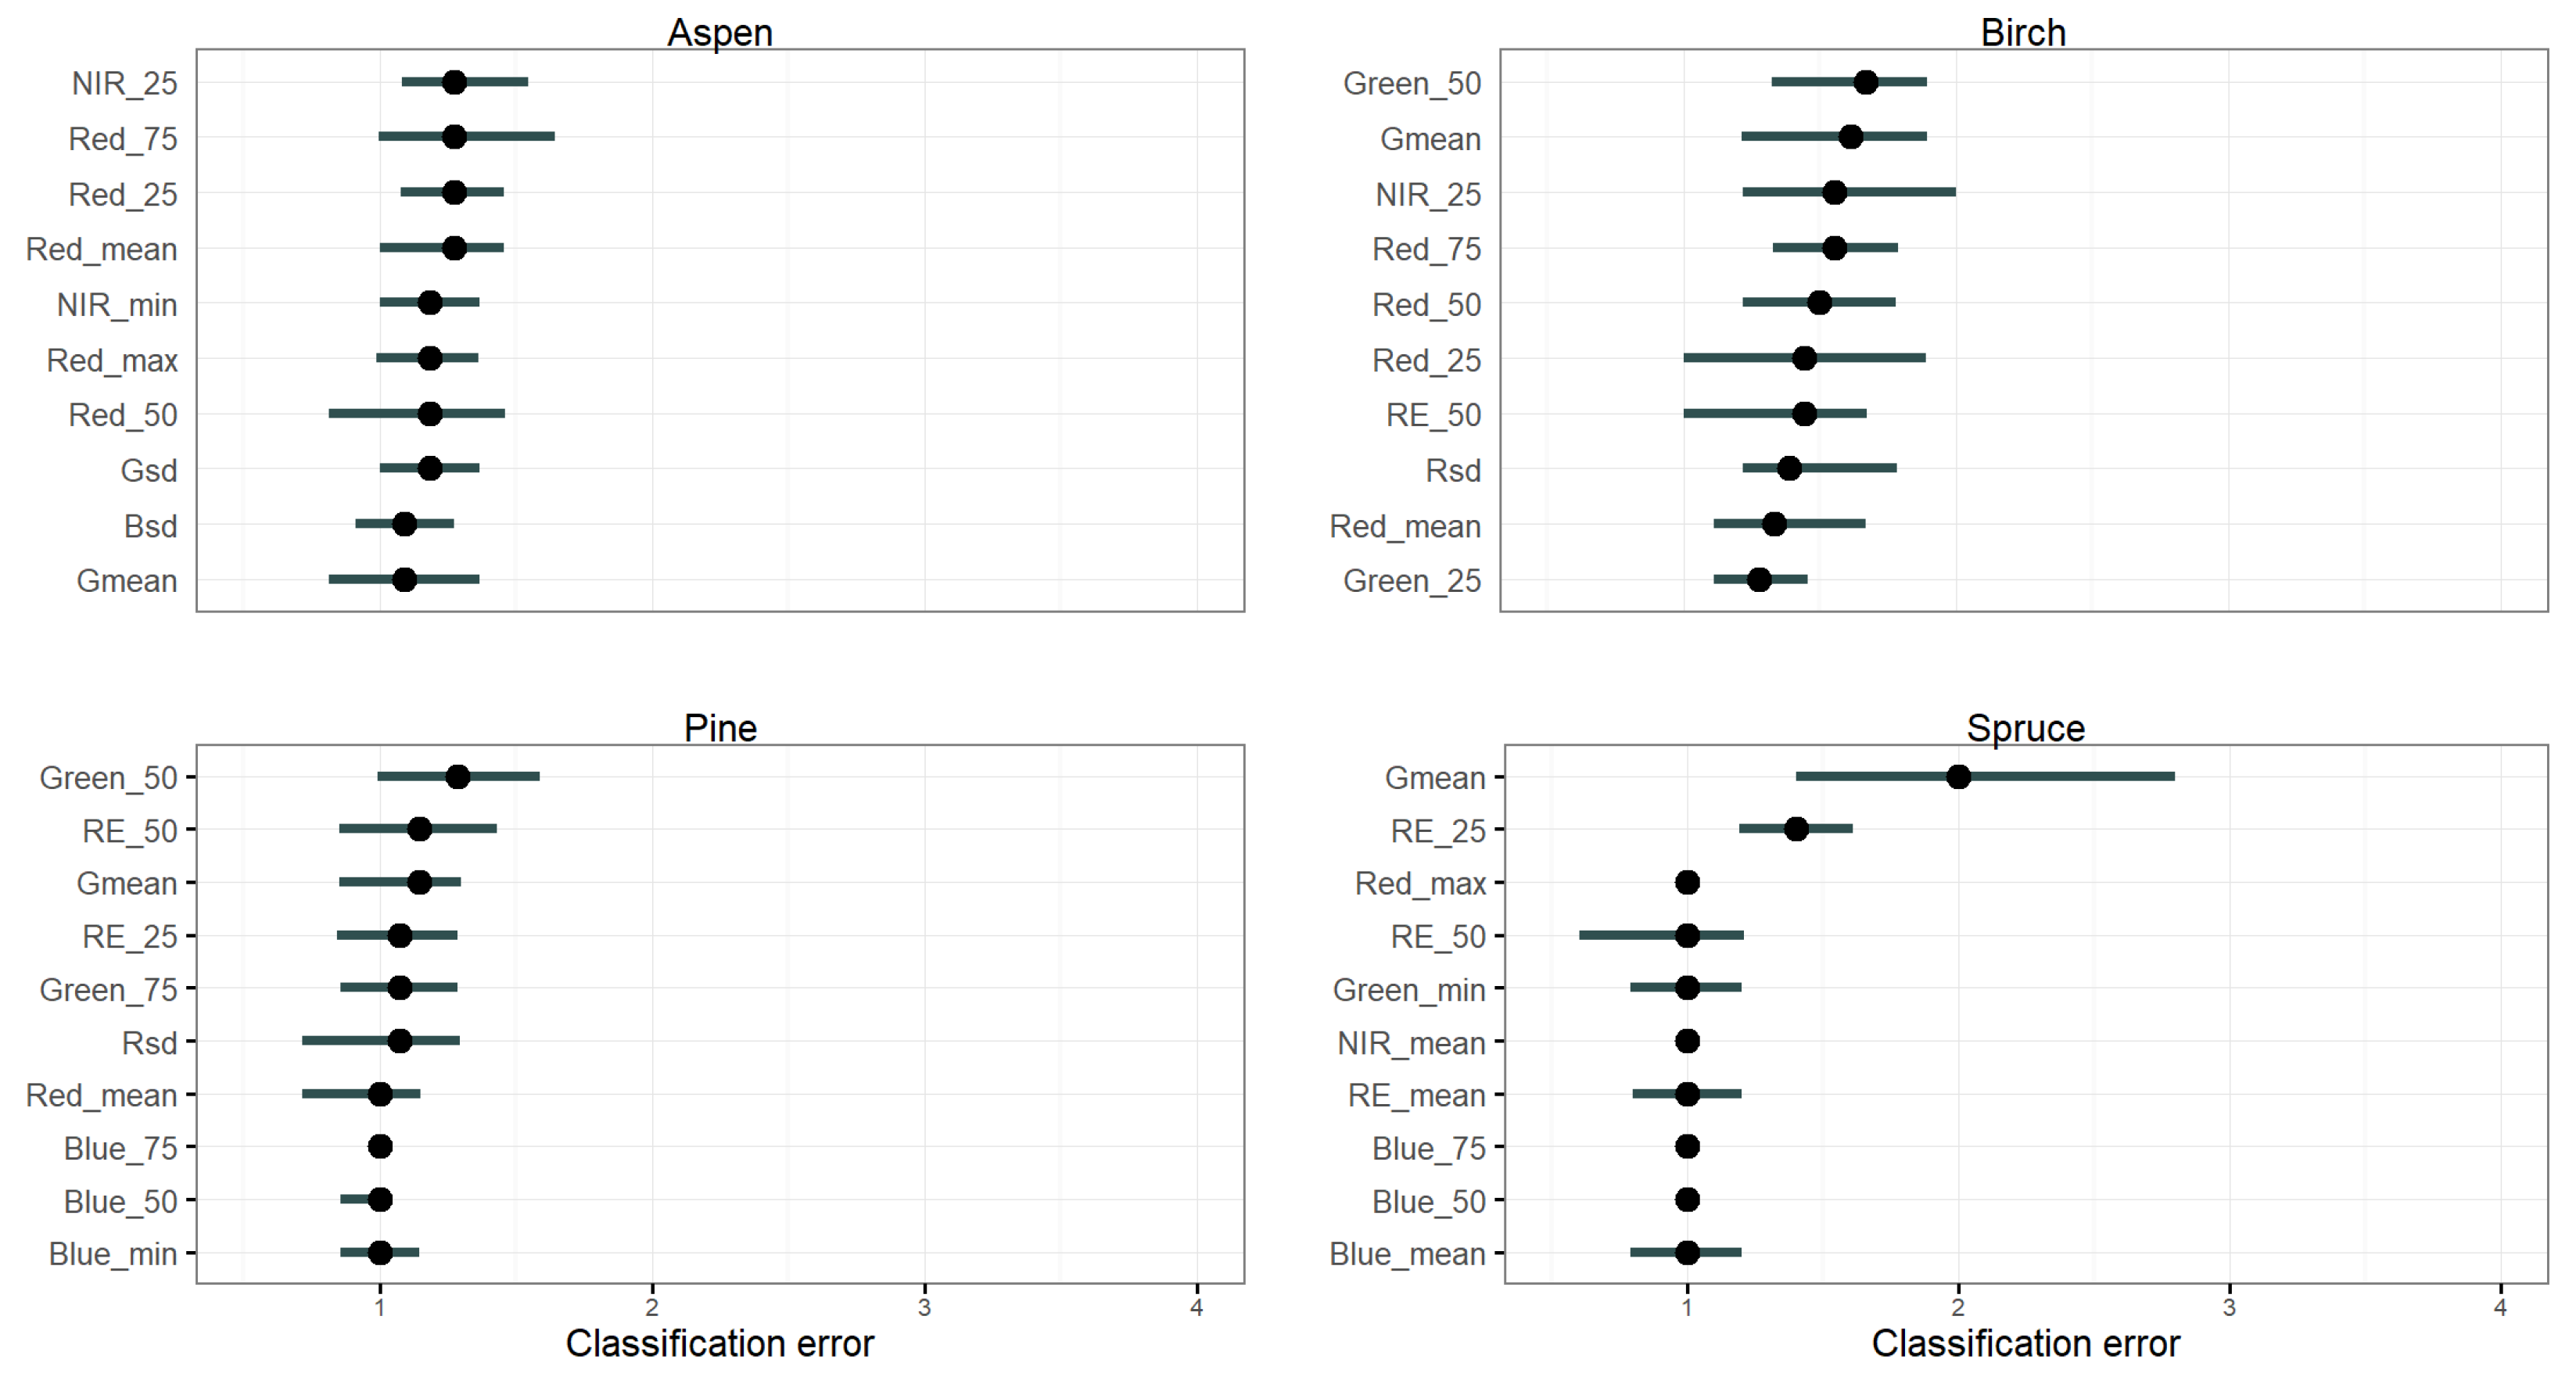
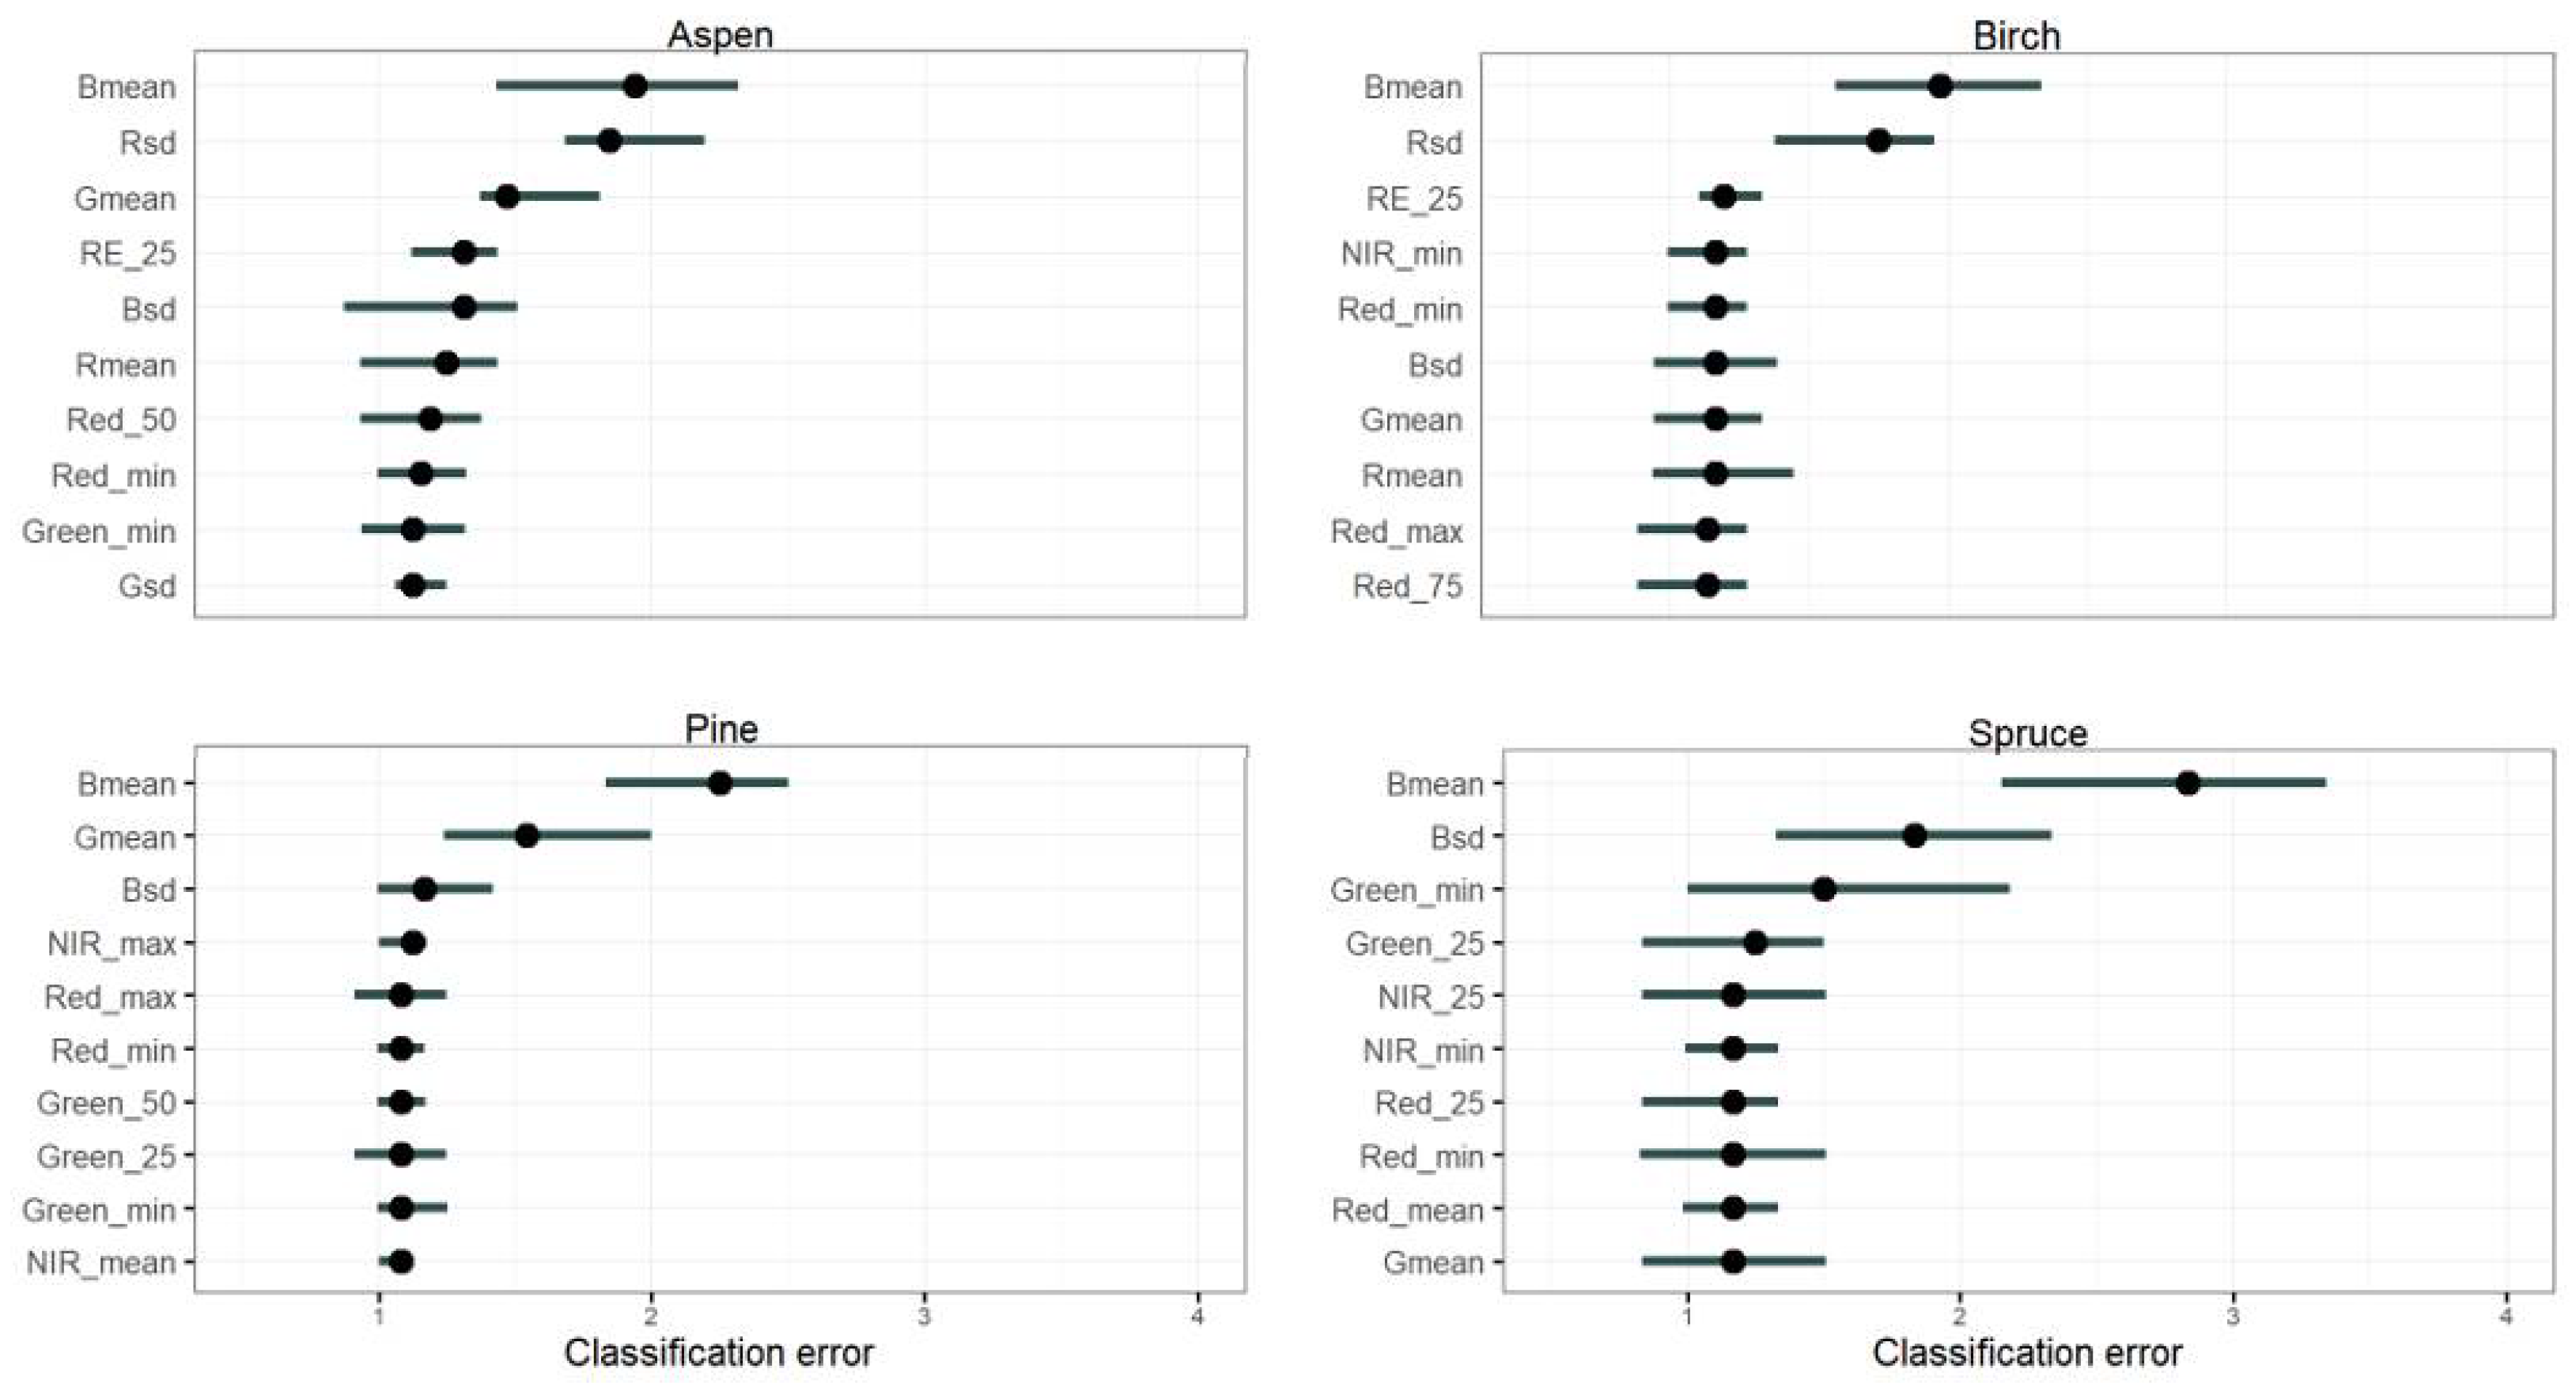
3.3. Spectral Feature Importance

The permutation feature importance plots with the 10 most important features in the SVM models for the MicaSense and Sequoia datasets are shown in Figure 4 and Figure 5. The importance is measured as the factor by which the model’s classification error increases compared to the unpermuted classifications when the feature is permuted. Each permutation was repeated 20 times. Here, the horizontal line denotes the 5% and 95% quantiles of importance values, and point denotes median importance. When median classification error is close to 2 the model relies heavily on the feature. Different multispectral features had major importance for most of the species in the 4-class classification models with the MicaSense dataset. We did not find notable differences in feature importance of aspen and pine with the MicaSense dataset: classification error scores of the top-10 features are close to 1, signifying rather low model reliance on these features. For spruce, Gmean (mean value of the green band from PPC) showed heavy model reliance with a classification error close to 2, while RE_25 (25% percentile of red-edge band) also stood out from the other features. Moreover, the Gmean was in top-3 among most important features for birch, pine, and spruce.
In contrast, the classification accuracy of the model trained with the Sequoia dataset relied much more on the spectral features extracted from PPC for all species, while the multispectral features played a less important role. The mean value of the blue band (Bmean) was the most important feature for all four species, with classification error close to or above 2 (Figure 5). We also found that NIR_25 (25% percentile of near infrared band) and Rsd (standard deviation of red band extracted from PPC) played an important role in discriminating deciduous trees (aspen, birch) from coniferous trees (pine, spruce) in the Micasense and Sequoia datasets, respectively.

4. Discussion

In this study we tested the performance of spectral features for discriminating European aspen from the three main tree species (Scots Pine, Norway spruce, and birch) in mature boreal forest. For this we used PPC and multispectral orthomosaics acquired from UAVs. We investigated if including only the spectral data features into the classification models is enough to accurately discriminate aspen from pine, spruce, and birch.
The results show that the 2-class and 4-class SVM models perform well in separating aspen from the main tree species for both UAV datasets utilized in the study. We observed that the highest classification accuracy of aspen was slightly improved in the 4-class model, trained with RGB and MSP features, compared to the 2-class model with only RGB features included (Aspen’s F1-score 86% vs. 84% for MicaSense and 80% vs. 79% for Sequoia datasets, respectively). Therefore, for the purpose of rapid and low-cost inventory of mature and old-growth aspen trees, a UAV platform equipped with only RGB sensor is sufficient. However, compared to lower-priced RGB sensors, MSP sensors are proven to be more stable over time and remain less affected by changes in environmental conditions (e.g., sunlight angle and cloud cover) due to their irradiance sensor [76,77,78]. Moreover, in the 4-class model, spruce is well-separated from pine, which makes the proposed method also suitable for applications in commercial forestry focusing on more valuable coniferous tree species.
We found that the most important spectral features in classifying aspen in the MicaSense dataset are different from those in the Sequoia dataset. In MicaSense, the best performing model relied more on the multispectral features compared to the best performing model built with Sequoia dataset, which relied more on the PPC features. Eight of the 10 most important features in MicaSense for aspen classification are multispectral (Figure 4). It is also worth mentioning that the classification did not rely on any particular feature and all the spectral features performed quite equally. In contrast to the MicaSense dataset, in the classification model of aspen based on the Sequoia dataset, the three most important features were from PPC (Figure 5), although different multispectral features had a positive impact on the model performance as well. The reason for that could be related to a difference in spatial resolution of the multispectral data. MicaSense data with the spatial resolution of 8.6–9.2 cm most likely was more sensitive to detect more detailed species-specific spectral information than Sequoia data with 13.5–14.5 cm.
It is challenging to compare the classification accuracy results with other studies due to, e.g., the different vegetation types, number of species, forest structure, and spatial distribution of the species. Compared to the recent European aspen review by Kivinen et al. [10], where aspen detection accuracy from various remote sensing methods ranged from 56% to 86% (user’s accuracy) and from 24% to 71% (producer’s accuracy), our results are promising. In our study we obtained the highest F1-score for Aspen = 86% and overall accuracy = 83.3%, which are close to accuracy results reported by Viinikka et al. [31] and Mäyrä et al. [37] utilizing the airborne hyperspectral and airborne laser scanning data in detecting European aspen in the same study area (F1-score for aspen 92%, overall accuracy = 84% and F1-score for aspen 91%, overall accuracy = 87%, respectively). Our study was done by including only the spectral data features into the classification model, and according to the previous studies, including height features from PPC, vegetation indices and texture features might improve the classification results [62,63].
There are several potential sources that bring uncertainty in our study. In general, the delineation accuracy of deciduous trees is a common problem in remote sensing [79,80]. Crowns of deciduous trees are often more complex than the crowns of conifers, which results in, e.g., multiple height peaks within single tree crowns [81,82]. In terms of data-related challenges, one of the key issues is combining datasets with different spatial resolution. Here, the high-resolution PPC was fused with the multispectral mosaics with coarser spatial resolution for extracting the spectral features. In data fusion, the difference in spatial resolution often leads to a mismatch between data sources. The GSD of the multispectral data was twice as big as that of the RGB data used for the ITD algorithm (8.6–14.5 and 3.9–4.9 cm, respectively). Even though the resulting tree-crown segments were well aligned with the field-measured trees (see Figure 3), there were still inclusions of the tree-crown background into segments that may affect the spectral signature of the whole segment. One possibility to avoid this is to replace the multispectral mosaic with a multispectral point cloud, produced from high-resolution multispectral images, and implement the individual tree detection algorithm based on it, then filter the points based on the specific height to select only the points belonging to the tree crown and exclude the surroundings of the tree crown. Enhancing spatial resolution of the multispectral data would allow more detailed investigation of species-specific spectral attributes.
Another way to improve the aspen detection accuracy and separation from birch species is to consider the seasonal phenology response of deciduous tree species to spectral composition during the UAV data acquisition [83,84] when, for example, birches have earlier leaf flush in spring than aspen trees in boreal forests [85]. It has been previously studied that inclusion of the near-infrared information remains more sensitive to leaf development than just RGB-based information [86,87].
Detection of the smaller trees under the dominant canopy layer is challenging from PPC because passive aerial images only capture the outer canopy envelope without penetrating it as LiDAR sensors do. In our study, we focused on the mature and old-growth aspens, which are easier to detect. Our approach suits well for detecting aspen-associated biodiversity values, as old large-diameter aspens are ecologically valuable [10,23].
Aspen tree occurrences derived from UAV imagery enable estimates of the ability of the forest area to support viable populations of aspen-associated species. Such information is crucial, because some species may persist in the small remaining patches of host trees for some time but ultimately become threatened as the number of aspen trees and their connectivity further decrease in the landscape [26,88,89]. Integration of various species data with information of the occurrence of individual aspen trees and their spatial patterns in the forest landscape could significantly increase our understanding of the landscape-level prerequisites for the occurrences of aspen-related species. Detecting aspen dynamics using multitemporal UAV imagery could also provide essential information for forest management and conservation purposes of future status of aspen-related species [10].
Our results highlight the potential of commonly used multispectral cameras to provide accurate information of boreal tree species at a local scale. Acquiring data over larger geographical regions with UAVs is often costly and time-consuming. Combined use of UAV data with other remote-sensing data with wider coverage but lower spatial resolution provides opportunities to significantly expand the extent of the mapped area. UAV-based orthoimages have been utilized as substitutes for labor-intensive traditional field surveys in estimating fractional coverage of target objects using optical satellite imagery [90,91,92]. Upscaling information of the aspen occurrence over wide geographical areas by using UAV-acquired imagery and high-resolution satellite imagery could provide a highly useful biodiversity indicator for assessing the state of biodiversity in boreal forests.

5. Conclusions

In this paper, we presented a workflow for a European aspen-recognition method based on individual tree detection approach using high-resolution photogrammetric point cloud and multispectral images, acquired from fixed-wing and multirotor UAVs. We compared the performance of a SVM classifier in combination with different spectral features derived from UAV data to discriminate aspen from birch, pine, and spruce species in boreal forests. The results of the study show that a combination of RGB and MSP features from PPC and multispectral orthomosaics provides the highest accuracy for aspen classification (F1-score = 86 %) from the dominant tree species in the study area (overall accuracy = 83.3 %). The proposed method can be used for rapid inventory of mature and old-growth aspen in desired areas for biodiversity assessment needs, but also for commercial forestry operations in boreal forests, where species-specific information is required, and provide valuable, precise, and low-cost information on demand compared to the traditional remote-sensing techniques.

Author Contributions

Conceptualization, A.K., T.K., P.V.; methodology, A.K., L.K., P.H.; software, A.K., P.K.; validation and formal analysis, A.K., P.H., L.K.; investigation, A.K., P.K., T.K., T.T., S.K., P.V.; writing—original draft preparation, A.K.; writing—review and editing, A.K., P.H., S.K., T.T., L.K., P.V., P.K., M.M., T.K.; visualization, A.K., P.H. All authors have read and agreed to the published version of the manuscript.

Funding

This research was funded by and supported by the project “Integrated Biodiversity Conservation and Carbon Sequestration in the Changing Environment” (IBC-Carbon) (project nr. 312559), the Strategic Research Council at the ACADEMY OF FINLAND and project “Open Geospatial Information Infrastructure for Research” (oGIIR) (project nr. 306539), funded by the ACADEMY OF FINLAND (2017–2019).

Institutional Review Board Statement

Not applicable.

Informed Consent Statement

Not applicable.

Data Availability Statement

Not applicable.

Acknowledgments

The authors wish to thank Aleksi Ritakallio and Max Stranden for assisting in field data collection. We also want to thank the Evo campus of the Häme University of Applied Science for providing accommodation and support during the fieldwork.

Conflicts of Interest

The authors declare no conflict of interest.

Appendix A

Table A1. Summary of flight characteristics for each research site.
Research SiteFlightDateUAV PlatformSensorNumber of ImagesOverlap, %GSD, cm
1110.7.18eBee plus RTKS.O.D.A34185/854.7
210.7.18eBee plus RTKS.O.D.A67085/854.7
310.7.18eBee plus RTKSequoia86480/8013.7
410.7.18eBee plus RTKSequoia93680/8013.7
2510.7.18eBee plus RTKS.O.D.A30385/854.9
610.7.18eBee plus RTKSequoia44880/8013.5
3710.7.18eBee plus RTKS.O.D.A54685/854.9
810.7.18eBee plus RTKSequoia83280/8014.5
4910.7.18eBee plus RTKS.O.D.A44485/854.9
1010.7.18eBee plus RTKSequoia77080/8014
51128.6.18eBee plus RTKS.O.D.A50085/854.9
1211.7.18eBee plus RTKS.O.D.A76585/854.9
1311.7.18eBee plus RTKS.O.D.A87585/854.9
1411.7.18eBee plus RTKS.O.D.A61185/854.9
1512.7.18eBee plus RTKS.O.D.A82985/854.9
1612.7.18eBee plus RTKS.O.D.A73585/854.9
1711.7.18eBee plus RTKSequoia106380/8013.7
1811.7.18eBee plus RTKSequoia19680/8013.7
1912.7.18eBee plus RTKSequoia106780/8013.7
2012.7.18eBee plus RTKSequoia85180/8013.7
62109.7.18Phantom 4 RTKPhantom19980/804.0
2210.7.18Matrice 210MicaSense 33888/759.2
72310.7.18Phantom 4 RTKPhantom51780/803.9
2410.7.18Matrice 210MicaSense35988/758.6
82510.7.18Phantom 4 RTKPhantom32280/804.2
2610.7.18Matrice 210MicaSense30988/758.8
92710.7.18Phantom 4 RTKPhantom32080/804.3
2810.7.18Matrice 210MicaSense18588/758.9
Table A2. Table of abbreviations of the spectral data features.
FeatureSourceDescription
RmeanRGB point cloudMean value of the red band
GmeanRGB point cloudMean value of the green band
BmeanRGB point cloudMean value of the blue band
RsdRGB point cloudStandard deviation of the red band
GsdRGB point cloudStandard deviation of the green band
BsdRGB point cloudStandard deviation of the blue band
Red_minMSP orthomosaicMinimum value of the red band
Red_maxMSP orthomosaicMaximum value of the red band
Red_meanMSP orthomosaicMean value of the red band
Red_25MSP orthomosaic25% percentile of the red band
Red_50MSP orthomosaic50% percentile of the red band
Red_75MSP orthomosaic75% percentile of the red band
Green_minMSP orthomosaicMinimum value of the green band
Green_maxMSP orthomosaicMaximum value of the green band
Green_meanMSP orthomosaicMean value of the green band
Green_25MSP orthomosaic25% percentile of the green band
Green_50MSP orthomosaic50% percentile of the green band
Green_75MSP orthomosaic75% percentile of the green band
NIR_minMSP orthomosaicMinimum value of the near infrared band
NIR_maxMSP orthomosaicMaximum value of the near infrared band
NIR_meanMSP orthomosaicMean value of the near infrared band
NIR_25MSP orthomosaic25% percentile of the near infrared band
NIR_50MSP orthomosaic50% percentile of the near infrared band
NIR_75MSP orthomosaic75% percentile of the near infrared band
RE_minMSP orthomosaicMinimum value of the red edge band
RE_maxMSP orthomosaicMaximum value of the red edge band
RE_meanMSP orthomosaicMean value of the red edge band
RE_25MSP orthomosaic25% percentile of the red edge band
RE_50MSP orthomosaic50% percentile of the red edge band
RE_75MSP orthomosaic75% percentile of the red edge band
Blue_min *MSP orthomosaicMinimum value of the blue band
Blue_max *MSP orthomosaicMaximum value of the blue band
Blue_mean *MSP orthomosaicMean value of the blue band
Blue_25 *MSP orthomosaic25% percentile of the blue band
Blue_50 *MSP orthomosaic50% percentile of the blue band
Blue_75 *MSP orthomosaic75% percentile of the blue band
*—applied only for MicaSense dataset.

References

  1. Tikkanen, O.P.; Martikainen, P.; Hyvärinen, E.; Junninen, K.; Kouki, J. Red-listed boreal forest species of Finland: Associations with forest structure, tree species, and decaying wood. Ann. Zool. Fenn. 2006, 43, 373–383. Available online: https://0-www-jstor-org.brum.beds.ac.uk/stable/23736858 (accessed on 20 March 2021).
  2. Felton, A.; Lindbladh, M.; Brunet, J.; Fritz, Ö. Replacing coniferous monocultures with mixed-species production stands: An assessment of the potential benefits for forest biodiversity in northern Europe. For. Ecol. Manag. 2010, 260, 939–947. [Google Scholar] [CrossRef]
  3. Gamfeldt, L.; Snall, T.; Bagchi, R.; Jonsson, M.; Gustafsson, L.; Kjellander, P.; Ruiz-Jaen, M.C.; Fröberg, M.; Stendahl, J.; Philipson, C.D.; et al. Higher levels of multiple ecosystem services are found in forests with more tree species. Nat. Commun. 2013, 4, 1340. [Google Scholar] [CrossRef] [PubMed]
  4. Brockerhoff, E.G.; Barbaro, L.; Castagneyrol, B.; Forrester, D.I.; Gardiner, B.; González-Olabarria, J.R.; Lyver, P.O.; Meurisse, N.; Oxbrough, A.; Taki, H.; et al. Forest biodiversity, ecosystem functioning and the provision of ecosystem services. Biodiv. Conserv. 2017, 26, 3005–3035. [Google Scholar] [CrossRef] [Green Version]
  5. Esseen, P.A.; Ehnström, B.; Ericson, L.; Sjöberg, K. Boreal forests. Ecol. Bull. 1997, 46, 16–47. Available online: https://0-www-jstor-org.brum.beds.ac.uk/stable/20113207 (accessed on 21 March 2021).
  6. Nilsson, S.G.; Hedin, J.; Niklasson, M. Biodiversity and its assessment in boreal and nemoral forests. Scand. J. For. Res. 2001, 16, 10–26. [Google Scholar] [CrossRef] [Green Version]
  7. Fassnacht, F.E.; Latifi, H.; Stereńczak, K.; Modzelewska, A.; Lefsky, M.; Waser, L.T.; Straub, C.; Ghosh, A. Review of studies on tree species classification from remotely sensed data. Remote Sens. Environ. 2016, 186, 64–87. [Google Scholar] [CrossRef]
  8. Pettorelli, N.; Wegmann, M.; Skidmore, A.; Mücher, S.; Dawson, T.P.; Fernandez, M.; Lucas, R.; Schaepman, M.E.; Wang, T.; O’Connor, B.; et al. Framing the concept of satellite remote sensing essential biodiversity variables: Challenges and future directions. Remote Sens. Ecol. Conserv. 2016, 2, 122–131. [Google Scholar] [CrossRef]
  9. Rogers, P.C.; Pinno, B.D.; Šebesta, J.; Albrectsen, B.R.; Li, G.; Ivanova, N.; Kusbach, A.; Kuuluvainen, T.; Landhäusser, S.M.; Liu, H.; et al. A global view of aspen: Conservation science for widespread keystone systems. Glob. Ecol. Conserv. 2020, 21, e00828. [Google Scholar] [CrossRef]
  10. Kivinen, S.; Koivisto, E.; Keski-Saari, S.; Poikolainen, L.; Tanhuanpää, T.; Kuzmin, A.; Viinikka, A.; Heikkinen, R.K.; Pykälä, J.; Virkkala, R.; et al. A keystone species, European aspen (Populus tremula L.), in boreal forests: Ecological role, knowledge needs and mapping using remote sensing. For. Ecol. Manag. 2020, 462, 118008. [Google Scholar] [CrossRef]
  11. Martikainen, P. Conservation of threatened saproxylic beetles: Significance of retained aspen Populus tremula on clearcut areas. Ecol. Bull. 2001, 49, 205–218. Available online: http://0-www-jstor-org.brum.beds.ac.uk/stable/20113277 (accessed on 20 March 2021).
  12. Ranius, T.; Martikainen, P.; Kouki, J. Colonisation of ephemeral forest habitats by specialised species: Beetles and bugs associated with recently dead aspen wood. Biodiv. Conserv. 2011, 20, 2903–2915. [Google Scholar] [CrossRef] [Green Version]
  13. Kuusinen, M. Epiphytic lichen flora and diversity on Populus tremula in old-growth and managed forests of southern and middle boreal Finland. Annal. Bot. Fenn. 1994, 31, 245–260. Available online: https://0-www-jstor-org.brum.beds.ac.uk/stable/43922219 (accessed on 20 March 2021).
  14. Hedenås, H.; Hedström, P. Conservation of epiphytic lichens: Significance of remnant aspen (Populus tremula) trees in clear-cuts. Biol. Conserv. 2007, 135, 388–395. [Google Scholar] [CrossRef]
  15. Junninen, K.; Penttilä, R.; Martikainen, P. Fallen retention aspen trees on clear-cuts can be important habitats for red-listed polypores: A case study in Finland. Biodiv. Conserv. 2007, 16, 475–490. [Google Scholar] [CrossRef]
  16. Hanski, I.K. Home ranges and habitat use in the declining flying squirrel Pteromys volans in managed forests. Wildl. Biol. 1998, 4, 33–46. [Google Scholar] [CrossRef]
  17. Angelstam, P.; Mikusiński, G. Woodpecker assemblages in natural and managed boreal and hemiboreal forest—A review. Annal. Zool. Fenn. 1994, 31, 157–172. Available online: https://0-www-jstor-org.brum.beds.ac.uk/stable/23735508 (accessed on 20 March 2021).
  18. Baroni, D.; Korpimäki, E.; Selonen, V.; Laaksonen, T. Tree cavity abundance and beyond: Nesting and food storing sites of the pygmy owl in managed boreal forests. For. Ecol. Manag. 2020, 460, 117818. [Google Scholar] [CrossRef]
  19. Jonsell, M.; Weslien, J.; Ehnström, B. Substrate requirements of red-listed saproxylic invertebrates in Sweden. Biodivers. Conserv. 1998, 7, 749–764. [Google Scholar] [CrossRef]
  20. Hyvärinen, E.; Juslén, A.; Kemppainen, E.; Uddström, A.; Liukko, U.-M. Suomen Lajien Uhanalaisuus Punainen Kirja 2019 (The 2019 Red List of Finnish Species); Ympäristöministeriö (Ministry of the Environment) & Suomen Ympäristökeskus (Finnish Environment Institute): Helsinki, Finland, 2019.
  21. ArtDatabanken. Rodlistade Arter i Sverige 2015 (The 2015 Red List of Swedish Species); ArtDatabanken SLU (Swedish Species Information Centre): Uppsala, Sweden, 2015. [Google Scholar]
  22. Henriksen, S.; Hilmo, O. Norsk Rødliste for Arter 2015 (The 2015 Norwegian Red List for Species); Artsdatabanken (Norwegian Biodiversity Information Centre): Trondheim, Norway, 2015. [Google Scholar]
  23. Kouki, J.; Arnold, K.; Martikainen, P. Long-term persistence of aspen—A key host for many threatened species—is endangered in old-growth conservation areas in Finland. J. Nat. Cons. 2004, 12, 41–52. [Google Scholar] [CrossRef]
  24. Latva-Karjanmaa, T.; Penttilä, R.; Siitonen, J. The demographic structure of European aspen (Populus tremula) populations in managed and old-growth boreal forests in eastern Finland. Can. J. For. Res. 2007, 37, 1070–1081. [Google Scholar] [CrossRef]
  25. Maltamo, M.; Pesonen, A.; Korhonen, L.; Kouki, J.; Vehmas, M.; Eerikäinen, K. Inventory of aspen trees in spruce dominated stands in conservation area. For. Ecos. 2015, 2, 12. [Google Scholar] [CrossRef] [Green Version]
  26. Hardenbol, A.; Junninen, K.; Kouki, J. A key tree species for forest biodiversity, European aspen (Populus tremula), is rapidly declining in boreal old-growth forest reserves. For. Ecol. Manag. 2020, 462, 118009. [Google Scholar] [CrossRef]
  27. Packalén, P.; Temesgen, H.; Maltamo, M. Variable selection strategies for nearest neighbor imputation methods used in remote sensing based forest inventory. Can. J. Rem. Sens. 2007, 38, 557–569. [Google Scholar] [CrossRef]
  28. Holmgren, J.; Persson, Å.; Söderman, U. Species identification of individual trees by combining high resolution LiDAR data with multi-spectral images. Int. J. Rem. Sens. 2008, 29, 1537–1552. [Google Scholar] [CrossRef]
  29. Ørka, H.O.; Næsset, E.; Bollandsås, O.M. Effects of different sensors and leaf-on and leaf-off canopy conditions on echo distributions and individual tree properties derived from airborne laser scanning. Remote Sens. Environ. 2010, 114, 1445–1461. [Google Scholar] [CrossRef]
  30. Trier, Ø.D.; Salberg, A.B.; Kermit, M.; Rudjord, Ø.; Gobakken, T.; Næsset, E.; Aarsten, D. Tree species classification in Norway from airborne hyperspectral and airborne laser scanning data. Eur. J. Remote Sens. 2018, 51, 336–351. [Google Scholar] [CrossRef]
  31. Viinikka, A.; Hurskainen, P.; Keski-Saari, S.; Kivinen, S.; Tanhuanpää, T.; Mäyrä, J.; Poikolainen, L.; Vihervaara, P.; Kumpula, T. Detecting European aspen (Populus tremula L.) in boreal forests using airborne hyperspectral and airborne laser scanning data. Remote Sens. 2020, 2, 2610. [Google Scholar] [CrossRef]
  32. Korpela, I.; Ørka, H.O.; Maltamo, M.; Tokola, T.; Hyyppä, J. Tree species classification using airborne LiDAR—effects of stand and tree parameters, downsizing of training set, intensity normalization, and sensor type. Silva Fenn. 2010, 44, 319–339. [Google Scholar] [CrossRef] [Green Version]
  33. Ghosh, A.; Fassnacht, F.E.; Joshi, P.K.; Koch, B. A framework for mapping tree species combining hyperspectral and LiDAR data: Role of selected classifiers and sensor across three spatial scales. Int. J. Appl. Earth Obs. Geoinf. 2014, 26, 49–63. [Google Scholar] [CrossRef]
  34. Fricker, G.A.; Ventura, J.D.; Wolf, J.A.; North, M.P.; Davis, F.W.; Franklin, J. A convolutional neural network classifier identifies tree species in mixed-conifer forest from hyperspectral imagery. Remote Sens. 2019, 11, 2326. [Google Scholar] [CrossRef] [Green Version]
  35. Grabska, E.; Hostert, P.; Pflugmacher, D.; Ostapowicz, K. Forest stand species mapping using the Sentinel-2 time series. Remote Sens. 2019, 11, 1197. [Google Scholar] [CrossRef] [Green Version]
  36. Hościło, A.; Lewandowska, A. Mapping forest type and tree species on a regional scale using multi-temporal Sentinel-2 data. Remote Sens. 2019, 11, 929. [Google Scholar] [CrossRef] [Green Version]
  37. Mäyrä, J.; Keski-Saari, S.; Kivinen, S.; Tanhuanpää, T.; Hurskainen, P.; Kullberg, P.; Poikolainen, L.; Viinikka, A.; Tuominen, S.; Kumpula, T.; et al. Tree species classification from airborne hyperspectral and LiDAR data using 3D convolutional neural networks. Remote Sens. Environ. 2021, 256, 112322. [Google Scholar] [CrossRef]
  38. Colomina, I.; Molina, P. Unmanned aerial systems for photogrammetry and remote sensing: A review. ISPRS J. Photogr. Remote Sens. 2014, 92, 79–97. [Google Scholar] [CrossRef] [Green Version]
  39. Tang, L.; Shao, G. Drone remote sensing for forestry research and practices. J. For. Res. 2015, 26, 791–797. [Google Scholar] [CrossRef]
  40. Torresan, C.; Berton, A.; Carotenuto, F.; Di Gennaro, S.F.; Gioli, B.; Matese, A.; Miglietta, F.; Vagnoli, C.; Zaldei, A.; Wallace, L. Forestry applications of UAVs in Europe: A review. Int. J. Remote Sens. 2017, 38, 2427–2447. [Google Scholar] [CrossRef]
  41. Sankey, T.; Donager, J.; McVay, J.; Sankey, J.B. UAV lidar and hyperspectral fusion for forest monitoring in the southwestern USA. Remote Sens. Environ. 2017, 195, 30–43. [Google Scholar] [CrossRef]
  42. Guimarães, N.; Pádua, L.; Marques, P.; Silva, N.; Peres, E.; Sousa, J.J. Forestry remote sensing from Unmanned Aerial Vehicles: A review focusing on the data, processing and potentialities. Remote Sens. 2020, 12, 1046. [Google Scholar] [CrossRef] [Green Version]
  43. Zarco-Tejada, P.J.; Diaz-Varela, R.; Angileri, V.; Loudjani, P. Tree height quantification using very high resolution imagery acquired from an unmanned aerial vehicle (UAV) and automatic 3D photo-reconstruction methods. Eur. J. Agron. 2014, 55, 89–99. [Google Scholar] [CrossRef]
  44. Puliti, S.; Ørka, H.O.; Gobakken, T.; Næsset, E. Inventory of small forest areas using Unmanned Aerial System. Remote Sens. 2015, 7, 9632–9654. [Google Scholar] [CrossRef] [Green Version]
  45. Wallace, L.; Lucieer, A.; Malenovský, Z.; Turner, D.; Vopěnka, P. Assessment of forest structure using two UAV techniques: A comparison of airborne laser scanning and structure from motion (SfM) point clouds. Forests 2016, 7, 62. [Google Scholar] [CrossRef] [Green Version]
  46. Goodbody, T.R.H.; Coops, N.C.; Marshall, P.L.; Tompalski, P.; Crawford, P. Unmanned aerial systems for precision forest inventory purposes: A review and case study. For. Chron. 2017, 93, 71–81. [Google Scholar] [CrossRef] [Green Version]
  47. Jayathunga, S.; Owari, T.; Tsuyuki, S.; Hirata, Y. Potential of UAV photogrammetry for characterization of forest canopy structure in uneven-aged mixed conifer—Broadleaf forests. Int. J. Remote Sens. 2020, 41, 53–73. [Google Scholar] [CrossRef]
  48. Miyoshi, G.T.; Arruda, M.d.S.; Osco, L.P.; Junior, J.M.; Gonçalves, D.N.; Imai, N.N.; Tommaselli, A.M.G.; Honkavaara, E.; Gonçalves, W.N. A Novel Deep Learning Method to Identify Single Tree Species in UAV-Based Hyperspectral Images. Remote Sens. 2020, 12, 1294. [Google Scholar] [CrossRef] [Green Version]
  49. Getzin, S.; Wiegand, K.; Schöning, I. Assessing biodiversity in forests using very high-resolution images and unmanned aerial vehicles. Meth. Ecol. Evol. 2012, 3, 397–404. [Google Scholar] [CrossRef]
  50. Anderson, K.; Gaston, K.J. Lightweight unmanned aerial vehicles will revolutionize spatial ecology. Front. Ecol. Environ. 2013, 11, 138–146. [Google Scholar] [CrossRef] [Green Version]
  51. López, J.J.; Mulero-Pázmány, M. Drones for conservation in protected areas: Present and future. Drones 2019, 3, 10. [Google Scholar] [CrossRef] [Green Version]
  52. Baena, S.; Moat, J.; Whaley, O.; Boyd, D.S. Identifying species from the air: UAVs and the very high resolution challenge for plant conservation. PLoS ONE 2017, 12, e0188714. [Google Scholar] [CrossRef] [Green Version]
  53. Michez, A.; Piégay, H.; Lisein, J.; Claessens, H.; Lejeune, P. Classification of riparian forest species and health condition using multi-temporal and hyperspatial imagery from unmanned aerial system. Environ. Mon. Assess. 2016, 188, 146. [Google Scholar] [CrossRef] [PubMed] [Green Version]
  54. Gini, R.; Passoni, D.; Pinto, L.; Sona, G. Use of unmanned aerial systems for multispectral survey and tree classification: A test in a park area of northern Italy. Eur. J. Remote Sens. 2014, 47, 251–269. [Google Scholar] [CrossRef]
  55. Bagaram, M.B.; Giuliarelli, D.; Chirici, G.; Giannetti, F.; Barbati, A. UAV Remote Sensing for Biodiversity Monitoring: Are Forest Canopy Gaps Good Covariates? Remote Sens. 2018, 10, 9139. [Google Scholar] [CrossRef]
  56. Briechle, S.; Krzystek, P.; Vosselman, G. Classification of tree species and standing dead trees by fusing UAV-based lidar data and multispectral imagery in the 3D deep neural network PointNet++. ISPRS Ann. Photogramm. Remote Sens. Spat. Inf. Sci. 2020, 5, 203–210. [Google Scholar] [CrossRef]
  57. Thiel, C.; Mueller, M.M.; Epple, L.; Thau, C.; Hese, S.; Voltersen, M.; Henkel, A. UAS Imagery-Based Mapping of Coarse Wood Debris in a Natural Deciduous Forest in Central Germany (Hainich National Park). Remote Sens. 2020, 12, 3293. [Google Scholar] [CrossRef]
  58. Nevalainen, O.; Honkavaara, E.; Tuominen, S.; Viljanen, N.; Hakala, T.; Yu, X.; Hyyppä, J.; Saari, H.; Pölönen, I.; Imai, N.N.; et al. Individual Tree Detection and Classification with UAV-Based Photogrammetric Point Clouds and Hyperspectral Imaging. Remote Sens. 2017, 9, 185. [Google Scholar] [CrossRef] [Green Version]
  59. Nezami, S.; Khoramshahi, E.; Nevalainen, O.; Pölönen, I.; Honkavaara, E. Tree Species Classification of Drone Hyperspectral and RGB Imagery with Deep Learning Convolutional Neural Networks. Remote. Sens. 2020, 12, 1070. [Google Scholar] [CrossRef] [Green Version]
  60. Tuominen, S.; Näsi, R.; Honkavaara, E.; Balazs, A.; Hakala, T.; Viljanen, N.; Pölönen, I.; Saari, H.; Ojanen, H. Assessment of Classifiers and Remote Sensing Features of Hyperspectral Imagery and Stereo-Photogrammetric Point Clouds for Recognition of Tree Species in a Forest Area of High Species Diversity. Remote Sens. 2018, 10, 714. [Google Scholar] [CrossRef] [Green Version]
  61. Saarinen, N.; Vastaranta, M.; Näsi, R.; Rosnell, T.; Hakala, T.; Honkavaara, E.; Wulder, M.A.; Luoma, V.; Tommaselli, A.M.G.; Imai, N.N.; et al. Assessing Biodiversity in Boreal Forests with UAV-Based Photogrammetric Point Clouds and Hyperspectral Imaging. Remote Sens. 2018, 10, 338. [Google Scholar] [CrossRef] [Green Version]
  62. Gini, R.; Sona, G.; Ronchetti, G.; Passoni, D.; Pinto, L. Improving tree species classification using UAS multispectral images and texture measures. ISPRS Int. J. Geo-Inf. 2018, 7, 315. [Google Scholar] [CrossRef] [Green Version]
  63. Xu, Z.; Shen, X.; Cao, L.; Coops, N.C.; Goodbody, T.R.H.; Zhong, T.; Zhao, W.; Sun, Q.; Ba, S.; Zhang, Z.; et al. Tree species classification using UAS-based digital aerial photogrammetry point clouds and multispectral imageries in subtropical natural forests. Int. J. Appl. Earth Obs. Geoinf. 2020, 92, 102173. [Google Scholar] [CrossRef]
  64. Franklin, S.E.; Ahmed, O.S. Deciduous tree species classification using object-based analysis and machine learning with unmanned aerial vehicle multispectral data. Int. J. Remote Sens. 2018, 39, 5236–5245. [Google Scholar] [CrossRef]
  65. Brown, D.C. Close-range camera calibration. Photogramm. Eng. 1971, 37, 855–866. [Google Scholar]
  66. Puliti, S.; Gobakken, T.; Ørka, H.O.; Næsset, E. Assessing 3D point clouds from aerial photographs for species-specific forest inventories. Scand. J. For. Res. 2017, 32, 68–79. [Google Scholar] [CrossRef]
  67. Isenburg, M. “LAStools-Efficient LiDAR Processing Software” (Version 200509, Academic License). 2021. Available online: https://rapidlasso.com/LAStools (accessed on 20 March 2021).
  68. R Core Team. R: A Language and Environment for Statistical Computing; R Foundation for Statistical Computing: Vienna, Austria, 2021. [Google Scholar]
  69. Silva, C.A.; Crookston, N.L.; Hudak, A.T.; Vierling, L.A.; Klauberg, C.; Cardil, A. rLiDAR: LiDAR Data Processing and Visualization. Available online: https://cran.r-project.org/package=rLiDAR (accessed on 20 March 2021).
  70. Yu, B.; Ostland, M.; Gong, P.; Pu, R. Penalized discriminant analysis of in situ hyperspectral data for conifer species recognition. IEEE Transact. Geosci. Remote Sens. 1999, 37, 2569–2577. [Google Scholar] [CrossRef] [Green Version]
  71. Kuhn, M. Caret: Classification and Regression Training. Misc Functions for Training and Plotting Classification and Regression Models. Available online: http://CRAN.R-project.org/package=caret (accessed on 20 March 2021).
  72. Mountrakis, G.; Im, J.; Ogole, C. Support vector machines in remote sensing: A review. ISPRS J. Photogramm. Remote Sens. 2011, 66, 247–259. [Google Scholar] [CrossRef]
  73. Kuhn, M. The Caret Package Documentation, 2019-03-27. Available online: http://topepo.github.io/caret/index.html (accessed on 4 March 2021).
  74. Molnar, C. Interpretable Machine Learning. A Guide for Making Black Box Models Explainable 2019. Available online: https://christophm.github.io/interpretable-ml-book/ (accessed on 29 January 2021).
  75. Fisher, A.; Rudin, C.; Dominici, F. All models are wrong, but many are useful: Learning a variable’s importance by studying an entire class of prediction models simultaneously. J. Mach. Learn. Res. 2019, 20, 1–81. Available online: http://www.jmlr.org/papers/v20/18-760.html (accessed on 21 March 2021).
  76. Xu, R.; Li, C.; Paterson, A.H. Multispectral imaging and unmanned aerial systems for cotton plant phenotyping. PLoS ONE 2019, 14, e0205083. [Google Scholar] [CrossRef] [Green Version]
  77. Roth, L.; Streit, B. Predicting cover crop biomass by lightweight uas-based rgb and nir photography: An applied photogrammetric approach. Precis. Agric. 2018, 19, 93–114. [Google Scholar] [CrossRef] [Green Version]
  78. Ashapure, A.; Jung, J.; Chang, A.; Oh, S.; Maeda, M.; Landivar, J. A Comparative Study of RGB and Multispectral Sensor-Based Cotton Canopy Cover Modelling Using Multi-Temporal UAS Data. Remote Sens. 2019, 11, 2757. [Google Scholar] [CrossRef] [Green Version]
  79. Zhen, Z.; Quackenbush, L.J.; Zhang, L. Trends in automatic individual tree crown detection and delineation-evolution of LiDAR data. Remote Sens. 2016, 8, 333. [Google Scholar] [CrossRef] [Green Version]
  80. Dalponte, M.; Ørka, H.O.; Ene, L.T.; Gobakken, T.; Næsset, E. Tree Crown Delineation and Tree Species Classification in Boreal Forests Using Hyperspectral and ALS Data. Remote Sens. Environ. 2014, 140, 306–317. [Google Scholar] [CrossRef]
  81. Kwak, D.A.; Lee, W.K.; Lee, J.H.; Biging, G.S.; Gong, P. Detection of individual trees and estimation of tree height using LiDAR data. J. Forest Res. 2007, 12, 425–434. [Google Scholar] [CrossRef]
  82. Tanhuanpää, T.; Yu, X.; Luoma, V.; Saarinen, N.; Raisio, J.; Hyyppä, J.; Kumpula, T.; Holopainen, M. Effect of canopy structure on the performance of tree mapping methods in urban parks. Urban For. Urban Green. 2019, 44, 126441. [Google Scholar] [CrossRef]
  83. Lisein, J.; Michez, A.; Claessens, H.; Lejeune, P. Discrimination of deciduous tree species from time series of unmanned aerial system imagery. PLoS ONE 2015, 10, e0141006. [Google Scholar] [CrossRef] [PubMed]
  84. Weil, G.; Lensky, I.; Resheff, Y.; Levin, N. Optimizing the Timing of Unmanned Aerial Vehicle Image Acquisition for Applied Mapping of Woody Vegetation Species Using Feature Selection. Remote Sens. 2017, 9, 1130. [Google Scholar] [CrossRef] [Green Version]
  85. Heide, O.M. Daylength and thermal time responses of budburst during dormancy release in some northern deciduous trees. Physiol. Plant. 1993, 88, 531–540. [Google Scholar] [CrossRef]
  86. Brown, L.A.; Dash, J.; Ogutu, B.O.; Richardson, A.D. On the relationship between continuous measures of canopy greenness derived using near-surface remote sensing and satellite-derived vegetation products. Agric. For. Meteorol. 2017, 247, 280–292. [Google Scholar] [CrossRef] [Green Version]
  87. Fawcett, D.; Bennie, J.; Anderson, K. Monitoring spring phenology of individual tree crowns using drone—Acquired NDVI data. Remote Sens. Ecol. Conserv. 2020. [Google Scholar] [CrossRef]
  88. Gu, W.D.; Kuusinen, M.; Konttinen, T.; Hanski, I. Spatial pattern in the occurrence of the lichen Lobaria pulmonaria in managed and virgin boreal forests. Ecography 2001, 24, 139–150. [Google Scholar] [CrossRef]
  89. Suominen, O.; Edenius, L.; Ericsson, G.; de Dios, V.R. Gastropod diversity in aspen stands in coastal northern Sweden. For. Ecol. Manag. 2003, 175, 403–412. [Google Scholar] [CrossRef]
  90. Kattenborn, T.; Lopatin, J.; Förster, M.; Braun, A.C.; Fassnacht, F.E. UAV data as alternative to field sampling to map woody invasive species based on combined Sentinel-1 and Sentinel-2 data. Remote Sens. Environ. 2019, 227, 61–73. [Google Scholar] [CrossRef]
  91. Riihimäki, H.; Luoto, M.; Heiskanen, J. Estimating Fractional Cover of Tundra Vegetation at Multiple Scales Using Unmanned Aerial Systems and Optical Satellite Data. Remote Sens. Environ. 2019, 224, 119–132. [Google Scholar] [CrossRef]
  92. Gränzig, T.; Fassnacht, F.E.; Kleinschmit, B.; Förster, M. Mapping the fractional coverage of the invasive shrub Ulex europaeus with multi-temporal Sentinel-2 imagery utilizing UAV orthoimages and a new spatial optimization approach. Int. J. Appl. Earth Obs. Geoinf. 2021, 96, 102281. [Google Scholar] [CrossRef]
Figure 1. The analysis workflow of the study.
Remotesensing 13 01723 g001
Figure 2. Location of the study area, UAV data and field data.
Remotesensing 13 01723 g002
Figure 3. An example of the identified tree-crown segments with the field-measured trees (green star cross) on RGB (left) and multispectral (right) orthomosaics.
Remotesensing 13 01723 g003
Figure 4. Permutation feature importance for classification of the 4 tree species applying the SVM model for the MicaSense dataset (10 most important features).
Remotesensing 13 01723 g004
Figure 5. Permutation feature importance for classification of the 4 tree species applying the SVM model for the Sequoia dataset (10 most important features).
Remotesensing 13 01723 g005
Table 1. Abundance of tree species in field data.
SpeciesMicaSense DatasetSequoia Dataset
Scots pine (Pinus sylvestris L.)75120
Norway spruce (Picea abies L.)66120
Downy birch (Betula pubescens L.) and Silver birch (Betula pendula)75107
Aspen (Populus tremula L.)90118
Total:306465
Table 2. Accuracy assessment of the 2-class classification model. MSP = spectral features extracted from multispectral mosaics, RGB = spectral features extracted from PPC.
Camera (Feature Set)Number of FeaturesF1-Score (%)Overall Accuracy (%)Kappa
AspenOther
MicaSense (RGB)6849390.10.77
MicaSense (MSP)30819187.90.72
MicaSense (RGB+MSP)32829390.10.76
Sequoia (RGB)6799389.90.73
Sequoia (MSP)21689084.20.57
Sequoia (RGB+MSP)29779389.20.70
Table 3. Confusion matrix for the best SVM model for a) for the MicaSense dataset (RGB features) and b) the Sequoia dataset (RGB features). UA = user’s accuracy, PA = producer’s accuracy, OA = overall accuracy.
(a)
MicaSense (RGB) Predicted
AspenOtherTotalUA (%)
ObservedAspen2352882.1
Other4596393.7
Total276491
PA (%)85.292.2
OA (%) 90.1
(b)
Sequoia (RGB) Predicted
AspenOtherTotalUA (%)
ObservedAspen2763381.8
Other89810692.5
Total35104139
PA (%)77.194.2
OA (%) 88.9
Table 4. Accuracy assessment of the 4-class classification model. MSP = spectral features extracted from multispectral mosaics, RGB = spectral features extracted from PPC, OA = overall accuracy.
Camera (Feature Set)Number of FeaturesF1-Score (%)OA (%)Kappa
AspenBirchPineSpruce
MicaSense (RGB)68278797678.90.72
MicaSense (MSP)248476719181.10.75
MicaSense (RGB+MSP)288678808883.30.78
Sequoia (RGB)67864899381.30.75
Sequoia (MSP)176357727968.30.58
Sequoia (RGB+MSP)268069819481.30.75
Table 5. Confusion matrix for the best SVM model for a) the MicaSense dataset (MSP and RGB features) and b) the Sequoia dataset (MSP and RGB features). UA = user’s accuracy, PA = producer’s accuracy, OA = overall accuracy.
(a)
MicaSense (RGB+MSP) PredictedUA (%)
AspenBirchPineSpruceTotal
ObservedAspen243112982.8
Birch116112384.2
Pine131611676.2
Spruce101192290.5
Total2722192290
PA (%)88.972.784.286.4
OA (%) 83.3
(b)
Sequoia (RGB+MSP) PredictedUA (%)
AspenBirchPineSpruceTotal
ObservedAspen286103580.0
Birch422513268.8
Pine333023878.9
Spruce010333497.1
Total35323636139
PA (%)80.068.883.391.7
OA (%) 81.3
Publisher’s Note: MDPI stays neutral with regard to jurisdictional claims in published maps and institutional affiliations.

