Article

Quantify the Contribution of Dust and Anthropogenic Sources to Aerosols in North China by Lidar and Validated with CALIPSO

1
Key Lab of Environmental Optics & Technology, Anhui Institute of Optics and Fine Mechanics, Chinese Academy of Sciences, Hefei 230031, China
2
Department of Precision Machinery and Precision Instrumentation, University of Science and Technology of China, Hefei 230026, China
3
Center for Excellence in Regional Atmospheric Environment, Institute of Urban Environment, Chinese Academy of Sciences, Xiamen 361021, China
4
Key Laboratory of Precision Scientific Instrumentation of Anhui Higher Education Institutes, University of Science and Technology of China, Hefei 230026, China
5
Anhui Province Key Laboratory of Polar Environment and Global Change, University of Science and Technology of China, Hefei 230026, China
6
Institute of Physical Science and Information Technology, Anhui University, Hefei 230601, China
*
Author to whom correspondence should be addressed.
Submission received: 13 April 2021 / Revised: 29 April 2021 / Accepted: 5 May 2021 / Published: 6 May 2021
(This article belongs to the Special Issue Remote Sensing of Aerosols and Gases in Cities)

Abstract

:
Persistent heavy haze episodes have repeatedly shrouded North China in recent years. Besides anthropogenic emissions, natural dust also contributes to the aerosols in this region. Through continuous observation by a dual-wavelength Raman lidar, the primary aerosol types and their contributions to air pollution in North China were determined. The following three aerosol types can be classified: natural dust, anthropogenic aerosols, and the mixture of anthropogenic aerosols and dust (polluted dust). The classification results are basically consistent with the classification results from the cloud–aerosol lidar and infrared pathfinder satellite observations (CALIPSO) satellite measurements. The relative bias of the lidar ratio between the Raman lidar and CALIPSO is less than 25% over 90% of the cases, indicating that the CALIPSO lidar ratio selection algorithm is reasonable. The classification results show that approximately 45% of aerosols below 1.8 km are contributed by polluted dust during our one year observations. The contribution of dust increased with height, from 6% at 500 m to 28% at 1,800 m, while the contribution of anthropogenic aerosols decreased from 49% to 25%. In addition, polluted dust is the major aerosol subtype below 1.0 km in spring (over 60%) and autumn (over 70%). Anthropogenic aerosols contribute more than 75% of air pollution in summer. In winter, anthropogenic aerosols prevailed (over 80%) in the lower layer, while polluted dust (around 60%) dominated the upper layer. Our results identified the primarily aerosol types to assess the contributions of anthropogenic and natural sources to air pollution in North China, and highlight that natural dust plays a crucial role in lower-layer air pollution in spring and autumn, while controlling anthropogenic aerosols will significantly improve air quality in winter.

Graphical Abstract

1. Introduction

The microphysical and chemical properties, as well as the vertical distribution of aerosols have a strong influence on radiation effects and climate change, and the effects vary significantly for different aerosol types [1]. The aerosol types can be roughly divided into anthropogenic (urban/industrial pollution and biomass burning) and natural (dust, sea salt, volcano, etc.) aerosols. The types of aerosols are primarily determined by geographical and climatic characteristics and the source of observation stations. The aerosol layers observed in the Beijing–Tianjin–Hebei (BTH) region are often a mixture of various types (natural and anthropogenic). BTH is one of the regions with the most serious air pollution in China [2,3,4]. Its northern and western sides are surrounded by the Yanshan and Taihang Mountains, respectively, and the capacity of atmospheric diffusion is extremely poor. Previous studies have reported that there are three main transport paths affecting the air quality of the BTH region, they are as follows: the northwest, the southwest, and the southeast [5,6,7]. The occurrence of the extremely heavy haze event in the BTH region is closely related to the transport of anthropogenic aerosols in the southern region, while the high-speed northwest air mass is conducive to the removal of air pollutants [8,9]. In addition, dust aerosols also frequently contribute to air pollution in the BTH regions, especially in spring [10], which is mainly affected by the northwest transport. Thus, air pollution in the BTH region includes both natural and anthropogenic sources. The accurate identification of the aerosol types will help us better understand the sources of aerosols and determine the contribution of natural and anthropogenic sources to air pollution in the BTH region.
Polarization-sensitive Raman lidar systems [11] or high-spectral resolution lidar (HSRL) systems [12,13] can independently estimate the vertical distribution of aerosols, and accurately distinguish between natural and anthropogenic aerosol types [14,15,16,17,18,19,20,21]. Although we have a clear understanding of the frequent outbreaks of persistent heavy haze events in the BTH region in recent years [22], there are few studies on aerosol classification and the vertical distribution of different aerosol types based on Raman lidar in the BTH region. An 11 day field campaign in January of 2005 by Tesche et al. [23], in which they only analyzed a case with a possible influence of Asian dust, reported the lidar ratio at 532 nm (LR532, also called extinction-to-backscatter ratio) and the particle linear depolarization ratio at 532 nm (PDR532) are 40 ± 5 sr and 0.20–0.25, respectively. Xie et al. [24] reported the LR532 and volume linear depolarization ratio at 532 nm (VDR532) of typical Asian dust and anthropogenic aerosols in Beijing in 2008. The LR532 of Asian dust is 36.2 ± 4.7 sr, and the VDR532 is 0.20 ± 0.05. The LR532 and VDR532 of anthropogenic aerosols are 38.5 ± 5 sr and 0.07 ± 0.01 for heavy pollution, and 73.9 ± 6 sr and 0.06 ± 0.05 for light pollution. Hänel et al. [25] performed Raman lidar observations in Beijing from April 2009 to March 2010 and found that the LR532 of anthropogenic fine-mode aerosols showed a narrow distribution of 60 sr, while the LR532 of a complex mixture of natural dust, burning biomass smoke and urban/industrial pollution showed a wide distribution of 40 to 90 sr. Previous studies presented typical nighttime aerosol characteristics in the BTH areas, but did not show daytime aerosol characteristics and detailed classification results.
To classify the aerosol types and identify the contribution of different aerosol types to air pollution in the BTH region, dual-wavelength Mie–Raman lidar (MRL) was deployed at the Central Weather Bureau Farm (CWBF) from January 2018 to January 2019. The CWBF (39.15°N, 115.73°E) is located approximately 120 km southwest of Beijing, and is a flat rural environment of North China (Figure 1). We analyzed in detail the MRL observation data of 2147 h of a year, and the data coverage during the whole observation period is shown in Figure 2. The monthly observation data in Figure 2 excludes the data of rain, snow, cloudy, and clean periods. For the convenience of the subsequent discussion, we divide the observed data of a year into four seasons, spring (March, April, and May), summer (June, July, and August), autumn (September, October, and November), and winter (December, January, and February). In June 2018, the observation was stopped due to instrument failure. Therefore, the seasonal average profile of summer in Section 3.5 only represents July and August, and not for the entire summer.
Based on these observations, we analyze the key property of typical aerosol types in Section 3.1, and classify the anthropogenic and natural aerosols in the BTH region in Section 3.2. The comparison of the classification results with the cloud–aerosol lidar and infrared pathfinder satellite observations (CALIPSO) satellite level 2 products [26,27] is presented in Section 3.3. After that, the mean profiles of different aerosol type optical parameters in the BTH region are discussed in Section 3.4. Finally, we present the contribution of different aerosol types to air pollution in different seasons in Section 3.5.

2. Methods

2.1. Ground-Based Mie–Raman Lidar

Ground-based MRL was carried out in the CWBF to observe the air pollution from 26 January 2018 to 16 January 2019. The MRL system receives a 532 nm perpendicular polarization channel, 532 nm parallel polarization channel, 355 nm Mie scattering channel, 387 nm nitrogen Raman scattering channel, and 408 nm water vapor Raman scattering channel. Signals can be detected with a spatial resolution of 7.5 m in analog and photon counting modes. Each sampled signal profile collection time is about 7 min, and data is collected every 15 min. More detailed information on the MRL system can be found in our previous studies [29,30].
MRL can independently determine the extinction and backscattering coefficients [11,31,32] by measuring the elastic backscattering signal at 355 nm and the nitrogen inelastic backscattering signal at 387 nm to determine the lidar ratio at 355 nm (LR355). Since the signal-to-noise ratio of the Raman channel is quite low, the signal must be averaged over a period of time. Here, we used the three-hour average MRL signal profile to calculate the LR355 at night (18:00–06:00 local time), and the twelve-hour average MRL signal profile to calculate the daytime LR355. In addition, a four-point spatial accumulation and then a ten-point spatial smoothing was used on the average MRL signal profile. The spatial resolution of the average MRL signal profile is reduced from 7.5 m to 30 m. Also, the overlap function [33] was used to determine the LR355 in the lower lidar layer (0.5–0.8 km).
The elastic backscatter signal was also used to retrieve the aerosol extinction coefficient at 355 nm (EXT355) and the aerosol extinction coefficient at 532 nm (EXT532) [34,35]. Fernald method requires a crucial assumption, the range-dependent LR. Here, the LR355 was set equal to the LR532 [36] to retrieve the EXT532. The closest observed LR355 was used to constrain the retrieved EXT532 and EXT355. VDR532 is retrieved from the ratio of the calibrated perpendicular polarized backscatter signal to the parallel polarized backscatter signal [37,38], and then PDR532 is derived from VDR532 and backscatter coefficient according to Freudenthaler et al. [37]. Also, a four-point spatial accumulation and then a ten-point spatial smoothing was used on the sampled signal profile to reduce the relative error in computing the EXT355, EXT532, and PDR532. More details of data retrieval and data validation can be found in our previous studies [30]. In addition, we only used the signal of the analog channel to retrieve the aerosol optical parameters of the lower atmosphere, including EXT355, EXT532, PDR532, and LR355. The relative errors of the retrieved aerosol optical parameters were calculated according to the law of error propagation, and mainly depends on the signal-to-noise (SNR) ratio [39] of the average MRL signal profile. Data whose SNR of the input MRL signal is lower than 1 will be discarded.
Overall, MRL can provide five aerosol optical parameters, including the EXT355, EXT532, PDR532, LR355, and extinction color ratio (ECR355/532) to distinguish anthropogenic and natural aerosols. The EXT355 and EXT532 indicate the aerosol concentrations. The LR355 depends on the aerosol types and is mainly related to absorption (>70 sr) and scattering (<40 sr) of particles [40]. The PDR532 is a key parameter indicating the aerosol types, which helps to distinguish spherical and non-spherical particles [37,38]. The ECR355/532 is defined as the ratio of the EXT355 and EXT532, it is inversely related to aerosol size, and identifies the fine-mode aerosols associated with biomass burning smoke and urban/industrial pollution [18].

2.2. CALIPSO Level 2 Aerosol Products

CALIPSO was launched on 28 April 2006, and it is the first active remote sensing satellite to observe clouds and aerosols. It carries a dual-wavelength polarized lidar system [41], which can provide measurements of backscattered signals at two wavelengths (1064 nm and 532 nm) and PDR532. Combined with altitude, location, and surface type, CALIPSO can retrieve the vertical distribution of global aerosols and identify aerosol types. Liu et al. [42], Omar et al. [27] and Young and Vaughan [43] describe in detail the CALIPSO aerosol cloud recognition and aerosol classification algorithm. CALIPSO does not calculate the aerosol LR by independently retrieving the aerosol extinction and backscatter coefficient as the Raman lidar and HSRL technology do. The calculation of the aerosol extinction and backscattering coefficient profiles of CALIPSO requires the assumption of a reasonable LR. The CALIPSO version 4.20 (V4) level 2 aerosol data products [26] divide the aerosol layer into seven aerosol types (clean marine, dust, polluted dust, clean continental, polluted continental/smoke, elevated smoke, and dusty marine), each of which assumes an LR with a value between 20 sr and 70 sr. The LR of the seven aerosol types were derived through field measurements and aerosol robotic network inversion [44].
The CALIPSO V4 level 2 aerosol profile products (“CAL_LID_L2_05kmAPro–Standard–V4–20.”) and aerosol classification results (“CAL_LID_L2_VFM–Standard–V4–20.”) from January 2018 to January 2019 were used in this study. Each parameter used includes uncertainty estimates and some data quality indicators, such as cloud aerosol discrimination score (CAD_Score) and extinction quality control flag (Ext_QC). We used data quality control procedures similar to Winker et al. [45] to filter the profiles of EXT532 and PDR532, as follows: (1) CAD_Score is between −100 and −20; (2) the aerosol layers with Ext_QC equal 0 or 1; (3) samples with an extinction uncertainty of 99.9 km−1 are discarded; (4) fill values of an extinction coefficient assigned to 0.0 km−1 are rejected; and (5) samples below 0.45 km are ignored. In addition, we only accept the aerosol classification results with a feature classification flag of 1.

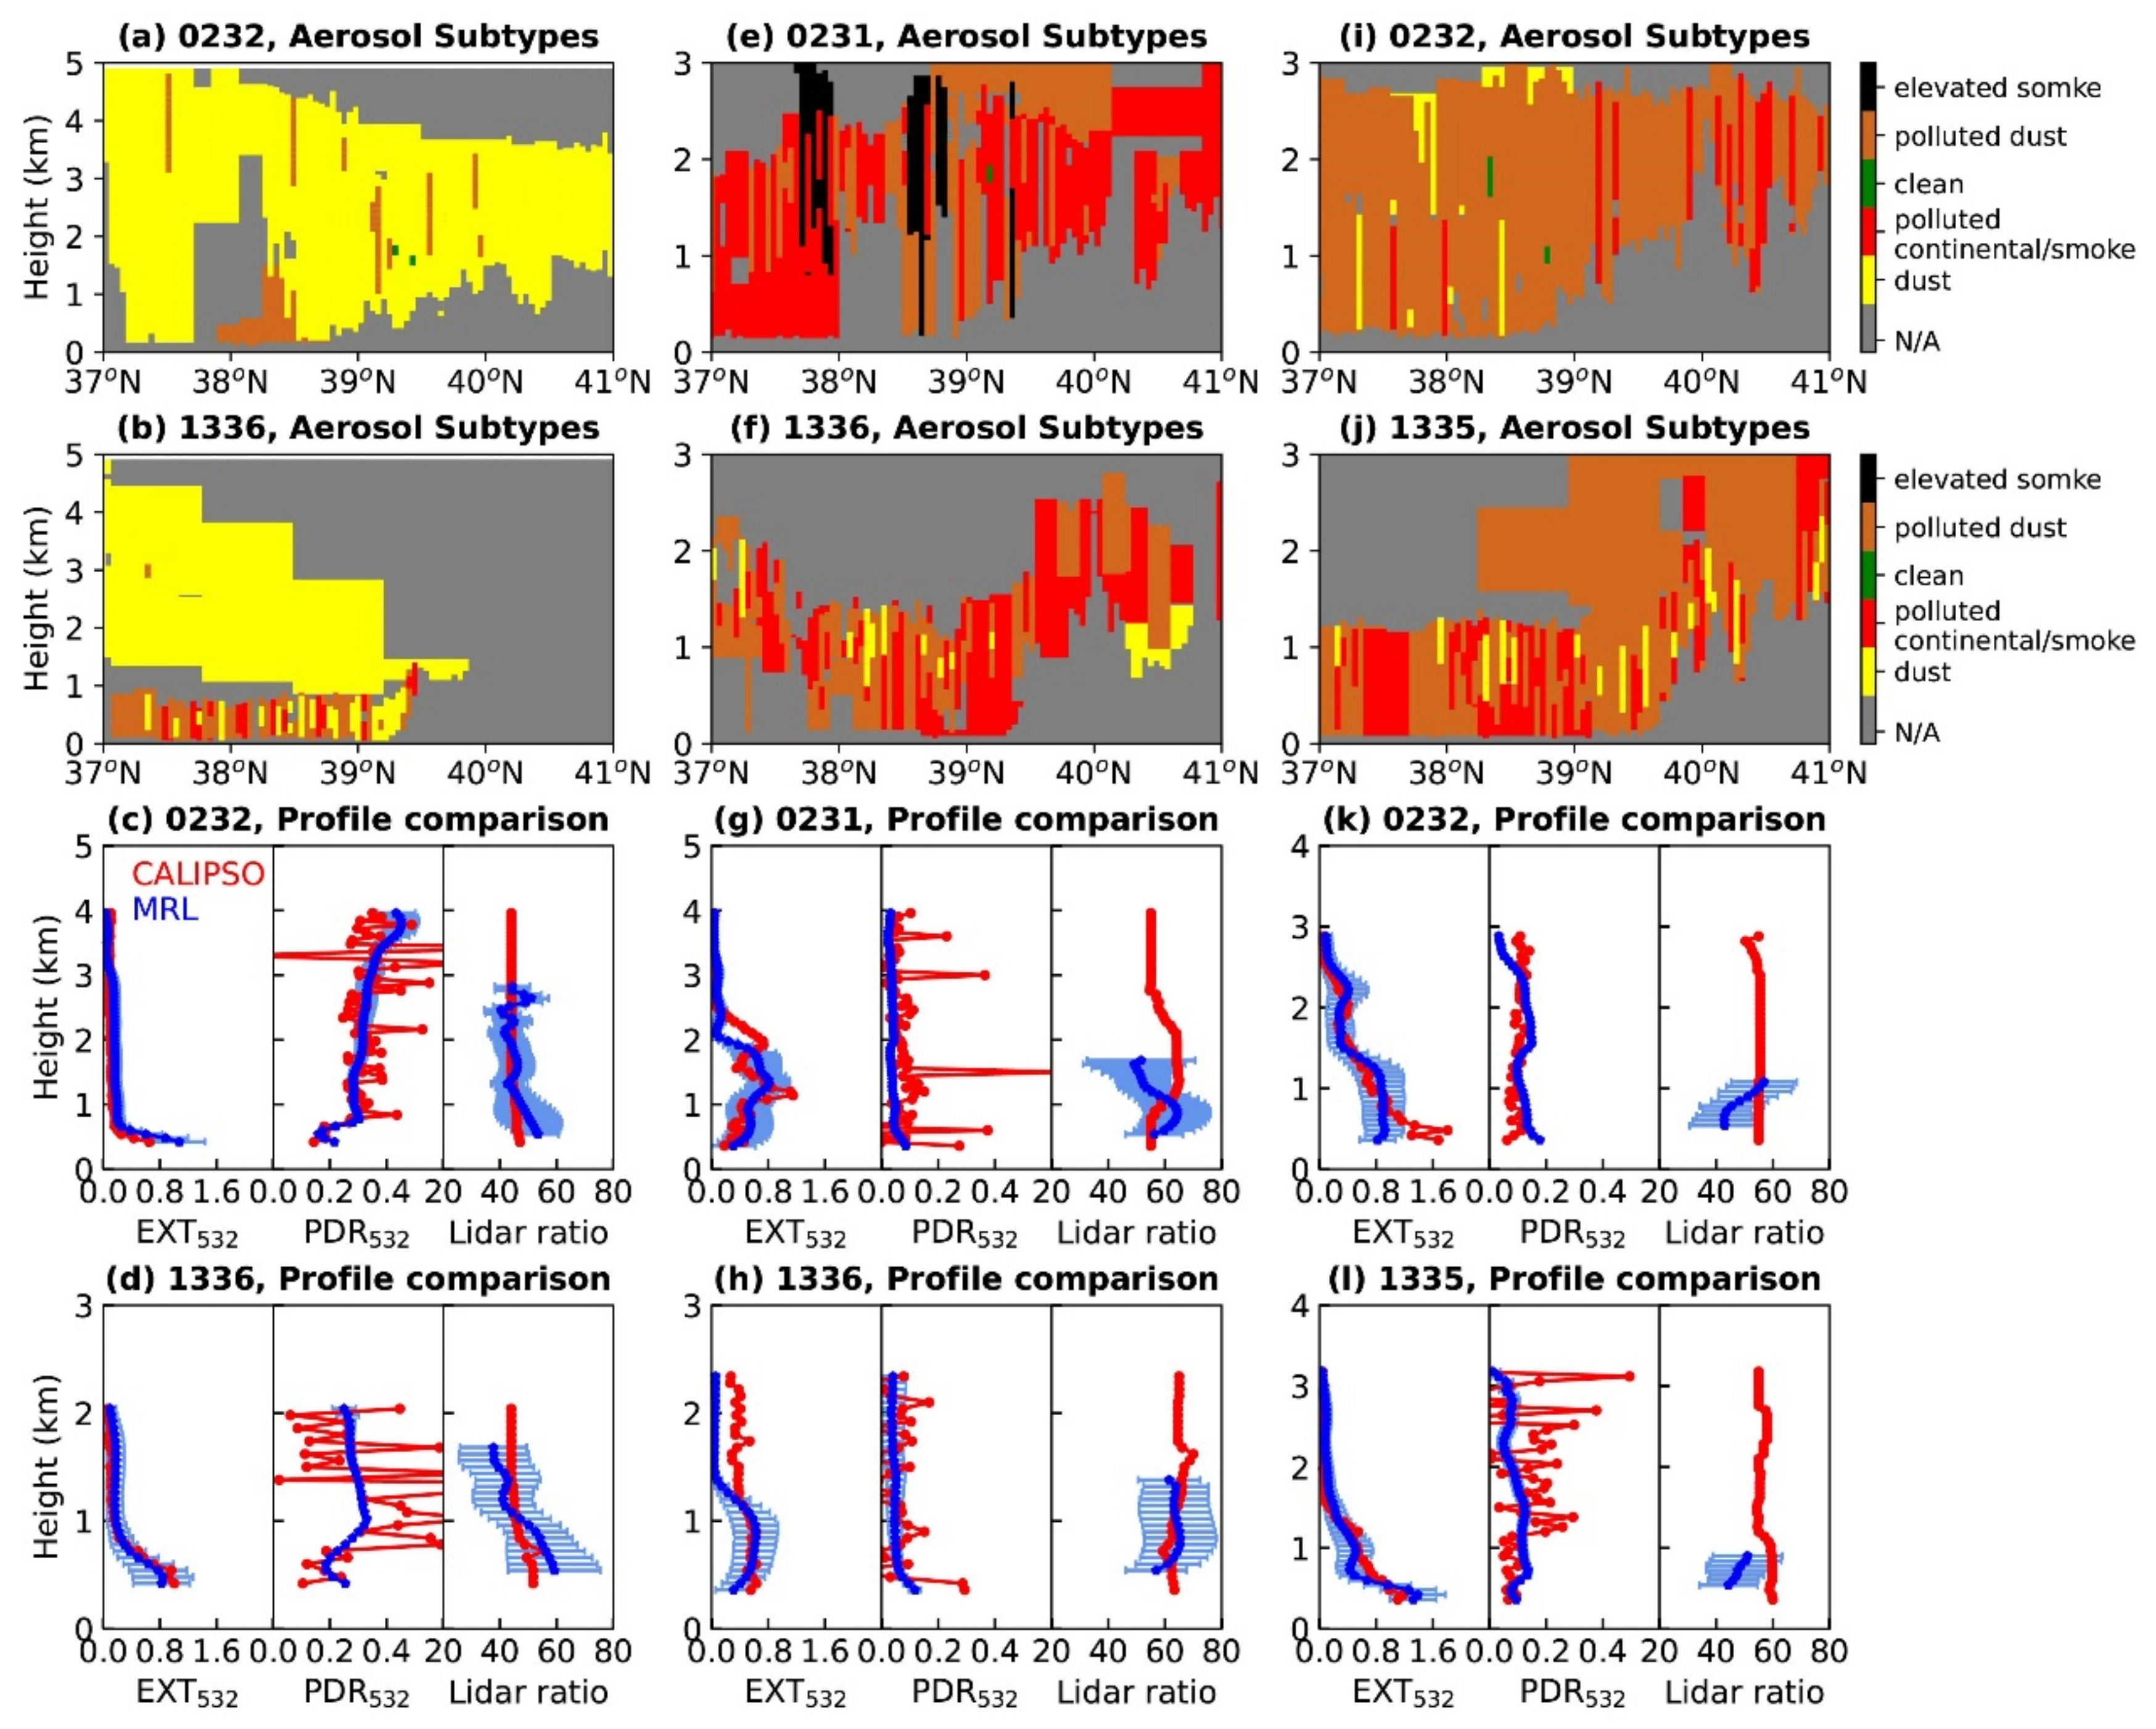
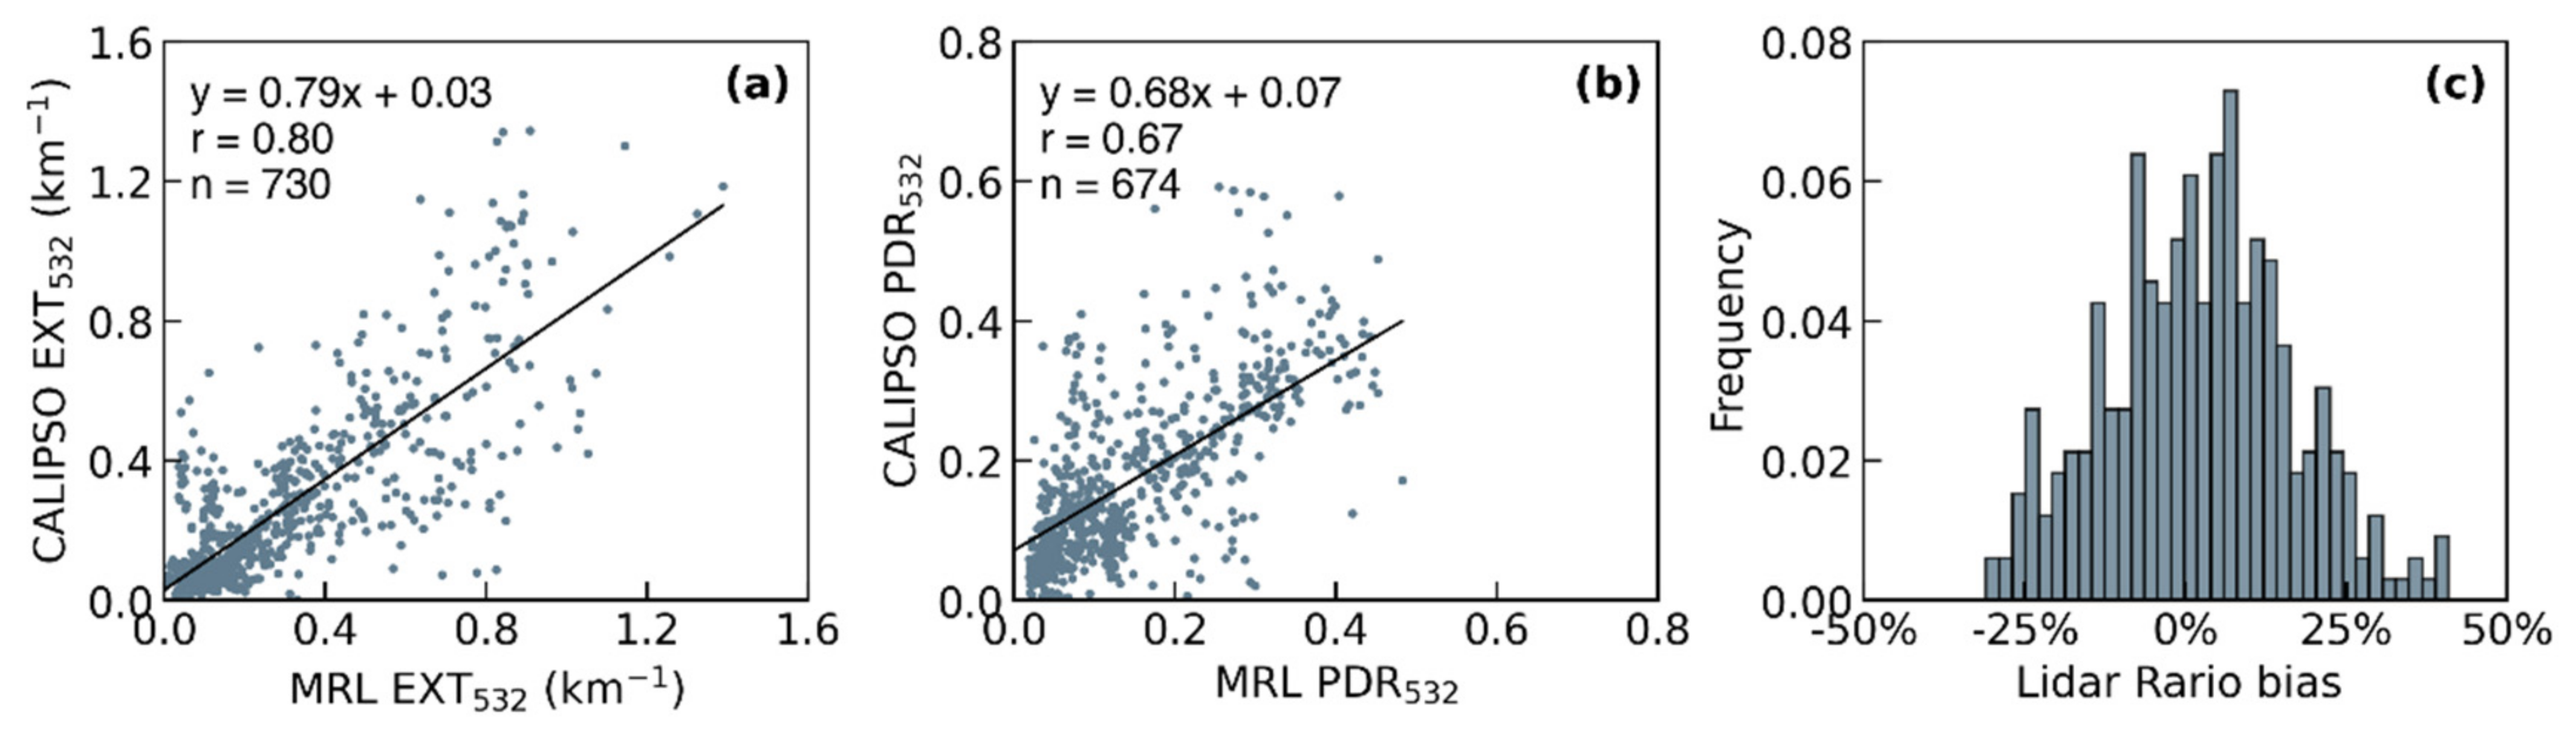
2.3. Comparison between Mie–Raman Lidar and CALIPSO

The CALIPSO V4 level 2 aerosol products, specifically EXT532, PDR532, and aerosol type classification results are used for comparison. It is hard to expect aerosols in the planetary boundary layer to be homogeneously distributed over long distances and long periods [46]. Thus, only CALIPSO overpasses that occurred at a distance of less than 90 km and a temporary difference of less than one hour were selected for comparison. From 26 January 2018 to 16 January 2019, 22 overpasses were found, of which 3 overpasses are missing data within 90 km from the observation site. Thus, 19 qualified for comparison. Details of the 19 cases are listed in Table 1.
MRL and CALIPSO measurements were made with different forms (time–height for MRL and latitude–height for CALIPSO). The CALIPSO V4 level 2 aerosol profile products, including EXT532 and PDR532, are reported on a nominal 5 km horizontal grid and a nominal 60 m vertical resolution between the surface and 20.2 km. Considering the difference in measurement forms and spatial and temporal resolution between CALIPSO and MRL, the PDR532, EXT532, and LR355 of MRL were reevaluated. We averaged all of the MRL signal profiles within one hour of CALIPSO overpasses, an eight-point spatial accumulation and then a five-point spatial smoothing was applied on the averaged MRL signal profile to recalculate PDR532 and EXT532. The spatial resolution of the sampled signal is reduced from 7.5 m to 60 m, which is the same as that of CALIPSO. The retrieval of LR355 still uses the three-hour average MRL signal profile at night and the twelve-hour average MRL signal profile during daytime, but an eight-point spatial accumulation was performed. Similarly, after excluding abnormal data, we averaged all the CALIPSO V4 level 2 aerosol profile products (PDR532, EXT532 and LR355) within 90 km of the MRL observation site to reproduce a signal profile. Since PDR532 of CALIPSO is relatively noisy when compared with PDR532 of MRL (Figure S1), we only calculated the Pearson correlation coefficient of EXT532 between MRL and CALIPSO (Table 1). In addition, we also evaluated the relative bias of the LR between MRL and CALIPSO. The relative bias is defined by the following equation:
Bias ( z ) = 100 % δ CALIPSO ( z ) δ MRL ( z ) δ CALIPSO ( z ) ,
where z is the height, and δMRL and δCALIPSO are the LR measured by MRL and assumed by CALIPSO, respectively.

3. Results

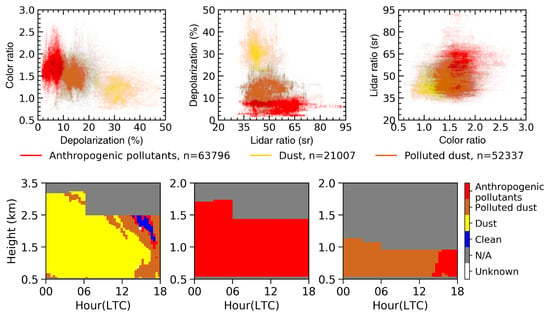
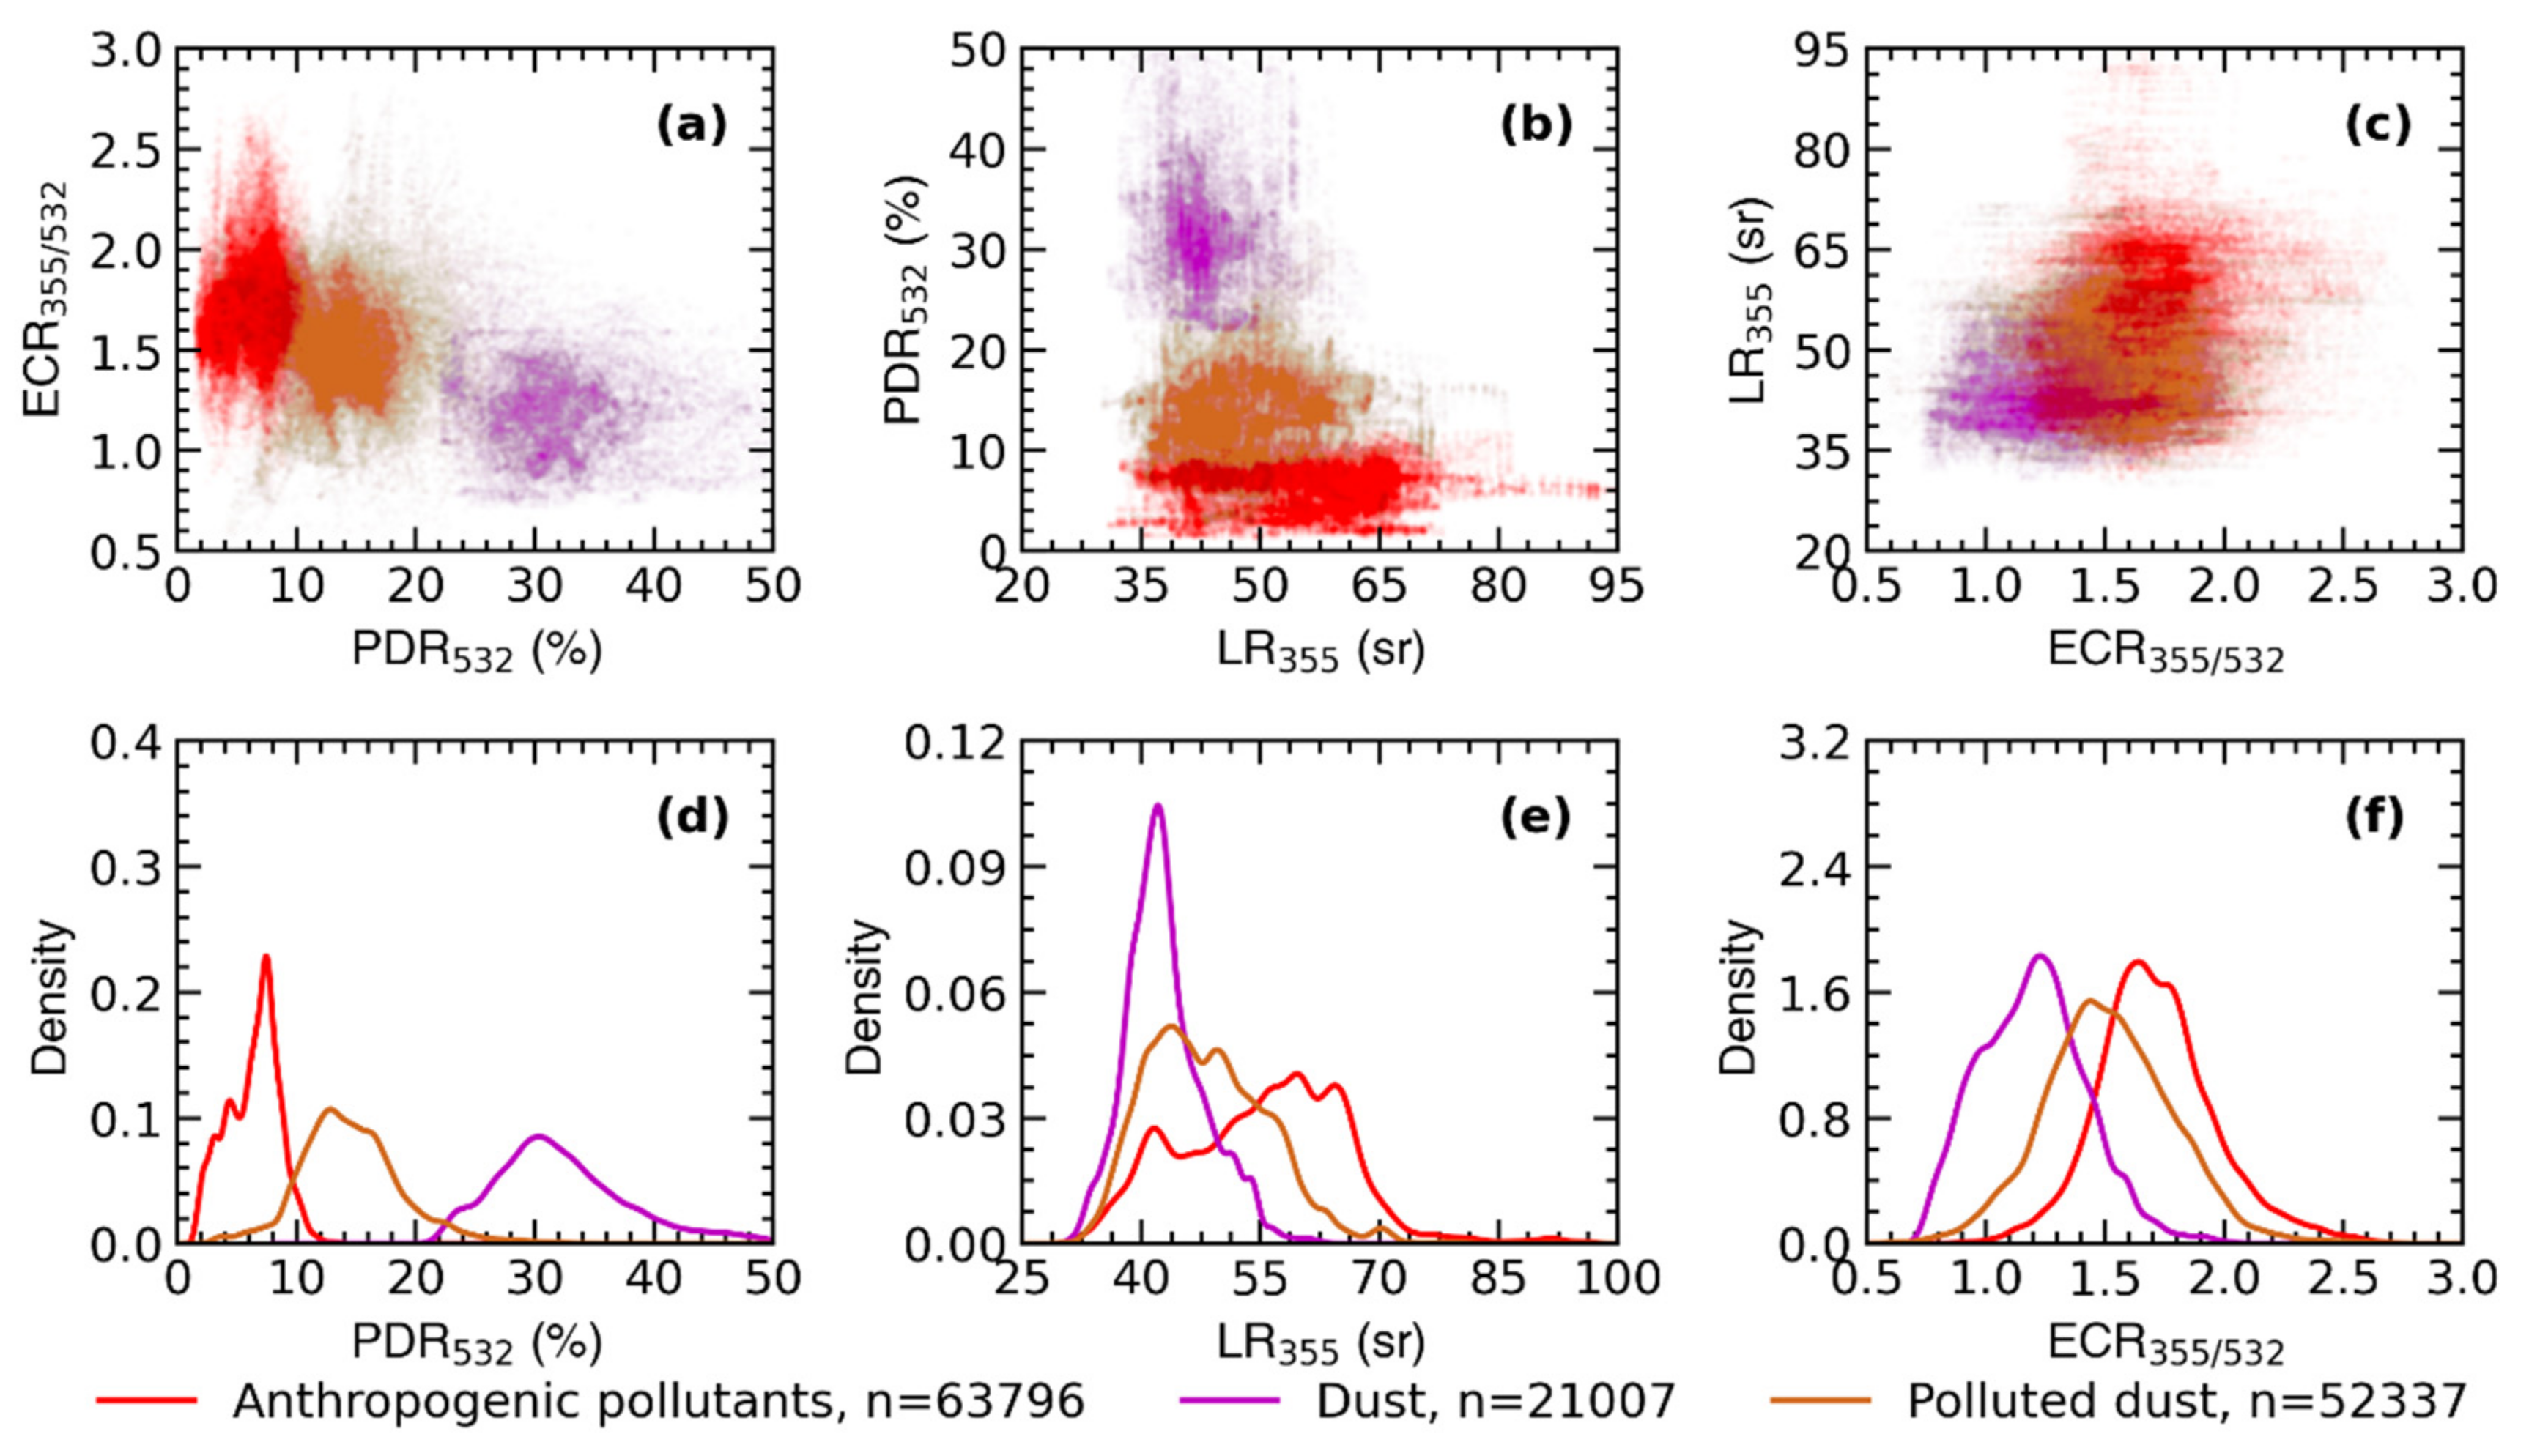
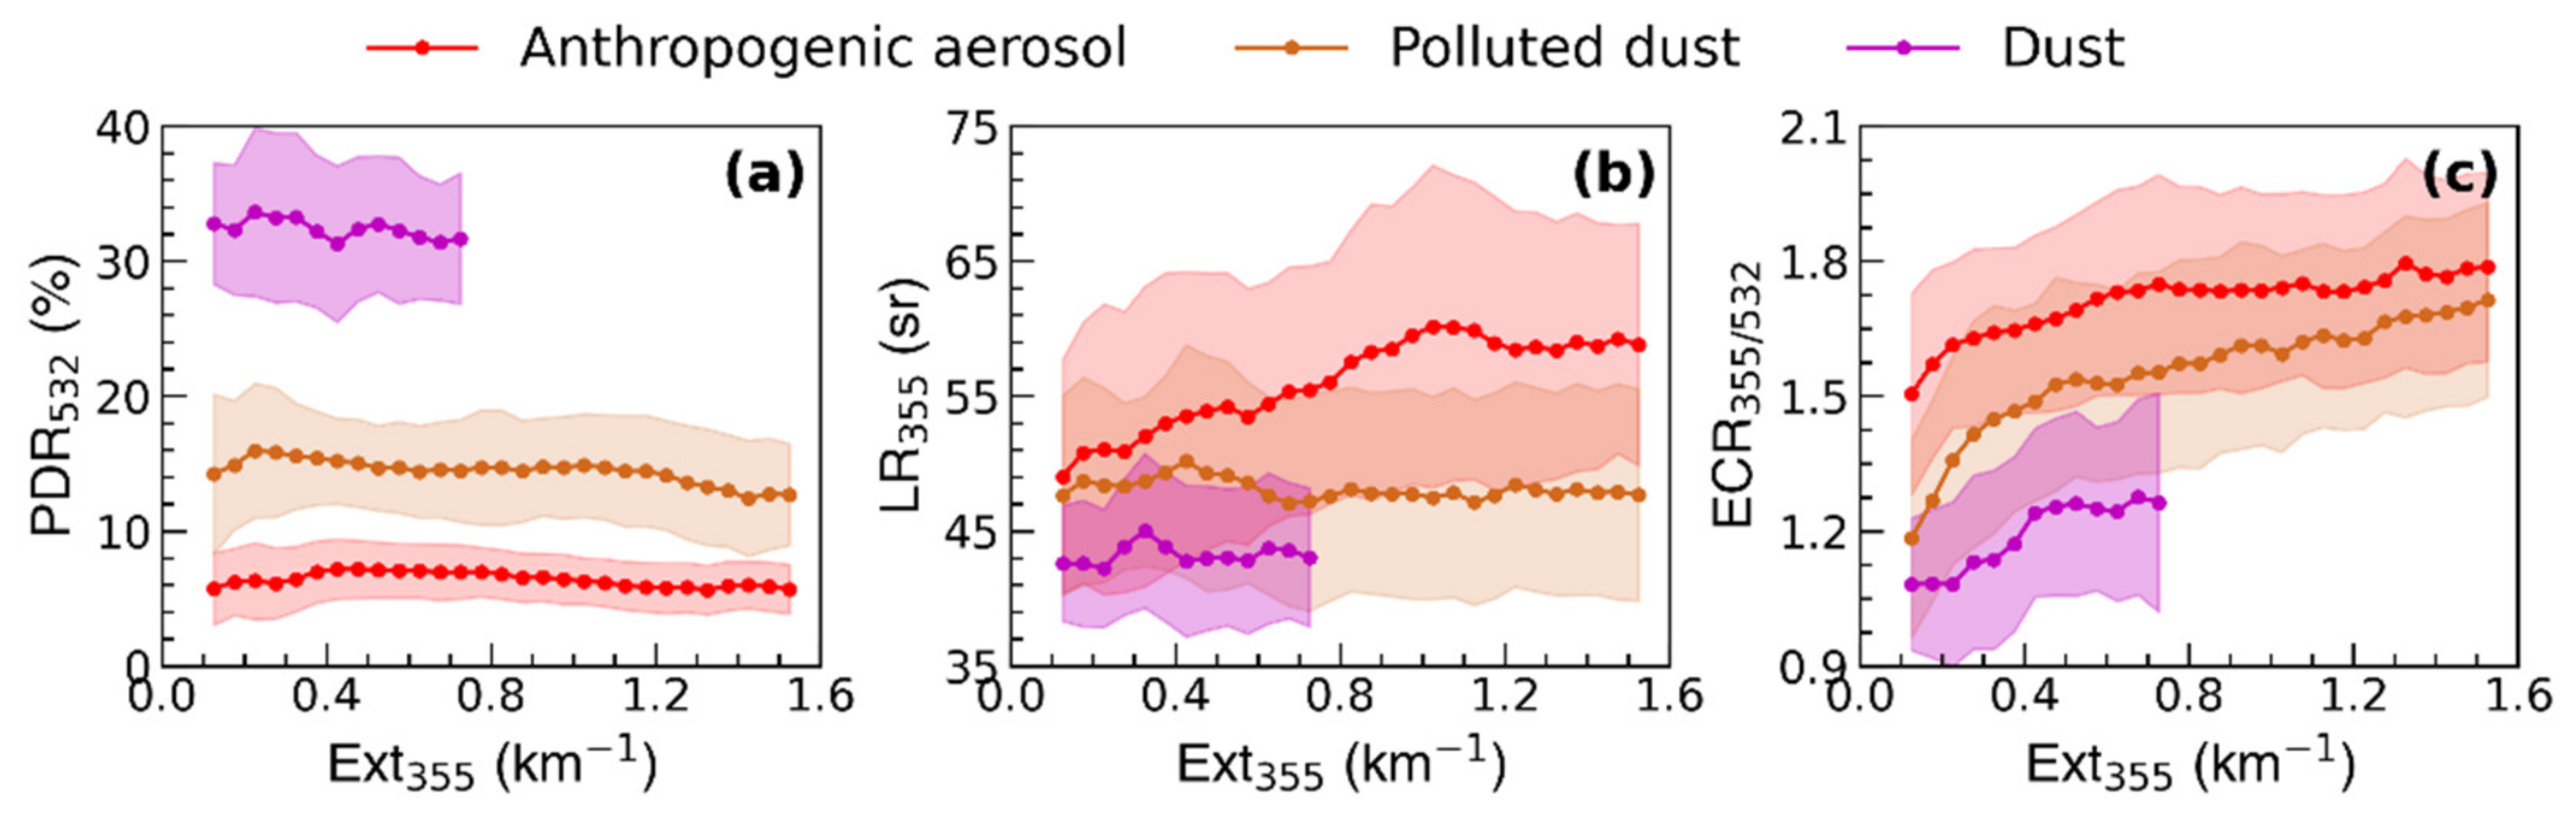
3.1. Key Property of Typical Aerosol Types in BTH Region
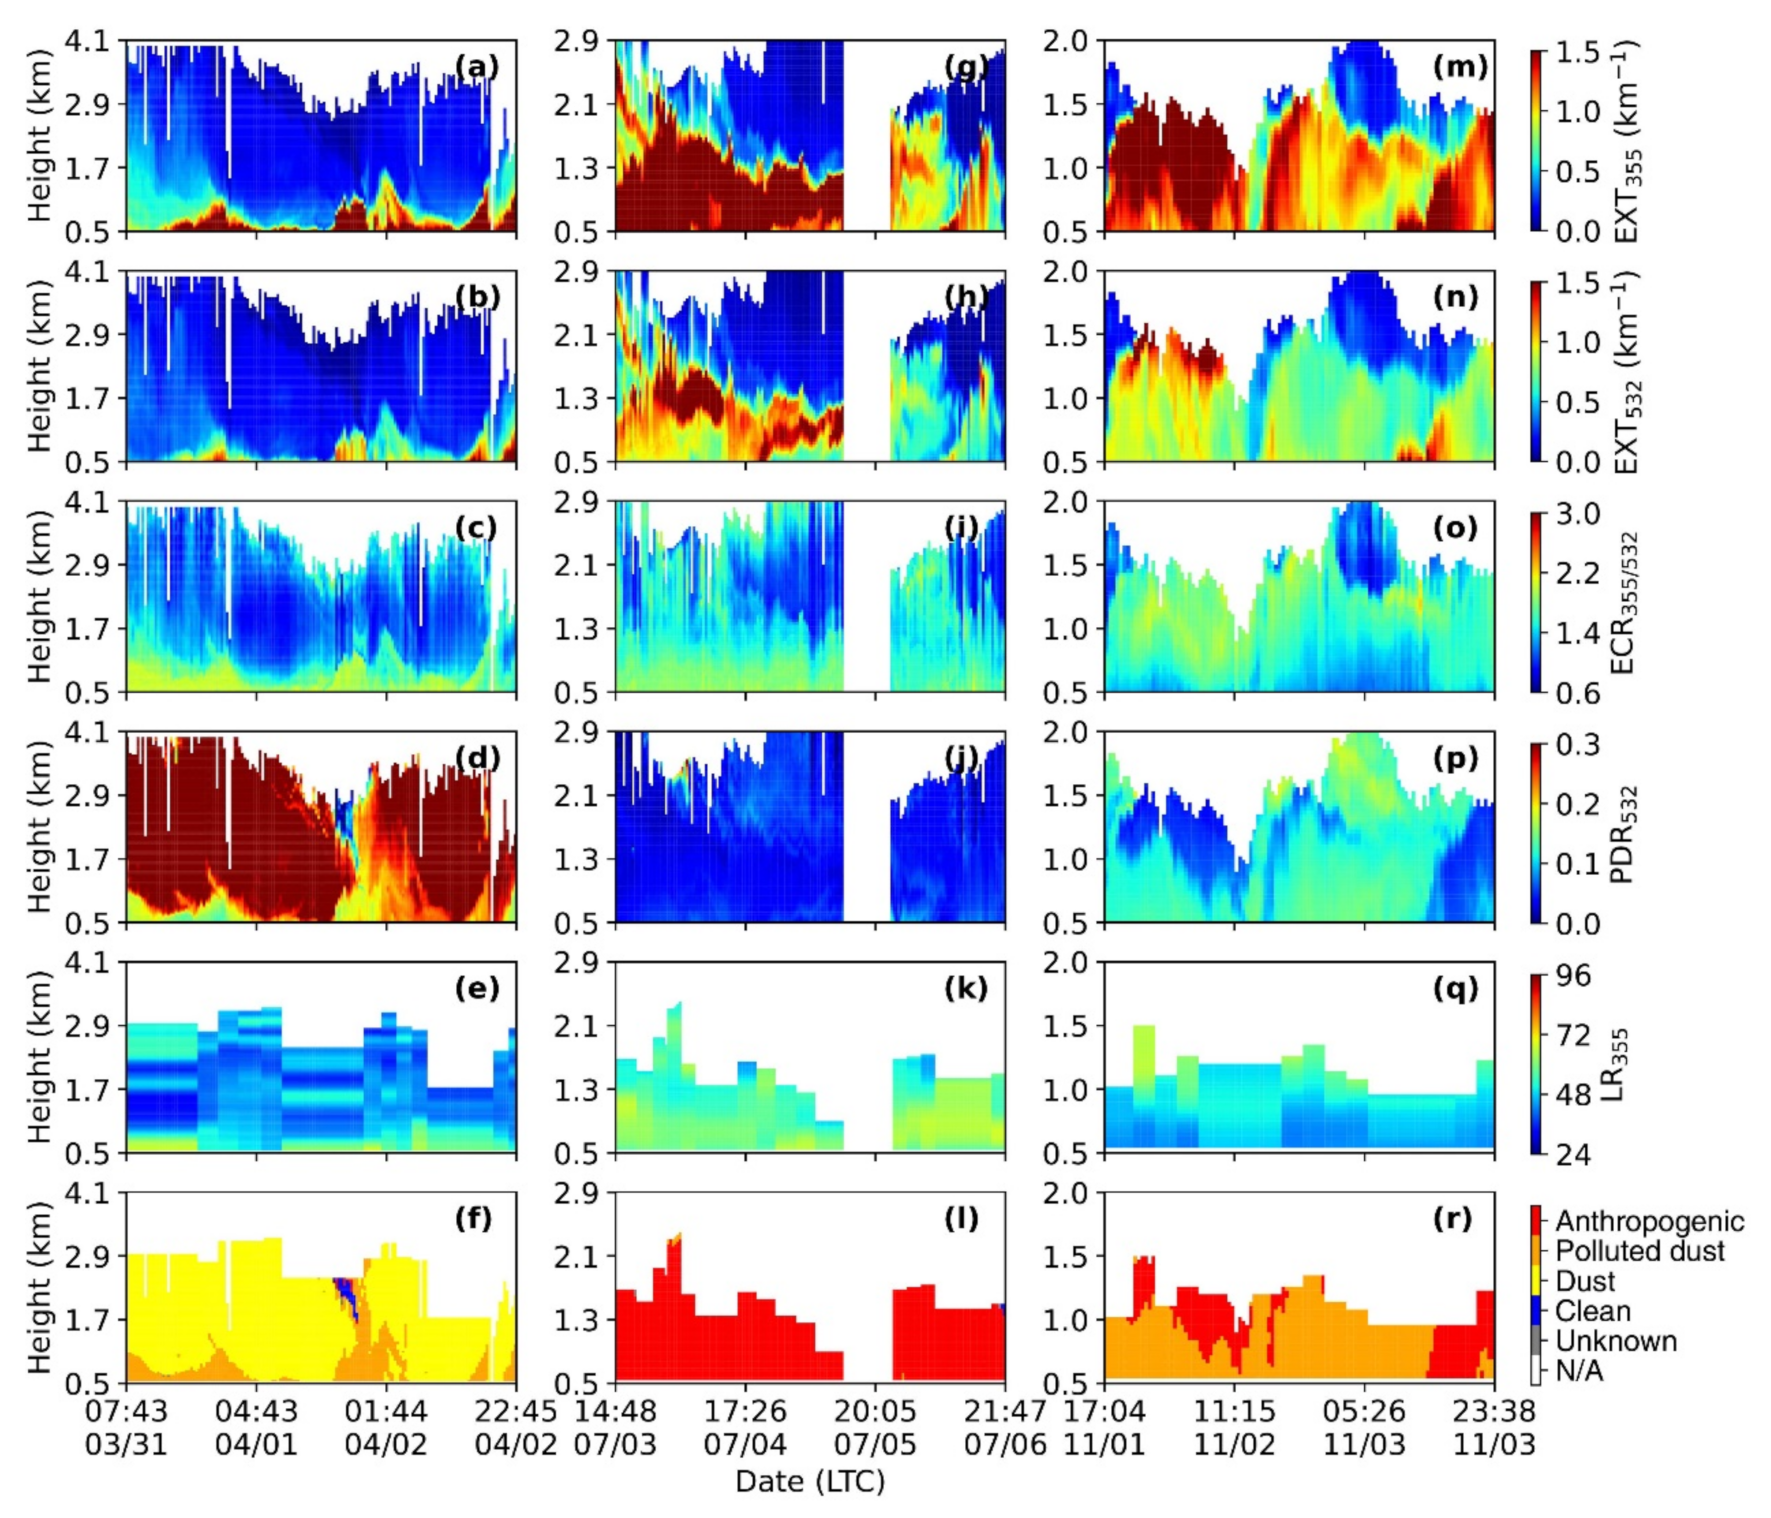
3.1.1. Dust Aerosol

A typical dust event measured by MRL is shown via time–height indicators of EXT355, EXT532, ECR355/532, PDR532, LR355, and classification results from 7:43 on 31 March to 22:45 on 2 April in Figure 3a–f. The high PDR532, greater than 0.3, indicates that the dust layer on 31 March roughly extends from around 0.8 km to 4 km, and the top height of the dust layer may be higher than 4 km due to the missing data. The height of the dust layer gradually decreased during the night on 31 March, and reached 1.5 km on 1 April. Another intense dust layer occurred at approximately 0:00 on 2 April, and the depth of this dust layer rapidly decreased from the upper air to several hundred meters within a few hours. According to the air mass backward trajectories (Figure 1a, Figure S2), the air masses at 1.5 km are long-range transported from Northwest China (66%), which is one of the sources of natural dust [10]. However, the air masses at 0.5 km came from southerly polluted industrial areas and Northwest China, causing dust aerosol mixed with anthropogenic aerosols. Thus, the EXT355, EXT532, LR355, and ECR355/532 in the lower lidar layer are considerably higher than those in the upper lidar layer (1.0–1.8 km), and the PDR532 below 0.8 km was lower than that in the upper lidar layer.
Figure 4a–d present the CALIPSO observations during nighttime (02:32) and daytime (13:36) on 1 April. The CALIPSO overpasses were 53 km and 15 km away from the MRL measuring site during the nighttime and daytime, respectively. Figure 4a,b show that almost all of the V4 aerosol subtype masks above 1 km are classified as dust (yellow). Moreover, the V4 aerosol subtype mask correctly separates the upper dust layer and lower mixture of dust and anthropogenic aerosols. The part of the aerosol below 1 km is classified as polluted dust (brown) or polluted continental (red), which is similar to the MRL observations. Figure 4c,d show the profile comparison with a distance of less than 90 km and a temporal difference of less than 1 h between CALIPSO and MRL. The comparison of the EXT532 profile shows superior consistency (R2 = 0.90 around 02:32 LT, R2 = 0.99 around 13:36 LT). The PDR532 of CALIPSO is relatively noisy when compared with the PDR532 of MRL, and sometimes shows an unrealistic value [47]. Nevertheless, the high PDR (>0.25) is evident in the CALIPSO PDR532 profile. The LR of the dust aerosol has no obvious wavelength dependence [48]. Thus, the LR355 retrieved by MRL is consistent with the LR532 assumed by CALIPSO, the relative bias is less than 15% during the day and night.
Another two dust events were also observed in spring, as shown in Figure S3. In addition, dust events were also found in autumn and winter (Figure S4). All of the dust events observed in 2018 are related to long-distance transport in Northwest China. The dust event in the BTH region exhibits a period of 2–5 days, and the height of the dust layer was roughly distributed from 0.5 km to 4 km. Based on our one-year observation, the PDR532 of the Asian dust ranged from 0.22 to 0.49, and the PDR532 is the biggest difference in the aerosol optical parameters between dust and other aerosols. The ECR355/532 of Asian dust is between 0.7 and 2.2, and the LR355 of Asian dust is 30–60 sr, indicating coarse and less-absorbing particles.

3.1.2. Anthropogenic Aerosols

It is hard to distinguish between biomass burning smoke and urban pollution due to the practically identical LR355, PDR532 and ECR355/532 measured by MRL [27]. Müller et al. [40] have reported that the wavelength dependence of the LR (355 and 532 nm) can be used to distinguish urban aerosols from smoke aerosols. Foy et al. [17] found that the depolarization color ratio can be used to characterize the biomass burning smoke and urban pollution, which is defined as the ratio of depolarization at 532 nm and 1,064 nm. Thus, we define those non-depolarizing aerosols (biomass burning smoke or urban pollution) as anthropogenic aerosols. The anthropogenic pollution case in summer from 14:48 on 3 July to 21:47 on 6 July is presented in Figure 3g–l. The polluted air originated from the highly populated North China plain during our observation period (Figure 1b). A routine maintenance of the MRL was performed in the afternoon of 5 July, and the data collection was stopped, as shown in the white area in Figure 3g–l. Figure 3h shows that the high EXT532 value extends from 0.5 km to about 1.7 km. The main part of the aerosol layer is concentrated in the upper lidar layer, which may be related to the airborne transport of southern anthropogenic aerosols (Figure 1b). The low PDR532 (less than 0.1) and high LR355 (>50 sr) are considerably different from the dust aerosol, indicating spherical fine-mode particles. A small part of the particles with higher PDR532 (>0.15) may be affected by the dust aerosol originating from Mongolia.
Two CALIPSO overpasses around 02:31 LT and 13:36 LT on 6 July at a distance of 50 km and 10 km are presented in Figure 4e–h. Figure 4e,f show about half of the aerosol subtype mask is classified as polluted continental/smoke (red), while part of the aerosol subtype mask is assigned to polluted dust (brown), dust (yellow), and elevated smoke (black). The CALIPSO aerosol-type retrieval algorithm in V4 defines the non-depolarizing aerosols as polluted continental/smoke or elevated smoke (black). The elevated smoke inland has similar optical properties to the polluted continental/smoke, and it is recognized primarily according to altitude. ‘Elevated’ is defined as the top height of the aerosol layer higher than 2.5 km above ground level [26]. Figure 4g,h give a quantitative view of the CALIPSO observations and compare them with the MRL results. The differences found in the EXT532 profile comparison (R2 = 0.66 around 02:31 LT, R2 = 0.74 around 13:36 LT) were probably due to the inhomogeneous aerosol conditions during the comparison period. The PDR532 measured by CALIPSO and MRL is usually less than 0.10. There are several noisy values in the CALIPSO PDR532 profile due to an attenuation-related depolarization bias, which may lead to the overuse of the polluted dust subtype [15]. The relative bias of LR between CALIPSO and MRL was up to 23% around 02:31 LT and within 9% around 13:36 LT.
Anthropogenic aerosols can be observed throughout the year, with the most frequent in winter (Figures S5–S9). The occurrence of heavy anthropogenic pollution is closely related to the transport of air pollution in the southeast or southwest. The intense haze layer is primarily concentrated in the lower lidar layer in winter, indicating the contribution of local emissions. While the anthropogenic pollution in the upper lidar layer in summer is more serious, suggesting that the regional transmission plays an important role [49]. The low PDR532 is the strongest signal for anthropogenic aerosols with values between 0.02 and 0.14 compared with 0.22 to 0.49 for the dust aerosols. The high ECR355/532 (0.9–2.7) stands out clearly for the fine particles of anthropogenic aerosols. The typical value of the LR355 of anthropogenic aerosols is 55 ± 10 sr, and it is widely distributed, ranging from 31 sr to 97 sr. The largest LR355 up to 97 sr was found in winter, which may be related to absorbing aerosols, such as black carbon.

3.1.3. Polluted Dust

Atmospheric aerosols are not usually of a single pure type, but appear as a mixture of various types, which will change the optical and radiative properties of the aerosols. Polluted dust is created to account for the episodes of dust mixed with anthropogenic aerosols, which are frequently encountered in the BTH region. A typical polluted dust layer below 2 km is shown in Figure 3m–r. The PDR532 is around 0.15, in contrast with values greater than 0.22 for dust aerosol and less than 0.1 for anthropogenic aerosols, the PDR532 is the biggest difference between polluted dust and other aerosol types. The backward trajectory shows that the air masses are transported from the Mongolia region, which contains the pure dust aerosols, and then these air masses pass through the southern urban/industrial areas, mixing the pure dust with anthropogenic aerosols (Figure 1c). Dust mixed with non-depolarizing aerosol during transportation makes the mixed aerosols nearly spherical.
CALIPSO observations during the nighttime (02:32 LT) and daytime (13:35 LT) on 3 November clearly show that the polluted dust layer extends from the ground to more than 2 km (Figure 4i,j). Two CALIPSO overpasses were 58 km and 39 km away from the MRL measuring site during the nighttime and daytime, respectively. The comparison of EXT532 between MRL and CALIPSO is in good agreement (R2 = 0.87 around 02:32 LT, R2 = 0.90 around 13:35 LT). The PDR532 below 2 km measured by CALIPSO was from 0.07 to 0.26, similar to the 0.09–0.18 observed by MRL. The LR355 retrieved from MRL is 42–57 sr at night and 44–51 sr during the day. The LR532 assumed by CALIPSO was 55 sr at night and 60 sr during the day. The relative bias of the LR between CALIPSO and MRL is within 25%.
Polluted dust was most common in spring and autumn, which is deeply affected by the Asian dust activities (Figures S10–S13). The long-distance transportation of northwestern dust air masses mixed with southerly urban/industrial pollution dominates air pollution in spring and autumn in the BTH region. The PDR532 of polluted dust is distributed in the range from 0.06 to 0.27. The ECR355/532 is from 0.8 to 2.6, and the LR355 span the 31–85 sr range. The widely distributed PDR532, LR355, and ECR355/532 are closely related to the mixing ratio of dust and urban/industrial pollution. Compared with pure dust and urban/industrial pollution, significant shifts in PDR532, LR355, and ECR355/532 indicate the variation in aerosol optical and radiative properties.

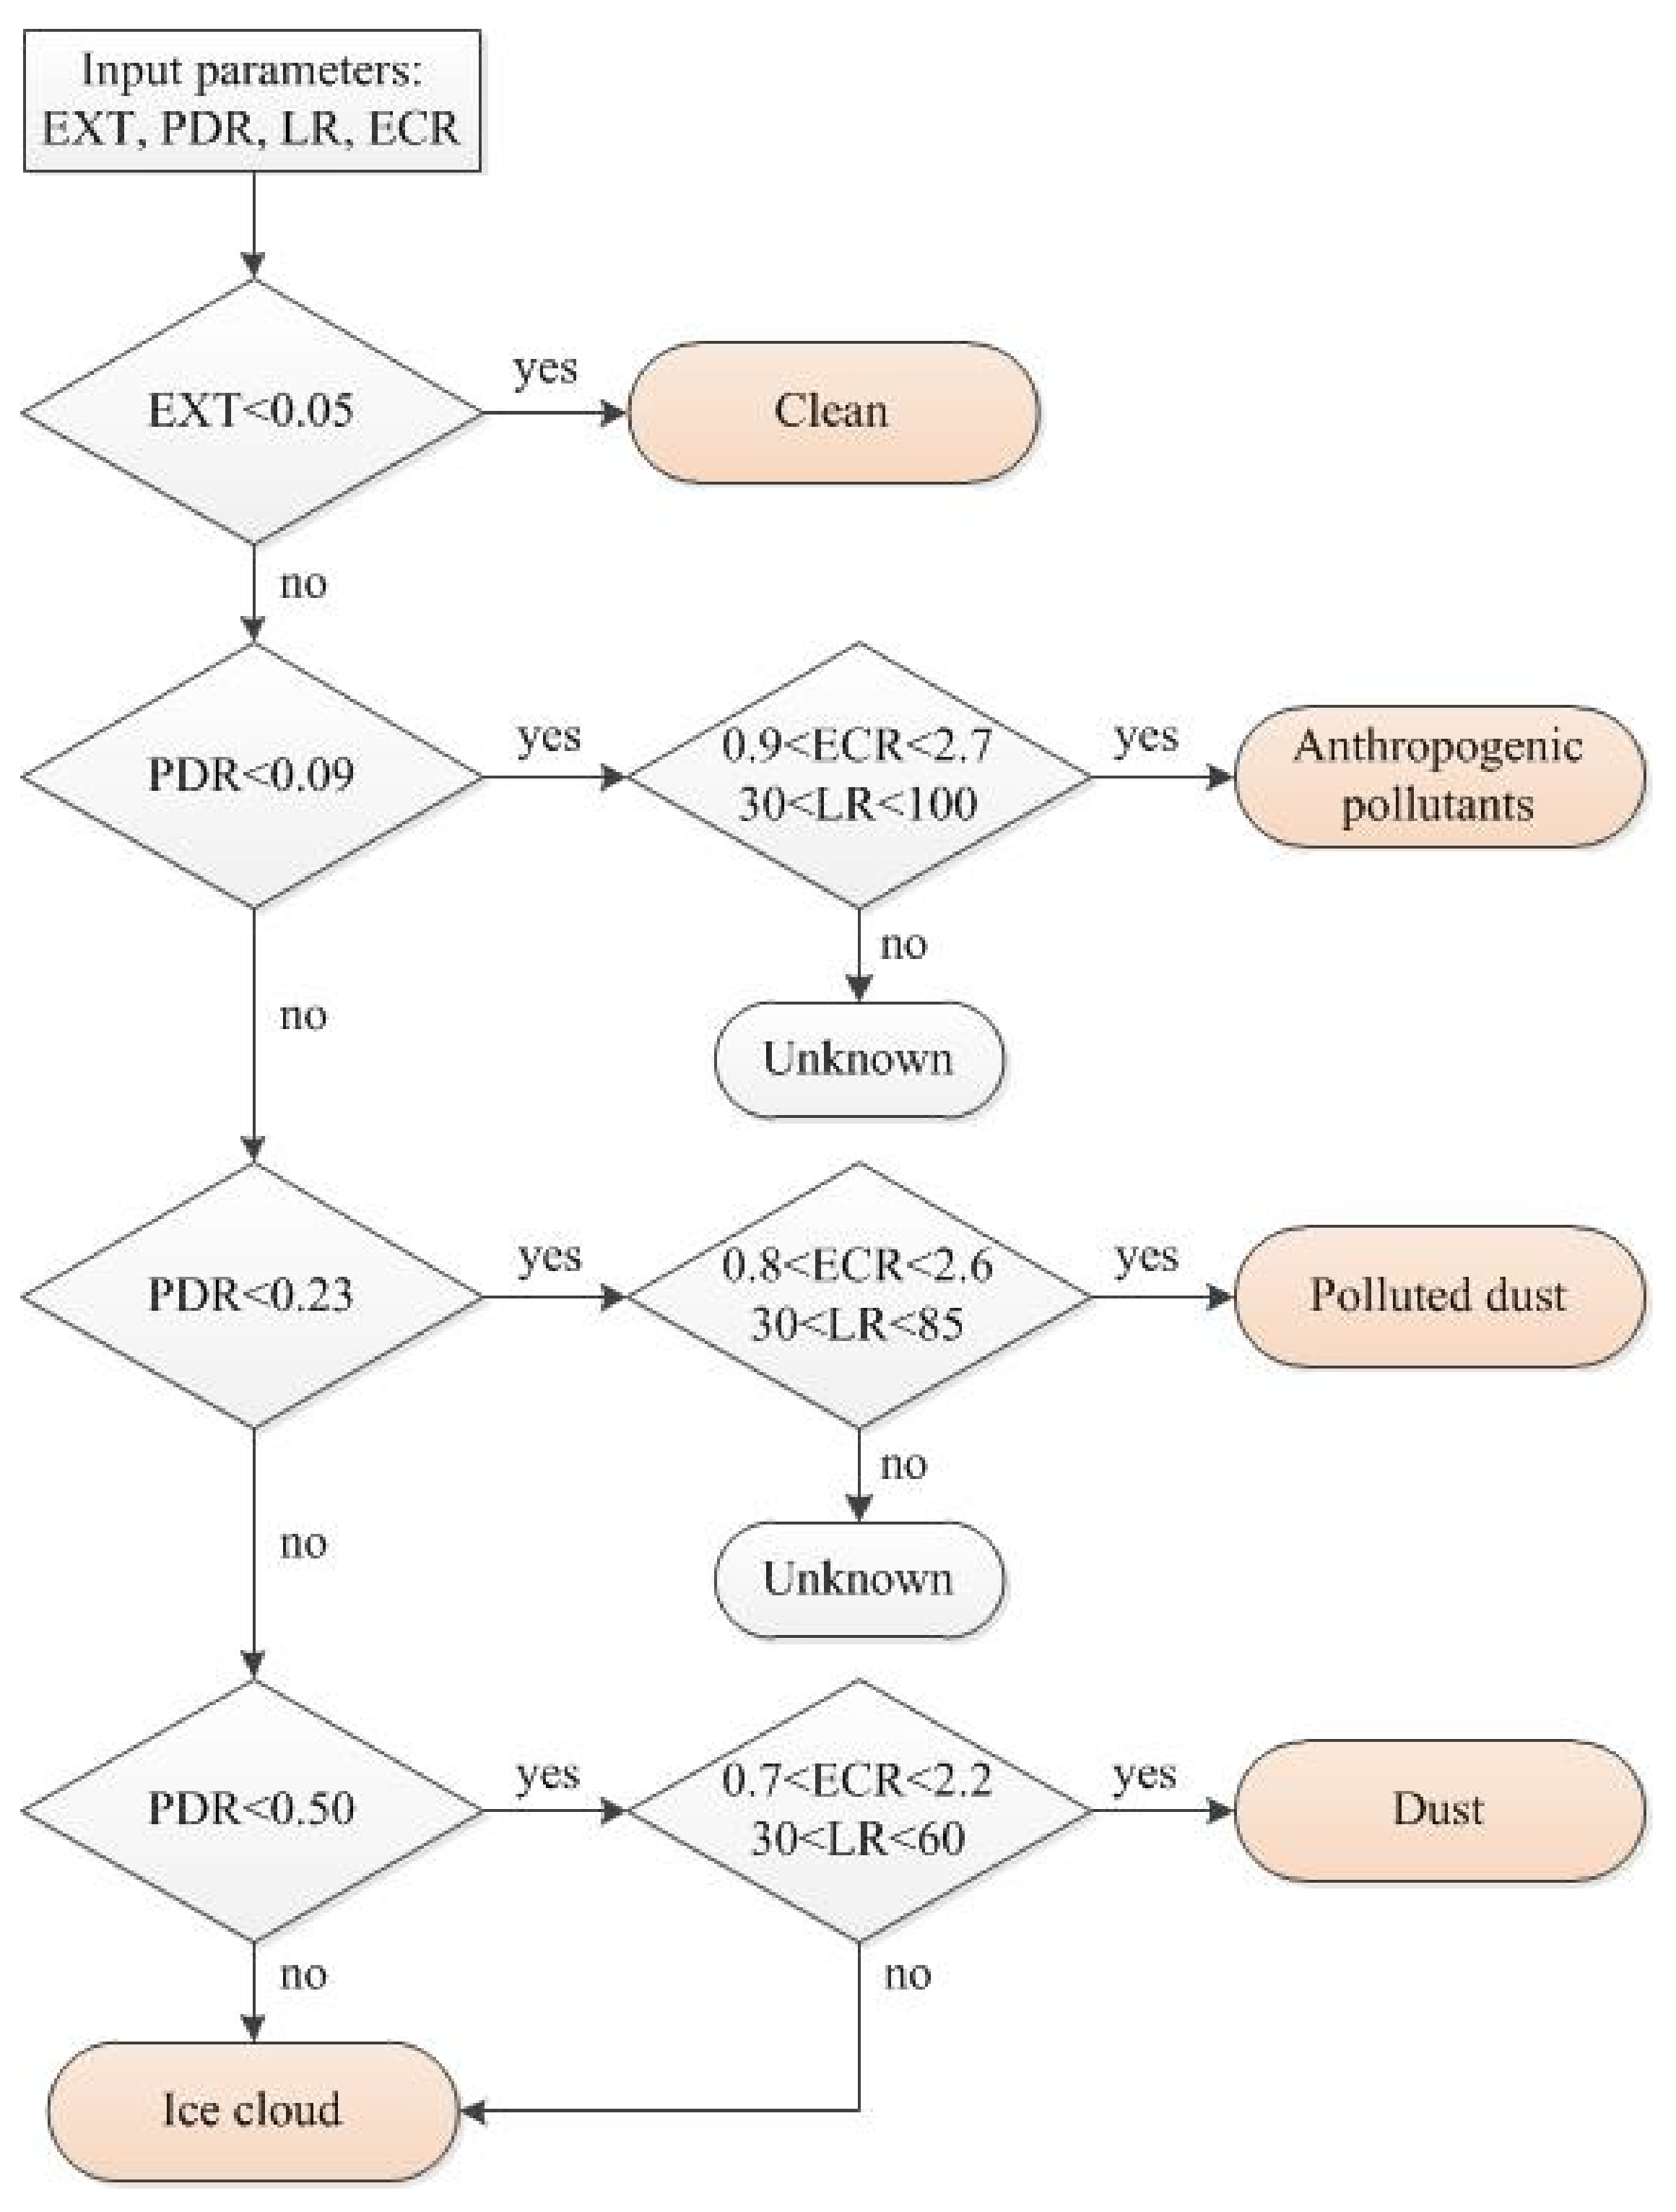
3.2. Aerosol Classification Scheme

As stated above, anthropogenic aerosols (urban/industrial pollution or biomass burning smoke), dust, and polluted dust (mixture of dust and anthropogenic aerosols) are the key aerosol types frequently encountered in the BTH region. Here, we use the PDR532, LR355, and ECR355/532 in aerosol classification according to the difference in optical properties between the three key aerosol types. The EXT355 and EXT532 as well as the aerosol optical depth are not applied, as these parameters vary primarly with aerosol concentration rather than aerosol type.
Figure 5a–c show the characteristics of key aerosol types in the BTH region based on a one year continuous observation of MRL. Two dimensional projections of PDR532 versus ECR355/532, LR355 versus PDR532, and ECR355/532 versus LR355 are color-coded by inferred aerosol types, and the saturation of each hue represents the relative population density of each aerosol type. Obviously, PDR532 presents the greatest variation between the different aerosol types, and it is the most relevant attribute for aerosol classification. In contrast, although LR355 and ECR355/532 are different in the three aerosol types, there is a clear overlap in the numerical distribution, which can be used as an auxiliary parameter in aerosol classification. Clusters of data pairs between the three aerosol types usually show a wide distribution, and the frequency distribution of PDR532, LR355, and ECR355/532 along with the the number of points of each aerosol type are shown in Figure 5d–f.
The main peak of the PDR532 frequency distribution for anthropogenic aerosols is at 0.076. While there is still a faint small peak at 0.041, which may be caused by a mixture of different kinds of non-depolarizing air pollutants, such as biomass burning smoke, fossil fuel combustion, and industrial pollution. An extremely wide distribution of PDR532 of polluted dust was found, and the central value is from 0.09 to 0.20. The PDR532 frequency distribution of Asian dust shows a main peak at approximately 0.31. The wide distribution of the PDR532 of Asian dust may be related to the considerably intricate shape of the dust particles, and the dust from both the Gobi Desert and Taklimakan Desert will affect the air quality in the BTH region [10]. Generally, coarse-mode particles have a lower LR, and fine-mode particle pollution will increase the LR [25]. Asian dust is dominated by coarse particles, the LR355 frequency distribution showed a significant narrow peak at 43 sr. The LR355 frequency distribution of polluted dust overlaps with that of the Asian dust, but the value of the LR355 of polluted dust is higher due to the mixing of fine-mode particles. The wide LR355 distribution of anthropogenic aerosols mainly ranges from 35 sr (scattering aerosol) to 70 sr (absorbing aerosol), indicating that the anthropogenic aerosols are a mixture of multiple non-depolarizing air pollutants, and it is consistent with the PDR532 observation. The frequency distribution of the ECR355/532 of the three aerosol types show a single peak, the peak value of Asian dust, polluted dust, and anthropogenic aerosols are 1.25, 1.43, and 1.66, respectively. Overall, the characteristics in aerosol optical parameters between the three key aerosol types can be identified as follows: (1) high PDR532, low LR355, and low ECR355/532 corresponding to coarse non-spherical scattering particles for Asian dust; (2) low PDR532, high LR355, and high ECR355/532 corresponding to fine spherical medium-absorbing particles for anthropogenic aerosols; and (3) medium PDR532, medium LR355, and medium ECR355/532 for polluted dust. The mean values of PDR532, LR355, and ECR355/532 for the three aerosol types are listed in Table 2.
In addition, we also list the PDR532 and LR of ice clouds (Table 3), which are not found in our observations but can be seen in the BTH region [50]. Similar to dust aerosols, the PDR532 of ice clouds is widely distributed, and the maximum value reaches 0.6, which is significantly higher than that of dust aerosols. It is difficult to distinguish between dust and ice clouds through a high PDR532. Particularly, the LR of ice clouds is very low, usually less than 30 sr. Thus, an LR threshold of 30 sr can be used to distinguish dust and ice clouds [51]. According to our one-year continuous measurements and former findings (Table 3), a flowchart of aerosol type classification is presented in Figure 6. Applying the classification scheme shown in Figure 6 to the cases in Section 3.1, the results are shown in Figure 3f,l,r. The aerosol subtype mask clearly shows that the classification scheme can effectively identify the main aerosol types and the stratification of aerosols in the BTH region.

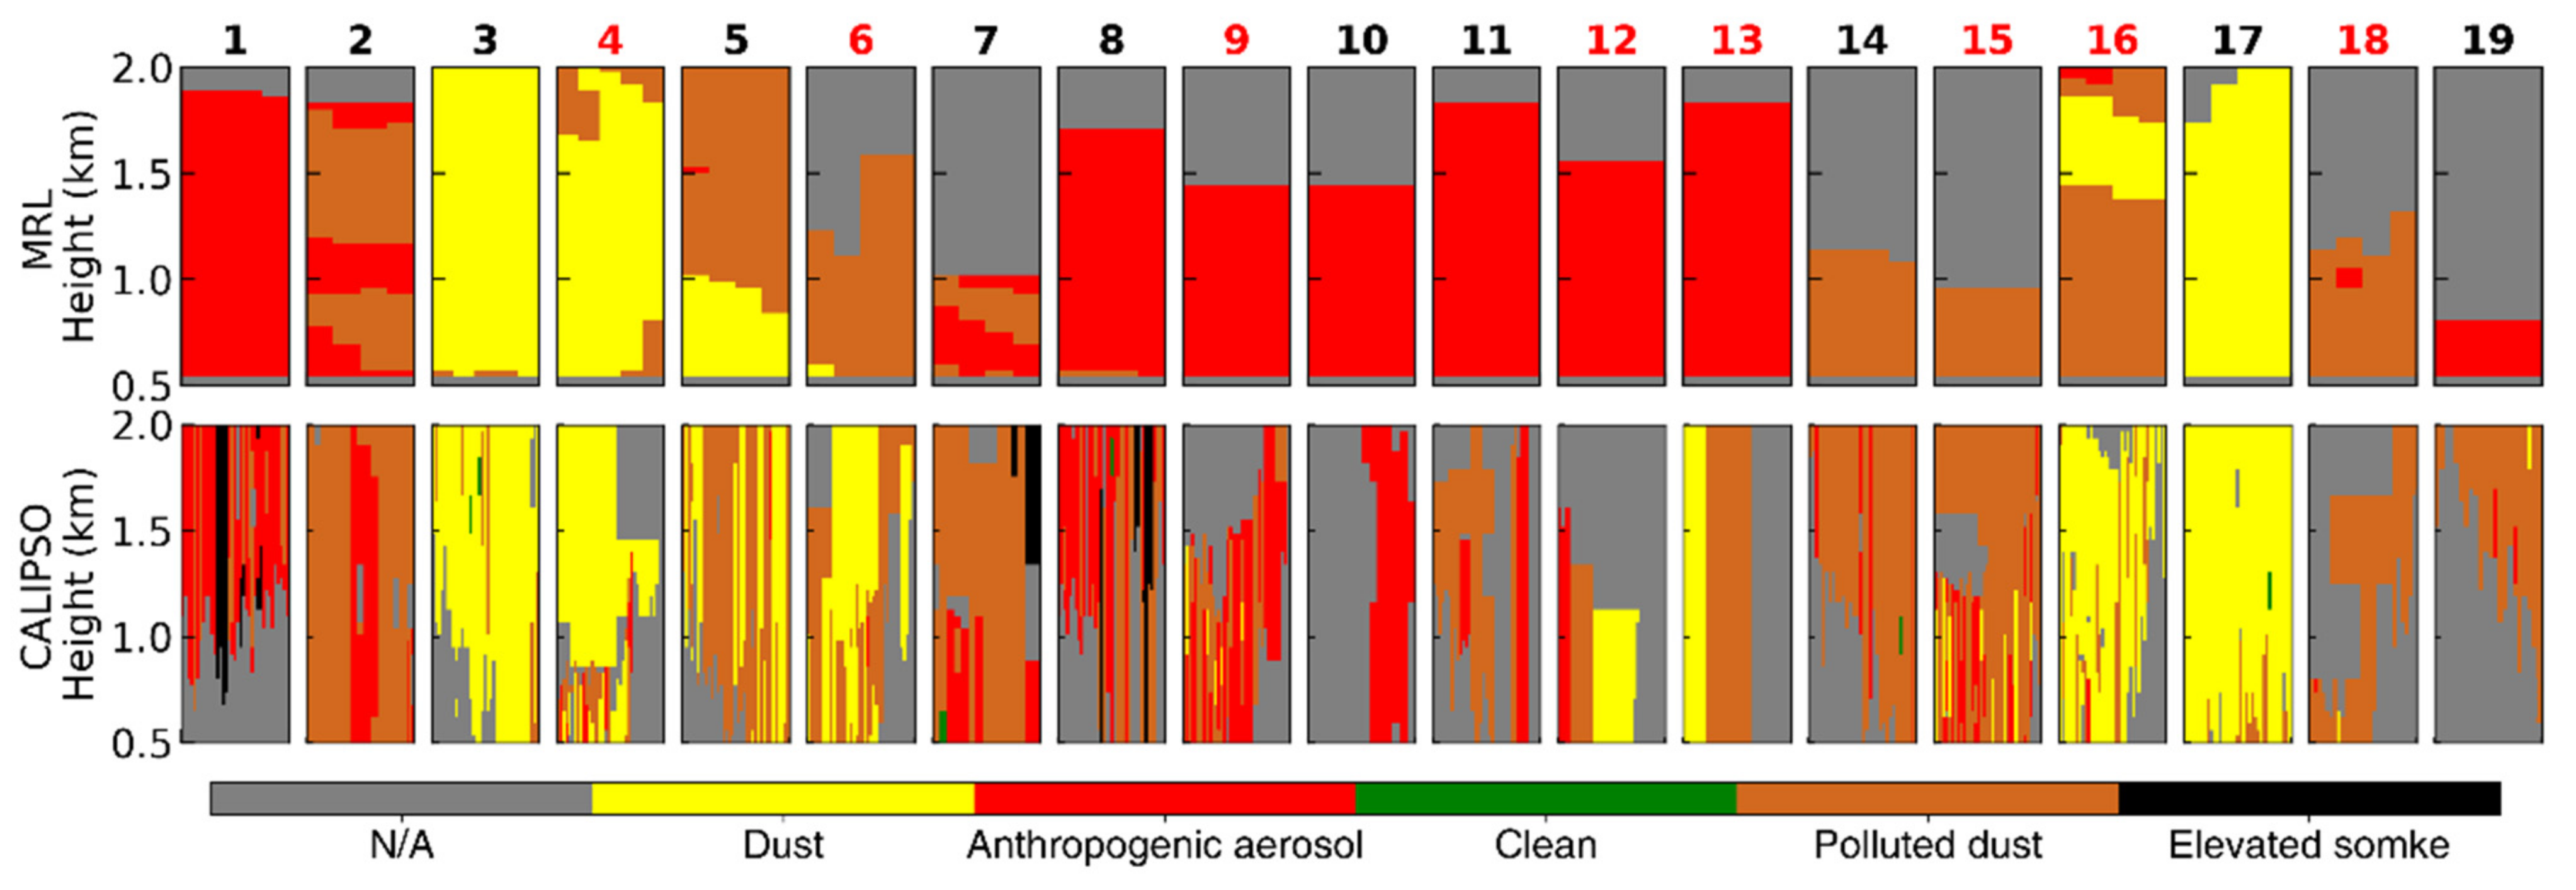
3.3. Classification Results Comparison between MRL and CALIPSO

To verify the classification scheme, we compared MRL classification results with the CALIPSO measurements, 19 cases of CALIPSO overpasses are presented in Figure 7. Due to the different measurement forms being made between MRL and CALIPSO, the MRL aerosol subtype mask only shows the results within one hour of the CALIPSO overpasses, as shown in the first line of Figure 7. The CALIPSO classification results that occurred at a distance of less than 90 km in each case were presented in the second line of Figure 7. The case number is displayed at the top of each subgraph, the black and red numbers represent the nighttime and daytime results, respectively. Detailed information for each case can be found in Table 1. In general, Figure 7 confirms that the aerosol classification results derived from MRL are similar to the CALIPSO aerosol classification results.
The comparison of dust aerosols between MRL and CALIPSO shows the best consistency (i.e., case 3, case 4, and case 17). While some differences can still be found in the comparison of other aerosol types, especially anthropogenic aerosols. The classification results of MRL in case 1, and cases 8–13 show anthropogenic aerosols, while the classification results of CALIPSO show anthropogenic aerosols, elevated smoke, polluted dust, and even dust aerosols. As stated in Section 3.1.2, our classification results classify both the elevated smoke and polluted continental/smoke as anthropogenic aerosols. The appearance of polluted dust and dust may be related to the PDR532 bias of CALIPSO, especially during the daytime, i.e., case 12 and case 13 (Figure S1). Another reason is the difference in the PDR532 threshold. CALIPSO classifies aerosols with a PDR532 of less than 0.075 as anthropogenic aerosols, which is lower than the threshold of 0.09 used in our classification scheme. The quite noisy PDR532 may easily exceed the PDR532 threshold of polluted dust (0.075) and dust (0.20), which may cause the misclassification of aerosols [15,27]. In addition, the MRL classification results sometimes show the stratification of aerosols in single-column measurements, while the different aerosol types determined by CALIPSO often appear between columns (i.e., case 2 and case 5). Burton et al. [15] also reported the similar problem that the CALIPSO aerosol subtype mask sometimes fails to recognize the internal boundaries between the different aerosol types in the single column. The layer boundary of the adjacent aerosol type is defined by the change in the aerosol backscattering intensity, regardless of the change of the aerosol optical parameters, such as PDR532 [60]. Although different aerosol types may indeed have different backscattering intensities, it is obviously not as reliable as the measurement of aerosol optical parameters for the aerosol layer boundary distinction.
In addition, 19 cases of CALIPSO-measured EXT532, PDR532, and LR355 were compared with MRL observations (Figure 8). Occasionally, the unrealistic PDR532 values appear in CALIPSO measurements, which may cause great errors in our comparison results. Thus, we discard PDR532 values greater than 0.6. In fact, the range of PDR532 measured by MRL is between 0.02 and 0.49. A scatter plot of the MRL and CALIPSO measurements is shown in Figure 8a,b. The MRL EXT532 agrees well with the CALIPSO results, with a Pearson correlation coefficient (r) of 0.80. The regression analysis indicated that the EXT532 measured by CALIPSO is slightly smaller than that measured by MRL. The correlation coefficient of PDR532 between MRL and CALIPSO is 0.67. The PDR532 bias of CALIPSO may explain some comparison differences (Figure S1). In the comparison of a single EXT532 profile, sometimes there is no significant correlation (Table 1). Under the lower aerosol concentrations, a small disturbance will cause the low correlation, but the actual EXT532 deviation measured by MRL and CALIPSO is very small. For example, case 11, 12, and 13 in Figure S1, there is little difference in EXT532 between MRL and CALIPSO, but the correlation is 0.22, 0.26, and 0.09, respectively. The second reason may be the inhomogeneous aerosol conditions within the boundary layer [46], while the CALIPSO overpass is far away (>50 km) from the observation site, a large deviation may be found in the EXT532 comparison between MRL and CALIPSO. Figure 8c provides an overview of the relative bias between LR532 assumed by CALIPSO and LR355 measured by MRL. The relative bias of LR is within 25% in more than 90% of the cases, and the relative bias of LR may be smaller due to the difference in the wavelength.

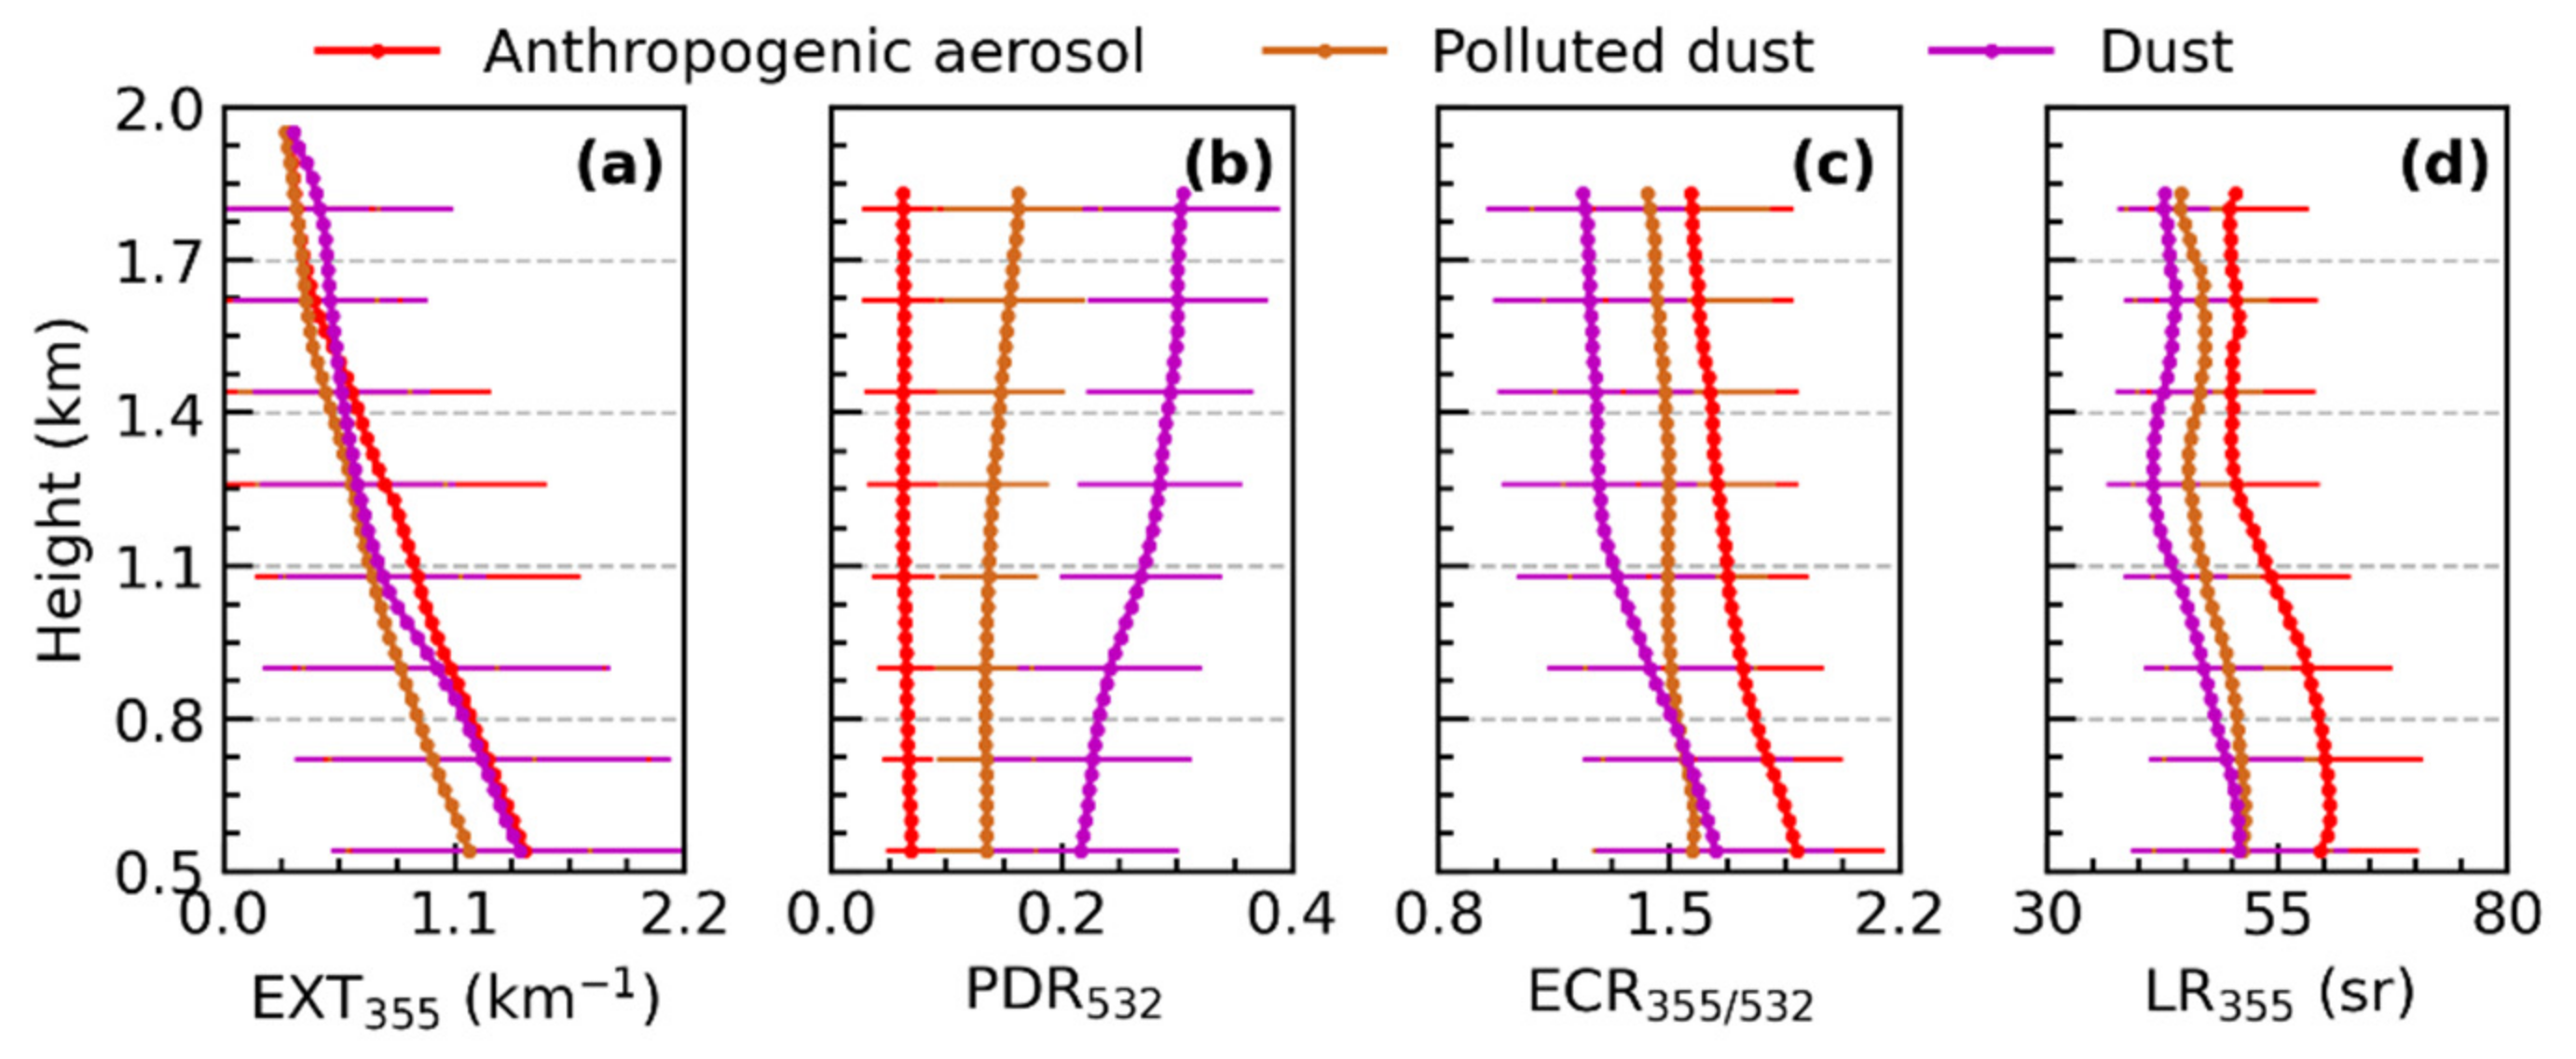
3.4. Mean Vertical Profiles for Three Aerosol Types

After the aforementioned analysis, the observed aerosol cases can be divided into the following three categories: anthropogenic aerosols (Figures S5–S9), polluted dust (Figures S10–S13) and dust (Figures S3 and S4). To further explore the aerosol optical parameters, we investigated the vertical profile variation in the three kinds of aerosol types. The mean profiles of EXT355, PDR532, ECR355/532, and LR355 for each aerosol type were presented in Figure 9. The average profiles are given up to 1.8 km due to the low signal-to-noise ratio of the lidar signal under heavily polluted conditions. However, we need to mention that Asian dust can usually be extended to higher altitudes.
The average EXT355 gradually decreases with the increase in height, and the differences in the mean EXT355 profiles above 1.6 km between anthropogenic aerosols and polluted dust gradually become insignificant, lower than the EXT355 of dust (Figure 9). The average EXT355 of dust and anthropogenic aerosols in the lower lidar layer is quite close, which is higher than that of polluted dust. From 0.9 to 1.1 km, the average EXT355 of Asian dust decreased significantly. The evolution of the mean profiles of the aerosol optical parameters are different from the evolution of the average EXT355 profile. The variation in the mean PDR532 profile of anthropogenic aerosols remains almost consistent between 0.51 km and 1.8 km, the value is around 0.07. The mean ECR355/532 of anthropogenic aerosols reaches its maximum (1.9) at 0.51 km, and then decreases gradually with the height. The average LR355 of anthropogenic aerosols in the lower lidar layer is around 61 sr, and this gradually decreases to about 52 sr. Therefore, air pollution related to human activities is the heaviest in the lower lidar layer, mainly composed of medium-absorbing spherical fine particles, and the average particle size increases and absorption decreases with the increasing in the altitude.
By contrast, the average PDR532 and ECR355/532 profiles of polluted dust barely changed from 0.51 to 1.8 km, the values are around 0.14 and 1.55, respectively (Figure 9). The average LR355 of polluted dust in the lower lidar layer (52 sr) is slightly higher than that in the upper lidar layer (46 sr). The smallest average PDR532 of the dust appeared at 0.51 km, about 0.22. While the averaged ECR355/532 and LR355 of the dust are the highest at 0.51 km, which are 1.65 and 51 sr, respectively. It is related to the mixing of anthropogenic aerosols in the lower lidar layer (Figure 3a–f, Figure S3g–l). The mean PDR532 of the dust gradually increased below 1.8 km, and the mean ECR355/532 profile and LR355 profile gradually decreased, suggesting that the influence of dust on the aerosol optical properties was strengthened. The average values of the PDR532, ECR355/532, and LR355 of the dust above 1.5 km are around 0.28, 1.28, and 43 sr, respectively. Thus, the dust aerosols in the lower lidar layer are usually affected by anthropogenic aerosols, exhibiting a lower PDR532, and higher ECR355/532 and LR355, while dust aerosols dominate the aerosols optical properties in the upper lidar layer.
We also investigated the trend of the average optical parameters of dust, polluted dust, and anthropogenic aerosols under different pollution levels (Figure 10). The PDR532 of anthropogenic aerosols, polluted dust, and dust fluctuated with the increase in EXT355, and the values are around 0.06, 0.15 and 0.32, respectively. The LR355 of anthropogenic aerosols present an enhancement when EXT355 is less than 1.0 km−1, which is increased from about 49 sr during light pollution (<0.5 km−1) to about 59 sr during heavy pollution (>1.0 km−1), implying that the particles absorption is enhanced under heavy pollution. There are no significant shifts in the LR355 of dust and polluted dust with the increase in EXT355. The ECR355/532 of dust, polluted dust, and anthropogenic aerosols gradually increased with the enhancement in the air pollution, especially under light pollution, suggesting an increase in fine-particle pollution. This is consistent with the results of ground particle size measurements, the increased air pollution in the BTH region is closely related to the generation of new particles [61]. When the EXT355 is less than 0.5, the ECR355/532 of polluted dust increased rapidly, which is significantly higher than that of anthropogenic aerosols, indicating that dust promotes the generation of new particles [62].

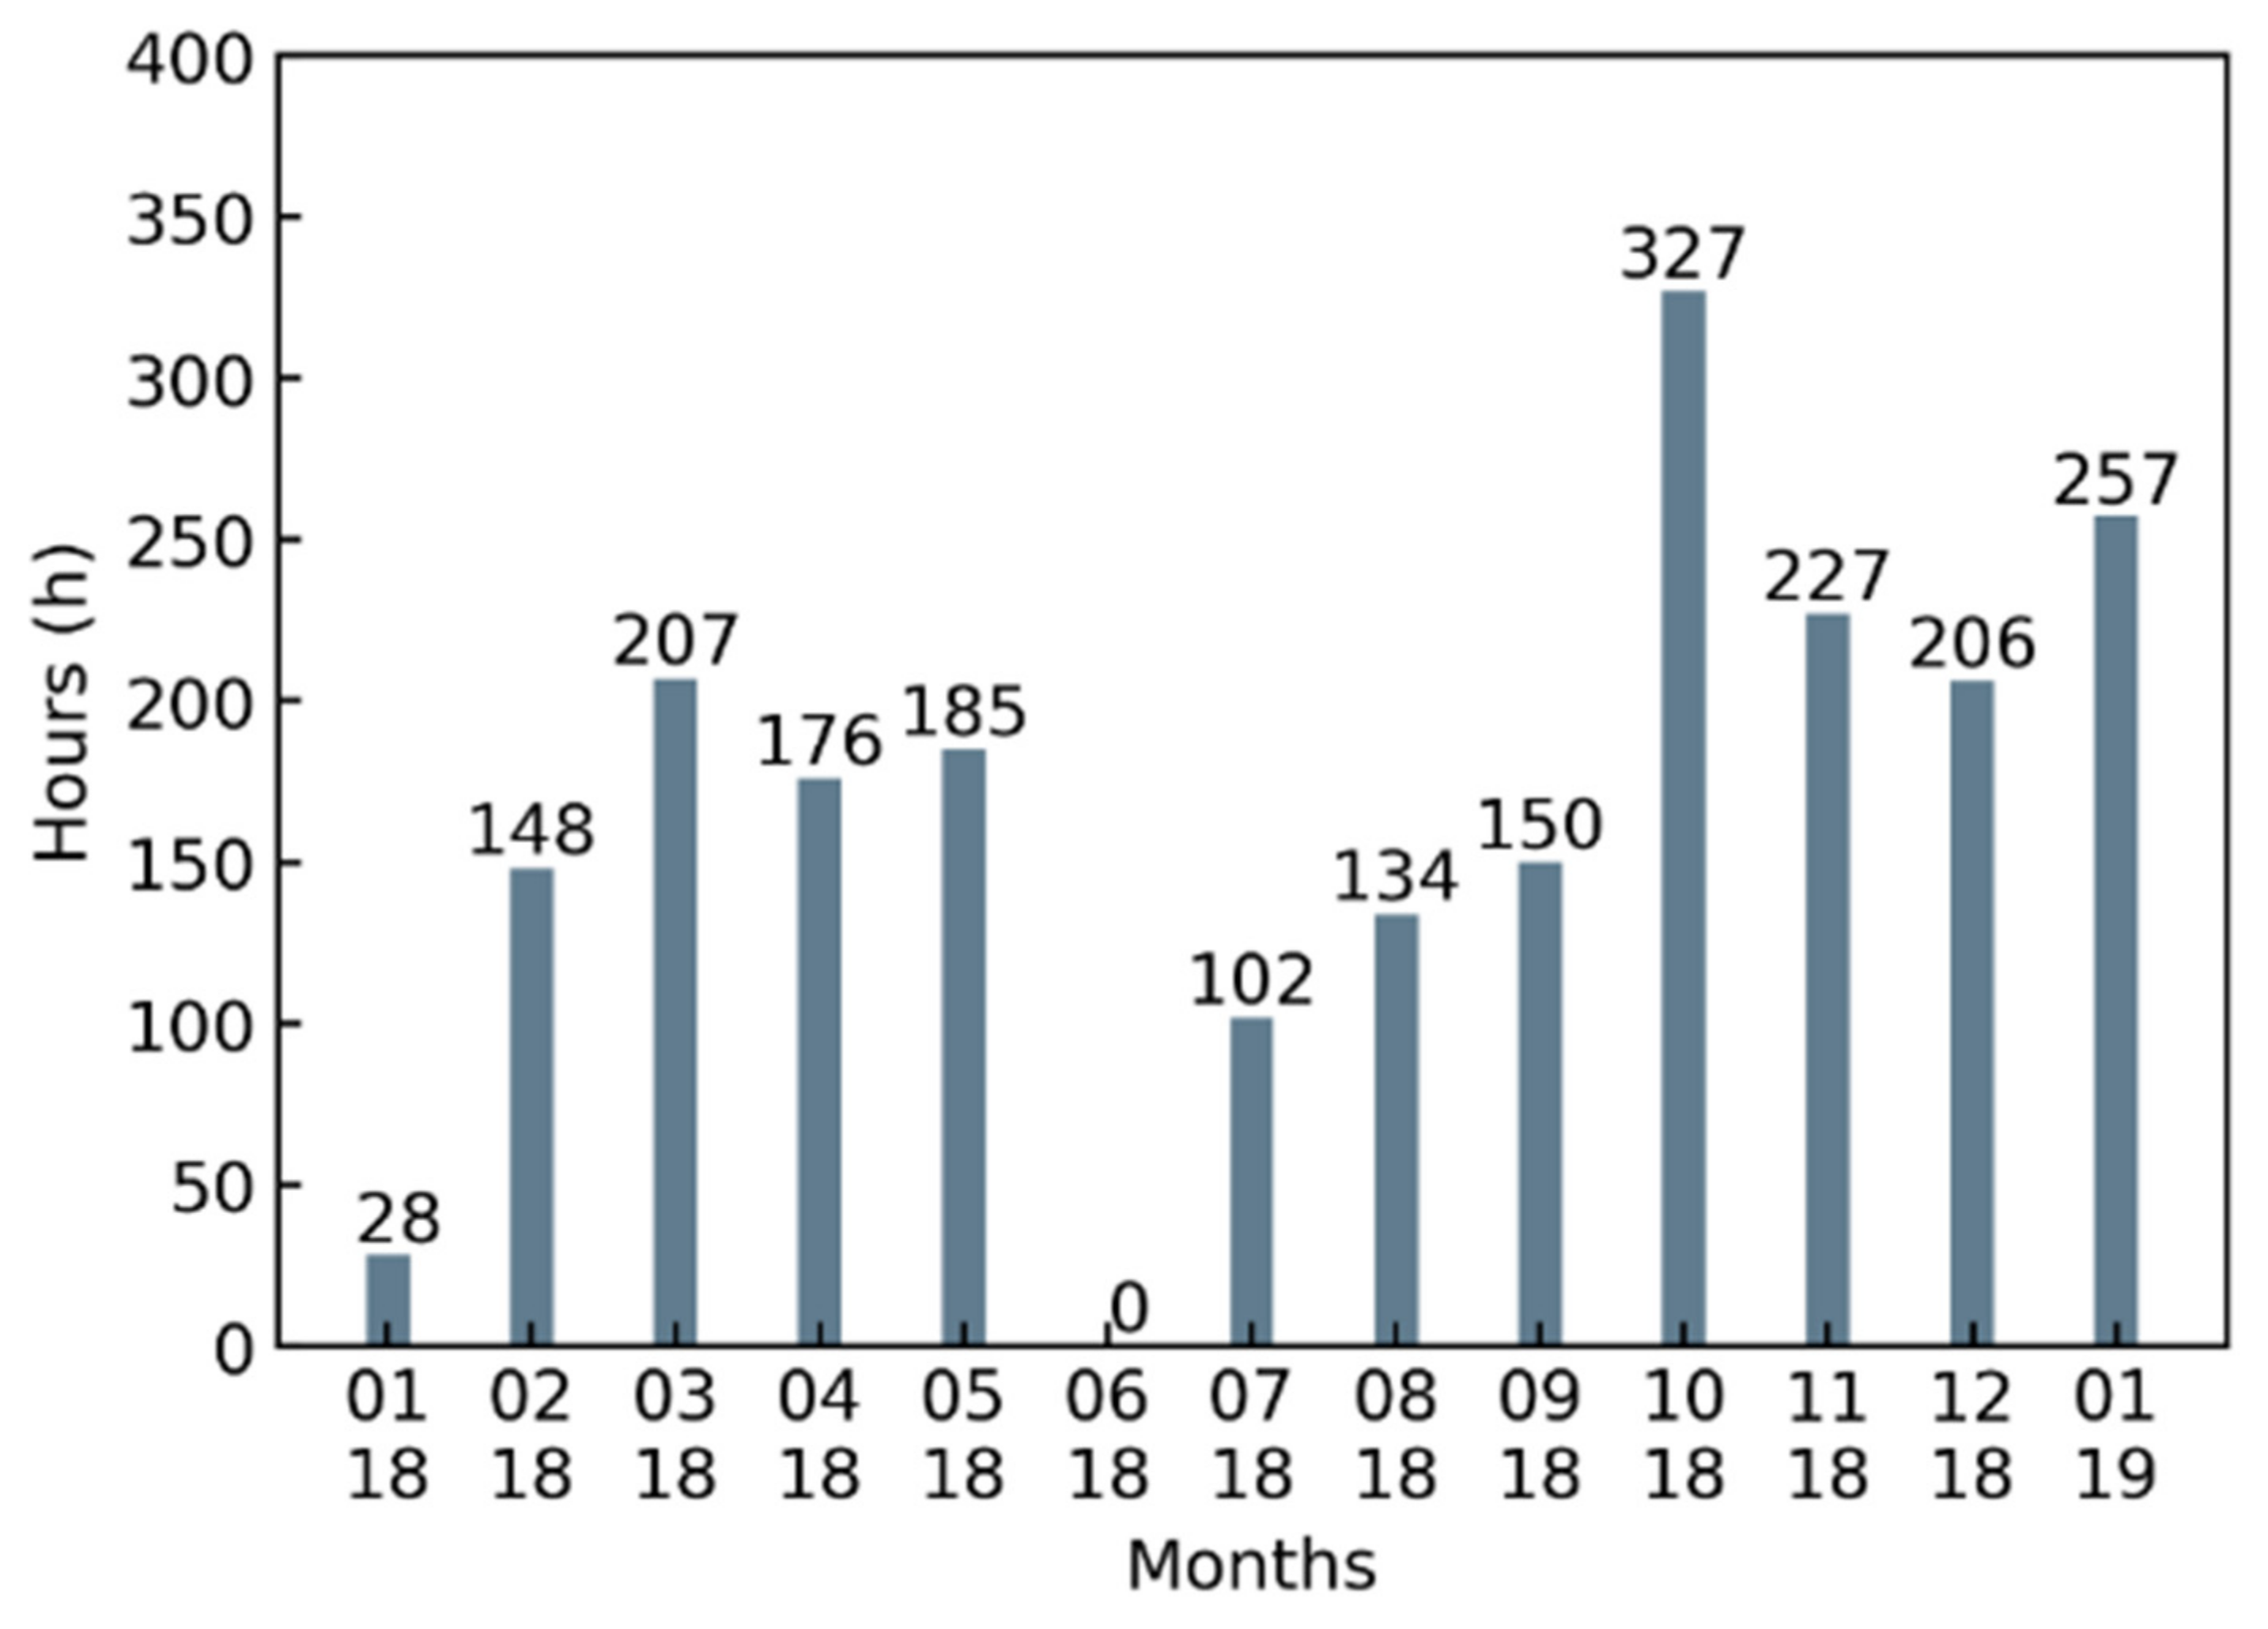
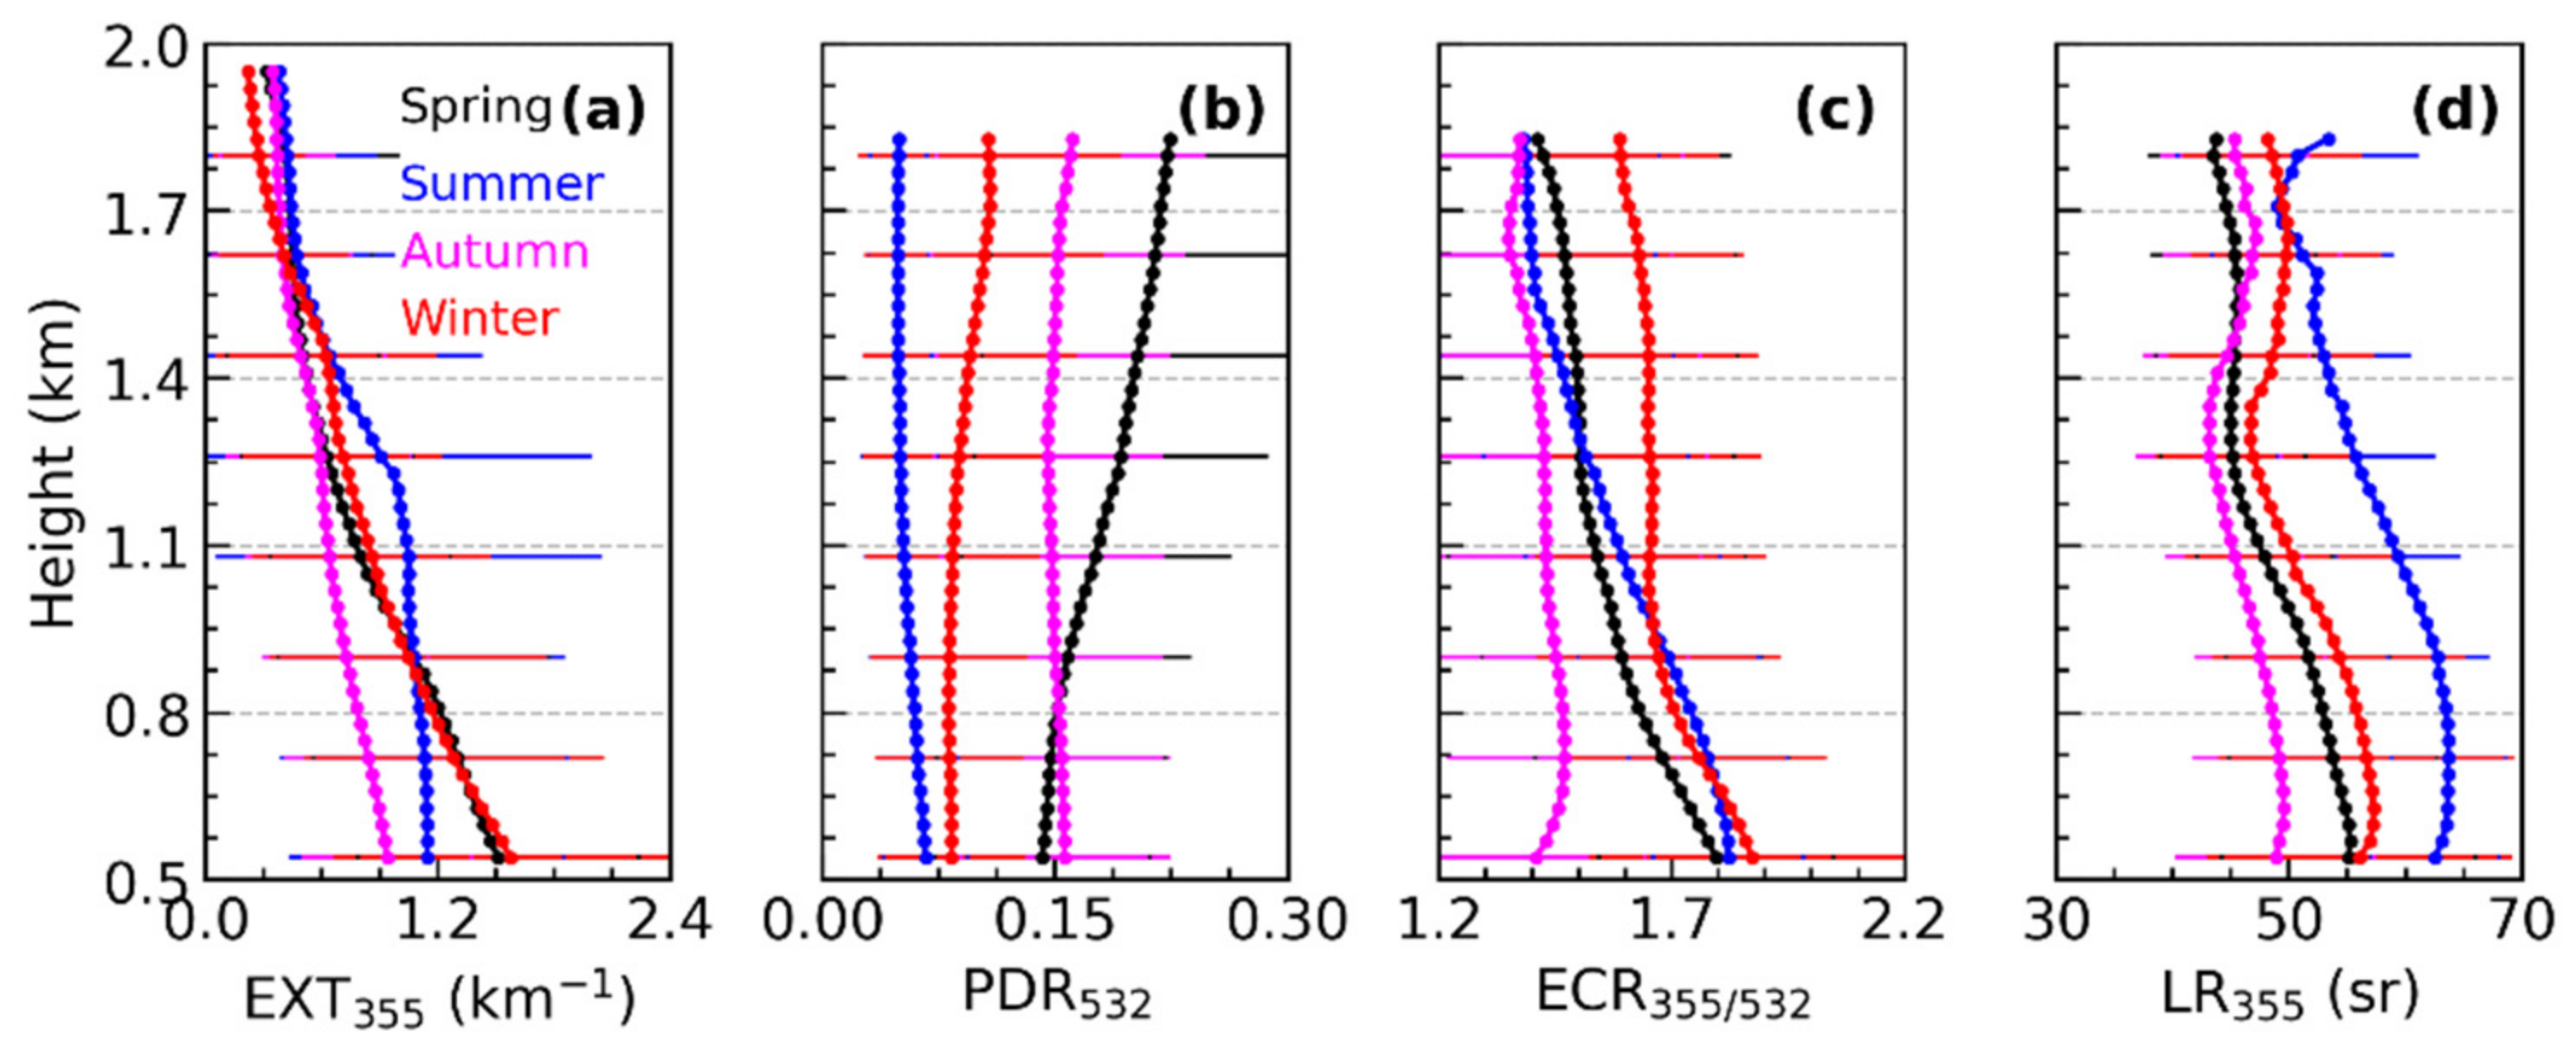
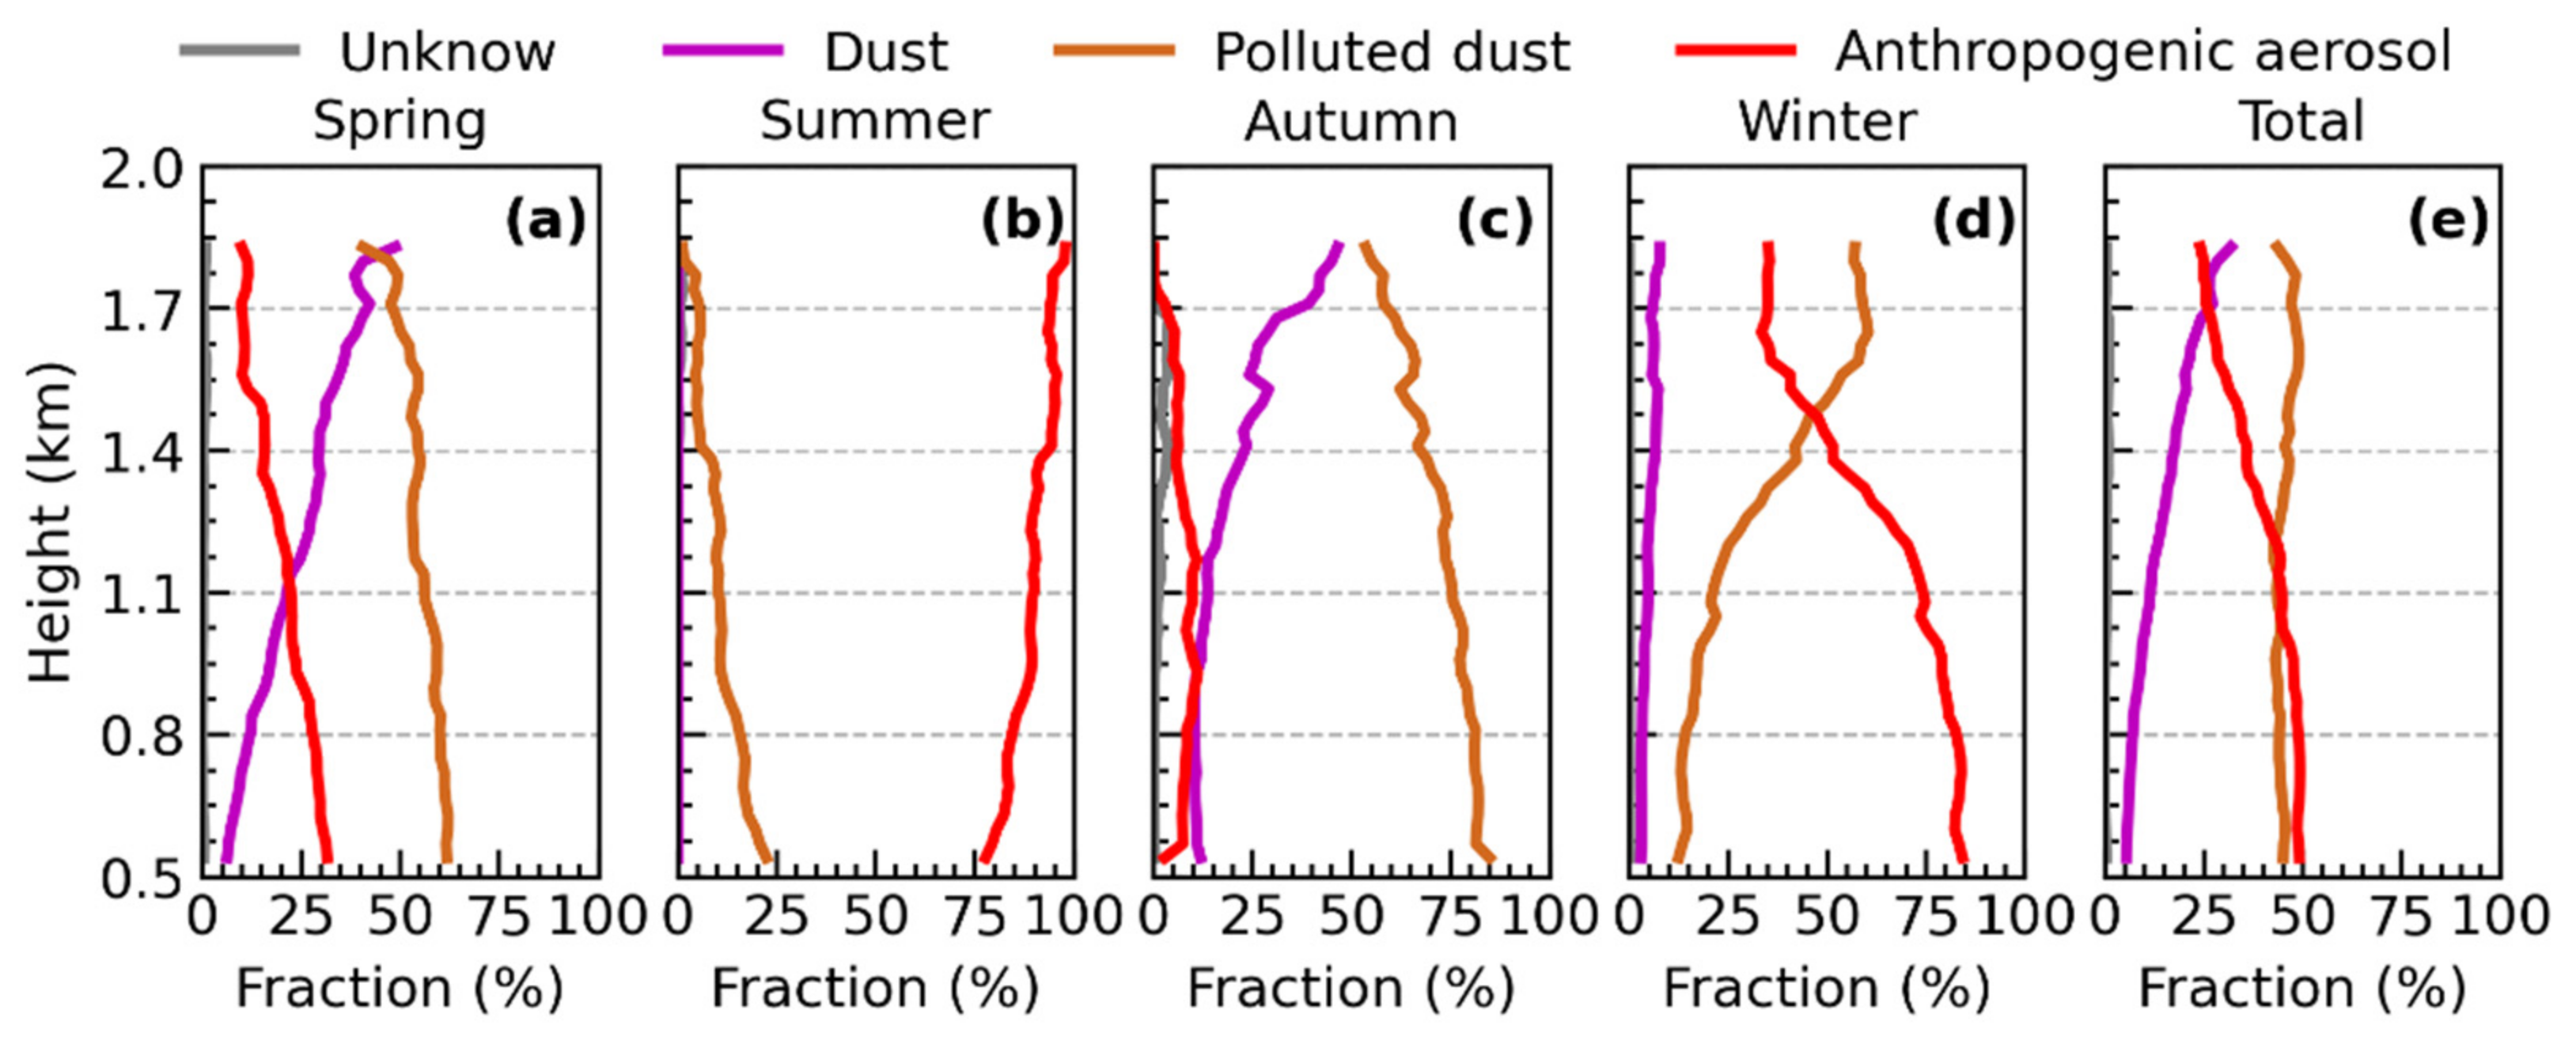
3.5. Contribution of Three Aerosol Types to Air Pollution in Different Seasons

The variation in the aerosol optical parameters in different seasons is primarily determined by the source of the particles. The EXT355 in spring, autumn and winter shows a smooth decrease with height, with a value of about 1.6 km−1 at 0.51 km in spring and winter, and about 1.0 km−1 at 0.51 km in autumn (Figure 11). Due to the reinforced vertical mixing ability of the atmosphere and the airborne transport of aerosols in summer, the high EXT355 (about 1.1 km−1) extends to 1.2 km, and then gradually decreases. In spring, the PDR532 is increased with the altitude due to the impact of upper dust transportation. The PDR532 changes a little with the height in summer and autumn, and the value from 0.04 to 0.06 in summer, which is considerably lower than 0.12–0.15 in autumn. The PDR532 in winter slightly increased with the height, from 0.08 at 0.51 km−1 to 0.11 at 1.8 km−1. The mean ECR355/532 profile in spring, summer, and winter decreased with the height, indicating that fine particles were mainly concentrated in the lower lidar layer. The ECR355/532 in winter decreased considerably from 1.87 to 1.65 between 0.51 km and 0.81 km, respectively, and then the ECR355/532 remained around 1.65. The ECR355/532 in spring declined rapidly between 0.51 km and 1.11 km (from 1.80 to 1.65, respectively). In summer, the ECR355/532 decreased the most with the height, from 1.82 to 1.4 between 0.51 km and 1.62 km, respectively. The maximum ECR355/532 in autumn was 1.47 at 0.7 km, then slowly down to 1.4 at 1.8 km. The maximum values of the LR355 in the four seasons are in the low lidar layer, of which summer is the largest (about 62 sr), followed by winter (about 57 sr), spring (about 54 sr), and autumn (about 49 sr). The mean values of PDR532, LR355, and ECR355/532 during the different seasons are listed in Table 2.
Figure 12 shows the relative contributions of key aerosol types in different seasons in the BTH region. The relative contribution of polluted dust in spring is greater than 50% below 1.7 km (Figure 12). The relative contribution of dust in spring is 5% at 0.51 km and there is a rapid growth to 50% at 1.8 km, while the contribution of anthropogenic aerosols decreases with height, from 31% to 10%. It implies that natural sources have a significant impact on spring air quality. The similar aerosol subtype contributions were also found in autumn, polluted dust is the main aerosol subtype with values greater than 80% in the lower lidar layer. The dust subtype contributions in autumn increased with the height, from 11% to 50%, and the relative contribution of anthropogenic aerosols was extremely low, usually less than 10%. Thus, natural sources play an important role in air pollution in spring and autumn in the BTH region, and controlling dust aerosols will help improve the air quality in spring and autumn.
The largest average LR355 and lowest average PDR532 occurred in summer, the values range from 55 sr to 65 sr and 0.04 to 0.06, respectively. It is the typical value for anthropogenic aerosols. Thus, more than 75% of the aerosol subtypes below 1.8 km in summer are anthropogenic aerosols. The contribution of polluted dust in summer is less than 25%, and this decreased with the height. There is no dust aerosol found in summer. Most of the haze pollution in the lower lidar layer in winter is related to human activities, over 80% are contributed by anthropogenic aerosols, and the contribution of polluted dust and dust in the lower lidar layer is 14% and 3%, respectively. Particularly, the contribution of polluted dust increased considerably in the range of 1.1–1.6 km, up to 60%. It is related to the meteorological conditions, the strong northwesterly winds usually prevailed in the upper lidar layer, and the southerly winds are dominated in the lower lidar layer, producing significant stratification of aerosols [30]. During our one-year observation, the proportion of anthropogenic aerosols, polluted dust and dust in the lower lidar layer are about 49%, 45%, and 6%, respectively. However, in the upper lidar layer, the proportion of anthropogenic aerosol decreased from 49% to 21%, the proportion of dust aerosol increased from 6% to 26%, and the proportion of polluted dust barely changed. Overall, the anthropogenic and natural sources jointly control the air pollution in the BTH region. Anthropogenic air pollution is dominant in summer, natural sources contribute significantly in spring and autumn. Anthropogenic aerosols and natural dust have deeply affected the wintertime low-level air quality and high-level air quality, respectively.

4. Discussions

In this work, the vertical distribution of aerosol optical parameters in the BTH region was obtained using ground-based MRL and compared with CALIPSO satellite measurements. The contribution of different aerosol types and mixtures to air pollution in the BTH area can be distinguished by combining PDR532, LR355, and ECR355/532 derived from MRL. There are the following three key aerosol types in the BTH region: moderately absorbed spherical fine particles (anthropogenic aerosols) contributed by human activities, scattered non-spherical coarse particles (dust) dominated by natural sources, and a mixture of the two aerosols (polluted dust).
In the comparison between the MRL and CALIPSO aerosol classification results, it was found that the dust aerosols are the best agreed, while differences in anthropogenic aerosols and polluted dust were found in several cases. The first reason may be that the threshold settings of polluted dust and dust PDR532 in our classification process are higher than those set in the CALISPO classification algorithm (0.09 vs 0.075, 0.23 vs 0.20, respectively). Secondly, the PDR532 of CALIPSO tends to be noisy, especially during the daytime. The noisy PDR532 of anthropogenic aerosols makes it easy to reach the PDR532 threshold of polluted dust or even dust, which will lead to the overuse of polluted dust and dust aerosols. The noisy CALIPSO PDR532 also causes a large deviation when compared with the MRL PDR532 (R = 0.67), the Pearson correlation is significantly lower than the comparison of EXT532 (R = 0.80) between CALIPSO and MRL, and the EXT532 measured by MRL is slightly higher than the EXT532 retrieved by CALIPSO. It was also found that CALIPSO results sometimes fail to determine aerosol stratification. In addition, the relative bias of LR between MRL and CALIPSO is within 25% in over 90% of the cases, indicating that the CALIPSO LR selection algorithm is reasonable.
According to our one year classification results, approximately 45% of the aerosols below 1.8 km are contributed by polluted dust. The contribution of dust increased with the height, from 6% to 28%, while the contribution of anthropogenic aerosols decreased from 49% to 25%. Also, the ECR355/532 and LR355 in the lower lidar layer are higher than those in the upper lidar layer, implying that the underlying aerosols are more absorbable fine particles. The seasonal variation in the aerosol classification results show that polluted dust is the major aerosol subtype in spring and autumn, and the relative contribution of polluted dust below 1.0 km in spring and autumn is over 60% and over 70%, respectively. The relative contribution of dust in spring and autumn increased with the height, which is deeply affected by the long-range transport of dust in the free troposphere. The smallest average PDR532 and the largest average LR355 were found in summer in the BTH region, anthropogenic aerosols contribute more than 75% of aerosol pollution, and the contribution of nature sources are insignificant. In winter, the anthropogenic aerosols prevailed (over 80%) in the lower lidar layer, while polluted dust (around 60%) dominated in the upper lidar layer. In addition, as the air pollution worsens, the ECR355/532 keeps increasing, especially in the lightly polluted conditions, suggesting that fine particles played an important role in the early stage of the haze events. The LR355 of anthropogenic aerosols increases with the aggravation of air pollution, the absorption of anthropogenic aerosols has been enhanced in heavily polluted conditions. The strengthened aerosol absorption will increase the atmospheric stability, and ultimately contribute to the aggravation of surface air pollution [63].
Our observation results, especially the vertical profile of different aerosol types, can also be integrated into the dust generation and convection and chemical migration models of the North China Plain. Lidar data assimilation has long been recognized for its potential to improve numerical modeling analyses [64]. Recent research presents the assimilation of CALIPSO extinction coefficient measurements in the chemistry transport model, they focus on the desert dust outbreak and found that the assimilation of CALIPSO lidar observations improves the statistics compared to the model-free run [65]. In addition, the vertical profile of the depolarization ratio and lidar ratio, as well as the aerosol classification results, can be used as the assimilation data of the model to optimize the simulation. With integrated information from various sources, i.e., numerical simulation, ground-based and satellite remote sensing, these results can more accurately describe the three-dimensional distribution pattern of aerosols.
Overall, our results present the aerosol vertical structure in the BTH region and identify the major aerosol types (over 99% of aerosols can be classified) and sources. Also, the results highlight that natural dust plays a crucial role in lower-layer air pollution in spring and autumn, while controlling anthropogenic aerosols will significantly improve the air quality in winter. Although the CALIPSO measurements can cover the whole world, the temporary resolution of a particular area is obviously insufficient, which can be remedied by ground remote sensing. Combining satellite and ground-based MRL observations, accurate aerosol type and high spatial and temporal resolution aerosol vertical distribution can be obtained, which is expected to assess the contribution of anthropogenic and natural sources to heavy haze pollution.

Supplementary Materials

The following are available online at https://0-www-mdpi-com.brum.beds.ac.uk/article/10.3390/rs13091811/s1, Figures S1–S13.

Author Contributions

Conceptualization, C.L., Q.H. and Y.D.; data curation, Z.W. and Y.D.; formal analysis, Z.W.; funding acquisition, C.L. and Q.H.; investigation, Z.W., C.L., Q.H. and Y.D.; methodology, Z.W., C.L., Q.H. and Y.D.; project administration, Z.W., H.L., C.X. and W.T.; resources, C.L.; software, Z.W., C.L., Q.H. and Y.D.. All authors have read and agreed to the published version of the manuscript.

Funding

This research was supported by grants from the National Key Research and Development Program of China (No.2018YFC0213201, 2017YFC0210002 and 2018YFC0213104), the National Natural Science Foundation of China (No. 41722501, 51778596, and 41977184), Anhui Science and Technology Major Project (No. 18030801111), the Strategic Priority Research Program of the Chinese Academy of Sciences (No. XDA23020301), the Major Projects of High Resolution Earth Observation Systems of National Science and Technology (05-Y30B01-9001-19/20-3), the Youth Innovation Promotion Association of CAS (2021443), and the Young Talent Project of the Center for Excellence in Regional Atmospheric Environment, CAS (CERAE202004).

Institutional Review Board Statement

Not applicable.

Informed Consent Statement

Not applicable.

Data Availability Statement

All code/data needed to evaluate the conclusions in the paper are present in the paper and/or the Supplementary Materials. Additional code/data related to this paper may be requested from the authors.

Acknowledgments

The authors acknowledge the National Oceanic and Atmospheric Administration (NOAA) Air Resources Laboratory (ARL) for the provision of the HYSPLIT transport and dispersion model used in this publication. We thank NASA Langley Research Center Atmospheric Sciences Data Center for providing the CALIPSO data.

Conflicts of Interest

The authors declare no conflict of interest.

References

  1. Sokolik, I.N.; Winker, D.M.; Bergametti, G.; Gillette, D.A.; Carmichael, G.; Kaufman, Y.J.; Gomes, L.; Schuetz, L.; Penner, J.E. Introduction to special section: Outstanding problems in quantifying the radiative impacts of mineral dust. Geophys. Res. Lett. 2001, 106, 15–18. [Google Scholar] [CrossRef]
  2. Zhang, C.; Liu, C.; Chan, K.L.; Hu, Q.; Liu, H.; Li, B.; Xing, C.; Tan, W.; Zhou, H.; Si, F.; et al. First observation of tropospheric nitrogen dioxide from the Environmental Trace Gases Monitoring Instrument onboard the GaoFen-5 satellite. Light. Sci. Appl. 2020, 9, 66. [Google Scholar] [CrossRef] [PubMed] [Green Version]
  3. Zhang, C.; Liu, C.; Hu, Q.; Cai, Z.; Su, W.; Xia, C.; Zhu, Y.; Wang, S.; Liu, J. Satellite UV-Vis spectroscopy: Implications for air quality trends and their driving forces in China during 2005–2017. Light. Sci. Appl. 2019, 8, 100. [Google Scholar] [CrossRef] [Green Version]
  4. Zhang, Q.; Zheng, Y.; Tong, D.; Shao, M.; Wang, S.; Zhang, Y.; Xu, X.; Wang, J.; He, H.; Liu, W.; et al. Drivers of improved PM2.5 air quality in China from 2013 to 2017. Proc. Natl. Acad. Sci. USA 2019, 116, 24463–24469. [Google Scholar] [CrossRef] [Green Version]
  5. Chang, X.; Wang, S.; Zhao, B.; Cai, S.; Hao, J. Assessment of inter-city transport of particulate matter in the Beijing-Tianjin-Hebei region. Atmos. Chem. Phys. 2018, 18, 4843–4858. [Google Scholar] [CrossRef]
  6. Li, H.; Duan, F.; Ma, Y.; He, K.; Zhu, L.; Ma, T.; Ye, S.; Yang, S.; Huang, T.; Kimoto, T. Case study of spring haze in Beijing: Characteristics, formation processes, secondary transition, and regional transportation. Environ. Pollut. 2018, 242, 544–554. [Google Scholar] [CrossRef] [PubMed]
  7. Zhang, H.; Cheng, S.; Wang, X.; Yao, S.; Zhu, F. Continuous monitoring, compositions analysis and the implication of regional transport for submicron and fine aerosols in Beijing, China. Atmos. Environ. 2018, 195, 30–45. [Google Scholar] [CrossRef]
  8. Ouyang, W.; Xu, Y.; Cao, J.; Gao, X.; Gao, B.; Hao, Z.; Lin, C. Rainwater characteristics and interaction with atmospheric particle matter transportation analyzed by remote sensing around Beijing. Sci. Total Environ. 2019, 651, 532–540. [Google Scholar] [CrossRef]
  9. Zhang, Y.; Chen, J.; Yang, H.; Li, R.; Yu, Q. Seasonal variation and potential source regions of PM2.5-bound PAHs in the megacity Beijing, China: Impact of regional transport. Environ. Pollut. 2017, 231, 329–338. [Google Scholar] [CrossRef]
  10. Sun, J.; Zhang, M.; Liu, T. Spatial and temporal characteristics of dust storms in China and its surrounding regions, 1960–1999: Relations to source area and climate. J. Geophys. Res. Atmos. 2001, 106, 10325–10333. [Google Scholar] [CrossRef]
  11. Ansmann, A.; Wandinger, U.; Riebesell, M.; Weitkamp, C.; Michaelis, W. Independent measurement of extinction and backscatter profiles in cirrus clouds by using a combined Raman elastic-backscatter lidar. Appl. Opt. 1992, 31, 7113–7131. [Google Scholar] [CrossRef]
  12. Esselborn, M.; Wirth, M.; Fix, A.; Tesche, M.; Ehret, G. Airborne high spectral resolution lidar for measuring aerosol extinction and backscatter coefficients. Appl. Opt. 2008, 47, 346–358. [Google Scholar] [CrossRef]
  13. Piironen, P.; Eloranta, E.W. Demonstration of a high-spectral-resolution lidar based on an iodine absorption filter. Opt. Lett. 1994, 19, 234–236. [Google Scholar] [CrossRef]
  14. Burton, S.P.; Ferrare, R.A.; Hostetler, C.A.; Hair, J.W.; Rogers, R.R.; Obland, M.D.; Butler, C.F.; Cook, A.L.; Harper, D.B.; Froyd, K.D. Aerosol classification using airborne High Spectral Resolution Lidar measurements—Methodology and examples. Atmos. Meas. Tech. 2012, 5, 73–98. [Google Scholar] [CrossRef] [Green Version]
  15. Burton, S.P.; Ferrare, R.A.; Vaughan, M.A.; Omar, A.H.; Rogers, R.R.; Hostetler, C.A.; Hair, J.W. Aerosol classification from airborne HSRL and comparisons with the CALIPSO vertical feature mask. Atmos. Meas. Tech. 2013, 6, 1397–1412. [Google Scholar] [CrossRef] [Green Version]
  16. Burton, S.P.; Vaughan, M.A.; Ferrare, R.A.; Hostetler, C.A. Separating mixtures of aerosol types in airborne High Spectral Resolution Lidar data. Atmos. Meas. Tech. 2014, 7, 419–436. [Google Scholar] [CrossRef] [Green Version]
  17. de Foy, B.; Burton, S.P.; Ferrare, R.A.; Hostetler, C.A.; Hair, J.W.; Wiedinmyer, C.; Molina, L.T. Aerosol plume transport and transformation in high spectral resolution lidar measurements and WRF-Flexpart simulations during the MILAGRO Field Campaign. Atmos. Chem. Phys. 2011, 11, 3543–3563. [Google Scholar] [CrossRef] [Green Version]
  18. Groß, S.; Esselborn, M.; Weinzierl, B.; Wirth, M.; Fix, A.; Petzold, A. Aerosol classification by airborne high spectral resolution lidar observations. Atmos. Chem. Phys. 2013, 13, 2487–2505. [Google Scholar] [CrossRef] [Green Version]
  19. Groß, S.; Freudenthaler, V.; Schepanski, K.; Toledano, C.; Schäfler, A.; Ansmann, A.; Weinzierl, B. Optical properties of long-range transported Saharan dust over Barbados as measured by dual-wavelength depolarization Raman lidar measurements. Atmos. Chem. Phys. 2015, 15, 11067–11080. [Google Scholar] [CrossRef] [Green Version]
  20. Groß, S.; Tesche, M.; Freudenthaler, V.; Toledano, C.; Wiegner, M.; Ansmann, A.; Althausen, D.; Seefeldner, M. Characterization of Saharan dust, marine aerosols and mixtures of biomass-burning aerosols and dust by means of multi-wavelength depolarization and Raman lidar measurements during SAMUM 2. Tellus B 2017, 63, 706–724. [Google Scholar] [CrossRef]
  21. Weinzierl, B.; Sauer, D.; Esselborn, M.; Petzold, A.; Veira, A.; Rose, M.; Mund, S.; Wirth, M.; Ansmann, A.; Tesche, M.; et al. Microphysical and optical properties of dust and tropical biomass burning aerosol layers in the Cape Verde region-an overview of the airborne in situ and lidar measurements during SAMUM-2. Tellus B 2011, 63, 589–618. [Google Scholar] [CrossRef] [Green Version]
  22. Li, Z.; Guo, J.; Ding, A.; Liao, H.; Liu, J.; Sun, Y.; Wang, T.; Xue, H.; Zhang, H.; Zhu, B. Aerosol and boundary-layer interactions and impact on air quality. Natl. Sci. Rev. 2017, 4, 810–833. [Google Scholar] [CrossRef]
  23. Tesche, M.; Ansmann, A.; Müller, D.; Althausen, D.; Engelmann, R.; Hu, M.; Zhang, Y. Particle backscatter, extinction, and lidar ratio profiling with Raman lidar in south and north China. Appl. Opt. 2007, 46, 6302–6308. [Google Scholar] [CrossRef] [PubMed]
  24. Xie, C.; Nishizawa, T.; Sugimoto, N.; Matsui, I.; Wang, Z. Characteristics of aerosol optical properties in pollution and Asian dust episodes over Beijing, China. Appl. Opt. 2008, 47, 4945–4951. [Google Scholar] [CrossRef] [PubMed]
  25. Hänel, A.; Baars, H.; Althausen, D.; Ansmann, A.; Engelmann, R.; Sun, J.Y. One-year aerosol profiling with EUCAARI Raman lidar at Shangdianzi GAW station: Beijing plume and seasonal variations. J. Geophys. Res. Atmos. 2012, 117, D13201. [Google Scholar] [CrossRef] [Green Version]
  26. Kim, M.; Omar, A.; Tackett, J.L.; Vaughan, M.A.; Winker, D.M.; Trepte, C.R.; Hu, Y.; Liu, Z.; Poole, L.R.; Pitts, M.C. The CALIPSO version 4 automated aerosol classification and lidar ratio selection algorithm. Atmos. Meas. Tech. 2018, 11, 6107–6135. [Google Scholar] [CrossRef] [PubMed] [Green Version]
  27. Omar, A.H.; Winker, D.M.; Vaughan, M.A.; Hu, Y.; Trepte, C.R.; Ferrare, R.A.; Lee, K.-P.; Hostetler, C.A.; Kittaka, C.; Rogers, R.R.; et al. The CALIPSO Automated Aerosol Classification and Lidar Ratio Selection Algorithm. J. Atmos. Oceanic Technol. 2009, 26, 1994–2014. [Google Scholar] [CrossRef]
  28. Draxler, R.R.; Hess, G. An overview of the HYSPLIT_4 modelling system for trajectories. Aust. Meteorol. Mag. 1998, 47, 295–308. [Google Scholar]
  29. Ji, X.; Liu, C.; Xie, Z.; Hu, Q.; Dong, Y.; Fan, G.; Zhang, T.; Xing, C.; Wang, Z.; Javed, Z.; et al. Comparison of mixing layer height inversion algorithms using lidar and a pollution case study in Baoding, China. J. Environ. Sci. 2019, 79, 81–90. [Google Scholar] [CrossRef]
  30. Wang, Z.; Liu, C.; Xie, Z.; Hu, Q.; Andreae, M.O.; Dong, Y.; Zhao, C.; Liu, T.; Zhu, Y.; Liu, H.; et al. Elevated dust layers inhibit dissipation of heavy anthropogenic surface air pollution. Atmos. Chem. Phys. 2020, 20, 14917–14932. [Google Scholar] [CrossRef]
  31. Ansmann, A.; Riebesell, M.; Wandinger, U.; Weitkamp, C.; Voss, E.; Lahmann, W.; Michaelis, W. Combined Raman elastic-backscatter lidar for vertical profiling of moisture, aerosol extinction, backscatter, and lidar ratio. Appl. Opt. 1992, 55, 18–28. [Google Scholar] [CrossRef]
  32. Ansmann, A.; Riebesell, M.; Weitkamp, C. Measurement of atmospheric aerosol extinction profiles with a Raman lidar. Opt. Lett. 1990, 15, 746–748. [Google Scholar] [CrossRef]
  33. Wandinger, U.; Ansmann, A. Experimental determination of the lidar overlap profile with Raman lidar. Appl. Opt. 2002, 41, 511–514. [Google Scholar] [CrossRef]
  34. Fernald, F.G. Analysis of atmospheric lidar observations: Some comments. Appl. Opt. 1984, 23, 652–653. [Google Scholar] [CrossRef]
  35. Klett, J.D. Stable analytical inversion solution for processing lidar returns. Appl. Opt. 1981, 20, 211–220. [Google Scholar] [CrossRef] [Green Version]
  36. Sugimoto, N.; Matsui, I.; Shimizu, A.; Uno, I.; Asai, K.; Endoh, T.; Nakajima, T. Observation of dust and anthropogenic aerosol plumes in the northwest Pacific with a two-wavelength polarization lidar on board the research vessel Mirai. Geophys. Res. Lett. 2002, 29, 1901. [Google Scholar] [CrossRef] [Green Version]
  37. Freudenthaler, V.; Esselborn, M.; Wiegner, M.; Heese, B.; Tesche, M.; Ansmann, A.; Müller, D.; Althausen, D.; Wirth, M.; Fix, A. Depolarization ratio profiling at several wavelengths in pure Saharan dust during SAMUM 2006. Tellus B 2009, 61, 165–179. [Google Scholar] [CrossRef] [Green Version]
  38. Tesche, M.; Ansmann, A.; Müller, D.; Althausen, D.; Engelmann, R.; Freudenthaler, V.; Groß, S. Vertically resolved separation of dust and smoke over Cape Verde using multiwavelength Raman and polarization lidars during Saharan Mineral Dust Experiment 2008. J. Geophys. Res. Atmos. 2009, 114, D13202. [Google Scholar] [CrossRef]
  39. Heese, B.; Flentje, H.; Althausen, D.; Ansmann, A.; Frey, S. Ceilometer lidar comparison: Backscatter coefficient retrieval and signal-to-noise ratio determination. Atmos. Meas. Tech. 2010, 3, 1763–1770. [Google Scholar] [CrossRef] [Green Version]
  40. Müller, D.; Ansmann, A.; Mattis, I.; Tesche, M.; Wandinger, U.; Althausen, D.; Pisani, G. Aerosol-type-dependent lidar ratios observed with Raman lidar. J. Geophys. Res. 2007, 112, D16202. [Google Scholar] [CrossRef]
  41. Hunt, W.H.; Winker, D.M.; Vaughan, M.A.; Powell, K.A.; Lucker, P.L.; Weimer, C. CALIPSO Lidar Description and Performance Assessment. J. Atmos. Oceanic Technol. 2009, 26, 1214–1228. [Google Scholar] [CrossRef]
  42. Liu, Z.; Vaughan, M.; Winker, D.; Kittaka, C.; Getzewich, B.; Kuehn, R.; Omar, A.; Powell, K.; Trepte, C.; Hostetler, C. The CALIPSO Lidar Cloud and Aerosol Discrimination: Version 2 Algorithm and Initial Assessment of Performance. J. Atmos. Oceanic Technol. 2009, 26, 1198–1213. [Google Scholar] [CrossRef]
  43. Young, S.A.; Vaughan, M.A.; Kuehn, R.E.; Winker, D.M. The retrieval of profiles of particulate extinction from Cloud Aerosol Lidar Infrared Pathfinder Satellite Observations (CALIPSO) data: Uncertainty and error sensitivity analyses. J. Atmos. Ocean. Tech. 2016, 33, 1795–1798. [Google Scholar] [CrossRef]
  44. Holben, B.N.; Eck, T.F.; Slutsker, I.; Tanre, D.; Buis, J.; Setzer, A.; Vermote, E.; Reagan, J.; Kaufman, Y.; Nakajima, T. AERONET: A federated instrument network and data archive for aerosol characterization. Remote Sens. Environ. 1998, 66, 1–16. [Google Scholar] [CrossRef]
  45. Winker, D.M.; Tackett, J.L.; Getzewich, B.J.; Liu, Z.; Vaughan, M.A.; Rogers, R.R. The global 3-D distribution of tropospheric aerosols as characterized by CALIOP. Atmos. Chem. Phys. 2013, 13, 3345–3361. [Google Scholar] [CrossRef] [Green Version]
  46. Anderson, T.L.; Charlson, R.J.; Winker, D.M.; Ogren, J.A.; Holmén, K. Mesoscale variations of tropospheric aerosols. J. Atmos. Sci. 2003, 60, 119–136. [Google Scholar] [CrossRef]
  47. Tesche, M.; Wandinger, U.; Ansmann, A.; Althausen, D.; Müller, D.; Omar, A.H. Ground-based validation of CALIPSO observations of dust and smoke in the Cape Verde region. J. Geophys. Res. Atmos. 2013, 118, 2889–2902. [Google Scholar] [CrossRef]
  48. Tesche, M.; Ansmann, A.; Muller, D.; Althausen, D.; Mattis, I.; Heese, B.; Freudenthaler, V.; Wiegner, M.; Esselborn, M.; Pisani, G. Vertical profiling of Saharan dust with Raman lidars and airborne HSRL in southern Morocco during SAMUM. Tellus B 2009, 61, 144–164. [Google Scholar] [CrossRef] [Green Version]
  49. Liu, Y.; Tang, G.; Zhou, L.; Hu, B.; Liu, B.; Li, Y.; Liu, S.; Wang, Y. Mixing layer transport flux of particulate matter in Beijing, China. Atmos. Chem. Phys. 2019, 19, 9531–9540. [Google Scholar] [CrossRef] [Green Version]
  50. Zongming Tao, Z.T.; Dong Liu, D.L.; Zhiqing Zhong, Z.Z.; Bo Shi, B.S.; Miao Nie, M.N.; Xiaomin Ma, X.M.; Jun Zhou, J.Z. Measurements of cirrus clouds with a three-wavelength lidar. Chin. Opt. Lett. 2012, 10, 050101–050103. [Google Scholar] [CrossRef]
  51. Sakai, T.; Nagai, T.; Nakazato, M.; Mano, Y.; Matsumura, T. Ice clouds and Asian dust studied with lidar measurements of particle extinction-to-backscatter ratio, particle depolarization, and water-vapor mixing ratio over Tsukuba. Appl. Opt. 2003, 42, 7103–7116. [Google Scholar] [CrossRef]
  52. Noel, V.; Chepfer, H.; Ledanois, G.; Delaval, A.; Flamant, P.H. Classification of particle effective shape ratios in cirrus clouds based on the lidar depolarization ratio. Appl. Opt. 2002, 41, 4245–4257. [Google Scholar] [CrossRef]
  53. Chen, W.-N.; Chiang, C.-W.; Nee, J.-B. Lidar ratio and depolarization ratio for cirrus clouds. Appl. Opt. 2002, 41, 6470. [Google Scholar] [CrossRef]
  54. Reichardt, J.; Reichardt, S.; Behrendt, A.; McGee, T.J. Correlations among the optical properties of cirrus-cloud particles: Implications for spaceborne remote sensing. Geophys. Res. Lett. 2002, 29, 1668. [Google Scholar] [CrossRef]
  55. Voudouri, K.A.; Giannakaki, E.; Komppula, M.; Balis, D. Variability in cirrus cloud properties using a PollyXT Raman lidar over high and tropical latitudes. Atmos. Chem. Phys. 2020, 20, 4427–4444. [Google Scholar] [CrossRef] [Green Version]
  56. Janicka, L.; Stachlewska, I.S. Properties of biomass burning aerosol mixtures derived at fine temporal and spatial scales from Raman lidar measurements: Part I optical properties. Atmos. Chem. Phys. Discuss. 2019, 1–46. [Google Scholar] [CrossRef] [Green Version]
  57. Giannakaki, E.; van Zyl, P.G.; Müller, D.; Balis, D.; Komppula, M. Optical and microphysical characterization of aerosol layers over South Africa by means of multi-wavelength depolarization and Raman lidar measurements. Atmos. Chem. Phys. 2016, 16, 8109–8123. [Google Scholar] [CrossRef] [Green Version]
  58. Sakai, T.; Shibata, T.; Iwasaka, Y.; Nagai, T.; Nakazato, M.; Matsumura, T.; Ichiki, A.; Kim, Y.-S.; Tamura, K.; Troshkin, D. Case study of Raman lidar measurements of Asian dust events in 2000 and 2001 at Nagoya and Tsukuba, Japan. Atmos. Environ. 2002, 36, 5479–5489. [Google Scholar] [CrossRef]
  59. Murayama, T.; Masonis, S.J.; Redemann, J.; Anderson, T.L.; Schmid, B.; Livingston, J.M.; Russell, P.B.; Huebert, B.; Howell, S.G.; McNaughton, C.S.; et al. An intercomparison of lidar-derived aerosol optical properties with airborne measurements near Tokyo during ACE-Asia. J. Geophys. Res. 2003, 108, 8651. [Google Scholar] [CrossRef] [Green Version]
  60. Vaughan, M.A.; Powell, K.A.; Winker, D.M.; Hostetler, C.A.; Kuehn, R.E.; Hunt, W.H.; Getzewich, B.J.; Young, S.A.; Liu, Z.; McGill, M.J. Fully Automated Detection of Cloud and Aerosol Layers in the CALIPSO Lidar Measurements. J. Atmos. Ocean. Tech. 2009, 26, 2034–2050. [Google Scholar] [CrossRef]
  61. Guo, S.; Hu, M.; Zamora, M.L.; Peng, J.; Shang, D.; Zheng, J.; Du, Z.; Wu, Z.; Shao, M.; Zeng, L.; et al. Elucidating severe urban haze formation in China. Proc. Natl. Acad. Sci. USA 2014, 111, 17373–17378. [Google Scholar] [CrossRef] [Green Version]
  62. Nie, W.; Ding, A.; Wang, T.; Kerminen, V.M.; George, C.; Xue, L.; Wang, W.; Zhang, Q.; Petaja, T.; Qi, X.; et al. Polluted dust promotes new particle formation and growth. Sci. Rep. 2014, 4, 6634. [Google Scholar] [CrossRef] [PubMed] [Green Version]
  63. Ding, A.; Huang, X.; Nie, W.; Sun, J.; Kerminen, V.M.; Petäjä, T.; Su, H.; Cheng, Y.; Yang, X.Q.; Wang, M. Enhanced haze pollution by black carbon in megacities in China. Geophys. Res. Lett. 2016, 43, 2873–2879. [Google Scholar] [CrossRef]
  64. Zhang, J.; Campbell, J.R.; Reid, J.S.; Westphal, D.L.; Baker, N.L.; Campbell, W.F.; Hyer, E.J. Evaluating the impact of assimilating CALIOP-derived aerosol extinction profiles on a global mass trans-port model. Geophys. Res. Lett. 2011, 38, L14801. [Google Scholar] [CrossRef] [Green Version]
  65. El Amraoui, L.; Sič, B.; Piacentini, A.; Marécal, V.; Frebourg, N.; Attié, J.-L. Aerosol data assimilation in the MOCAGE chemical transport model during the TRAQA/ChArMEx campaign: Lidar observations. Atmos. Meas. Tech. 2020, 13, 4645–4667. [Google Scholar] [CrossRef]
Figure 1. Cluster analysis of 120-h air mass backward trajectories initialized at 500 m (red) and 1500 m (blue). (a) Case of dust aerosol from 7:00 on 31 March to 22:00 on 2 April, (b) case of anthropogenic aerosol from 14:00 on 3 July to 21:00 on 6 July, and (c) case of polluted dust from 17:00 on 1 November to 23:00 on 3 November. The numbers in the bottom left are the fraction of each category of air mass backward trajectories. The 120-h air mass backward trajectories (AMBTs) were computed using the hybrid single-particle Lagrangian integrated trajectory (HYSPLIT) model of the National Oceanic and Atmospheric Administration [28]. We calculated the hourly AMBTs during the whole observation period initialized at 500 m and 1500 m. Then, cluster analysis of AMBTs was conducted in two categories directions. Base map is from TrajStat 1.2.2 software (http://www.meteothinker.com) (accessed on 13 April 2021).
Remotesensing 13 01811 g001
Figure 2. Data coverage from 26 January 2018 to 16 January 2019.
Remotesensing 13 01811 g002
Figure 3. Time–height plots of the extinction coefficient at 355 nm (EXT355), EXT532, extinction color ratio (ECR355/532), particle linear depolarization ratio (PDR532), lidar ratio (LR355), and classification results from (af) 7:43 on 31 March to 22:45 on 2 April, (gl) 14:48 on 3 July to 21:47 on 6 July, and (mr) 17:04 on 1 November to 23:38 on 3 November.
Remotesensing 13 01811 g003
Figure 4. The CALIPSO observations compared with MRL. Latitude–height plots of the aerosol subtype mask and profile comparison of the EXT532, PDR532, and lidar ratio on (ad) 1 April, (eh) 6 July, and (il) 3 November. CALIPSO assumed LR532 and MRL retrieves LR355. The envelopes in MRL profiles represent the errors at each altitude. The CALIPSO overpasses that occurred at a distance of less than 90 km and a temporal difference of less than 1 h were selected for profile comparison.
Remotesensing 13 01811 g004
Figure 5. Characteristics of key aerosol types in Beijing–Tianjin–Hebei (BTH) region measured by MRL. Two-dimensional projections of (a) PDR532 versus ECR355/532, (b) LR355 versus PDR532, and (c) ECR355/532 versus LR355 are color-coded by inferred aerosol types, the saturation of each hue represents the relative population density. The frequency distribution of (d) PDR532, (e) LR355, and (f) ECR355/532 of key aerosol types in BTH region, as well as the the number of points (n) of each aerosol type measured by MRL.
Remotesensing 13 01811 g005
Figure 6. Flowchart of aerosol type classification in BTH region according to PDR532, LR355, and ECR355/532 measured by MRL.
Remotesensing 13 01811 g006
Figure 7. Aerosol subtype mask comparison between MRL and CALIPSO. The first line is the time–height plots of the classification results determined by MRL, and a temporal difference of less than 1 h between MRL and CALIPSO were selected. The second line is the latitude–height plots of the CALIPSO classification results, and the CALIPSO overpasses that occurred at a distance of less than 90 km were selected. The case number is displayed at the top of each subgraph, the black represents nighttime results, and the red indicates the daytime results, the details of each case can be found in Table 1. Color-coded aerosol type of polluted continental/smoke of CALIPSO is shown as anthropogenic aerosol (red).
Remotesensing 13 01811 g007
Figure 8. Comparison of the EXT532, PDR532, and lidar ratio between MRL and CALIPSO. Scatter plots show relationship between MRL and CAPLISO for (a) EXT532 and (b) PDR532. (c) The relative bias between LR532 assumed by CALIPSO and LR355 measured by MRL. The correlation coefficients in (a) and (b) are shown at the top left, n = number of samples. The steps of relative bias of lidar ratio is 2%.
Remotesensing 13 01811 g008
Figure 9. Average vertical profiles of aerosol optical parameters of key aerosol types in North China. Vertical structure of (a) EXT355, (b) PDR532, (c) ECR355/532, and (d) LR355. The envelope over the horizontal bars represent one standard deviation at each altitude.
Remotesensing 13 01811 g009
Figure 10. The trend of average aerosol optical parameters of key aerosol types with the aggravation of air pollution. Solid lines show the (a) PDR532, (b) LR355, and (c) ECR355/532 variation along with the increasement in EXT355. The step of EXT355 is 0.05 km−1. The envelope over the vertical bars represent one standard deviation at each EXT355.
Remotesensing 13 01811 g010
Figure 11. Average vertical profiles of aerosol optical parameters in different seasons in BTH region. Vertical structure of (a) EXT355, (b) PDR532, (c) ECR355/532, and (d) LR355. The envelope over the horizontal bars represent one standard deviation at each altitude.
Remotesensing 13 01811 g011
Figure 12. The relative contributions of key aerosol types in (a) spring, (b) summer, (c) autumn, (d) winter, and (e) the whole year in BTH region.
Remotesensing 13 01811 g012
Table 1. Cloud–aerosol lidar and infrared pathfinder satellite observations (CALIPSO) overpasses used for comparison during our observation period.
CaseDateTime (LTC)Separation (km)Heights (km)R2
127 Jan0231440.54–2.220.43
29 Mar0225860.96–2.700.91
31 Apr0232530.54–3.840.90
41 Apr1336150.54–2.040.99
517 Apr0232520.54–3.900.94
617 Apr1336140.54–3.180.65
726 Apr0225860.54–3.450.21
86 Jul0231500.54–5.220.66
96 Jul1336100.54–2.340.74
1015 Jul0225870.54–1.860.52
1123 Aug0231500.54–1.920.22
1223 Aug1336100.54–1.380.26
138 Sep133570.78–2.700.09
143 Nov0232580.54–2.880.87
153 Nov1335390.54–3.120.90
1629 Nov1338320.54–1.800.80
174 Dec0229210.54–2.280.67
1813 Dec1340650.54–1.440.89
1912 Jan0234740.54–2.100.44
R2 represents the Pearson correlation of extinction coefficient at 532 nm (EXT532) between Mie–Raman lidar (MRL) and CALIPSO.
Table 2. Aerosol optical parameters for key aerosol types and different seasons.
PDR532LR355ECR355/532
Anthropogenic0.063 ± 0.02255.2 ± 10.41.72 ± 0.25
Polluted dust0.146 ± 0.04248.2 ± 7.61.52 ± 0.27
Dust0.322 ± 0.05543.0 ± 5.21.20 ± 0.22
Spring0.184 ± 0.09148.2 ± 7.11.55 ± 0.33
Summer0.054 ± 0.02357.2 ± 6.61.57 ± 0.22
Autumn0.151 ± 0.07446.3 ± 6.71.42 ± 0.32
Winter0.090 ± 0.06151.2 ± 9.51.67 ± 0.25
± for one standard deviation.
Table 3. Lidar ratio and depolarization ratio for ice clouds, anthropogenic aerosols, and dust.
LR (sr)PDR532LocationReference
Ice clouds
0.3–0.6Palaiseau, FranceNoel et al. 2002 [52]
29 ± 12(LR 532)0.2–0.6TaiwanChen et al. 2002 [53]
17 ± 14(LR 532)0.22 ± 0.07Tsukuba, JapanSakai et al. 2003 [51]
10 ± 30(LR 355)0.13–0.35ArcticReichardt et al. 2002 [54]
~20(LR 355) GermanyAnsmann et al. 1992b [11]
25 ± 1(LR 355) Beijing, ChinaZongming Tao et al. 2012 [50]
~20(LR 532) North AmericaBurton et al. 2012 [14]
27 ± 12(LR 355) Gwal PahariVoudouri et al. 2020 [55]
Anthropogenic aerosols
56 ± 6(LR 532)0.06 ± 0.01Central EuropeGroß et al., 2013 [18]
50–70(LR 532)<0.1North AmericaBurton et al., 2012 [14]
53–57(LR 355)0.05WarsawJanicka et al., 2019 [56]
52 ± 7(LR 355)0.09 ± 0.04South AfricaGiannakaki et al., 2016 [57]
Dust
47 ± 18(LR 532)0.20 ± 0.07Tsukuba, JapanSakai et al., 2003 [51]
46 ± 5(LR 532)0.20–0.33Tsukuba, JapanSakai et al., 2002 [58]
46.5 ± 10.5(LR 532)~0.30Tokyo, JapanMurayama et al., 2003 [59]
58 ± 7(LR 355)0.30 ± 0.01PraiaGroß et al., 2017 [20]
53±5(LR 355)0.27 ± 0.01BarbadosGroß et al., 2015 [19]
± for one standard deviation.
Publisher’s Note: MDPI stays neutral with regard to jurisdictional claims in published maps and institutional affiliations.

