
Subtask Attention Based Object Detection in Remote Sensing Images


1
National Key Laboratory of Science & Technology on Multi-Spectral Information Processing, School of Artificial Intelligence and Automation, Huazhong University of Science and Technology, Wuhan 430074, China
2
Shenzhen Huazhong University of Science and Technology Research Institute, Shenzhen 518000, China
3
School of Remote Sensing and Information Engineering, Wuhan University, Wuhan 430079, China
*
Author to whom correspondence should be addressed.
Remote Sens. 2021, 13(10), 1925; https://0-doi-org.brum.beds.ac.uk/10.3390/rs13101925
Submission received: 24 March 2021
/
Revised: 1 May 2021
/
Accepted: 11 May 2021
/
Published: 14 May 2021
(This article belongs to the Special Issue Knowledge Graph-Guided Deep Learning for Remote Sensing Image Understanding)
Abstract
:Object detection in remote sensing images (RSIs) is one of the basic tasks in the field of remote sensing image automatic interpretation. In recent years, the deep object detection frameworks of natural scene images (NSIs) have been introduced into object detection on RSIs, and the detection performance has improved significantly because of the powerful feature representation. However, there are still many challenges concerning the particularities of remote sensing objects. One of the main challenges is the missed detection of small objects which have less than five percent of the pixels of the big objects. Generally, the existing algorithms choose to deal with this problem by multi-scale feature fusion based on a feature pyramid. However, the benefits of this strategy are limited, considering that the location of small objects in the feature map will disappear when the detection task is processed at the end of the network. In this study, we propose a subtask attention network (StAN), which handles the detection task directly on the shallow layer of the network. First, StAN contains one shared feature branch and two subtask attention branches of a semantic auxiliary subtask and a detection subtask based on the multi-task attention network (MTAN). Second, the detection branch uses only low-level features considering small objects. Third, the attention map guidance mechanism is put forward to optimize the network for keeping the identification ability. Fourth, the multi-dimensional sampling module (MdS), global multi-view channel weights (GMulW) and target-guided pixel attention (TPA) are designed for further improvement of the detection accuracy in complex scenes. The experimental results on the NWPU VHR-10 dataset and DOTA dataset demonstrated that the proposed algorithm achieved the SOTA performance, and the missed detection of small objects decreased. On the other hand, ablation experiments also proved the effects of MdS, GMulW and TPA.
1. Introduction
Object detection in remote sensing images (RSIs) [1] is always one of the research hotspots of remote sensing technology. With the rapid development of remote sensing technology [2,3,4], the quality of RSIs is constantly improved, and it is easier for researchers to obtain. Remote sensing object detection has also played a more and more important role in intelligent monitoring, urban planning, natural disaster assessment and other fields. In the last ten years of research, many excellent algorithms have been proposed to handle this task, mainly deep learning-based methods and traditional methods. These studies have greatly promoted the development of remote sensing object detection technology and brought considerable economic value in many application fields.
According to [1], the traditional methods of object detection in RSIs can be divided into four main categories: template matching-based methods, knowledge-based methods, object-based image analysis (OBIA)-based methods and machine learning-based methods. Template matching-based [5], knowledge-based [6] and OBIA-based [7] methods used to be popular approaches, but they have received less attention since the machine learning has become mainstream. Considering the existing machine learning-based detection algorithms in RSIs, it is always treated as the classification task which contains two core components: feature extractor and classifier. Almost all of the well-known artificial features and classifiers have been introduced into the RSIs detection task. For example, histogram of oriented gradient (HOG) [8,9], scale invariant feature transform (SIFT) [10] and steering kernel [11] are adopted by many scholars; other features, such as Gabor feature [12], gray-level co-occurrence matrix (GLCM) [13], bag of visual words (BoW) [13,14], etc. are also getting a lot of attention. As for classifiers, support vector machine (SVM) and its variants are the most commonly used ones [9,11,15,16]. In addition, other famous classifiers have also been introduced into RSIs-based object detection, such as conditional random field (CRF) [17,18,19], k-nearest neighbor (KNN) [20], expectation maximization (EM) [21], AdaBoost [22], random forest [23], etc. Although the application of machine learning technology has greatly promoted the development object detection in RSIs, these algorithms usually handle only few categories and cannot cope with complex scenes due to the limitations of artificial features.
Recently, deep learning technology has attracted more attention. Breakthroughs have been made in many computer vision tasks since the publication of AlexNet [24] because the deep features have stronger representation ability than artificial features. Due to the excellent performance of deep learning in NSIs object detection [25,26,27], deep learning technology was introduced to remote sensing object detection in recent years and gradually became the mainstream [28,29]. On the one hand, the deep features extracted by deep CNN are used to describe the detected candidates for further classification in some machine learning-based methods. Some algorithms adopt existing CNN architectures directly to extract deep features of remote sensing objects. For example, a pre-trained AlexNet model is used to extract the deep features of the area surrounding an oil tank, in which the output of the first linear layer of the AlexNet is used as the extracted feature [30]. In literature [31], the fully convolutional network was combined with Markov random field to detect an airplane. More typically, the algorithms in [32] were proposed to handle multi-class remote sensing object detection, which included four steps: candidate region generation, feature extraction, classification and bounding box fine tuning, and the deep CNN was used in the second step. Some other scholars took the special characteristics of RSIs into account. For example, a new rotation-invariant constraint based on existing CNN architectures was proposed in [33] to handle the problem that objects show a variety of orientations in RSIs. On the other hand, the mature deep object detection frameworks of NSIs were also introduced into remote sensing object detection, including both two-stage framework and one-stage framework. The R-CNN series [25], which has a clear step of region proposal generation, is representative of two-stage algorithms. There are many algorithms of remote sensing object detection that are based on R-CNN [34,35,36,37]. These algorithms make improvements regarding the orientation and scale variations of remote sensing objects, which mainly focus on the region proposal network (RPN). As for the one-stage frameworks, the most famous algorithms are the YOLO series [26] and SSD series [27]. There are also many improved versions based on these two frameworks which aim to remote sensing objects, such as YOLO-based methods [38,39] and SSD-based methods [40,41,42].
The SOTA remote sensing object detection algorithms are almost based on mature deep object detection frameworks, including one-stage framework and two-stage framework. As a rule of thumb, the two-stage framework is more time consuming than the one-stage framework, both in training and application. Considering that remote sensing image processing is usually faced with massive data, this paper mainly focuses on the one-stage framework.
Although the application of deep learning technology has made great progress in RSIs object detection, there are still many challenges due to the characteristics of RSIs and many studies trying to solve them [38,39,40,41,42]. One of the main challenges are the missing detection and inaccurate location of small objects. Remote sensing images from the same source have a fixed resolution, which leads to the objects in RSIs having the same size in comparison with reality. Therefore, the size of the target in RSIs varies greatly, and the pixel number of a small object may be less than five percent of that of a large object. To handle this problem, existing algorithms mainly adopt the combination of hierarchical feature maps, such as in [38]; however, the effect is limited.
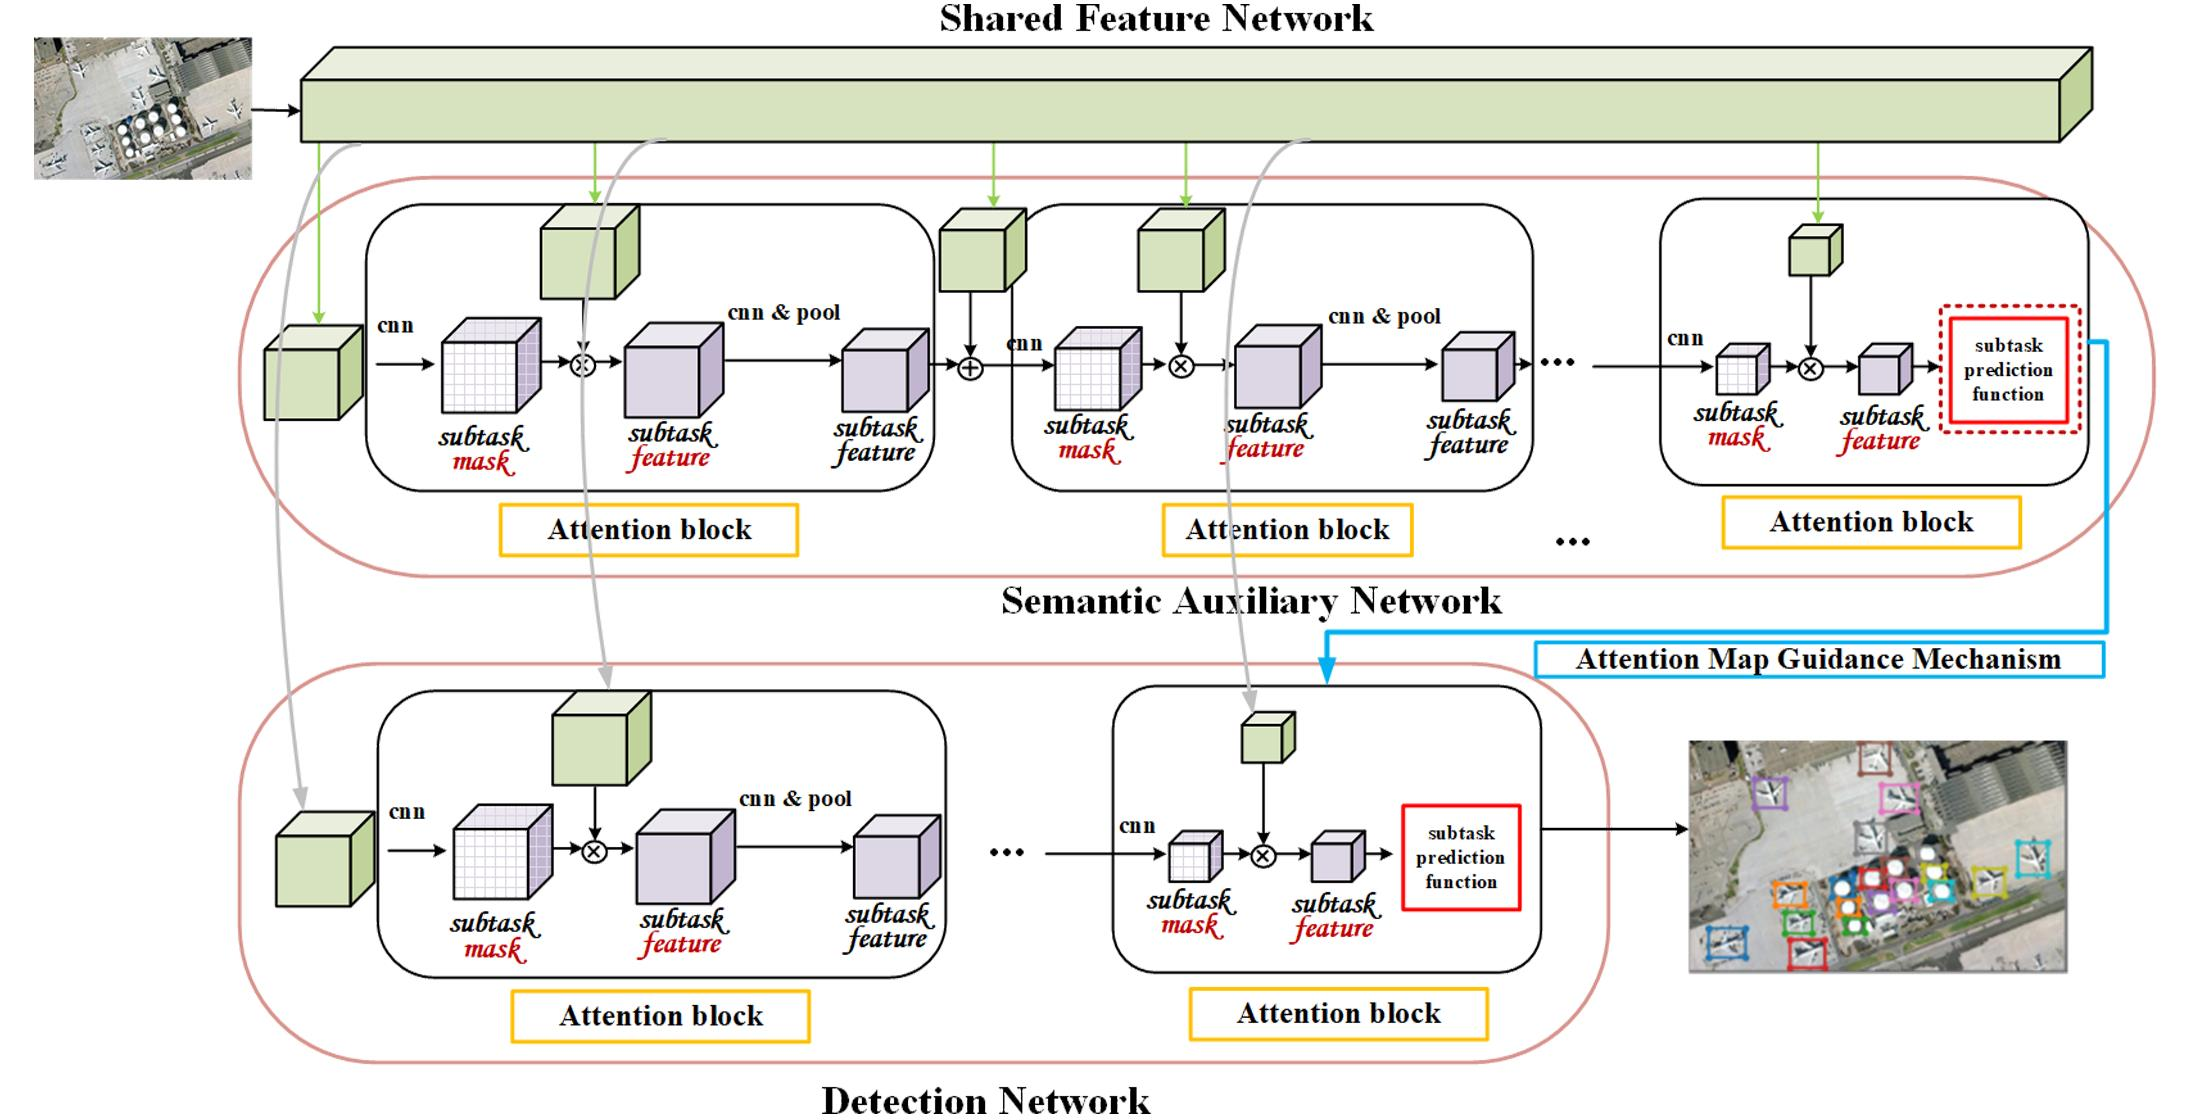
To improve the ability of accurate detection of small objects, a novel model is proposed based on a multi-task and attention mechanism, named subtask attention network (StAN). First, we treat the detection task as a subtask and build a semantic auxiliary subtask, both are performed in two attention branches based on the multi-task attention network (MTAN) [43]. Second, the two subtasks share the deep feature from a shared feature branch, but the branch of detection subtask directly predicts on low-level features because small objects disappear in space on high-level feature maps as the map size decreases, which reduces the detection accuracy of small objects. Third, the high-level attention map of the semantic auxiliary branch is used to guide the detection branch to produce the final result; namely, the attention map guidance mechanism. In addition, the semantic auxiliary branch is trained by classification loss while the detection branch is trained just like YOLO v3 [44]. Fourth, the multi-dimensional sampling module (MdS), global multi-view channel weights (GMulW) and target-guided pixel attention (TPA) are proposed as gain modules for further improvement of the detection accuracy in complex scenes, and integrated into StAN. In the proposed StAN, we handle the detection task on shallow layers of the neural network to avoid the disappearance of small objects on feature maps. On the other hand, another subtask branch, which uses high-level semantic features, is also used to ensure the overall detection accuracy. It is well known that deep semantic features are beneficial to object classification. Moreover, the neural structures commonly used for classification tasks do not fit to remote sensing objects. Thus, we design three gain modules based on some successful instances from literature, and integrate these modules into the shared feature branch for further improvement.
The main contributions of this paper can be summarized as follows:
- (1)
- Contrary to the existing algorithms, which combine hierarchical feature maps, we conduct object detection directly on the shallow features for the problem of low detection precision of small objects and propose the StAN model. In addition, we use high-level semantic features in a subtask branch and aid the object detection through an attention map guidance mechanism.
- (2)
- In order to further improve the overall detection accuracy in complex remote sensing scenes, we propose the MdS, GMulW and TPA modules and integrate them into StAN.
- (3)
- Through a large number of comparative experiments, we prove that the performance of the proposed algorithm reaches the SOTA level, especially for small objects. The effect of gain modules has also been demonstrated by ablation experiments.
The rest of this paper is organized as follows: Section 2 describes the details of the proposed StAN model and the three gain modules. Section 3 introduces the datasets and experiment settings. Section 4 shows the experimental results on the NWPU VHR-10 dataset and DOTA dataset which demonstrate the performance of the proposed algorithm and the effect of gain modules. Section 5 makes a conclusion of this paper.
2. Methodology
The proposed algorithm is based on the multi-task and attention mechanism which refer to MTAN framework [43]. On the other hand, our object detection mechanism is based on the one-stage framework YOLO v3, which has no extraction process of region proposals [44]. The overall architecture of the proposed StAN is shown in Figure 1. The implementation details of the proposed algorithm are covered in the remaining part of this section. First, we introduce some brief basic information about the MTAN framework and YOLO v3 framework for understanding of the proposed algorithm. Second, we illustrate the overall framework of the proposed StAN and describe the details of each part. Third, we detail the MdS, GMulW and TPA modules and integrate them into StAN, which is then named StAN-Gain.
2.1. Preliminaries
2.1.1. Multi-Task Attention Network (MTAN)
The MTAN framework is a commonly used multi-task framework which allows training task-specific attentions [43]. The overall architecture of MTAN is shown in Figure 2; it consists of a shared network and several subtask branches. The shared network provides shared global features to each task, while the soft-attention module forms subtask branches that handle their own task. In literature [43], authors introduced this multi-task framework by semantic segmentation and depth estimation, in which the shared network was a SegNet because both subtasks were pixel-level prediction tasks. However, for our study, we build two subtasks: semantic auxiliary subtask and detection subtask, which are quite different from the subtasks in [43]. We adopt ResNet [45] as the backbone of our shared feature network (Figure 1). In addition, the subtasks of our model are not independent of each other, and the semantic auxiliary branch provides auxiliary information for the detection branch by an attention map guidance mechanism. More implementation details of the StAN model are described in the following sections.
2.1.2. YOLO v3
YOLO v3 [44] is one of the one-stage detection algorithms. In contrast to the two-stage detection algorithms that propose object candidates first, the YOLO v3 algorithm assumes that the objects may exist at every position in the image. First, the YOLO v3 algorithm generates nine anchor sizes through k-means clustering on the ground-truth bounding boxes of the training data. The nine anchor sizes are then used as bounding box priors to handle the location prediction during detection. Second, a full convolution neural network (FCN) is used to extract deep features. Third, the nine anchors are divided into three groups corresponding to three prediction modules after the FCN. The outputs of each prediction module are m channel score maps, which means that we can obtain m scores for each location. In the original design, , in which 3 means the anchor count and 4 corresponds to the bounding box offset, while 1 means objectness prediction that is used to judge whether here is an object. According to the m scores, for each location in the output map, it can be determined whether there is an object, and the bounding box can be calculated by offset and anchor priors. In addition, the bounding box will be mapped to the original image as the final location prediction.
Considering the detection task in the proposed StAN model, we adopt the detection strategy of YOLO v3. First, nine anchor sizes are obtained from the training dataset, exactly like what YOLO v3 does. Second, deep features are extracted by the shared feature network of the StAN model. Third, the prediction operate is performed by the detection branch of the StAN model. In contrast to YOLO v3, the anchors of our algorithm are not divided into three groups for simplicity. Thus, the count of output score maps is in our model.
2.2. Subtask Attention Network
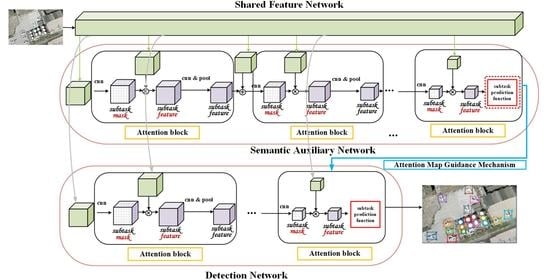
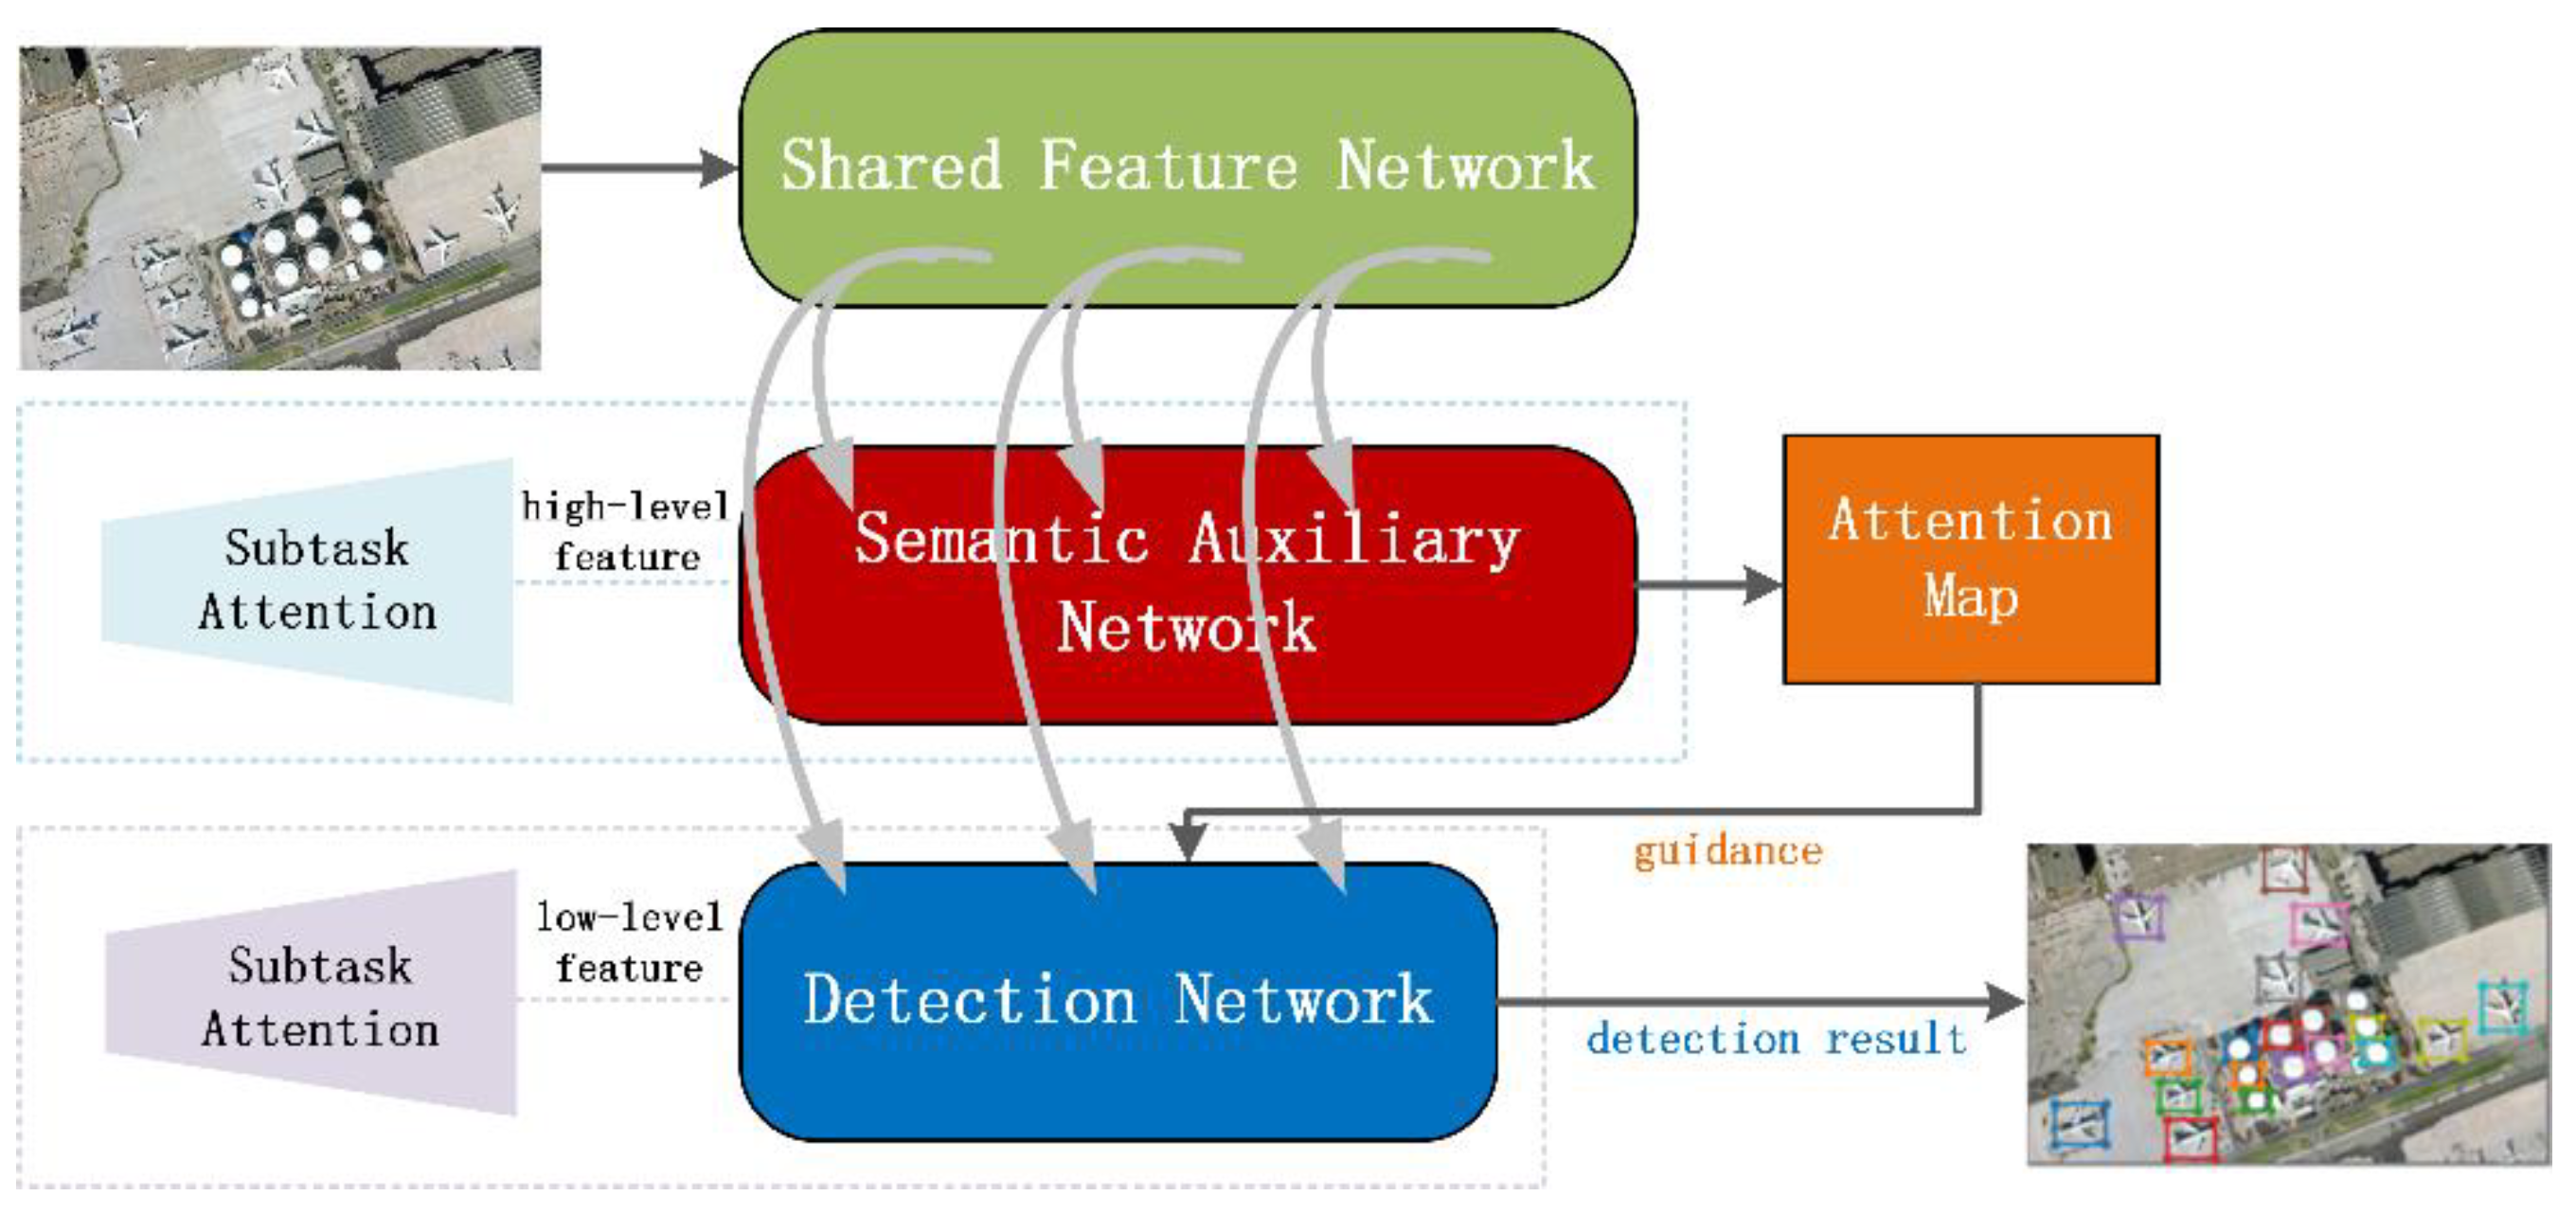
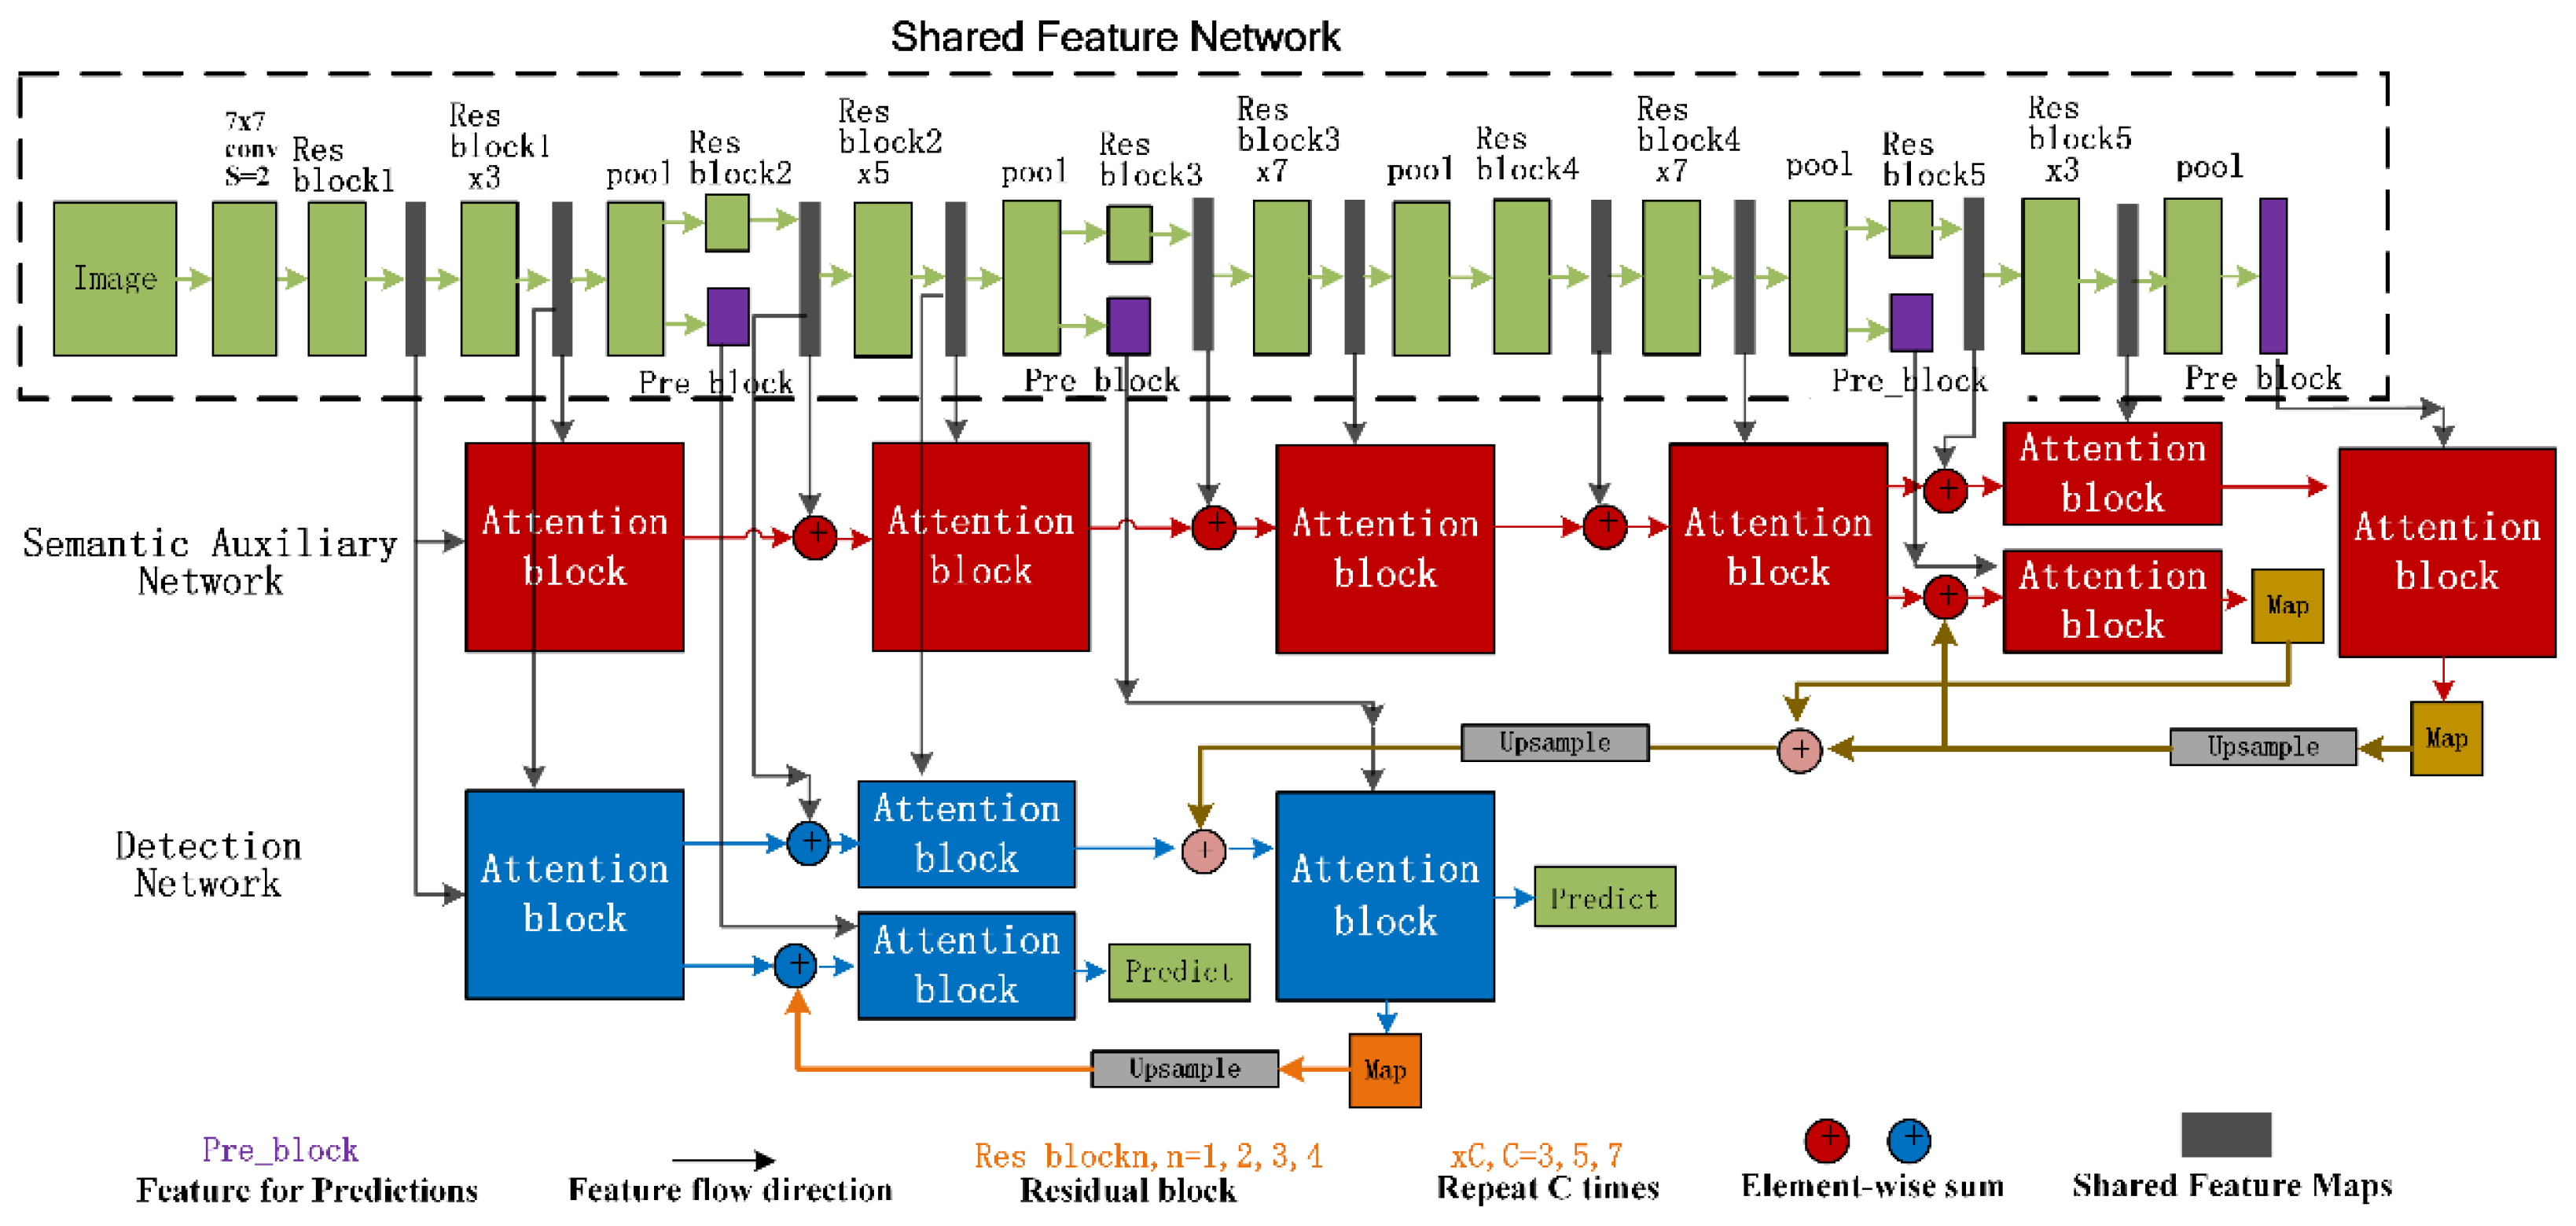
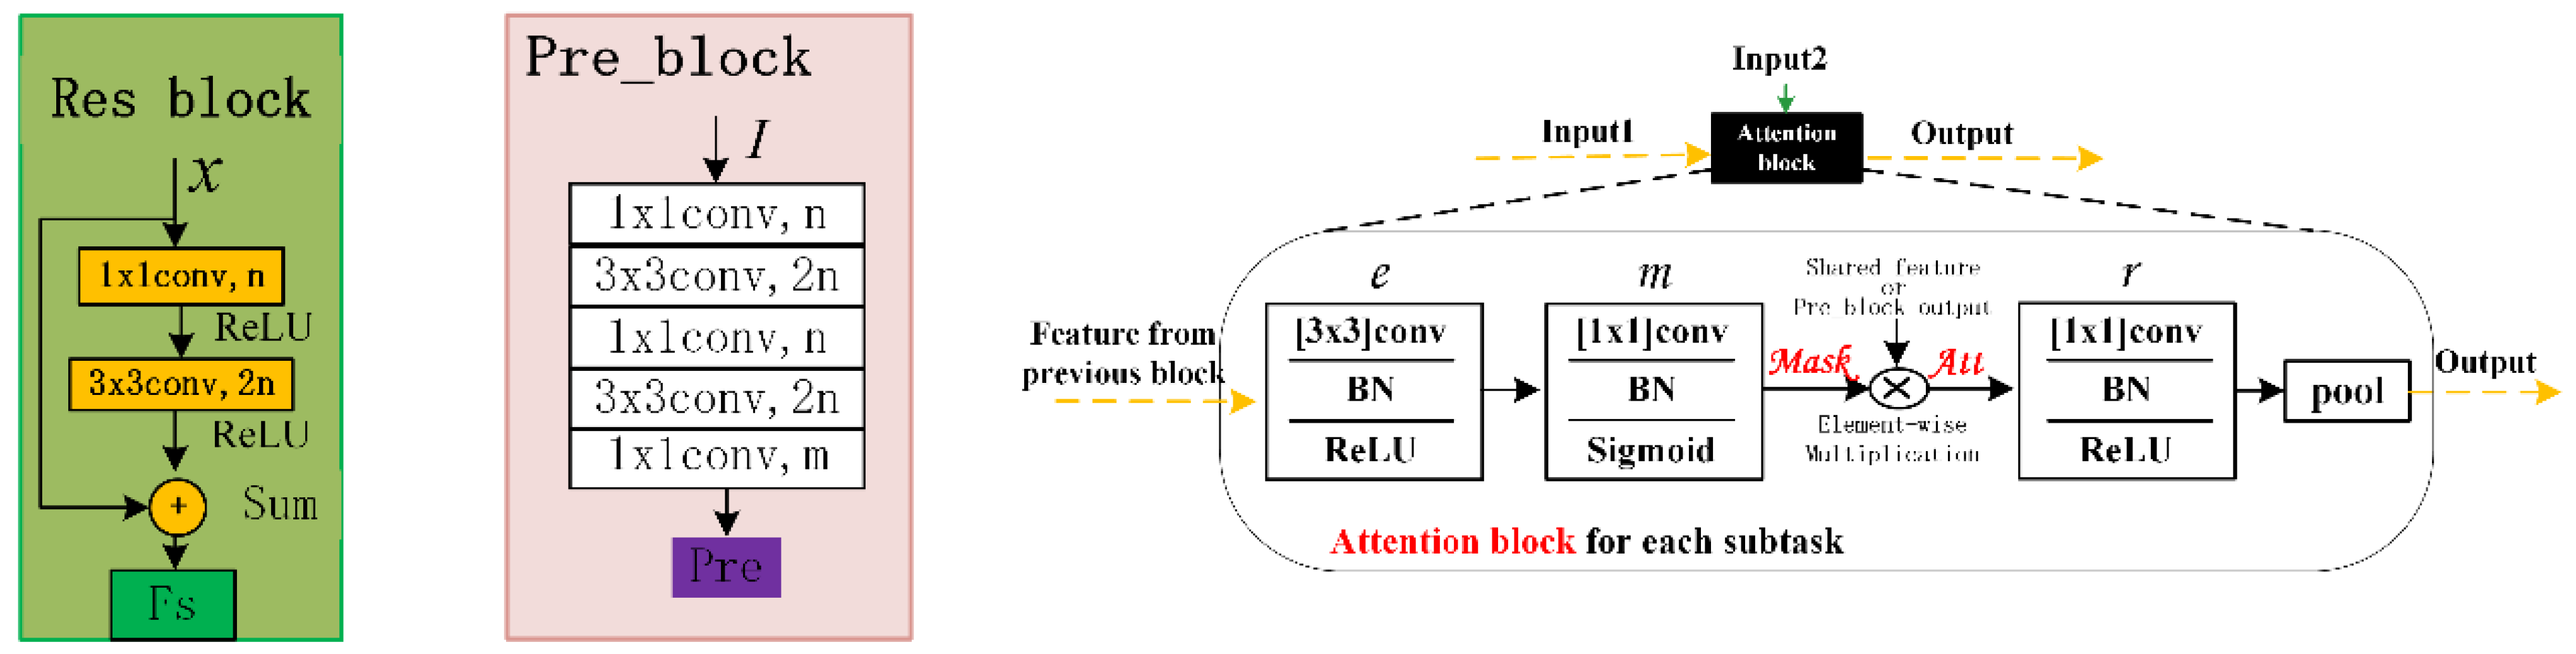
In the architecture of StAN (illustrated in detail in Figure 3), ResNet [45] is adopted to extract shared features for our detection task. The semantic auxiliary branch contains seven attention blocks, which provide two predictions of object classification in different depth, and the first prediction integrates the prediction information from the higher one. As for the detection branch, which contains four attention blocks based on low-level features, it also provides two predictions for final detection results and adopts the same integration strategy as the semantic auxiliary branch. In addition, the attention map guidance mechanism is applied for the detection branch, in which both outputs of the semantic auxiliary branch are used to guide the detection subtask. The details of the architectures of Res block, pre_block and attention block are shown in Figure 4. For the Res block, we adopt a simple form containing one convolution layer and one convolution layer, and the pre_block contains three convolution layers and two convolution layers, in which for classification and for detection. The anchors are obtained just as YOLO v3 [44] and anchor_cnt is set to 9. Moreover, the corresponds to the background and the 4 means parameters of bounding box. As for the attention block, the task-specific attention module from [43] is adopted here but the places of r and e are switched. The features of the previous block are fused with other features before input, so it is necessary to further mine features through a convolutional layer before generating a mask. In addition, the input 2 may be a shared feature or the output of pre_block, and the pooling layer will be removed if the attention block takes the output of pre_block as input.
In order to drive a model training, the loss function consists of four parts corresponding to four outputs of two subtask branches. The loss functions of the same subtask branch are identical, so we describe the loss function form only to consider different subtasks. For the whole StAN model, the loss function is formulated as follows:
In which means input image and means ground-truth of subtask k. For the proposed StAN model, equals to 2, which corresponds to a semantic auxiliary subtask and a detection subtask. Furthermore, is set to 1.52, while is set to 5.48, which aims to balance the loss value of the two subtasks. When we define the one-hot label of ground-truth as and prediction as , then the loss of semantic auxiliary subtask is as follows:
Which is the standard cross entropy loss. As for the detection subtask, the loss function contains and that correspond to the object classification and the bounding box regression, which is:
In the formulation (3), and mean the ground-truth and prediction of object category, while and correspond to the object location, and is set to 0.5 here. The is cross entropy loss like in Formulation (2), and is defined as follows:
Which is the L2 loss of four bounding box parameters, . The width and height of the bounding box are treated by square root with reference to YOLO [26].
2.3. Gain Modules for StAN Enhancement
The ResNet is designed for NSIs classification, which does not consider the characteristics of remote sensing objects, such as the variety of direction and size. To further improve the overall detection accuracy of the StAN model, three gain modules are proposed and integrated into the shared feature network of the StAN, including multi-dimensional sampling module (MdS), global multi-view channel weights (GMulW) and target-guided pixel attention module (TPA). The MdS is designed for multi-scale features extraction. Another two modules are based on attention mechanism. The attention mechanism has been introduced into remote sensing object detection in recent years by many scholars [46,47,48,49]. In contract to existing algorithms, which use single type attention, several attention modules are embedded into our model. First, the attention module in subtask branches can learn task-related features by applying a soft attention mask to the features from the shared network. Second, the GMulW module brings both channel and spatial attentions. Third, the TPA module focuses on pixel-level attention which is obtained by supervised learning. The integration of different level attentions is more conducive to the complex remote sensing object detection task. The enhancement version of StAN is denoted as StAN-Enh and the details of these modules are described as follows.
2.3.1. Multi-Dimensional Sampling Module
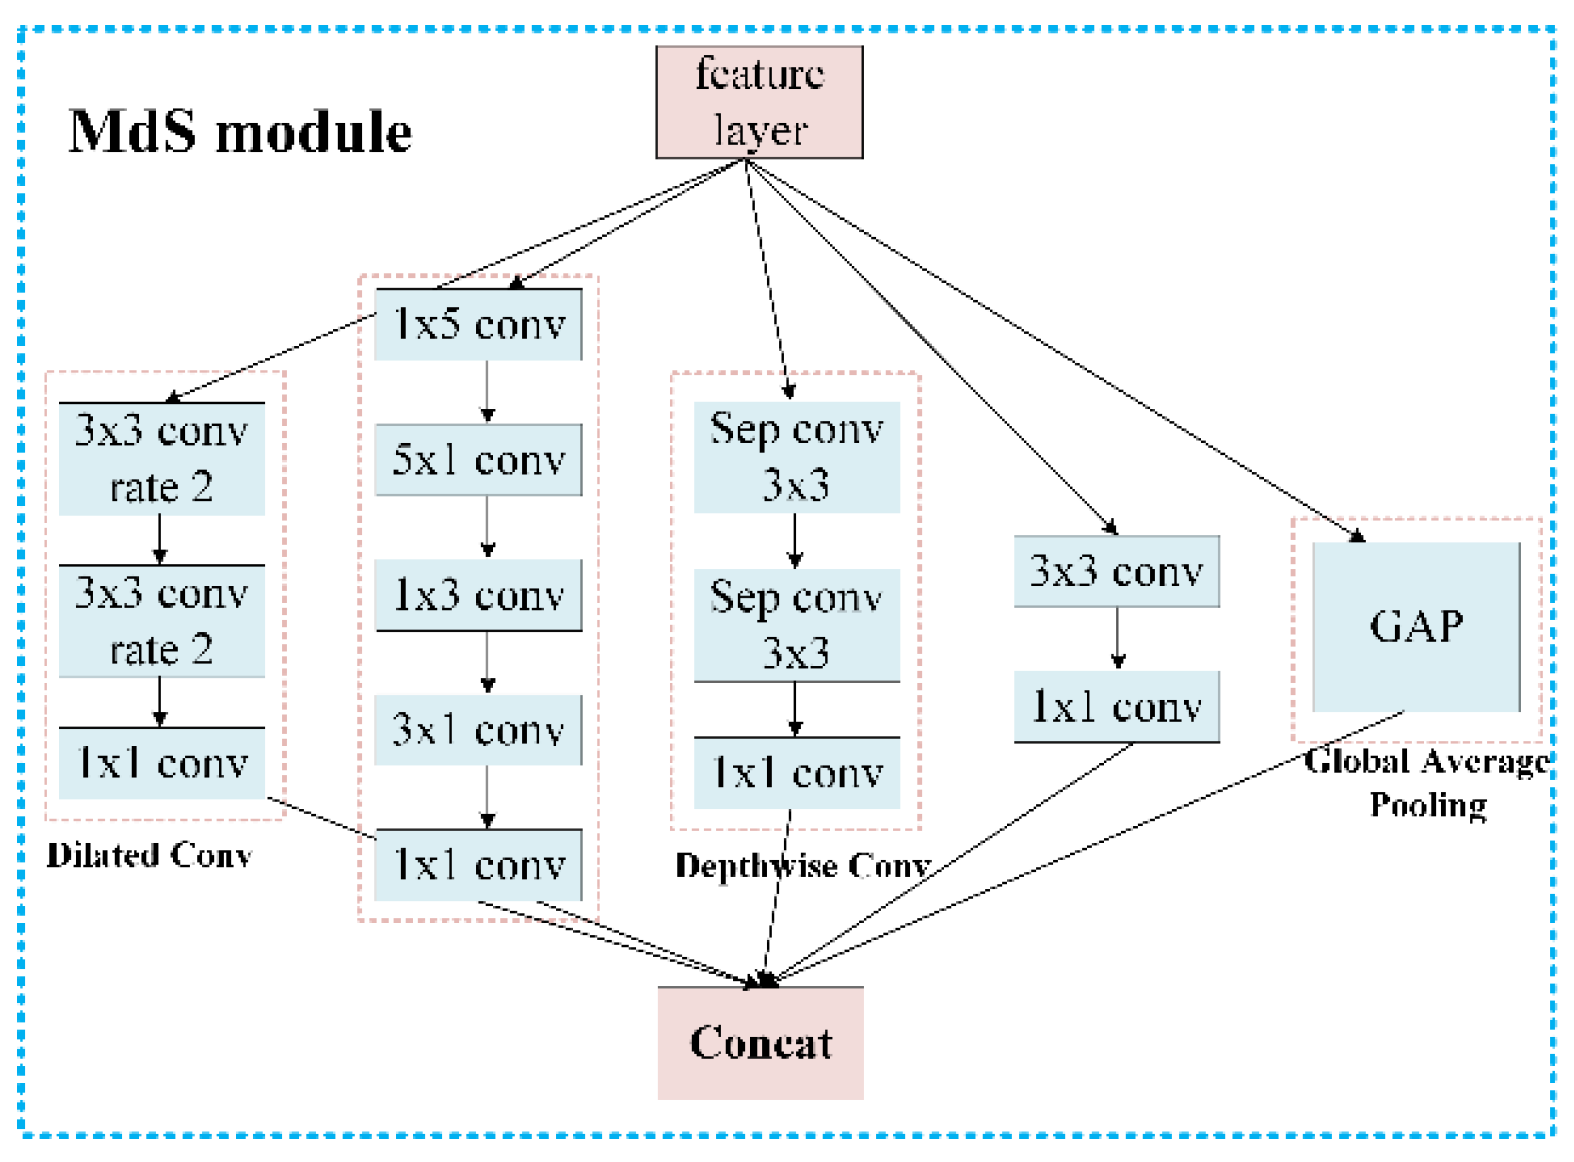
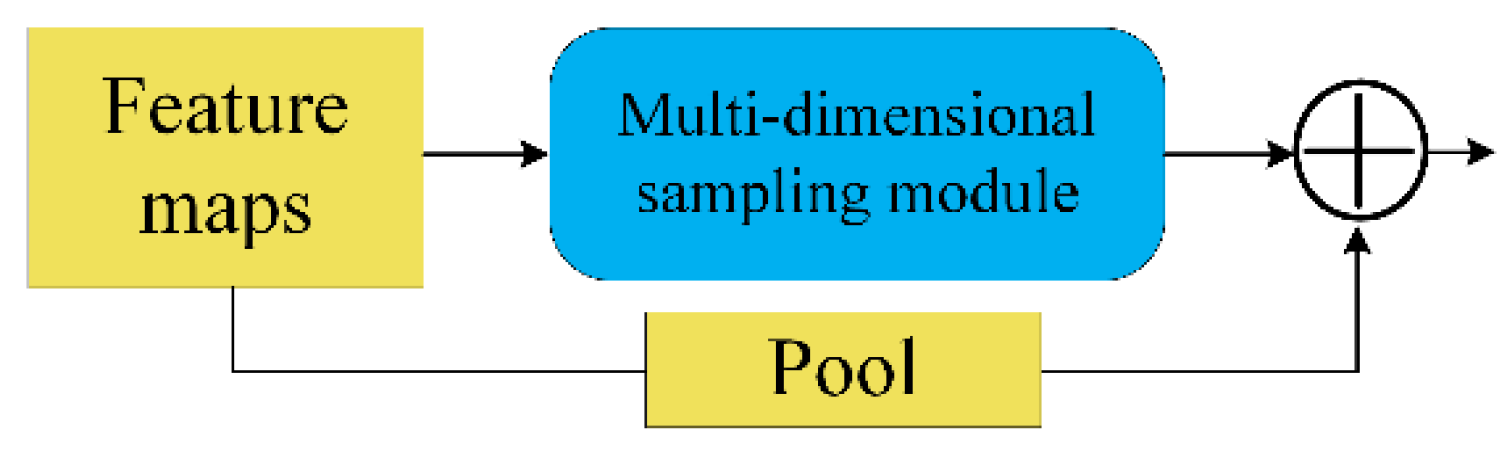
Considering a drastic change in the size of an object, it is reasonable to use a multi-dimensional convolution kernel to extract the object features. Inspired by the inception module [50], we designed the MdS module (Figure 5). In the MdS module, dilated convolution [51] can obtain a larger view field, while depthwise separable convolution [52] can focus on a single channel of feature maps. In addition, the global average pooling passes global information to the next layer. To integrate the MdS module into the StAN model, we replace the Res block and its following pooling layer with the architecture in Figure 6.
2.3.2. Global Multi-View Channel Weights Module
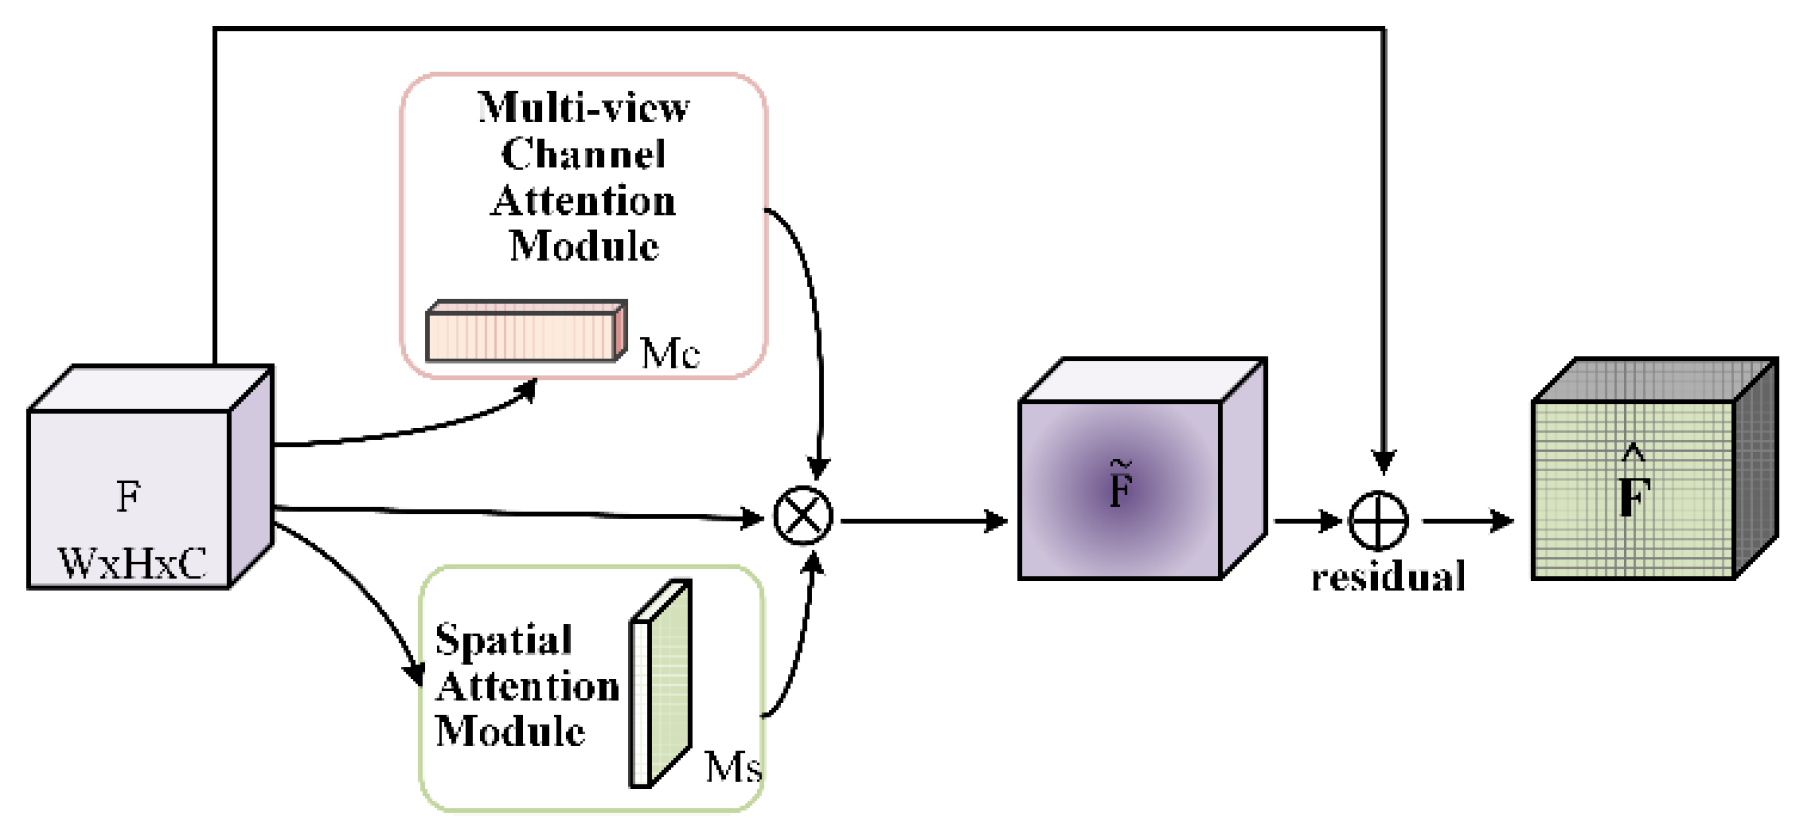
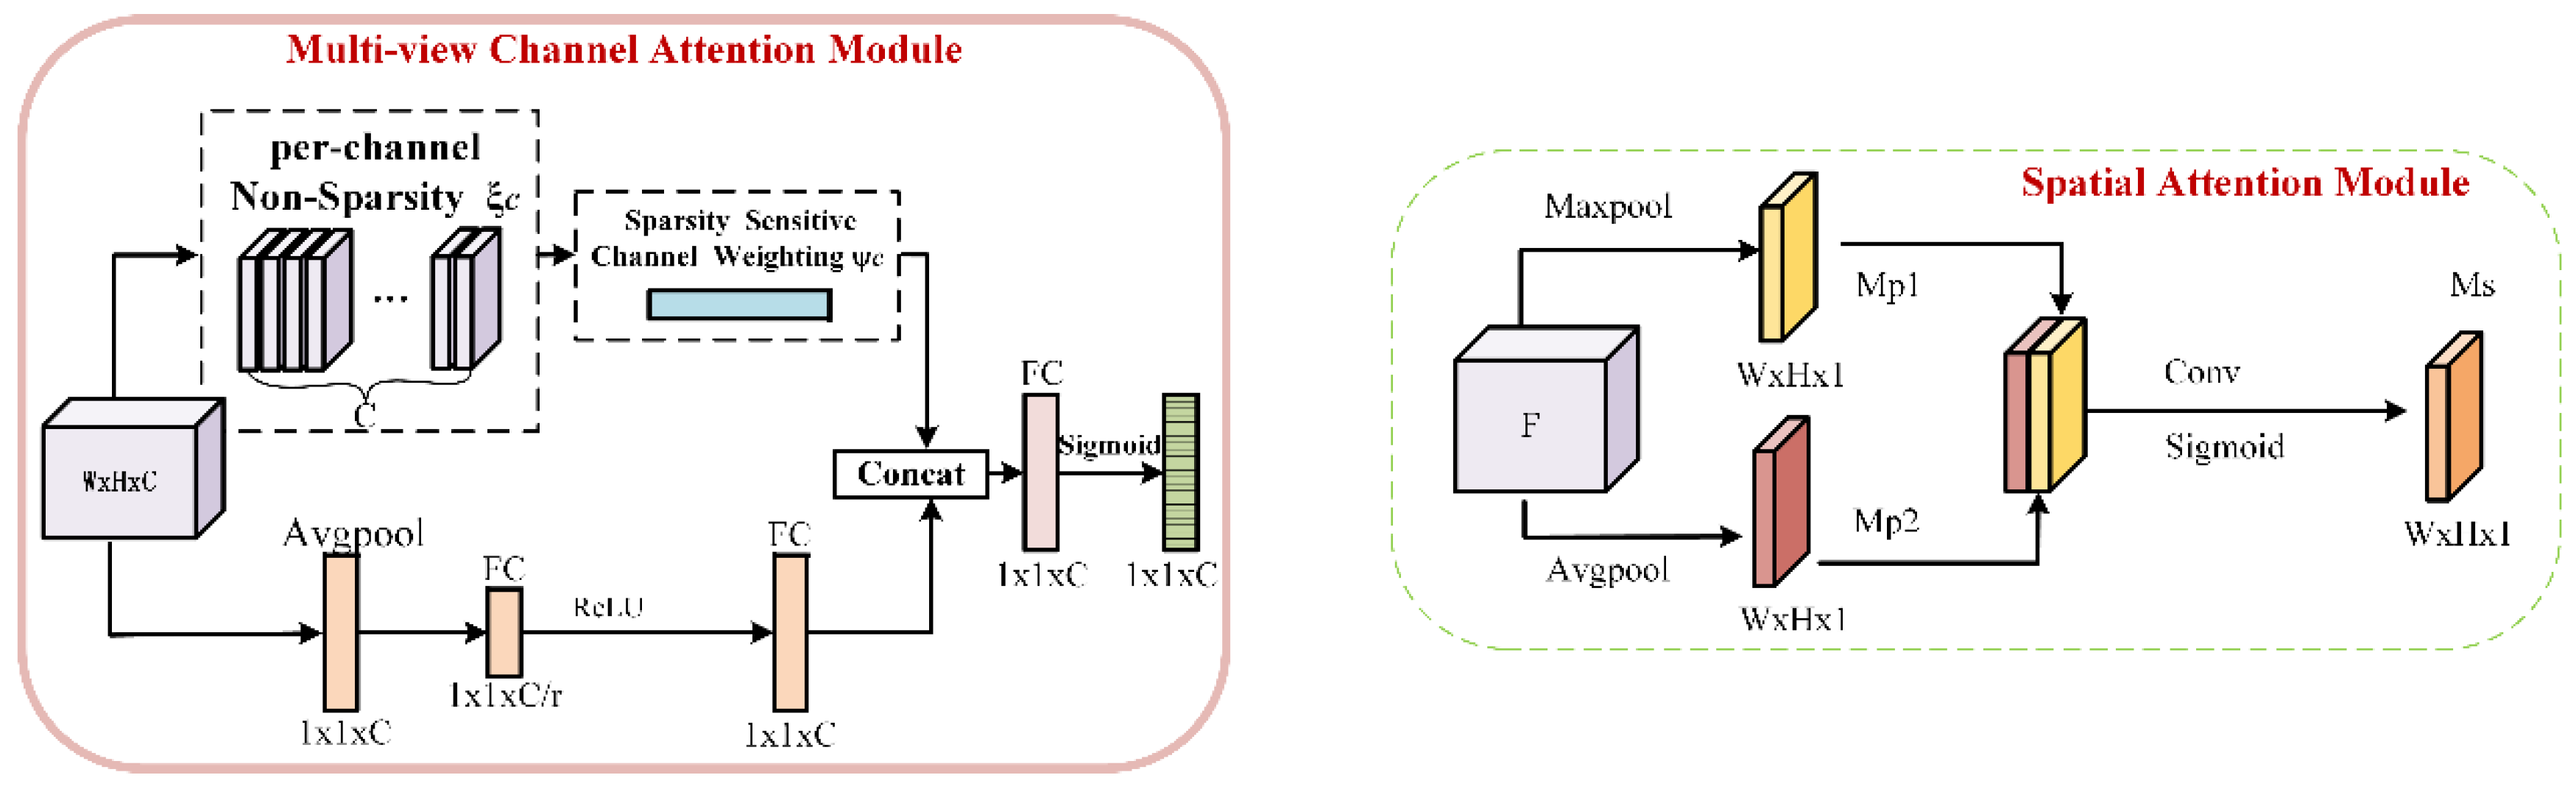
The GMulW module is integrated into the Res block (Figure 7), in which , and the operator means element-wise multiplication. The and refer to outputs of the multi-view attention module and spatial attention module, which are detailed in Figure 8.
The design of GMulW is inspired by the CBAM module [53], which constructs channel and spatial attention at the same time. In literature [54], the EAM module is designed for remote sensing scene classification, which is also based on the CBAM but the method of combining two kinds of pooling features is different. However, the channel attention module of both CBAM and EAM adopts maximal pooling to generate attention, and this directly compresses each channel to a single value. Such an operation results in the loss of much important information, and it is sensitive to noise with a large value. We replace the maximal pooling with the sparsity sensitive channel weighting module [55], which generates the channel weighting based on the sparsity of feature maps. In addition, the merge operation between different branches of the channel attention module is changed to be consistent with spatial attention, which means a concatenate operation. As for spatial attention, we keep the same form as CBAM. Furthermore, the parallel arrangement of attention modules is adopted in the GMulW. In fact, the channel-first order is slightly better according to [53], but it is not what we care about because the arrangement of attention modules has little effect.
2.3.3. Target-Guided Pixel Attention Module
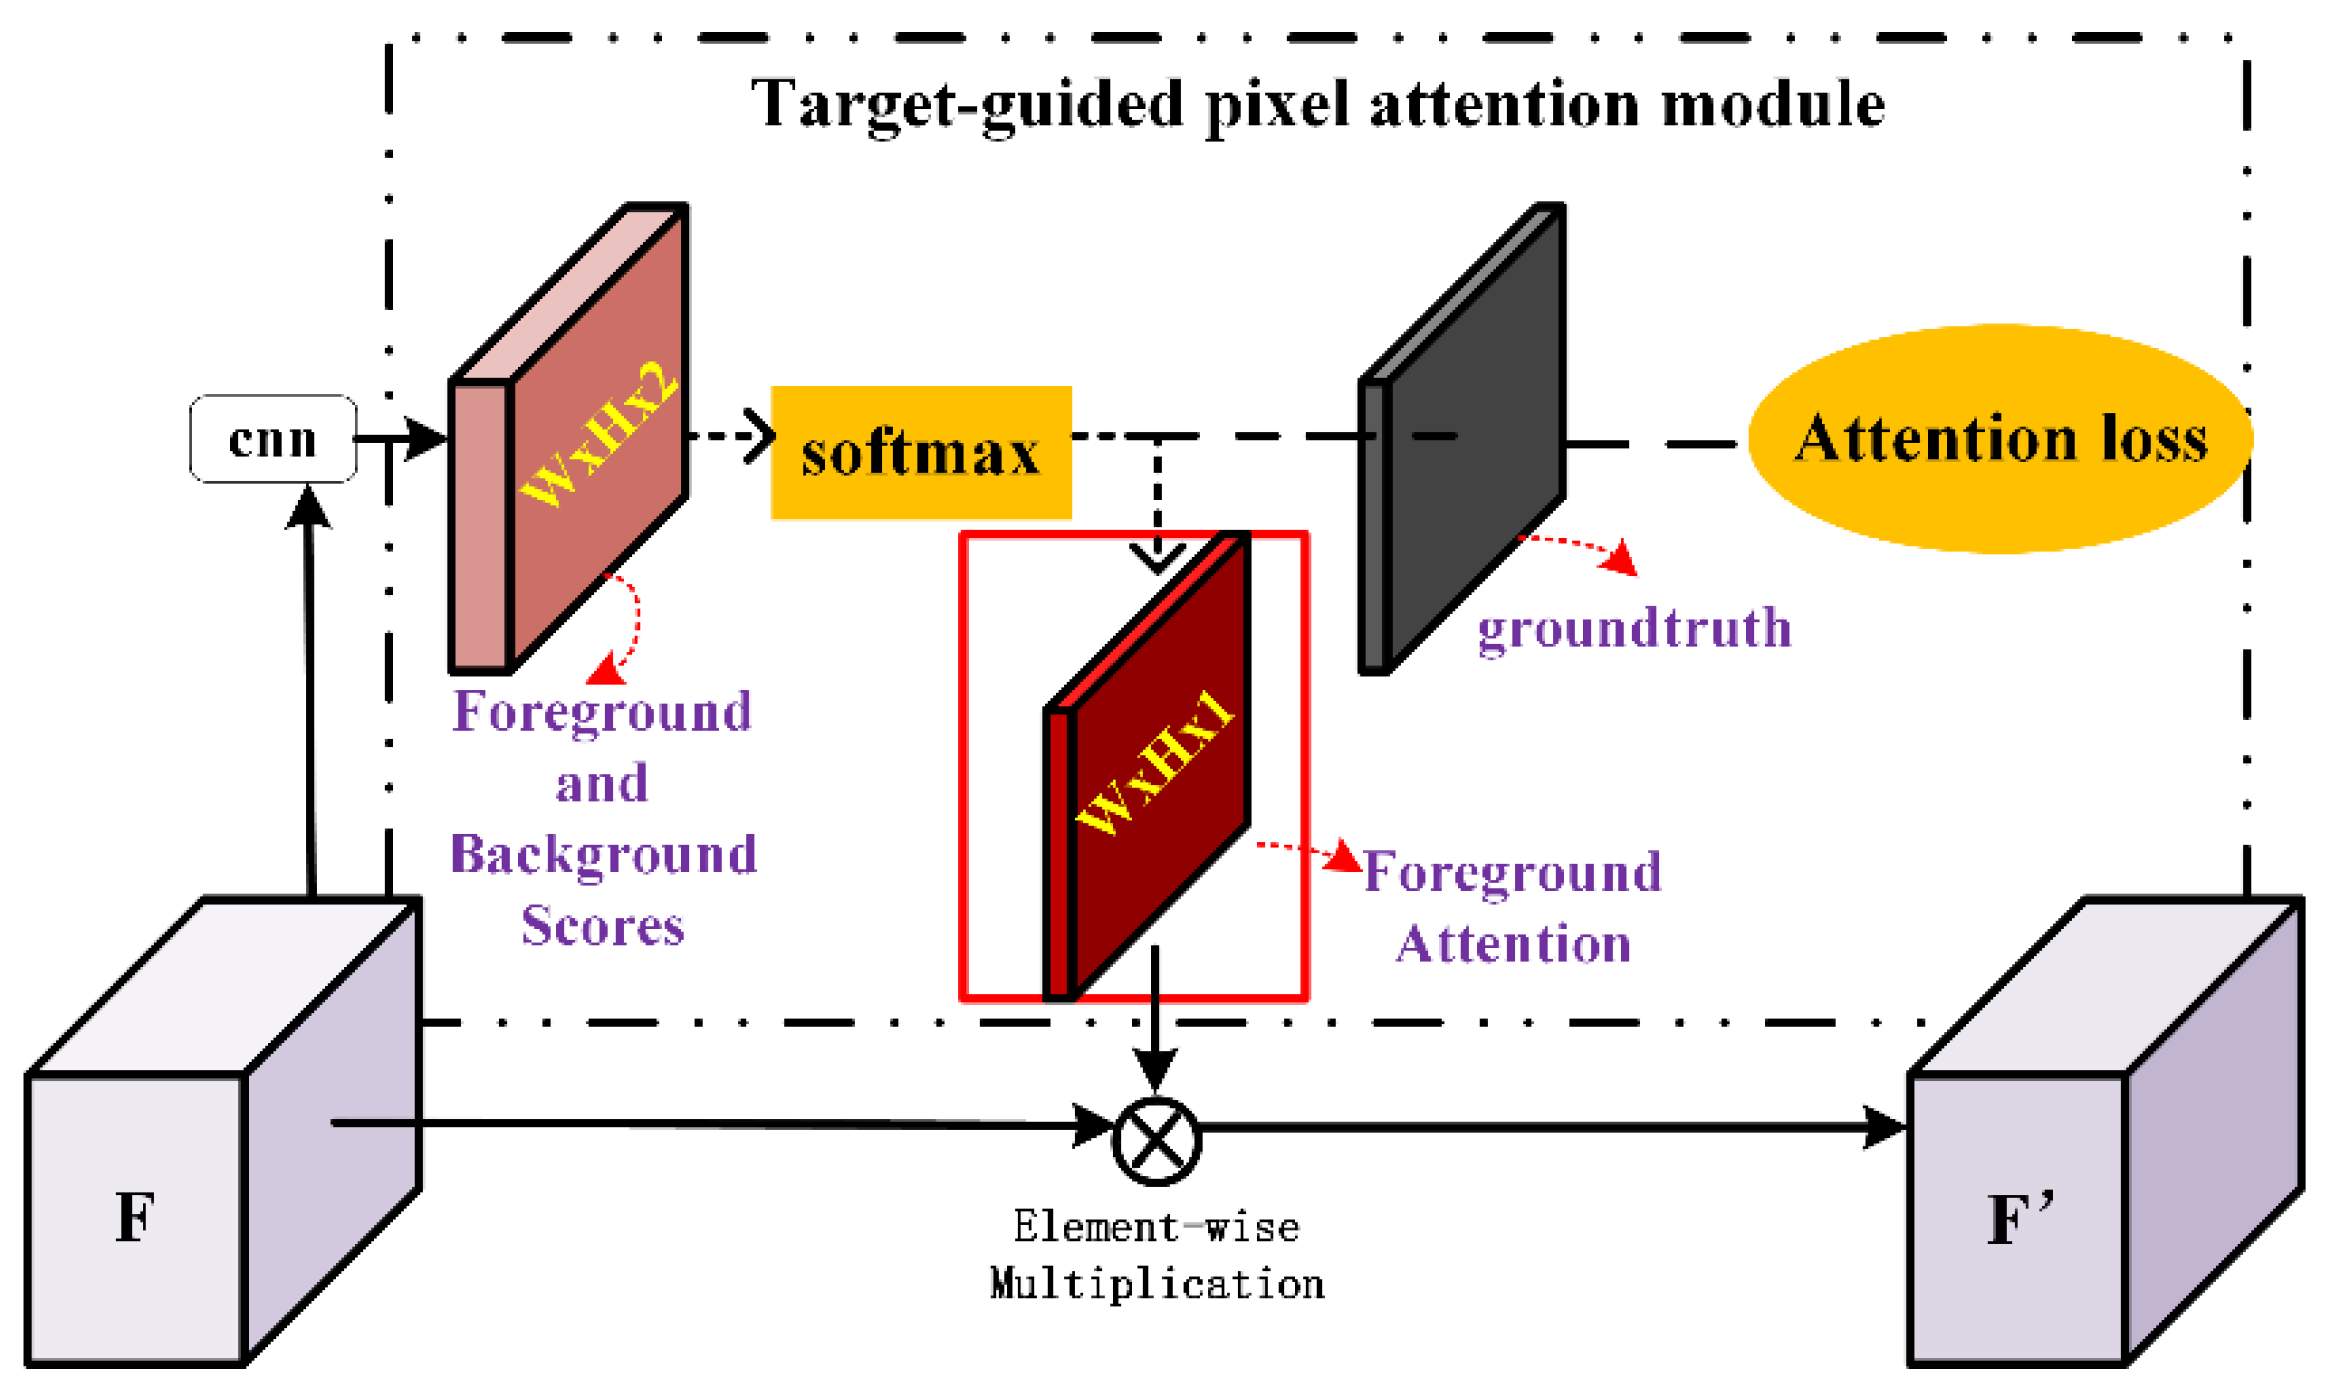
The TPA module is designed based on the MDA-net in SCRDet algorithm [56], which is an attention mechanism based on supervised learning. The supervised pixel attention is helpful to detect small and disorderly objects by suppressing noise and highlighting object features, which is suitable for remote sensing object detection. However, the MDA-net estimates both foreground and background attention scores which may interfere with each other because they are mutually exclusive. Therefore, we only retain the estimate of the foreground attention (Figure 9).
To train the TPA module, the pixel-wise softmax cross-entropy loss function is calculated between both foreground and background attention scores and the binary map generated from ground-truth, which is formulated as follows:
where refers to attention score and corresponds to a pixel in the binary map. The is set to 0.58, which corresponds to the subtask loss weights and . In order to balance the contributions of the positive and negative pixels, is set to 0.25 for background pixels. The factor is set to 2 here to adjust the contribution of hard pixels and easy pixels.
3. Dataset and Experimental Settings
3.1. Dataset Description
To verify the performance of the proposed algorithm, we selected the NWPU VHR-10 [57] and DOTA [58] datasets for experiments. The NWPU VHR-10 dataset contains 10 categories of labeled objects from 800 images cropped out from the Google Earth and Vaihingen datasets. In the experiment, the dataset is divided into a training set, verification set and test set according to the ratio of 3:1:1, which is the same as that in literature [59]. DOTA consists of 2806 aerial images and contains 15 categories of labeled objects. The size of the aerial images is from 800 × 800 pixels to 4000 × 4000 pixels, and the images contain a variety of objects of different scales, orientations and shapes. The DOTA dataset is divided into a training set, verification set and test set according to the ratio of 4:1:1. In addition, the horizontal bounding box is selected as a location ground-truth.
3.2. Evaluation Indicator
Just like most object detection algorithms, the average precision (AP) and mean AP (mAP) are selected here to evaluate the proposed algorithm. The AP calculates the average value of precision when the recall value changes from 0 to 1, which is also known as the area under the PRC. As for mAP, it calculates the mean value of AP over all object categories. These two evaluation indicators are defined as follows:
To calculate the selected AP and mAP, we need to use four evaluation components from the confusion matrix in Table 1 to calculate the precision and recall as follows:
Considering the object detection scene, if the intersection over union (IoU) between the detected bounding box and the truth bounding box is greater than 0.5 and the category prediction of this bounding box equals to its ground-truth, then this detection result is approved as TP. Detected bounding boxes other than TP are approved as FP. The missed detection objects are considered as FN. As for the TN, it is not meaningful for an object detection task. In addition, no more than one detected bounding box is taken as TP when there are several detected bounding boxes meeting the IoU threshold, and he other detected bounding boxes are considered as FP.
Moreover, we calculate the average IoU between the detection bounding box and the corresponding ground-truth to evaluate the location accuracy.
3.3. Baseline Method
On the NWPU VHR-10 dataset, the performance of the proposed algorithm is compared with both traditional algorithms and deep learning algorithms, which include SSCBoW [60], COPD [15], transferred CNN [57], RICNN [57], RP-Faster R-CNN [61], SSD512 [27], DSOD300 [62], deformable R-FCN [59], Faster R-CNN [63], PSB [64], SAPNet [65] and deformable faster R-CNN [66]. As for the DOTA dataset, only several deep algorithms are selected for comparison, including SSD [27], YOLO v2 [67], R-FCN [68], YOLO v3 [44], R-DFPN [69], RRPN [61,70] and RoI Transformer [71], ICN [72]. In addition, the result of YOLO v3 [44] and results from [73] are selected for comparison, to verify the performance of location accuracy of the proposed algorithm.
3.4. Implementation Details
The proposed algorithm was implemented by Pytorch framework and executed on a windows computer with AMD Ryzen 7 2700 3.2 GHz Eight-Core Processor and GeForce GTX 1080 GPU with 8 GB memory, CUDA 9.0, cuDNN 9.0.
The parameters of our models were initialized by the Kaiming strategy [74]. The models were trained end-to-end by using the Adam [75] algorithm as an optimizer, where the learning rate was fixed to 0.0001 and the default values were adopted for other Adam hyper-parameters. The hyper-parameters in the loss function are mentioned above. In addition, the batch size is set to 8 for both datasets considering the limitation of the GPU memory.
During training, all the images were scaled to 608 × 608 and the RandomChoice operate was applied to each image for preprocessing. The adopted data augment strategies included: random mirror flips, random rotation (), random shift (translation range was 20 px), random Gaussian blur (), random adjustment of exposure and saturation ( times of original image).
4. Results
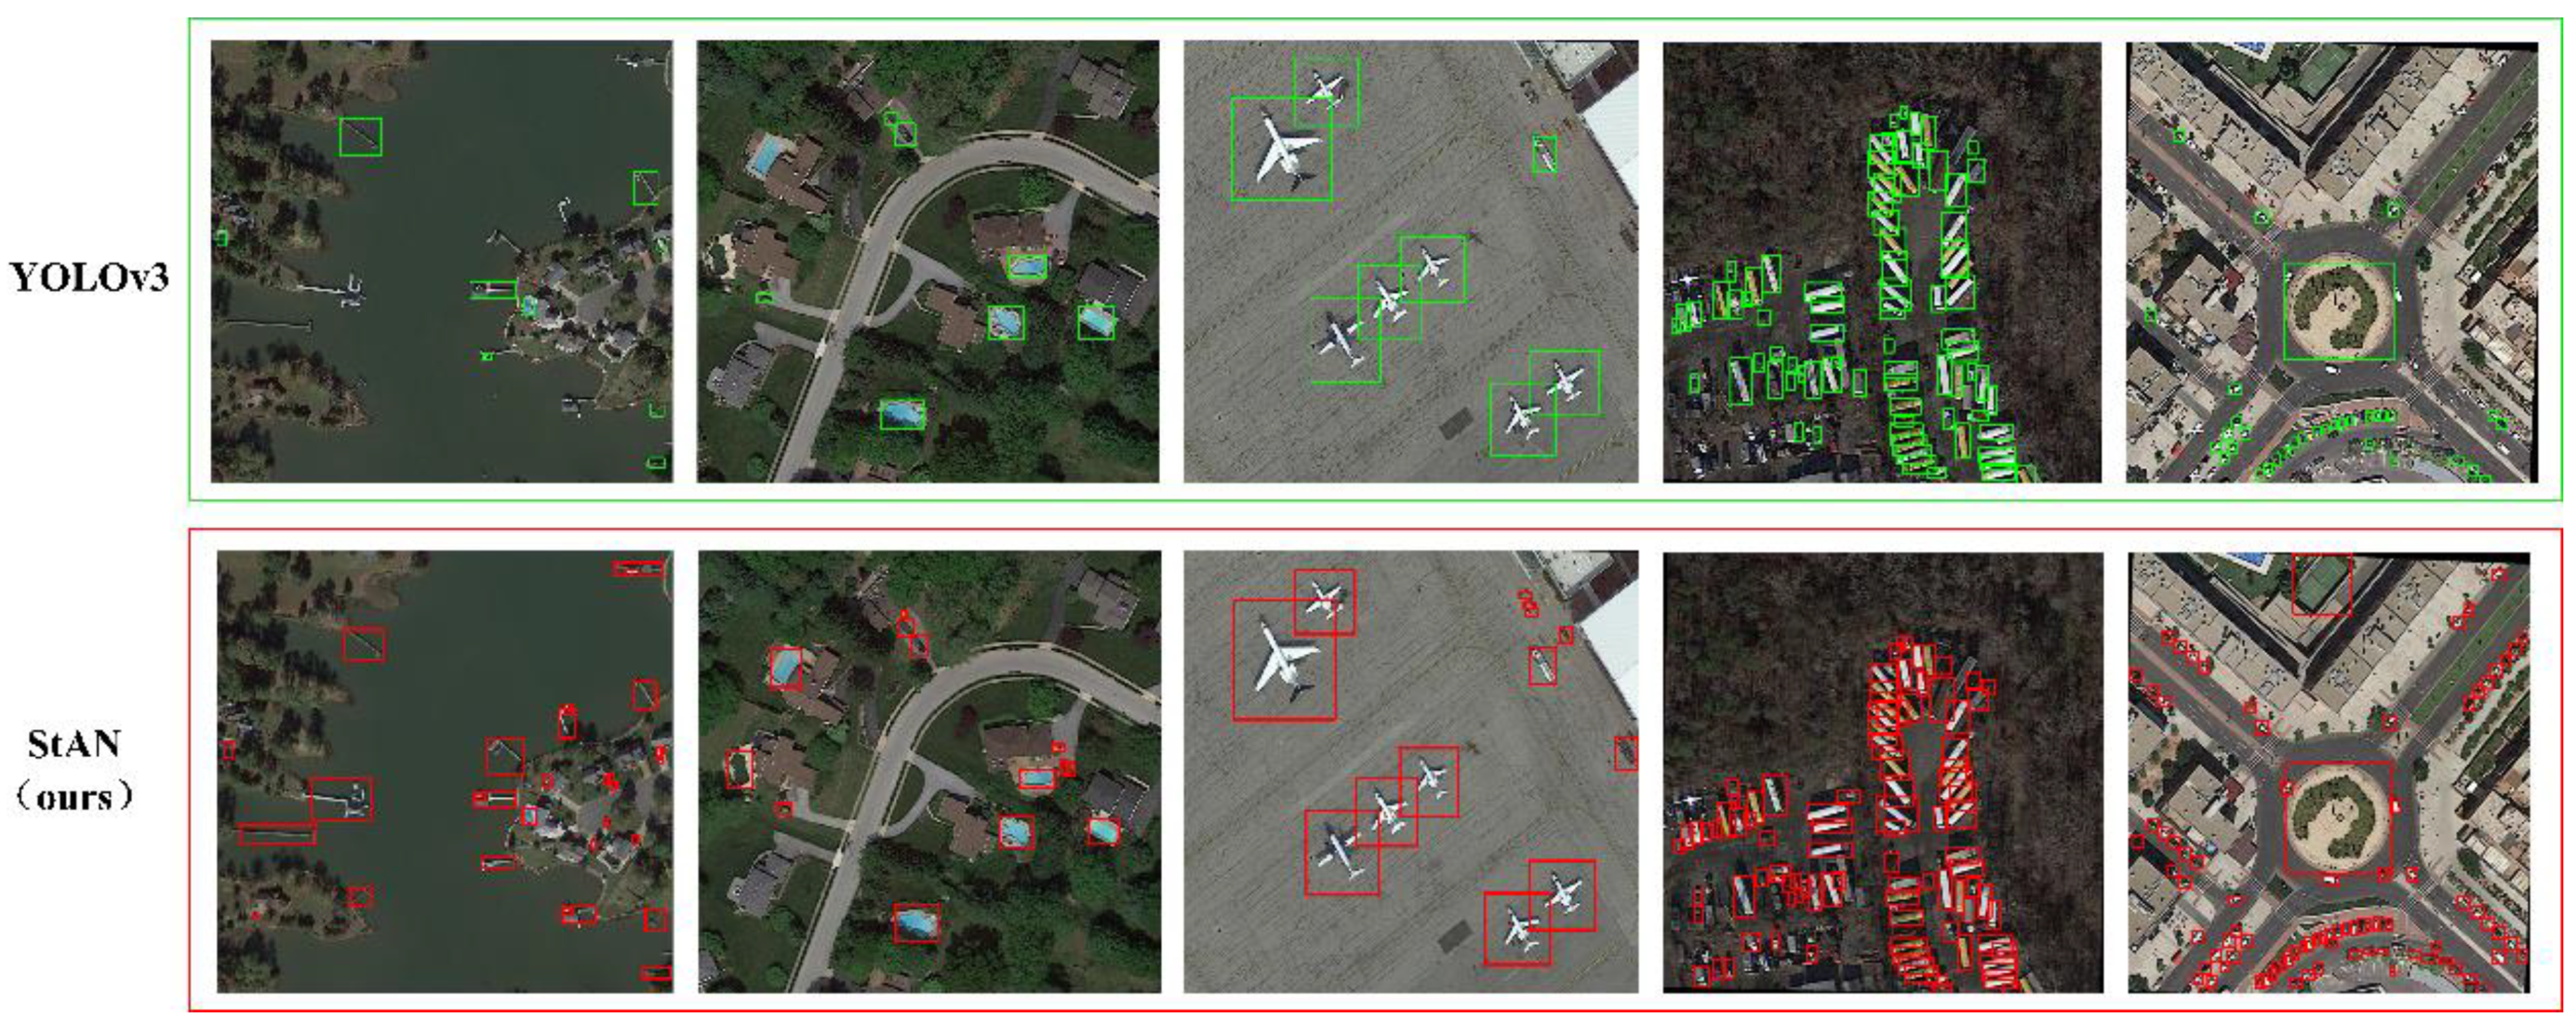
We trained both the proposed StAN and StAN-Enh models on the NWPU VHR-10 and DOTA datasets. Some of the test results of the StAN model on the NWPU VHR-10 dataset are shown in the Figure 10, while the results of the StAN-Enh model on both datasets are shown in Figure 11. As the figures show, the proposed algorithm can detect most objects, no matter if large or small. Moreover, we show some results of YOLO v3 and the proposed StAN in Figure 12 for comparison. The results show that the performance in small object detection of the proposed StAN is perceptibly improved. Below, we quantitatively compare the proposed algorithm and the baseline methods and present an ablation experiment on the proposed gain modules.
4.1. Quantitative Comparison on NWPU VHR-10 Dataset
To prove the effectiveness of the proposed StAN model, we compare it with 11 existing algorithms on the NWPU VHR-10 dataset, in which SSCBoW and COPD are machine learning methods, while the other ones are based on deep learning technology. The nine deep learning-based methods include both SSD-based one-stage algorithms [27,62] and R-CNN-based two-stage algorithms [61,63,64,65]. These deep learning-based methods represent the SOTA in recent years. The AP values of each category and the mAP value are shown in Table 2, in which PL means plane, SH means ship, ST means storage tank, BD means baseball diamond, TC means tennis court, BC means basketball court, GT means ground track field, HA means harbor, BR means bridge and VE means vehicle. Of note, the values in Table 2 are magnified 100 times. As the results show, the proposed StAN and StAN-Enh achieve the SOTA performance. The mAP value of the StAN model is about 7% lower than the one of SAPNet, because the SAPNet adopts a series of special structures for multi-scale feature fusion, while the shared feature network of the StAN model just contains a basic residual structure. As for the enhancement version with the gain modules, its mAP value is only 0.3% lower than the one of SAPNet. Considering different categories of the NWPU VHR-10 dataset, the storage tank and vehicle are the two categories of small objects. For the storage tank, both StAN and StAN-Enh achieve the best performance and the AP values are significantly higher than with other algorithms. For the smallest vehicle, StAN-Enh performs much better than the other algorithms, for example, the AP value of StAN-Enh is 8.7% higher than the one of SAPNet, which performs best at comparison algorithms. Such results show the success in small object detection based on our strategy that handles the detection task in low-level features. On the other hand, the proposed StAN-Enh performs worse on big objects compared to SAPNet. There are two possible reasons for such results. First, the multilayer RPNs of SAPNet can generate candidate boxes that are more favorable to the larger objects. Second, the nine anchors of our algorithms are obtained through k-means clustering on the ground-truth bounding boxes of the training data, and the proportion of small objects is higher than the one of large objects in the training set, which causes the anchor priors to favor small size.
In addition to the AP and MAP values, we calculated the average IoU of the StAN model and compared it with the algorithms in [73]. As shown in Table 3, the proposed StAN model achieves a higher location accuracy, which further proves the correctness of the detection task on the shallow layer features. The in Table 3 means the growth value compared to baseline methods.
Table 4 shows the average running time of some comparison algorithms and our model, in which the results of comparison algorithms are obtained from literatures [57,59]. The SSCBow and COPD are machine learning-based algorithms and tested on a PC with two 2.8 GHz 6-core CPUs and 32 GB memory [57]. Other algorithms are deep learning-based algorithms tested on the PC with NVIDIA GPUs. According to the result, our model is faster than most comparison algorithms, no matter if machine learning-based algorithms or deep learning-based ones. The deformable R-FCN obtains the best computation performance and only needs an average of 0.201 s for each test image. However, considering that GTX 1080 Ti improves overall performance by more than 30% over the GTX 1080, our algorithm’s time cost is generally acceptable.
4.2. Quantitative Comparison on DOTA Dataset
Based on the DOTA dataset, we compared the proposed models with eight deep learning-based algorithms. The mAP values of each algorithm are shown in Table 5, and the values are magnified 100 times. means the growth value of the proposed models compared to the baseline methods. As shown in Table 5, the mAP value of the StAN model is just below RoI Transformer and ICN. As for StAN-Enh, its mAP value is 2.15% lower than the one of ICN. The proposed algorithm performs better on small objects but has limitations on the large objects, as can be seen in Table 2. The DOTA dataset contains more categories of large objects, such as a tennis court, soccer ball field and ground track field. Therefore, the mAP value is more reflective of the performance of detecting large objects, which may be a partial reason why the mAP value of the proposed StAN-Enh is lower. In addition, the ICN are two-stage detection algorithms and our proposed models have exceeded all the one-stage algorithms used for comparison.
We also calculated the average IoU of the StAN based on the DOTA dataset and compared it with YOLO v3. According to the result, our detection algorithm has a better location accuracy (Table 6).
4.3. Ablation Experiment
In this Subsection, we show the results of the ablation experiment proving the effectiveness of the proposed gain modules. The results on the NWPU VHR-10 dataset are shown in Table 7 and Table 8, and results on the DOTA dataset in Table 9 and Table 10. The results show that all the gain modules can bring performance improvements of both detection ability and location accuracy. The TPA module, especially, makes the best improvement, because it is based on supervised learning, which can effectively suppress the background noise.
5. Conclusions
In this paper, the StAN model, designed based on the multi-task framework MTAN, is proposed to improve the missing detection of small objects in remote sensing object detection task. The StAN contains one shared feature branch and two subtask attention branches of a semantic auxiliary subtask and a detection subtask. In contrast to the general strategy of existing algorithms, such as SAPNet and ICN which handle the drastic scale variation by multi-scale feature fusion, the detection subtask uses only low-level features considering small objects. Then the semantic auxiliary branch here is used to keep the identification ability by the attention map guidance mechanism, which benefits from the high-level semantic features. Furthermore, three gain modules are proposed to make further improvement; namely, MdS, GMulW and TPA. These modules are integrated into the StAN model which is then named StAN-Enh. The results of experiments on two common datasets demonstrate that the proposed StAN and StAN-Enh achieve the SOTA performance. Although the mAP of our model is slightly lower than the one of SAPNet and ICN, the ability of small object detection is significantly improved. On the other hand, the calculation of the average IoU proves that the handle detection task on a shallow layer of a deep network is beneficial to accurate location.
Although the proposed algorithm performs well on small objects, it has some limitations on large objects. The reason for this may be that we adopt the same anchor setting as YOLO v3, which is unable to cope with such a drastic scale change. In the future work, we will try to combine the proposed algorithm with the two-stage detection framework which uses a region proposal network (RPN) to generate candidate boxes rather than an anchor. The challenge is in the control of the increase of time consumption. Moreover, the feature pyramid-based multi-scale feature fusion will be considered in the RPN design to improve the processing performance of multi-scale objects, which was demonstrated to be effective by both SAPNet and ICN. On the other hand, the two-stage frameworks are generally more time consuming than the one-stage frameworks. However, our one-stage model has worse time efficiency than the two-stage deformable R-FCN that takes a deeper ResNet as a backbone. The efficiency optimization of the gain modules and the subtask branch is therefore one of our future goals.
Author Contributions
Conceptualization, Y.T. and S.X.; methodology, S.X.; validation, C.W. and P.Y.; investigation, S.X., Y.T. and Y.L.; writing—original draft preparation, S.X. and Y.T.; writing—review and editing, Y.L.; visualization, S.X.; supervision, Y.T. and Y.L.; project administration, Y.T.; funding acquisition, Y.L. and Y.T. All authors have read and agreed to the published version of the manuscript.
Funding
This research was funded by Shenzhen Basic Research Program, grant number JCYJ20180305180708546; National Natural Science Foundation of China, grant number 41971284.
Institutional Review Board Statement
Not applicable.
Informed Consent Statement
Not applicable.
Data Availability Statement
The experiments are conducted on publicly open datasets. The download of the publicly open datasets can refer to the corresponding published papers. We do not repeat it here again.
Acknowledgments
Thanks for the comments from reviewers and editors.
Conflicts of Interest
The authors declare no conflict of interest.
References
- Cheng, G.; Han, J. A Survey on Object Detection in Optical Remote Sensing Images. ISPRS J. Photogramm. Remote Sens. 2016, 117, 11–28. [Google Scholar] [CrossRef] [Green Version]
- Chi, M.; Plaza, A.; Benediktsson, J.; Shen, J.; Zhu, Y. Big data for remote sensing: Challenges and opportunities. Proc. IEEE 2016, 104, 2207–2219. [Google Scholar] [CrossRef]
- Li, Y.; Ma, J.; Zhang, Y. Image retrieval from remote sensing big data: A survey. Inf. Fusion 2021, 67, 94–115. [Google Scholar] [CrossRef]
- Li, Y.; Zhang, Y.; Zhu, Z. Error-Tolerant Deep Learning for Remote Sensing Image Scene Classification. IEEE Trans. Cybern. 2021, 51, 1756–1768. [Google Scholar] [CrossRef]
- Liu, G.; Sun, X.; Fu, K.; Wang, H. Aircraft Recognition in High-Resolution Satellite Images Using Coarse-to-Fine Shape Prior. IEEE Geosci. Remote Sens. Lett. 2013, 10, 573–577. [Google Scholar] [CrossRef]
- Ok, A.O.; Senaras, C.; Yuksel, B. Automated detection of arbitrarily shaped buildings in complex environments from monocular VHR optical satellite imagery. IEEE Trans. Geosci. Remote Sens. 2013, 51, 1701–1717. [Google Scholar] [CrossRef]
- Blaschke, T.; Hay, G.J.; Kelly, M.; Lang, S.; Hofmann, P.; Addink, E.; Feitosa, R.Q.; van der Meer, F.; van der Werff, H.; van Coillie, F.; et al. Geographic object-based image analysis–towards a new paradigm. ISPRS J. Photogramm. Remote Sens. 2014, 87, 180–191. [Google Scholar] [CrossRef] [PubMed] [Green Version]
- Liu, K.; Mattyus, G. Fast multiclass vehicle detection on aerial images. IEEE Geosci. Remote Sens. Lett. 2015, 9, 1938–1942. [Google Scholar]
- Cheng, G.; Han, J.; Guo, L.; Qian, X.; Zhou, P.; Yao, X.; Hu, X. Object detection in remote sensing imagery using a discriminatively trained mixture model. ISPRS J. Photogramm. Remote Sens. 2013, 85, 32–43. [Google Scholar] [CrossRef]
- Tao, C.; Tan, Y.; Cai, H.; Tian, J. Airport detection from large IKONOS images using clustered SIFT keypoints and region information. IEEE Geosci. Remote Sens. Lett. 2011, 1, 128–132. [Google Scholar] [CrossRef]
- Li, Y.; Zhang, Y. Robust infrared small target detection using local steering kernel reconstruction. Pattern Recognit. 2018, 77, 113–125. [Google Scholar] [CrossRef]
- Zhang, L.; Zhang, L.; Tao, D.; Huang, X. A multifeature tensor for remotesensing target recognition. IEEE Geosci. Remote Sens. Lett. 2011, 8, 374–378. [Google Scholar] [CrossRef]
- Xu, S.; Fang, T.; Li, D.; Wang, S. Object classification of aerial images with bag of visual words. IEEE Geosci. Remote Sens. Lett. 2010, 7, 366–370. [Google Scholar]
- Xia, G.; Wang, Z.; Xiong, C.; Zhang, L. Accurate annotation of remote sensing images via active spectral clustering with little expert knowledge. Remote Sens. 2015, 7, 15014–15045. [Google Scholar] [CrossRef] [Green Version]
- Cheng, G.; Han, J.; Zhou, P.; Guo, L. Multi-class geospatial object detection and geographic image classification based on collection of part detectors. ISPRS J. Photogramm. Remote Sens. 2014, 98, 119–132. [Google Scholar] [CrossRef]
- Zhang, D.; Han, J.; Cheng, G.; Liu, Z.; Bu, S.; Guo, L. Weakly supervised learning for target detection in remote sensing images. IEEE Geosci. Remote Sens. Lett. 2015, 12, 701–705. [Google Scholar] [CrossRef]
- Zhong, P.; Wang, R. A multiple conditional random fields ensemble model for urban area detection in remote sensing optical images. IEEE Trans. Geosci. Remote Sens. 2007, 45, 3978–3988. [Google Scholar] [CrossRef]
- Li, E.; Femiani, J.; Xu, S.; Zhang, X.; Wonka, P. Robust rooftop extraction from visible band images using higher order CRF. IEEE Trans. Geosci. Remote Sens. 2015, 53, 4483–4495. [Google Scholar] [CrossRef]
- Yao, X.; Han, J.; Guo, L.; Bu, S.; Liu, Z. A coarse-to-fine model for airport detection from remote sensing images using targetoriented visual saliency and CRF. Neurocomputing 2015, 164, 162–172. [Google Scholar] [CrossRef]
- Cheng, G.; Guo, L.; Zhao, T.; Han, J.; Li, H.; Fang, J. Automatic landslide detection from remote-sensing imagery using a scene classification method based on BoVW and pLSA. Int. J. Remote Sens. 2013, 34, 45–59. [Google Scholar] [CrossRef]
- Ari, C.; Aksoy, S. Detection of compound structures using a Gaussian mixture model with spectral and spatial constraints. IEEE Trans. Geosci. Remote Sens. 2014, 52, 6627–6638. [Google Scholar] [CrossRef]
- Shi, Z.; Yu, X.; Jiang, Z.; Li, B. Ship detection in high-resolution optical imagery based on anomaly detector and local shape feature. IEEE Trans. Geosci. Remote Sens. 2014, 52, 4511–4523. [Google Scholar]
- Dong, Y.; Du, B.; Zhang, L. Target detection based on random forest metric learning. IEEE J. Sel. Top. Appl. Earth Observ. Remote Sens. 2015, 8, 1830–1838. [Google Scholar] [CrossRef]
- Krizhevsky, A.; Sutskever, I.; Hinton, G.E. Imagenet classification with deep convolutional neural networks. In Proceedings of the Advances in Neural Information Processing Systems, Lake Tahoe, NV, USA, 3–6 December 2012; pp. 1097–1105. [Google Scholar]
- Girshick, R.; Donahue, J.; Darrell, T.; Malik, J. Rich feature hierarchies for accurate object detection and semantic segmentation. In Proceedings of the IEEE Conference on Computer Vision and Pattern Recognition, Columbus, OH, USA, 23–28 June 2014. [Google Scholar]
- Redmon, J.; Divvala, S.; Girshick, R.; Farhadi, A. You only look once: Unified, real-time object detection. In Proceedings of the IEEE Conference on Computer Vision and Pattern Recognition, Las Vegas, NV, USA, 27–30 June 2016. [Google Scholar]
- Liu, W.; Anguelov, D.; Erhan, D.; Szegedy, C.; Reed, C.; Fu, C.; Berg, A.C. SSD: Single Shot Multibox Detector. In Proceedings of the European Conference on Computer Vision, Amsterdam, The Netherlands, 11–14 October 2016. [Google Scholar]
- Li, Y.; Zhang, Y.; Huang, X.; Yuille, A. Deep networks under scene-level supervision for multi-class geospatial object detection from remote sensing images. ISPRS J. Photogramm. Remote Sens. 2018, 146, 182–196. [Google Scholar] [CrossRef]
- Li, Y.; Chen, W.; Zhang, Y.; Tao, C.; Xiao, R.; Tan, Y. Accurate cloud detection in high-resolution remote sensing imagery by weakly supervised deep learning. Remote Sens. Environ. 2020, 250, 112045. [Google Scholar] [CrossRef]
- Zhang, L.; Shi, Z.; Wu, J. A Hierarchical Oil Tank Detector with Deep Surrounding Features for High-Resolution Optical Satellite Imagery. IEEE J. Sel. Top. Appl. Earth Observ. Remote Sens. 2017, 8, 4895–4909. [Google Scholar] [CrossRef]
- Yang, Y.; Zhuang, Y.; Bi, F.; Shi, H.; Xie, Y. M-FCN: Effective Fully Convolutional Network-Based Airplane Detection Framework. IEEE Geosci. Remote Sens. Lett. 2017, 14, 1293–1297. [Google Scholar] [CrossRef]
- Long, Y.; Gong, Y.; Xiao, Z.; Liu, Q. Accurate Object Localization in Remote Sensing Images Based on Convolutional Neural Networks. IEEE Trans. Geosci. Remote Sens. 2017, 55, 2486–2498. [Google Scholar] [CrossRef]
- Li, Y.; Shi, T.; Zhang, Y.; Chen, W.; Wang, Z.; Li, H. Learning deep semantic segmentation network under multiple weakly-supervised constraints for cross-domain remote sensing image semantic segmentation. ISPRS J. Photogramm. Remote Sens. 2021, 175, 20–33. [Google Scholar] [CrossRef]
- Kang, M.; Ji, K.; Leng, X.; Lin, Z. Contextual region-based convolutional neural network with multilayer fusion for SAR ship detection. Remote Sens. 2017, 9, 860. [Google Scholar] [CrossRef] [Green Version]
- Li, K.; Cheng, G.; Bu, S.; You, X. Rotation-insensitive and context-augmented object detection in remote sensing images. IEEE Trans. Geosci. Remote Sens. 2017, 56, 2337–2348. [Google Scholar] [CrossRef]
- Cheng, L.; Liu, X.; Li, L.; Jiao, L.; Tang, X. Deep Adaptive Proposal Network for Object Detection in Optical Remote Sensing Images. arXiv 2018, arXiv:1807.07327. [Google Scholar]
- Tang, T.; Zhou, S.; Deng, Z.; Zou, H.; Lei, L. Vehicle Detection in Aerial Images Based on Region Convolutional Neural Networks and Hard Negative Example Mining. Sensors 2017, 17, 336. [Google Scholar] [CrossRef] [PubMed] [Green Version]
- Liu, W.; Ma, L.; Chen, H. Arbitrary-Oriented Ship Detection Framework in Optical Remote-Sensing Images. IEEE Geosci. Remote Sens. Lett. 2018, 15, 937–941. [Google Scholar] [CrossRef]
- Etten, A.V. You Only Look Twice: Rapid Multi-Scale Object Detection in Satellite Imagery. arXiv 2018, arXiv:1805.09512. [Google Scholar]
- Liu, L.; Pan, Z.; Lei, B. Learning a Rotation Invariant Detector with Rotatable Bounding Box. arXiv 2017, arXiv:1711.09405. [Google Scholar]
- Chen, S.; Zhan, R.; Zhang, J. Geospatial Object Detection in Remote Sensing Imagery Based on Multiscale Single-Shot Detector with Activated Semantics. Remote Sens. 2018, 10, 820. [Google Scholar] [CrossRef] [Green Version]
- Cui, L.; Ma, R.; Lv, P.; Jiang, X.; Gao, Z.; Zhou, B.; Xu, M. MDSSD: Multi-scale deconvolutional single shot detector for small objects. Sci. China Inf. Sci. 2020, 63, 120113:1–120113:3. [Google Scholar] [CrossRef] [Green Version]
- Liu, S.; Johns, E.; Davison, A.J. End-to-end multi-task learning with attention. In Proceedings of the IEEE Conference on Computer Vision and Pattern Recognition, Long Beach, CA, USA, 16–20 June 2019. [Google Scholar]
- Redmon, J.; Farhadi, A. Yolov3: An Incremental Improvement. arXiv 2018, arXiv:1804.02767. [Google Scholar]
- He, K.; Zhang, X.; Ren, S.; Sun, J. Deep Residual Learning for Image Recognition. In Proceedings of the IEEE Conference on Computer Vision and Pattern Recognition, Las Vegas, NV, USA, 27–30 June 2016. [Google Scholar]
- Bi, F.; Hou, J.; Chen, L.; Yang, Z.; Wang, Y. Ship Detection for Optical Remote Sensing Images Based on Visual Attention Enhanced Network. Sensors 2019, 19, 2271. [Google Scholar] [CrossRef] [Green Version]
- Chen, J.; Wan, L.; Zhu, J.; Xu, G.; Deng, M. Multi-Scale Spatial and Channel-wise Attention for Improving Object Detection in Remote Sensing Imagery. IEEE Geosci. Remote Sens. Lett. 2019, 17, 681–685. [Google Scholar] [CrossRef]
- Zhang, Q.; Cong, R.; Li, C.; Cheng, M.; Fang, Y.; Cao, X.; Zhao, Y.; Kwong, S. Dense Attention Fluid Network for Salient Object Detection in Optical Remote Sensing Images. IEEE Trans. Image Process. 2020, 30, 1305–1317. [Google Scholar] [CrossRef]
- Yin, W.; Diao, W.; Wang, P.; Gao, X.; Li, Y.; Sun, X. PCAN—Part-Based Context Attention Network for Thermal Power Plant Detection in Remote Sensing Imagery. Remote Sens. 2021, 13, 1243. [Google Scholar] [CrossRef]
- Szegedy, C.; Liu, W.; Jia, Y.; Sermanet, P.; Reed, S.; Anguelov, D.; Erhan, D.; Vanhoucke, V.; Rabinovich, A. Going Deeper with Convolutions. In Proceedings of the IEEE Conference on Computer Vision and Pattern Recognition, Boston, MA, USA, 7–12 June 2015. [Google Scholar]
- Yu, F.; Koltun, V. Multi-scale Context Aggregation by Dilated Convolutions. arXiv 2015, arXiv:1511.07122. [Google Scholar]
- Chollet, F. Xception: Deep Learning with Depthwise Separable Convolutions. In Proceedings of the IEEE Conference on Computer Vision and Pattern Recognition, Honolulu, HI, USA, 21–26 July 2017. [Google Scholar]
- Woo, S.; Park, J.; Lee, J.Y.; Kweon, I.S. CBAM: Convolutional Block Attention Module. In Proceedings of the European Conference on Computer Vision, Munich, Germany, 8–14 September 2018. [Google Scholar]
- Zhao, Z.; Li, J.; Luo, Z.; Li, J.; Chen, C. Remote Sensing Image Scene Classification Based on an Enhanced Attention Module. IEEE Geosci. Remote Sens. Lett. 2020. [Google Scholar] [CrossRef]
- Kalantidis, Y.; Mellina, C.; Osindero, S. Cross-dimensional Weighting for Aggregated Deep Convolutional Features. In Proceedings of the European Conference on Computer Vision, Amsterdam, The Netherlands, 11–14 October 2016. [Google Scholar]
- Yang, X.; Yang, J.; Yan, J.; Zhang, Y.; Zhang, T.; Guo, Z.; Sun, X.; Kun, F. SCRDet: Towards More Robust Detection for Small, Cluttered and Rotated Objects. In Proceedings of the International Conference on Computer Vision, Seoul, Korea, 27 October–3 November 2019. [Google Scholar]
- Cheng, G.; Zhou, P.; Han, J. Learning Rotation-Invariant Convolutional Neural Networks for Object Detection in VHR Optical Remote Sensing Images. IEEE Trans. Geosci. Remote Sens. 2016, 54, 7405–7415. [Google Scholar] [CrossRef]
- Xia, G.; Bai, X.; Ding, J.; Zhu, Z.; Belongie, S.; Luo, J.; Datcu, M.; Pelillo, M.; Zhang, L. DOTA: A Large-scale Dataset for Object Detection in Aerial Images. In Proceedings of the IEEE Conference on Computer Vision and Pattern Recognition, Salt Lake City, UT, USA, 18–23 June 2018. [Google Scholar]
- Xu, Z.; Xu, X.; Wang, L.; Yang, R.; Pu, F. Deformable ConvNet with Aspect Ratio Constrained NMS for Object Detection in Remote Sensing Imagery. Remote Sens. 2017, 9, 1312. [Google Scholar] [CrossRef] [Green Version]
- Sun, H.; Sun, X.; Wang, H.; Li, X. Automatic Target Detection in High-Resolution Remote Sensing Images Using Spatial Sparse Coding Bag-of-Words Model. IEEE Geosci. Remote Sens. Lett. 2011, 9, 109–113. [Google Scholar] [CrossRef]
- Han, X.; Zhong, Y.; Zhang, L. An Efficient and Robust Integrated Geospatial Object Detection Framework for High Spatial Resolution Remote Sensing Imagery. Remote Sens. 2017, 9, 666. [Google Scholar] [CrossRef] [Green Version]
- Shen, Z.; Liu, Z.; Li, J.; Jiang, Y.; Chen, Y.; Xue, X. DSOD: Learning Deeply Supervised Object Detectors from Scratch. In Proceedings of the International Conference on Computer Vision, Venice, Italy, 22–29 October 2017. [Google Scholar]
- Ren, S.; He, K.; Girshick, R.; Sun, J. Faster R-CNN: Towards Real-Time Object Detection with Region Proposal Networks. In Proceedings of the Advances in Neural Information Processing Systems, Montreal, QC, Canada, 7–12 December 2015; pp. 91–99. [Google Scholar]
- Kilic, E.; Ozturk, S. A subclass supported convolutional neural network for object detection and localization in remote-sensing images. Int. J. Remote Sens. 2019, 40, 4193–4212. [Google Scholar] [CrossRef]
- Zhang, S.; He, G.; Chen, H.; Jing, N.; Wang, Q. Scale Adaptive Proposal Network for Object Detection in Remote Sensing Images. IEEE Geosci. Remote Sens. Lett. 2019, 16, 864–868. [Google Scholar] [CrossRef]
- Ren, Y.; Zhu, C.; Xiao, S. Deformable Faster R-CNN with Aggregating Multi-Layer Features for Partially Occluded Object Detection in Optical Remote Sensing Images. Remote Sens. 2018, 10, 1470. [Google Scholar] [CrossRef] [Green Version]
- Redmon, J.; Farhadi, A. YOLO9000: Better, Faster, Stronger. In Proceedings of the IEEE Conference on Computer Vision and Pattern Recognition, Honolulu, HI, USA, 21–26 July 2017; pp. 7263–7271. [Google Scholar]
- Dai, J.; Li, Y.; He, K.; Sun, J. R-FCN: Object Detection via Region-based Fully Convolutional Networks. In Proceedings of the Advances in Neural Information Processing Systems, Barcelona, Spain, 5–10 December 2016; pp. 379–387. [Google Scholar]
- Yang, X.; Sun, H.; Fu, K.; Yang, J.; Sun, X.; Yan, M.; Guo, Z. Automatic Ship Detection in Remote Sensing Images from Google Earth of Complex Scenes Based on Multiscale Rotation Dense Feature Pyramid Networks. Remote Sens. 2018, 10, 132. [Google Scholar] [CrossRef] [Green Version]
- Ma, J.; Shao, W.; Ye, H.; Wang, L.; Wang, H.; Zheng, Y.; Xue, X. Arbitrary-Oriented Scene Text Detection via Rotation Proposals. IEEE Trans. Multimed. 2018, 20, 3111–3122. [Google Scholar] [CrossRef] [Green Version]
- Ding, J.; Xue, N.; Long, Y.; Xia, G.; Lu, Q. Learning RoI Transformer for Detecting Oriented Objects in Aerial Images. arXiv 2018, arXiv:1812.00155. [Google Scholar]
- Azimi, S.M.; Vig, E.; Bahmanyar, R.; Körner, M.; Reinartz, P. Towards Multi-class Object Detection in Unconstrained Remote Sensing Imagery. In Proceedings of the Asian Conference on Computer Vision, Perth, WA, Australia, 2–6 December 2018; pp. 150–165. [Google Scholar]
- Zhu, H.; Zhang, P.; Wang, L.; Zhang, X.; Jiao, L. A multiscale object detection approach for remote sensing images based on MSE-DenseNet and the dynamic anchor assignment. Remote Sens. Lett. 2019, 10, 959–967. [Google Scholar] [CrossRef]
- He, K.; Zhang, X.; Ren, S.; Sun, J. Delving Deep into Rectifiers: Surpassing Human-Level Performance on ImageNet Classification. In Proceedings of the International Conference on Computer Vision, Santiago, Chile, 7–13 December 2015; pp. 1026–1034. [Google Scholar]
- Kingma, D.P.; Ba, J. Adam: A Method for Stochastic Optimization. arXiv 2014, arXiv:1412.6980. [Google Scholar]
Figure 1.
The overall architecture of the proposed StAN model.

Figure 2.
The overall architecture of the MTAN model in literature [43].
Figure 2.
The overall architecture of the MTAN model in literature [43].

Figure 3.
The implement detail of the proposed StAN model.

Figure 4.
The implement detail of the core modules in StAN model. On the left is the architecture of the Res block, in the middle is the architecture of the pre_block and on the right is the architecture of the attention block.
Figure 4.
The implement detail of the core modules in StAN model. On the left is the architecture of the Res block, in the middle is the architecture of the pre_block and on the right is the architecture of the attention block.

Figure 5.
The architecture of the MdS module.

Figure 6.
The form of integrating the MdS module into a shared feature network.

Figure 7.
The overall architecture of the GMulW module.

Figure 8.
The details of the core parts in the GMulW module. On the left is the architecture of the multi-view channel attention module and on the right the architecture of the spatial attention module.
Figure 8.
The details of the core parts in the GMulW module. On the left is the architecture of the multi-view channel attention module and on the right the architecture of the spatial attention module.

Figure 9.
The architecture of the TPA module.

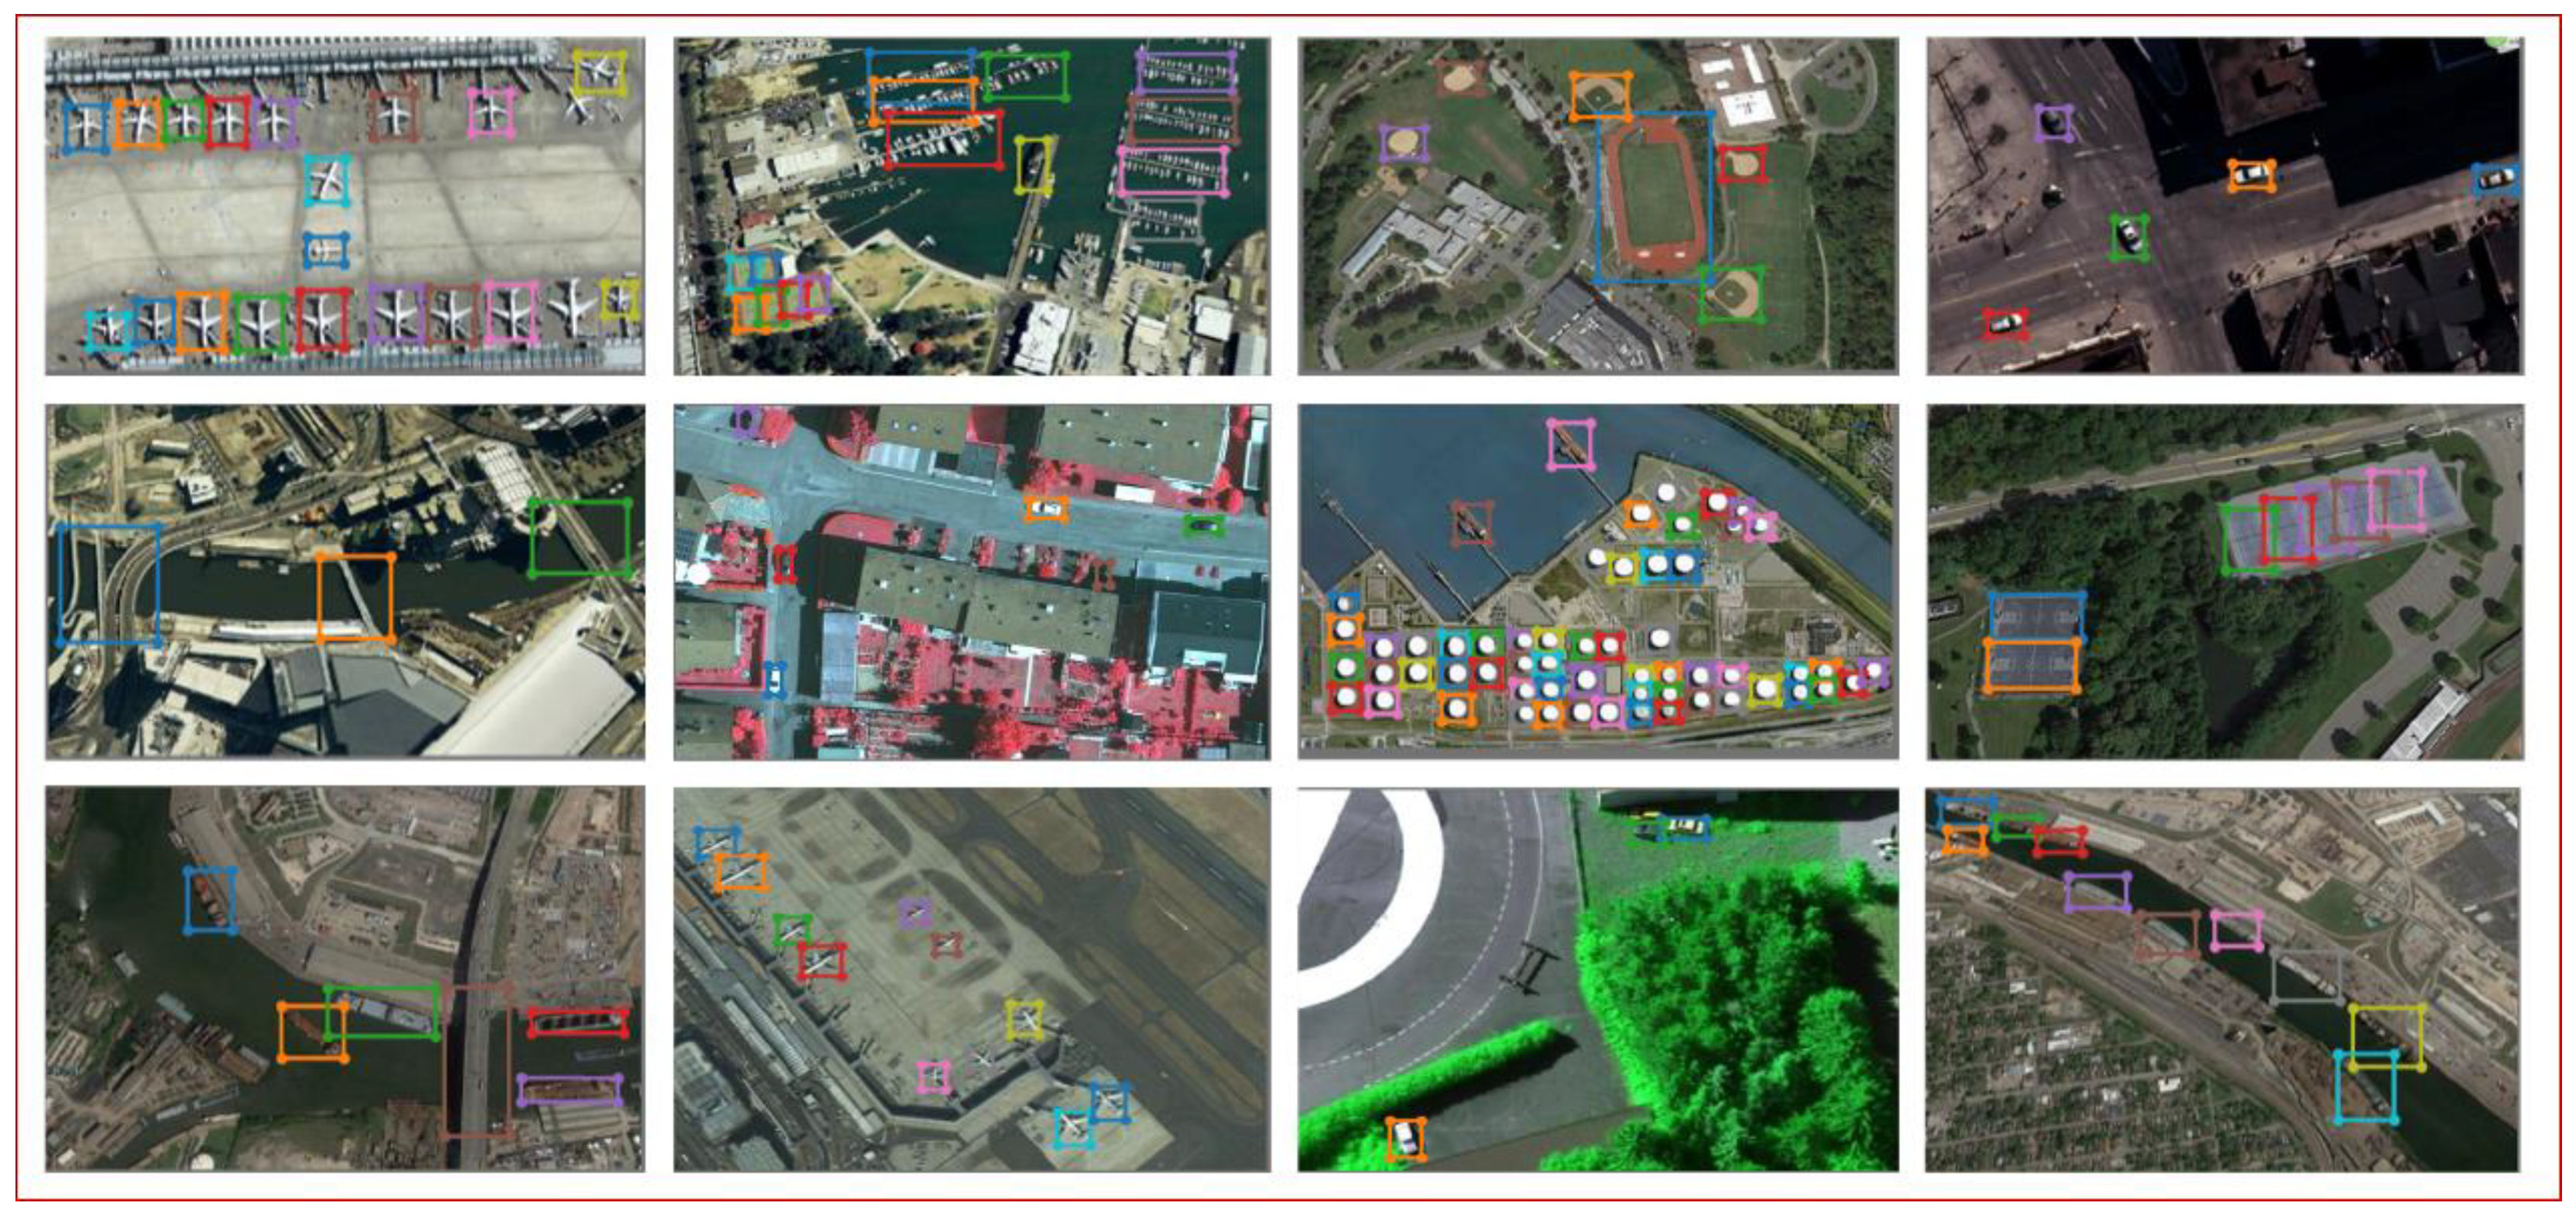
Figure 10.
Results of the StAN model on the NWPU VHR-10 dataset.

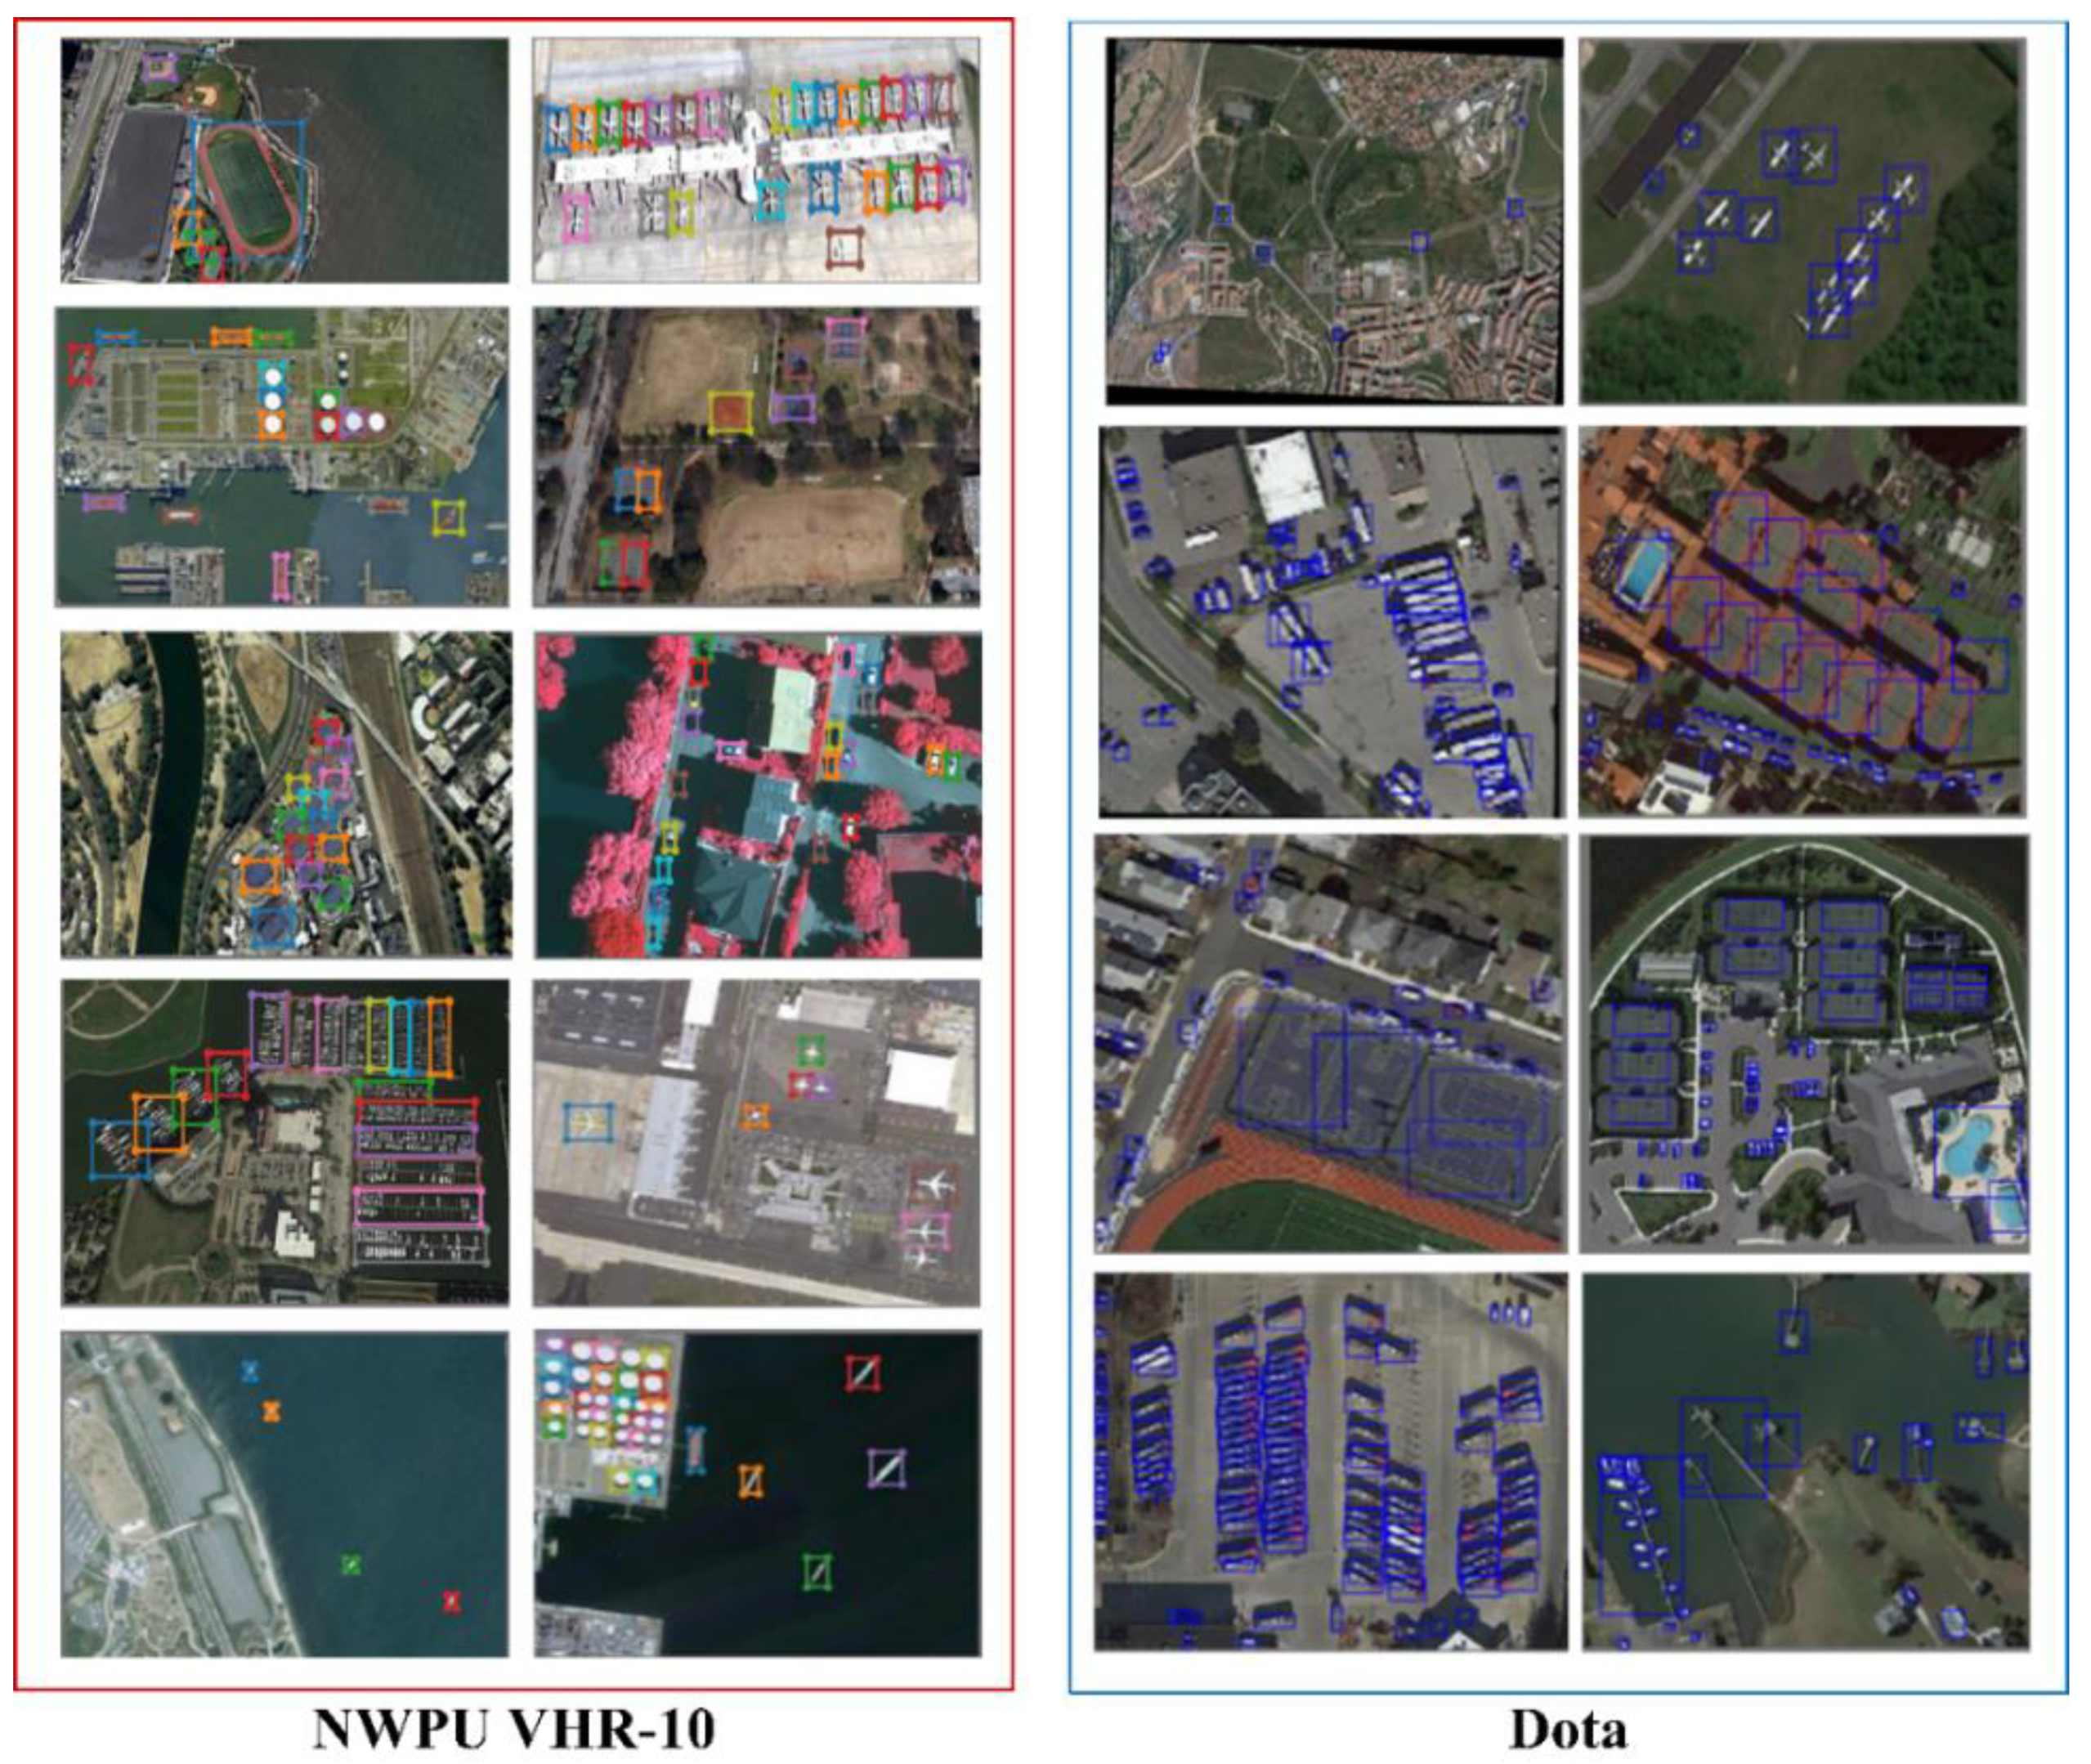
Figure 11.
Results of the StAN-Enh model.

Figure 12.
Comparison between YOLO v3 and StAN on DOTA.


Table 1.
The Confusion matrix.
| Actual | 0 | 1 | |
|---|---|---|---|
| Predict | |||
| 0 | true negative (TN) | false negative (FN) | |
| 1 | false positive (FP) | true positive (TP) | |
Table 2.
Results of the Proposed Models and Other Baseline Methods on NWPU VHR-10.
| Method | AP for Each Target Category | mAP (×100) | |||||||||
|---|---|---|---|---|---|---|---|---|---|---|---|
| PL | SH | ST | BD | TC | BC | GT | HA | BR | VE | ||
| SSCBoW [60] | 50.61 | 50.84 | 33.37 | 43.49 | 0.33 | 14.96 | 10.07 | 58.33 | 12.49 | 33.61 | 30.81 |
| COPD [15] | 62.25 | 68.87 | 63.71 | 83.27 | 32.08 | 36.25 | 85.31 | 55.27 | 14.79 | 44.03 | 54.58 |
| Transferred CNN [57] | 66.10 | 56.90 | 84.30 | 81.60 | 35.00 | 45.90 | 80.00 | 62.00 | 42.30 | 42.90 | 59.70 |
| RICNN [57] | 88.35 | 77.34 | 85.27 | 88.12 | 40.83 | 58.45 | 86.73 | 68.60 | 61.51 | 71.10 | 72.63 |
| R-P-Faster R-CNN [61] | 90.40 | 75.00 | 44.40 | 89.90 | 79.00 | 77.60 | 87.70 | 79.10 | 68.20 | 73.20 | 76.50 |
| SSD512 [27] | 90.40 | 60.90 | 79.80 | 89.90 | 82.60 | 80.60 | 98.30 | 73.40 | 76.70 | 52.10 | 78.40 |
| DSOD300 [62] | 82.70 | 62.80 | 89.20 | 90.10 | 87.80 | 80.90 | 79.80 | 82.10 | 81.20 | 61.30 | 79.80 |
| Deformable R-FCN [59] | 87.30 | 81.40 | 63.60 | 90.40 | 81.60 | 74.10 | 90.30 | 75.30 | 71.40 | 75.50 | 79.10 |
| Faster R-CNN [63] | 94.60 | 82.30 | 65.32 | 95.50 | 81.90 | 89.70 | 92.40 | 72.40 | 57.50 | 77.80 | 80.90 |
| PSB [64] | 90.70 | 80.60 | 80.30 | 89.90 | 75.50 | 81.60 | 86.50 | 78.50 | 77.20 | 71.00 | 81.20 |
| SAPNet [65] | 97.80 | 87.60 | 67.20 | 94.80 | 99.50 | 99.50 | 95.90 | 96.80 | 68.00 | 85.10 | 89.20 |
| StAN(Ours) | 95.86 | 70.31 | 96.17 | 87.43 | 86.22 | 80.48 | 99.48 | 85.93 | 41.20 | 78.53 | 82.16 |
| StAN-Enh(Ours) | 94.80 | 79.10 | 98.20 | 96.70 | 89.10 | 89.60 | 93.50 | 91.00 | 62.70 | 93.80 | 88.9 |
Table 3.
Location Accuracy of StAN and Other Baseline Methods on NWPU VHR-10.
| Method | Average IoU (%) | |
|---|---|---|
| YOLOv3 [73] | 72.67 | 4.14 |
| YOLOv3 –DAA [73] | 73.83 | 2.98 |
| MSENet [73] | 73.70 | 3.11 |
| MSENet-DAA [73] | 74.34 | 2.47 |
| StAN(Ours) | 76.81 |
Table 4.
Computation Time Comparisons between StAN and Some Baseline Methods.
| SSCBow [60] | COPD [15] | Transferred CNN [57] | RICNN [57] | Deformable R-FCN [59] | StAN-Enh | |
|---|---|---|---|---|---|---|
| Average running time per image (second) | 40.32 | 1.07 | 5.24 | 8.77 | 0.201 | 0.52 |
| GPU | / | / | GTX Titan X | GTX Titan X | GTX 1080 Ti | GTX 1080 |
Table 5.
Results of StAN and Other Baseline Methods on DOTA.
| Method | mAP(×100) | ||
|---|---|---|---|
| SSD [27] | 10.94 | 51.46 | 59.36 |
| YOLOv2 [67] | 39.20 | 23.20 | 31.10 |
| R-FCN [68] | 47.24 | 15.16 | 23.06 |
| YOLOv3 [44] | 60.0 | 2.4 | 10.30 |
| R-DFPN [69] | 60.67 | 1.73 | 9.63 |
| RRPN [70] | 61.01 | 1.39 | 9.29 |
| RoI Transformer [71] | 69.56 | −7.16 | 0.74 |
| ICN [72] | 72.45 | −10.05 | −2.15 |
| StAN (Ours) | 62.4 | ||
| StAN-Enh (Ours) | 70.30 |
Table 6.
Location Accuracy of StAN and YOLO v3 on DOTA.
| Method | Average IoU (%) | |
|---|---|---|
| YOLOv3 [44] | 68.00 | 3.23 |
| StAN (Ours) | 71.23 |
Table 7.
Ablation Experiment on NWPU VHR-10.
| Method | mAP (×100) |
|---|---|
| StAN | 82.16 |
| StAN + MdS | 83.0 |
| StAN + MdS + GMulW | 85.6 |
| StAN + MdS + GMulW + TPA | 88.9 |
Table 8.
Ablation Experiment of Location Accuracy on NWPU VHR-10.
| Method | Average IoU (%) |
|---|---|
| StAN | 76.80 |
| StAN + MdS | 76.87 |
| StAN + MdS + GMulW | 76.92 |
| StAN + MdS + GMulW + TPA | 76.96 |
Table 9.
Ablation Experiment on DOTA.
| Method | mAP (×100) |
|---|---|
| StAN | 62.40 |
| StAN + MdS + GMulW | 64.70 |
| StAN + MdS + GMulW + TPA | 70.30 |
Table 10.
Ablation Experiment of Location Accuracy on DOTA.
| Method | Average IoU (%) |
|---|---|
| StAN | 71.23 |
| StAN + MdS + GMulW | 71.31 |
| StAN + MdS + GMulW + TPA | 71.40 |
Publisher’s Note: MDPI stays neutral with regard to jurisdictional claims in published maps and institutional affiliations. |
© 2021 by the authors. Licensee MDPI, Basel, Switzerland. This article is an open access article distributed under the terms and conditions of the Creative Commons Attribution (CC BY) license (https://creativecommons.org/licenses/by/4.0/).
Share and Cite
MDPI and ACS Style
Xiong, S.; Tan, Y.; Li, Y.; Wen, C.; Yan, P. Subtask Attention Based Object Detection in Remote Sensing Images. Remote Sens. 2021, 13, 1925. https://0-doi-org.brum.beds.ac.uk/10.3390/rs13101925
AMA Style
Xiong S, Tan Y, Li Y, Wen C, Yan P. Subtask Attention Based Object Detection in Remote Sensing Images. Remote Sensing. 2021; 13(10):1925. https://0-doi-org.brum.beds.ac.uk/10.3390/rs13101925
Chicago/Turabian StyleXiong, Shengzhou, Yihua Tan, Yansheng Li, Cai Wen, and Pei Yan. 2021. "Subtask Attention Based Object Detection in Remote Sensing Images" Remote Sensing 13, no. 10: 1925. https://0-doi-org.brum.beds.ac.uk/10.3390/rs13101925
Note that from the first issue of 2016, this journal uses article numbers instead of page numbers. See further details here.