
Evaluation of Current Trends of Climatic Actions in Europe Based on Observations and Regional Reanalysis


Department of Civil and Industrial Engineering, Structural Division, University of Pisa, Largo Lucio Lazzarino, 56122 Pisa, Italy
*
Author to whom correspondence should be addressed.
Remote Sens. 2021, 13(11), 2025; https://0-doi-org.brum.beds.ac.uk/10.3390/rs13112025
Submission received: 19 April 2021
/
Revised: 17 May 2021
/
Accepted: 18 May 2021
/
Published: 21 May 2021
(This article belongs to the Section Earth Observation Data)
Abstract
:Since extreme values of climatic actions are commonly derived assuming the climate being stationary over time, engineering structures and infrastructures are designed considering design actions derived under this assumption. Owing to the increased relevance of the expected climate change effects and the correlated variations of climate actions extremes, ad hoc strategies for future adaption of design loads are needed. Moreover, as current European maps for climatic actions are generally based on observations collected more than 20 years ago, they should be updated. By a suitable elaboration of the projections of future climate changes, the evolution over time of climatic actions can be assessed; this basic and crucial information allows us to facilitate future adaptations of climatic load maps, thus improving the climate resilience of structures and infrastructures. In this paper, current trends of climatic actions in Europe, daily maximum and minimum temperatures, daily precipitation, and ground snow loads, are investigated based on available gridded datasets of observations (E-OBS) and regional reanalysis (Uncertainties in Ensembles of Regional Re-Analyses, UERRA), to assess their suitability to be used in the elaboration of maps for climatic actions. The results indicate that the E-OBS gridded datasets reproduce trends in extreme temperatures and precipitation well in the investigated regions, while reanalysis data, which include snow water equivalent, show biases in the assessment of ground snow load modifications over the years in comparison with measurements. As far as climate change effects are concerned, trends of variation of climatic actions are estimated considering subsequent time windows, 40 years in duration, covering the period 1950–2020. Results, in terms of factors of change, are critically discussed, also in comparison with the elaborations of reliable datasets of real observations, considering a case study covering Germany and Switzerland.
1. Introduction
The assessment of climate change effects is an increasingly debated topic that involves various research fields and is becoming more and more relevant in many sciences and engineering disciplines, including civil, industrial and infrastructure engineering.
According to the last report of the Intergovernmental Panel on Climate Change (IPPC) [1] “warming of the climate system is unequivocal, and since the 1950s, many of the observed changes are unprecedented over decades to millennia”. Moreover, there is sound evidence that, due to global warming, extreme climatic events in Europe will probably become more frequent and severe in the near future. Definition of climate change adaptation strategies is thus becoming essential to improve the climate resilience of key economic, industrial, and social sectors. Anyhow, it must be considered that, due to the delayed impacts of greenhouse gasses emission scenarios [2,3,4], effects of mitigation policies take time to become perceptible.
Variable actions related to climate are generally referred to as “climatic actions” in structural engineering standards [5,6]. Climatic actions are introduced in design calculations as representative values, known as characteristic values, i.e., associated to a specified small probability of being exceeded during a chosen reference period. In general, characteristic values of climatic actions are based on an intended annual probability of being exceeded of 0.02 [5,6].
In this context, it is important to recall that the magnitude of climatic actions, such as wind, snow, thermal effects, atmospheric icing, flooding, currents and wave-induced actions often governs both the design of individual structures and infrastructures, and the resilience of infrastructure networks. For this reason, improving the robustness of engineering structures and infrastructures to cope with current and projected changes in climate extremes with appropriate degree of reliability is a high priority. In fact, constructions built today should face climatic actions and extreme events unavoidably affected by climate change influences during, and often beyond, their intended design service time. Moreover, a particularly relevant issue is the assessment of the capability of existing structures and infrastructures, designed according to current or past codes [7,8], to withstand future climatic actions, which are likely to occur during their whole real life [9]. For these reasons, the challenge to estimate how climate change will affect climatic actions is increasingly pressing [10].
Representative values of climatic actions, provided in structural engineering codes and standards, are currently based on the extreme value analysis applied to past observations of the natural phenomena, under the assumption that climate conditions are stationary over time. Although this hypothesis is debatable in the light of climate changes, it is commonly adopted in standardization to simplify the problem. These representative values are evaluated elaborating observed data series, generally covering years, thus disregarding the effects of climate change [9] and even more so their predicted future fluctuations.
Critically looking at current European maps of climatic actions used as a reference for structural design of civil engineering works, the following two main issues can be highlighted:
- a proper harmonization of climatic maps across different countries is still missing, as discussed in [11] for snow;
The relevance of these aspects is emphasized in view of the development of the so-called “second generation of Eurocodes”, currently underway by Mandate M/515 of the European Commission to the European Committee for Standardization (CEN) [14,15], which is expected to be completed by 2026, when all the reviewed Eurocode parts will be made available.
The assessment of future trends of climatic actions and their impact on structural reliability are discussed by the authors in [9]. The methodology, based on the so-called “factor of change” or “change factor” approach [16,17,18] relies on original algorithms for elaboration of climate projections, allowing to derive factors of change maps. These factors of change can be used to adapt representative values of climatic actions for the assessment of structural reliability variations taking into account non-stationary climate conditions. Uncertainties affecting the prediction of future extremes and suitable hierarchical models are further discussed in [19,20].
The possibility to estimate historical trends of climate extremes, referring to the recently developed pan-European dataset of climate data, is investigated. Starting from available datasets of gridded observations [21,22] and regional reanalysis for Europe [23], factors of change maps are derived, and the results obtained are discussed, focusing on their ability to reproduce climate’s trends by comparison against a long series of real measurements. The main objectives of the paper are:
- the suitability assessment of gridded observations and regional reanalysis data for Europe for the elaboration of maps for climatic actions to be used in European structural design standards;
- the definition of a general procedure to update the maps of climatic actions, based on the same data as above, allowing us to estimate the effects of climate change.
2. The Current European Situation
2.1. Climatic Action Maps in the Eurocodes
Climatic actions for structural design are defined in specific parts of Eurocode 1: EN1991-1-3, dealing with snow loads [24], EN1991-1-4 with wind actions [25], and EN1991-1-5 with thermal actions [26]. Among other representative values of climatic actions, the characteristic values are undoubtedly particularly relevant for ultimate limit state (ULS) verifications. As already said, in EN1990 “Basis of structural design” [5], characteristic values of the time-varying part of climatic actions are associated with an annual probability of exceedance .
Characteristic values of climatic actions, as well as their representations by means of maps, are typically country-specific data, belonging to the set of the so-called Nationally Determined Parameters (NDP), provided in National Annexes to the Eurocodes, elaborated by the National Standard Bodies members of CEN (European Standardization Committee). Maps of characteristic ground snow loads , basic wind velocity , and maximum and minimum shade air temperature, and , are thus given in the National Annexes to EN1993-1-3, EN1993-1-4, and EN1993-1-5, respectively. A detailed discussion about the status of European ground snow load maps, based on Eurocode recommendations and national provisions, can be found in [11].
Although different procedures for the analysis of extremes of climatic actions are adopted by different countries, the current definition of characteristic values of climatic actions is usually based on the extreme value analysis of past observations of the natural phenomena. Under the aforementioned assumption of stationary climate conditions, thereby disregarding potential effects of climate change, the main steps of the general procedure are:
- Collection of annual extremes at an appropriate number of weather stations adequately covering the investigated geographical region, for a suitable period of time (typically 40 or more years) [13];
- Definition of the extreme value distribution best fitting available data, and calculation of the characteristic values of the climatic action at each weather station;
- Identification of proper altitude–action relationships allowing to transpose the characteristic values to the sea level, if necessary;
- Drawing of isopleths over the considered region to plot the climatic map, associated with the given annual probability of exceedance.
By analyzing the available National Annexes to EN1991-1-3 [24], and to EN1991-1-5 [26], the current European ground snow load map [11], and thermal map can be derived, illustrated in Figure 1 and Figure 2, respectively. Since current climatic load maps are derived nationally, often starting from inhomogeneous measurements of basic climatic data and adopting different analysis methods, they generally result as being neither homogeneous nor harmonized across borders between neighbouring European countries [11,27]. This is the main reason why some of the discontinuities detected along country borders are often not explainable by purely physical reasons. In addition, updating of national data is rather occasional; for instance, the Czech standardization institute recently published a revision of their maps for climatic actions [28], maps of neighboring countries still being dated.
Looking at the current situation, the harmonised definition of climatic parameters across countries and the updating of current values, also taking into account recent measurements, are topical in view of future revisions of climatic load maps. An efficient solution could consist in supplementing the homogenous observational datasets, currently under development at European level, with data derived by regional reanalyses at adequate resolution. In this way, suitable information can be obtained also in areas not adequately covered by historical measurements. Datasets of observations and regional reanalyses for Europe are available for temperatures, precipitation, and snow water equivalent, while data are lacking for basic wind velocity [25], i.e., the 10-min mean wind velocity at 10 m height above the ground.
2.2. Available Dataset of Climatic Data for Europe
Climatic data are provided by different sources, including observational records (raw measurements as well as processed data), regional reanalysis and climate model simulations. Temperature, precipitation, wind, and snow, manually registered until a few decades ago, nowadays are mostly monitored by automatic weather stations, run by national weather services, but the density of weather stations and the time coverage may significantly vary from country to country.
Requirements and recommendations for a functional and robust Global Climate Observing System are provided by the World Meteorological Organization in [29], to ensure sufficiently homogenous, stable and accurate data for climate purposes. Observations of climate variables by in situ networks are integrated with data from satellite-based remote sensing subsystems through the process of reanalysis. A model of the atmosphere, ocean or coupled climate system is employed to spread information in space and time and between variables, and otherwise to fill gaps in the observational record [29]. Modern climate models provide gridded data referred to approximately square cells, with a spatial resolution which is a function of the cell dimensions. At present, modelled data at high spatial resolution are available for the greater part of Europe. The most significant source of climate data for Europe is undoubtedly the Copernicus Climate Data Store (CDS), including observational, regional reanalysis and climate projections, as described in the following.
2.2.1. Observational Dataset
Gridded observational datasets are derived from the interpolation of meteorological observations registered at weather stations; they are still the most reliable source of information for monitoring the climate system [22]. Such data require a high geographical density of weather stations and are generally available at national scale, the complete sharing of daily meteorological observations at European scale being often restricted for copyright reasons. Fortunately, for some countries like Germany this is not the case [30].
Some European countries (see for example [31,32,33,34,35], for France, Germany, Spain, Norway, and UK respectively) recently developed gridded datasets of observations, used also to validate regional climate models outputs. This kind of data can be associated with significant uncertainties, especially for precipitation, characterized by observational uncertainties similar to those of Regional Climate Models [36]. Major biases are observed in sub-regions of Europe, mainly due to the density of station networks. For these reasons, high spatial resolution of daily gridded data consistently derived at continental scale are needed. In this context, the E-OBS dataset was developed for Europe since 2008 [21] and it is being continuously updated every six months. In its latest versions meteorological data provided by E-OBS are based on cells with 0.1° × 0.1° sides (i.e., approximately 10 km × 10 km), thus being associated with high spatial resolution. For this reason and for its time coverage (1950–2020), E-OBS, available within the Copernicus context, is considered as the most relevant dataset available at the European scale.
The E-OBS dataset is based on the blended time series collected by the European Climate Assessment and Dataset (ECA&D) [37,38] station network, where all station data are sourced directly from the European National Meteorological and Hydrological Services, or from other data holding institutes. These point observations are subsequently interpolated over the grid, allowing to cover the whole Europe. Daily mean, maximum and minimum temperature, and precipitation are provided from 1950 to 2020 and are freely available for non-commercial use as network Common Data Form files (NetCDF).
Uncertainties in the earlier version of the E-OBS dataset, characterized by a coarse 0.25° grid, are discussed in [22], focusing on the period . The study highlights that the earlier E-OBS data set (i.e., dated before 2019) should be cautionary used for the examination of long-term trends across Europe, since at that time station data were not duly homogenized. Applications of the E-OBS dataset on the 0.25° regular grid can also be found in [39] for the analysis of extreme annual daily maximum temperature in Europe, considering the adoption of different extreme value distribution (Weibull, Frechet and Gumbel) and parameter estimation method (least square and maximum likelihood estimators). Promising results were obtained giving the overall impression that the gridded E-OBS data set could be applicable for computation of return levels of temperature extremes in a pan-European context [39]. In the following, variations over time of extreme daily maximum and minimum temperatures and precipitations will be assessed, based on the most recent version of E-OBS datasets. The results obtained will be compared with those obtained considering long-series of observations at 71 weather stations in Germany and Switzerland, available at the German weather service (DWD), and at the Swiss weather service (MeteoSwiss), respectively.
Unfortunately, snow data are not available in the E-OBS dataset and high-resolution observational datasets for snow are available only for short and recent periods and for limited geographic regions. For example, ground snow cover data for the Alps, obtained by means of Moderate Resolution Imaging Spectroradiometer (MODIS) remote sensing, are available from 2002 to 2019 only [40,41]. New snow products are recently being developed based on satellite observations [42]: the GlobSnow dataset, developed by the European Space Agency, providing snow water equivalent in the Northern Hemisphere is undoubtedly one of the most relevant. Snow water equivalent are provided since 1979 until the present at a spatial resolution of approximately 25 km, combining information retrieved from microwave radiometer sensors and snow depth data collected at weather stations [43]. To the best of the authors’ knowledge, applications and evaluations of the GlobSnow products for the analysis of extreme ground snow loads are still missing. Indeed, according to the authors’ experience, the current version of that dataset is still characterized by too coarse a resolution to capture extreme snow loads for the derivation of snow load maps. Furthermore, uncertainties in the model to convert snow depth satellite measurements into snow water equivalent data should be duly considered, as they may significantly affect the results of the analysis [7].
Snow data are still poorly documented for many reasons, such as geographical coverage of stations, significantly varying from country to country, limited and fragmented measurements, inhomogeneous observational practices, and so on. The depth of the snow cover is measured at most stations, while the snow water equivalent is less frequently recorded. Actually, a long series of high-quality snow data, allowing the evolution over time of the snow loads on ground to be estimated, are available for few countries in Europe [44]. It is important to underline that observations and, consequently, statistics refer to snow load on ground, while measurements of roof snow load, which is far most interesting for structural design purposes, depend on the roof’s geometry and its exposure to wind, are so limited that current and future trends of snow load on roofs cannot be directly assessed [45]. It is expected that changes of roof snow load will be mainly related to alterations of the ground snow load, while wind exposure conditions will remain unchanged. Recent studies confirm that changes in wind velocity do not significantly affect the deposition of snow on roofs [9,46].
2.2.2. Reanalysis Dataset
Wherever the quality or time coverage of real observations is unsatisfactory, high-resolution modelled datasets could represent a viable alternative solution to elaborate climatic maps. Atmospheric reanalysis is based on the idea that historical observations of the atmospheric state, obtained by in situ, surface, and satellite remote-sensing surveys, can be reproduced by means of numerical weather prediction models. Reanalysis provides a physically and dynamically consistent description of the atmospheric state and provides a modelled representation of the past weather, covering the same time window of the available real observations. Due to the fact that the complete set of variables describing the atmospheric state is provided on the whole regular grid and that the system is forced to match past observations, where available, reanalysis can be a reliable tool to derive supplementary information, even at sites where no or few observations are available. Anyhow, as global reanalysis (ERA-5 reanalysis), available from 1979 to the present, refers to an excessively coarse horizontal resolution of 31 km, improved models are necessary to estimate climate extremes at local scales. To satisfy this need, sophisticated regional reanalysis methodologies are increasingly being developed, e.g., the Uncertainties in Ensembles of Regional Re-Analyses (UERRA) European project [23].
Regional reanalysis makes use of limited-area models with high grid resolution. Their accuracy on the mesoscale is significantly enhanced thanks to fine spatial sampling, and improved representation of: soil atmosphere interactions, orographic effects, land-use effects, and land–ocean contrasts [23]. Reanalysis of weather data (precipitation, temperature, humidity, radiation, and wind speed) can also be used to run snowpack models and derive snow water equivalent data [47,48].
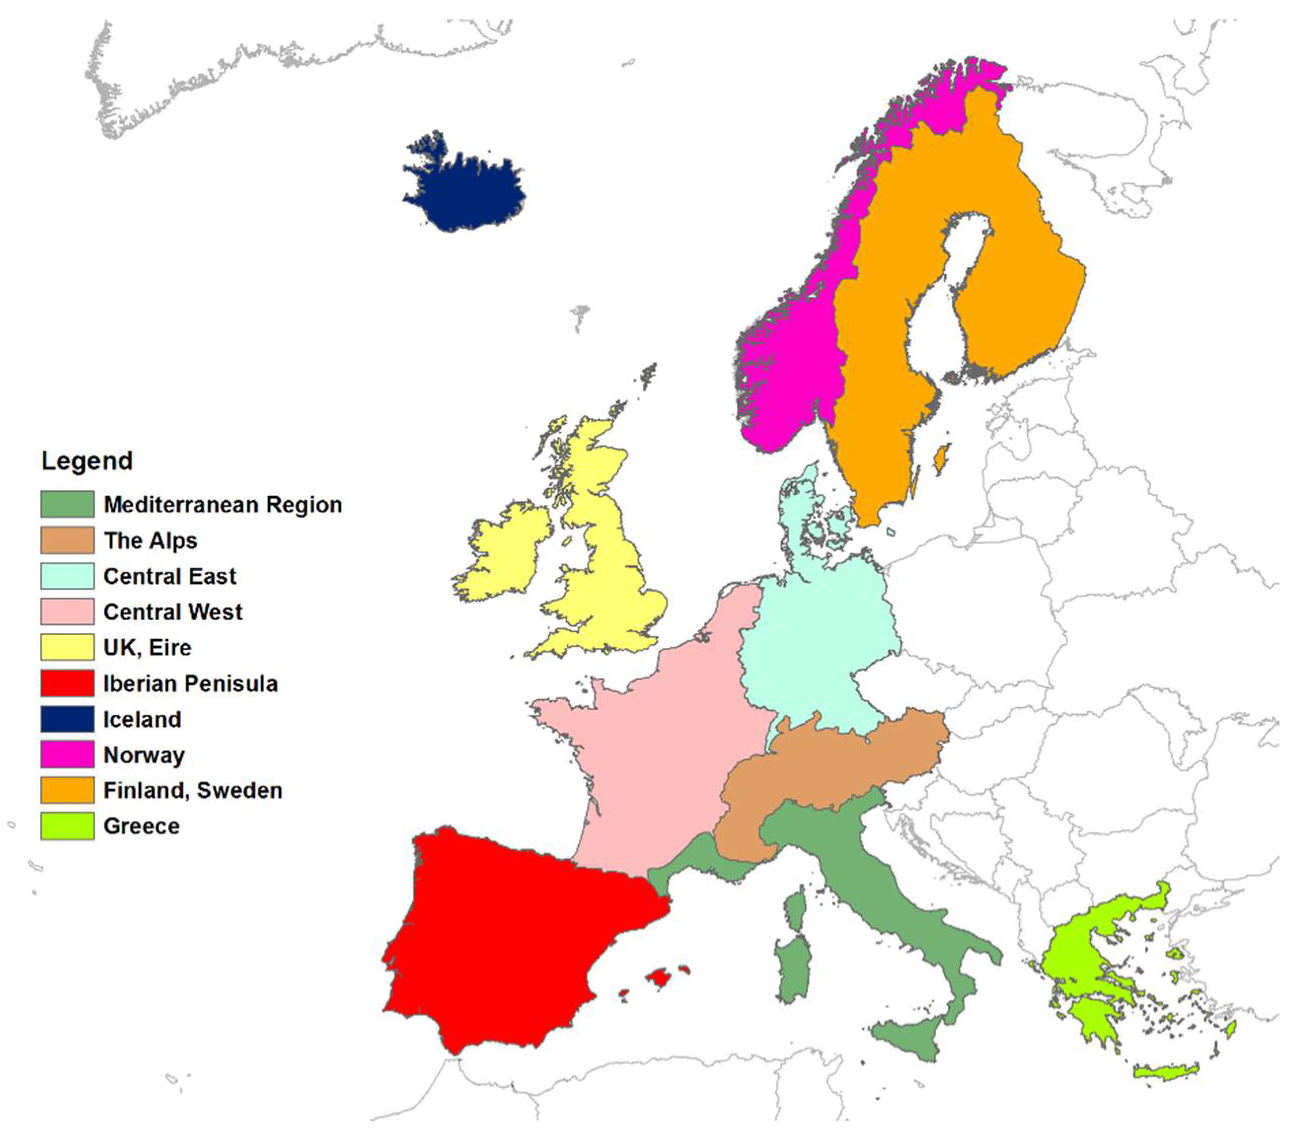
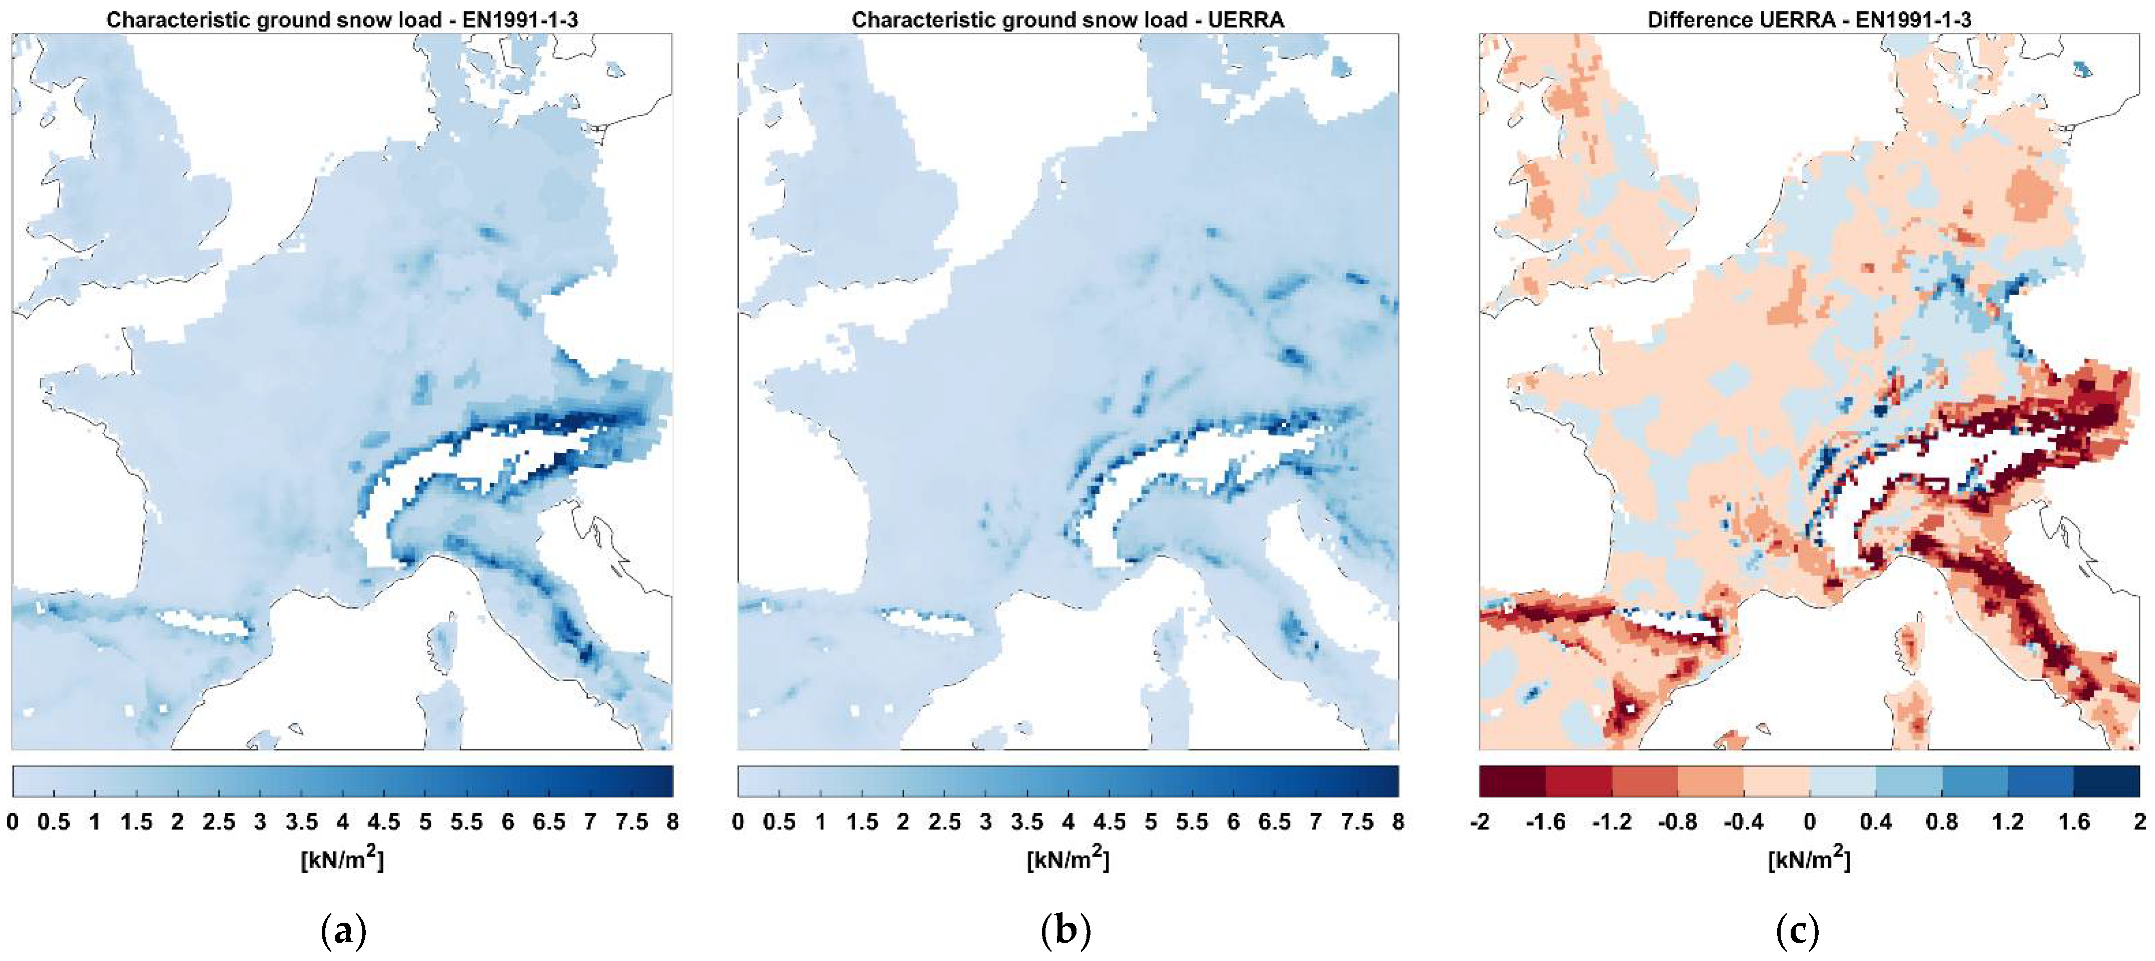
The UERRA-HARMONIE [49] Data Assimilation system is implemented and optimized for Europe and surrounding sea areas with a resolution of 11 km, referring to 65 altitude levels. Data of the run covering the period January 1961–July 2019 are available in the Copernicus CDS [50], where snow depth water equivalent is provided at surface level every six hours. In this study, a first evaluation of the ability of UERRA data to reproduce extreme ground snow load is carried out comparing the ground snow load maps, derived from the extreme values analysis of snow water equivalent modelled data in the period , with the one derived from real observations collected during the European Snow Load Research Project (ESLRP) [12], where 10 homogeneous climatic regions were identified and subsequently integrated in the Annex C to EN1991-1-3 [24] as shown in Figure 3. The comparison between the ESLRP snow load maps and those derived in the present study starting from the analysis of regional reanalysis is summarized in Figure 4 for the central European region. Error statistics (root-mean-square error, RMSE, and mean absolute error, MAE) between characteristic load values obtained from modelled data (UERRA), and from point measurements derived in the ESLRP, are summarized in Table 1 for the European climatic regions, as defined in [12].
RMSE values range from , in the West region, to in the Alps. One of the main reasons justifying the most significant errors detected in the Alpine, Mediterranean and Iberian regions, can be found in the snow density functions adopted to convert snow depth data into snow load, which differ from country to country. It must be remarked that the number of observational sites also varies over time, so that deeper examination of evolution of a series of annual extremes on a station-by-station basis is needed. Focusing on the last 30 years of simulations, from 1990 to 2020, the evolution, critically discussed in the following for Germany and Switzerland, generally reveals that errors tend to significantly reduce over time.
The previous considerations suggest caution in using reanalysis data set for the analysis of long-term trends across Europe, some kind of validation being always indispensable. In the next section, the ability to reproduce trends of ground snow loads will be assessed for Germany and Switzerland, characterized by high-station density and significantly long time series of snow depth observations.
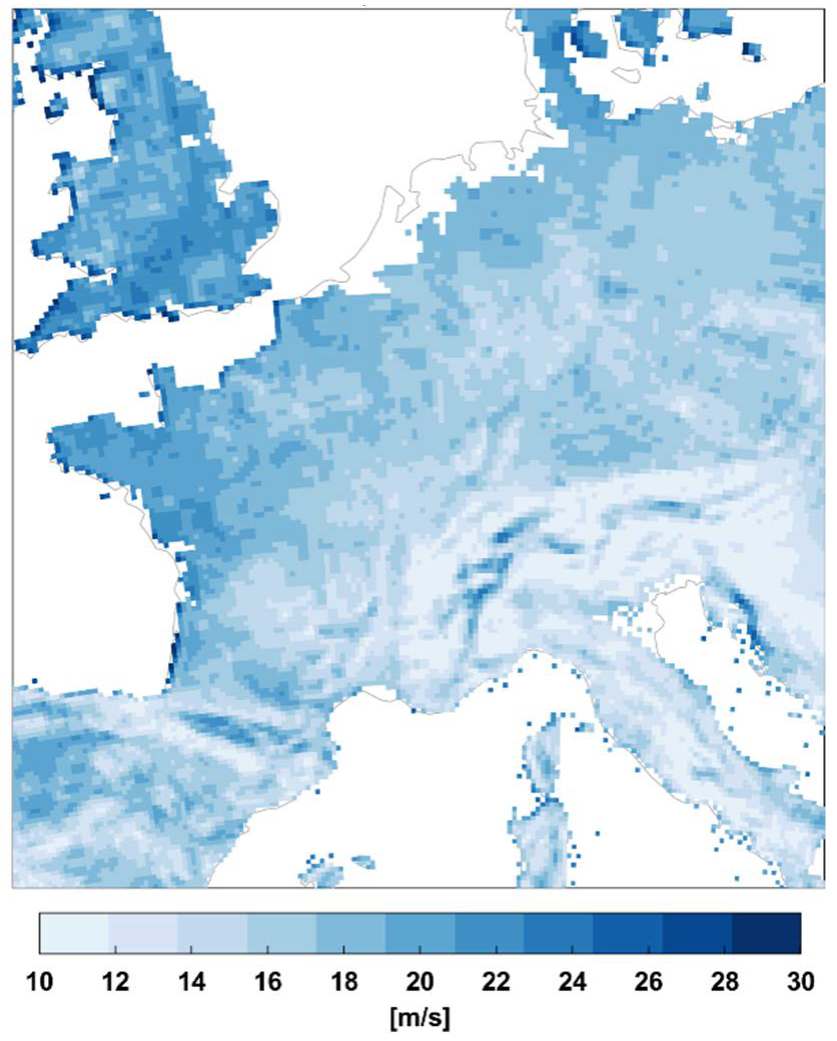
As far as wind is concerned, reanalysis data for wind velocity are provided with a time frequency of 6 h by the UERRA project and this downsampling results in a significant underestimation of maxima as discussed in [51] and confirmed by preliminary analysis carried out by the authors. The characteristic values derived from UERRA reanalysis data in the time interval 1981–2020 are shown in Figure 5. Looking at this Figure, it is worth to note that characteristic values of basic wind velocity are generally underestimated. For example, in central Italy values less than 16 m/s are generally obtained, which are well below the current characteristic values, around 27 m/s, derived from point measurements. For this reason, wind reanalysis data have not been considered in the following.
2.2.3. Climate Projections
In the Copernicus Climate Data Store (CDS), Regional Climate Model (RCM) climate projections data developed for the Europe domain within the Coordinated Regional Climate Downscaling Experiment (EURO-CORDEX) [52,53] are also provided. Historical and future simulations datasets provide the basis for the investigation of current and future European climate considering different scenarios [54] and are increasingly used for climate change impact studies [55], once suitably calibrated on the basis of observational and reanalysis information. Although specific studies regarding effects of climate change on temperature and precipitation are widespread [53,55], a limited number of studies focus on snow [7,8]. In fact, on the one hand, the outputs of global climate models (GCMs) have too coarse a spatial resolution; on the other, regional climate models (RCMs) have only recently reached reasonable horizontal resolutions to be suitable to evaluate changes in snow parameters, greatly affected by local scale phenomena [56]. A first evaluation of the snow variables in the EURO-CORDEX initiative [52,53] can be found in [56], while an original procedure to derive ground snow load from available climate projections is described in [7,8]. A procedure for the estimation of future trends of climatic actions based on high-resolution RCMs projection was proposed by the authors in [9].
3. Methodology
Current evolutions of climatic actions in Europe are evaluated considering available observational and reanalysis datasets, by means of the so-called factor of change approach [13,14,15], according to the procedure summarized below. Factors of change are concise representations of changes of characteristic values of climatic actions, based on the elaboration of data over subsequent time windows of constant length. Factors of change are estimated comparing data obtained for -th time window, with those obtained for the reference time window, generally coincident with the first.
To be consistent with the actual definition of climatic hazard maps for structural design [8,13,57,58], the study considers time windows of 40 years, assuming that climate is stationary during that time interval. To assess the effects of climate change, time windows are shifted by 10 years from each other. The 10-year shifts correspond to the reasonable assumption that effects of climate change cannot be appreciated at a lower time scale, as confirmed by previous analyses. The first step of the procedure is the extraction of series of annual extremes of the investigated climate variables for each considered time window (e.g., , , , ). Subsequently, an extreme value analysis is carried out for each of the -th time windows, according to the block maxima approach [59]. Consistent with the approach generally followed for the estimation of characteristic climatic actions in Europe [11,12,13], an extreme value type I distribution (Gumbel) has been assumed as the best fitting distribution function for the variation of the extremes:
being the location parameter the center of the distribution, and the scale parameter the size of deviations around the location parameter for the -th time window. Parameters can be estimated by means of the maximum likelihood or least square method and characteristic values of the climatic action, , are thus evaluated for each of the -th time window as:
where, according to EN1990 [5], the annual probability of exceedance is set to . Finally, factors of change are evaluated in terms of differences or in terms of ratios, depending on the climatic variable under consideration. Factors of change in terms of differences, the so-called “delta changes”, are typically defined for temperatures as:
Factors of changes in terms of ratios are typically defined for precipitations and snow loads:
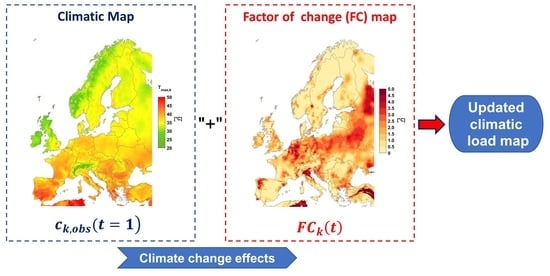
Assuming that the initial time window corresponds to the observation period used for the definition of the current climatic hazard maps, factors of change can be used to update these maps according to the procedure defined in [9], already applied in [60] for temperature and snow load maps for a case study referred to an Italian region.
The analysis of point observations, E-OBS data and regional reanalysis has been carried out assuming a Gumbel distribution for the extremes. This hypothesis is consistent with the prevailing model assumptions for climatic actions in structural design [11,12,13]. Of course, the choice of the most appropriate distribution function for climate extremes is a crucial question. In fact, the choice is not straightforward, and it depends on the investigated variable, on the geographical location, and on the record’s length. This aspect has been investigated and discussed in depth over the years, e.g., for rainfall precipitation, the Generalized Extreme Value (GEV) [61,62] for annual maxima and the generalized Pareto (GP) for peak over threshold extremes are often adopted. A significant study on the “battle” of extreme value distributions for extreme daily rainfall is presented in [63,64] focusing on annual maxima and peak-over threshold values respectively. It must be remarked that the selection of the most appropriate extreme distribution can be non-univocal since few data generally fall in the upper tail region, which characterizes various distributions and where the focus of the investigation resides. Anyhow, being relative measures, factors of change are not significantly influenced by the choice of the distribution.
4. Results and Discussion
Representative values of extreme distributions of daily temperatures, precipitation and ground snow loads for Europe, based on gridded and reanalysis datasets, are presented in the following sub-sections and critically discussed. The main focus of the discussion is to evaluate the ability of such datasets to reproduce climatic trends, by comparison with point measurements of the investigated climate variables for a representative case study region.
4.1. Historical Trends in Extreme Temperatures and Precipitation Based on E-OBS Dataset and Point Observations
4.1.1. Extreme Temperatures
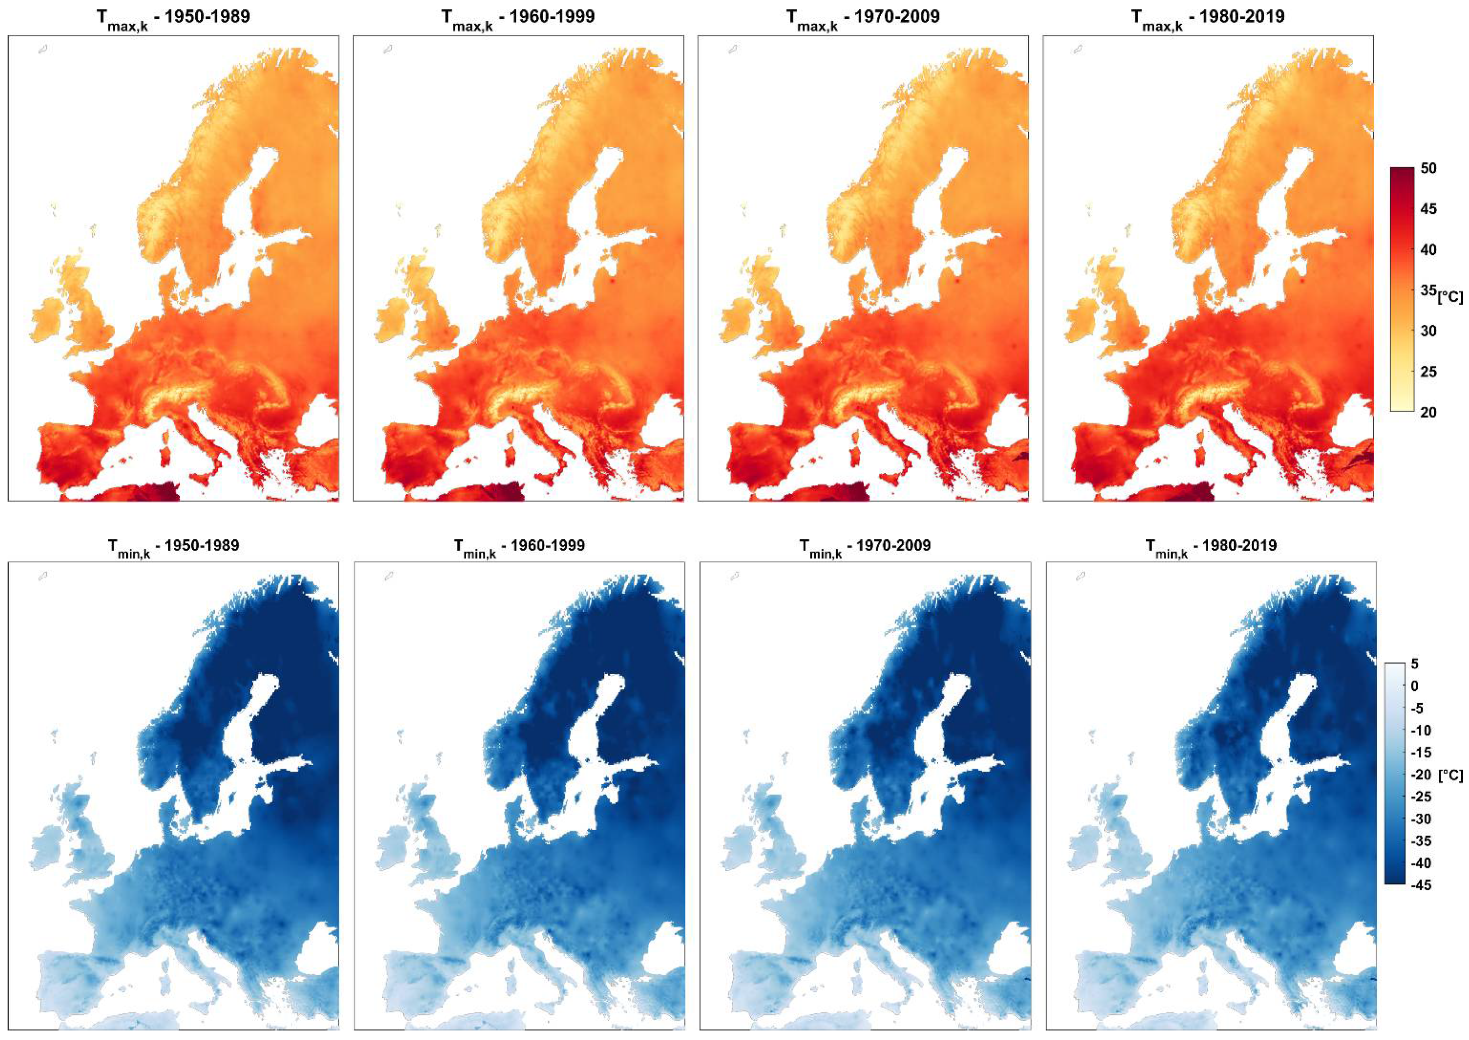
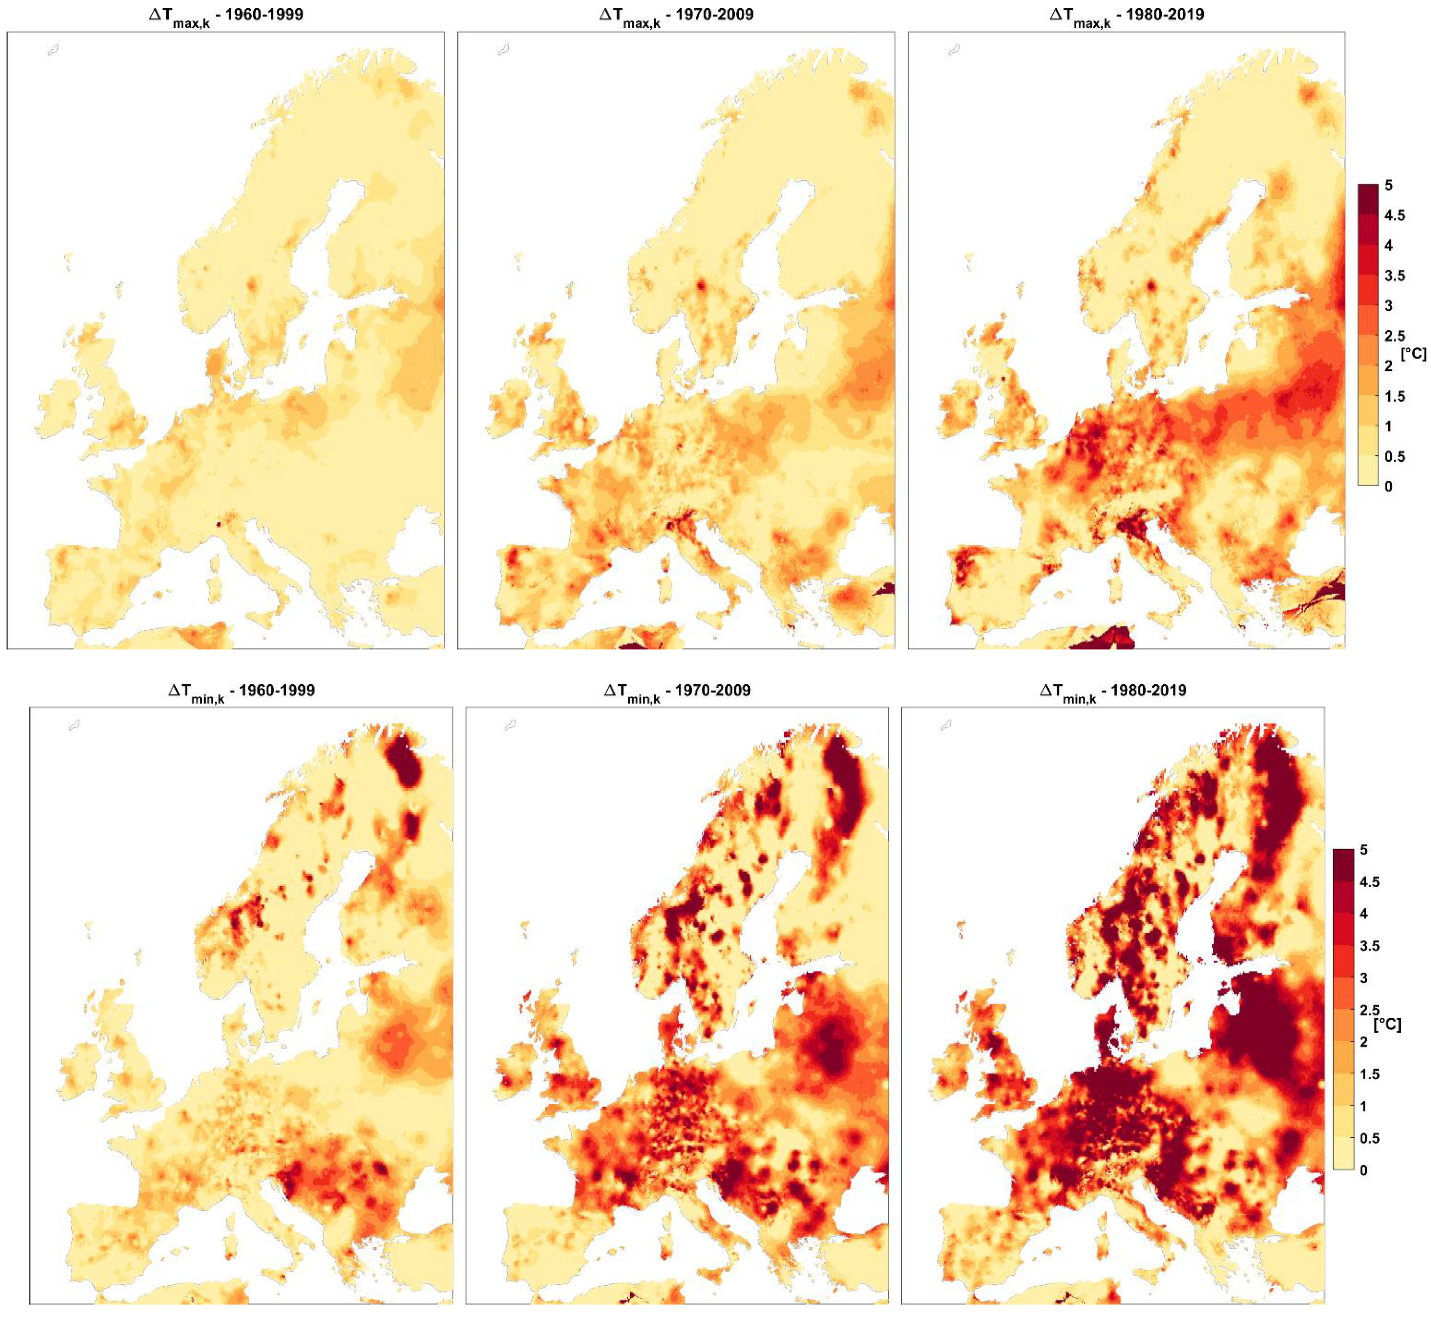
Historical trend in daily maximum and minimum temperatures in Europe are evaluated extracting annual maxima from the E-OBS dataset for the period . An extreme values analysis is carried out in subsequent time windows (, , , and ) and characteristic values, corresponding to are derived. The resulting thermal maps are illustrated in Figure 6, while the corresponding factors of change maps, with reference to the first time window (), are shown in Figure 7. As expected, owing the global warming the outcomes show a general increasing trend. Estimated variations of characteristic values results in being much more significant than variations of mean temperature values, especially for minimum temperatures. As an example, differences in characteristic values up to 5°C are estimated for the last observed time window , while an increase by 1.45 to 1.59 °C in 2006–2015 relative to the pre-industrial period (1850–1900) is registered for the average annual temperature over European land [4]. The study of average temperature variations is out of the scope of the paper; the interested reader can refer to [1,2,4].
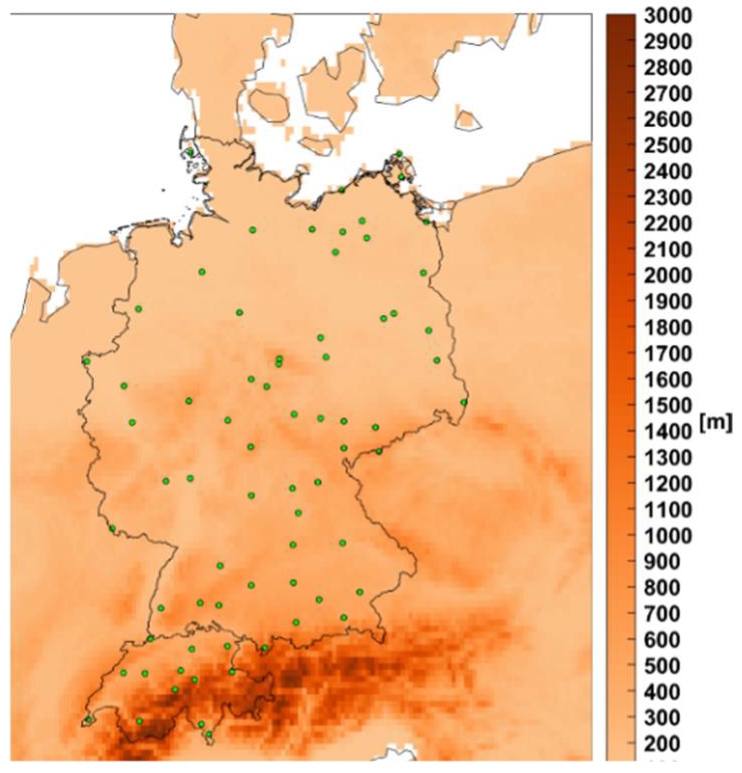
As already mentioned, caution should be exercised when using the E-OBS data set for the examination of long-term trends across Europe [22]. This is mainly due to the lack of homogeneous geographical distribution of weather stations, upon which E-OBS data are based and their time coverage in some areas. This suggests a careful comparison of results obtained via the E-OBS dataset with those from specific station data. The comparison is made considering 71 weather stations in Germany and Switzerland (see Figure 8), for which a wide dataset of high-quality measurements is provided by the respective national meteorological offices. Obviously, a more uniformly distributed set of weather stations should be needed to obtain a refined general assessment for the whole European territory.
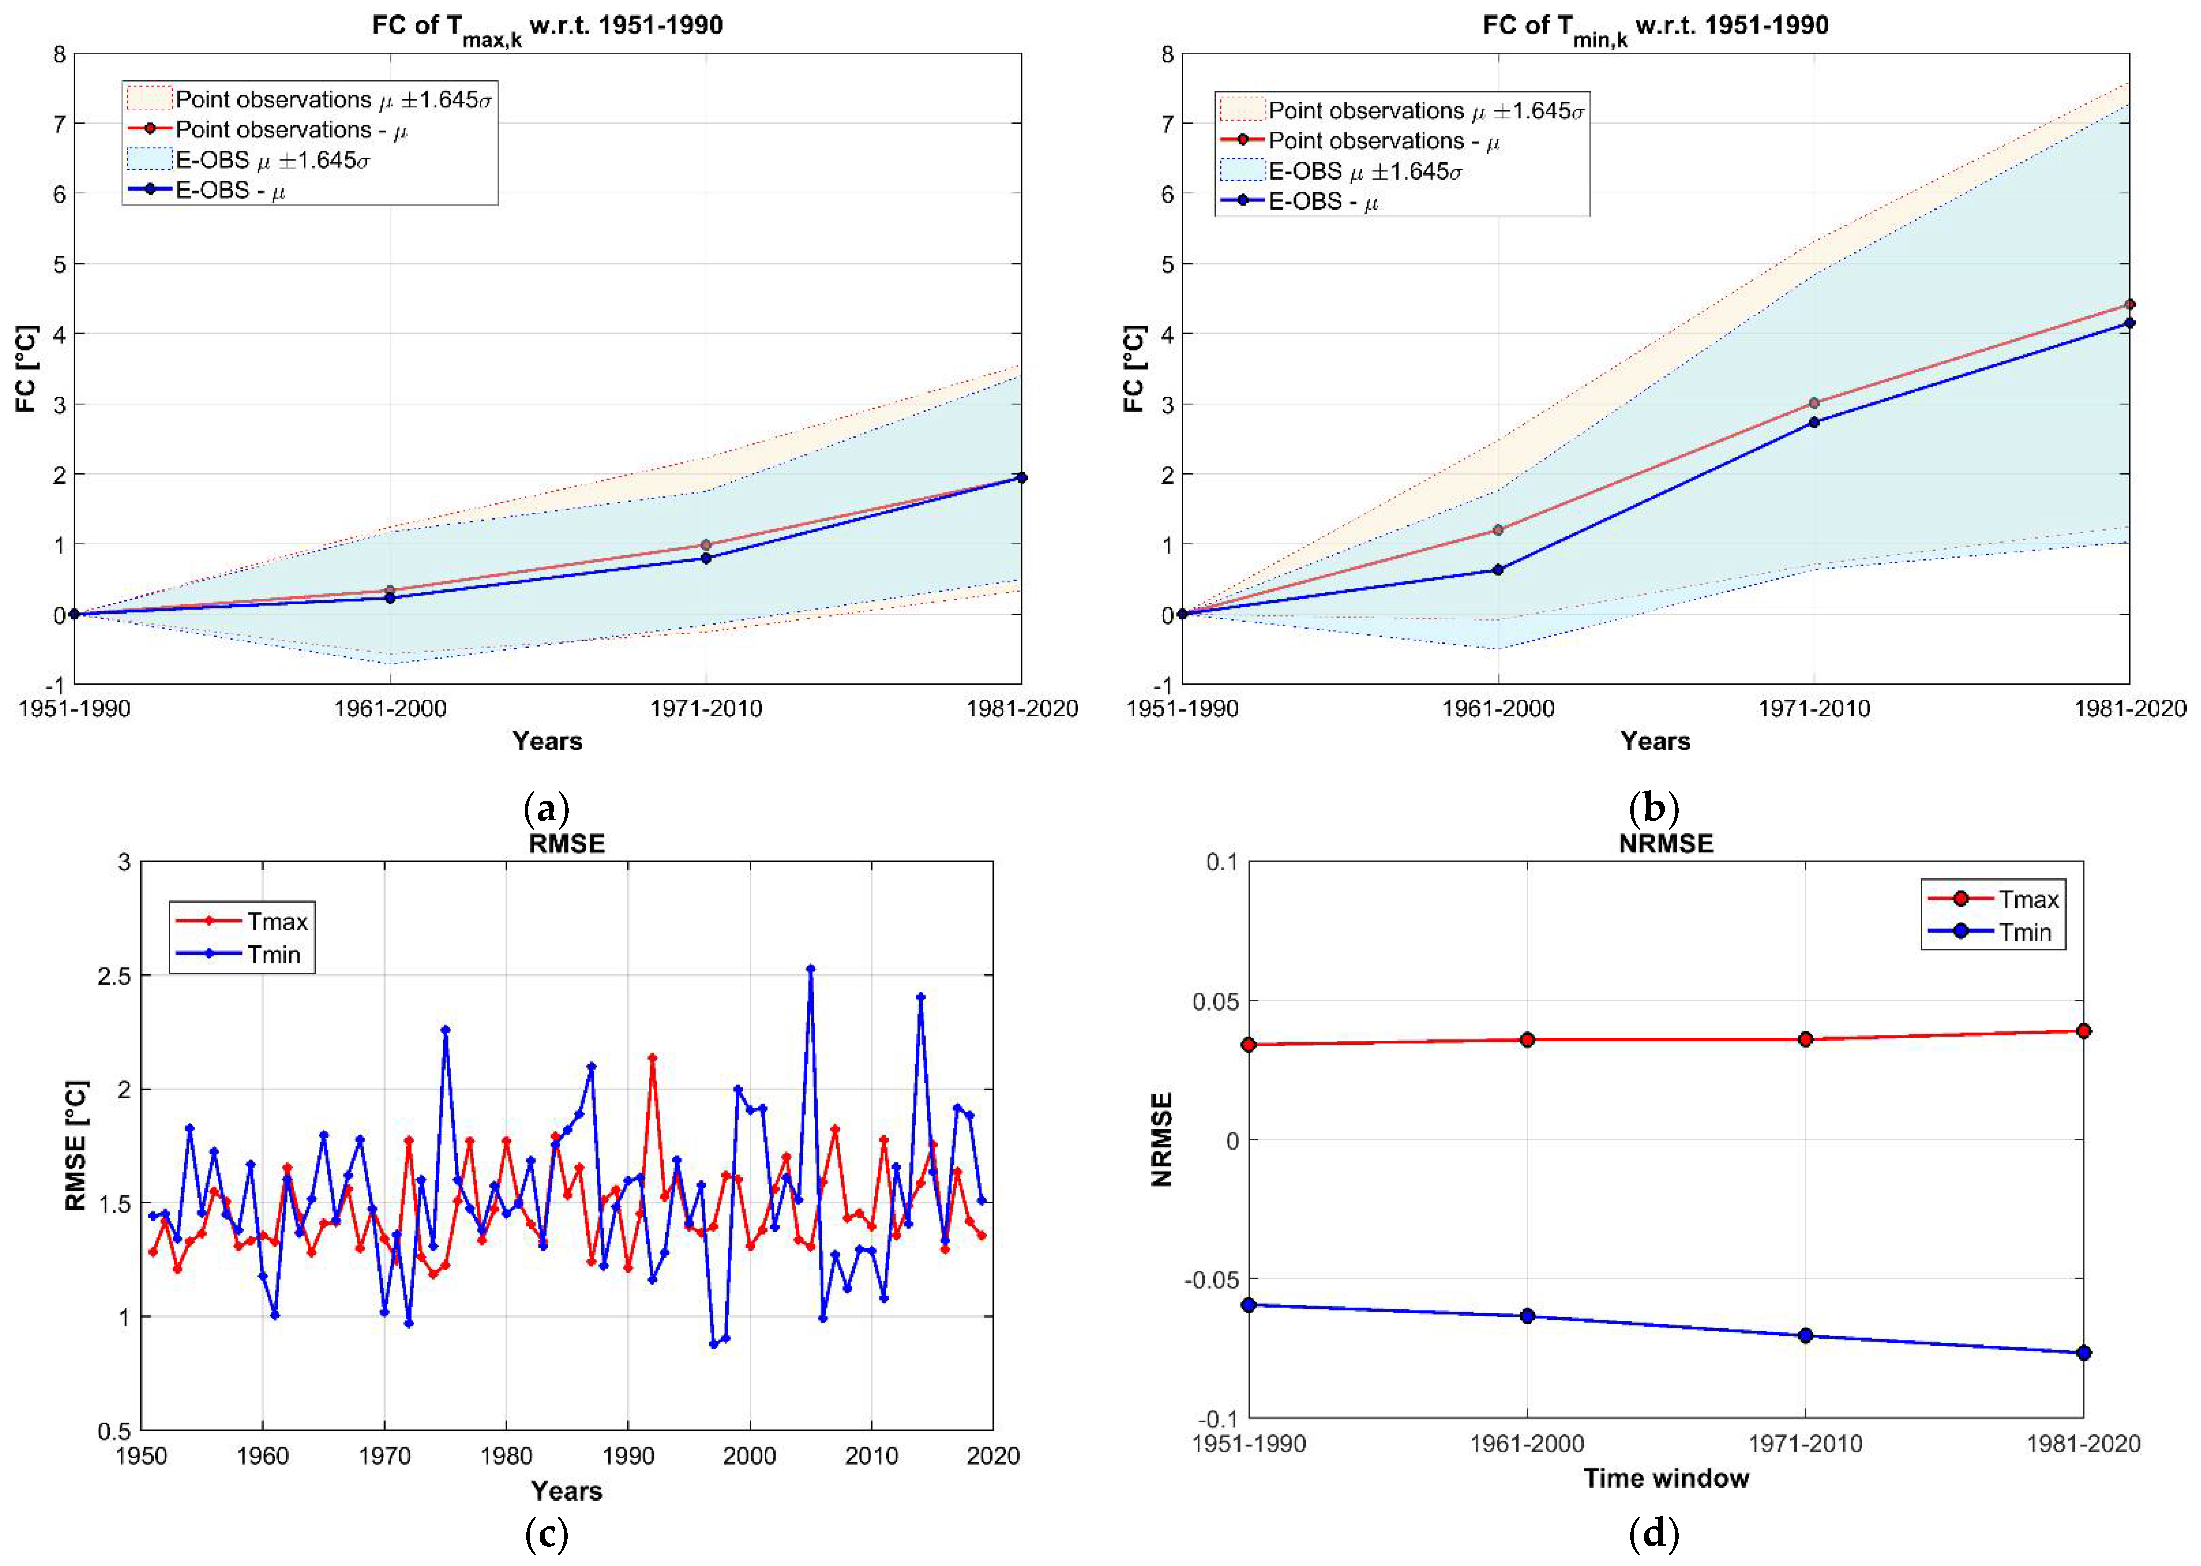
Factors of change for temperature characteristic values, evaluated comparing the outcomes of the analysis of annual maxima and minima extracted from E-OBS, and the real measurements at the test stations, are shown for the investigated region in Figure 9a,b for maximum and minimum temperatures, respectively. The outcomes show very similar trends, both in terms of mean values for the region (blue and red solid lines), and the associated uncertainty interval. The yearly RMSE are evaluated for annual maxima of Tmax and minima of Tmin comparing data extracted from E-OBS and the measurements registered at the test stations; the outcomes are shown in Figure 9c. Values range from 1 °C to 2.5 °C and no significant time-dependent changes are detected. In Figure 9d, the normalized root mean square error (NRMSE) is shown for characteristic values in the four time windows, highlighting that the errors are very low and almost constant over time. For this reason, the trend evaluation is scarcely influenced by these errors.
4.1.2. Extreme Precipitation
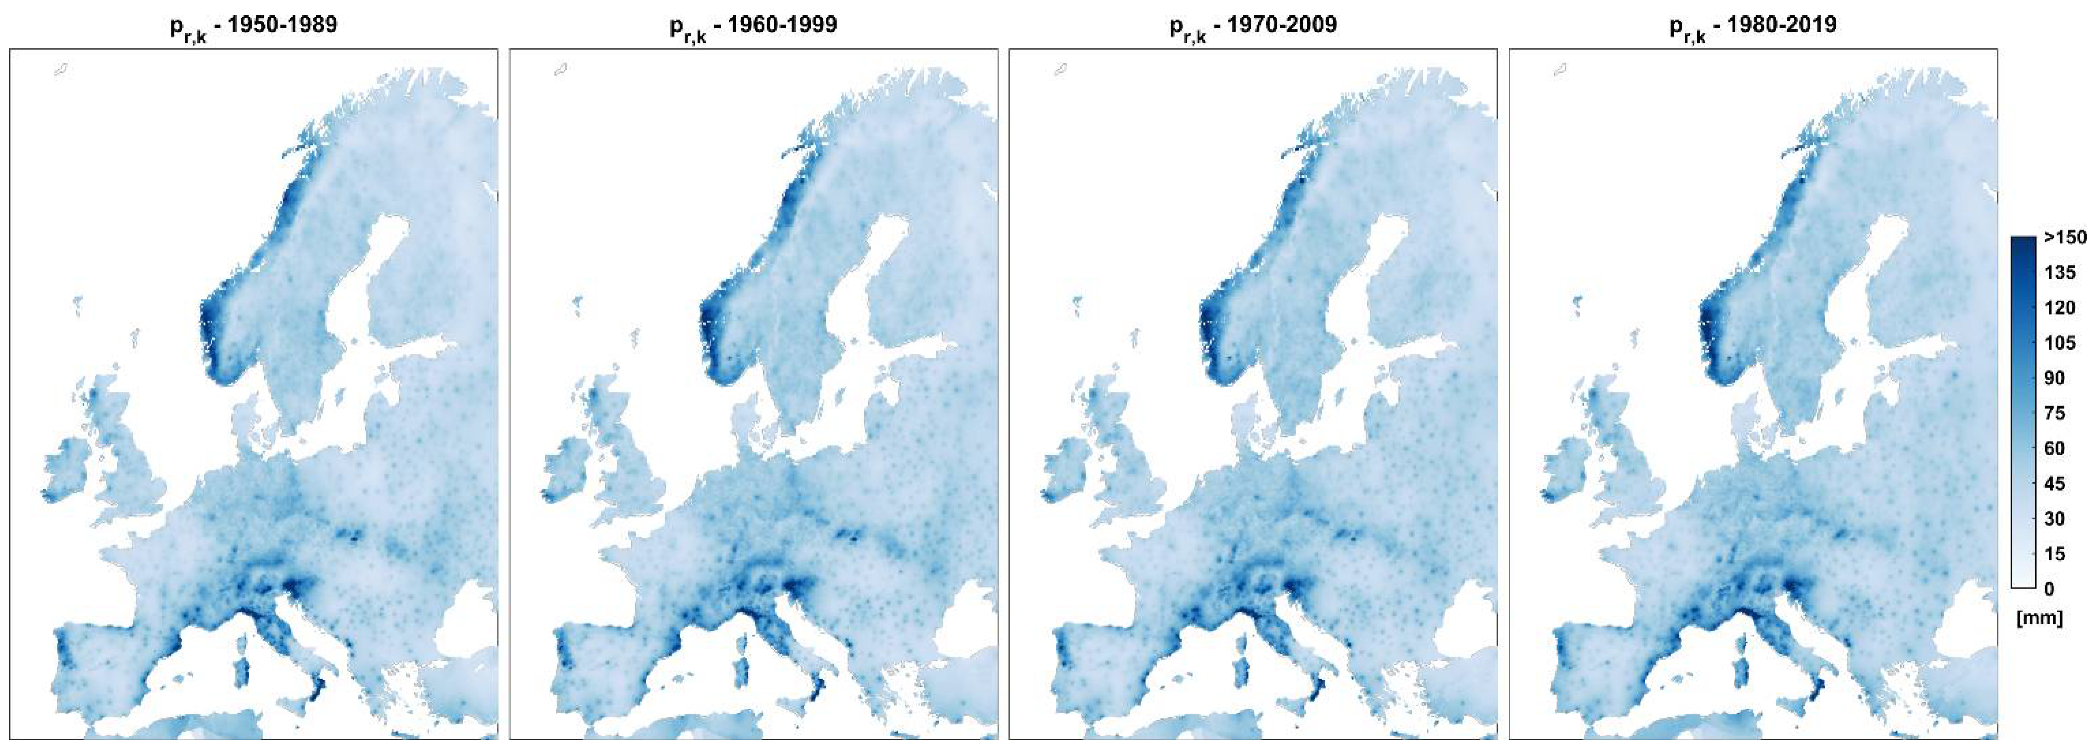
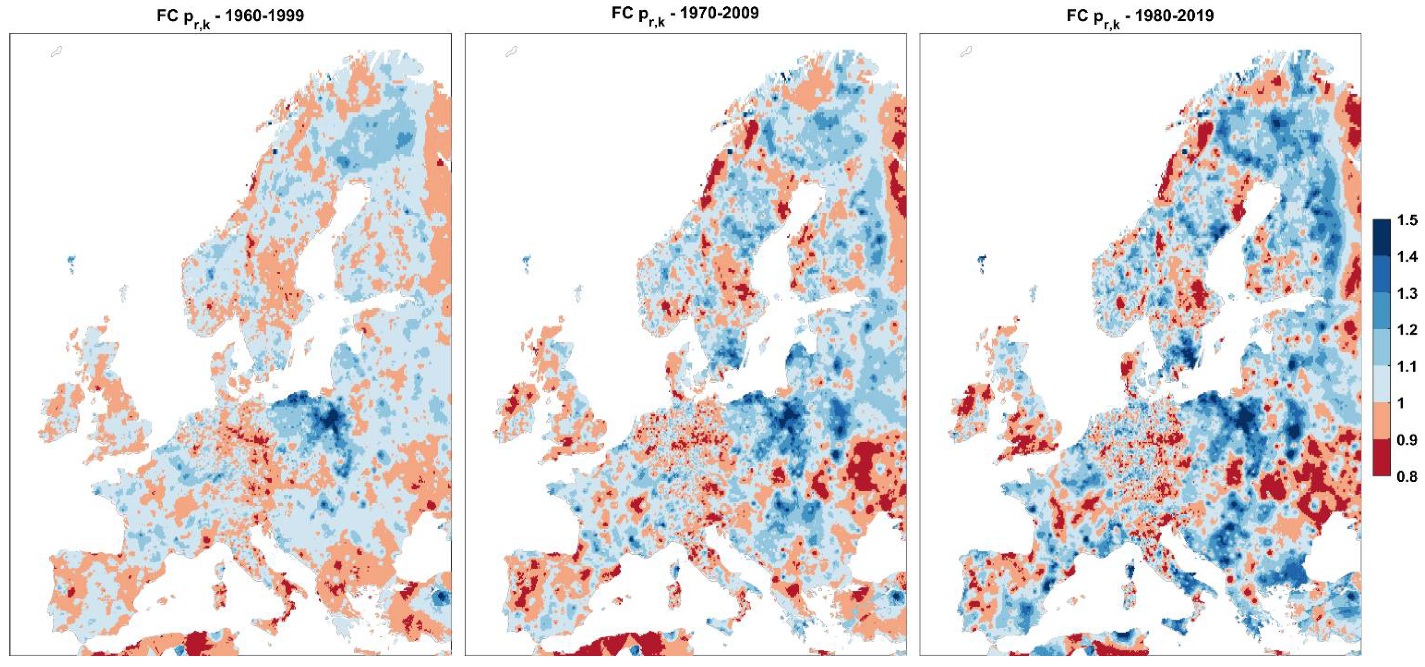
Global warming effects are generally associated to an increase in precipitation extremes [65,66]. The observational evidence of heavy rainfall intensifications in several regions all around the world in the last six decades is confirmed by the outcomes of many recent climate studies [3,67,68]. The observations support the classical Clausius–Clapeyron thermodynamic law, stating that warmer air has a higher water vapor holding capacity [3]. Even if precipitation is not directly covered by structural Eurocodes, changes in the frequency and intensity of precipitation extremes may have significant adverse implications on the hydrologic design of water infrastructures, since it can cause an increase of risk of flooding events as well as a reduction of service life of bridges, associated with higher scouring rate of bridge foundations [9]. Following the procedure already adopted for temperatures, analyses have been carried out for daily precipitation, evaluating historical trends from the E-OBS dataset for the period . The resulting maps are illustrated in Figure 10, while the corresponding factors of change maps, again with reference to the first time window (), are shown in Figure 11.
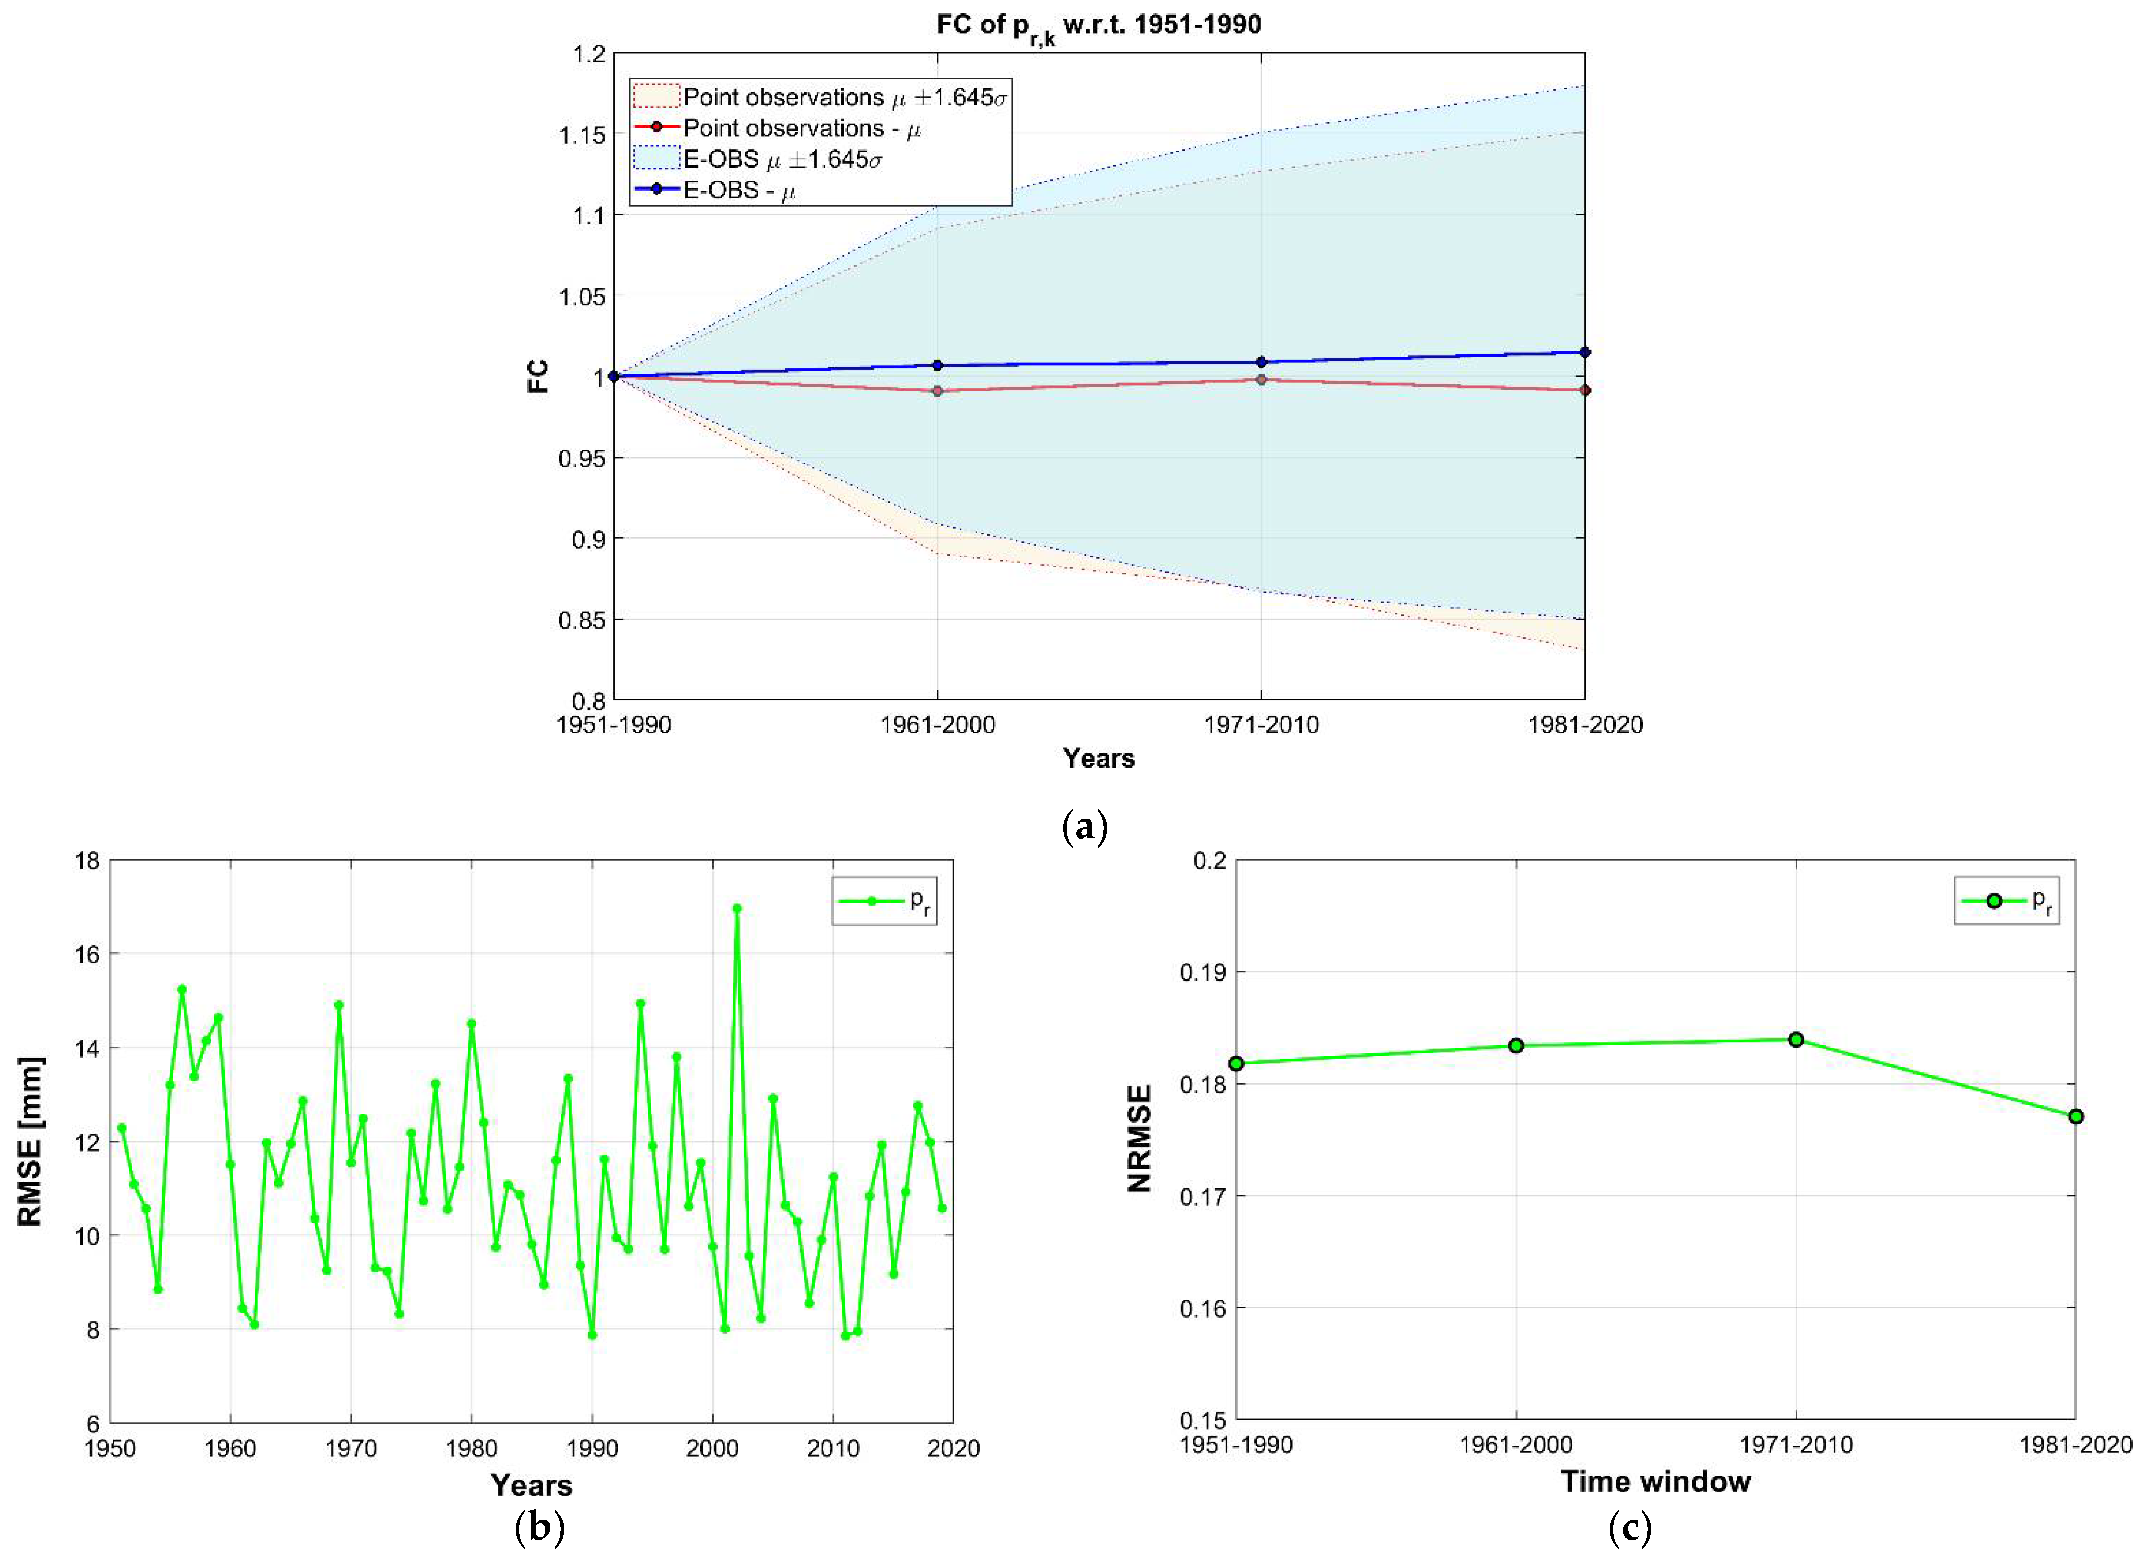
The ability of the E-OBS dataset to reproduce trends in extreme precipitations has been also investigated, comparing the results with those derived from available data registered at the 71 weathers station in Germany and Switzerland (see Figure 8). Factors of change for characteristic values evaluated from the analysis of annual maxima extracted from E-OBS and from the measurements at the test stations are summarized in Figure 12a. The outcomes show very similar constant trends both in terms of average values for the investigated region (blue and red solid lines) and in terms of associated uncertainty interval. The yearly RMSE values, evaluated for annual maxima, are shown in Figure 12b; they range from 8 mm to 15 mm and do not exhibit significant time-dependent changes. Finally, the normalized root mean square errors (NRMSE) obtained considering values characterized by an annual probability of exceedance in the four time windows are diagrammatically illustrated in Figure 12c.
4.2. Historical Trend of Ground Snow Load Based on Uncertainties in Ensembles of Regional Re-Analyses (UERRA) Dataset and Point Observations
Assessing the historical trends of ground snow load is a challenging task for several reasons: the intrinsic complexity of the snowfall phenomena; accumulation and melting of subsequent snowfalls, lack of homogenous data; sparsity of weather stations where snow variables are consistently measured for a sufficient time interval (more than 40 years), and so on. That stated, it must be emphasized that one of the abused and conventional remarks about global warming, stating that it will systematically lead to a reduction of snow loads, is not always true. This evidence makes the analyses extremely interesting for assessing structural reliability of snow load prone structures under changing climatic conditions in the coming decades. In fact, despite a reduction in most regions of Europe of snowfall frequency and mean snowfall being expected as a consequence of the increase of mean temperatures, a contrasting response could be experienced in other regions for snowfall extremes [69]. Actually, the snowfall rate can increase as a result of the intensification of precipitation rate, combined with the decrease of snowfall fraction when the former aspect prevails [69,70].
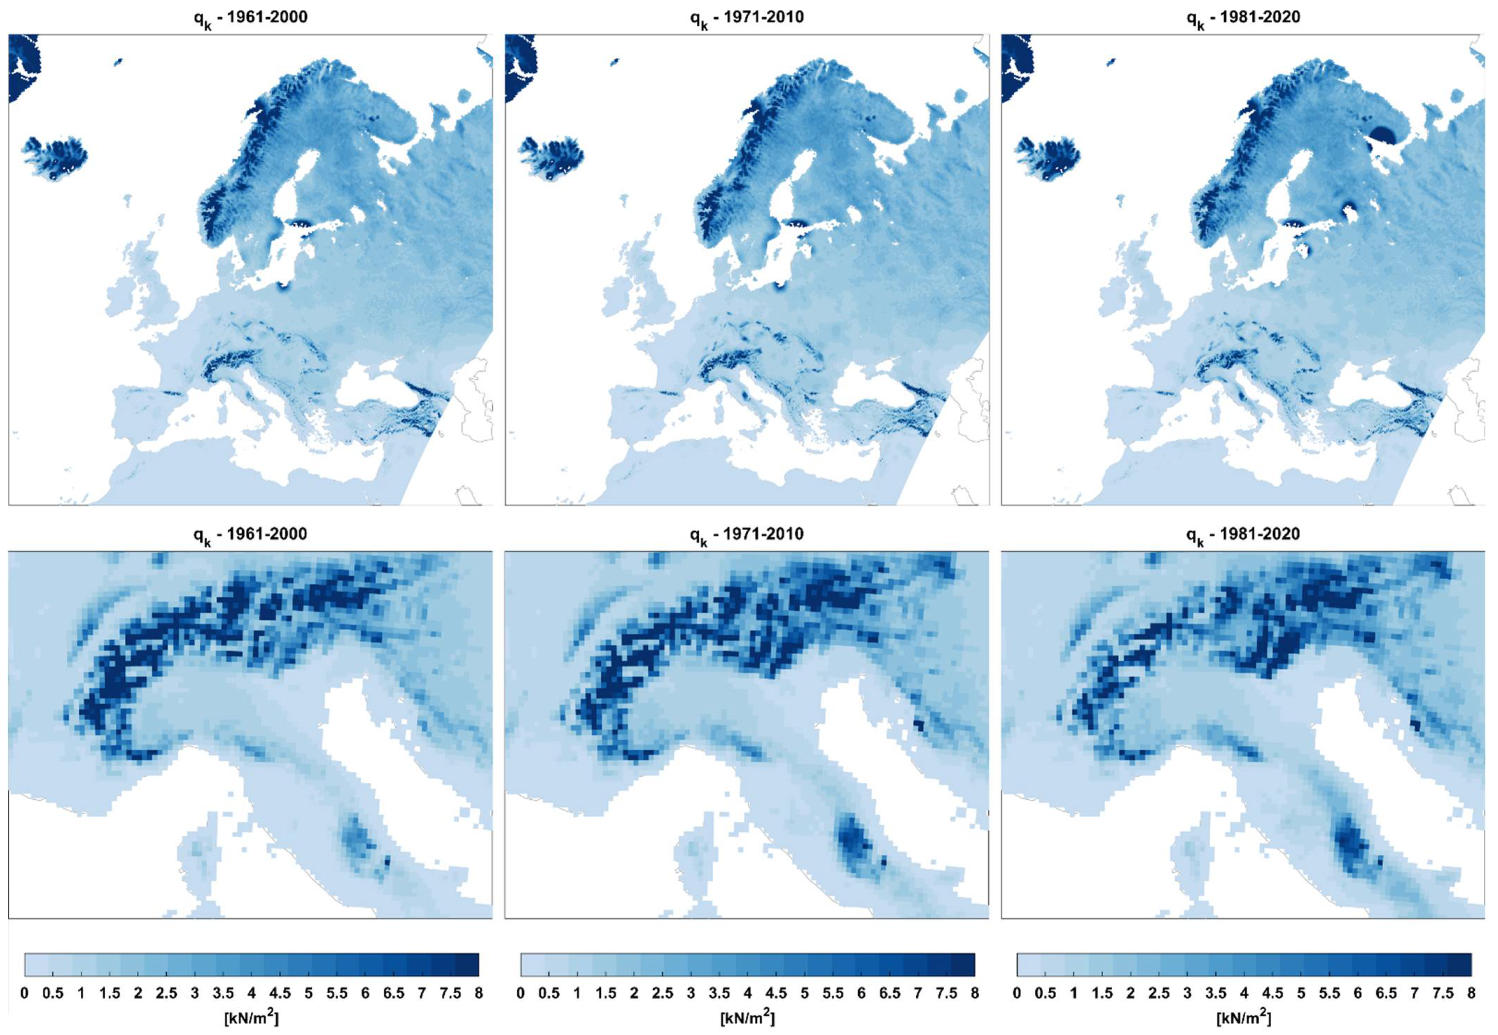
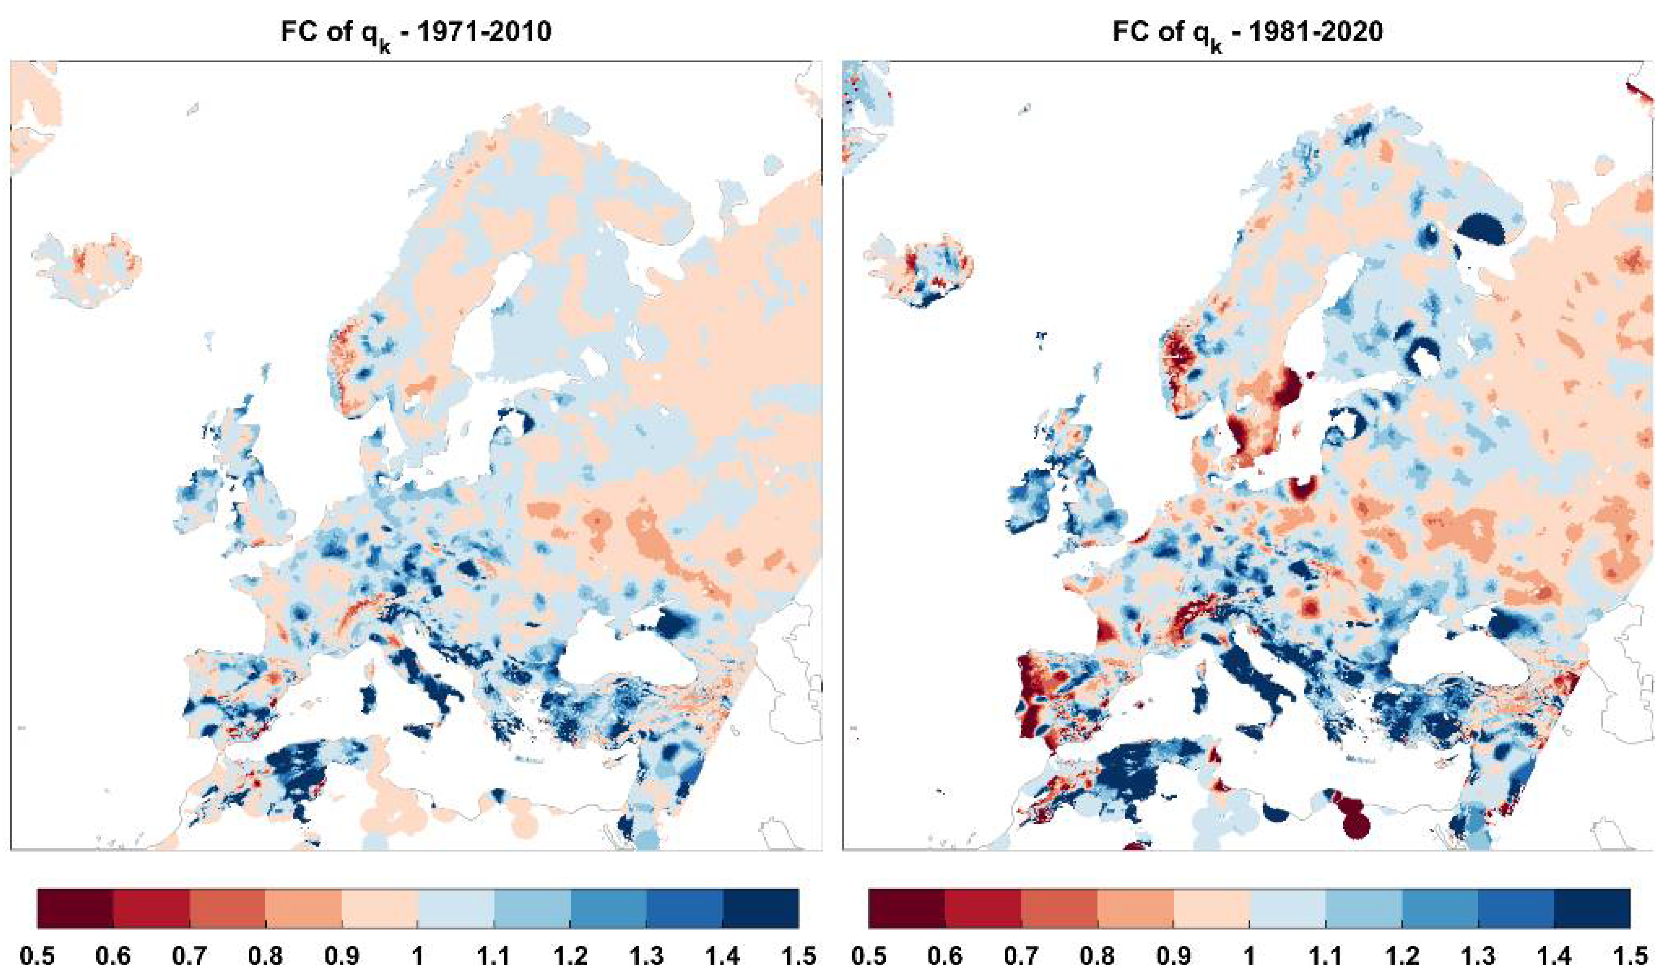
The possibility to evaluate current trend of ground snow loads from regional reanalyses was investigated, extracting the annual maxima of snow water equivalent from the UERRA-HARMONIE dataset by means of the CDS toolbox for the period . An extreme values analysis was then carried out in the subsequent 40-year long time windows (, and ), and for each time window characteristic values (annual probability of exceedance ) were derived. The resulting ground snow load maps are illustrated in Figure 13, where the northcentral Italy is illustrated in more detail. The corresponding factors of change maps, referred to the initial time window (), are shown in Figure 14. The maps show increasing trend of ground snow loads in large parts of the European territory; however, this outcome is not confirmed by the observations [8,45]. In fact, a detailed examination of the annual maxima values on a station-by-station basis revealed a significant underestimation of ground snow load by regional reanalyses in the first 20 years of the simulation period, thus leading to false positive trends. This is not particularly surprising, as the conversion of water equivalent into snow loads is not so direct, as it could appear at first sight, because it is affected by several other phenomena, as discussed, for example, in [7,8,9]. Taking into account that it is characterized by a good amount of available high-quality data series of snow depth measurements, the region already investigated for temperature and precipitation extremes has also been considered, to compare the reanalysis data with real point observations.
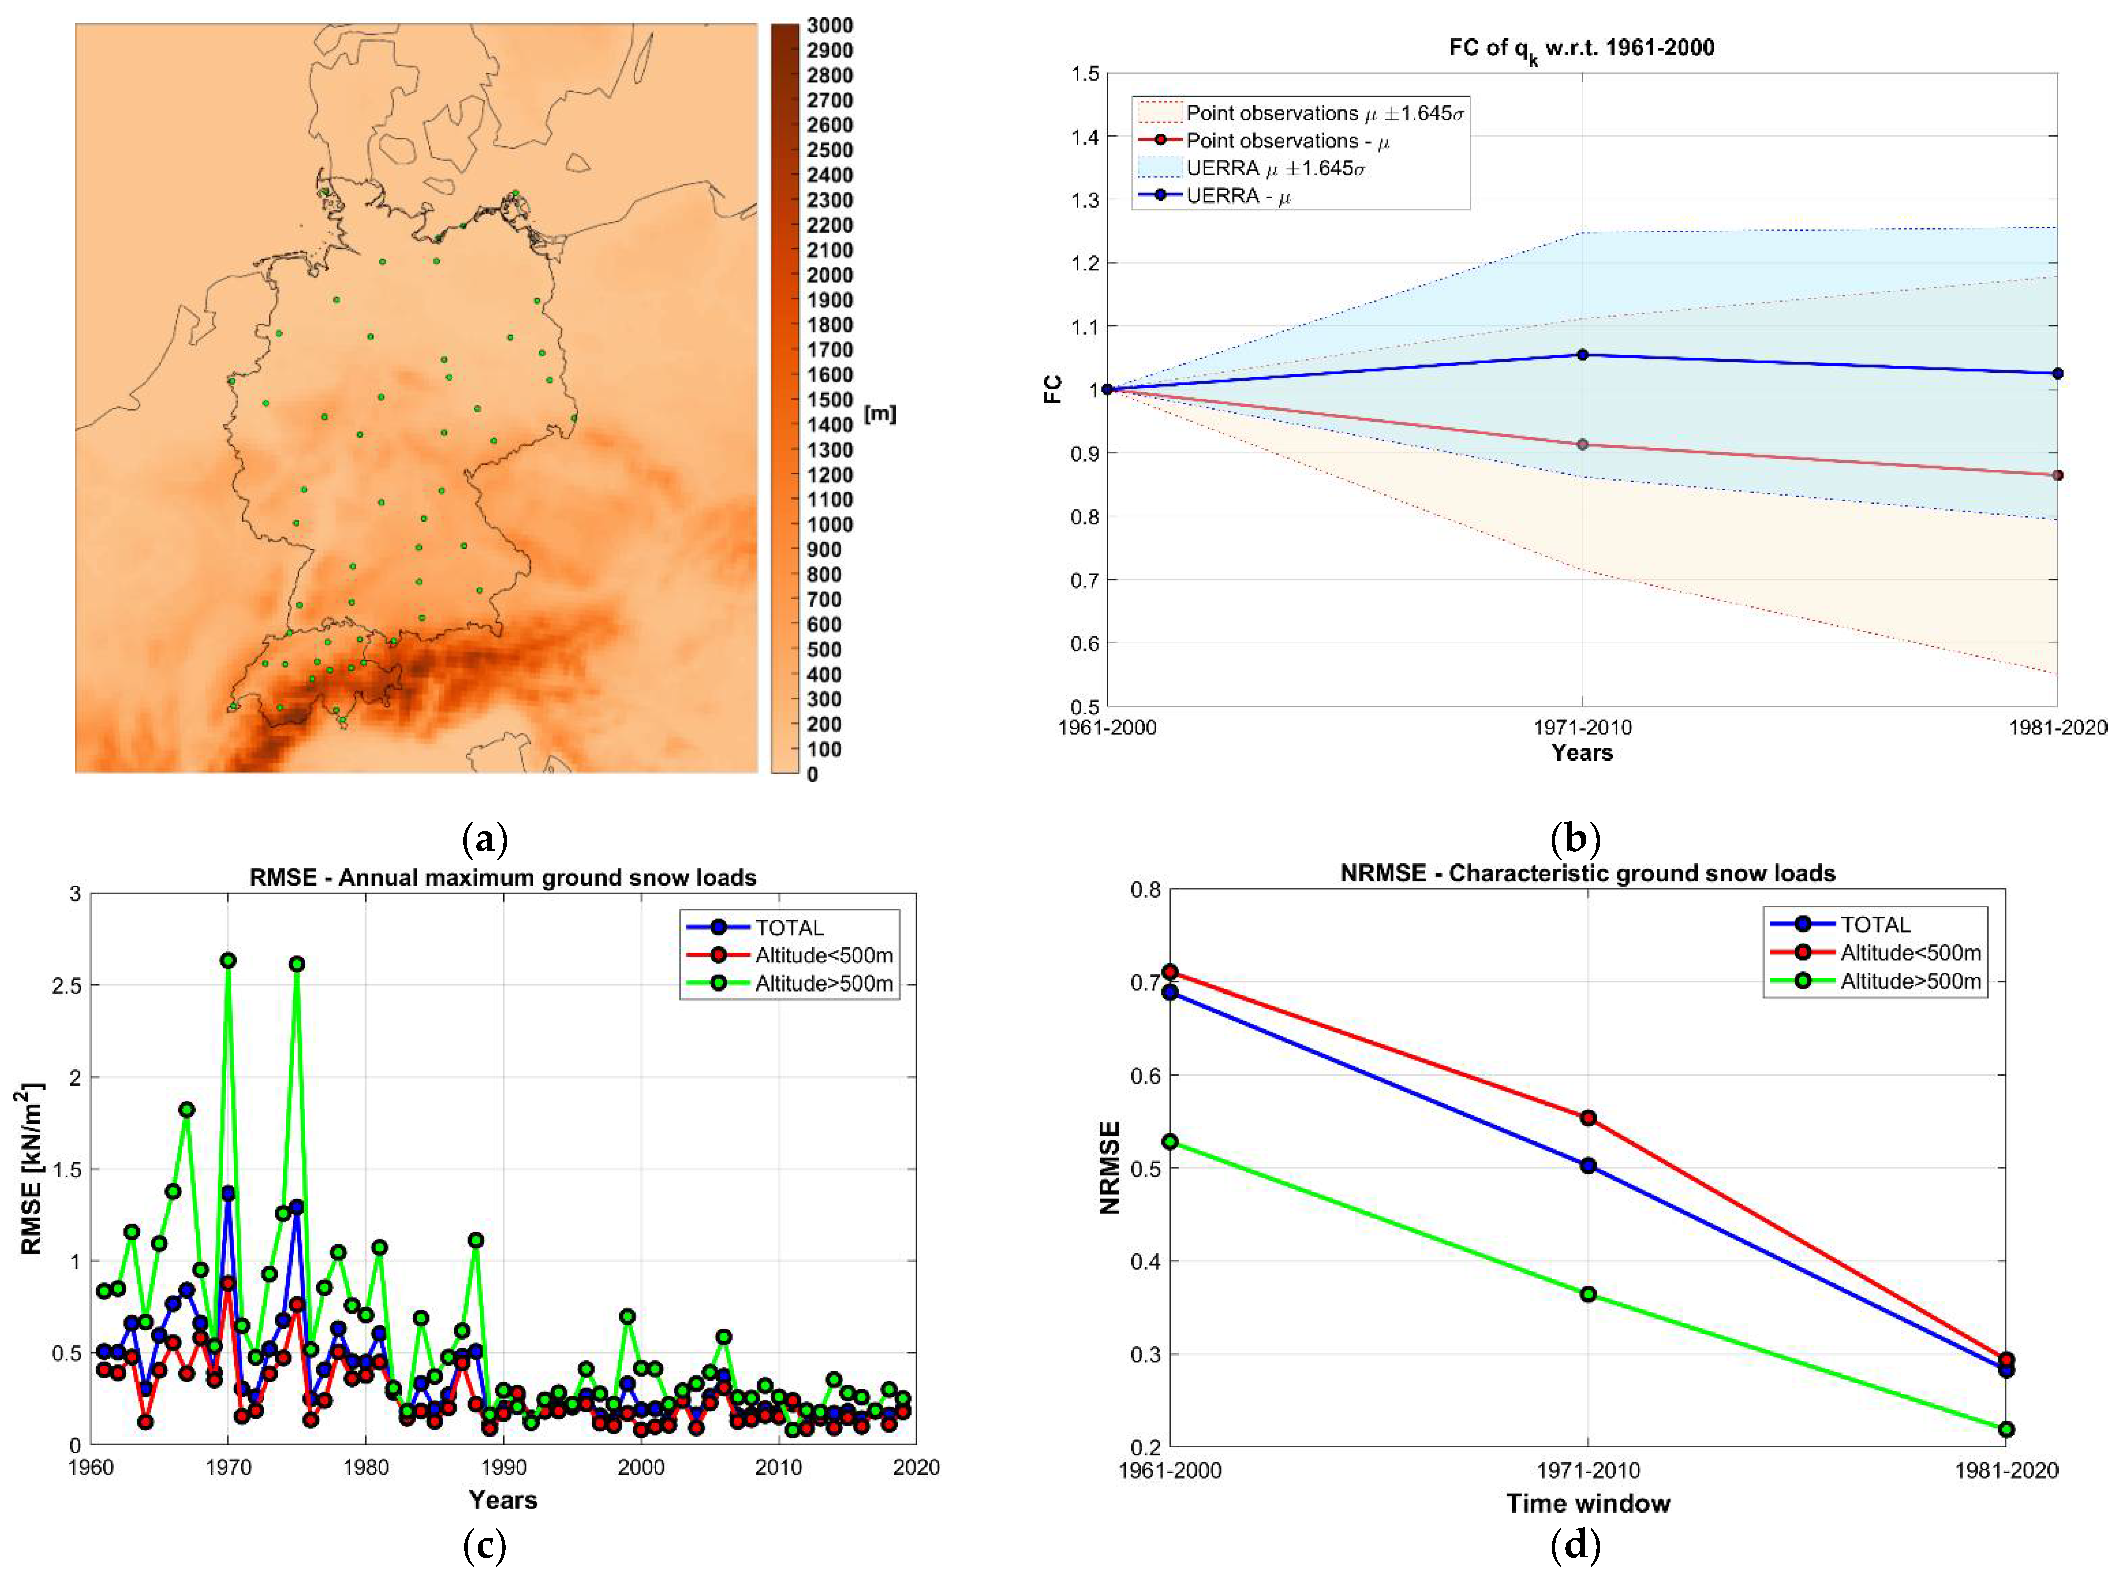
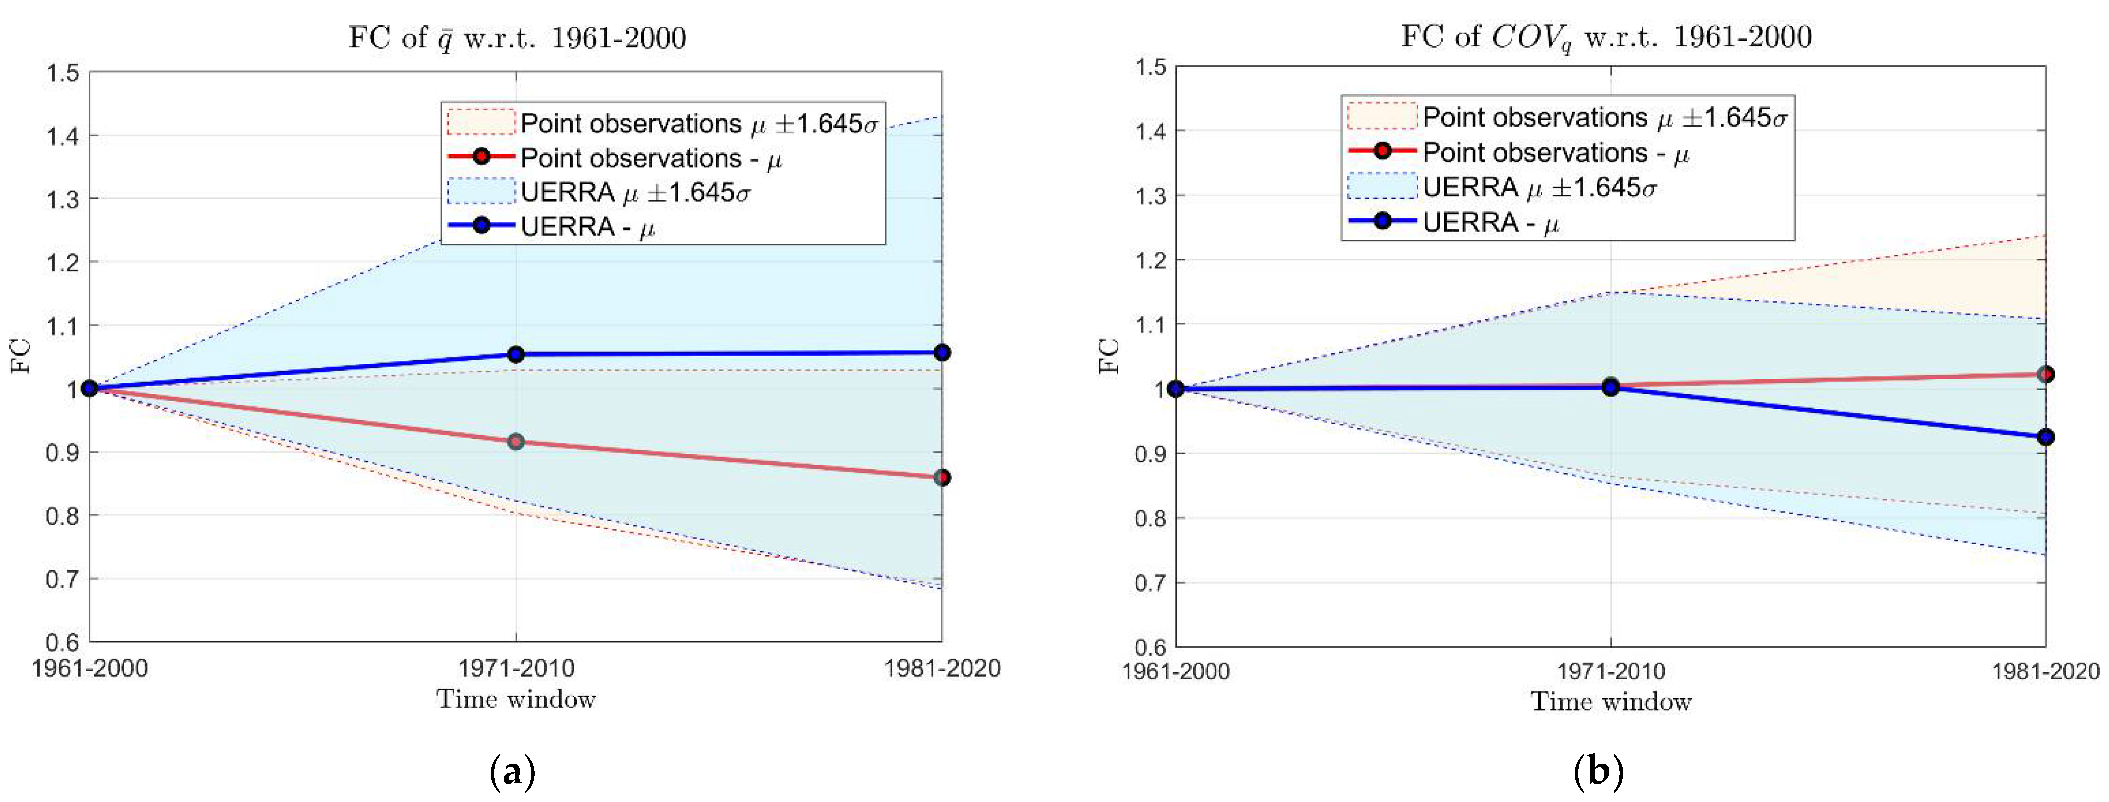
For the aim of the study, 51 weather stations in Germany and Switzerland (see Figure 15a) have been selected among the 71 previously analyzed, and factors of change have been evaluated for characteristic ground snow load (Figure 15b), mean of annual maxima (Figure 16a), and coefficient of variation of annual maxima () (Figure 16b). As known, the assessment of the evolution over time of the two relevant variables and is particularly important, since the variation of structural reliability over time significantly depend on them [9,19]. The two datasets lead to the estimation of significantly different trends if the snow loads obtained considering the second time window are compared with those obtained considering the first time window. Looking at Figure 15c, this discrepancy can be easily explained noting that error statistics (RMSE) between annual maxima derived from UERRA reanalysis and point observations, which are very large with reference to the period , significantly reduce in recent years, . Considering instead the NRMSE for characteristic ground snow loads in the three subsequent time windows, illustrated in Figure 15d, it clearly emerges that errors significantly reduce over time, which confirms that the ability of the UERRA-HARMONIE reanalysis to reproduce snow depth measurements in the investigated areas is not satisfactory going back in time for more than 30 years. On the basis of the above investigations, regional reanalysis data for snow depth water equivalent, which are still useful for the validation of climate model projections in a limited period (), seem to not allow, at the current state, an assessment of observed trends.
5. Conclusions
The assumption of stationary climate, which is still a common practice for the definition of climatic actions in design standards for engineering structures and infrastructures, is currently being debated due to the gradually increasing and tangible effects of climate change. Historical trends of climatic actions provide a first input for the adaptation of climatic load maps in Europe. In fact, to ensure an adequate reliability level over time and to cope with the effects of climate change, the existing maps, generally based on observation collected more than 20 years ago, require urgent updates to include the latest observations as well as available information on future climate provided by climate models. Strategies and methods for the update of climatic load maps have been discussed in this paper, while methods for the evaluation of long-term structural reliability in a changing climate have been presented in previous works.
Changes in extremes of climatic variables in Europe, such as daily maximum and minimum temperatures, daily precipitation and ground snow loads, have been assessed based on available datasets of gridded observations (E-OBS) and regional reanalysis (UERRA). The results in terms of characteristic values, compared against a significant case study of point observations covering Switzerland and Germany show the ability of the E-OBS gridded dataset to adequately reproduce trends in extreme temperatures and precipitation in the investigated regions. By contrast, reanalysis data provide biases in the evaluation of basic wind velocity and ground snow load trends. In the first case a significant underestimation is observed due to data downsampling (6 h sampling rate), while for snow loads more encouraging results are obtained as the observed biases reduce from the first time window () to the present. Unfortunately, this still makes the reanalysis dataset unsuitable for the assessment of snow load trends.
Further studies, starting from the results obtained, will focus on the evaluation of future trends in the investigated regions, extending the data series with a multi-model ensemble of climate projections based on different future scenarios.
Supplementary Materials
The data are available online at https://0-www-mdpi-com.brum.beds.ac.uk/article/10.3390/rs13112025/s1.
Author Contributions
Conceptualization, P.C., P.F. and F.L.; methodology, P.C., P.F. and F.L.; software, P.C., P.F. and F.L.; validation, P.C., P.F. and F.L.; writing—original draft preparation, P.C., P.F. and F.L.; writing—review and editing, P.C., P.F. and F.L.; resources, P.C. All authors have read and agreed to the published version of the manuscript.
Funding
This research received no external funding.
Data Availability Statement
The data presented in this study are available in Supplementary Materials.
Acknowledgments
We acknowledge the E-OBS dataset from the EU-FP6 project UERRA (https://www.uerra.eu accessed on 19 April 2021) and the Copernicus Climate Change Service, and the data providers in the ECA&D project (https://www.ecad.eu accessed on 18 May 2021).
Conflicts of Interest
The authors declare no conflict of interest.
References
- Intergovernmental Panel on Climate Change (IPCC). Climate Change 2013: The Physical Science Basis. Contribution of Working Group I to the Fifth Assessment Report of the Intergovernmental Panel on Climate Change; Cambridge University Press: Cambridge, UK; New York, NY, USA, 2013. [Google Scholar]
- Intergovernmental Panel on Climate Change (IPCC). Climate Change 2014: Impacts, Adaptation and Vulnerability—Part B: Regional aspects—Contribution of Working Group II to the Fifth Assessment Report of the Intergovernmental Panel on Climate Change; Cambridge University Press: Cambridge, UK, 2014. [Google Scholar]
- Fischer, E.M.; Knutti, R. Observed heavy precipitation increase confirms theory and early models. Nat. Clim. Chang. 2016, 6, 986–991. [Google Scholar] [CrossRef]
- European Environmental Agency (EEA). Climate Change Impacts and Vulnerability in Europe—An Indicator-Based Report; EEA Report 1/2017; European Environment Agency: Copenhagen, Denmark, 2017. [Google Scholar]
- European Committee for Standardization (CEN). EN 1990 Eurocode—Basis of Structural Design; CEN: Brussels, Belgium, 2002. [Google Scholar]
- International Organization for Standardization (ISO). ISO 2394 General Principles on Reliability for Structures; ISO: Geneva, Switzerland, 2015. [Google Scholar]
- Croce, P.; Formichi, P.; Landi, F.; Marsili, F. Climate change: Impact on snow loads on structures. Cold Reg. Sci. Technol. 2018, 150, 35–50. [Google Scholar] [CrossRef] [Green Version]
- Croce, P.; Formichi, P.; Landi, F.; Mercogliano, P.; Bucchignani, E.; Dosio, A.; Dimova, S. The snow load in Europe and the climate change. Clim. Risk Manag. 2018, 20, 138–154. [Google Scholar] [CrossRef]
- Croce, P.; Formichi, P.; Landi, F. Climate Change: Impacts on Climatic Actions and Structural Reliability. Appl. Sci. 2019, 9, 5416. [Google Scholar] [CrossRef] [Green Version]
- Madsen, H.O. Managing structural safety and reliability in adaptation to climate change. In Safety, Reliability, Risk and Life-Cycle Performance of Structures and Infrastructure; Deodatis, E.F., Ed.; Taylor & Francis Group: London, UK, 2013; pp. 81–88. ISBN 978-1-315-88488-2. [Google Scholar]
- Croce, P.; Formichi, P.; Landi, F.; Marsili, F. Harmonized European ground snow load map: Analysis and comparison of national provisions. Cold Reg. Sci. Technol. 2019, 168, 102875. [Google Scholar] [CrossRef]
- Sanpaolesi, L.; Del Corso, R.; Formichi, P.; Currie, D.; Sims, P.; Sacré, C.; Stiefel, U.; Lozza, S.; Eiselt, B.; Peckham, R.; et al. Phase 1 Final Report to the European Commission, Scientific Support Activity in the Field of Structural Stability of Civil Engineering Works: Snow Loads; Department of Structural Engineering, University of Pisa: Pisa, Italy, 1998; Available online: http://www2.ing.unipi.it/dic/snowloads/Final%20Report%20I.pdf (accessed on 20 March 2021).
- Formichi, P.; Danciu, L.; Akkar, S.; Kale, O.; Malakatas, N.; Croce, P.; Nikolov, D.; Gocheva, A.; Luechinger, P.; Fardis, M.; et al. Eurocodes: Background and applications. Elaboration of maps for climatic and seismic actions for structural design with the Eurocodes. JRC Sci. Policy Rep. 2016. [Google Scholar] [CrossRef]
- European Commission. M/515 EN—Mandate for Amending Existing Eurocodes and Extending the Scope of Structural Eurocodes; European Commission: Brussels, Belgium, 2012. [Google Scholar]
- European Committee for Standardization (CEN). CEN/TC250—Response to Mandate M/515—Towards a Second Generation of Eurocodes; CEN-TC250—N 993; European Committee for Standardization: Brussels, Belgium, 2013. [Google Scholar]
- Anandhi, A.; Frei, A.; Pierson, D.C.; Schneiderman, E.M.; Zion, M.S.; Lounsbury, D.; Matonse, A.H. Examination of change factor methodologies for climate change impact assessment. Water Resour. Res. 2011, 47, W03501. [Google Scholar] [CrossRef] [Green Version]
- Fatichi, S.; Ivanov, V.Y.; Caporali, E. Simulation of future climate scenarios with a weather generator. Adv. Water Resour. 2011, 34, 448–467. [Google Scholar] [CrossRef]
- Ho, C.K.; Stephenson, D.B.; Collins, M.; Ferro, C.A.T.; Brown, S.J. Calibration strategies a source of additional uncertainty in climate change projections. Bull. Am. Meteorol. Soc. 2012, 93, 21–26. [Google Scholar] [CrossRef] [Green Version]
- Croce, P.; Formichi, P.; Landi, F. Probabilistic methodology to assess impact of climate change on structural safety. In Proceedings of the 30th European Safety and Reliability Conference and the 15th Probabilistic Safety Assessment and Management Conference, Venice, Italy, 1–5 November 2020; Baraldi, P., Di Maio, F., Zio, E., Eds.; Research Publishing: Singapore, 2020; pp. 4758–4764. [Google Scholar] [CrossRef]
- Croce, P.; Formichi, P.; Landi, F. A Bayesian hierarchical model for climatic loads under climate change. In Proceedings of the 3rd ECCOMAS Thematic Conference on Uncertainty Quantification in Computational Sciences and Engineering, Crete, Greece, 24–26 June 2019; pp. 298–308. [Google Scholar]
- Haylock, M.R.; Hofstra, N.; Klein Tank, A.M.G.; Klok, E.J.; Jones, P.D.; New, M. A European daily high-resolution gridded data set of surface temperature and precipitation for 1950–2006. J. Geophys. Res. 2008, 113, D20119. [Google Scholar] [CrossRef] [Green Version]
- Cornes, R.C.; van der Schrier, G.; van den Besselaar, E.J.M.; Jones, P.D. An Ensemble Version of the E-OBS Temperature and Precipitation Data Sets. J. Geophys. Res. Atmosph. 2018, 123, 9391–9409. [Google Scholar] [CrossRef] [Green Version]
- Bach, L.; Schraff, C.; Keller, J.D.; Hense, A. Towards a probabilistic regional reanalysis system for Europe: Evaluation of precipitation from experiments. Tellus A Dyn. Meteorol. Oceanograph. 2016, 68, 32209. [Google Scholar] [CrossRef] [Green Version]
- European Committee for Standardization (CEN). EN 1991-1-3. Eurocode 1: Actions on Structures—Part 1–3: General Actions—Snow Loads; CEN: Brussels, Belgium, 2003. [Google Scholar]
- European Committee for Standardization (CEN). EN 1991-1-4. Eurocode 1: Actions on Structures—Part 1-4: General Actions—Wind Actions; CEN: Brussels, Belgium, 2005. [Google Scholar]
- European Committee for Standardization (CEN). EN 1991-1-5. Eurocode 1: Actions on Structures—Part 1–5: General Actions—Thermal Actions; CEN: Brussels, Belgium, 2003. [Google Scholar]
- European Committee for Standardization (CEN). SC1.PT5 “Climate Change” Final Report; CEN/TC250—N64; CEN: Brussels, Belgium, 2017. [Google Scholar]
- CZ Map of the Snow Load on the Ground. Available online: https://clima-maps.info/snehovamapa/ (accessed on 20 March 2021).
- World Metereological Office (WMO). The Global Observing System for Climate: Implementation Needs; WMO: Geneva, Switzerland, 2016; Available online: https://unfccc.int/files/science/workstreams/systematic_observation/application/pdf/gcos_ip_10oct2016.pdf (accessed on 10 May 2021).
- Krähenmann, S.; Walter, A.; Brienen, S.; Imbery, F.; Matzaraki, A. High-resolution grids of hourly meteorological variables for Germany. Appl. Clim. 2018, 131, 899–926. [Google Scholar] [CrossRef] [Green Version]
- Quintana-Seguí, P.; Le Moigne, P.; Durand, Y.; Martin, E.; Habets, F.; Baillon, M.; Canellas, C.; Franchisteguy, L.; Morel, S. Analysis of near-surface atmospheric variables: Validation of the SAFRAN analysis over France. J. Appl. Meteorol. Climatol. 2008, 47, 92–107. [Google Scholar] [CrossRef]
- DWD. Regionalisierte Niederschlagshöhen (REGNIE); Deutscher Wetterdienst: Offenbach am Main, Germany, 2009. [Google Scholar]
- Mohr, M. Comparison of Versions 1.1 and 1.0 of Gridded Temperature and Precipitation Data for Norway; Technical Report; Report No. 19; Norwegian Meteorological Institute: Oslo, Norway, 2009. [Google Scholar]
- Herrera, S.; Gutiérrez, J.M.; Ancell, R.; Pons, M.R.; Fras, M.D.; Fernández, J. Development and analysis of a 50-year high-resolution daily gridded precipitation dataset over Spain (Spain02). Int. J. Climatol. 2012, 32, 74–85. [Google Scholar] [CrossRef] [Green Version]
- Perry, M.; Hollis, D. The generation of monthly gridded datasets for a range of climatic variables over the UK. Int. J. Climatol. 2005, 25, 1041–1054. [Google Scholar] [CrossRef]
- Prein, A.F.; Gobiet, A. Impacts of uncertainties in European gridded precipitation observations on regional climate analysis. Int. J. Climatol. 2017, 37, 305–327. [Google Scholar] [CrossRef] [PubMed]
- Klein Tank, A.M.G.; Wijngaard, J.B.; Können, G.P.; Böhm, R.; Demarée, G. Daily dataset of 20th-century surface air temperature and precipitation series for the European Climate Assessment. Int. J. Climatol. 2002, 22, 1441–1453. [Google Scholar] [CrossRef]
- Klok, E.J.; Klein Tank, A.M.G. Updated and extended European dataset of daily climate observations. Int. J. Climatol. 2009, 29, 1182–1191. [Google Scholar] [CrossRef]
- Chervenkov, H.; Malcheva, K. Statistical Modelling of Extremes with Distributions of Fréchet and Gumbel: Parameter Estimation and Demonstration of Meteorological Applications. Int. J. Bioautom. 2018, 22, 21–38. [Google Scholar] [CrossRef] [Green Version]
- Notarnicola, C.; Duguay, M.; Moelg, N.; Schellenberger, T.; Tetzla, A.; Monsorno, R.; Costa, A.; Steurer, C.; Zebisch, M. Snow Cover Maps from MODIS Images at 250 m Resolution, Part 1: Algorithm Description. Remote Sens. 2013, 5, 110–126. [Google Scholar] [CrossRef] [Green Version]
- Matiu, M.; Jacob, A.; Notarnicola, C. Daily MODIS snow cover maps for the European Alps from 2002 onwards at 250 m horizontal resolution along with a nearly cloud-free version. Data 2020, 5, 1. [Google Scholar] [CrossRef] [Green Version]
- Allan Frei, A.; Tedesco, M.; Lee, S.; Foster, J.; Hall, D.K.; Kelly, R.; Robinson, D.A. A review of global satellite-derived snow products. Adv. Space Res. 2012, 50, 1007–1029. [Google Scholar] [CrossRef] [Green Version]
- Takala, M.; Luojus, K.; Pulliainen, J.; Derksen, C.; Lemmetyinen, J.; Kärnä, J.-P.; Koskinen, J.; Bojkov, B. Estimating northern hemisphere snow water equivalent for climate research through assimilation of space-borne radiometer data and ground-based measurements. Remote Sens. Environ. 2011, 115, 3517–3529. [Google Scholar] [CrossRef]
- Fontrodona Bach, A.; van der Schrier, G.; Melsen, L.A.; Klein Tank, A.M.G.; Teuling, A.J. Widespread and Accelerated Decrease of Observed Mean and Extreme Snow Depth Over Europe. Geophys. Res. Lett. 2018, 45, 312–319. [Google Scholar] [CrossRef] [Green Version]
- Croce, P.; Formichi, P.; Landi, F. Probabilistic Assessment of Roof Snow Load and the Calibration of Shape Coefficients in the Eurocodes. Appl. Sci. 2021, 11, 2984. [Google Scholar] [CrossRef]
- Moemken, J.; Reyer, M.; Feldmann, H.; Pinto, J.G. Future Changes of Wind Speed and Wind Energy Potentials in EURO-CORDEX Ensemble Simulations. J. Geophys. Res. Atmos. 2018, 123, 1–17. [Google Scholar] [CrossRef]
- Vionnet, V.; Brun, E.; Morin, S.; Boone, A.; Faroux, S.; Le Moigne, P.; Martin, E.; Willemet, J.-M. The detailed snowpack scheme Crocus and its implementation in SURFEX v7.2. Geosci. Model Dev. 2012, 5, 773–791. [Google Scholar] [CrossRef] [Green Version]
- Le Roux, E.; Evin, G.; Eckert, N.; Blanchet, J.; Morin, S. Non-stationary extreme value analysis of ground snow loads in the French Alps: A comparison with building standards. Nat. Hazards Earth Syst. Sci. 2020, 20, 2961–2977. [Google Scholar] [CrossRef]
- Ridal, M.; Olsson, E.; Unden, P.; Zimmermann, K.; Ohlsson, A. Uncertainties in Ensembles of Regional Re-Analyses. Deliverable D2.7 HARMONIE Reanalysis Report of Results and Dataset. 2017. Available online: https://www.uerra.eu/component/dpattachments/?task=attachment.download&id=297 (accessed on 10 May 2021).
- Copernicus Climate Change Service. UERRA Data User Guide. Version 3.3. Available online: https://datastore.copernicus-climate.eu/documents/uerra/D322_Lot1.4.1.2_User_guides_v3.3.pdf (accessed on 7 May 2021).
- Chiodi, R.; Ricciardelli, F. Three issues concerning the statistics of mean and extreme wind speeds. J. Wind Eng. Ind. Aerodyn. 2014, 125, 156–167. [Google Scholar] [CrossRef]
- Jacob, D.; Petersen, J.; Eggert, B.; Alias, A.; Christensen, O.B.; Bouwer, L.M.; Braun, A.; Colette, A.; Déqué, M.; Georgievski, G.; et al. EURO-CORDEX: New high-resolution climate change projections for European impact research. Reg. Environ. Chang. 2014, 14, 563–578. [Google Scholar] [CrossRef]
- Kotlarski, S.; Keuler, K.; Christensen, O.B.; Colette, A.; Déqué, M.; Gobiet, A.; Goergen, K.; Jacob, D.; Lüthi, D.; van Meijgaard, E.; et al. Regional Climate Modelling on European Scale: A joint standard evaluation of the EURO-CORDEX ensemble. Geosci. Model Dev. 2014, 7, 1297–1333. [Google Scholar] [CrossRef] [Green Version]
- Van Vuuren, D.P.; Edmonds, J.; Kainuma, M.; Riahi, K.; Thomson, A.; Hibbard, K.; Hurtt, G.C.; Kram, T.; Krey, V.; Lamarque, J.F.; et al. The representative concentration pathways: An overview. Clim. Chang. 2011, 109, 5–31. [Google Scholar] [CrossRef]
- Jacob, D.; Teichmann, C.; Sobolowski, S.; Katragkou, E.; Anders, I.; Belda, M.; Wulfmeyer, V. Regional climate downscaling over Europe: Perspectives from the EURO-CORDEX community. Reg. Environ. Chang. 2020, 20, 51. [Google Scholar] [CrossRef]
- Matiu, M.; Petitta, M.; Notarnicola, C.; Zebisch, M. Evaluating Snow in EURO-CORDEX Regional Climate Models with Observations for the European Alps: Biases and Their Relationship to Orography, Temperature, and Precipitation Mismatches. Atmosphere 2020, 11, 46. [Google Scholar] [CrossRef] [Green Version]
- Croce, P.; Formichi, P.; Landi, F. Structural safety and design under climate change. In The Evolving Metropolis, Proceedings of the IABSE Congress, New York, NY, USA, 4–6 September 2019; IABSE: Zurich, Switzerland, 2019; pp. 1130–1135. ISBN 978-385748165-9. [Google Scholar]
- Croce, P.; Formichi, P.; Landi, F.; Marsili, F. Evaluating the effect of climate change on thermal actions on structures. In Life-Cycle Analysis and Assessment in Civil Engineering: Towards an Integrated Vision; Caspeele, R.L., Taerwe, D., Frangopol, M., Eds.; Taylor & Francis Group: Oxfordshire, UK, 2019; pp. 1751–1758. ISBN 978-1-138-62633-1. [Google Scholar]
- Coles, S. An Introduction to Statistical Modelling of Extreme Values; Springer: London, UK, 2001. [Google Scholar]
- Croce, P.; Formichi, P.; Landi, F. Implication of climate change on climatic actions on structures: The update of climatic load maps. In Synergy of Culture and Civil Engineering—History and Challenges—Report, Proceedings of the IABSE Symposium, Wrocław, Poland, 7–9 October 2020; IABSE: Zurich, Switzerland, 2020; pp. 877–884. [Google Scholar]
- Rypkema, D.; Tuljapurkar, S. Chapter 2—Modeling extreme climatic events using the generalized extreme value (GEV) distribution. In Handbook of Statistics; Srinivasa Rao, S.R., Rao, C.R., Eds.; Elsevier: Amsterdam, The Netherlands, 2021; pp. 39–71. [Google Scholar] [CrossRef]
- Młynski, D.; Wałega, A.; Petroselli, A.; Tauro, F.; Cebulska, M. Estimating Maximum Daily Precipitation in the Upper Vistula Basin, Poland. Atmosphere 2019, 10, 43. [Google Scholar] [CrossRef] [Green Version]
- Papalexiou, S.M.; Koutsoyiannis, D. Battle of extreme value distributions: A global survey on extreme daily rainfall. Water Resour. Res. 2012, 49, 187–201. [Google Scholar] [CrossRef]
- Serinaldi, F.; Kilsby, C.G. Rainfall extremes: Toward reconciliation after the battle of distributions. Water Resour. Res. 2014, 50, 336–352. [Google Scholar] [CrossRef] [Green Version]
- O’Gorman, P.A. Precipitation Extremes Under Climate Change. Curr. Clim. Chang. Rep. 2015, 1, 49–59. [Google Scholar] [CrossRef] [Green Version]
- Croce, P.; Formichi, P.; Landi, F.; Marsili, F. Implication of climate change on extreme values of rainfall. In Proceedings of the IMSCI 2018—12th International Multi-Conference on Society, Cybernetics and Informatics, Orlando, FL, USA, 8–11 July 2018; Volume 1, pp. 132–137. [Google Scholar]
- Westra, S.; Alexander, L.V.; Zwiers, F.W. Global increasing trends in annual maximum daily precipitation. J. Clim. 2013, 26, 3904–3918. [Google Scholar] [CrossRef] [Green Version]
- Donat, M.G.; Lowry, A.L.; Alexander, L.V.; O’Gorman, P.A.; Maher, N. More extreme precipitation in the world’s dry and wet regions. Nat. Clim. Chang. 2016, 6, 508–513. [Google Scholar] [CrossRef]
- O’Gorman, P.A. Contrasting responses of mean and extreme snowfall to climate change. Nature 2014, 515, 416–418. [Google Scholar] [CrossRef] [PubMed] [Green Version]
- Strasser, U. Snow loads in a changing climate: New risks? Nat. Hazards Earth Syst. Sci. 2008, 8, 1–8. [Google Scholar] [CrossRef] [Green Version]
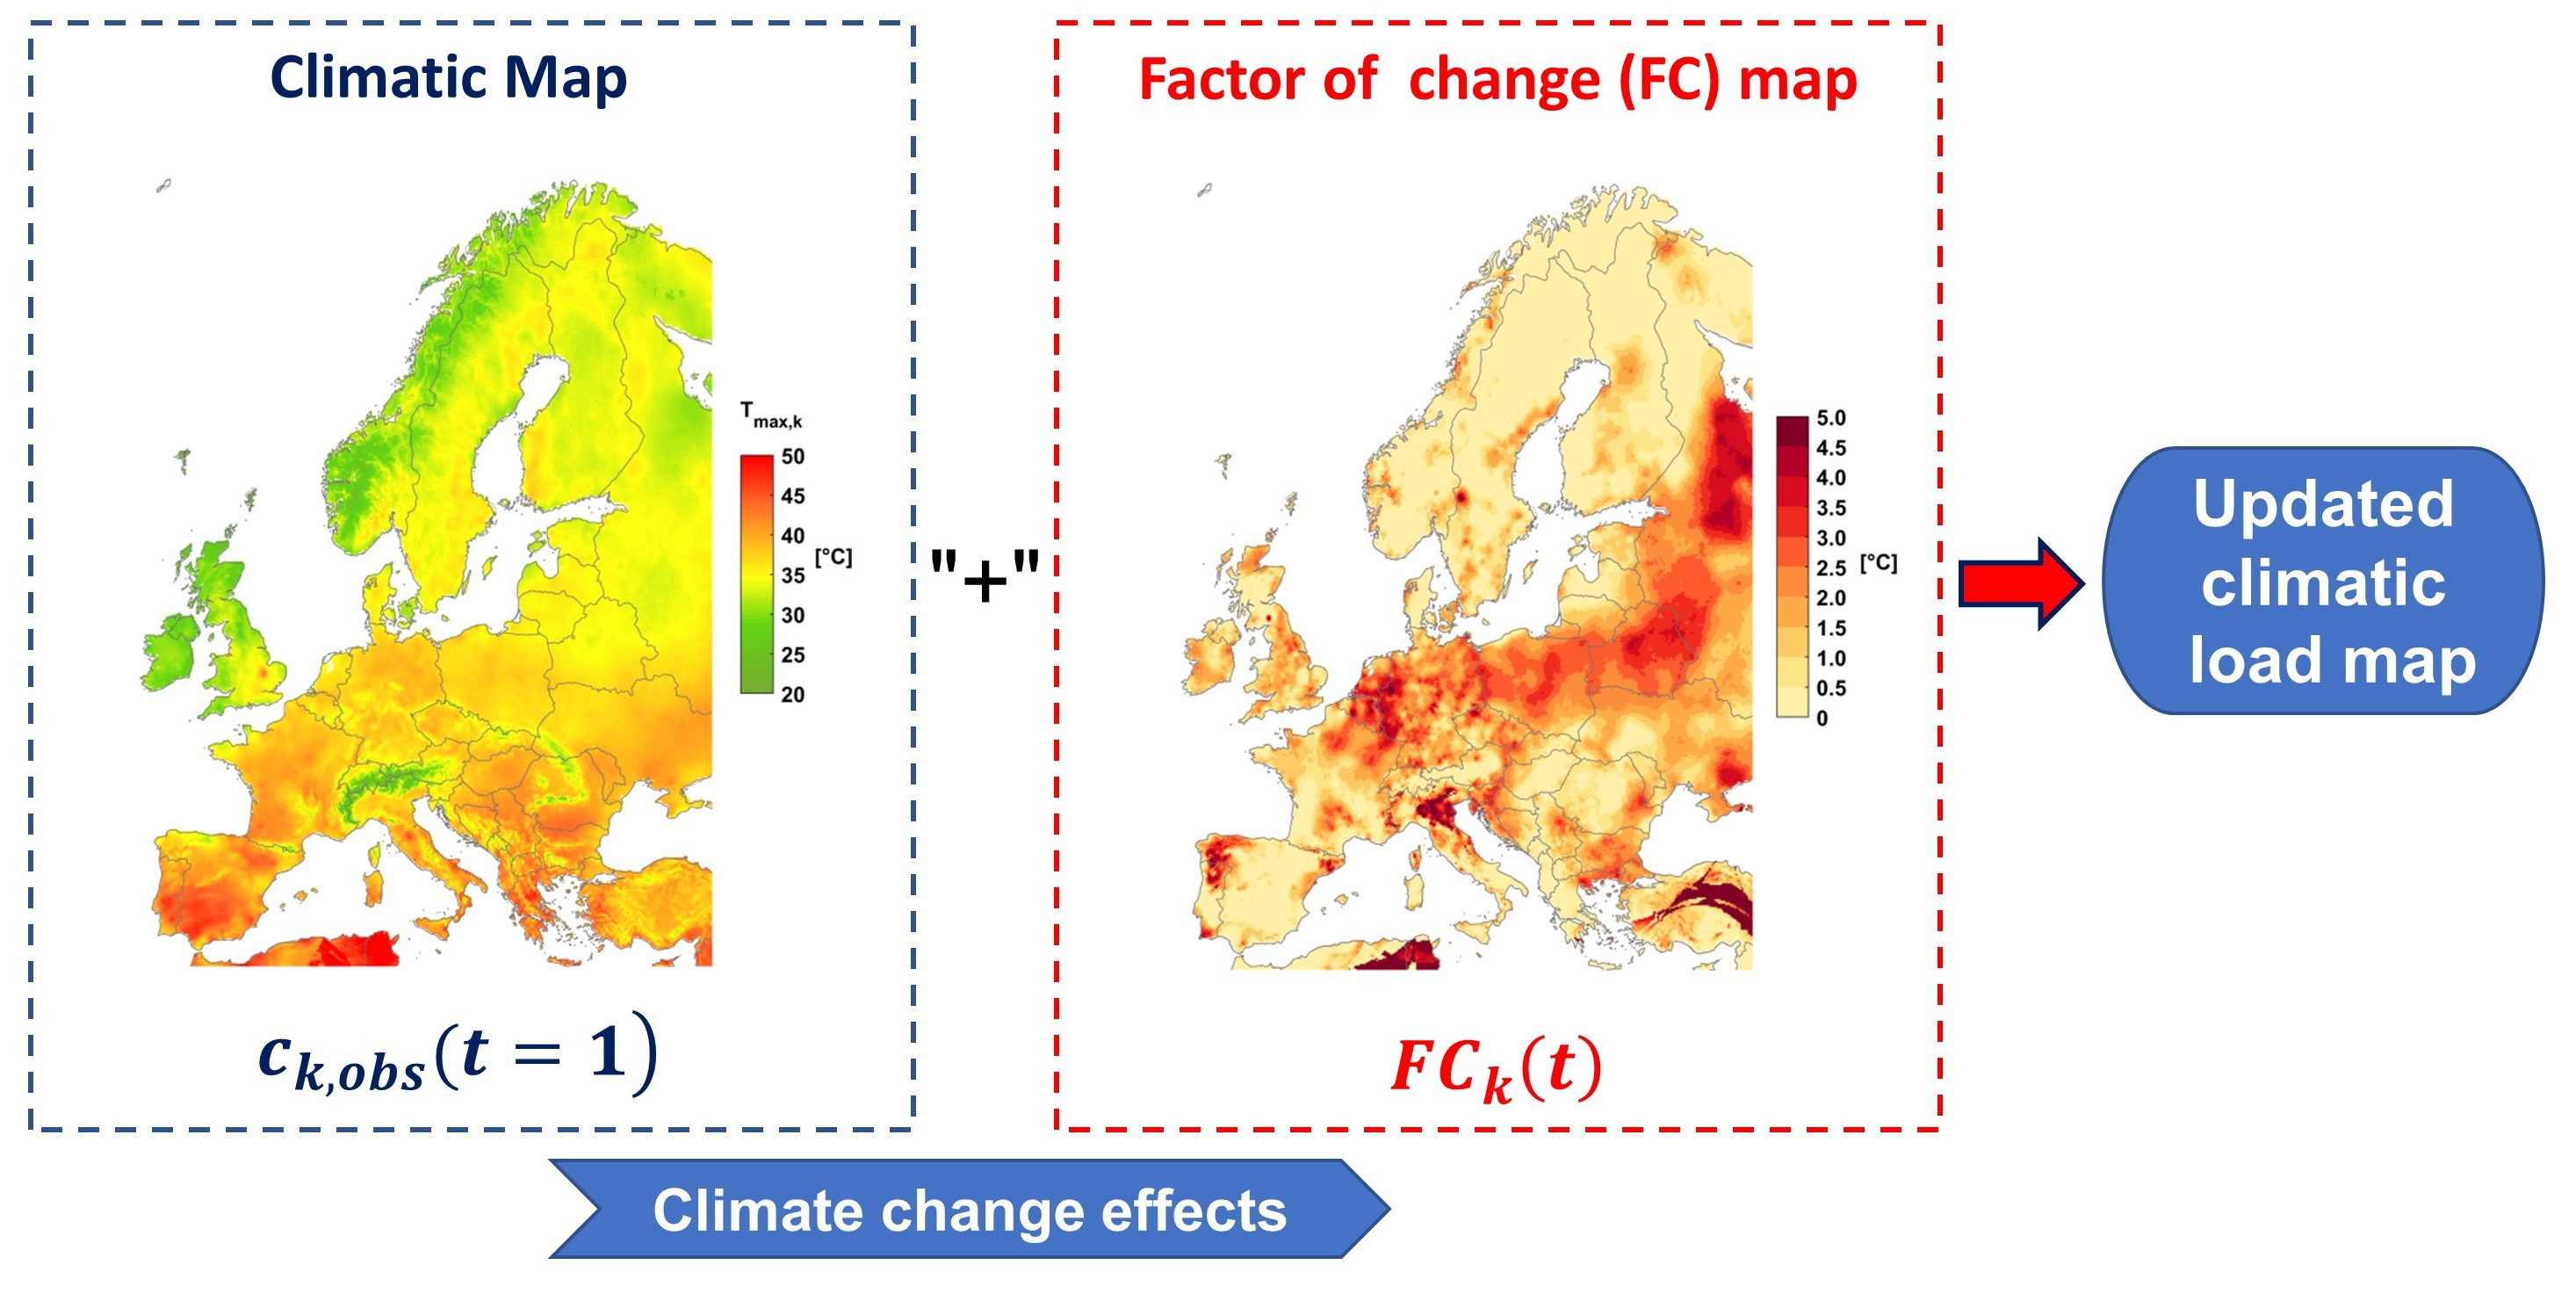
Figure 1.
European ground snow load map, resulting from the current set of available National Annexes to EN1991-1-3 “Actions on structures: Snow loads”.
Figure 1.
European ground snow load map, resulting from the current set of available National Annexes to EN1991-1-3 “Actions on structures: Snow loads”.

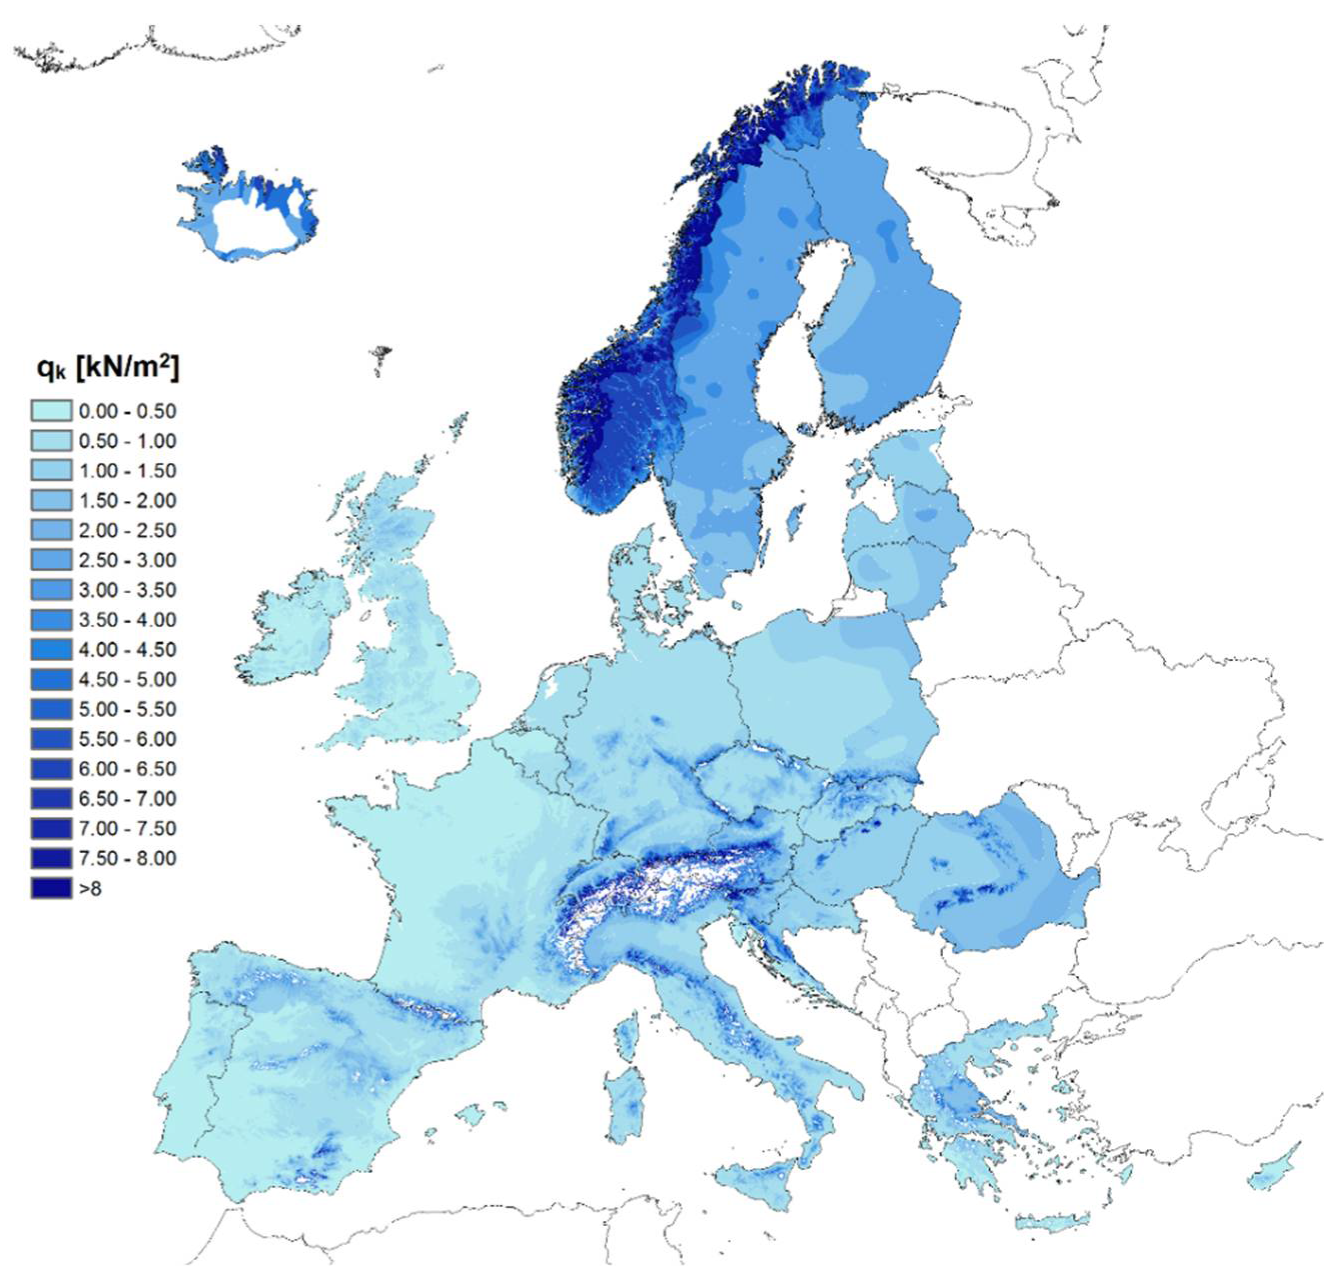
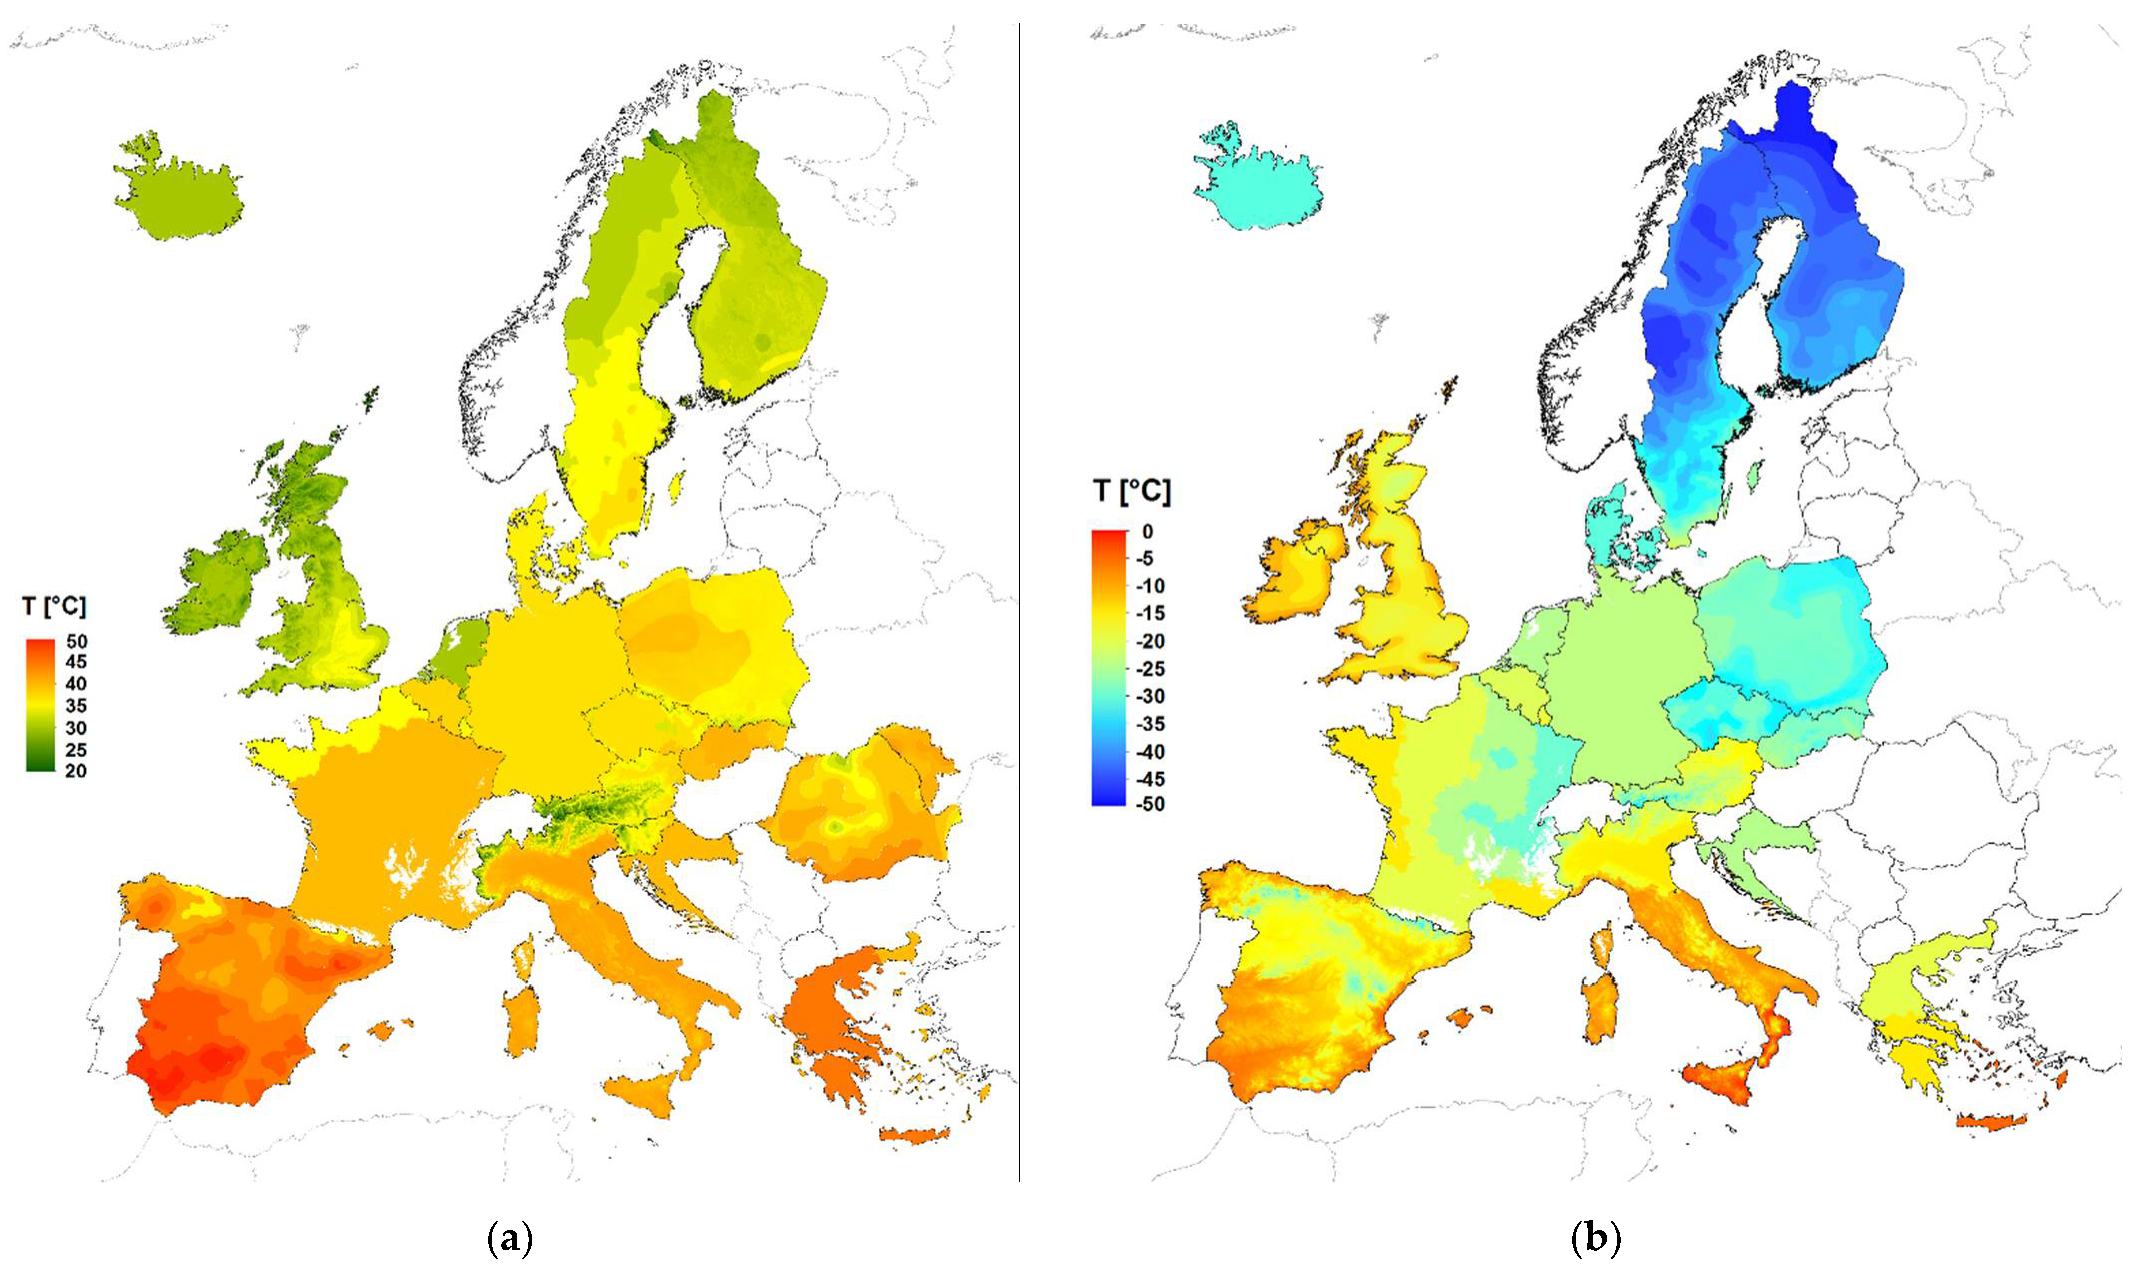
Figure 2.
Maximum (a) and minimum (b) air shade temperature maps, and with an annual probability of exceeded of 0.02, based on available National Annexes to EN1991-1-5 “Actions on structures: Thermal actions”.
Figure 2.
Maximum (a) and minimum (b) air shade temperature maps, and with an annual probability of exceeded of 0.02, based on available National Annexes to EN1991-1-5 “Actions on structures: Thermal actions”.

Figure 3.
Climatic regions defined in Annex C of EN1991-1-3, based on the results of the European Snow Load Research Project (ESLRP).
Figure 3.
Climatic regions defined in Annex C of EN1991-1-3, based on the results of the European Snow Load Research Project (ESLRP).

Figure 4.
Ground snow loads maps, based on EN1991-1-3-Annex C (a), UERRA dataset (b), differences UERRA-EN1991-1-3—Annex C (c).
Figure 4.
Ground snow loads maps, based on EN1991-1-3-Annex C (a), UERRA dataset (b), differences UERRA-EN1991-1-3—Annex C (c).

Figure 5.
Map of characteristic values of wind velocity derived from the UERRA dataset for the period 1981–2020.
Figure 5.
Map of characteristic values of wind velocity derived from the UERRA dataset for the period 1981–2020.

Figure 6.
Maps of characteristic values of daily temperatures and , based on the E-OBS dataset in moving time windows (1950–1989, 1960–1999, 1970–2009 and 1980–2019).
Figure 6.
Maps of characteristic values of daily temperatures and , based on the E-OBS dataset in moving time windows (1950–1989, 1960–1999, 1970–2009 and 1980–2019).

Figure 7.
Delta change maps of characteristic values of daily temperatures and , based on the E-OBS dataset.
Figure 7.
Delta change maps of characteristic values of daily temperatures and , based on the E-OBS dataset.

Figure 8.
E-OBS orography and point locations of the 71 German and Swiss test weather stations.

Figure 9.
Factors of change for characteristic values of daily (a) and (b), root-mean-square error (RMSE) values for annual maxima of daily and annual minima of daily (c) and normalized root-mean-square error (NRMSE) values between characteristic values obtained by the gridded data and recorded values at the test stations (d).

Figure 10.
Maps of characteristic values (annual probability of exceedance ) of the daily precipitation, based on the E-OBS dataset in moving time windows (1950–1989, 1960–1999, 1970–2009, and 1980–2019).
Figure 10.
Maps of characteristic values (annual probability of exceedance ) of the daily precipitation, based on the E-OBS dataset in moving time windows (1950–1989, 1960–1999, 1970–2009, and 1980–2019).

Figure 11.
Factors of change maps of daily precipitation characterized by an annual probability of exceedance , based on the E-OBS dataset.
Figure 11.
Factors of change maps of daily precipitation characterized by an annual probability of exceedance , based on the E-OBS dataset.

Figure 12.
Factors of change for daily precipitation characterized by an annual probability of exceedance (a), root-mean-square error (RMSE) values for annual maxima of daily precipitation (b) and normalized root-mean-square errors (NRMSE) between precipitation values characterized by an annual probability of exceedance , obtained by the E-OBS data, and recorded ones at test stations (c).

Figure 13.
Maps of characteristic values of ground snow loads in Europe (first row) with a focus on northcentral part of Italy (second row) based on UERRA dataset in moving time windows (1961–2000, 1971–2010 and 1981–2020).
Figure 13.
Maps of characteristic values of ground snow loads in Europe (first row) with a focus on northcentral part of Italy (second row) based on UERRA dataset in moving time windows (1961–2000, 1971–2010 and 1981–2020).

Figure 14.
Factors of change maps of characteristic ground snow loads with respect to the 1961–2000 time window based on the UERRA dataset.
Figure 14.
Factors of change maps of characteristic ground snow loads with respect to the 1961–2000 time window based on the UERRA dataset.

Figure 15.
Point locations of the 51 test stations (a), factors of change for characteristic ground snow load (b), root-mean-square error (RMSE) values for annual maxima ground snow loads (c) and normalized root-mean-square error (NRMSE) values between characteristic ground snow loads obtained by the gridded re-analyzed data and recorded values at those stations (d).

Figure 16.
Factors of change for mean (a) and (b) of annual maxima ground snow load, comparison between observations and regional reanalysis at the test stations.
Figure 16.
Factors of change for mean (a) and (b) of annual maxima ground snow load, comparison between observations and regional reanalysis at the test stations.


Table 1.
Root mean square error (RMSE) and mean absolute error (MAE) statistics derived comparing Uncertainties in Ensembles of Regional Re-Analyses (UERRA) and EN1991-1-3 ground snow load maps.
Table 1.
Root mean square error (RMSE) and mean absolute error (MAE) statistics derived comparing Uncertainties in Ensembles of Regional Re-Analyses (UERRA) and EN1991-1-3 ground snow load maps.
| Climatic Region | RMSE [kN/m2] | MAE [kN/m2] |
|---|---|---|
| Alps | 1.80 | 1.24 |
| Mediterranean | 1.03 | 0.70 |
| East | 0.33 | 0.23 |
| West | 0.19 | 0.13 |
| Iberian Peninsula | 0.54 | 0.33 |
| UK—Eire | 0.23 | 0.18 |
Publisher’s Note: MDPI stays neutral with regard to jurisdictional claims in published maps and institutional affiliations. |
© 2021 by the authors. Licensee MDPI, Basel, Switzerland. This article is an open access article distributed under the terms and conditions of the Creative Commons Attribution (CC BY) license (https://creativecommons.org/licenses/by/4.0/).
Share and Cite
MDPI and ACS Style
Croce, P.; Formichi, P.; Landi, F. Evaluation of Current Trends of Climatic Actions in Europe Based on Observations and Regional Reanalysis. Remote Sens. 2021, 13, 2025. https://0-doi-org.brum.beds.ac.uk/10.3390/rs13112025
AMA Style
Croce P, Formichi P, Landi F. Evaluation of Current Trends of Climatic Actions in Europe Based on Observations and Regional Reanalysis. Remote Sensing. 2021; 13(11):2025. https://0-doi-org.brum.beds.ac.uk/10.3390/rs13112025
Chicago/Turabian StyleCroce, Pietro, Paolo Formichi, and Filippo Landi. 2021. "Evaluation of Current Trends of Climatic Actions in Europe Based on Observations and Regional Reanalysis" Remote Sensing 13, no. 11: 2025. https://0-doi-org.brum.beds.ac.uk/10.3390/rs13112025
Note that from the first issue of 2016, this journal uses article numbers instead of page numbers. See further details here.