Article

Evaluating the Performance of Lightning Data Assimilation from BLNET Observations in a 4DVAR-Based Weather Nowcasting Model for a High-Impact Weather over Beijing

1
Beijing Research Center for Urban Meteorological Engineering and Technology, Beijing 100089, China
2
Institute of Urban Meteorology, China Meteorological Administration, Beijing 100089, China
3
Key Laboratory of Middle Atmosphere and Global Environment Observation, Institute of Atmospheric Physics, Chinese Academy of Sciences, Beijing 100029, China
4
College of Earth and Planetary Science, University of Chinese Academy of Sciences, Beijing 100049, China
5
College of Geographical Sciences, Fujian Normal University, Fuzhou 350007, China
6
Key Laboratory of Humid Subtropical Eco-Geographical Process (Ministry of Education), College of Geographical Sciences, Fujian Normal University, Fuzhou 350007, China
7
School of Atmospheric Sciences, Sun Yat-sen University, Zhuhai 519082, China
8
Training Center, China Meteorological Administration, Beijing 100089, China
*
Author to whom correspondence should be addressed.
Remote Sens. 2021, 13(11), 2084; https://0-doi-org.brum.beds.ac.uk/10.3390/rs13112084
Submission received: 26 April 2021 / Revised: 13 May 2021 / Accepted: 18 May 2021 / Published: 26 May 2021

Abstract

:
The Beijing Broadband Lightning Network (BLNET) was successfully set up in North China and had yielded a considerable detection capability of total lightning (intracloud and cloud to ground) over the regions with complex underlying (plains, mountains, and oceans). This study set up a basic framework for the operational application of assimilating total lightning activities from BLNET and assesses the potential benefits in cloud-scale, very short-term forecast (nowcasting) by modulating the vertical velocity using the 4DVar technique. Nowcast statistics aggregated over 11 cycles show that the nowcasting performances with the assimilation of BLNET lightning datasets outperform RAD and the assimilation of GLD360 (Global Lightning) datasets. The assimilation of BLNET data improves the model’s dynamical states in the analysis by enhancing the convergence and updraft in and near the convective system. To better implement of assimilating real-time lightning data, this study also conducts sensitivity experiments to investigate the impact of the horizontal length scale of a distance-weighted interpolation, binning time intervals, and different vertical profile or distance weights prior to the DA. The results indicate that the best forecast performance for assimilating BLNET lightning datasets is obtained in a 4DVar cycle when the lightning accumulation interval is 3 min, the radius of horizontal interpolation is 5 × 5, and the statistically vertical velocity profile and the distance weights obtained from cumulus cloud.

1. Introduction

Accurate forecasting of high-impact weather, such as flooding, lightning, and hail, at the convective scale is always regarded as a major scientific challenge for most weather forecasting services and communities worldwide, even for very short-term forecasts (nowcasting, <6 h), due to the small tolerances of timing and location. Since Lilly [1] first proposed the challenges of how to explicitly nowcast the precipitation on a city scale, various observational datasets (e.g., automated surface observing stations, wind profiler, rawinsonde, and satellites) are selected to improve the prediction of NWPs and some great results have been obtained. Among them, because radar could represent well the complex structure of convective systems, radial velocity and reflectivity from radar observations are widely assimilated into NWPs and have achieved a great improvement of short-term forecasting shown by the previous reviews [2,3]. However, recent radar data assimilation (RDA) methods could still not produce the adequate vertical velocity strength in the initial field, so a 1–2 h dynamic spin-up period still exists even with rapidly updated RAD assimilation [4], and thus the forecasting performance is greatly deteriorated [3].
To offset the drawbacks of RDA, many other observational data (e.g., lightning data) have been assimilated into NWP together with radar observations. The reason for selecting lightning data assimilation (LDA) is because of a strong correlation between the graupel and updraft volumes [5], thus, assimilating the total lightning activities may enhance the updraft to alleviate model spin-up. In addition, lightning data could detect convections over observation-poor coverage areas, such as complex terrain (e.g., mountains or high buildings) with radar beam blockage or remote oceanic regions outside of the radar network’s coverage.
Based on the widely accepted noninductive electrification mechanism, lightning activities are inherently tied to the joint effect of small-scale dynamic and microphysical processes in thunderclouds (e.g., strong updrafts, graupel, and ice crystals), which establish the physical foundation for LDA. Most LDAs update the analysis field by the empirical linkages between the lightning flash and state variables, such as the water vapor mass mixing ratio [6], hydrometer mass [7,8], radar reflectivity [9], latent heating [10], and temperature [11]. Other studies use lightning data as a trigger function of convective parameterized schemes [12]. Similar to the aforementioned RDA methods by means of cloud analysis schemes, most of these LDAs generate vertical updraft to indirectly reduce spin-up time by adjusting the thermodynamic fields. Few researchers paid their attention to adjusting kinematic motion for LDA [13], let alone modulating vertical velocity based on the 4DVAR technique.
Xiao [14] (X21) proposed a new indirect LDA method using 4DVAR technique to assimilate total lightning observations in a convective-scale model (Variational Doppler Radar Analysis System, VDRAS). In their LDA scheme, the pseudo-3D-vertical velocities converted from the total lightning rate were assimilated to adjust the vertical motion for cloud resolution. By examining the forecasting performance of a localized convective system, they found that the simultaneous assimilation of lightning and RAD can not only improve very short-term precipitation forecasts but, in the first 1–2 h, more accurately simulate the detailed propagation and re-initiation of convective systems than radar-alone or lightning-alone experiments. Despite the fact that significant improvements have been attained, there are also some shortcomings: the assimilated lightning data in their study originate from the Vaisala Global Lightning Dataset (GLD360) created by the Vaisala detection network over the world (Said et al., 2013), and most of the total lightning activities captured are mainly cloud-to-ground (CG) lightning flashes. As it has been widely accepted [15], the intracloud (IC) lightning flashes make up more than 60% of total lightning activities; thus, the only assimilation of CG flashes may have little impact on the updraft motion in the analysis field and reduce DA performance.
With the implementation of “STORM973 (Dynamic-microphysical-electrical processes in severe thunderstorms and lightning hazards [15])”, the Institute of Atmospheric Physics of the Chinese Academy of Science has set up the Broadband Lightning Network (BLNET) with the capability of real-time locating CG and IC lightning in 3 dimensions [15]. As a regional lightning detection system, the detection efficiency (DE) of BLNET over the Beijing area is approximately 93.2% [16] and would provide high DE lightning data to examine and improve the LDA scheme in X21 with more cases.
Moreover, even using the current X21 to assimilate BLNET lightning data, some questions also are produced: (1) Do total lightning data from BLNET provide a value-added benefit to severe weather very short-term forecasts (Nowcasting)? (2) Do these “optimal” DA empirical settings from X21, need to be revisited or retuned? (3) How should BLNET lightning data be pre-processed?
Therefore, in this paper, we set up the LDA scheme for BLNET total lightning activity observations based on the concept of X21 by conducting DA experiments with an mesoscale convective system (MCS) case in North China (Figure 1) during the observation period of the STORM973 Project, and, thus, we intended to move one step closer to the future operational applications of LDA with the BLNE lightning data.

2. Model and Data

2.1. Description of RMAPS-NOW

In this study, we use Rapid-refresh Multi-scale Analysis and Prediction System-Nowcast (RMAPS-NOW) to evaluate the performance of the LDA scheme. It is based on the VDRAS, which was first developed by Sun and Crook [17], and then it was introduced to implemented in the Institute of Urban Meteorology, China, since the Beijing 2008 Olympic Games for operational nowcasting [18] and was developed to now. By assimilating multiple radars and surface observations [17] in the 4DVAR-based DA framework and using a cloud model as a constraint, RMAPS-NOW provides high-resolution analyses and short-term forecasts at a minute-timescale update rate every 10–18 min. A Kessler warm rain process [18] and a simple ice scheme [19] are used in RMAPS-NOW to stand for microphysics progress.
RMAPS -NOW is designed to run with continuous cycles: during a cold start, the forecast data from the WRF model (https://www.mmm.ucar.edu/weather-research-and-forecasting-model, accessed on 21 April 2021), developed by the National Center for Atmospheric Research (NCAR), are used with the combination of surface observations and the radar velocity azimuth display (VAD) profiles as the boundary conditions and a first guess, and in subsequent cycles, the background is taken from the short-term forecast or analysis of the previous cycle.

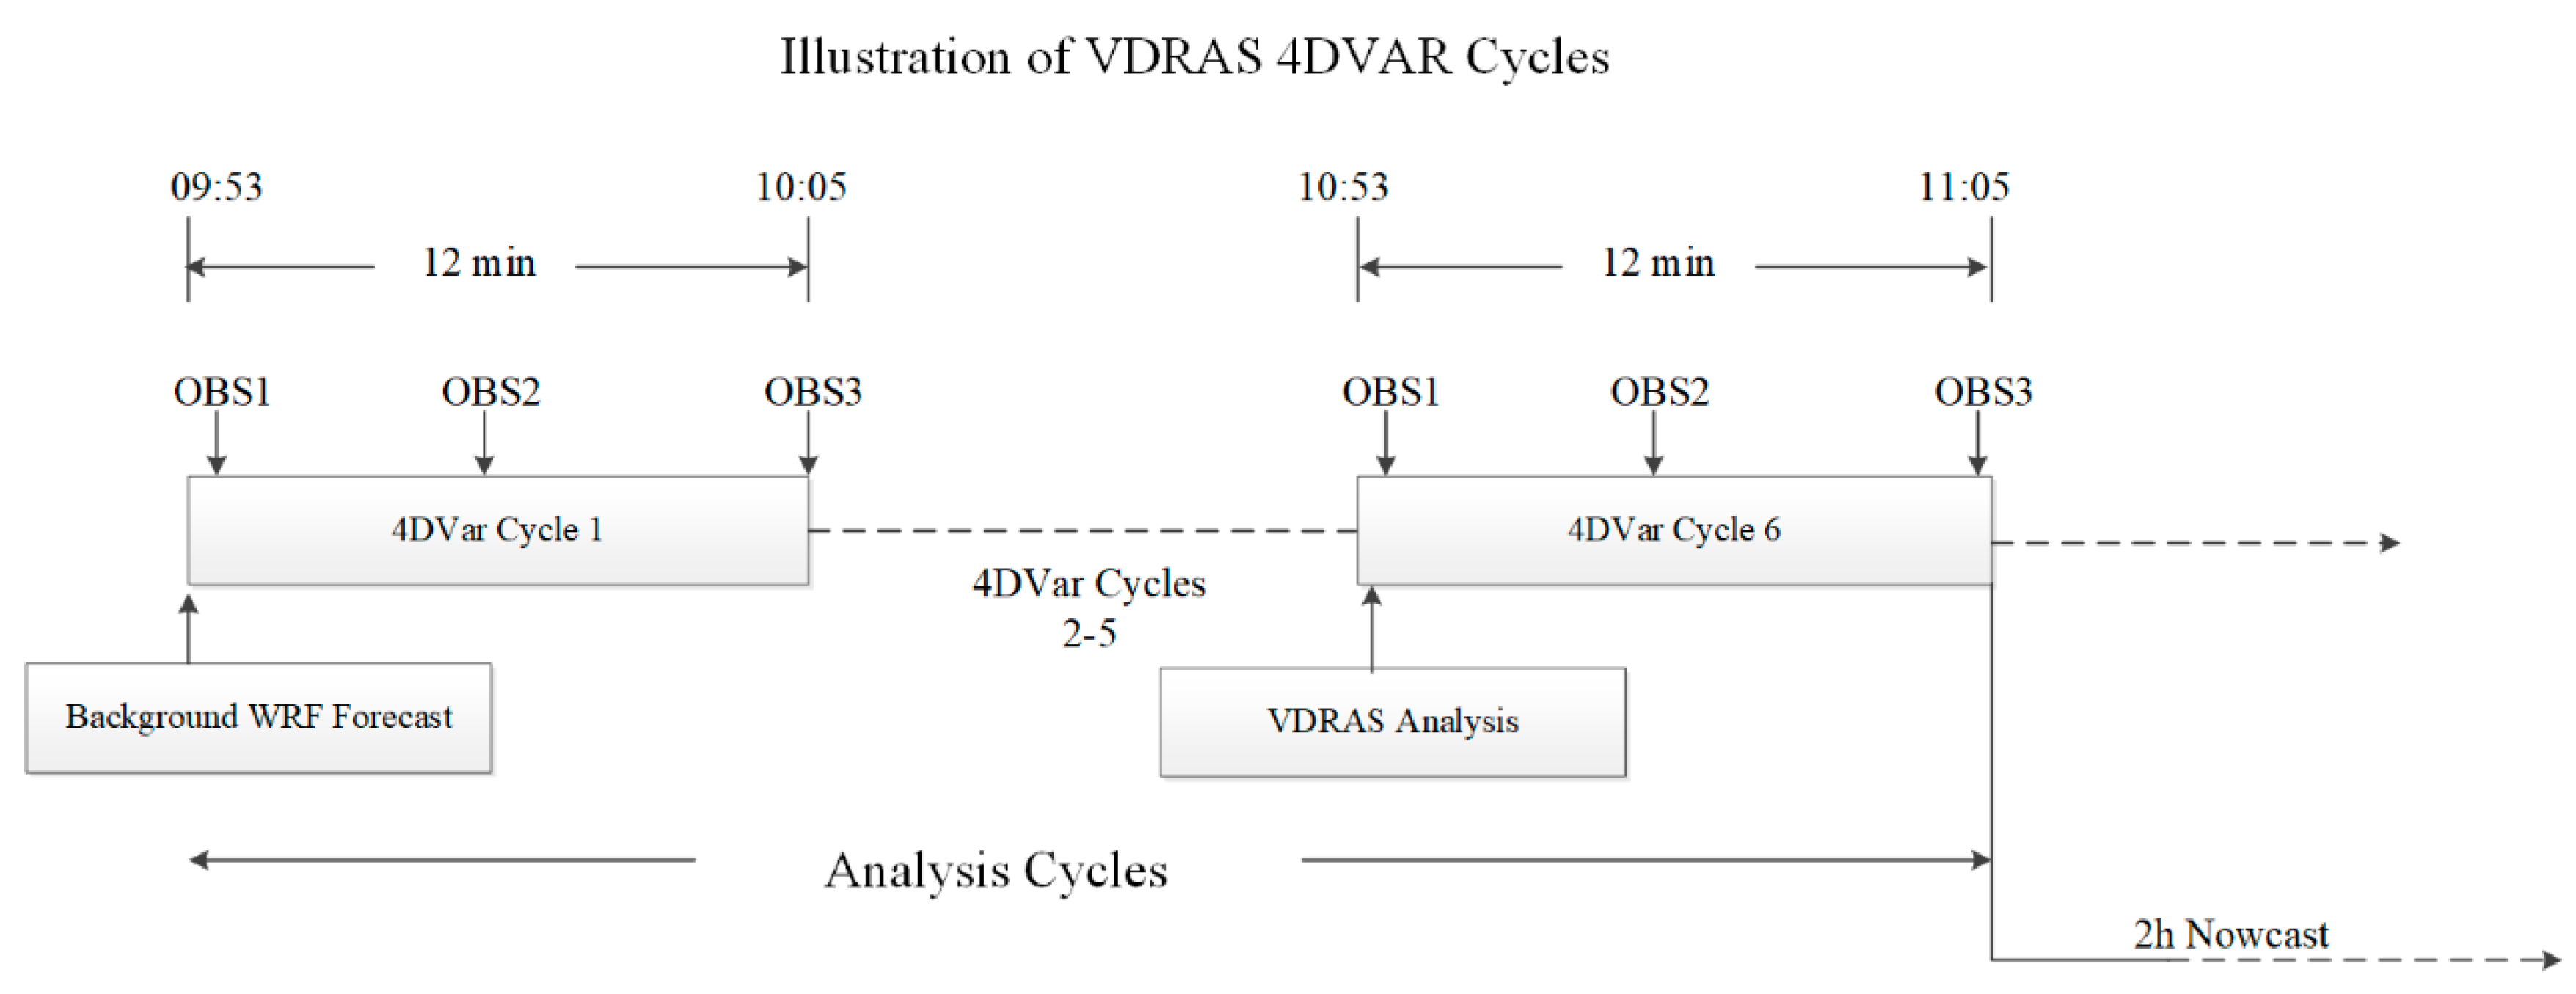
2.2. Data Assimilation Method

The concept of the 4DVar technique in RMAPS-NOW to only or both assimilate Doppler radars and lightning data was described in detail in previous studies [18,19]. So here, we will provide a concise summary for the study. RMAPS-NOW is designed to directly assimilate radar radial velocity and indirectly assimilate reflectivity and lightning data based on the empirical relationship between reflectivity and rain/snow water mixing or lightning flash rates and vertical velocity at the flash location, respectively.
The objective of the 4DVar framework in RMAPS-NOW is to seek an optimal analysis field that, upon model integration during the assimilation window(s), can minimize discrepancies between observation from different sources and model forecasts. The cost function J often is used to stand for the differences, which can be written as
J = J b + J C + J P + J V r R a d a r + J Q r R a d a r + J w l i g h t n i n g
where Jb is the background term measuring the differences between the initial state and the short-term forecast of RMAPSS-NOW, Jc represents the mesoscale background penalty term to keep the 4DVar analysis not away from a meso-scale background field and fill in the no-observation-data regions, and Jp, the temporal and spatial smoothness term, is used to force the minimized results to smoothly fit the observations. The next two terms with the “radar” superscript are the radar radial velocity observation terms and radar rain/snow water (converted from reflectivity) observations terms. The last term is the lightning-pseudo-vertical-velocity term for assimilating total lightning data, which will be presented in detail in 2.3. The control variable in VDRAS, including the following state variable: x-, y- and z- component winds (u, v and w, respectively), liquid water potential temperature, pressure, rainwater/snow mixing ratio (qr,s), and total water mixing ratio (qt) (the reader could find more description of the cloud model and 4DVar procedure used in RMAPSNOW i [17,19].

2.3. The Lightning DA Method

An empirical equation from Barthe et al. [19] is adopted as follows:
f = 1.3 × 10 2 w m a x 2.2
where f is the total lightning flash rate per minute, and wmax is the column maximum vertical velocity at the location of the detected strikes. Since only wmax adjusting could change little in the analysis field, we use a scheme to enlarge wmax into the updraft vertical profile for more information. Based on the concept provided by Yuter and Houze [20], the vertical profile of vertical velocity in the convective cloud column typically is the largest in the specific level and decreases to the low levels and top of the storm. Based on this concept, we calculate the climatological vertical velocity profile (blue lines in Figure 2a) by averaging and normalizing the vertical velocities at grid points with the composite reflectivity threshold criterion (>18 dBZ) for cumulus clouds using yearly RMAPS-NOW reanalysis data. Finally, the pseudo-vertical velocity at the lightning observation grid is acquired by the climatological vertical velocity profile multiplying with the maximum velocity. The pseudo-vertical velocity is added into the cost function to adjust vertical motion based on the 4DVAR framework.

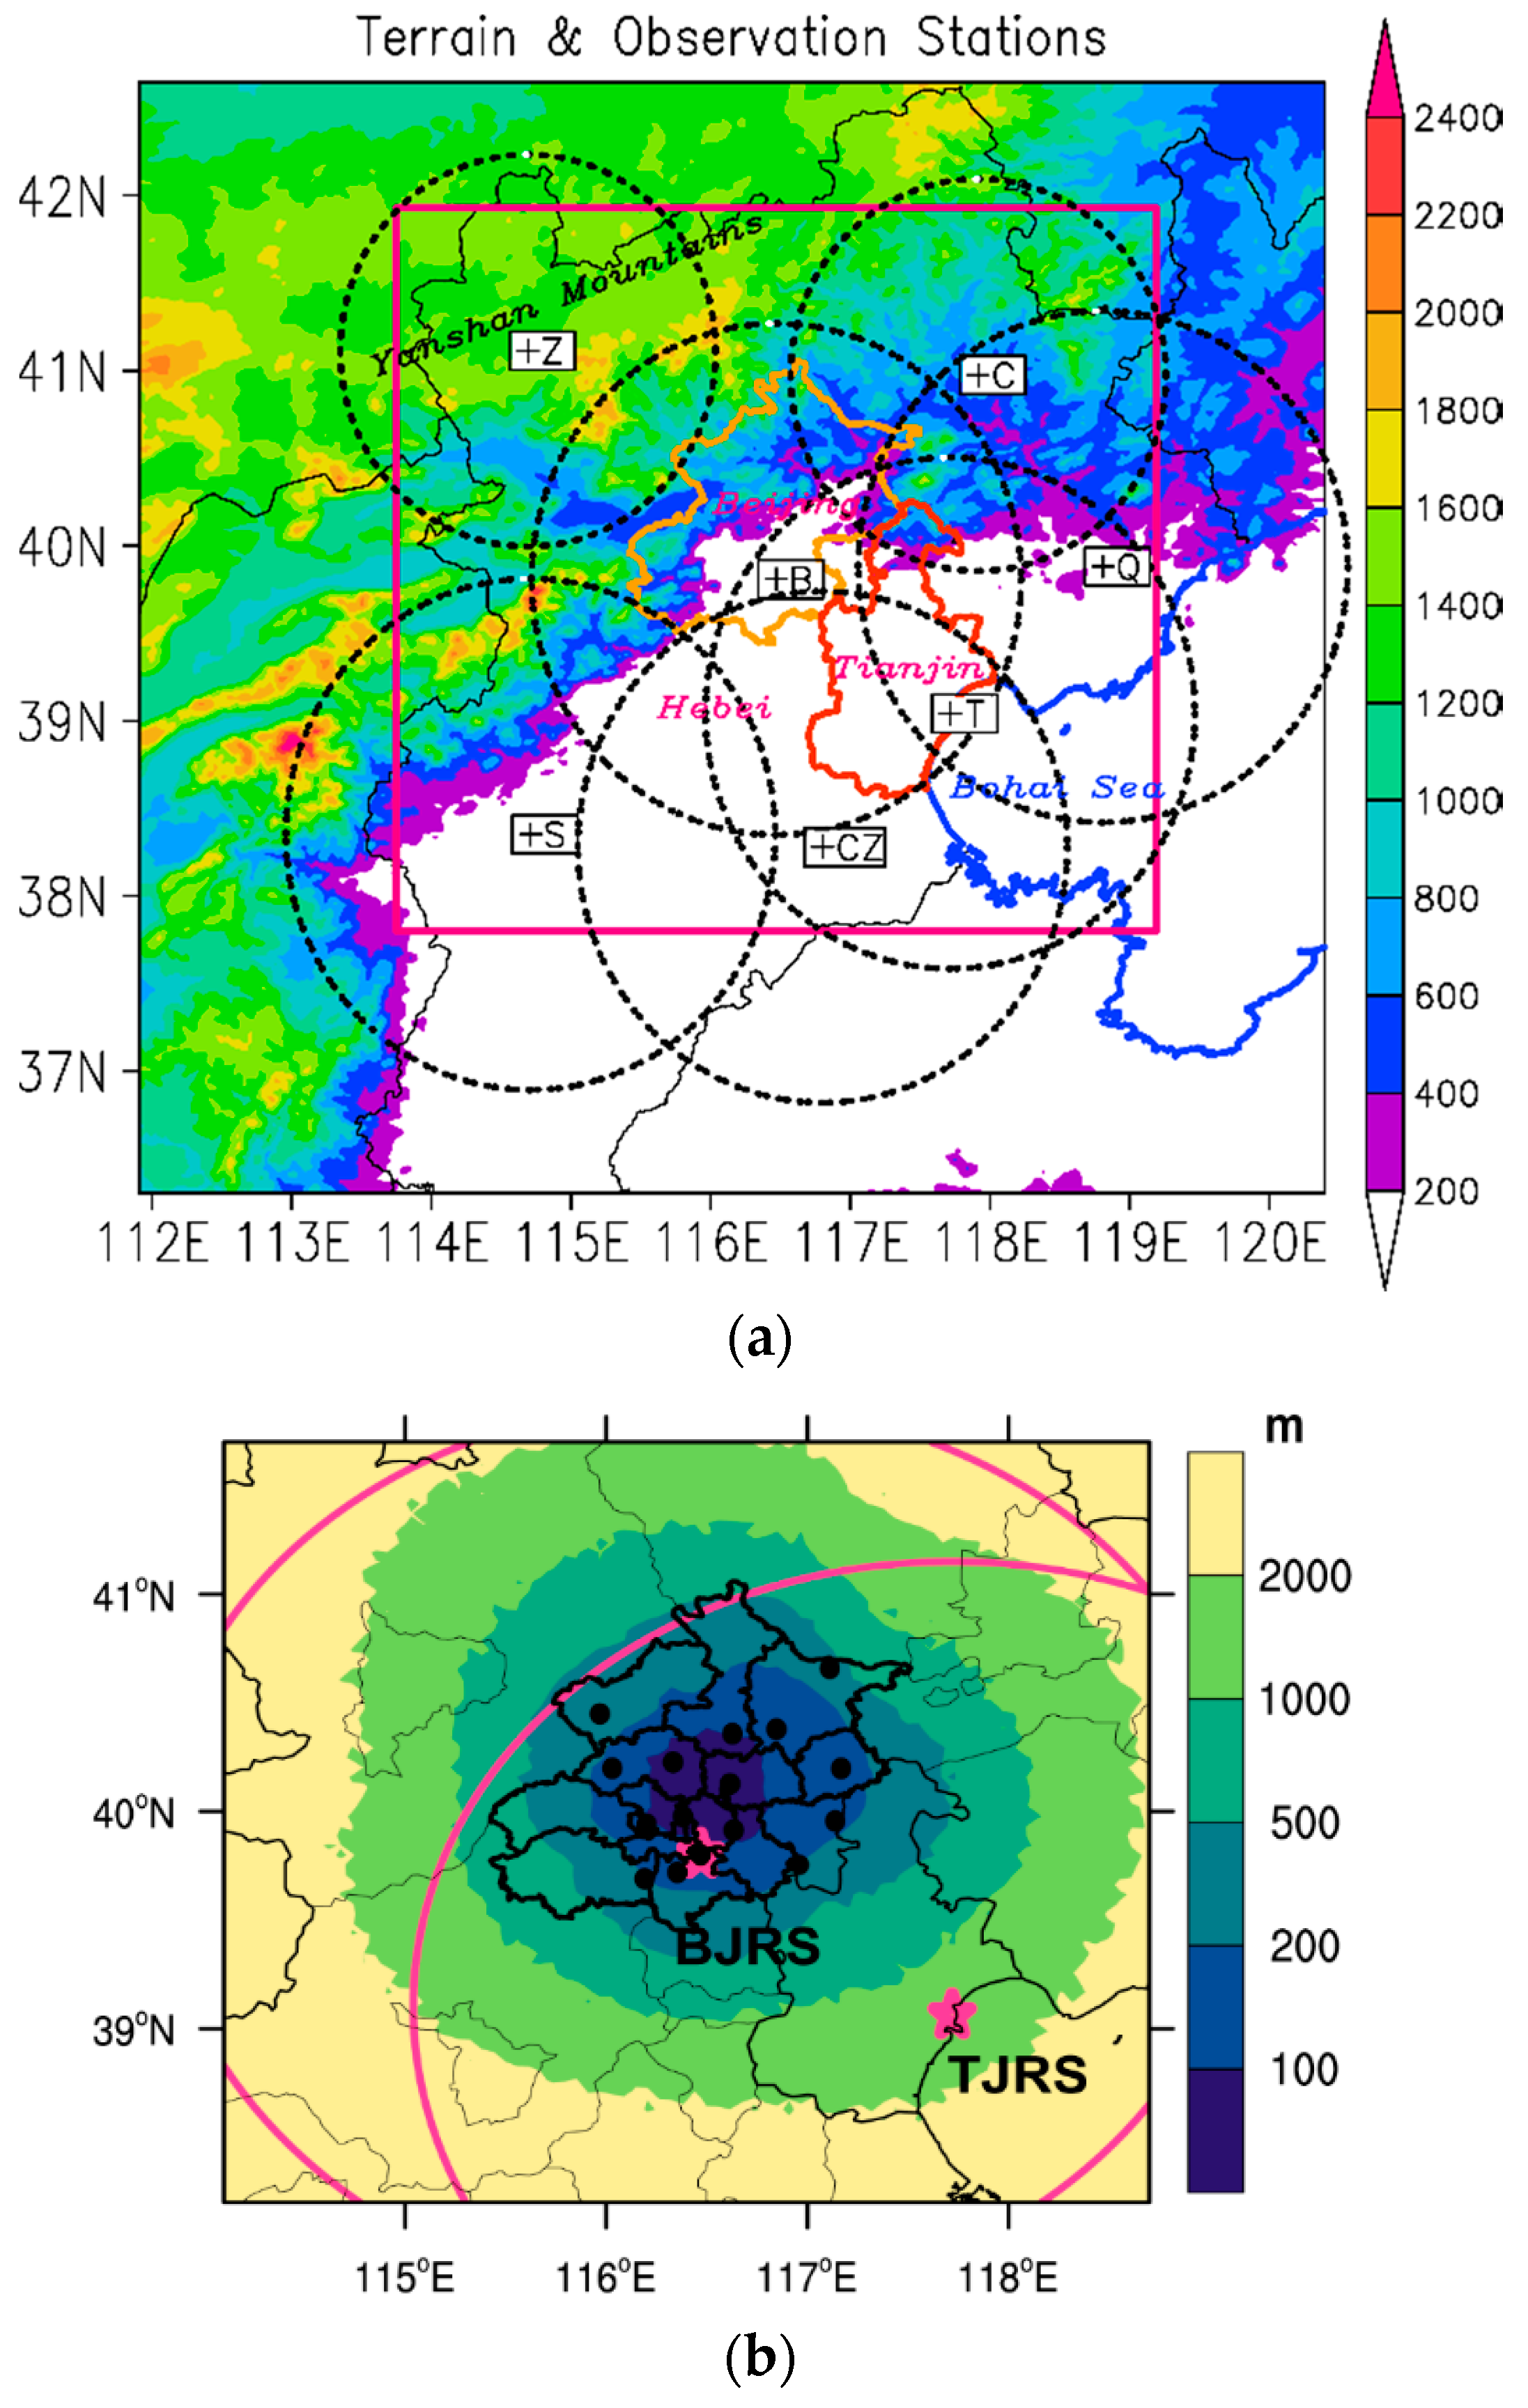
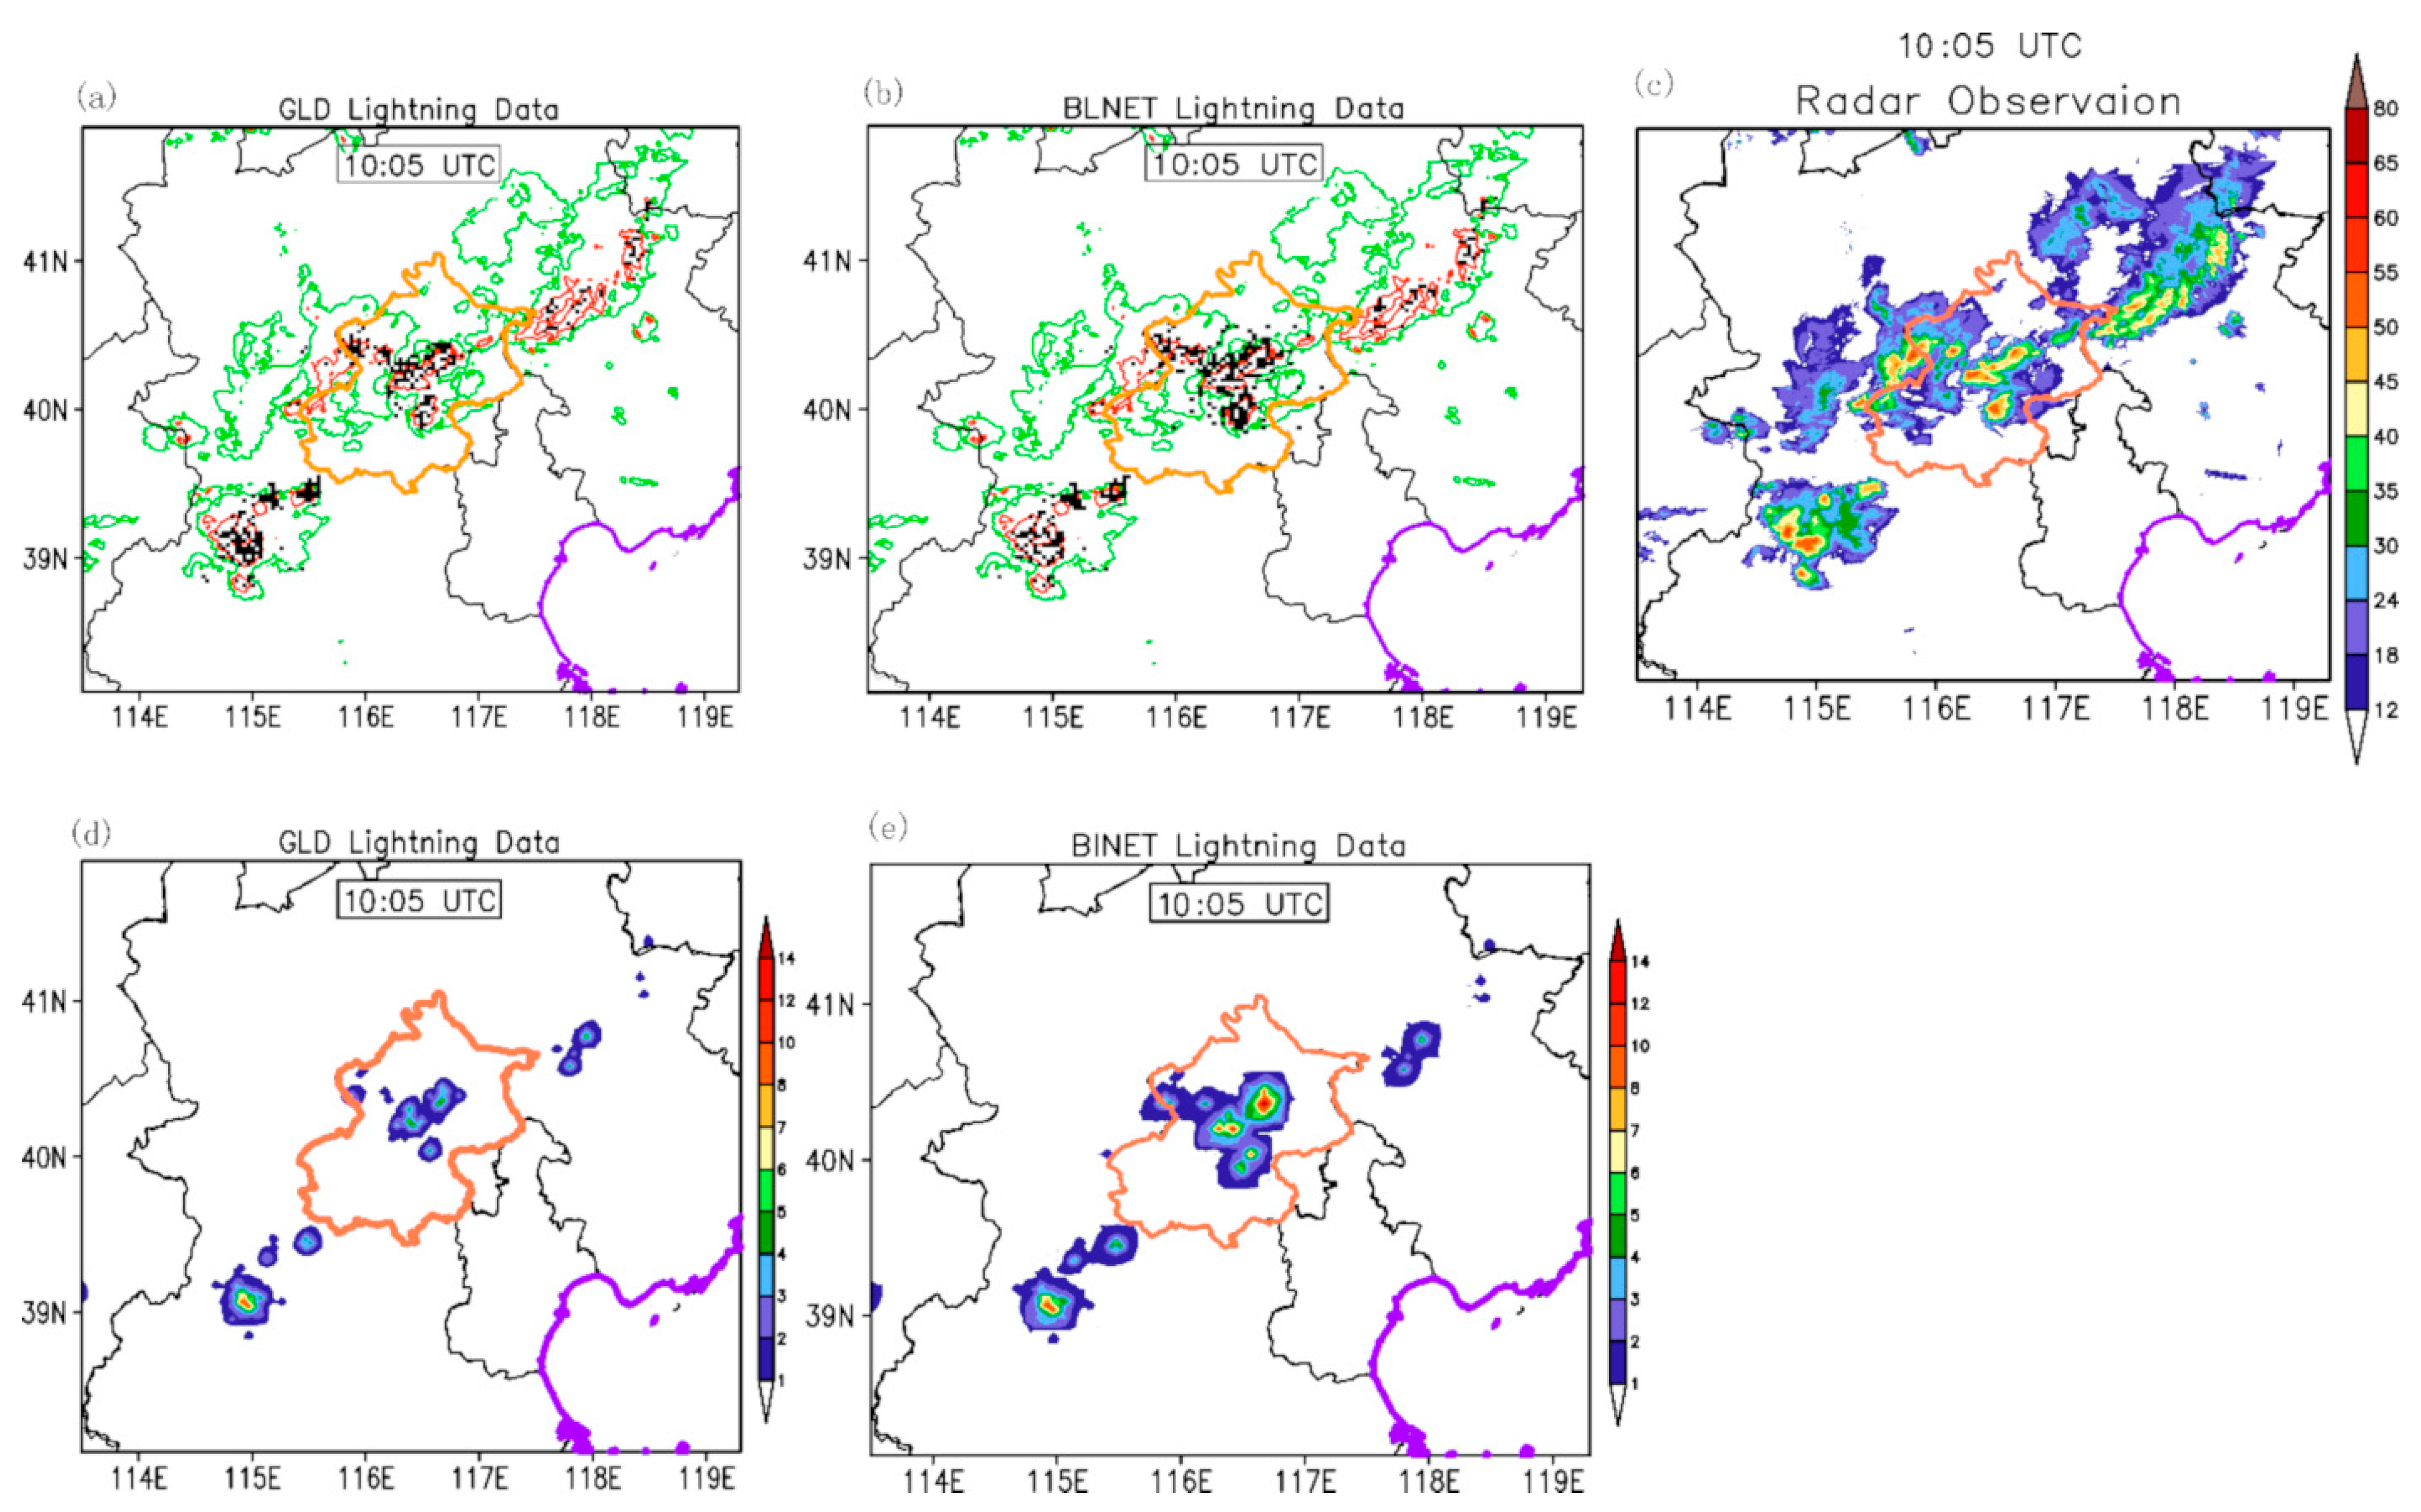
2.4. Descriptions of the Data Used for DA Experiments

Data from both radar (including radial velocity and reflectivity) and lightning observations are used in this study. The radar data are from China’s new generation weather radar network near Beijing, including seven China new generation radars (five S-band radars and two C-band radars) in the experimental domain (see them in Figure 1), which are synchronized and work operationally with the same scan mode to produce observations at nine elevation angles within no more than 6 min.
The lightning data used in this study are from BLNET. The BLNET is a regional lightning 3D location network including 16 stations, covering most of the Beijing-Tianjin-Hebei area (refer to Figure 1b). Every station is equipped with a magnetic antenna, a very high-frequency (VHF) antenna, and a fast/slow antenna to detect electromagnetic signals radiated from flashes from VLF to VHF. At each station, the waveform features of lightning pulses are analyzed, and then, information on the lightning type and captured time of each pulse at each station are transferred to the central station for 3D lightning mapping (Yuan et al., 2020; Lu et al., 2021). BLNET can locate total lightning activities (including IC and CG flashes) with the joint application of the algorithm of Chan and Ho and the Levenberg–Marquardt algorithm [21]. Srivastava et al. [16] evaluated the overall performance of total lightning DE and location accuracy (LA) of BLNET during the summers of 2015 and 2016 and showed that the average DE was >93% for total lightning flashes. Moreover, with reference to tower-initiated flashes, the horizontal location error of BLNET is 50~250 m.
A global lightning observation network (GLD360) is also used for comparison and baseline. The GLD360 sensors are designed to measure the VLF band signals of lightning (between ~500 Hz to 50 kHz). Many previous studies examined the DE of GLD360 in comparison with National Lightning Detection Network data, European Cooperation for Lightning Detection network data, or rocket- and wire-trigger lightning data [22]. The results showed that GLD360 mainly detects CG flashes (>77% CG, <28% IC, and ~40% total flash DE), and its positioning accuracy is ~2–3 km.
The GLD360 dataset provides lightning locations with the format of latitude and longitude records. However, the BLNET detects and locate electromagnetic radiation from CG and IC flashes with high DE, and dozens to hundreds of sferics are usually located in three dimensions. Therefore, it is necessary to cluster these sferics into flashes. The criteria used in this paper are 400 ms and 15 km, and the maximum flash duration is limited to 1.5 s, following Q [15,23]. The flash is regarded as CG when a return stroke is detected, and the first strike information is taken as that of this CG; otherwise, the flash type is IC. The two-dimensional BLNET location data are used in the paper.
A two-step binning method is applied to assimilate the two kinds of lightning data. First, the raw flash-location data were interpolated into a 2D total lightning rate field within the predefined resolution (here, we set it as model resolution) and then accumulated in pre-given time intervals. To avoid adjusting vertical velocity too much in non-precipitation clouds, we use radar reflectivity mosaic merged from 7 radars (Figure 1) as the same quality control (QC) threshold for the two sets of lightning data. We assume that those flash pulses are accompanied by a maximum composite reflectivity of >18 dBZ (the widely accepted threshold for precipitation clouds) within its 3 km × 3 km neighborhood and a (–6 min, +6 min) period to be reliable observations.
The lightning location data only locates near the area of the strongest updraft near the convective systems. However, the actual updraft area may be much more beyond the flash location; therefore, the lightning data are temporally accumulated and spatially interpolated so that the numerical model better assimilates them. We calculate a climatological distance-weighting coefficient (see blue lines in Figure 2b,c), which is similar to the method to obtain the vertical profile: first, select the grid points (defined as maximum-vertical-velocity points) with the local vertical velocity maximum; then, delete those grids accompanied by a maximum composite reflectivity of <18 dBZ; later, select a subdomain (i.e., 9 × 9) whose center is those maximum-vertical-velocity points; finally, average the velocities in all the subdomains and normalize to obtain the climatological distance-weighting coefficient. Multiply the observation total flash rate with the distance-weighting coefficient to yield a smooth total flash rate, which is more suitable to the updraft horizontal distribution of the model.
To illustrate the impact of lightning interpolation, Figure 3 shows the flash-clustered BLNET and raw GLD360 lightning flash locations (Figure 3b,e) and their corresponding interpolated total lightning activities rates with a seven-grid spacings interpolation radius (21 km, Figure 3d,f), which is accompanied by the mosaic radar reflectivity (Figure 3a). Comparisons of the two-lightning data show that BLNET (Figure 3b) could capture more total lightning activities than GLD360 (Figure 3c) for raw lightning data, especially for the area with a composite reflectivity between 18 and 30 dBZ due to the good IC-detection capability of BLNET. By comparing Figure 3d with Figure 3e, it is evident that the scheme of lightning interpolation may yield a smooth gridded total lightning activities field, and the gridded flash rate field better corresponds to the area and strength of the convective system observed by mosaic radar.
Note that the vertical velocity profile and distance-weighted horizontal parameters are statistically computed for cumulus clouds (corresponding to 18 dBZ). As widely accepted, different thresholds of composite radar reflectivity could represent different types of convections (e.g., 18 dBZ threshold for cumulus clouds; 40 dBZ threshold for storms, [24]) corresponding to different vertical profiles and horizontal distributions. Therefore, we will evaluate the LDA performance sensitivities for the predefined vertical profiles and horizontal weight obtained by averaging the grids with two groups of composite radar reflectivities (>18 and 40 dBZ) corresponding to different cloud types in Section 5.2.

3. Brief Description of the Mesoscale Convection System and Experimental Design

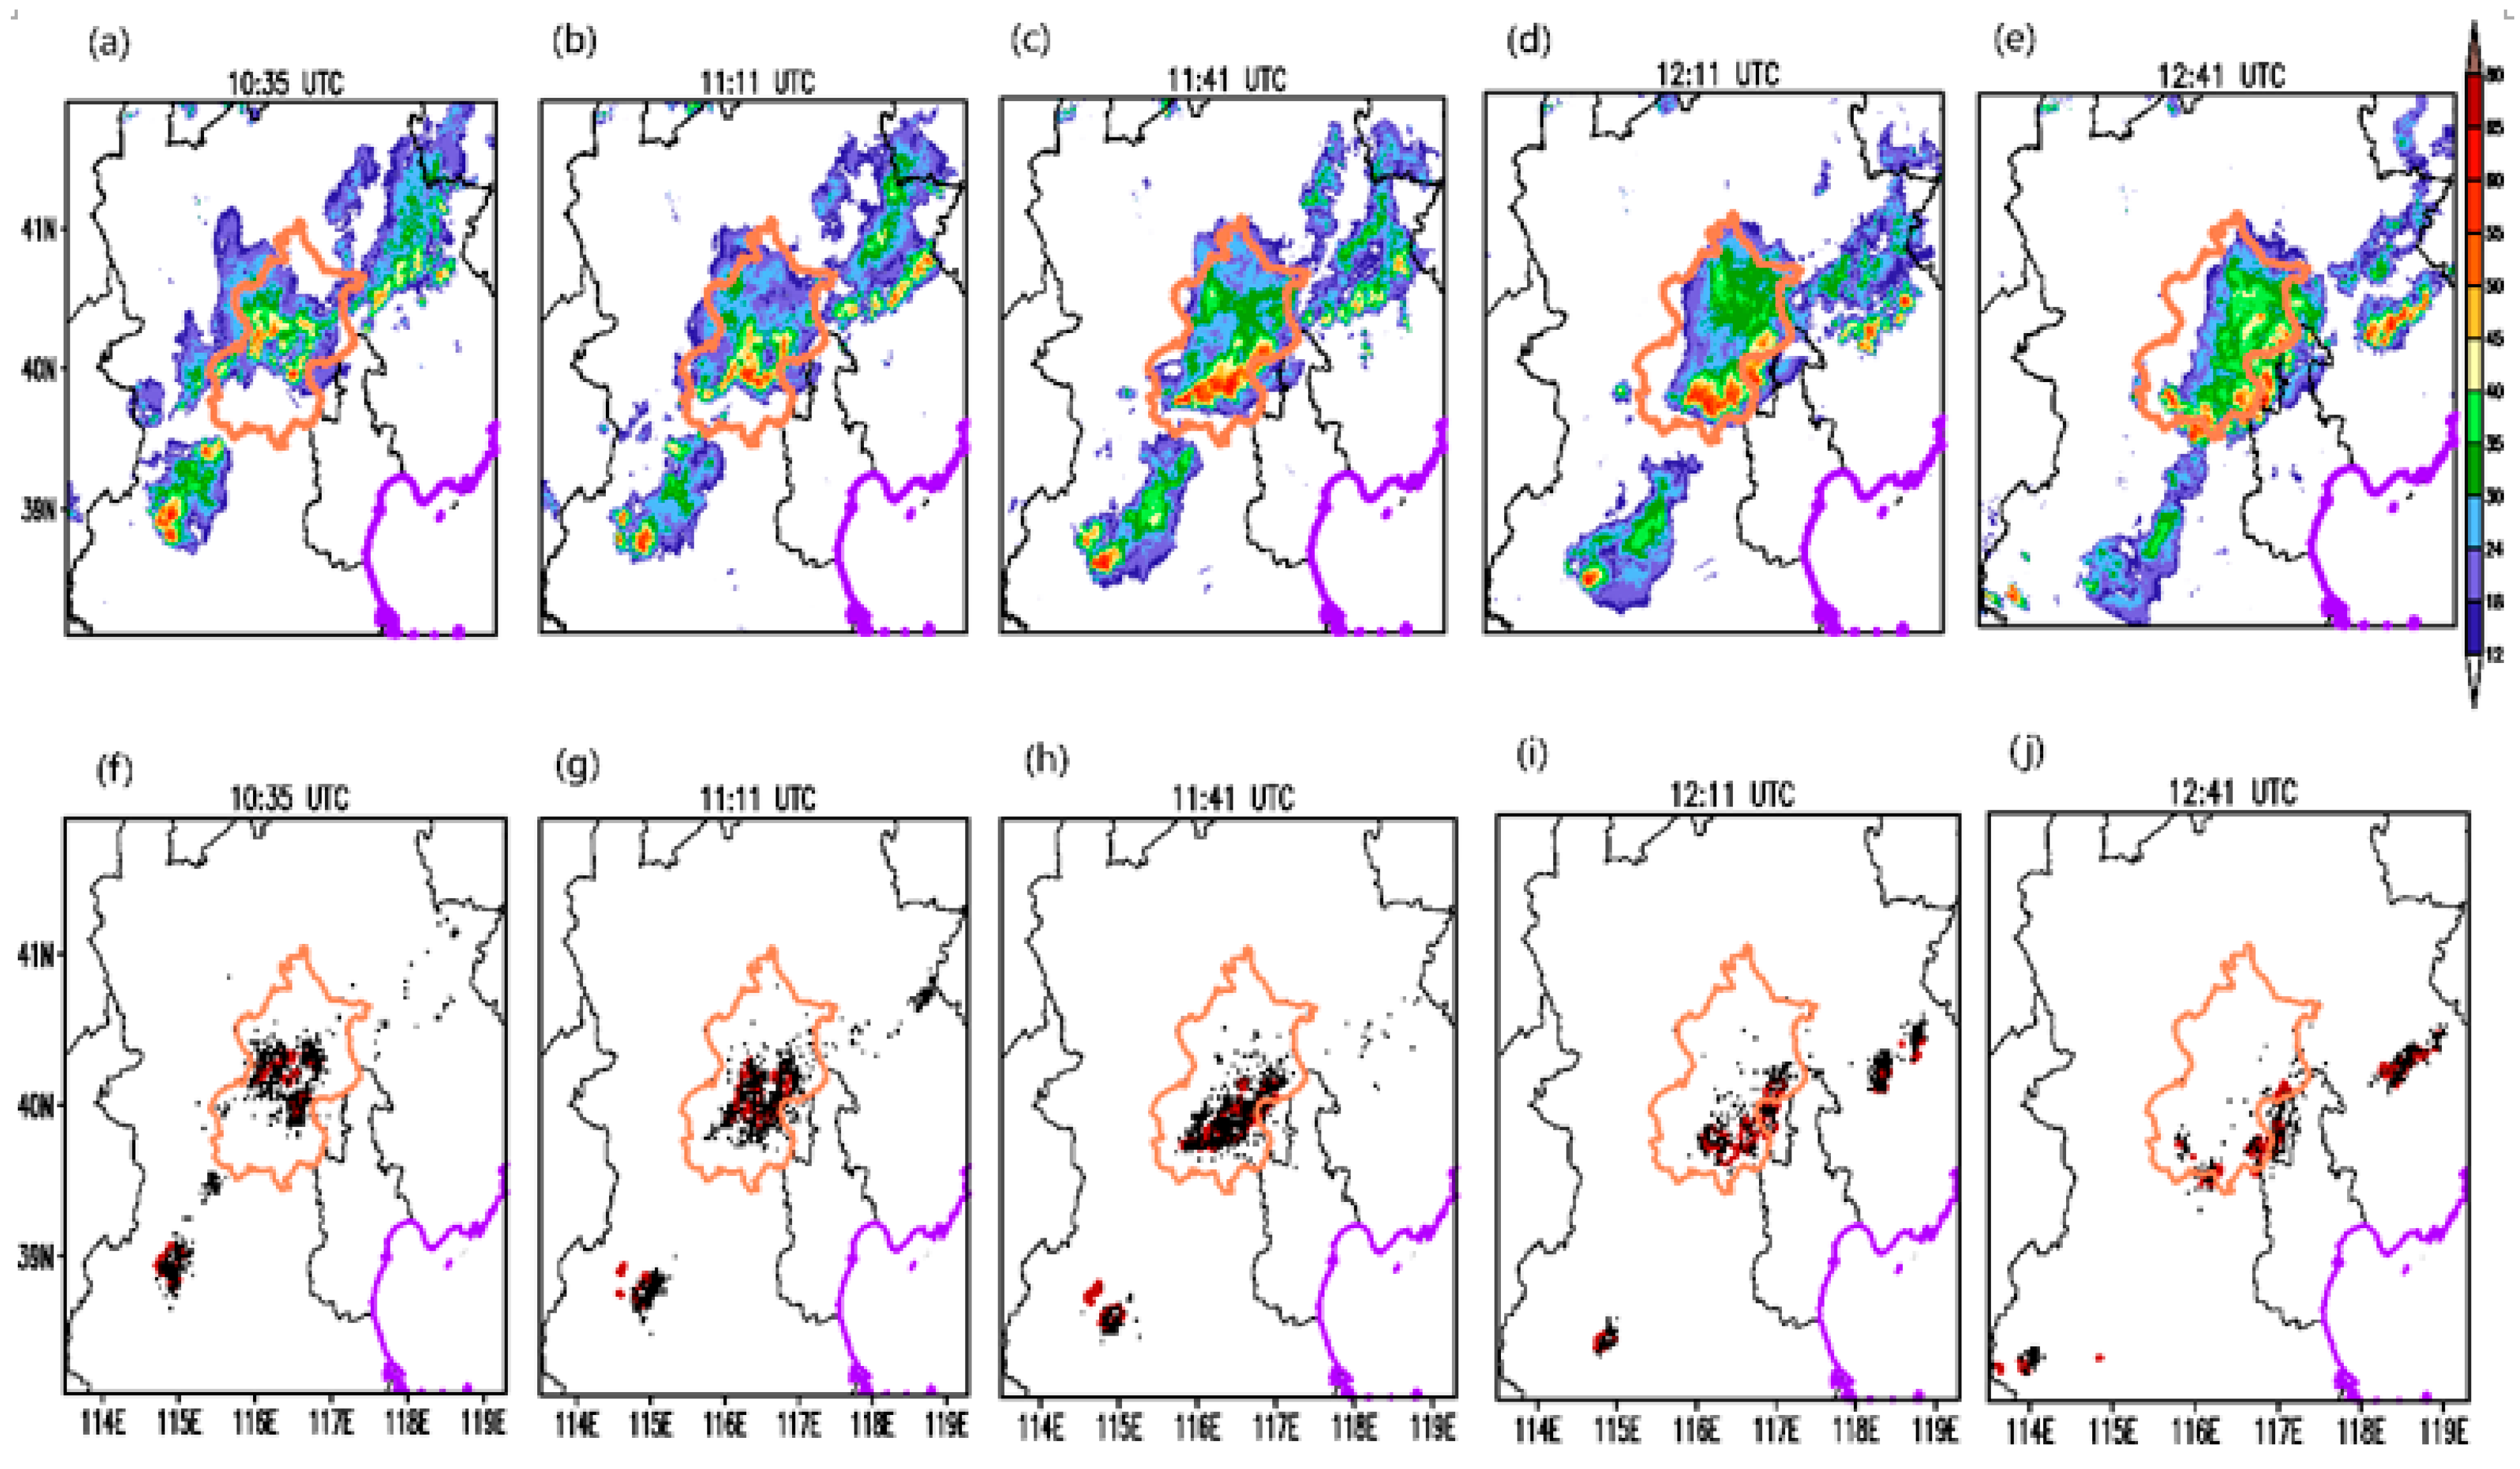
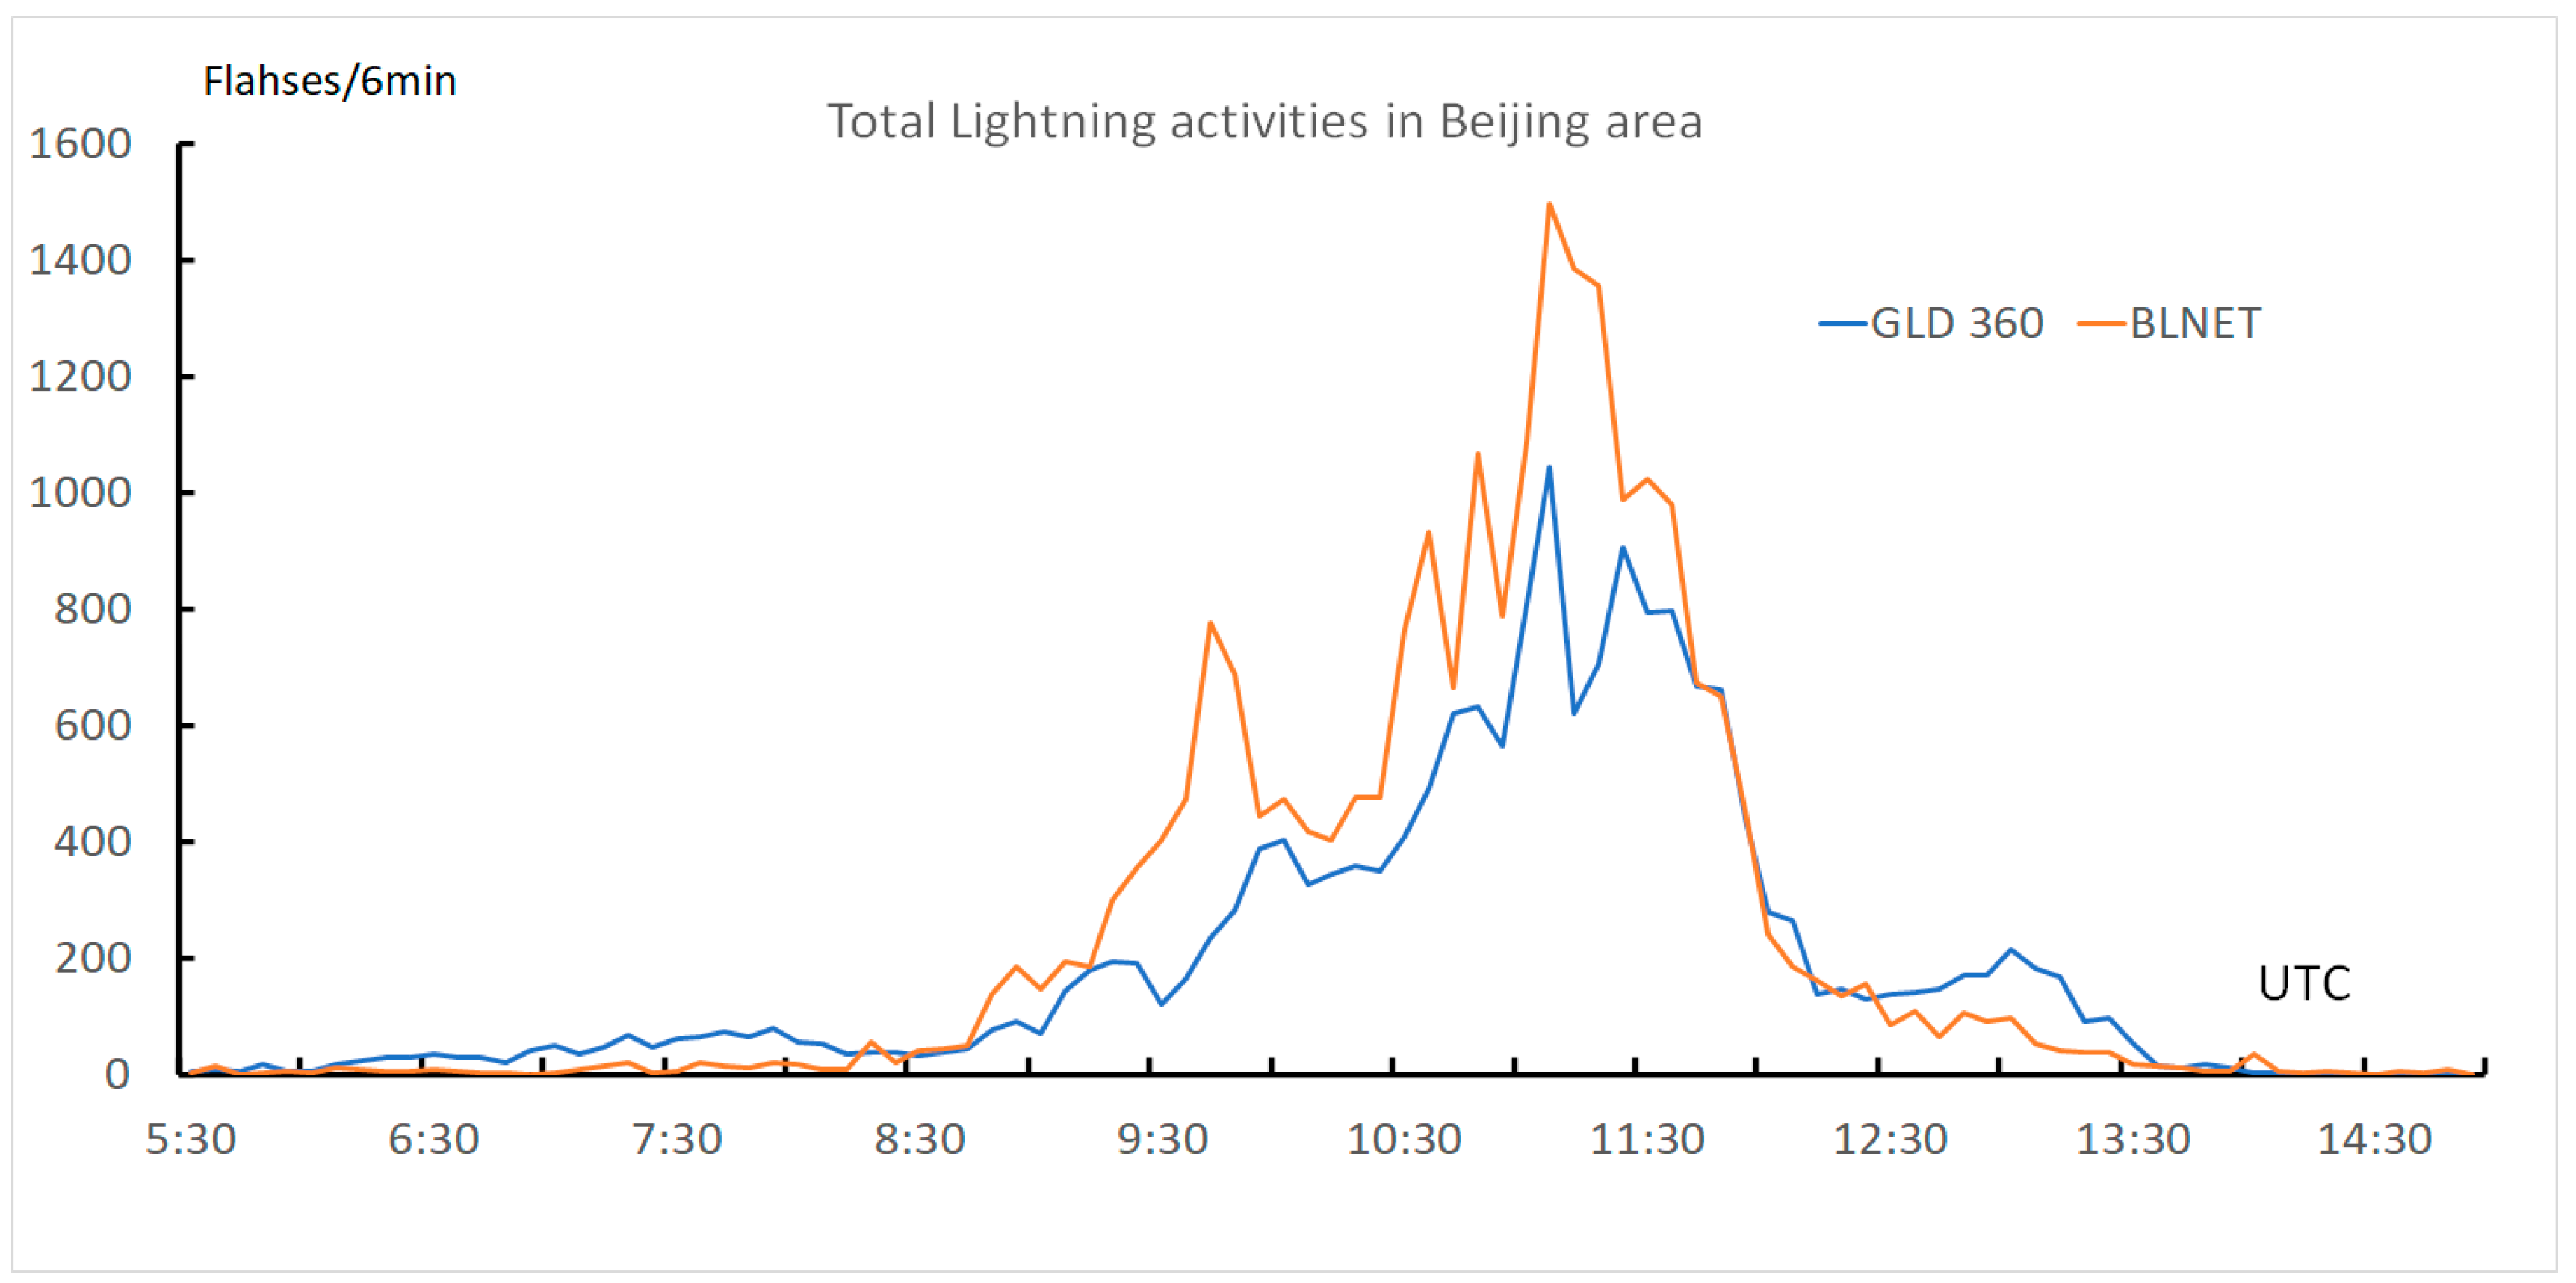
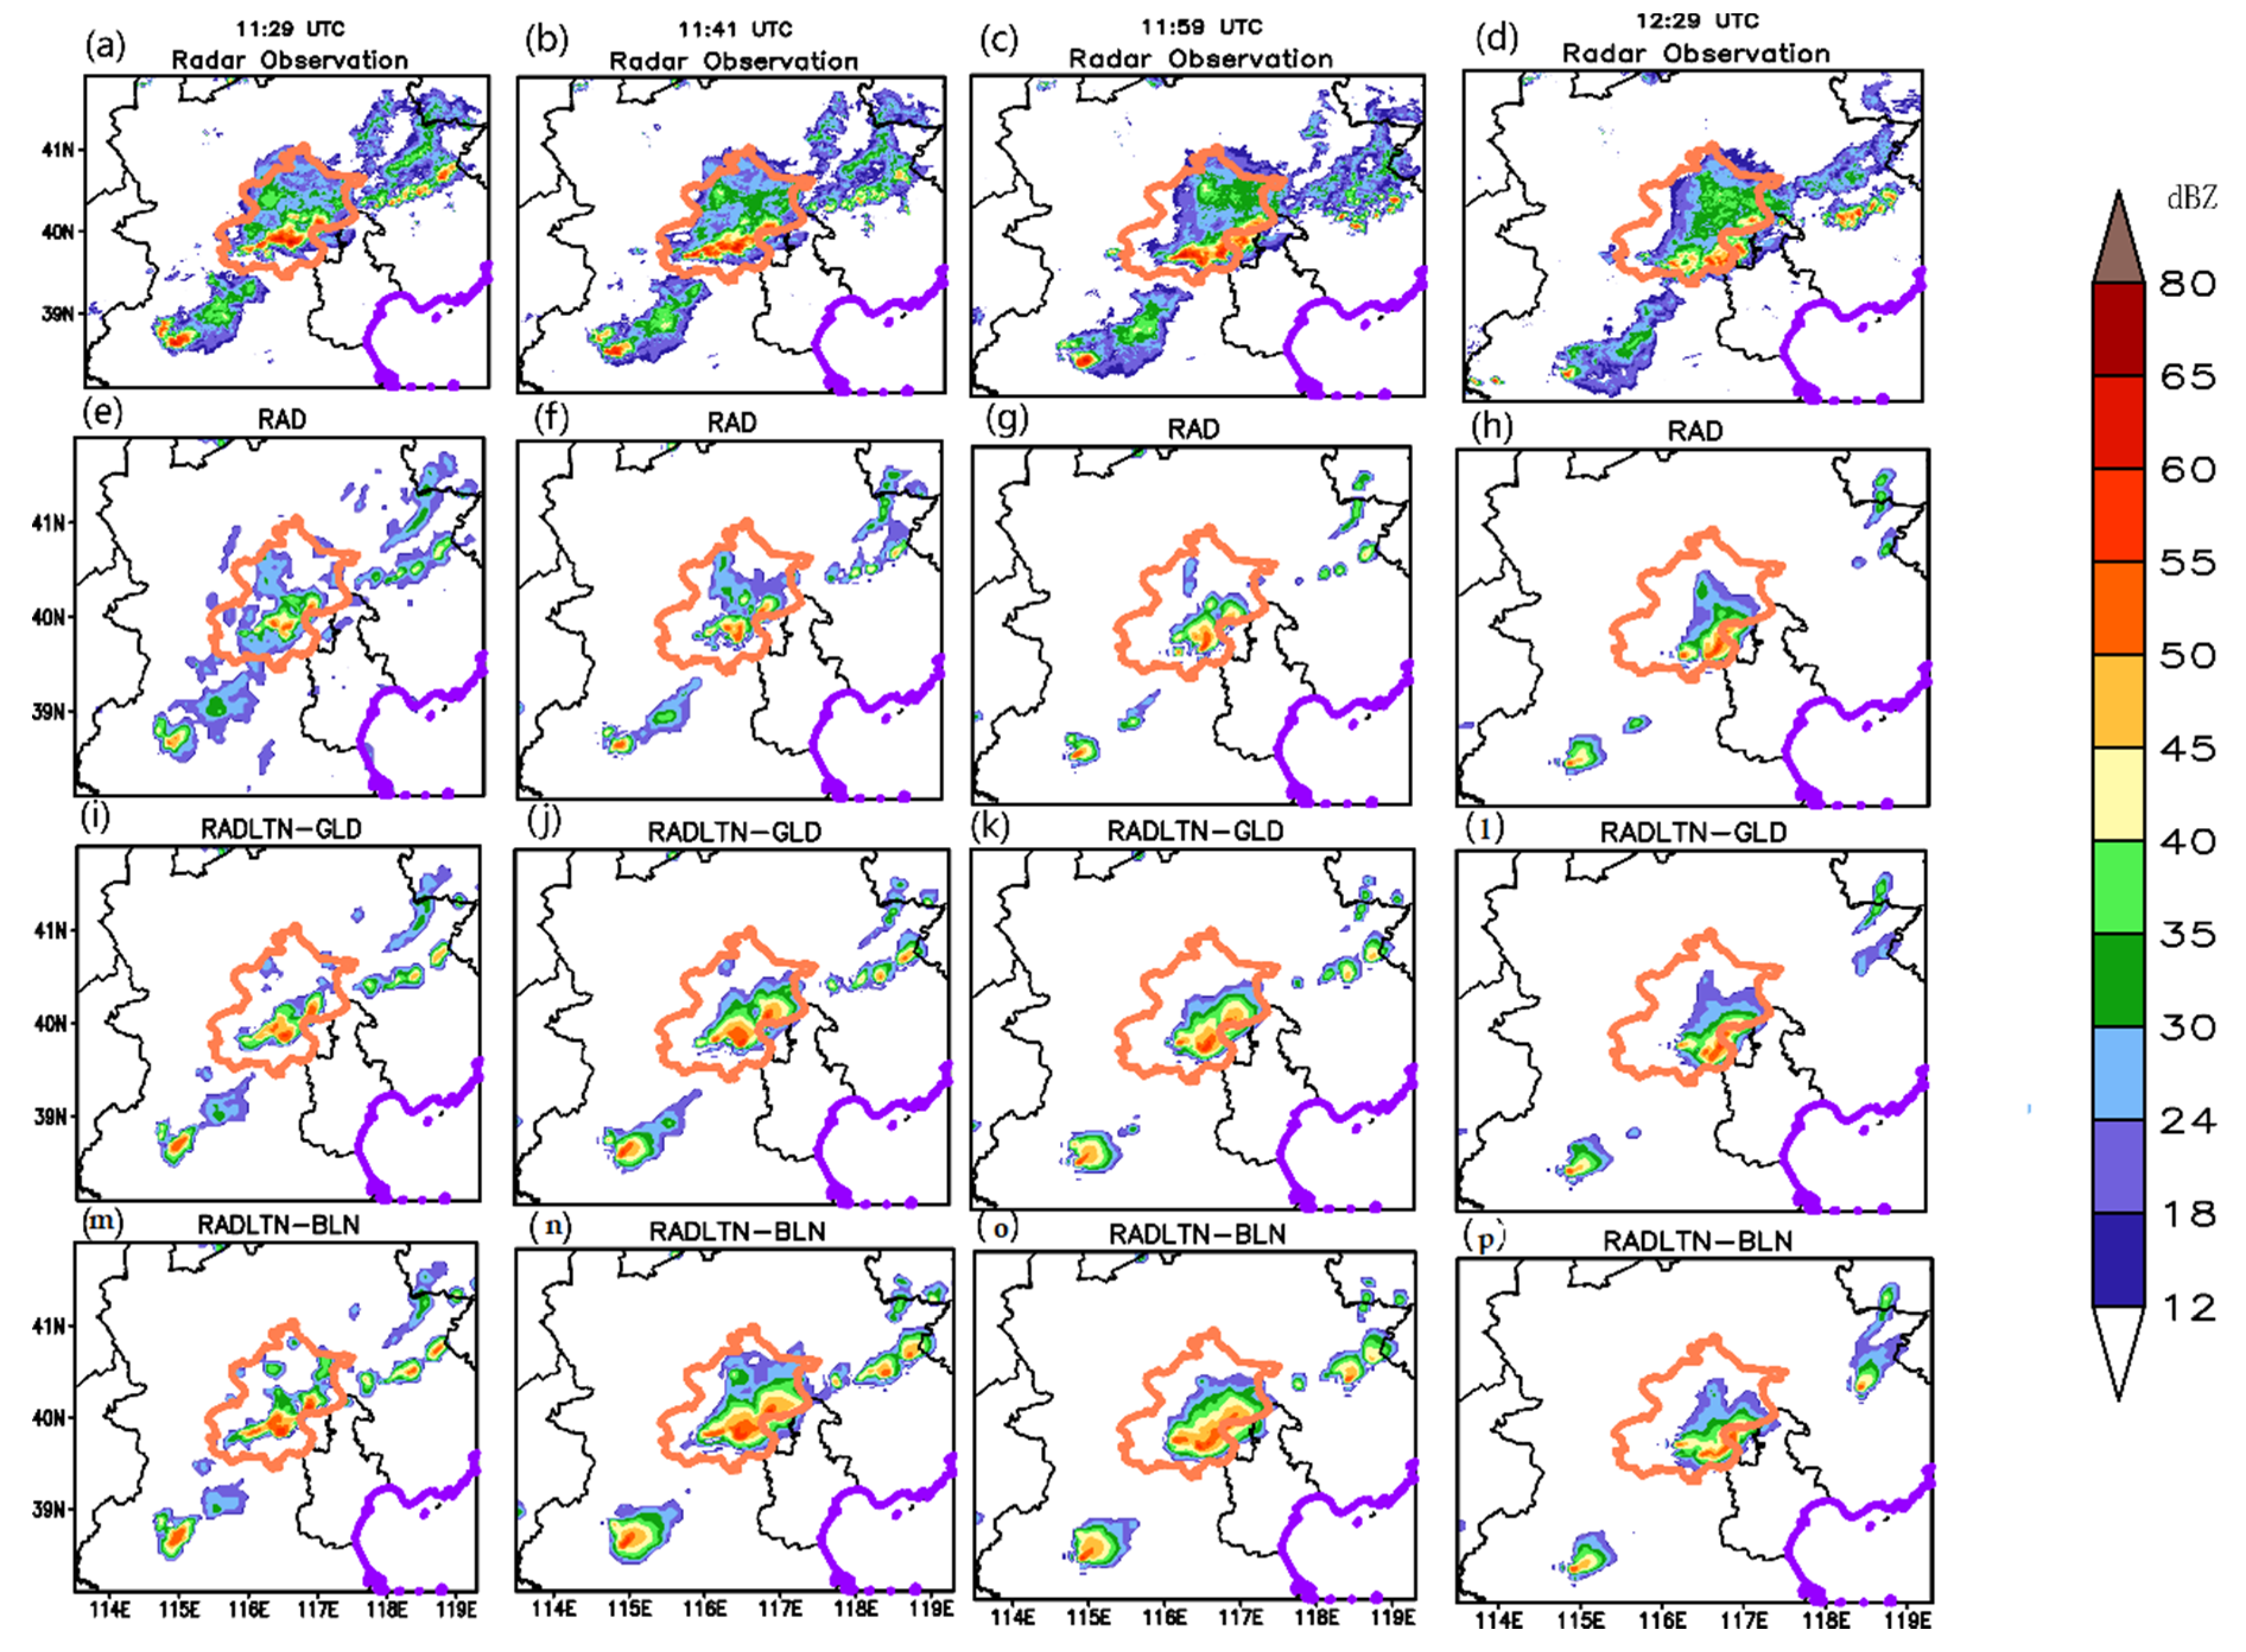
3.1. The Mesoscale Convection System

A mesoscale squall line that greatly influenced the Beijing metropolitan region on 7 August 2015 is selected to assess the LDA performances of the BLNET lightning data. On the day of interest, Beijing was jointly influenced by a northeast 500-hPa cold vortex and an 850 hPa subtropical high. The cold air advected by the northwest flow at 500 hPa and abundant low-level moisture advected by the lower southwest wind formed unstable conditions. The convective available potential energy (CAPE) calculated from Beijing sounding (near the Beijing S-band radar, see Figure 1) was over 4063 Jkg−1, and the convective inhibition (CIN) was at ~#x2212;20 Jkg−1.
Several convective clusters were initiated along Yanshan Mountain in northwestern Beijing at 0800 UTC (local time is UTC+8 h) and gradually propagated toward Beijing. At 1035 UTC (Figure 4a), some of these storms arrived at the plains, and several local convective cells initiated and developed rapidly in the Beijing metropolitan area. To 1111 UTC (Figure 4b), several mergers took place between these cells. To 1141 UTC (Figure 4c), a squall line formed with the length >200 km and propagated southeastwardly at 1211 UTC (Figure 4d). Strong winds, very frequent lightning, heavy precipitation, and hail were observed by the local weather services during the mature stage. The system gradually dissipated as the squall line split into multiple cells at approximately 1241 UTC, as shown in Figure 4e. Intense lightning activity from BLNET corresponds to the evolution of the convective system shown in Figure 4f–j, which is overlaid with reflectivity values > 40 dBZ. It is clearly shown that during the rapid development stage, lightning activities detected by the lightning observation network are much greater than those during the dissipation stage. A comparison of total lightning activities summed in the black rectangle in Figure 1a from BLNET (orange lines) or GLD360 (blue lines) observations (Figure 5) indicates that within the Beijing area, BLNET could capture 40~60% more lightning activities than GLD360 during the rapid development (0900–1200 UTC) of the MCS.
The reason why we select this squall line for this study is not only BLNET detection networks clearly observing the evolution of the convective systems. More importantly, the accurate prediction of its merger and intensification is regarded as a difficult challenge to operational forecasters. In fact, the current operational regional NWP (RMASP-ST, based on the WRF-3DVar) implemented at the Beijing-Tianjin-Hebei forecast office could not clearly capture the explicit propagation and distribution of rainfall centers (Forecast Summary of North China Meteorological Service, 2016, personal communication).

3.2. Description and Configuration of DA Experiments

Table 1 shows the brief descriptions of the following DA experiments selected to evaluate the effect of LDA with BLNET data. The DA experiment without RDA or LDA could not capture the convections (not shown), so we select the experiment with the assimilation of radar data alone (RAD) as the baseline in the study. The experiment RADLTN-BLN represents the assimilation of both radar and BLNET lightning data, and RADLTN-GLD is similar to RADLTN-BLN, except for the lighting data from GLD360 lightning data. Additionally, we design an additional experiment (DxYn) similar to RADLTN-BLN to examine the sensitivity of the assimilation of BLNET lightning data to horizontal influence radius (D) and lightning data accumulating time (Y) used in the LDA scheme. Finally, RADLTN-Cumulus and RADLTN-Storm experiments are designed to examine the sensitivity of LDA to the vertical profile and horizontal interpolation parameters obtained from different cloud types (cumulus or storm) by means of maximum radar reflectivity mosaics.
Figure 6 illustrates the continuous cycling used for the above experiments. The 4DVar window is 12 min, in which each of the seven radars may produce 2~3 radar volume scans. The first cycle starts at 0953 UTC, and the background is ingested from a horizontal resolution of 3 km forecast from WRF in the combination of surface data. In the next cycles, RMAPS-NOW uses the analysis from the last cycle as the background. After cycle 5, VDRAS runs the 2 h forecast at the end of the 4DVAR assimilation window of each cycle.
The red square in Figure 1a indicates that the RMAPS-NOW experimental domains are centered at 39.9089° N, 116.472° E. The horizontal spacing of the domain is 3 km (150 × 150 grid points). The number of evenly spaced vertical layers for these experiments is 30 with 500-m grid spacing. These DA experiments include both rain and simple ice process [19].

4. Results and Discussion

In this section, we continue to evaluate how the initial fields assimilating BLNET lightning observations (RADLTN-BLN) impact rainfall nowcasting with the baseline RAD and RADLTN-GLD.

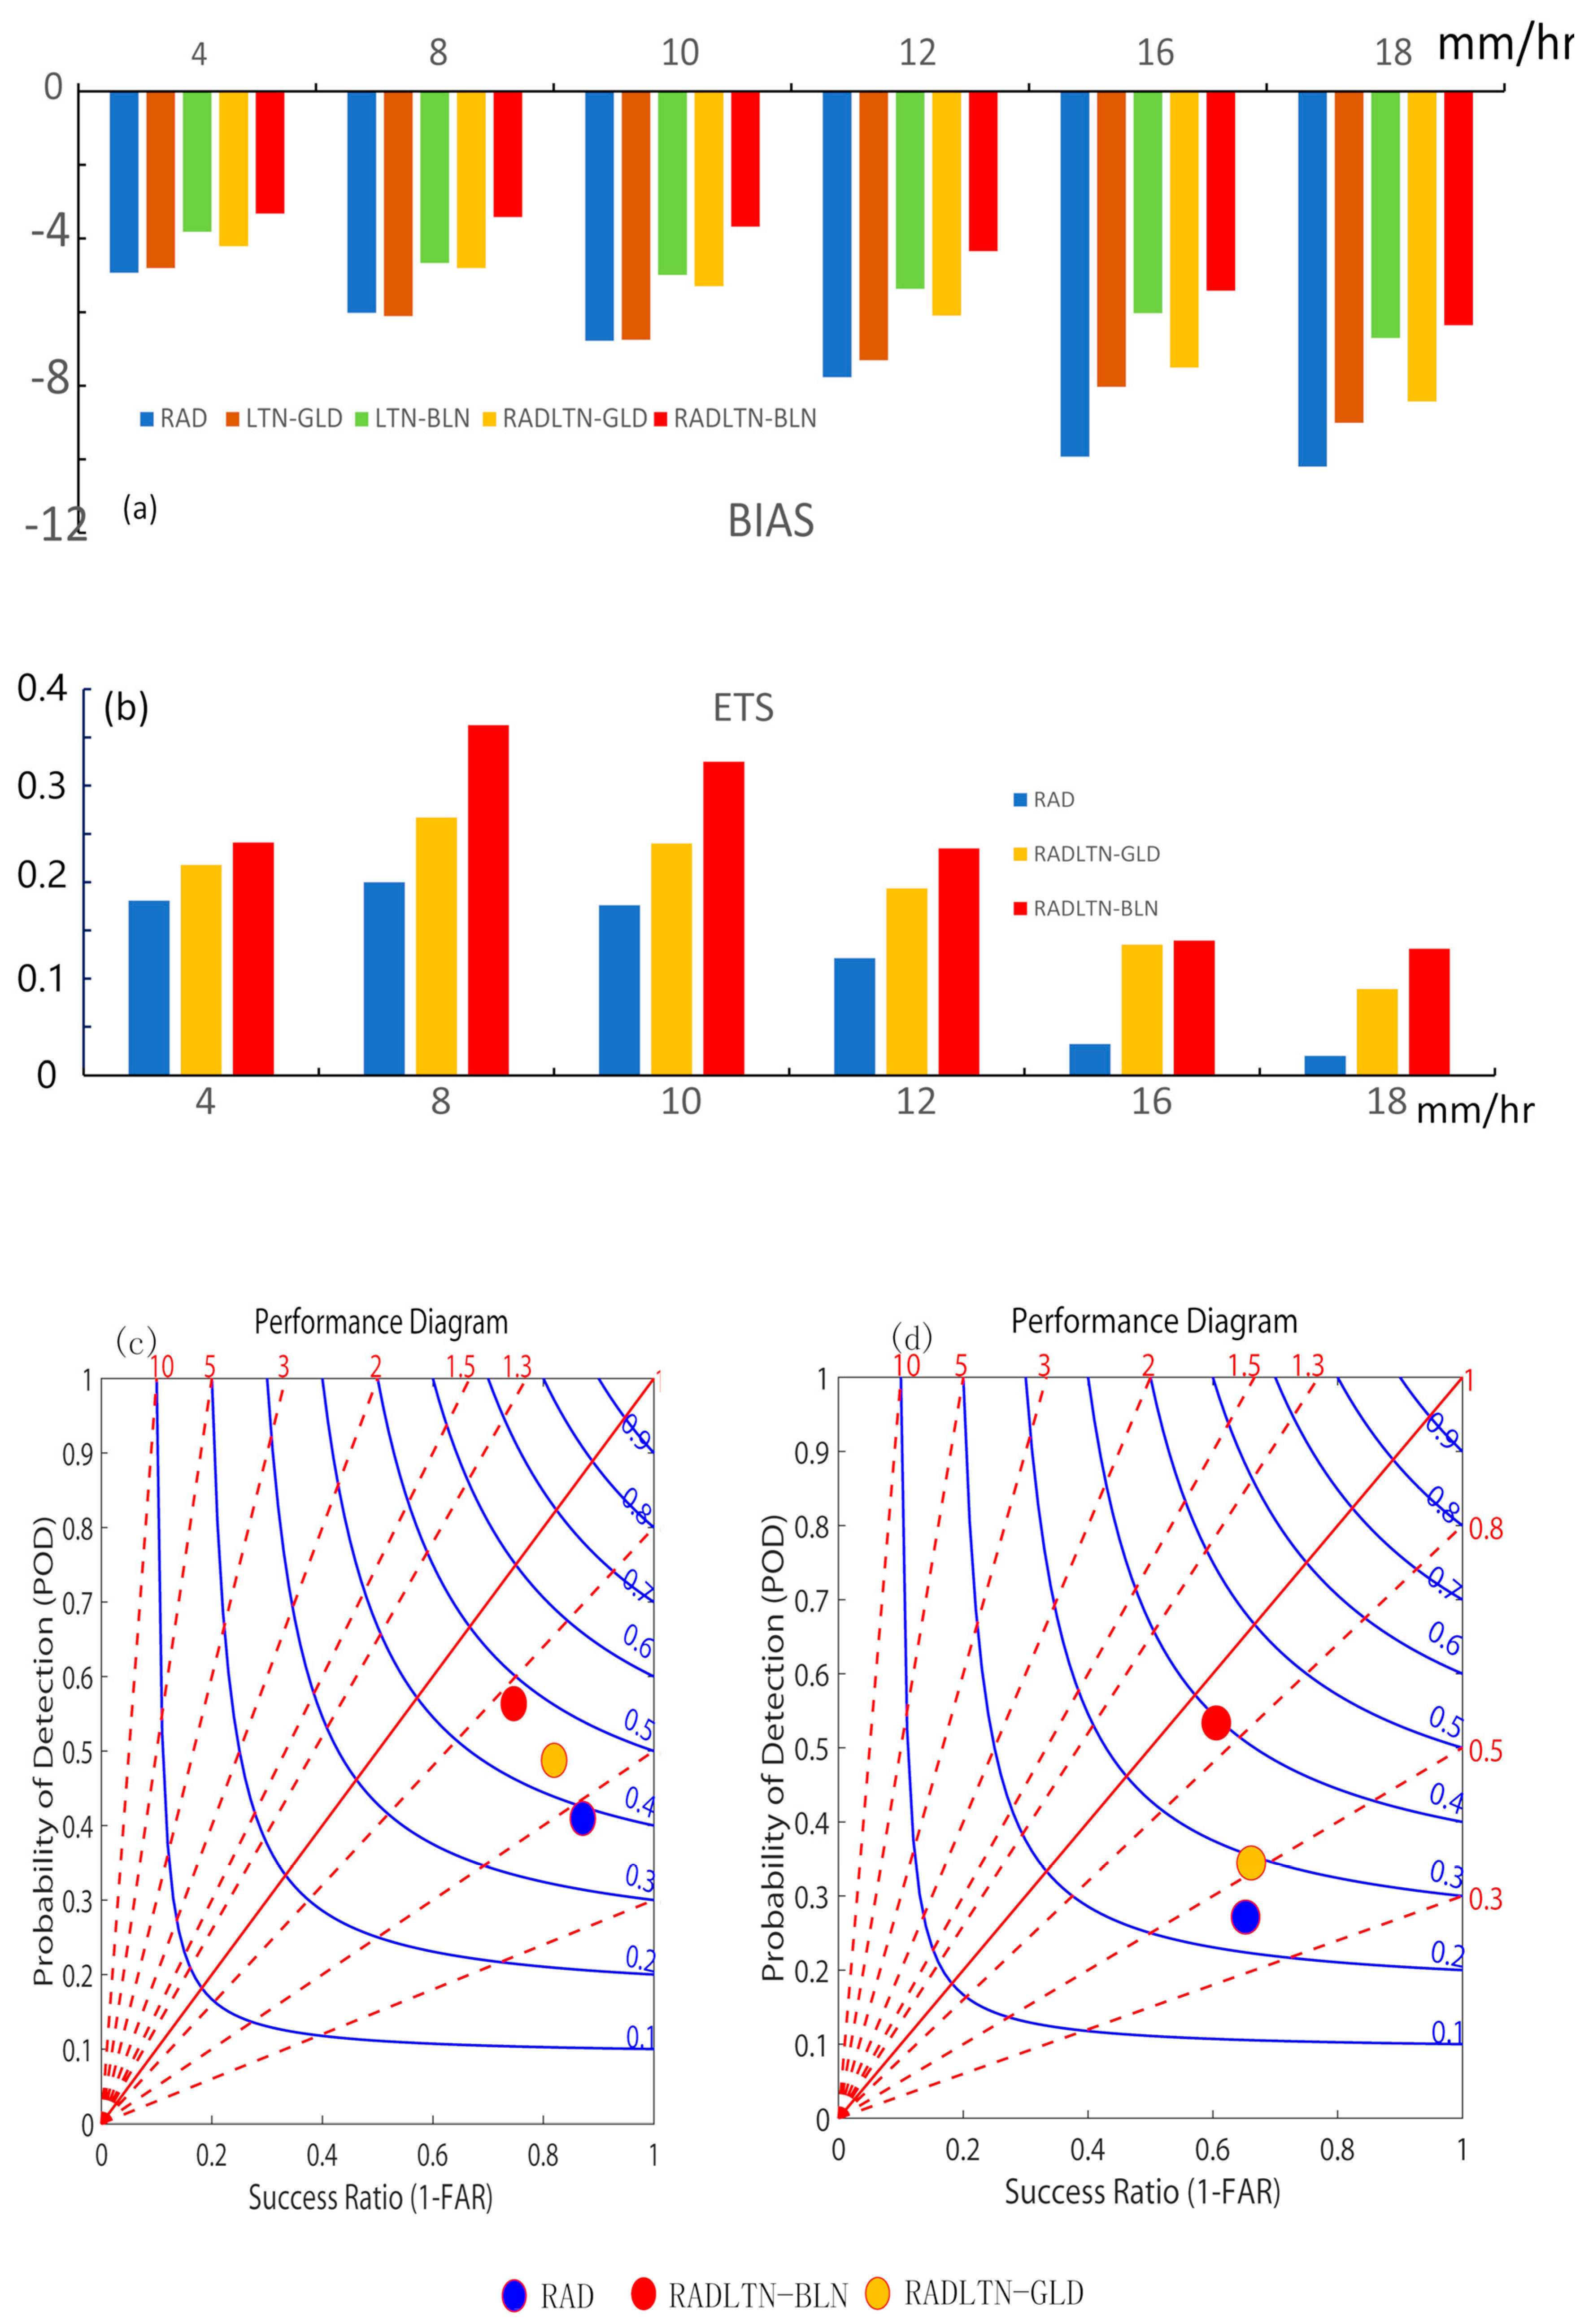
4.1. Verification Index

This study aims to assess whether adding extra high DE lightning data from BLNET to RMAPS-NOW using the 4DVAR framework could improve the ability of precipitation nowcast; therefore, we select the 2h predicted accumulated precipitation to assess the LDA performance.
The quantitative precipitation estimate product (QPE, hereafter) is produced by blending rain gauge observations and radar-derived rainfall within 2 h. Because RMAPS-NOW could not output QPE directly, the corresponding 2 h accumulated precipitation (units, mm) at the lowest nowcasted by the RMAPS-NOW is computed in each grid cell in the following relationship:
Precipitation = ρ a q r V t ρ w × 1000 × Δ t ,
where Δt is the time step, Vt is the terminal velocity, ρa is the density of air, qr is the rainwater mixing ratio, and ρw is the density of liquid water. Additionally, the horizontal resolution is 3 km as the forecasting model. Using the equation, the required accumulated rainfall over any given period of time for verification could be obtained. This study selects the following metrics: the grid-point-mean bias (observations minus model nowcasting), equitable threat score (ETS) reported by [25] and performance diagram [26], which includes critical information of the Critical Success Index CSI, Probability of Detection POD, frequency bias score BIAS, false alarm ratio FAR, and Success Ratio SR (one minus the FAR) to quantitatively compare the performance of the rainfall nowcasting obtained in different experiments. Aggregate metrics to QPE were computed and averaged for the six cycles initialized at 1105, 1117, 1129, 1141, 1153, and 1205 UTC.

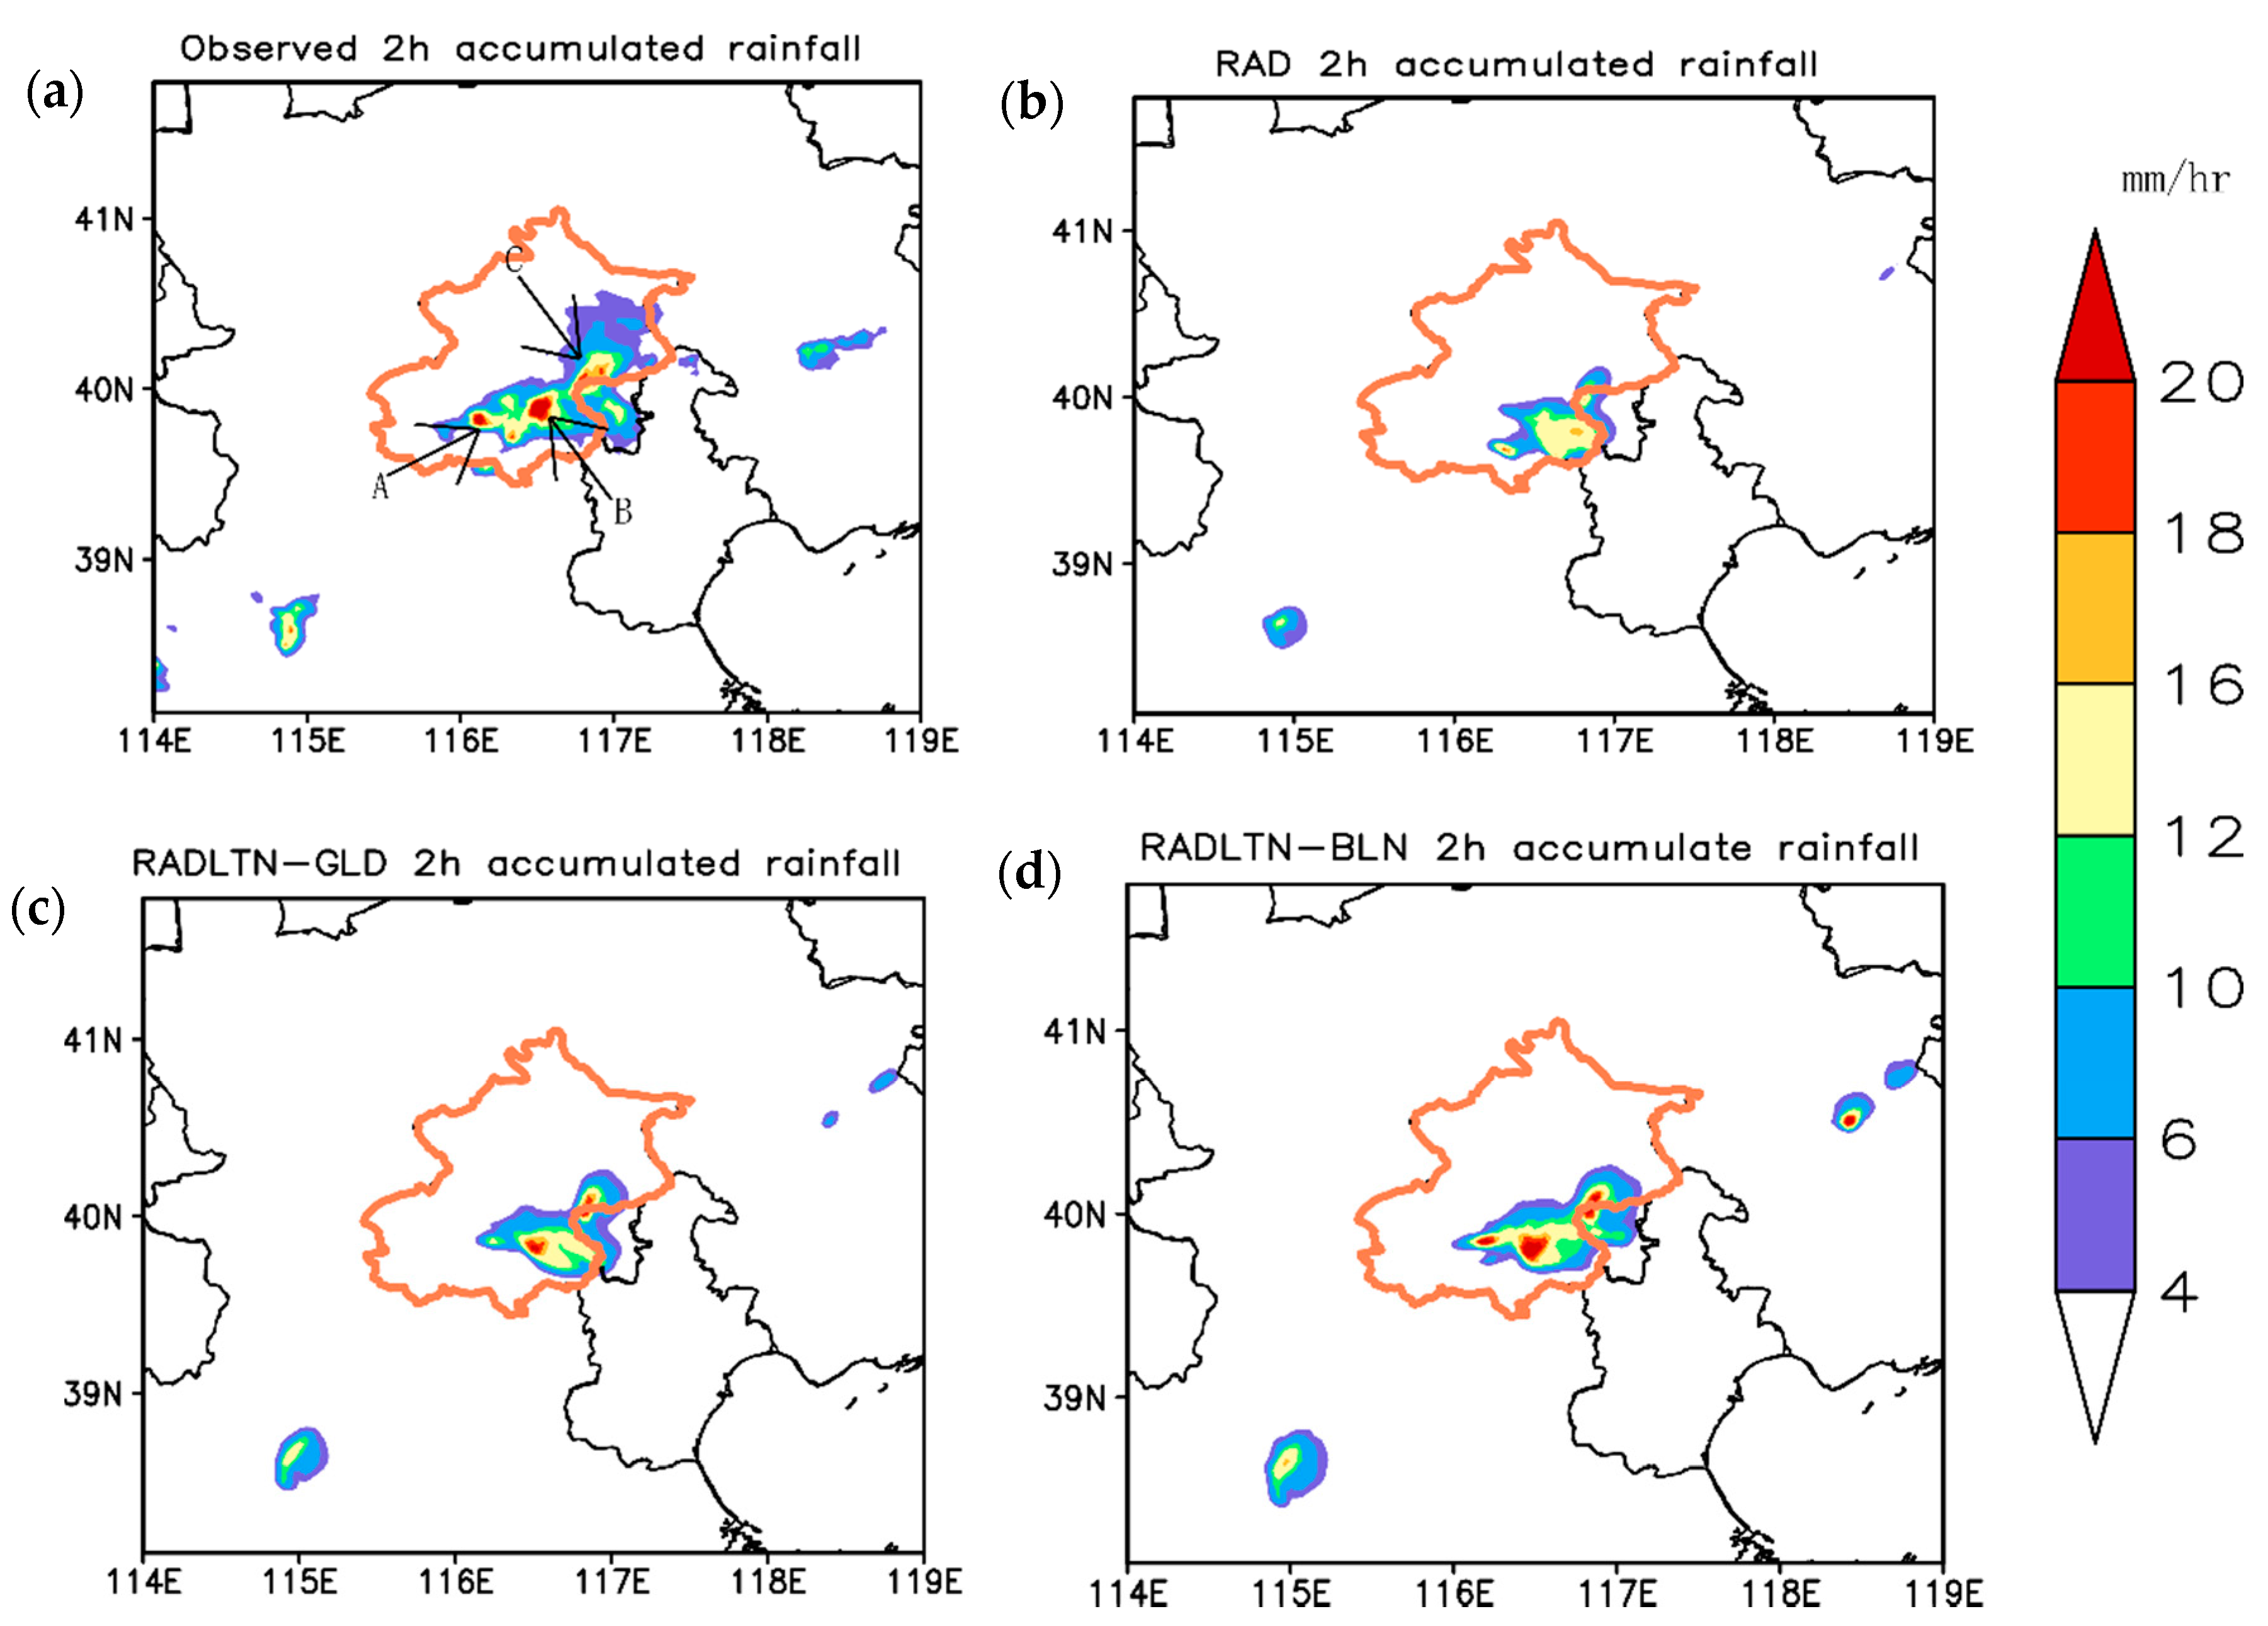
4.2. Improvement of LDA with BLNET Lightning Data on Precipitation Nowcasting

Because these studies mainly concern heavy precipitation nowcasting, we first investigate the improvement of assimilating BLNET lightning data on the performance of precipitation accumulation in RADLTN-BLN through verification against the (QPE) produced by RAD and RADLTN-GLD. These skill comparisons (Figure 7) reveal that benefit from the applications of LDA, RADLNT-BLN and RADLTN-GLD result in performance improvement for all hourly rainfall thresholds compared with experiment RAD and the assimilation of BLNET lightning data in RADLTN-BLN further improves the precipitation skill than those in RADLTN-GLD. The application of LDA for BLNET lightning data in RADLTN-BLN help to reduce the mean bias by ~43%, and increase the ETS by ~36–200% in the comparison of those counterparts in RAD, whereas the negative mean bias in RADLTN-GLD is only reduced by ~25% and the ETS is increased by ~33%–50% for the different precipitation thresholds (see Figure 7a,b). Figure 7c,d show the performance diagrams for two rainfall thresholds (4 mm h−1 for light rain and 14 mm h−1 for heavy rain). A perfect forecast will locate at the upper-right corner of the diagram. The improvement of combining LDA and RDA over radar-alone is clearly shown by the higher TS or POD and lower BIAS in RADLTN-BLN and RADLTN-GLD. Among the two LDA experiments, assimilating high DE lightning data can obtain a better improvement effect than RADLTN-GLD. Additionally, especially in moderate to heavy precipitation (10–18 mm), assimilating BLNET lightning data can result in obvious improvement by reducing the mean bias by >50%, increasing the ETS by >150% in Figure 7a,b, and frequency BIAS reduces by ~0.49 and TS increases by >0.15 at the 14 mm threshold shown in Figure 7d. It is not surprising because the IC observed by BLNET but missed by GLD360 could more clearly indicate the locations of the strong updraft (Wiens et al., 2005). By comparing analysis and forecast for composite reflectivity against the radar observations initialized at 1129 UTC (Figure 8), we found that the assimilation of BLNET lightning data could produce some improvement and accurately nowcast the nature of convective structures, especially for rainband centers. Additionally, moreover, it is shown that improvement of the 1-h predicted radar reflectivity from RADLTN-BLN experiment is relatively little, which the LDA effect mainly last for 1 h.
Figure 9 shows the 2 h accumulated precipitation nowcast (Figure 9b–d) against the QPE products (Figure 9a) converted from radar merging with rain gauges. While all the experiments successfully forecasted the main rainband B, RAD nearly missed rainfall events A and C. Moreover, the rainfall strength in RAD was distinctly underestimated compared with the observations. In comparison, the RADLTN-GLD experiment (Figure 8c) with LDA of low DE lightning data is able to capture storm C, but it still fails to capture new storm A, and with the assimilation of high DE lightning data, RADLTN-BLN produces the best performance. RADLTN-BLN both successfully nowcast the three rainfall centers (A, B, and C), and moreover, the precipitation system from RADLTN-BLN is much closer to the observed rain band pattern, distribution and intensity.
The above comparisons show that the application of LDA with BLNET lightning data, due to the higher DE, could lead to the more accurate and timely formation of precipitation and improve nowcasting performance than RAD or BLNET-GLD.

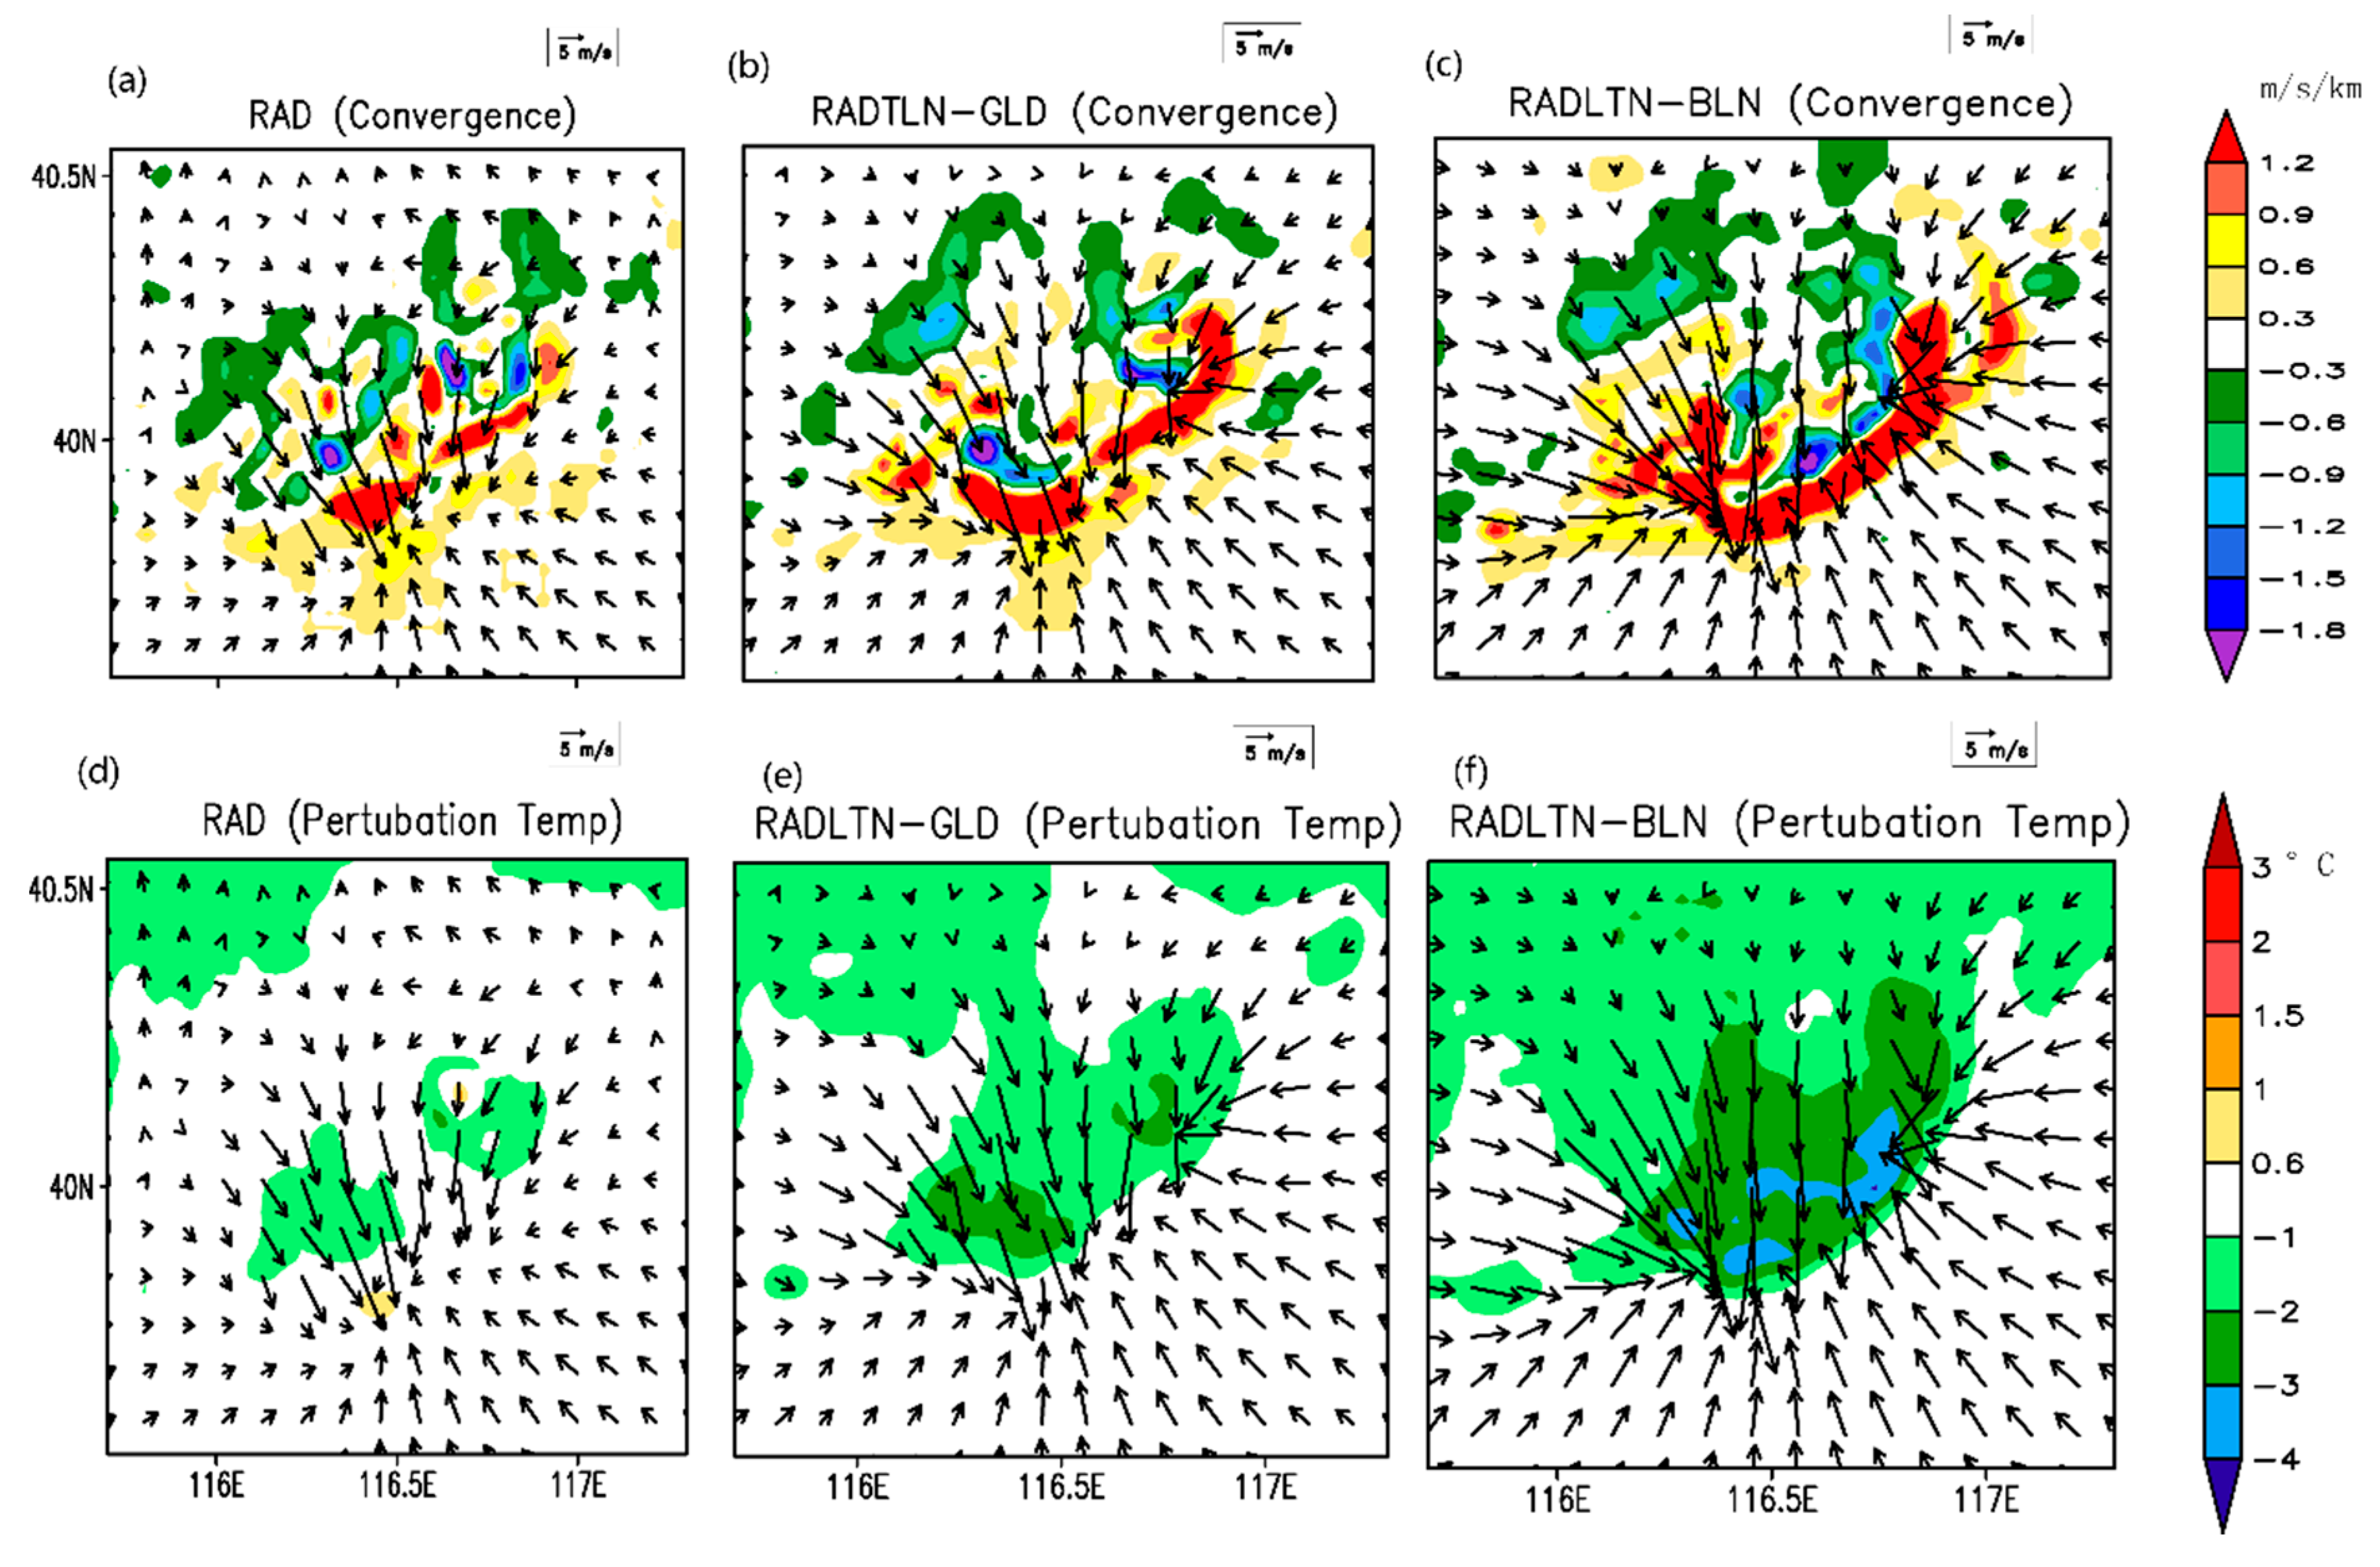
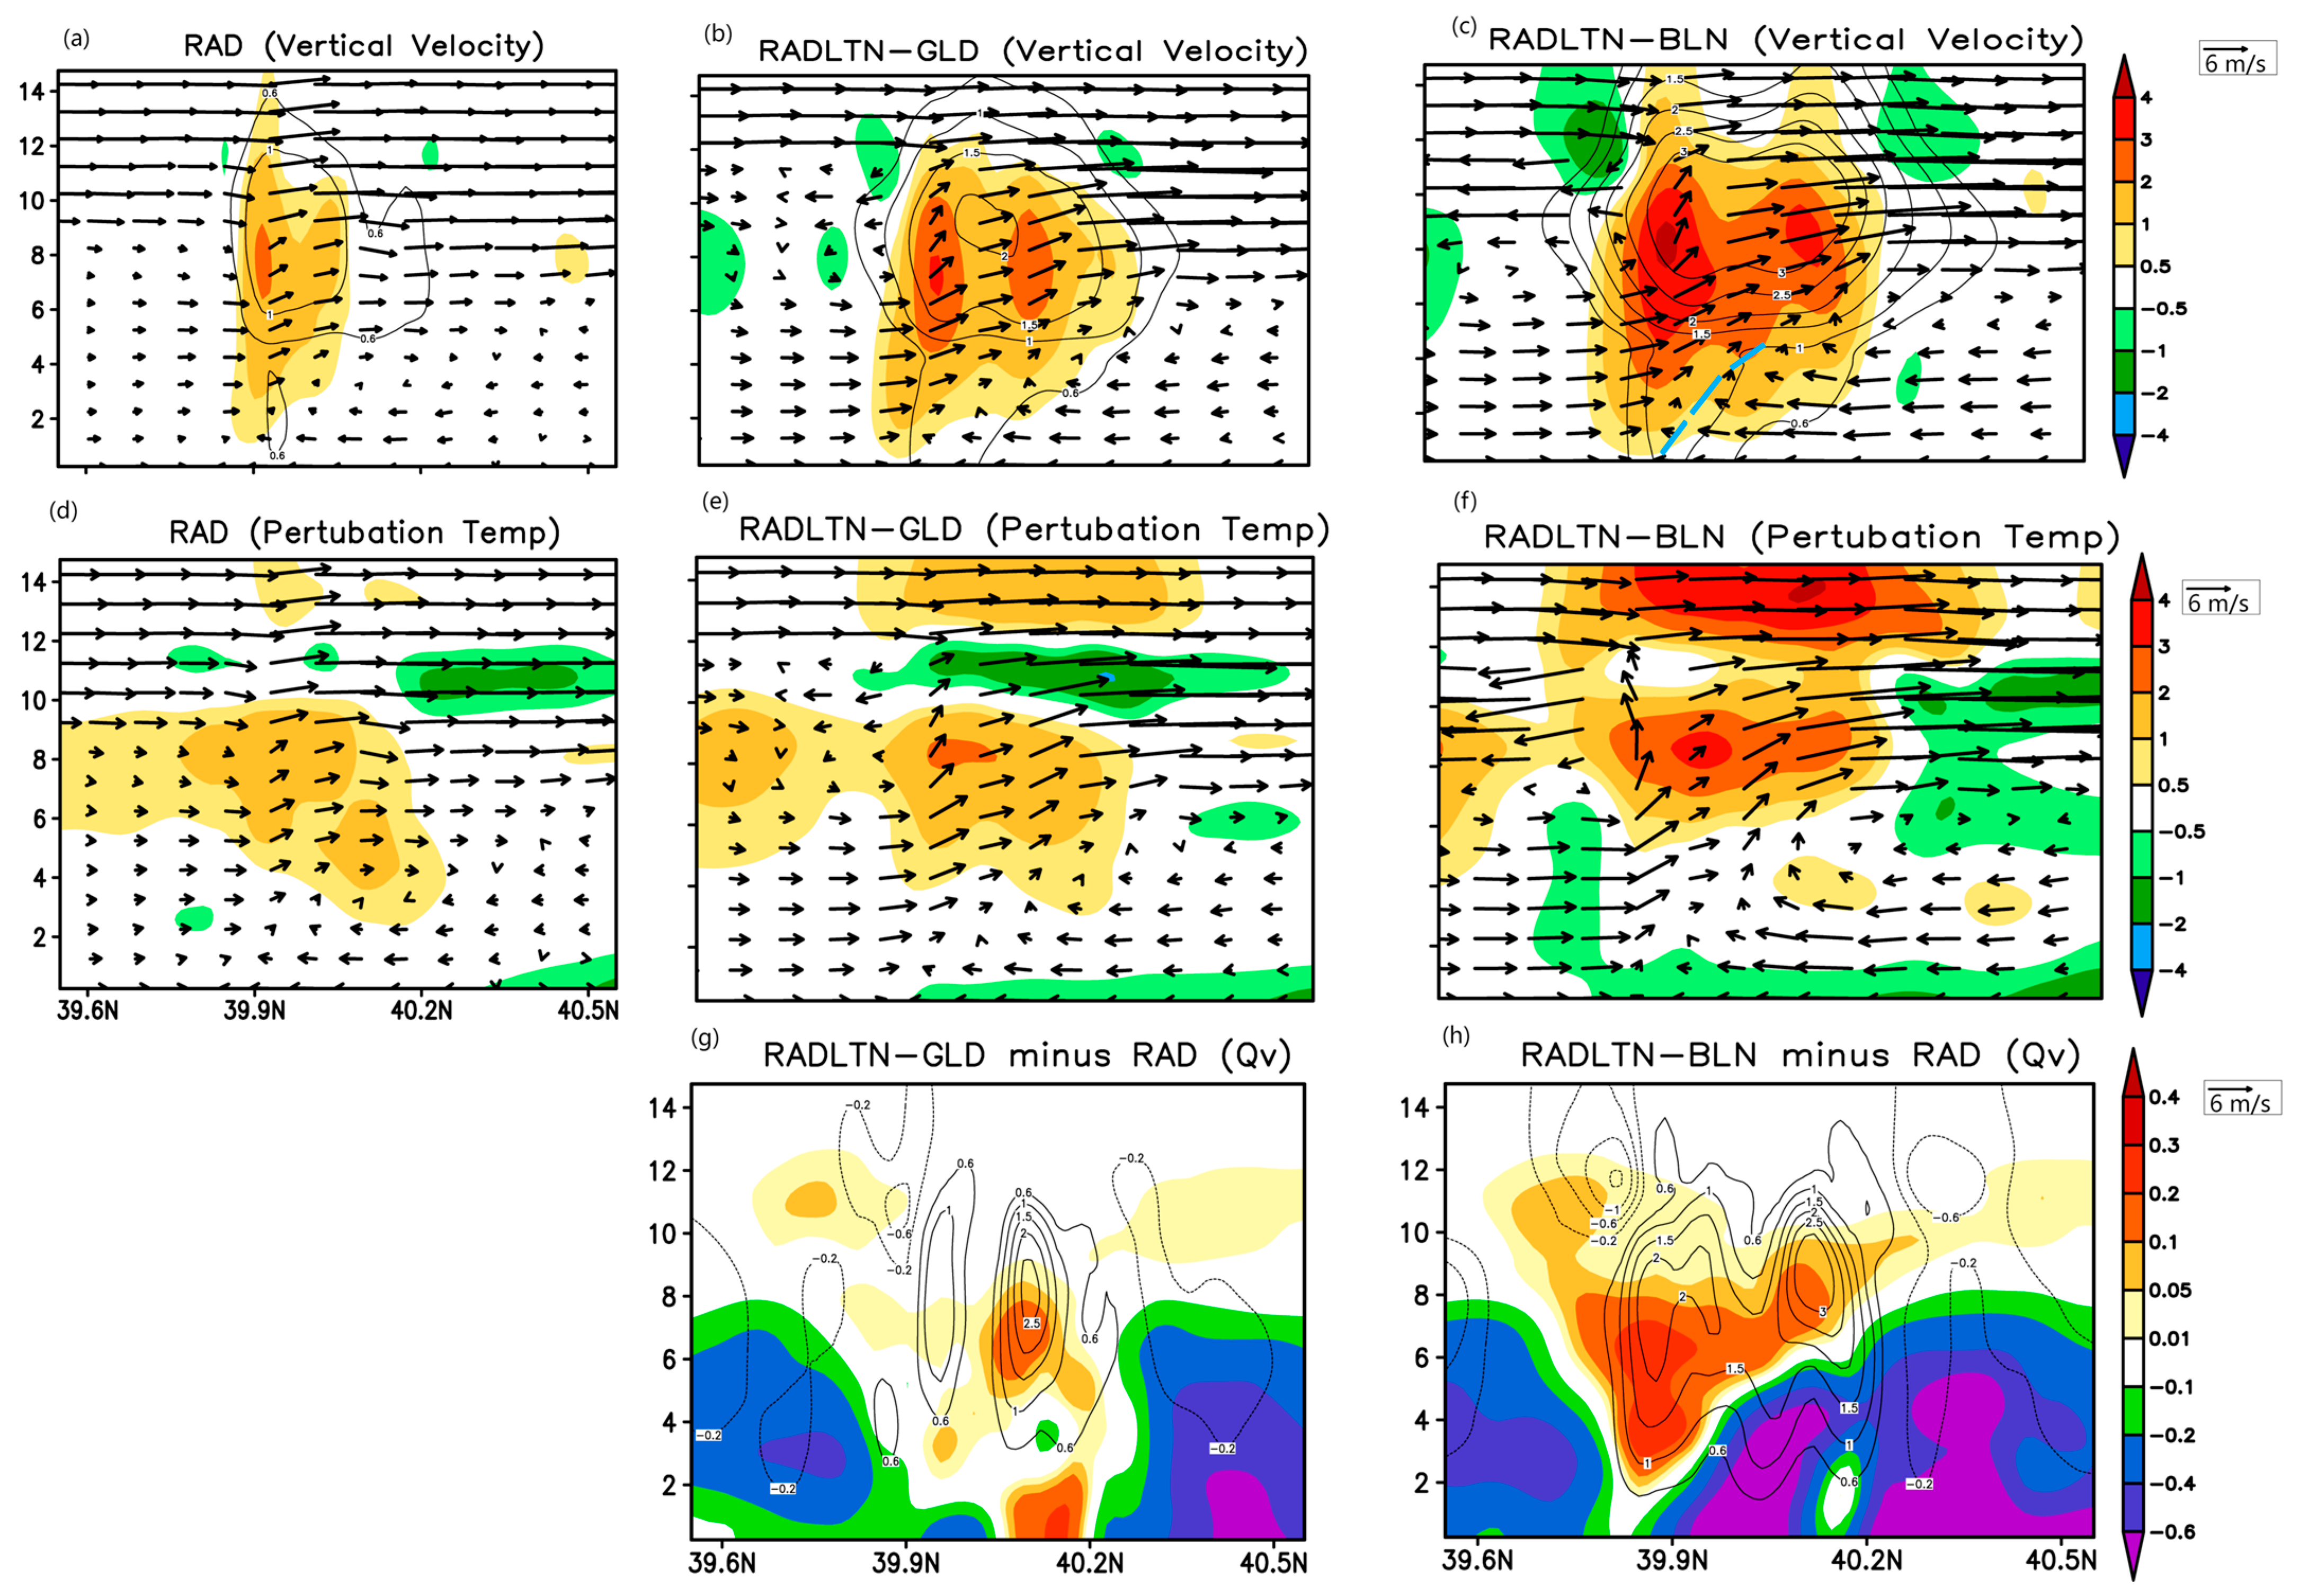
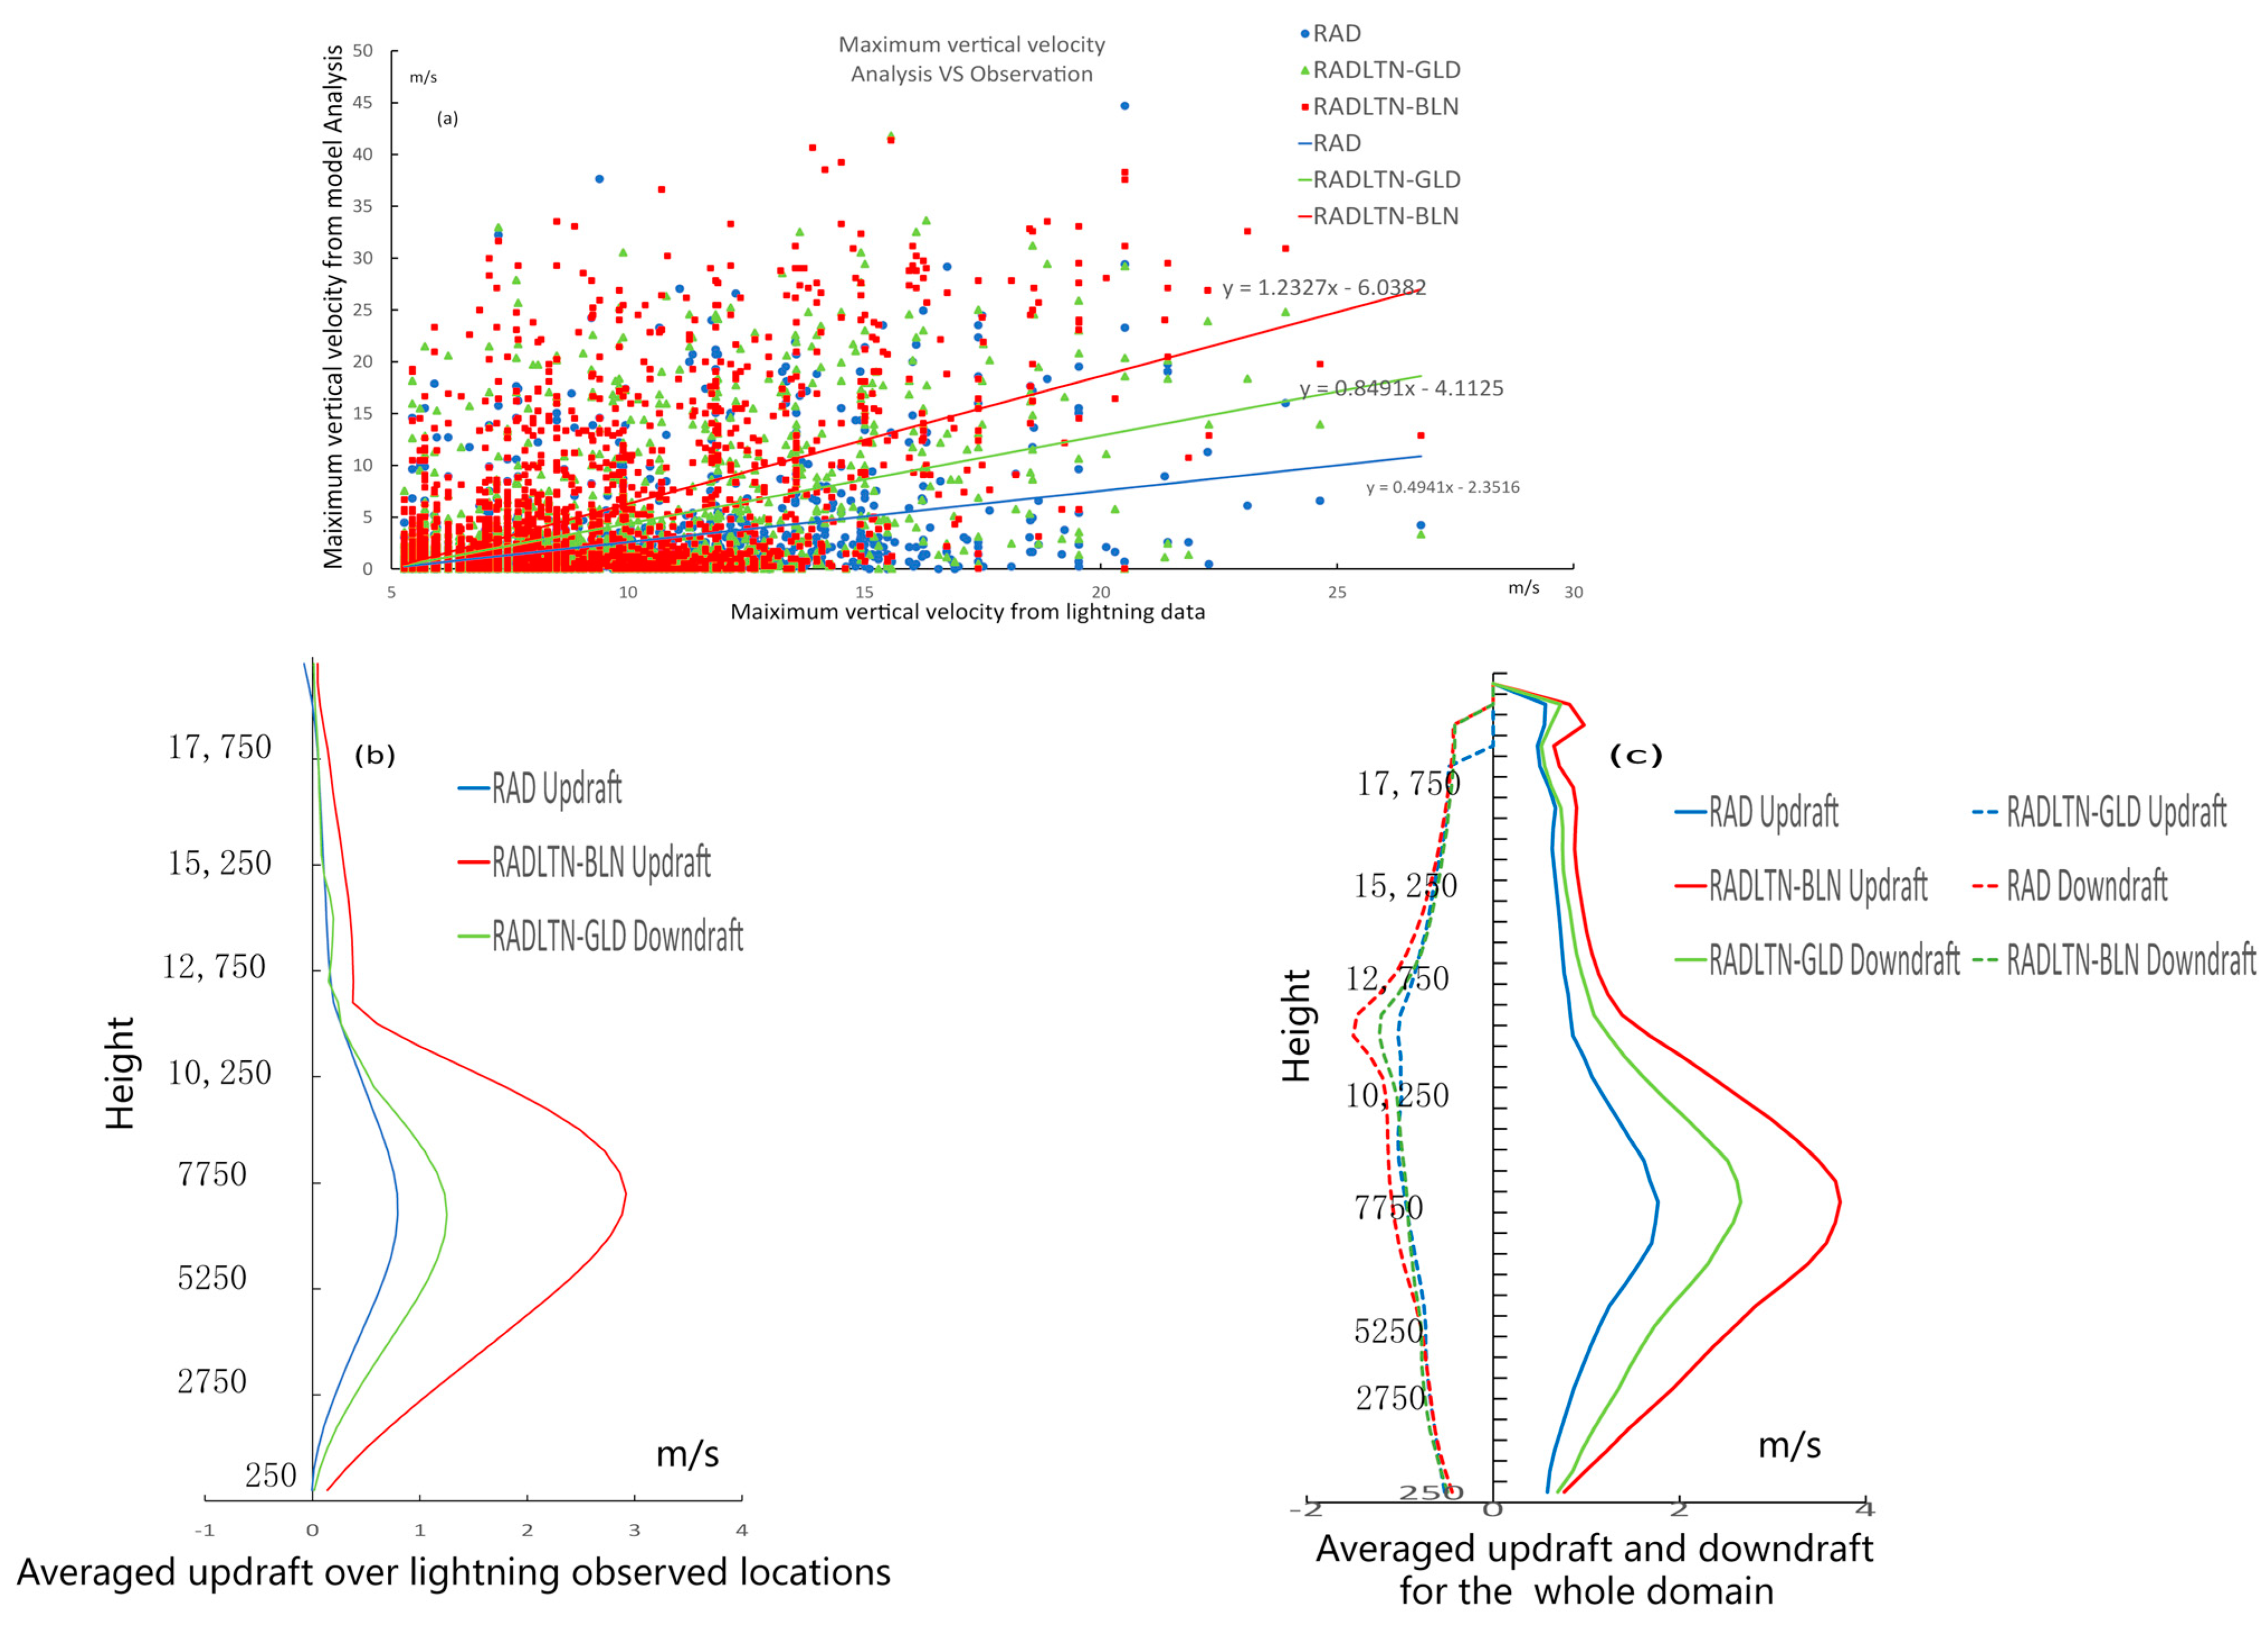
4.3. Impact of LDA on the Initial Fields

In this section, we will fully evaluate the impact of BLNET lightning data sources on improving the initial fields by comparing the thermal and dynamical features of the initial fields in it with others.
Figure 10 shows the initial convergence and perturbation temperature as well as wind field at the lowest layer. We found that the assimilation of lightning observations in RADLTN-GLD and RLADLTN-BLN (Figure 10b,c) increased the northwesterly and southeasterly flows near the convective systems comparing with RAD (Figure 10a) and thus formed more strong and systematic convergence line located in the southeast of the storms. Especially for the southwestern section of the convection systems, where only BLNET has good coverage, the area with strengthened wind convergence in RADLTN-BLN is successfully simulated in the initiated field and thus make the forecast of RADLTN-BLN to capture rainband A in Figure 9d than the other two experiments.
The cold pools at the lowest layer from these experiments are similar, as shown in Figs. 10e–f. Moreover, because RADLTN-BLN produces the most updraft and thus storm, the cool pools in RADLTN-BLN are the strongest than those in the other experiments, which is proved to more conducive the propagation of storms in many studies (i.e., [27]).
Figure 11 compares the south–north cross-sections of domain-averaged vertical velocity (a–c), the perturbation temperature (d–f), the rainwater mixing ratios (contours in a–c), and differences in water vapor mixing ratio (shaded) or vertical velocity (black contour) between RADLTN-BLN and RAD or RADLTN-GLD and RAD, as calculated by subtracting RAD in the two LDA experiments.
For vertical motion, lightning data can increase ascending motion compared with RAD (Figure 11a), and with the assimilation of higher DE, the vertical velocity in RADLTN-BLN (Figure 11c.) will increase more than RADLTN-GLD (Figure 11b). Moreover, the low-level winds in RADLTN-BLN exhibit a distinct inflow south of the storm and form a slanted convergence line (thick blue line in Figure 11c), which is caused by the explicit convergence induced by the higher DE lightning data. In terms of perturbation temperature, with LDA, latent heat release and cold pool structure from RADLTN-BLN (Figure 11e) and RADLTN-GLD (Figure 11f) become more obvious than their counterparts in RAD (Figure 11d). The comparisons of the two LTD experiments indicate that the RADLTN-BLN experiment produces more heating near the storm cell between 39.9 and 40.2° N and produces a stronger cold pool near the surface. By comparing the average difference in water vapor, we find that the water vapor in RADLTN-BLN is gathered near the inflow area of the storms and is lifted by the slanted enhanced updraft (see thick blue line in Figure 11c and contours in Figure 11h) into the middle level. The increased updraft, more latent heating, stronger cold pool, and concentrated water vapor make the storm in RADLTN-BLN (contours in Figure 11c) stronger than others (contours in Figure 11a,b).
These comparisons indicate that although LDA is able to better enhance the wind and convergences to sustain more vigorous microphysical processes and pinpoint locations of the storms than the radar-alone experiment, the additional assimilation of BLNET helps to add the analysis of stronger wind intensities and more accurately depict convergences and flows near the storms than GLD360.

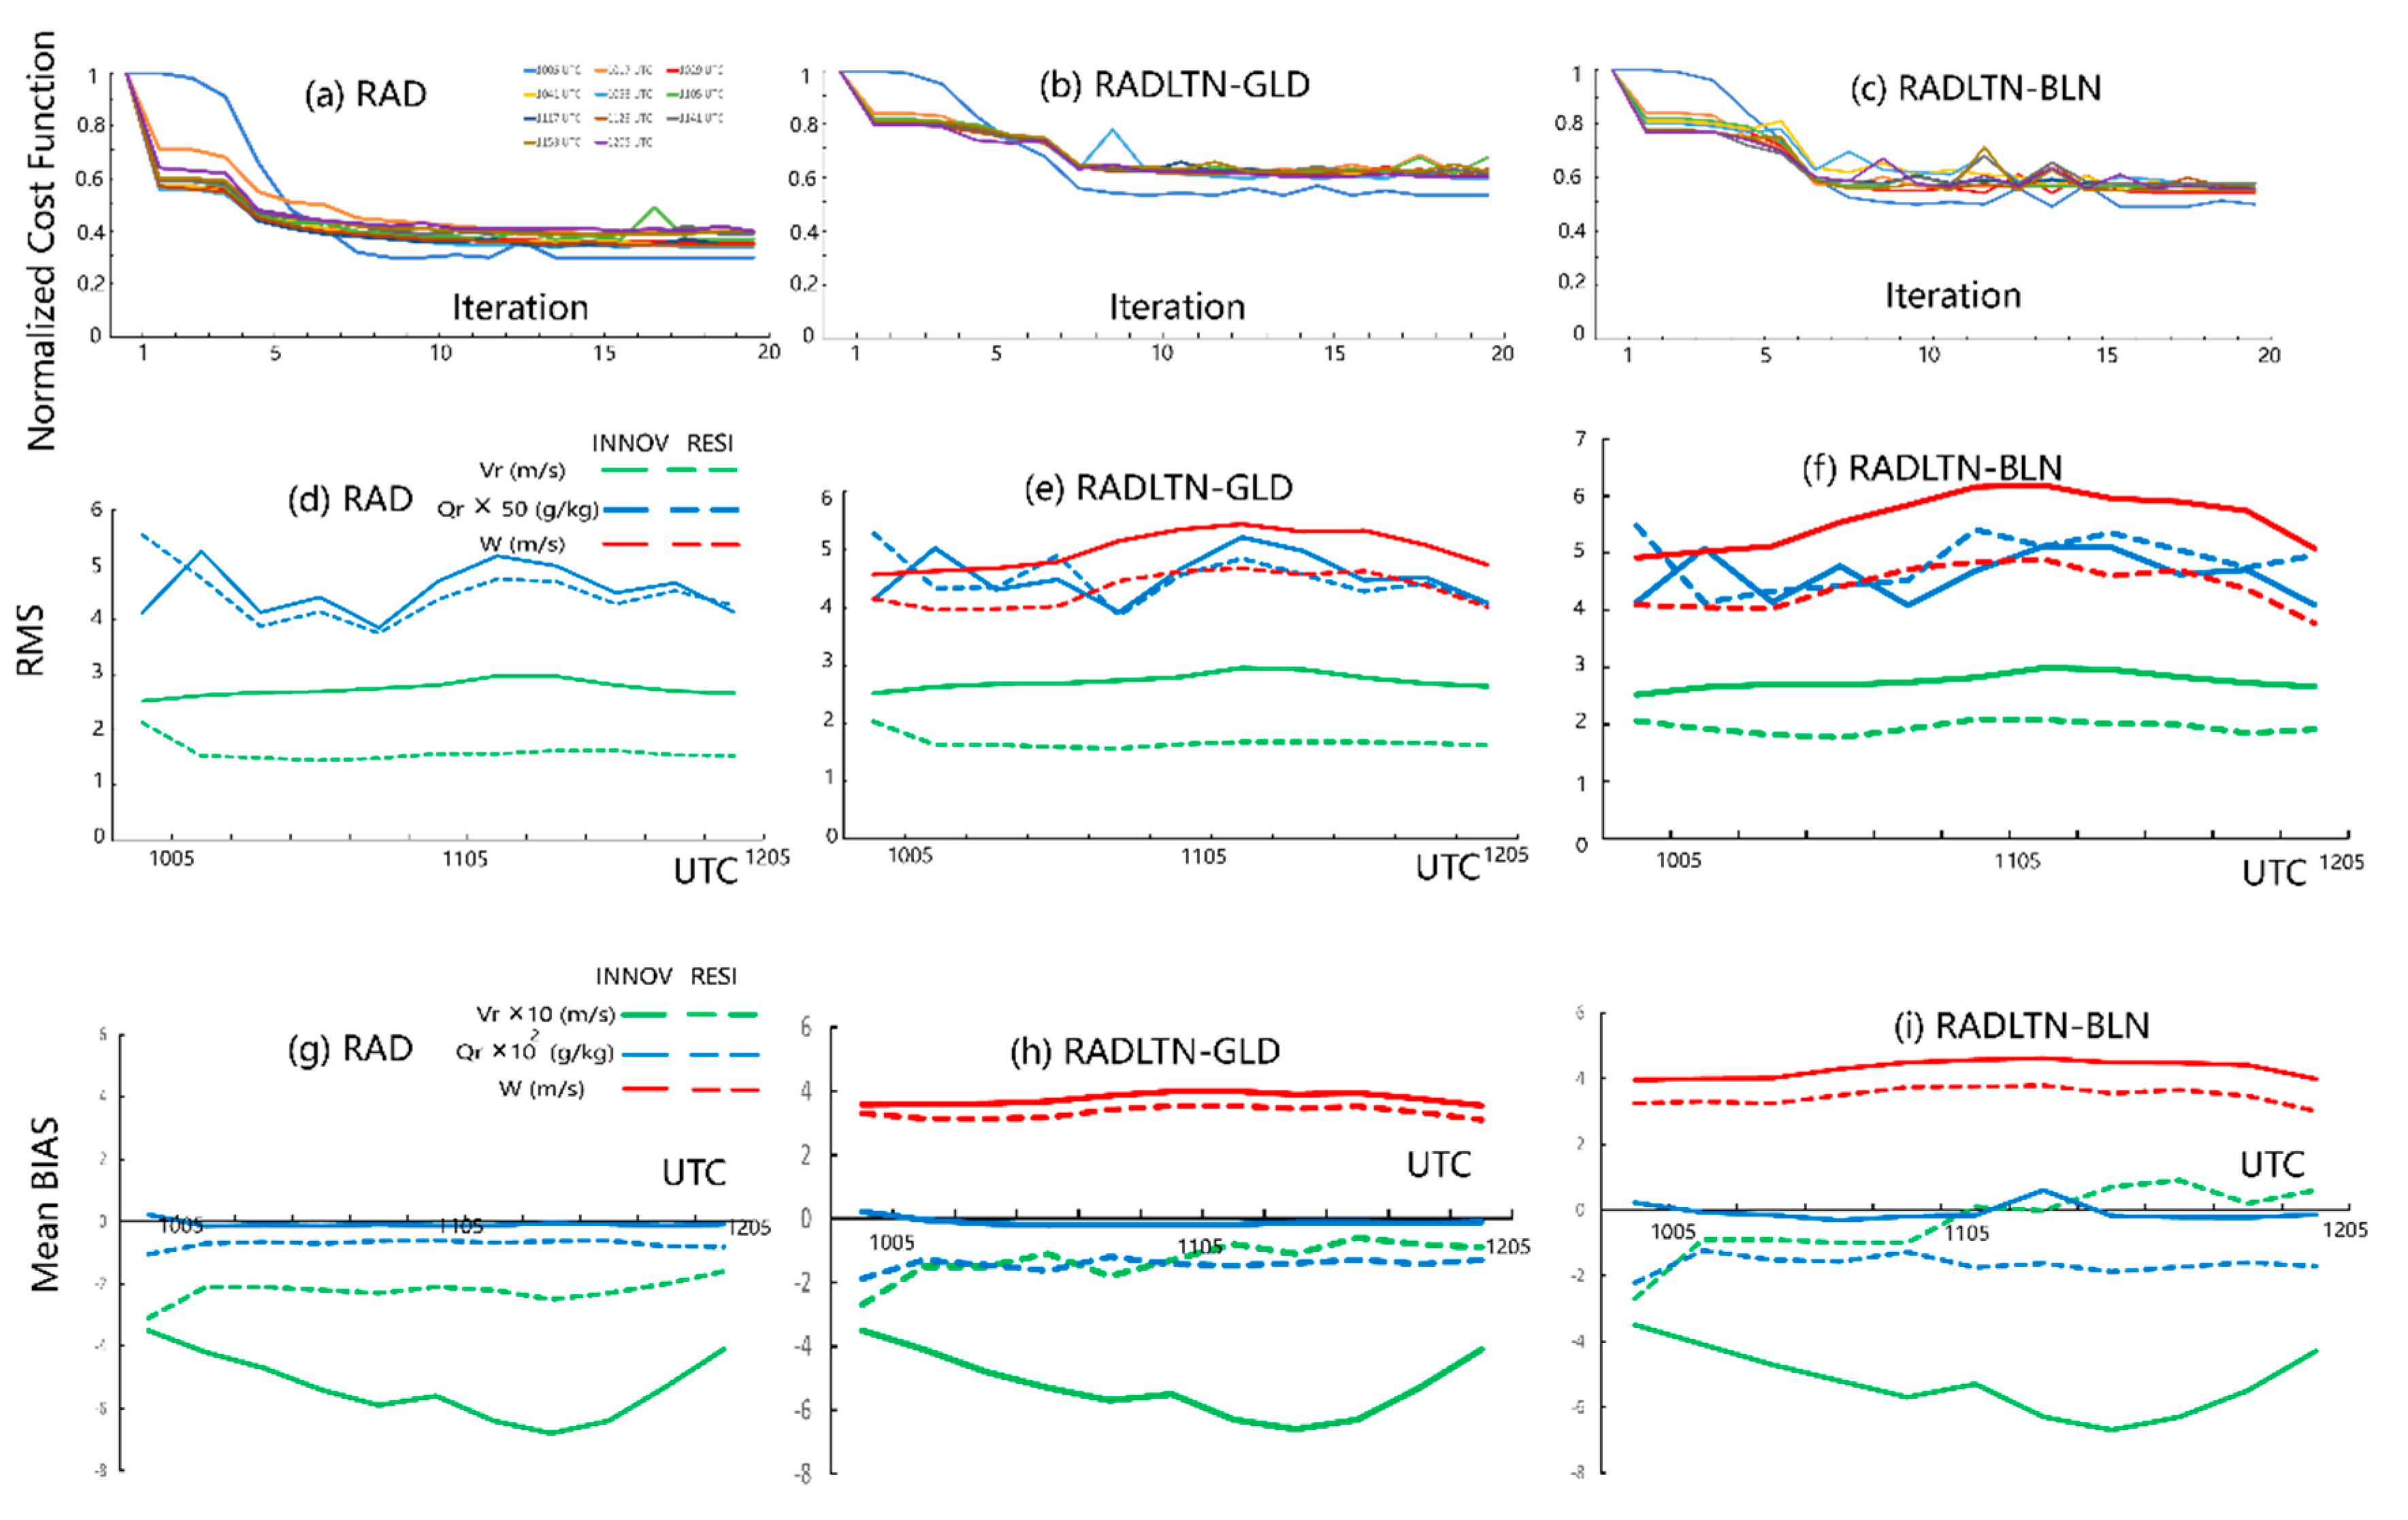
4.4. DA Metrics of 4DVAR Analysis Experiments with Successive Cycling

In this section, we continue to quantitatively evaluate the performance of the LDA in the 4DVAR procedure. Figure 12 is designed to show whether the LDA is done properly such that improves the vertical motion in the analysis field. A scatter plot of the maximum updrafts summated from the whole 11 cycles at the flash locations before and after LDA is shown in Figure 12a. Note that the pseudo-maximum vertical velocity observation along the X-axis is from the BLNET. With the help of LDA, the values of the maximum vertical velocities are much higher than those with the radar-alone experiment. A comparison of the two LDA experiments indicates that the maximum vertical velocities in RADLTN-BLN are enhanced compared with RADLTN-GLD because BLNET captures more lightning activities for both intensity and area. It is also clearly shown that using the assimilation of BLNET lightning data more enhances the linear regression slope (1.01) between the VDRAS analysis and lightning observations RADLTN-BLN, comparing with the value of 0.49 for RAD or 0.85 for RADLTN-GLD.
The profiles of averaged vertical velocity at the lightning activity locations for the three experiments from the whole 11 cycles are shown in Figure 12b. The shapes of the vertical profiles are similar because of the climatological vertical profile used in the LDA scheme and microphysics. The vertical velocities in the two LDA experiments increase from 1.75 to 12.5 km, and the peak is located at nearly 6.5 km. Moreover, the updraft values in BLNET increase much more than those in GLD360, by 300% to 50%. Figure 12c shows the updraft and downdraft averaged from the whole domain in the 11 cycles. The average updrafts are similarly enhanced in the whole domain by >200% for RADLTN-BLN and >55% for RADLTN-GLD compared with RAD, while the downdrafts in the experiments are similar. These comparisons indicate that our LDA scheme could successfully assimilate BLNET lightning data and thus much more increase the updraft from the lowest layer to the high layer in the whole analysis.
Next, the variation in the normalized total cost function (Figure 13a–c), root-mean-square (RMS) (Figure 13d–f), and mean bias (Figure 13g–i) of the innovation and analysis residuals to evaluate the quality and performance of the LDA during the 4DVar cycles from 1105 to 1205 UTC (11 cycles), widely used in recent LDA studies (Fierro et al., 2019, Hu et al., 2020 and X21). The innovation is observation minus background before the first iteration, and the analysis residuals are observation minus analysis after the last iteration.
For the three DA experiments, the total cost functions both undergo a sudden drop during the first eight iterations and reach the lowest after nearly 15~18 iterations. Because the lightning data add many extra observations to be assimilated beyond RAD with the nonlinear relationship between pseudo-updraft and total lightning activities, the cost function reduction scope in the RADLTN-GLD and RADLTN-BLN is distinctly smaller comparing with the RAD experiment (Figure 13b,c). By comparing the two LDAs, the BLNET lightning data with much higher DE is conducive to slightly degrade the total cost function rate by 5%.
The residual values for pseudo-vertical velocity in both RMS and mean bias are much lower than the corresponding values of innovations in the two LDA experiments, indicating that the LDA technique makes the pseudo-vertical velocity in analysis closer to the observations than those in the background, showing that the LDA scheme reasonably well assimilates the lightning observations. The mean bias of innovation and analysis residual for pseudo-velocity are generally positive, showing that overall, the cloud-resolving model could not simulate the strength of the strong updraft in the lightning column. Among the two LDA experiments, the decrease margin of BLNET for both RMS (averaged by 21%) and mean bias (averaged by ~19%) is more than that of GLD (13% and 12%), showing that high DE lightning data more properly adjust the pseudo-vertical motions within lightning columns. For radar radial velocity, the RMS and mean bias of innovation and residuals are not distinctly different among the three experiments and are very close to the observation below 1.7 ms−1 for RMS and 0.15 ms−1 for mean bias, respectively, indicating that the modulating the vertical motion did not change the effect of RDA on radial velocity. However, because the introduced strong velocity from the lightning data may cause the model-simulated convection to be stronger than the actual convection, the RMS and mean bias of the water mixing ratio slightly increase by 0.0015 gkg−1.

5. Sensitivity Test for the BLNET-Based LDA Experiments to the Prespecified Parameters

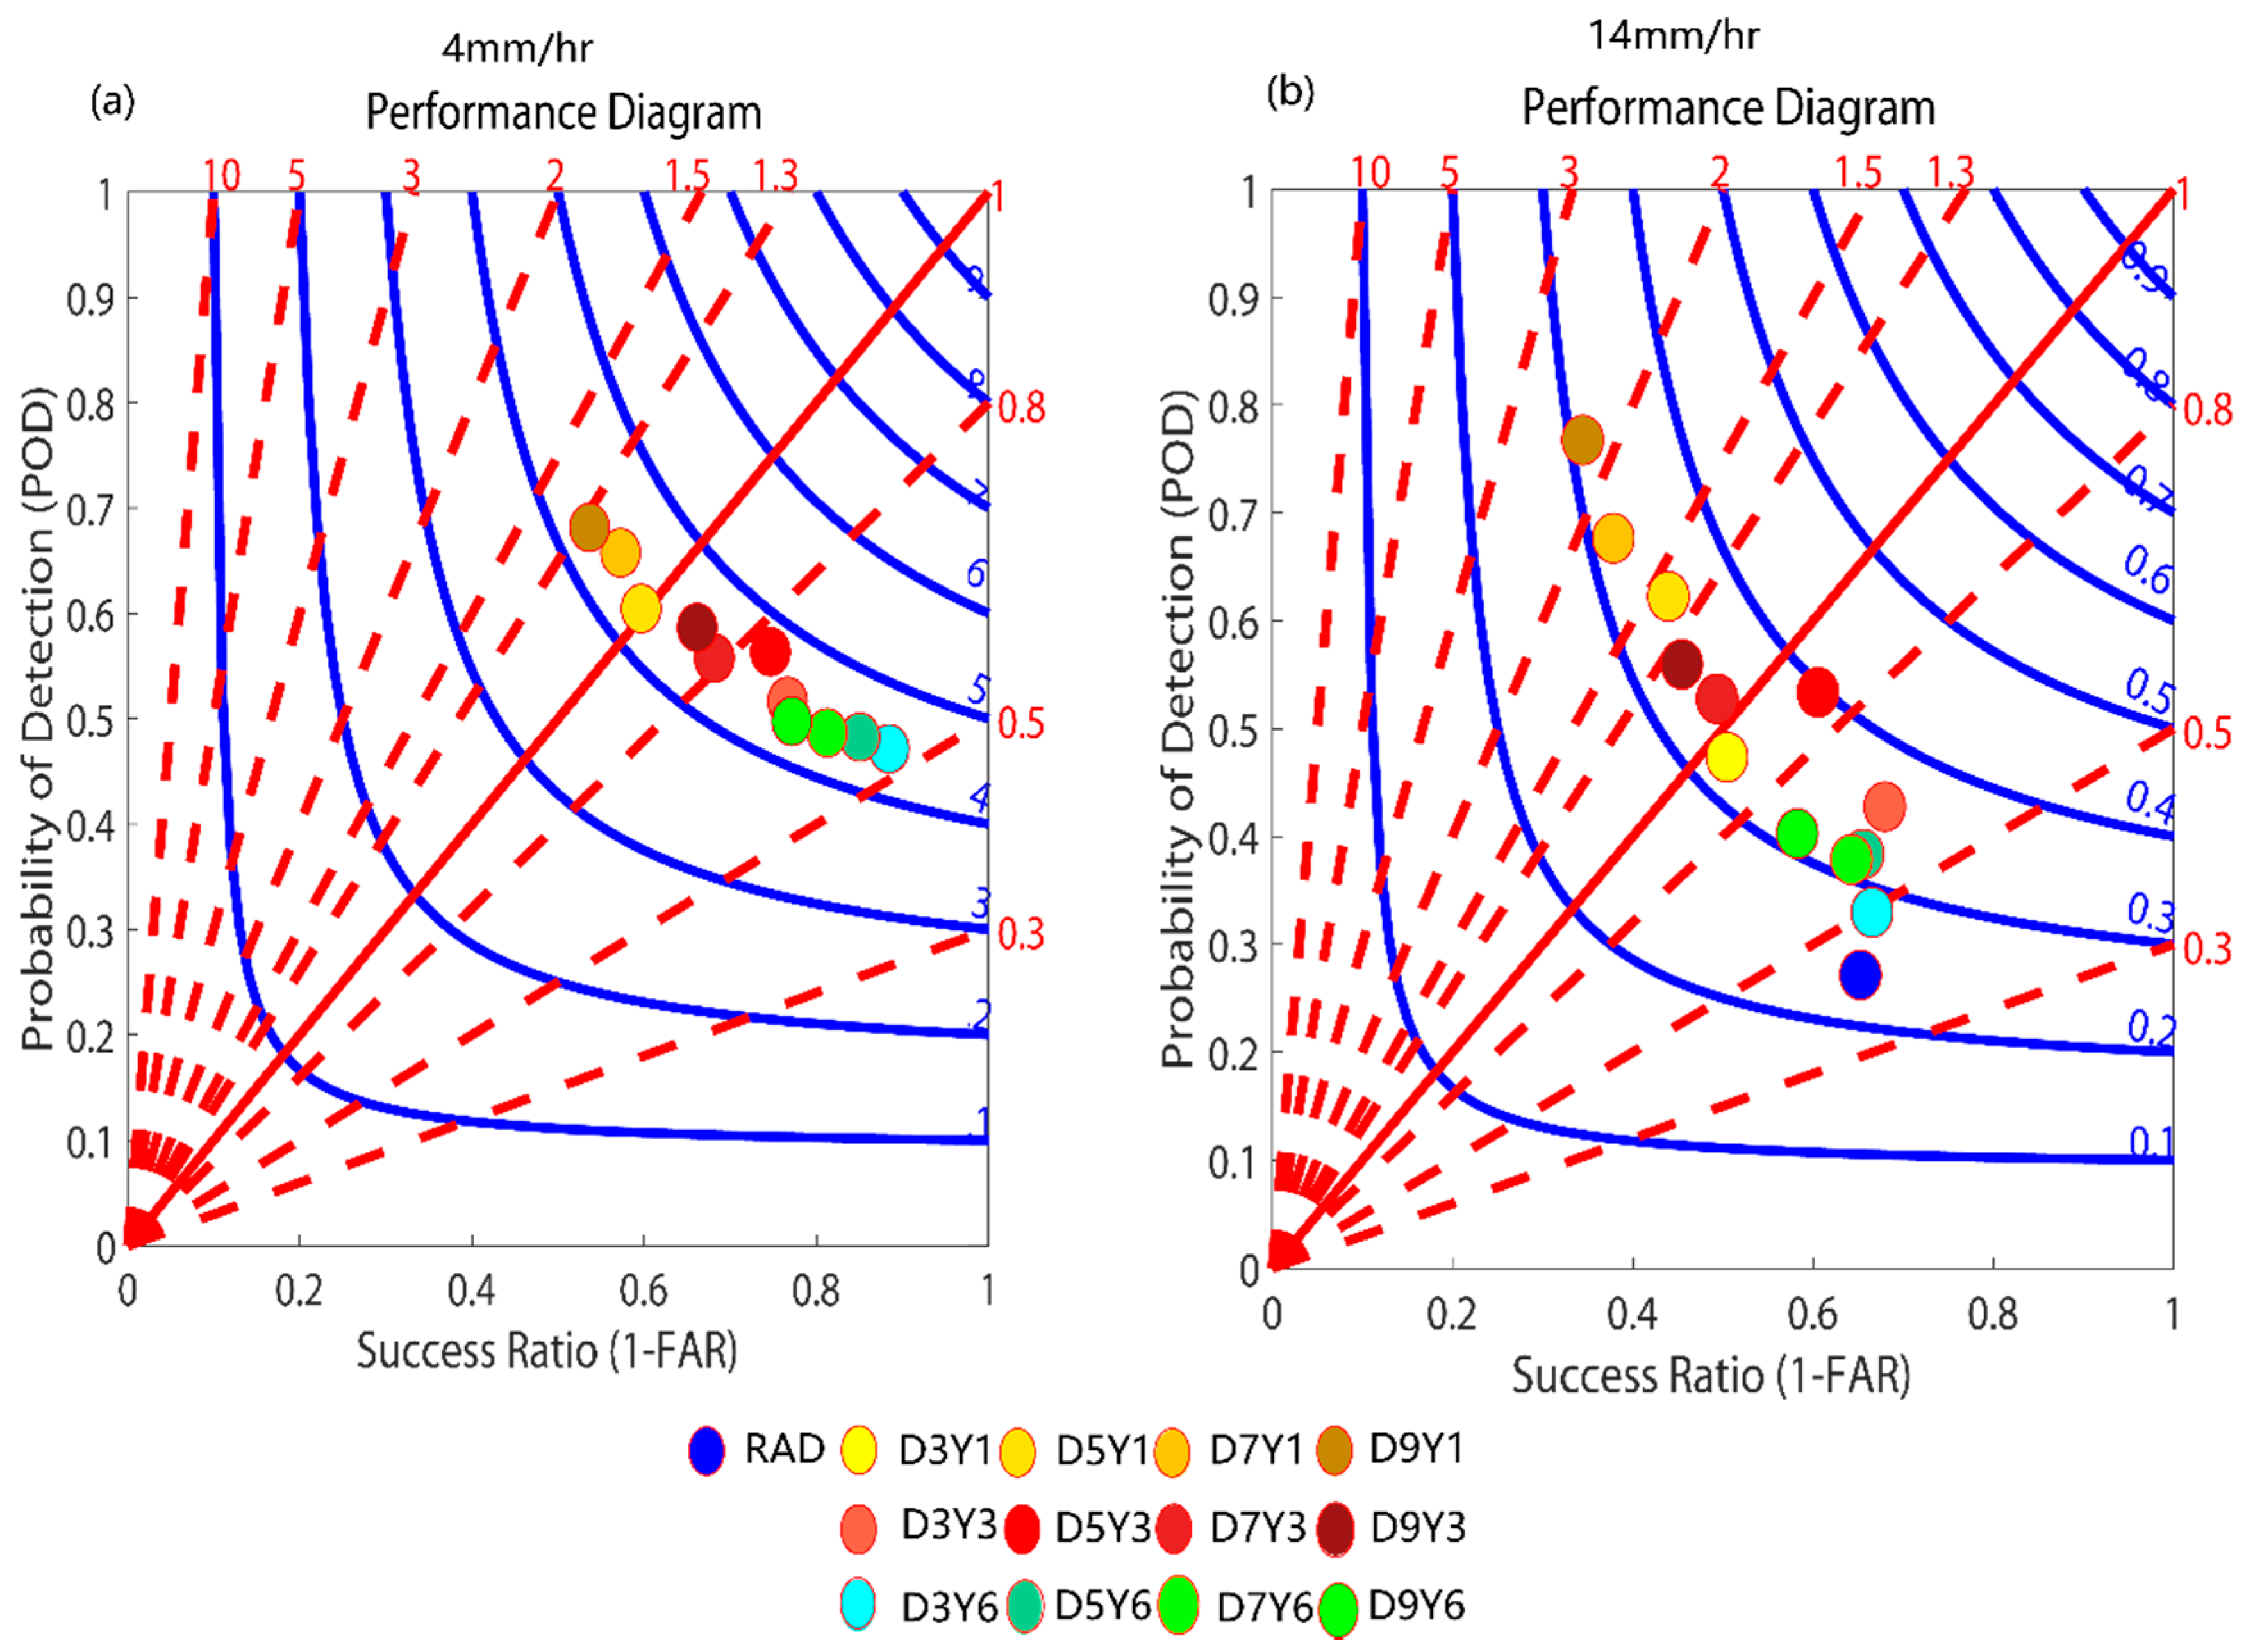
5.1. Sensitivity of LDA to the Frequency of Lightning Data and Horizontal Influence Radius

X21 found that the optimal parameter of the horizontal influence radius was 7 × 7, and the lightning data frequency was 3 min for LDA based on a series of experiments for GLD360. Due to BLNET observations is different lightning data source different from GLD360, using these parameters for BLNET-BLN may not obtain the best performance. Therefore, we conduct 12 experiments that vary the horizontal influence radius (3 × 3, 5 × 5, 7 × 7, and 9 × 9 grids) and the lightning data accumulating interval (1, 3, and 6 min). We named these experiments by D3Y1, D3Y3, D3Y6, D5Y1, D5Y3, D5Y6, D7Y1, D7Y3, D7Y6, D9Y1, D9Y3, and D9Y6, with D as the interpolated influence radius in the grid cells of the averaged squared area and Y is the time interval. For example, D5Y3 is that the lightning data are interpolated across a 5 × 5 grids and that the accumulating time interval of lightning data is 3 min. With a 3 min interval, VDRAS could assimilate 4~5 sets of lightning data in a 4DVar cycle.
Table 2 shows the mean BIAS and ETS from these above experiments averaged over 6 cycles in comparison with RAD. Both of these LDA experiments reduce the absolute value of the mean BIAS and improve ETS. Among them, D9Y1 shows the most improved mean bias, and D5Y3 produces the best ETS. For a given time interval, most experiments with a 5 × 5 grid cell area influence radius can outperform others. When the nowcast skill in the 7 × 7 grid cell is worse than that in the 5 × 5 grid cell area, it is better than 3 × 3 or 9 × 9. For a given grid cell area influence radius, the best results can be obtained in most experiments with a 3 min data binning interval. These results are different from X21, which may be due to the higher DE of BLNET.
Figure 14a,b show the combined scores to totally evaluate these experiments. Although we found all of the LDA experiments produce the better performance for both light rain and heavier rain nowcasting than RAD, D5Y3 produces the best performance (the highest TS) than others, especially for heavy rain (Figure 14b), although it slightly increases for frequency BIAS. So, we think that 3 min binning time of lightning and 5 × 5 grid influence radius are the best settings of LDA for the heavy rain precipitation.

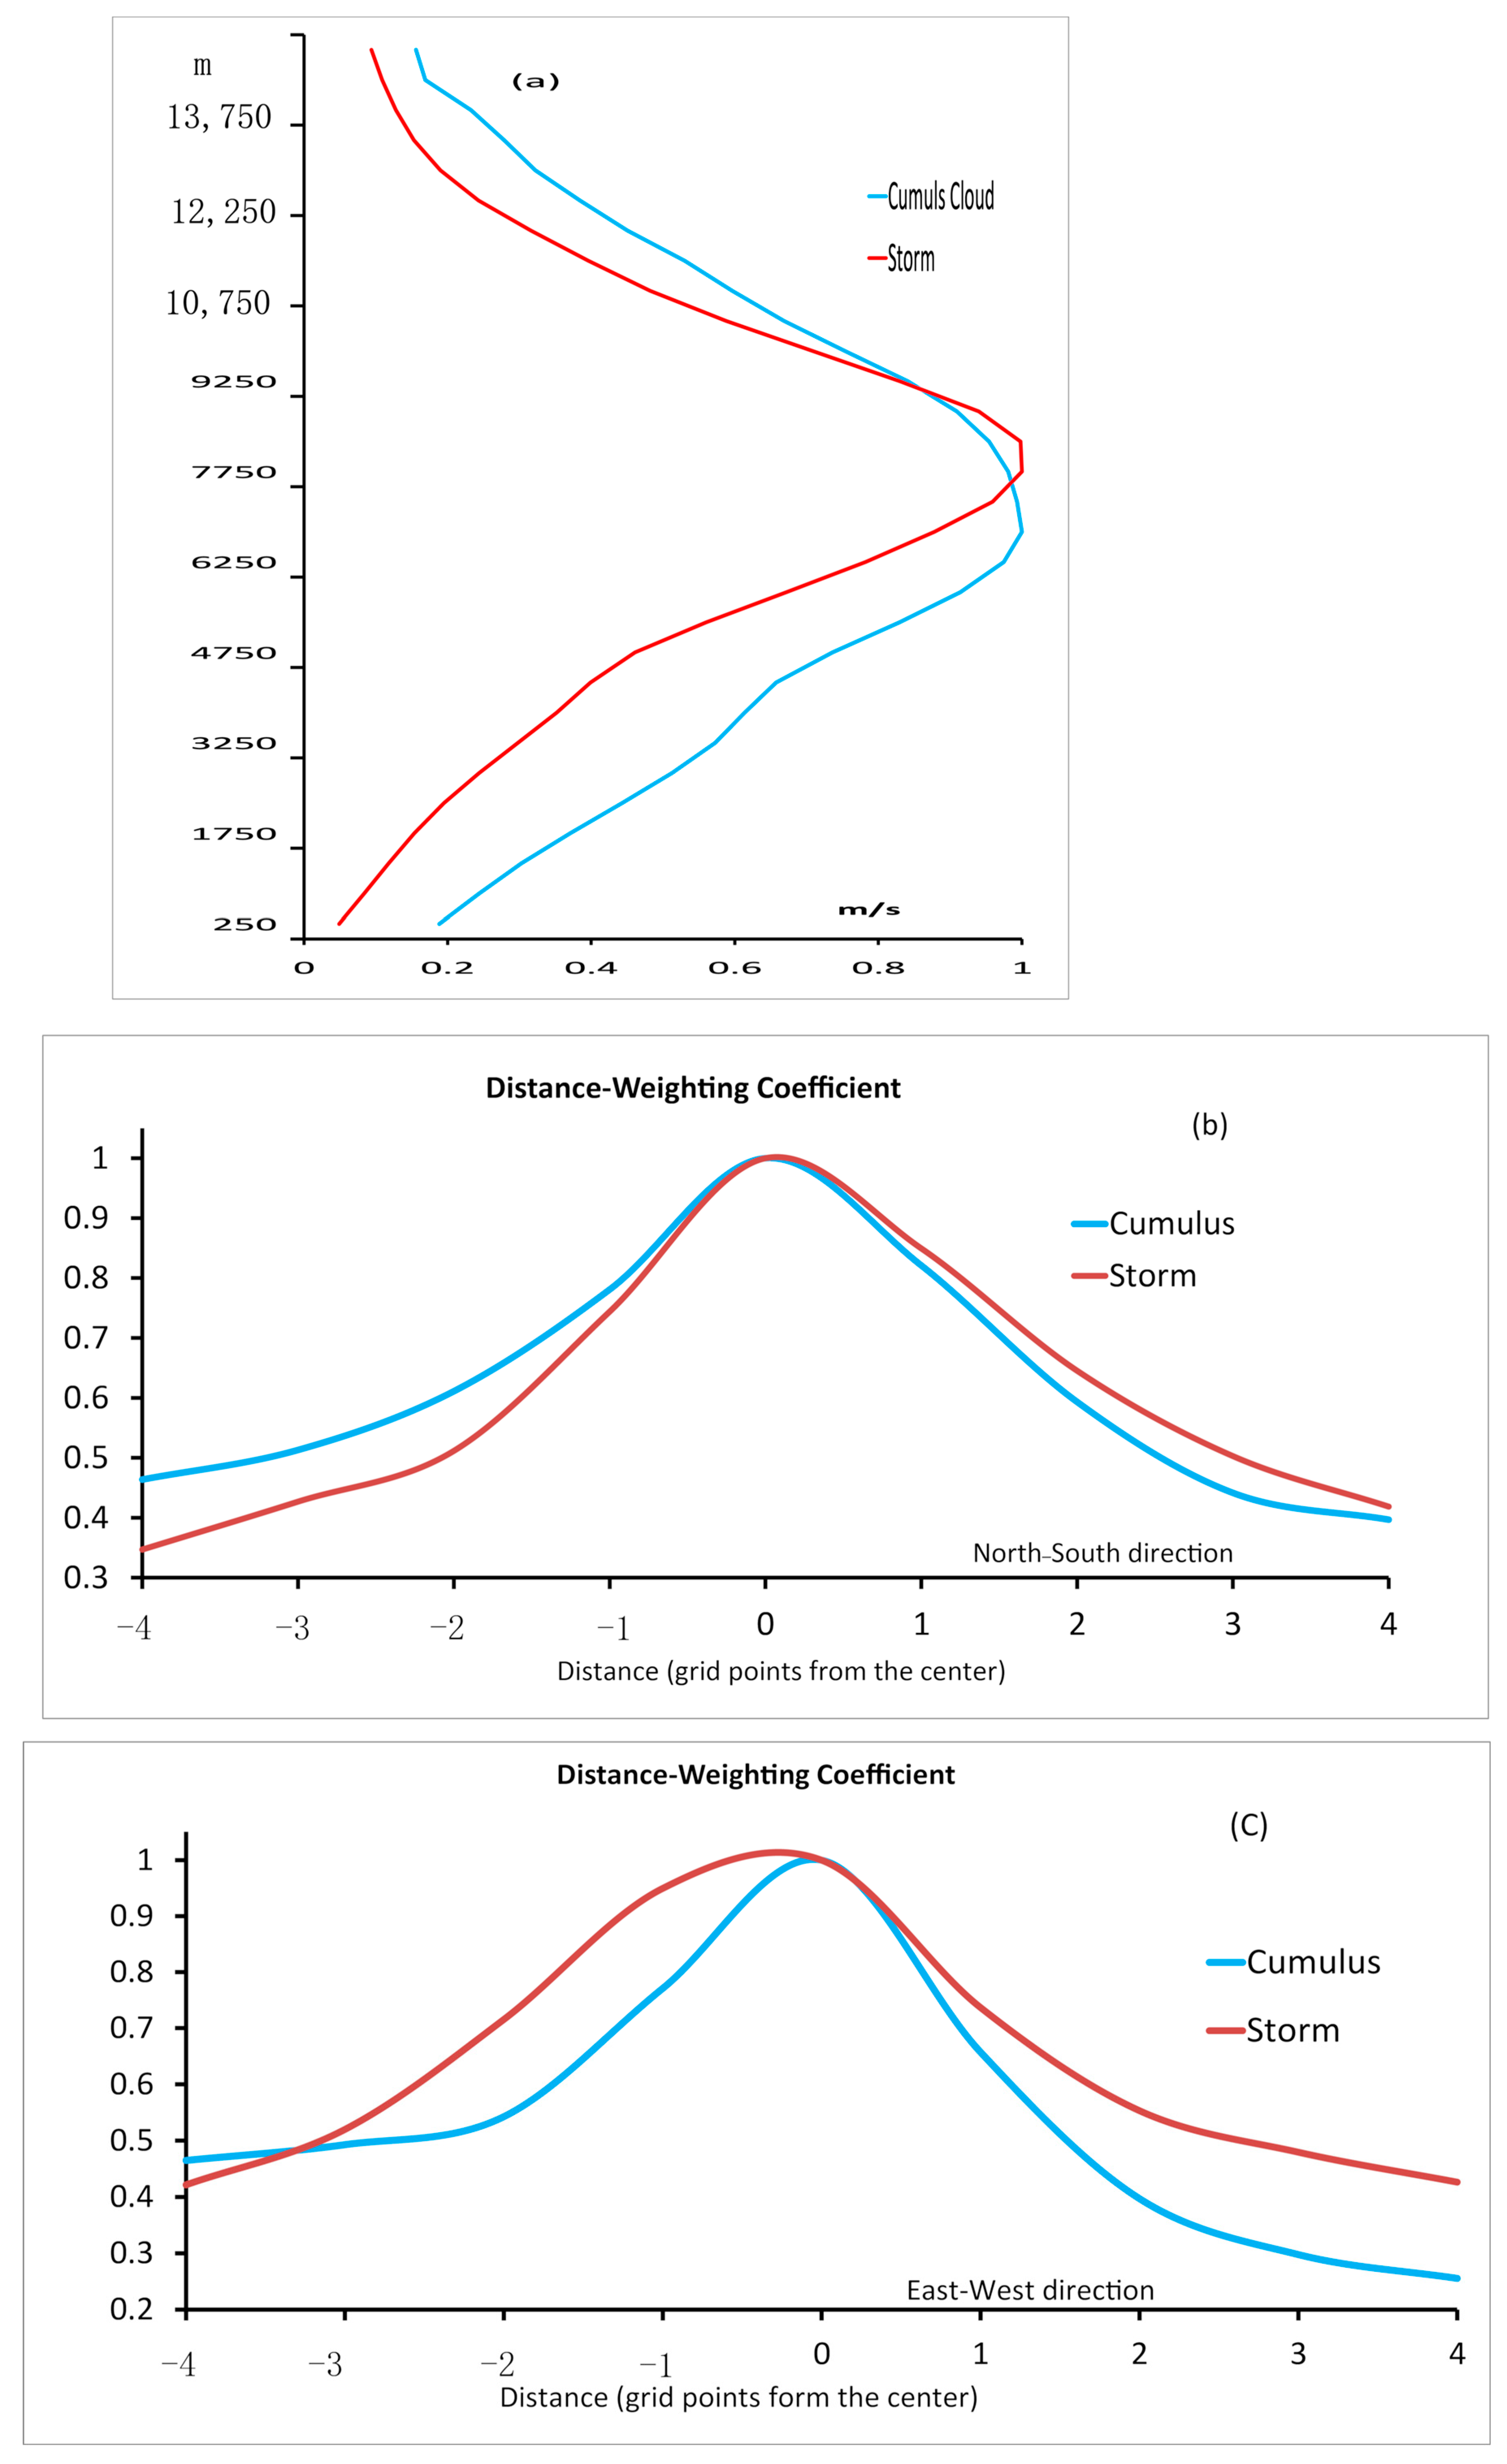
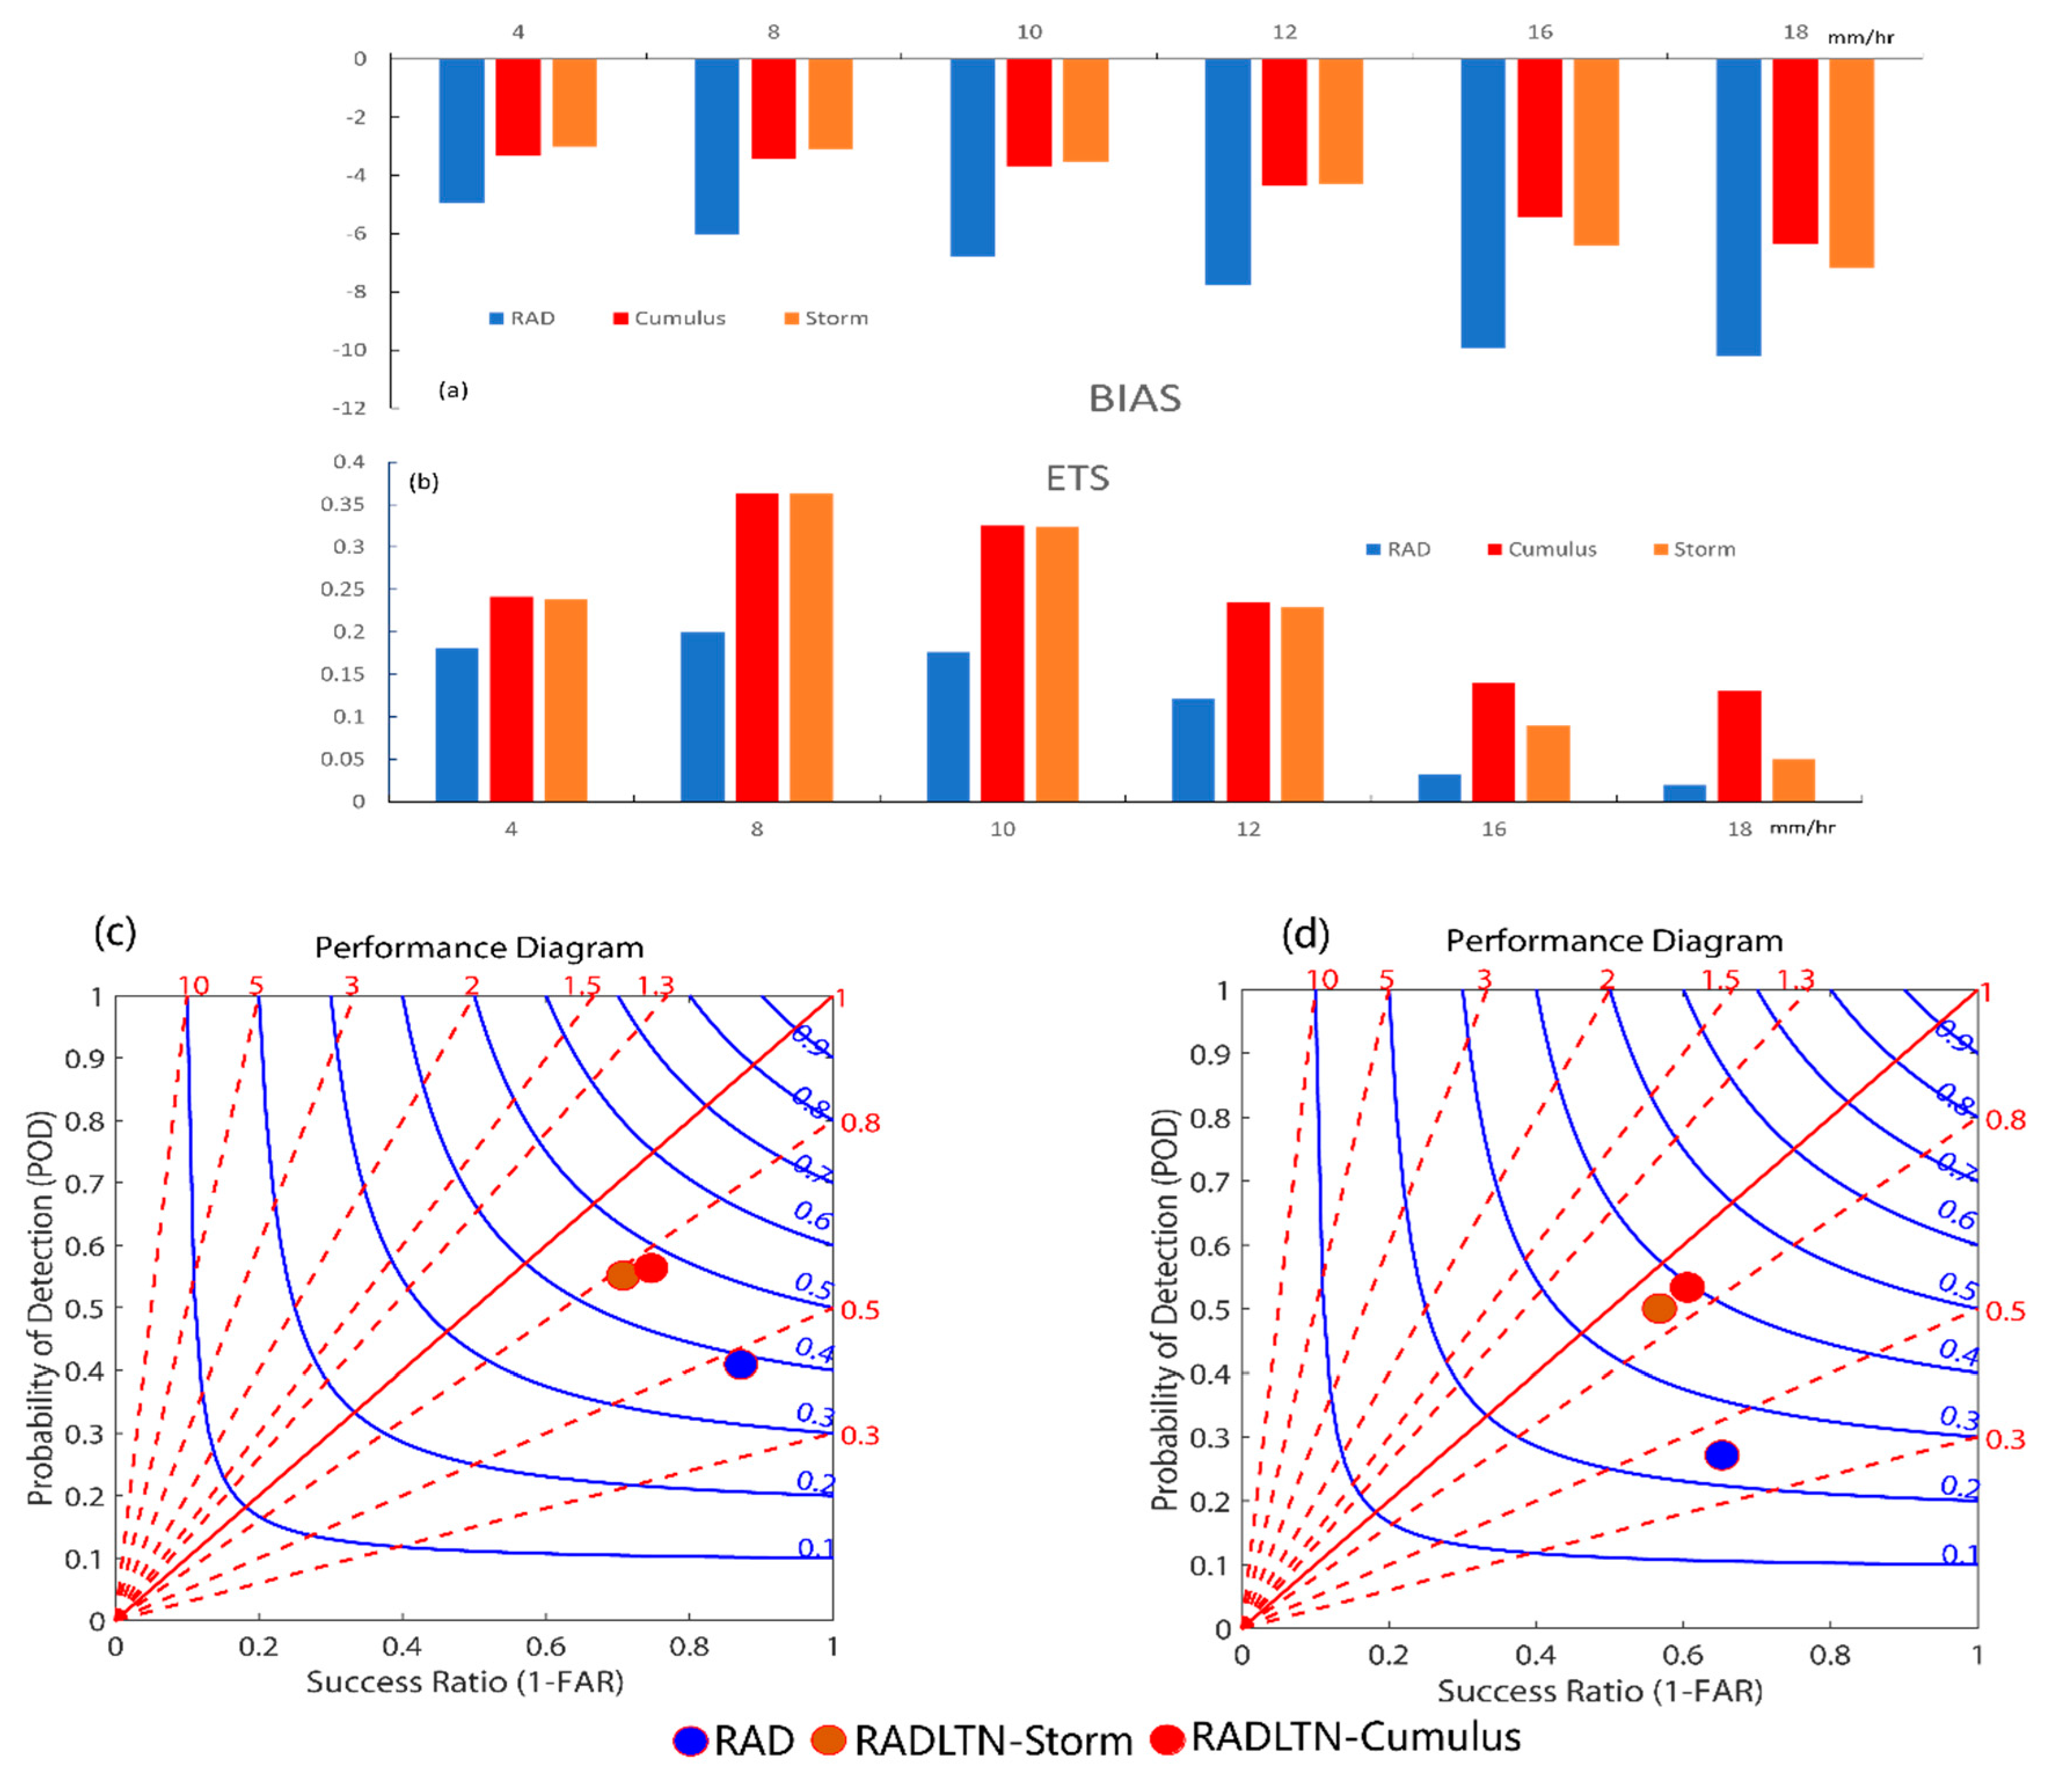
5.2. Sensitivity of LDA to Updraft Motion Profile from Different Cloud Types

We use the climatological vertical profile to obtain pseudo-updraft fields and the horizontal radius to spread the fields horizontally in the mentioned experiments. The vertical profile and horizontal radius are both calculated at the model grids with maximum radar reflectivity > 18 dBZ (corresponding to cumulus clouds). However, the different convective clouds accompanied by different radar reflectivity thresholds (e.g., storm clouds ~40 dBZ) may correspond to different horizontal and vertical distributions. Therefore, we also divide the maximum combined reflectivity factors into two categories: 18 dBZ (representing cumulus) and 40 dBZ (representing storm). According to the previous methods, we obtain the corresponding vertical profile (cumulus and storm) and horizontal radius (cumulus and storm) and determine which one could obtain better performance for LDA. Figure 2 compares the cumulus profile and distance-weight coefficient (blue lines in Figure 2) with those of the storm (red lines in Figure 2). The profile of the cumulus cloud is similar to the profile of the storm, but the maximum vertical motion in the latter is 1 km higher than the other (7750 m vs. 6750 m). Most updrafts of the storm distance-weight coefficient are stronger than those of the cumulus cloud. These results may indicate that the storm profile could represent the dynamic structure at the mature stage of convection. The precipitation mean BIAS and ETS are shown in Figure 15a,b for RAD, RADLTN-Cumulus, and RADLTN-Storm. The performance diagram provides an overall comparison for the two experiments. RADLTN-Cumulus outperforms RADLTN-Storm by only 5% for mean bias, 3–10% for ETS, and 0.06 for TS. We speculate the reason for this slightly better performance is that the cumulus profile and the distance-weight coefficient better represent the whole process of convection and provides more information about the low-level, which is missed by the storm.

6. Summary and Conclusions

This paper sets the basic framework of assimilating lightning data from BLNET in cloud-scale NWP for operational precipitation nowcasts (including lightning data pre-processing and LDA procedure) and evaluates the impact. The basic concept of the LDA scheme to assimilate pseudo-vertical velocities converted from total lightning activities based on X21. High-impact weather that occurred center of Beijing, China, is selected to provide an overall evaluation of the LDA scheme of BLNET lightning data. To set up an optimal configuration for the operational application, serial sensitivity tests were conducted to evaluate the impact of the distance-weighted horizontal interpolation scale, accumulation period for the BLNET data, and varied vertical velocity profiles and distance-weighting coefficients corresponding to different cloud types prior to 4DVAR procedure.
Three experiments, namely, assimilating only radar (RAD), assimilating both radar and lightning data from GLD360 network (RADLTN-GLD), and assimilating both radar and lightning data from the BLNET network (RADLTN-BLN), were carried out. Average nowcast results from different initialed time clearly showed that the combination of assimilating radar and lightning data could both obtain better results than RAD, and the assimilation of BLNET lightning data could improve much more than GLD360 lightning data. Moreover, LDA of BLNET could more accurately describe the detailed evolution of convective systems than RAD or RADLTN-GLD.
We assess the impact of LDA with BLNET lightning data on the initial fields to show how the high DE total lightning observations provide more benefits to the nowcasts. The improvement on the initial fields showed that the assimilation of BLNET lightning data could enhance vertical velocities and low-level convergence and reduce the discrepancy between the model background and observations, compared to assimilating only radar or radar and GLD360 lightning data. Moreover, assimilation of high DE lightning data (BLNET) more clearly depicts the strong convergence zone near convective storms, which is beneficial to forecast the evolution of convection systems.
By examining the variation in DA metrics, the results reveal that the LDA scheme successfully assimilates total lightning activities and radial velocity; however, for the water mixing ratio, the nonlinear correlations between total lightning activities and introduced vertical velocity from lightning data result in less effective assimilation. The high DE lightning data from BLNET, which better pinpoint updraft area and strength, results in more effective assimilated pseudo-velocity compared with low DE data GLD360.
For the sensitivity of LDA for BLNET lightning data with respect to the horizontal interpolation radius and the lightning data frequency on the nowcasting scores, a series of experiments show that different from those in X21 due to different lightning DEs, the 5′5 radius and 3 min accumulation intervals outperform the others.
Sensitivity experiments aimed to test the impact of the vertical velocity profile and distance-weighting coefficient derived from different maximum composite reflectivity thresholds corresponding to different clouds. The results indicate that 18 dBZ (cumulus cloud) produces slightly better forecast performances than 40 dBZ (storm cloud).
In future work, we will continue to conduct a large number of LDA experiments for forecast result verification and will target the complex terrain (mountain, plain and ocean) of North China to determine the suitability and deficiencies of LDA methods. Although our LDA scheme does not adjust moist conditions, spurious convection is also produced in the model. Therefore, some storm suppression methods could be applied to reduce spurious convection [28]. Moreover, more advanced DA schemes, such as the ensemble Kalman filter (EnKF) method and ensemble variational hybrid DA methods for LDA, can be further studied. Studies [13] show that assimilating total lightning data based on the GSI-EnKF technique improves short-term forecasts of deep moist convection. In future studies, the combination of ensemble DA and 4DVAR approaches is worth investigating.

Author Contributions

Formal analysis, Z.C.; Funding acquisition, M.C. (Mingxuan Chen) and M.C. (Min Chen); Methodology, X.Q.; Resources, J.L. and D.W.; Supervision, L.Z.; Validation, L.J. Writing—original draft, X.X. All authors have read and agreed to the published version of the manuscript.

Funding

This research was funded by “the Beijing Natural Science Foundation (Grant 8212026)”, “the National Natural Science Foundation of China (grants 41575050 and 41305041)”, “the China scholarship council (Grants 201605330013)” and “the Beijing Meteorological Bureau Science and Technology Project (BMBKJ201901022)”.

Institutional Review Board Statement

Not applicable.

Informed Consent Statement

Not applicable.

Data Availability Statement

The ground-based total lightning data from Beijing Broadband Lightning Network (BLNET) were collected by Key Laboratory of Middle Atmosphere and Global Environment Observation (LAGEO), Institute of Atmospheric Physics (IAP) of Chinese Academy of Sciences (CAS), and contact Xiushu Qie ([email protected]) for more detailed data.

Acknowledgments

The computing resources used in this study were provided by Beijing Research center for urban Meteorological Engineering and Technology. The authors would like to acknowledge the three anonymous reviewers whose comments helped strengthen the content of this manuscript.

Conflicts of Interest

The authors declare no conflict of interest.

References

  1. Lilly, D.K. Numerical prediction of thunderstorms—Has its time come? Q. J. Roy. Meteor. Soc. 1990, 116, 779–798. [Google Scholar]
  2. Sun, J.; Xue, M.; Wilson, J.W.; Zawadzki, I.; Ballard, S.P.; Onvlee-Hooimeyer, J.; Joe, P.; Barker, D.M.; Li, P.-W.; Golding, B.; et al. Use of NWP for Nowcasting Convective Precipitation: Recent Progress and Challenges. Bull. Am. Meteorol. Soc. 2014, 95, 409–426. [Google Scholar] [CrossRef] [Green Version]
  3. Majumdar, S.J.; Sun, J.; Golding, B.; Joe, P.; Dudhia, J.; Caumont, O.; Gouda, K.C.; Steinle, P.; Vincendon, B.; Wang, J.; et al. Multiscale Forecasting of High-Impact Weather: Current Status and Future Challenges. Bull. Am. Meteorol. Soc. 2021, 102, E635–E659. [Google Scholar] [CrossRef]
  4. Hu, M.; Xue, M. Impact of Configurations of Rapid Intermittent Assimilation of WSR-88D Radar Data for the 8 May 2003 Oklahoma City Tornadic Thunderstorm Case. Mon. Weather Rev. 2007, 135, 507–525. [Google Scholar] [CrossRef] [Green Version]
  5. Weiss, S.A.; MacGorman, D.R.; Calhoun, K.M. Lightning in the Anvils of Supercell Thunderstorms. Mon. Weather Rev. 2012, 140, 2064–2079. [Google Scholar] [CrossRef]
  6. Qie, X.; Zhu, R.; Yuan, T.; Wu, X.; Li, W.; Liu, D. Application of total-lightning data assimilation in a mesoscale convective system based on the WRF model. Atmos. Res. 2014, 145–146, 255–266. [Google Scholar] [CrossRef]
  7. Kong, R.; Xue, M.; Fierro, A.O.; Jung, Y.; Liu, C.; Mansell, E.R.; MacGorman, D.R. Assimilation of GOES-R Geostationary Lightning Mapper Flash Extent Density Data in GSI EnKF for the Analysis and Short-Term Forecast of a Mesoscale Convective System. Mon. Weather Rev. 2020, 148, 2111–2133. [Google Scholar] [CrossRef] [Green Version]
  8. Wang, H.; Liu, Y.; Zhao, T.; Liu, Y.; Xu, M.; Shen, S.; Jiang, Y.; Yang, H.; Feng, S. Continuous Assimilation of Lightning Data Using Time-Lagged Ensembles for a Convection-Allowing Numerical Weather Prediction Model. J. Geophys. Res. Atmos. 2018, 123, 9652–9673. [Google Scholar] [CrossRef]
  9. Pessi, A.; Businger, S. The impact of lightning data assimilation on a winter storm simulation over the North Pacific Ocean. Mon. Weather Rev. 2009, 137, 3177–3195. [Google Scholar] [CrossRef] [Green Version]
  10. Marchand, M.R.; Fuelberg, H.E. Assimilation of Lightning Data Using a Nudging Method Involving Low-Level Warming. Mon. Weather Rev. 2014, 142, 4850–4871. [Google Scholar] [CrossRef]
  11. Papadopoulos, A.; Chronis, T.G.; Anagnostou, E.N. Improving convective precipitation forecasting through assimilation of regional lightning measurements in a mesoscale model. Mon. Weather Rev. 2005, 133, 1961–1977. [Google Scholar] [CrossRef] [Green Version]
  12. Chen, Z.; Sun, J.; Qie, X.; Zhang, Y.; Ying, Z.; Xiao, X.; Cao, D. A Method to Update Model Kinematic States by Assimilating Satellite-Observed Total Lightning Data to Improve Convective Analysis and Forecasting. J. Geophys. Res. Atmos. 2020, 125. [Google Scholar] [CrossRef]
  13. Xiao, X.; Sun, J.; Qie, X.; Ying, Z.; Ji, L.; Chen, M.; Zhang, L. Lightning Data Assimilation Scheme in a 4DVAR System and Its Impact on Very Short-Term Convective Forecasting. Mon. Weather Rev. 2021, 149, 353–373. [Google Scholar] [CrossRef]
  14. Qie, X.; Yuan, S.; Chen, Z.; Wang, D.; Liu, D.; Sun, M.; Sun, Z.; Srivastava, A.; Zhang, H.; Lu, J.; et al. Understanding the dynamical-microphysical-electrical processes associated with severe thunder-storms over the Beijing metropolitan region. Sci. China Earth Sci. 2021, 64, 10–26. [Google Scholar] [CrossRef]
  15. Srivastava, A.; Tian, Y.; Qie, X.; Wang, D.; Sun, Z.; Yuan, S.; Wang, Y.; Chen, Z.; Xu, W.; Zhang, H.; et al. Performance assessment of Beijing Lightning Network (BLNET) and comparison with other lightning location networks across Beijing. Atmos. Res. 2017, 197, 76–83. [Google Scholar] [CrossRef]
  16. Sun, J.; Crook, N.A. Dynamical and Microphysical Retrieval from Doppler Radar Observations Using a Cloud Model and Its Adjoint. Part I: Model Development and Simulated Data Experiments. J. Atmos. Sci. 1997, 54, 1642–1661. [Google Scholar] [CrossRef]
  17. Sun, J.; Chen, M.; Wang, Y. A Frequent-Updating Analysis System Based on Radar, Surface, and Mesoscale Model Data for the Beijing 2008 Forecast Demonstration Project. Weather Forecast. 2010, 25, 1715–1735. [Google Scholar] [CrossRef]
  18. Chang, S.-F.; Liou, Y.-C.; Sun, J.; Tai, S.-L. The Implementation of the Ice-Phase Microphysical Process into a Four-Dimensional Variational Doppler Radar Analysis System (VDRAS) and Its Impact on Parameter Retrieval and Quantitative Precipitation Nowcasting. J. Atmos. Sci. 2016, 73, 1015–1038. [Google Scholar] [CrossRef]
  19. Barthe, C.; Deierling, W.; Barth, M.C. Estimation of total lightning from various storm parameters: A cloud-resolving model study. J. Geophys. Res. Space Phys. 2010, 115. [Google Scholar] [CrossRef]
  20. Yuter, S.E.; Houze, R.A. Three-dimensional kinematic and microphysical evolution of Florida cumulonimbus. Part II: Frequency distributions of vertical velocity, reflectivity, and differential reflectivity. Mon. Weather Rev. 1995, 123, 1921–1940. [Google Scholar] [CrossRef] [Green Version]
  21. Wang, Y.; Qie, X.; Wang, D.; Liu, M. Beijing Lightning Network (BLNET): A research and operational system for com-prehensive lightning detection. Atmos. Res. 2016, 171, 121–132. [Google Scholar] [CrossRef]
  22. Rudlosky, S.D.; Peterson, M.J.; Kahn, D.T. GLD360 Performance Relative to TRMM LIS. J. Atmos. Ocean. Technol. 2017, 34, 1307–1322. [Google Scholar] [CrossRef]
  23. Lu, J.; Qie, X.; Jiang, R.; Xiao, X.; Liu, D.; Li, J.; Wang, D.; Yuan, S.; Chen, Z.; Tian, Y.; et al. Lightning activity during con-vective cell mergers in a squall line and corresponding dynamical and thermodynamical characteristics. Atmos. Res. 2021, 256, 105555. [Google Scholar] [CrossRef]
  24. Wilson, J.W.; Crook, N.A.; Mueller, C.K.; Sun, J.; Dixon, M. Nowcasting Thunderstorms: A Status Report. Bull. Am. Meteorol. Soc. 1998, 79, 2079–2099. [Google Scholar] [CrossRef]
  25. Schaefer, T. The critical success index as an indicator of warning skill. Weather Forecast. 1990, 5, 570–575. [Google Scholar] [CrossRef] [Green Version]
  26. Roebber, P.J. Visualizing Multiple Measures of Forecast Quality. Weather Forecast. 2009, 24, 601–608. [Google Scholar] [CrossRef] [Green Version]
  27. Rotunno, R.; Klemp, J.B.; Weisman, M.L. A theory for strong, long-lived squall line. J. Atmos. Sci. 1988, 45, 463–485. [Google Scholar] [CrossRef] [Green Version]
  28. Gao, S.; Sun, J.; Min, J.; Zhang, Y.; Ying, Z. A scheme to assimilate “no rain” observations from Doppler radar. Weather Forecast. 2018, 33, 71–88. [Google Scholar] [CrossRef]
Figure 1. (a) Surface elevation (shading; units: m) around the study area in s North China. The solid red rectangle is the VDRAS reanalysis domain (450 km × 450 km) and the domain of the lightning observations and case study. The seven radar sites of the operational CINRAD network are indicated (+ symbols) with the letter B standing for radar BJRS in Beijing, T for TJRS in Tianjin, S for SJZRS in Shijiazhuang, Z for ZBRC Zhangbei, C for CDRC in Chengde, CZ for CZRS in Changzhou and Q for QHDRS in Qinhuangdao. Provincial borders are shown by black lines and the cities of Beijing and Tianjin are indicated by orange and red lines, respectively. The radar observation range is also indicated by the dashed circles. (b) Horizontal error by Monte Carlo simulation of 16 sites of BLNet (black dots) at 5 km height. The pink stars represent the Beijing and Tianjin S-Band radars (BJRS, TJRS) (Lu et al., 2021).
Remotesensing 13 02084 g001
Figure 2. (a) Normalized mean vertical velocity profile, and normalized mean horizontal weighting coefficient from the center of a grid point to its surrounding grid points in the (b) north–south direction and (c) east–west direction, for cumulus (bule) and storm (red), respectively.
Remotesensing 13 02084 g002
Figure 3. Raw flash locations (black shading) with radar echo areas > 18 dBZ (green contours) and >40 dBZ (red contours) for GLD360 (a) and BLNET (b), respectively; and the spatially interpolated flash field (flashes/min) with 21 km radius of influence for GLD360. (c) Radar reflectivity mosaic (z = 3.25 km; shading; units: dBZ) (d) and BLNET (e), respectively.
Remotesensing 13 02084 g003
Figure 4. Evolution of the MCS on 7 August 2015 from 1035 to 1241 UTC: (ad) merged radar reflectivity (shading; units: dBZ) at 2.5 km from the seven CINRAD radars; and (ej) flash locations (black points, BLNET). The borders of Beijing and the coastlines of the Bohai Sea are denoted by orange and purple contours, respectively.
Remotesensing 13 02084 g004
Figure 5. Comparison of total lightning activities summed in the VDRAS domain of Figure 1a from BLNET (orange) or GLD360 (blue) observations.
Remotesensing 13 02084 g005
Figure 6. Illustration of VDRAS assimilation and forecast cycles with a 12-min interval. Cycles 1–5 only perform 4DVAR analyses, whereas cycles 6–11 perform both analyses and 0–2 h forecasts. OBS stands for observations.
Remotesensing 13 02084 g006
Figure 7. Scores of 2h accumulated precipitation forecasts, averaged over six cycles initialized at, 1105, 1117, 1129, 1141, 1153 and 1205 UTC, for (a) mean bias, (b) ETS, for the experiments RAD, RADLTN-GLD and RADLTN-BLN and for Performance Diagram for two thresholds over (c) 4 mm/ h and (d) 14 mm/ h for these experiments. In the Performance Diagram, the red lines represent frequency BIAS and the blue lines are TS (threat score) with values indicated at the ends of the lines, the y-axis is POD, and the x-axis is SR (1-FAR). A perfect forecast would be located at the right upper corner. The blue, red and gold solid circles represent RAD, RADLTN-BLN and RADLTN-GLD, respectively.
Remotesensing 13 02084 g007
Figure 8. (ad) Observed and (ep) predicted radar reflectivity fields (shading; units: dBZ; z = 3.25 km) valid at 1129 (first column), 1141 (second column), 1159 (third column), and 1229 (fourth column) UTC. Results for RAD, RADLTN-GLD, and RADLTN-BLN are shown, respectively, in the second, third, and fourth row. The provincial borders are shown by the black contours and the border of Beijing and the coastlines of the Bohai Sea are indicated by the orange and purple contours.
Remotesensing 13 02084 g008
Figure 9. The 2h accumulated rainfall amount (color shading; units: mm hr−1) from (a) QPE, (b) RAD, (c) RADLTN-GLD, and (d) RADLTN-BLN, initialized at 1129 UTC and valid at 1329 UTC. The red arrows indicate the re-initiated storms, the old storms and the new initiation located in Beijing, respectively. The provincial borders are shown by black contours and the city of Beijing is indicated by the orange contour.
Remotesensing 13 02084 g009
Figure 10. Wind convergence field (shaded, 10−3s−1) and perturbation temperature fields (shaded, °C) overlaid with wind field (black vectors) in the analysis field for the (a,d) RAD, (b,e) RADLTN-GLD, and (c,f) RADLTN-BLN experiments at lowest layer at 1159 UTC.
Remotesensing 13 02084 g010
Figure 11. Latitudinally averaged east–west cross-sections of (ac) vertical velocity (shading; units: m s–1) and hydrometeor mixing ratio (rain + snow; black contours; units: g kg–1), (df) temperature perturbation from the domain mean (°C) overlaid by wind vectors from RAD (a,d), RADLTN-GLD (b,e) and RADLTN-BLN (c,f) and the difference water vapor (shaded; units:g kg−1) and vertical velocity (black contours; units: m s–1) calculated by subtracting RAD from RADLTN-GLD (g) or RADLTN-BLN (h). Flow vectors are from the combination of v wind (y axis) and w wind (z axis).
Remotesensing 13 02084 g011
Figure 12. The scattered plot of maximum vertical velocity from the model analysis versus that derived from lightning flash rate at the lightning locations (a) and the profiles of domain averaged updraft (units, ms−1) over the flash locations (b) and of the average updraft and downdraft over all grid points (units, ms−1) in the whole domain (c) averaged by 11 cycles.
Remotesensing 13 02084 g012
Figure 13. (ac) Normalized total cost function as a function of iteration number for experiments (a) RAD, (b) RADLTN-GLD, and (c) RADLTN-BLN. The cost function curves are color-coded for each 4DVAR cycles following the legends shown in (a). (df) Root-mean square statistics for innovation (observation-minus-background) (solid) and analysis residual (observation-minus-analysis) (dotted) for rain water mixing ratio (gkg−1, blue), vertical velocity (red, ms−1), and radial velocity (grean, ms−1) with respect to analysis/forecast cycle for (d) RAD, (e) RADLTN-GLD, and(f) RADLTN-BLN. (gi) same as (df), but for the mean bias statistics.
Remotesensing 13 02084 g013
Figure 14. As similar as shown in Figure 7c,d Performance Diagram for two thresholds over (a) 4 mm/h and (b) 14 mm/h, but for different RADLTN experiments in Table 2. The blue, yellow, gold, goldenrod, dark goldenrod, tomato, red, firebrick3, firebrick4, cyan, aquamarine, lawngreen and green also represent R3T1, R3T3, R3T6, R5T1, R5T3, R5T6, R7T1, R7T3, R7T6, R9T1, R9T3 and R9T6, respectively.
Remotesensing 13 02084 g014
Figure 15. As similar as Figure 7 (Scores of 2 h accumulated precipitation forecasts (a) mean bias, (b) ETS, for the ex-periments RAD, RADLTN-GLD and RADLTN-BLN and for Performance Diagram for two thresholds over (c) 4 mm/h and (d) 14 mm/h for these experiments), but for RADLTN-Cumulus and RADLTN-Storm experiments. The bule, brown and red represent RAD, RADLTN-Storm and RADLTN-Cumulus, respectively.
Remotesensing 13 02084 g015
Table 1. Description of data assimilation. The left column shows the DA experiments in this study. The middle column describes the DA schemes of the experiments performed here. The right column shows the data assimilated in these experiments.
ExperimentsDescriptionAssimilated Data
RADRadar DARadar
RADLTN-GLDRadar plus lightning DA with climatological vertical profile Radar and lightning (GLD360)
RADLTN-BLNRadar plus lightning DA with climatological vertical profile Radar and lightning (BLNET)
DxFySame as RADLTN, but with different lightning data frequencies (y) and horizontal interpolation radii (x)Radar and lightning (BLNET)
RADLTN-cumulus or stormSame as RADLTN, but climatological vertical profile from different maximum reflectivity thresholds (18 or 40dBZ)Radar and lightning (BLNET)
Table 2. Nowcasting scores of Mean BIAS and ETS averaged over four cycles initialized at 1105, 1117, 1129, 1141, 1153 and 1205.
Test
Rain(mm)
Mean BIAS of Different Experiments
RADD3Y1D3Y3D3Y6D5Y1D5Y3D5Y6D7Y1D7Y3D7Y6D9Y1D9Y3D9Y6
4−4.93−2.92−3.89−4.33−1.69−3.32−4.04−0.71−2.89−3.970.12−2.42−3.72
8−6.02−3.14−4.30−5.03−1.58−3.42−4.50−0.30−2.81−4.420.93−2.60−3.06
10−6.78−3.41−4.57−5.53−1.73−3.68−4.98-0.35−3.07−4.820.97−2.69−4.32
12−7.77−4.06−5.28−6.06−2.00−4.35−5.660.27−3.46−5.460.90−3.58−4.99
16−9.93−7.26−6.69−6.68−2.49−5.42−7.230.49−4.45−6.960.51−5.44−6.48
18−10.2−8.56−7.59−7.14−3.11−6.36−7.88−1.17−5.33−7.550.18−6.85−7.18
Mean ETS of Different Experiments
40.1810.1840.2270.2440.2130.2410.2460.1810.2210.2400.2100.2200.230
80.2000.2800.3330.2810.3140.3630.3010.2980.3380.3000.2790.3300.320
100.1760.2660.3060.2300.2900.3250.2650.2650.2880.2600.2520.2800.260
120.1210.2200.2040.1970.2320.2350.2070.1210.2240.2100.1920.1800.210
160.0320.0970.1280.1610.1220.1390.1200.1100.1160.1300.0980.0800.130
180.0200.0640.0410.0690.0840.1310.1050.0700.1210.0600.0620.0400.060
Note: Boldface and italic fonts denote the best scores for each threshold.
Publisher’s Note: MDPI stays neutral with regard to jurisdictional claims in published maps and institutional affiliations.

