Article

Spatiotemporal Patterns of Urbanization in the Three Most Developed Urban Agglomerations in China Based on Continuous Nighttime Light Data (2000–2018)

1
Institute of Geographic Sciences and Natural Resources Research, Chinese Academy of Sciences, Beijing 100101, China
2
College of Resources and Environment, University of Chinese Academy of Sciences, Beijing 100049, China
3
School of Environmental Science and Engineering, Tianjin University, Tianjin 300354, China
4
State Key Laboratory of Urban and Regional Ecology, Research Centre for Eco-Environmental Sciences, Chinese Academy of Sciences, Beijing 100085, China
5
Department of Urban Planning and Design, The University of Hong Kong, Pokfulam, Hong Kong, China
*
Author to whom correspondence should be addressed.
Remote Sens. 2021, 13(12), 2245; https://0-doi-org.brum.beds.ac.uk/10.3390/rs13122245
Submission received: 29 April 2021 / Revised: 4 June 2021 / Accepted: 6 June 2021 / Published: 8 June 2021

Abstract

:
Urban agglomeration is an advanced spatial form of integrating cities, resulting from the global urbanization of recent decades. Understanding spatiotemporal patterns and evolution is of great importance for improving urban agglomeration management. This study used continuous time-series NTL data from 2000 to 2018 combined with land-use images to investigate the spatiotemporal patterns of urbanization in the three most developed urban agglomerations in China over the past two decades: the Beijing–Tianjin–Hebei urban agglomeration (BTH), the Yangtze River Delta urban agglomeration (YRD), and the Guangdong–Hong Kong–Macao Greater Bay Area (GBA). The NTL intensity indexes, dynamic thresholds, extracted urban areas, and landscape metrics were synthetically used to facilitate the analysis. This study found that the urbanization process in the study areas could be divided into three stages: rapid urbanization in core cities from 2000 to 2010, a fluctuating urbanization process in both core cities and surrounding cities from 2010 to 2015, and stable urbanization, mainly in surrounding cities with a medium size after 2015. Meanwhile, the urbanization level of GBA was higher than that of YRD and BTH. However, with the acceleration of urban development in YRD, the gap in the urbanization level between GBA and YRD narrowed significantly in the third stage. In addition, this study confirmed that the scattered, medium-sized cities in YRD and GBA were more developed than those in BTH. This study showed that continuous NTL data could be effectively applied to monitor the urbanization patterns of urban agglomerations.

Graphical Abstract

1. Introduction

Cities, as the centers of capital, labor, and information, were home to more than 55% of the world’s population in 2018, and this number is expected to reach 68% in 2050 [1]. Measuring spatial urbanization patterns is a crucial task in urbanization studies [2,3]. Angel and Blei [4] proposed the constrained dispersal structure of American cities based on the geographic information of workplaces and commuters. Taubenböck et al. [3] calculated spatial dispersion indexes and concluded that long-term urbanization created compact urban patterns. Under the processes of economic globalization and global urbanization, central cities and their neighbors develop to a specific spatial size with a high population density and continuity in the spatial landscape [5]. Cities, which have strong functional interconnectivity and accessibility, are highly integrated with a compact spatial organization and have gradually led to urban agglomerations [6]. These regions, which result from economic concentration and highly developed urbanized areas, have become the most important geographical unit for economic activities and technological innovations [7,8,9,10]. Compared with individual cities, urbanization processes in the urban agglomerations are more significant and intensified [11,12,13]. Hence, identifying the spatiotemporal patterns and characteristics of urbanization in such agglomerations is important for supporting sustainable development and management.
Based on the fact that cities are brightly lit at night, urban agglomerations can be easily distinguished in nighttime light (NTL) remote sensing images [14]. NTL data from the Defense Meteorological Satellite Program/Operational Linescan System (DMSP/OLS) have provided consistent global time series of night lights since the system’s launch in 1992 [15,16,17]. In 2013, the Visible Infrared Imaging Radiometer Suite sensor, fitted with a specific panchromatic sensor known as the Day/Night Band (VIIRS/DNB), succeeded DMSP/OLS as the monitor of global NTL [18]. Compared with annual land-use data or statistical data, NTL images can provide timely and precise information on the spatial extent of urban areas [14]. In addition, NTL intensity can indicate levels of urbanization, such as economic development and human activity intensity [19]. Hence, these two series of NTL datasets have been intensively used to retrieve data on the spatial and temporal dynamics of urbanization worldwide [20,21,22,23,24,25]. By utilizing multitemporal DMSP/OLS and VIIRS/DNB NTL annual composites, urbanization dynamics were observed in China [26,27,28,29], India [30], Japan [31], South America [32], and at global scales [33,34]. In recent papers, Georg et al. [35] spatially parameterized the characteristics of urban corridors and published a global inventory based on NTL images. Zhou et al. [36] developed a quantile-based approach to map the consistent global urban areas, finding that urban areas reached 0.53% of the world’s land surface area in 2013. Based on DMSP/OLS NTL data, Chen et al. [37] established a bidirectional Markov random field model and support vector machine classifier to extract urban areas and analyzed global urbanization progress from 2000 to 2012. Emerging studies on the development of urban agglomerations using NTL data have been reported in recent years. For example, Zou et al. [38] mapped the expansion in the middle reaches of the Yangtze River in China from 1992 to 2011 using DMSP/OLS data and concluded that, at different spatial scales and across temporal stages, the expansion directions and forms showed fluctuating characteristics of urban extents. Gao et al. [39] used the DMSP/OLS NTL dataset to validate the evolution of three urban agglomerations in China from 1992 to 2015. The result indicated that the city size distribution in the regions became more even, and the ranks of small cities ascended. Peng et al. [6] conducted a study that identified the boundaries of the 23 main urban agglomerations in China from 2000 to 2012 using NTL data. The study classified them as world level, regional level, or sub-regional level, which suggested the effectiveness of the NTL data in exploring the spatiotemporal process of urbanization in urban agglomerations.
Despite the widespread use of NTL data for monitoring spatiotemporal characteristics of the changing world [40,41], the lack of long-term time-series NTL observations limits investigations [42,43]. The existing studies generally focused on the urbanization development from 1992 to 2013 or from 2013 to the present [26,32,36], which was a consequence of the inconsistent temporal coverage of the two products. Although VIIRS/DNB products provide a higher spatial and radiometric resolution [44,45], as well as a wider dynamic range of anthropogenic light emissions [46,47], compared with previous products, the temporal duration is short, which limits its application in decadal observations. In addition, previously published studies mainly used NTL data to identify urban areas, impervious surfaces, and built-up areas [48,49,50,51,52], ignoring the distribution of light intensity and the internal characteristics of urban agglomerations [41].
The Beijing–Tianjin–Hebei (BTH), Yangtze River Delta (YRD), and the Guangdong–Hong Kong–Macao Greater Bay Area (GBA) urban agglomerations are China’s three largest urban agglomerations [39,53] and are the most populated regions in the world [54,55,56]. These three urban agglomerations have all experienced rapid urbanization, a large-scale expansion in urban population, and growth in NTL intensity [6,39,57]. The Chinese government has identified these three regions as large, national-level urban agglomerations, and the most important foci of China’s New-Type Urbanization Plan, which aims to accelerate their development and improve the coordination of city functions within them [5]. Strong economic development in these regions further encourages the government to engage in research on the spatial and temporal patterns of regional rapid urbanization. In general, BTH, YRD, and GBA clearly exemplify the country’s urban agglomerations that have experienced rapid urbanization.
Understanding the evolution of the spatiotemporal urbanization patterns not only provides policy guidance for these three regions but also provides a theoretical basis for urban management and improvements in regional competitiveness for other emerging urban agglomerations where urbanization is still in progress. However, few studies have focused on the spatial patterns of urban agglomeration development in China using long-term NTL images. Hence, based on extended time-series NTL data from 2000 to 2018, the spatiotemporal patterns of rapid urbanization in these three urban agglomerations were analyzed such that policymakers can propose sustainable and targeted strategies.
The objectives of this study were (1) to prolong the temporal range of urban agglomeration studies in China by using a continuous NTL dataset from 2000 to 2018 and (2) to identify the spatial dynamics and temporal evolution of the three most developed urban agglomerations. First, we calculated four NTL-related indexes to analyze the relationship between the NTL data and the level of urbanization, and to further find the metric that is most relevant for determining the internal dynamics of urban development. Second, optimal thresholds were determined for each NTL image to separate urban from non-urban areas for every year and to find threshold variation trends. Finally, a spatial, metrics-based analysis of urban areas that were extracted from the NTL data was conducted to reveal the overall spatiotemporal patterns.

2. Materials and Methods

2.1. Study Area

In our comparative analysis of urbanization spatiotemporal patterns, the three most populous and developed urban agglomerations (i.e., BTH, YRD, and GBA) were selected, as illustrated in Figure 1. These three agglomerations are also known as administrative urban areas, which were proposed by the Chinese government [58]. The total areas of BTH, YRD, and GBA are 218,000 km2, 358,000 km2, and 55,900 km2, respectively. Their core cities are listed in Table 1. They have some similarities, such as a highly developed urbanization level, a megacity as the economic center, large populations, and a large GDP (Table 1). From 2000 to 2018, the residential populations increased from 90.26, 195.53, and 49.99 million to 107.57, 225.36, and 71.09 million, with GDP from 124.06, 271.66, and 307.91 billion USD to 1282.67, 3195.81, and 1653.96 billion USD, accounting for 9.23%, 23.00%, and 11.90% of the total GDP of China at the end of 2018 for BTH, YRD, and GBA, respectively. However, the development targets of these three agglomerations are significantly different due to their different population densities, political orientations, and economic conditions. In the future, BTH aims to be the most innovative region in China, with YRD and GBA as the pioneers of China’s economic reform and with an opening-up policy that aims to make them the most competitive urban agglomerations at the global scale.

2.2. Data Collection

This study used the extended time series (2000–2018) of the annual NTL images produced by Chen et al. [59]. This dataset, which presented good accuracy and temporal consistency, was generated using a modified auto-encoder model and a cross-sensor calibration model with two datasets: DMSP/OLS data (2000–2012) and composited monthly NPP/VIIRS data (2013–2018). The data, with a spatial resolution of 15 arc-seconds (approximately 500 m near the equator), using the unit of nW·cm−2·sr−1, include stable night light from urban areas and towns. The instantaneous light caused by transient events, such as forest fires, was filtered. In addition, global land-use/cover data from 2000 to 2018, which were provided by the European Space Agency (ESA) Climate Change Initiative Land Cover (CCI-LC) dataset with a finer resolution of 300 m, was further used to identify local optimized thresholds as ancillary data in the study [60] due to its high overall accuracy among seven datasets of global land cover China [61]. All the remote sensing data were preprocessed to the Albers equal-area conic projection.

2.3. Methodology

The technical approaches used in this study can be broken down into three steps. First, an optimal NTL index was constructed based on the extended time-series NTL images to depict the urbanization level in each year of each urban agglomeration. Second, optimal NTL thresholds were determined using the ancillary data to accurately extract the urban areas. Finally, the evolution patterns of urban development were analyzed based on the NTL intensity.

2.3.1. Construction of an Optimal Nighttime Light Index

The variations in NTL intensity and lit areas can help to identify important characteristics of different urbanization stages. NTL intensity is a widely used indicator to estimate urban development, and a larger NTL intensity usually represents a greater level of development [62]. Lit areas, which are used for extracting urban areas, are well documented in mapping urbanization processes [14]. Compared with only using lit-area metrics, the index combining both NTL intensity and area, on the one hand, can reflect more detailed spatiotemporal patterns of rapid urbanization. On the other hand, an optimal index from remote sensing images can overcome the lag of statistical data and can be quickly obtained at the microscale. Therefore, the construction of an NTL index is an important link in the study of urbanization processes. To find an optimal index, this study first calculated four widely used indexes, of which the effectiveness has been shown in monitoring urbanization processes and urban expansion in China [58,63,64,65]. The correlations between these four NTL indexes and the economy, population, and land use of the three urban agglomerations were analyzed to determine the optimal index for analyzing the spatiotemporal patterns of the study areas. The first index was the luminous area, which is defined as the pixels with an NTL intensity larger than 0 nW·cm−2·sr−1. The second index was the average NTL intensity index NTLAI:
N T L A I = r = min max r × n r N
where r denotes the radiance of the pixels, nr is the number of pixels with radiance r, and N is the total number of pixels in one image. This index took both light areas and intensity into account to indicate the urban internal characteristics.
The third index was the total NTL index:
N T L T I = r = min max r × n r
where NTLTI is the total NTL intensity of one image, r denotes the radiance of the pixels, and nr is the number of pixels with radiance r.
The fourth index was a composited NTL index (CNLI), which was proposed by Zhuo et al. [65]:
C N L I = r = min max r R max × n r N
where r is the radiance of the pixels, Rmax is the maximum radiance of the image, nr is the number of pixels with radiance r, and N is the total number of pixels in one image.
After obtaining these four indexes, a Pearson correlation matrix was then established to examine the strengths of the bivariate associations between the indexes and statistical data, including economic levels, populations, and land uses.

2.3.2. Extracting Urban Areas by Determining Dynamic Thresholds of the NTL Image

Previous studies have proposed many approaches to separate urban areas from their background, such as Markov random field model [37], quantile-based approach [36], fully convolutional network [66], and support-vector-machine-based region [67]. This study used dynamic thresholds to extract urban areas for two reasons. First, dynamic thresholds do not ignore small cities or overestimate actual urban areas. Second, the variations in these thresholds indicate spatiotemporal changes in the urbanization level of the study areas.
For determining dynamic thresholds, this study integrated NTL images with CCI-LC land-use data. By comparing the total area of pixels with a radiance larger than i-class and the area extracted from land-use data, optimal thresholds for each NTL image were found when the difference reached a minimum value, as illustrated in Figure 2, where NImax and NImin are the maximum and minimum values of the NTL intensity, and their initial values are derived from the NTL image, NIT is the threshold for the specific NTL image, NIT-1 represents the value of NTL intensity that is the closest but smaller than NIT, and NIT+1 represents the value of NTL intensity that is the closest but larger than NIT, S(NIT) denotes the urban areas extracted from the NTL image using the threshold NIT, Area is the actual urban area derived from the CCI-LC land-use data, and ΔS represents the discrepancies between urban areas extracted using threshold NIT and Area values. The equation indicates that only when the threshold is NIT can the discrepancy reach the minimum value.
After determining the thresholds, the urban area can be extracted. Considering that the land-use change within a single year was slight, we mapped the urban area with a five-year temporal interval, which is appropriate for monitoring urban expansion [68].

2.3.3. Evolution Patterns of Urbanization

The standard deviation ellipse (SDE) is an effective method for measuring the general trend and pattern of a changing phenomenon [69]. A change in the SDE can represent the evolution patterns of a discrete urban area, such as the change in gravity center, distribution range, density, direction, and shape, over the last two decades. The average center of the image extracted in Section 2.3.2 was a starting point to calculate one standard deviation of the x- and y-coordinates, and the long axis and the short axis of the ellipse were then defined [56]. The SDE was calculated using
S D E X = i = 1 n ( x i X ¯ ) 2 n   and   S D E y = i = 1 n ( y i Y ¯ ) 2 n
The center of the ellipse represents the relative position of the barycenter for the spatial distribution of urban areas, the long and short axes denote the dispersion degree of the two directions of the element, and the area of the ellipse represents the concentration degree of the spatial distribution of urban areas.
The intensity and compactness of urbanization development were measured using a relative expansion rate and cohesion metric, respectively. The relative expansion rate refers to the standardization of the average annual expansion rate of the urban areas in the three urban agglomerations, where this has been used to effectively quantify urbanization development [70,71]. The cohesion index is a measure of the compactness of an urban area [72,73], which increases as a patch becomes more clumped or aggregated in its spatial distribution.
R i = A i A i 1 A i 1 × 100 %
C = ( 1 j = 1 n p i j j = 1 n p i j × a i j ) × ( 1 1 N ) × 100
where Ri is the relative expansion rate of the urban area, i is the year, j is the serial number of the patch, Ai and Ai-1 are the area values of the urban patches in year i and i-1, pij is the perimeter of patch ij, aij is the area of patch ij, and N is the number of patches in the landscape. This class-level index was calculated using FRAGSTATS v4.2.

3. Results

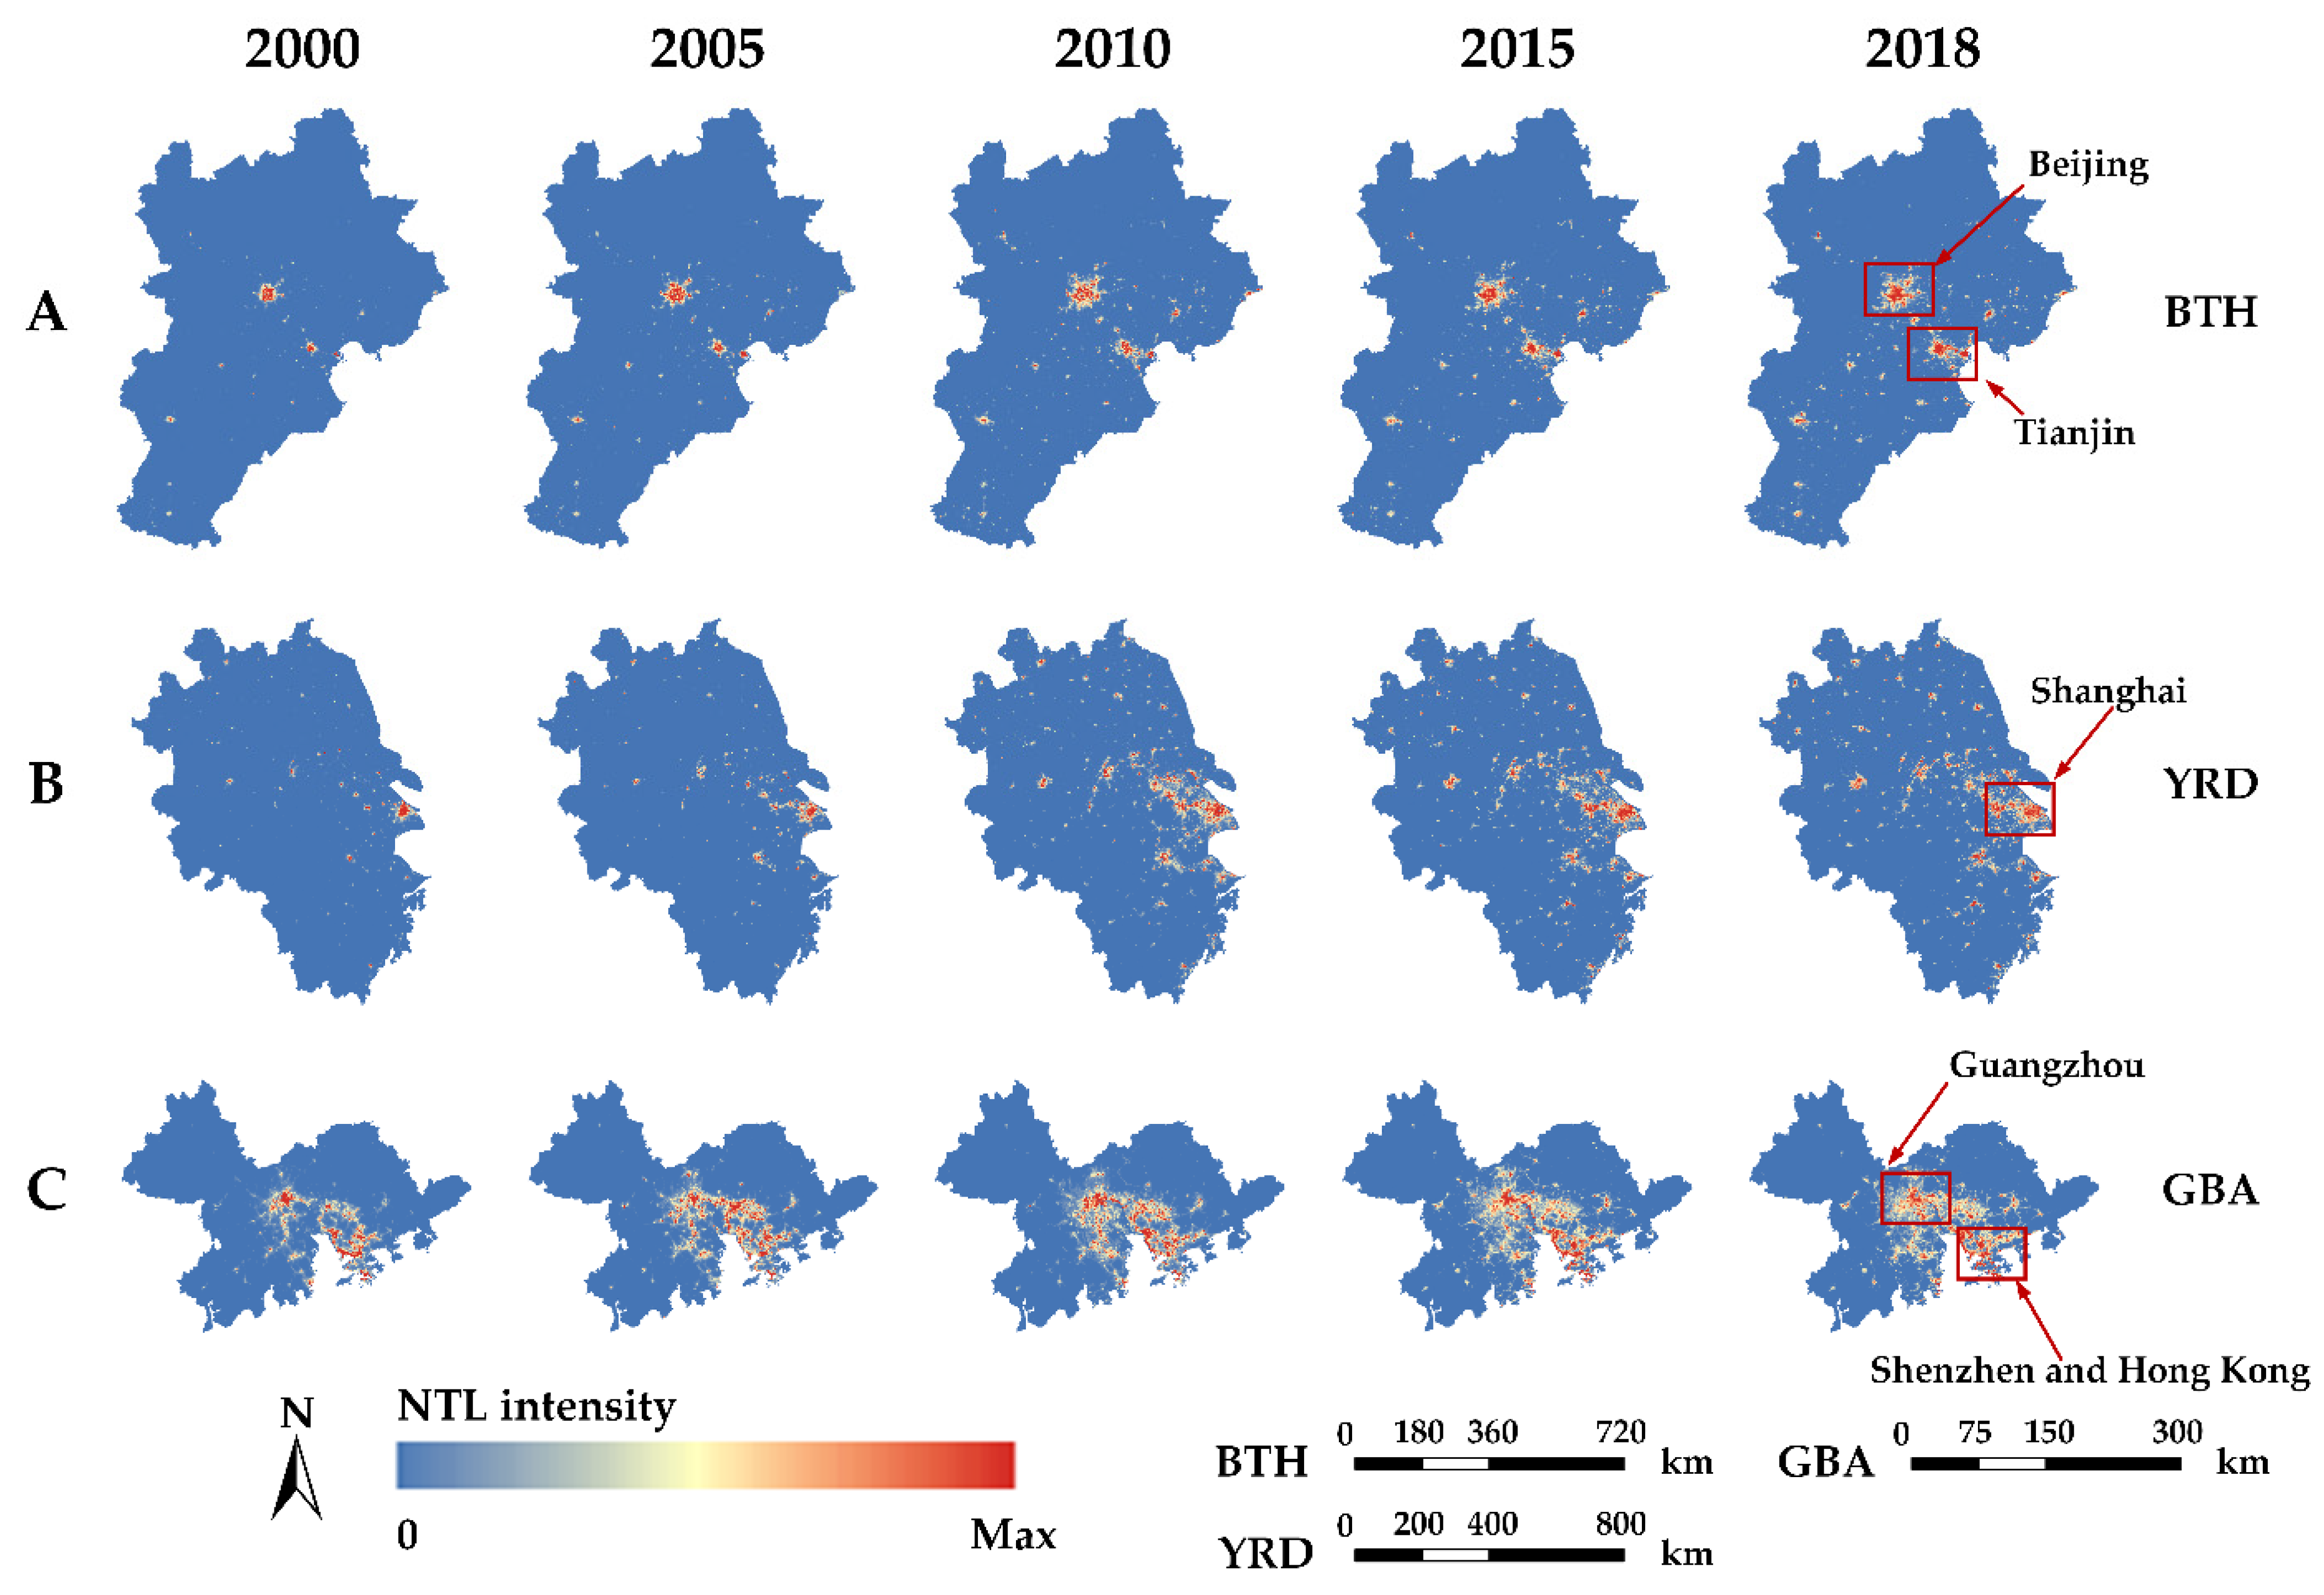
3.1. The Change in NTL Intensity during Rapid Urbanization

Before analyzing the spatiotemporal change in NTL intensity, this study constructed a Pearson correlation matrix to determine the optimal NTL index. The Pearson correlation coefficients (Table 2) showed that the four NTL indexes, except for the luminous area, were significantly related to the urban socio-economical characteristics. By comparing the coefficients of the NTL indexes, this study found that the average NTL intensity (NTLAI) had the largest coefficients, which indicated that NTLAI was the most optimal index for indicating the urbanization level and spatiotemporal patterns of urban agglomerations. Hence, this study selected NTLAI as the light index for further analyses.
From 2000 to 2018, the NTLAI continuously increased in the three urban agglomerations, which corresponded with rapid urbanization and economic growth. However, a significant variation of NLTAI in GBA and other two urban agglomerations was observed in this study (Figure 3D). This phenomenon could be partially attributed to the differences in the regional area to a much broader extent in BTH and YRD compared with GBA. Meanwhile, from the shape of the waterfall lines in Figure 3A–C, it is clear that the relative count of bright pixels in GBA was larger than that in BTH and YRD, which also caused obvious discrepancies in NTLAI. After 2015, although the overall intensity maintained a relatively steady increasing trend, the pixels with low intensity in the three urban agglomerations experienced dramatic growth, which was attributed to development in rural and suburban areas.

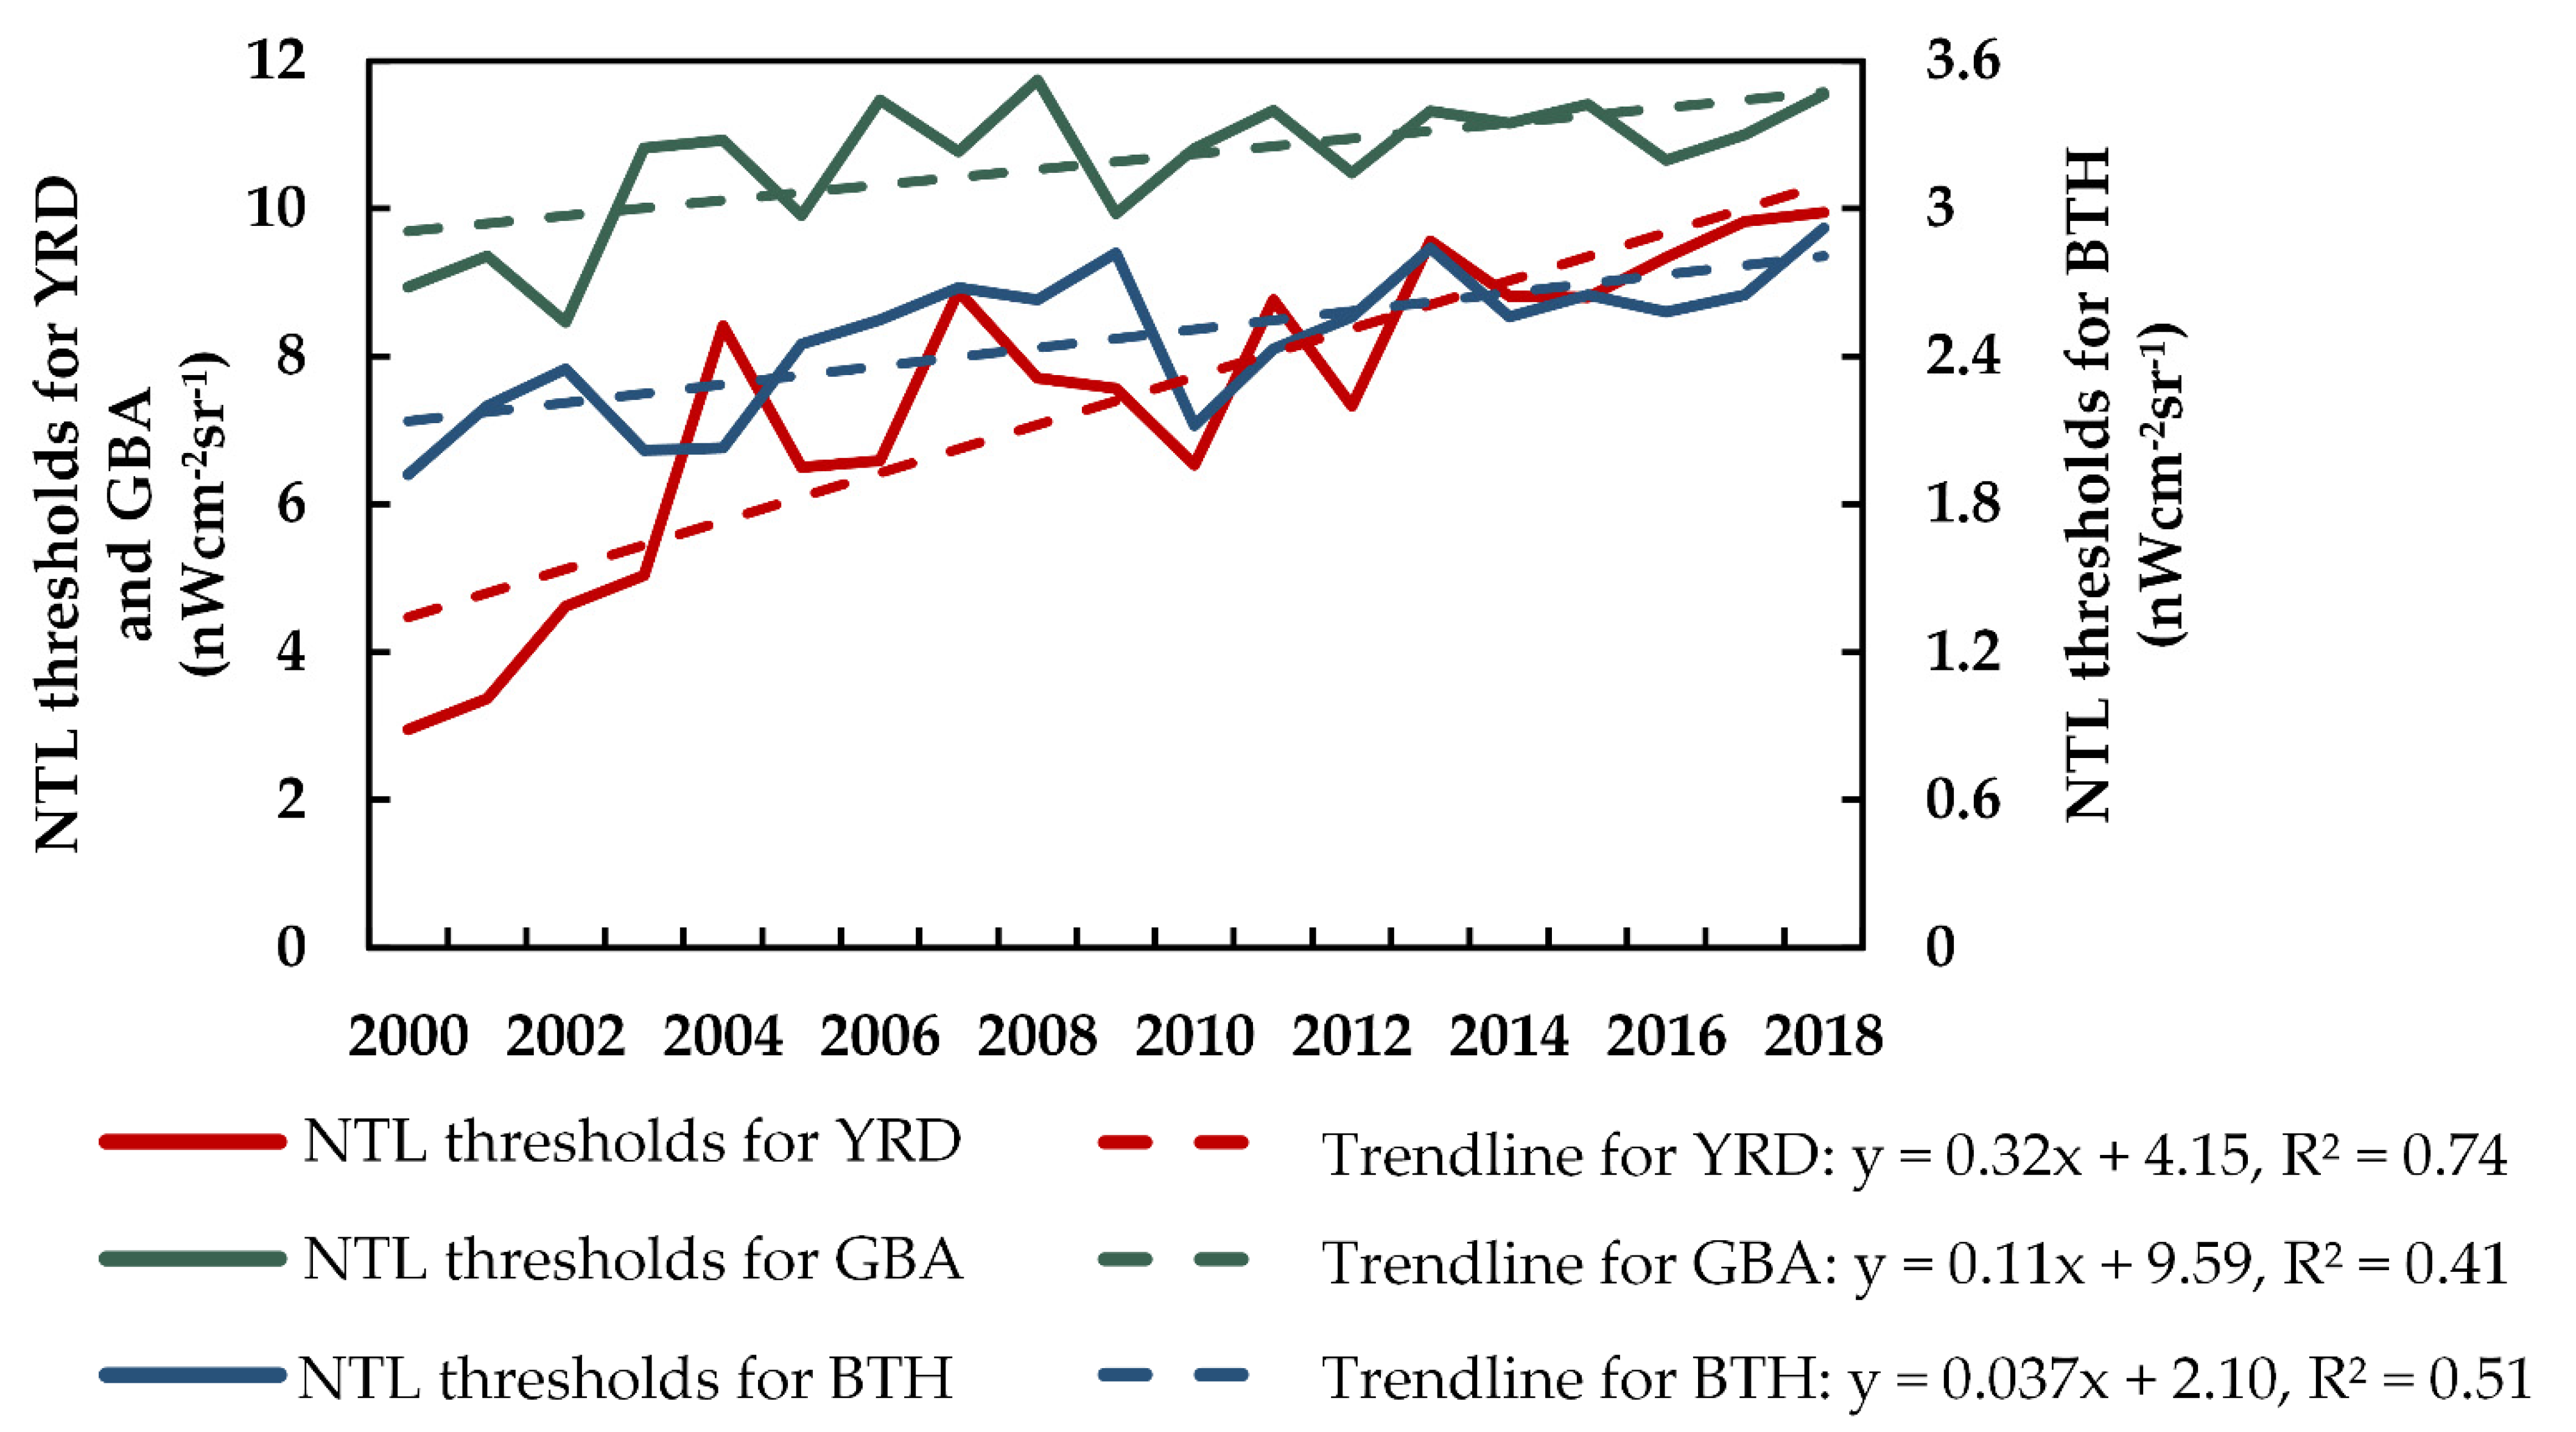
3.2. Variations in the Thresholds for Extracting Urban Areas

This study calculated the yearly thresholds for the three urban agglomerations to accurately delineate the urban areas. The values of the thresholds can directly indicate urbanization level and socioeconomic development status across regions [74]. Generally, a higher threshold of NTL data represents a more developed urbanization stage [75]. The thresholds of the three urban agglomerations increased from 8.94, 2.95, and 1.92 in 2000 to 11.54, 9.95, and 2.92 in 2018 for GBA, YRD, and BTH, respectively. The continuous growth in the thresholds showed that the urbanization level in the three urban agglomerations kept increasing over the last two decades, which enhanced the urban area’s minimum luminous grade derived from higher-level living conditions. The result also indicated that the thresholds of GBA from 2000 to 2018 were the largest, and BTH ranked last (Figure 4). The highest thresholds and the NTLAI of GBA suggested that GBA’s development level was much higher than the other two regions, revealing obvious discrepancies in the urbanization processes between the three agglomerations. However, it is worth noting that the slope of the trendline for the thresholds of YRD was much larger (0.32), i.e., three times and nine times larger than that of GBA (0.11) and BTH (0.037), respectively. Although the thresholds in YRD were only about 3 nW·cm−2·sr−1 at the beginning of the study period, the acceleration of urban development made them very close to those of GBA in 2018. By contrast, the slope of BTH was relatively small with a low intercept, indicating that the urbanization development of BTH seemed to fall behind the other two regions [6,11].

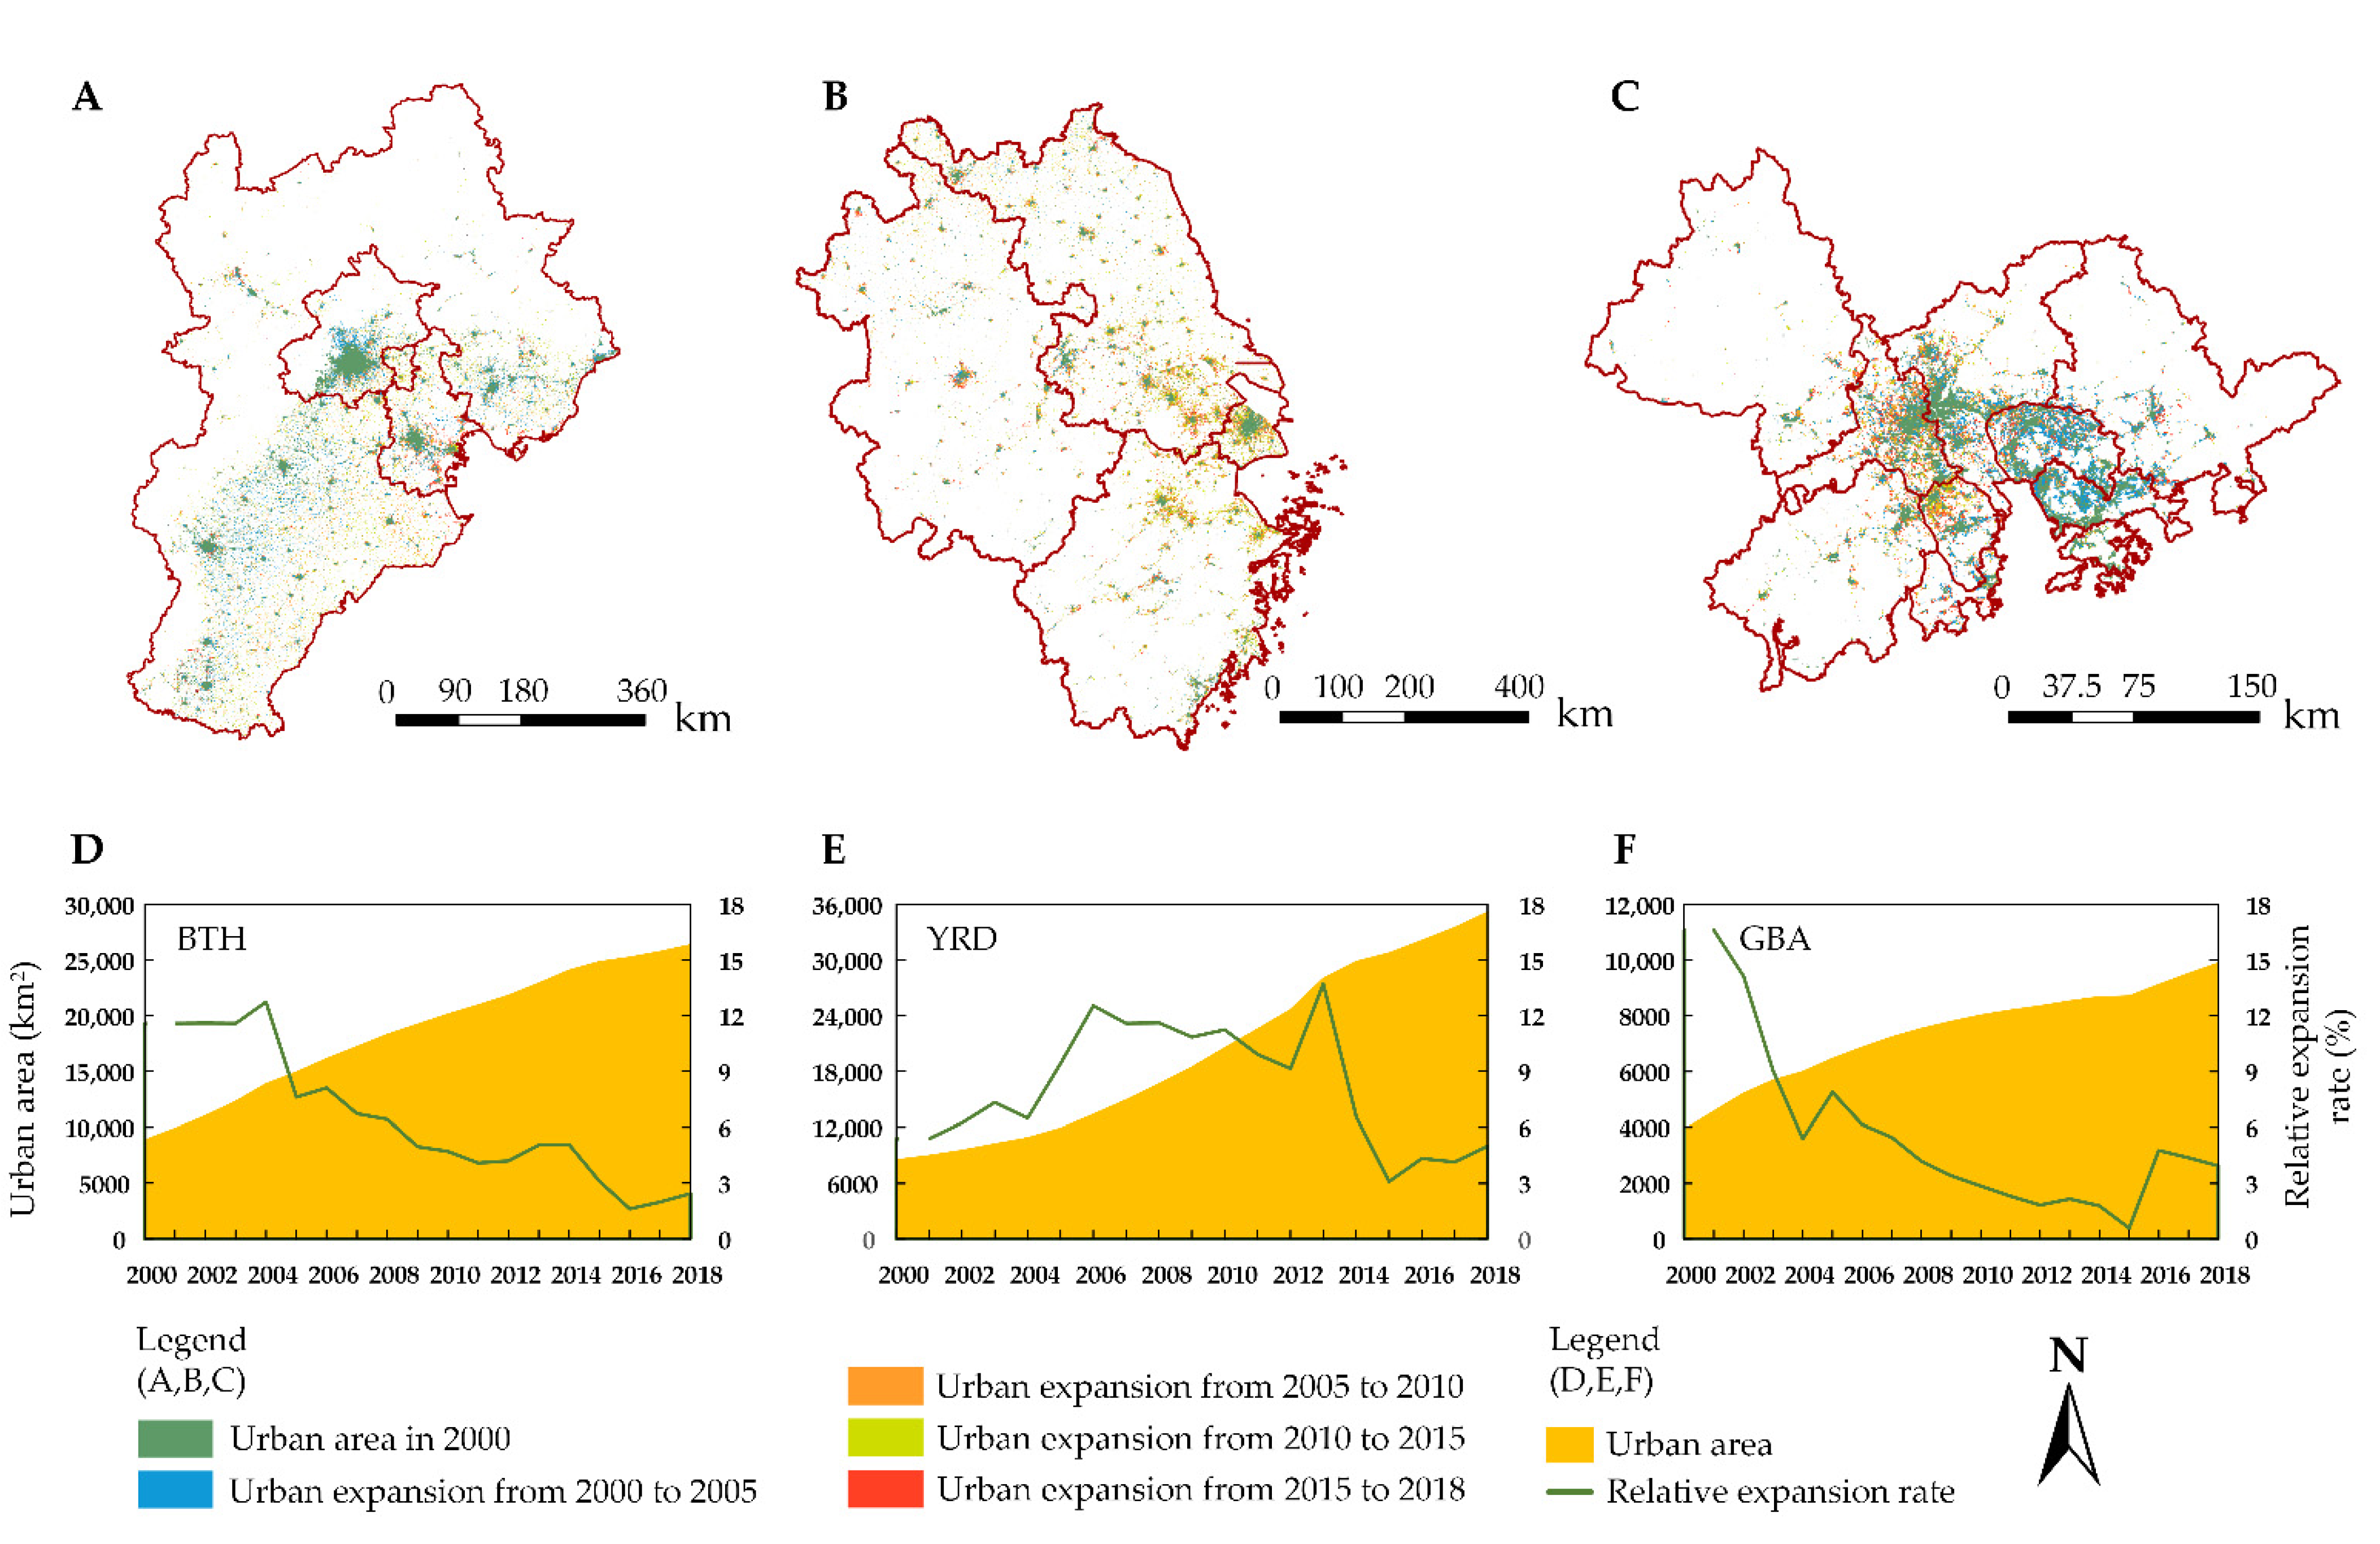
3.3. Urban Areas Derived from NTL Images

Considering that the differences between yearly images were very small, this study selected NTL images for every five years (Figure 5). The NTL intensity distribution indicated that the three urban agglomerations had considerably high expansion magnitudes over the past two decades. It was apparent in Figure 5 that the pixels of core cities—such as Beijing and Tianjin in BTH; Shanghai in YRD; Guangzhou, Shenzhen, and Hong Kong in GBA—had high brightness. These core cities were so-called megacities and the economic centers of each urban agglomeration such that they played the most important roles in promoting the whole region’s development. Examining the distribution of high-level lit pixels indicated that the megacities of BTH expanded outward from urban to rural areas with ring structures, but the luminous area in YRD occurred both in the megacity, namely, Shanghai, and some subordinate cities, mostly in the Jiangsu and Zhejiang provinces. Megacities in GBA stood out with sector patterns due to terrain constraints. The distributions of lit pixels with high brightness in the three agglomerations were also observed in previous studies, which mainly focused on impervious surface expansion [53]. In general, the spatiotemporal patterns of the NTL intensity in BTH presented a rapid diffusion from the core areas of the central cities to the periphery with a pie shape, and the high-level lit pixels of BTH appeared much more compact than those in the other two regions. Meanwhile, the patterns in YRD and GBA were dominated by the development of scattered satellite cities in the outskirts. The differences might result from the particularly strong attractiveness of megacities in BTH, and small cities in the other two regions were more developed than those of BTH.
After determining the dynamic thresholds, this study extracted the urban areas of the three urban agglomerations on the basis of extended time-series NTL data (Figure 6). As mentioned before, the development pattern of BTH was driven by two megacities, with quite a few small cities. However, the urban area in GBA was much more scattered and presented a widespread trend from north to south [53]. The relative expansion rate of the urban areas suggested that the urban expansion in BTH and GBA experienced a similar trend. The trends both started at a high speed with a gradually decreasing expansion rate from 2000 to approximately 2010; during this period the rate decreased from over 12% to less than 5% in the two urban agglomerations. The curve then remained stable without any significant change. However, a difference occurred in the year 2015: the trend of GBA returned to an increasing state, while that of BTH remained at a low level. In contrast, the relative expansion rate in YRD showed obvious differences. Although the initial expansion rate was not very high, with a value less than 6%, the rate consistently increased from 2000 to 2013 and reached a peak of 14% in 2013. The expansion rate then rapidly decreased to about 3% in 2015 and the trend showed a slight increase after 2015. From the perspective of urban extents among the three urban agglomerations, GBA was the smallest but most developed region. Its urban area increased from approximately 4000 km2 in 2000 to 10,000 km2 in 2018, with an annual average growth rate of 2.4%. YRD, as the fastest-growing urban agglomerations in China, had the largest increase from 8500 km2 in 2000 to more than 35,000 km2 in 2018, and the annual growth rate was up to 6.5%. The expansion of BTH, which was mostly driven by two megacities, made the urban area increase at a speed of 3.9% annually from 8800 km2 in 2000 to 26,000 km2 in 2018. The urban expansion patterns indicate that the urbanization process in GBA was undergoing dramatic landscape changes since 2000, but the magnitude of the change was still much slower than that in the other two urban agglomerations.

4. Discussion

4.1. Evolution Patterns of Urban Areas

To further measure the evolution patterns and spatial directions of urban areas in the three agglomerations studied, the standard deviation ellipse and cohesion index of the urban expansion were calculated (Figure 7). The direction and concentration degree of the extracted urban area change at the regional scale were depicted by the central coordinate and area the ellipse. The spatial evolution of the three agglomerations presented significantly different patterns in northeast–southwest, northwest–southeast, and east–west directions in BTH, YRD, and GBA, respectively. The different directions of the long axis suggest the varied cluster modes of the three urban agglomerations. Considering the close distance between Beijing and Tianjin, the two focal points were exactly at two regional centers, with one at the capital of Hebei province and the other at the midpoint of the Beijing–Tianjin area. While satellite cities in YRD and GBA, such as Nanjing (YRD), Hangzhou (YRD), and Foshan (GBA), had strong economic vitality and intensive human activities, the direction of the long axis in these two agglomerations developed along the belt of these subordinate cities. Regarding the expansion or contraction of the two axes in the three agglomerations, the short axis expanded to a greater extent than did the long axis in BTH, indicating that the main driving force for the evolution of the urban area was the growth of cities along the northwest–southeast direction (the Beijing–Tianjin area) rather than the northeast–southwest direction. In contrast, the rapid urbanization of peripheral cities in GBA made the long axis of the ellipse expand to a greater extent than the short axis. However, the two axes in YRD both contracted during the period, which suggests that the key drivers were cities located around the ellipse’s center. These findings corroborate the evidence reported in previous studies [58,76], confirming that scattered medium-sized cities in YRD and GBA were more developed than those in BTH.
Table 3 shows that the rotation of the ellipse of BTH, YRD, and GBA decreased from 23.53, 139.43, and 96.82 in 2000 to 20.98, 138.35, and 89.70 in 2018, respectively, which meant that the spatial patterns of the urban areas gradually changed from the original direction to new statuses with the rapid development of urbanization. Based on the changes in the cohesion indexes, the compactness of the three regions seemed to increase to different extents. Among them, the cohesion of BTH experienced the slowest increase over the past two decades, with the smallest value in 2018. YRD and GBA, however, both had significant growth and reached a high level of connectivity. This discrepancy could be attributed to how closely the inner cities interacted with each other. Small- and medium-sized cities in BTH lacked economic communication, limiting the cohesion of the whole region.
In fact, these significant differences in the evolution of the urban areas in the three urban agglomerations were one of the principal manifestations of spatiotemporal variations in the rapid urbanization progress. The urban areas extracted from the long-term NTL images consistently provided us with deeper insight into these variations at a low cost.

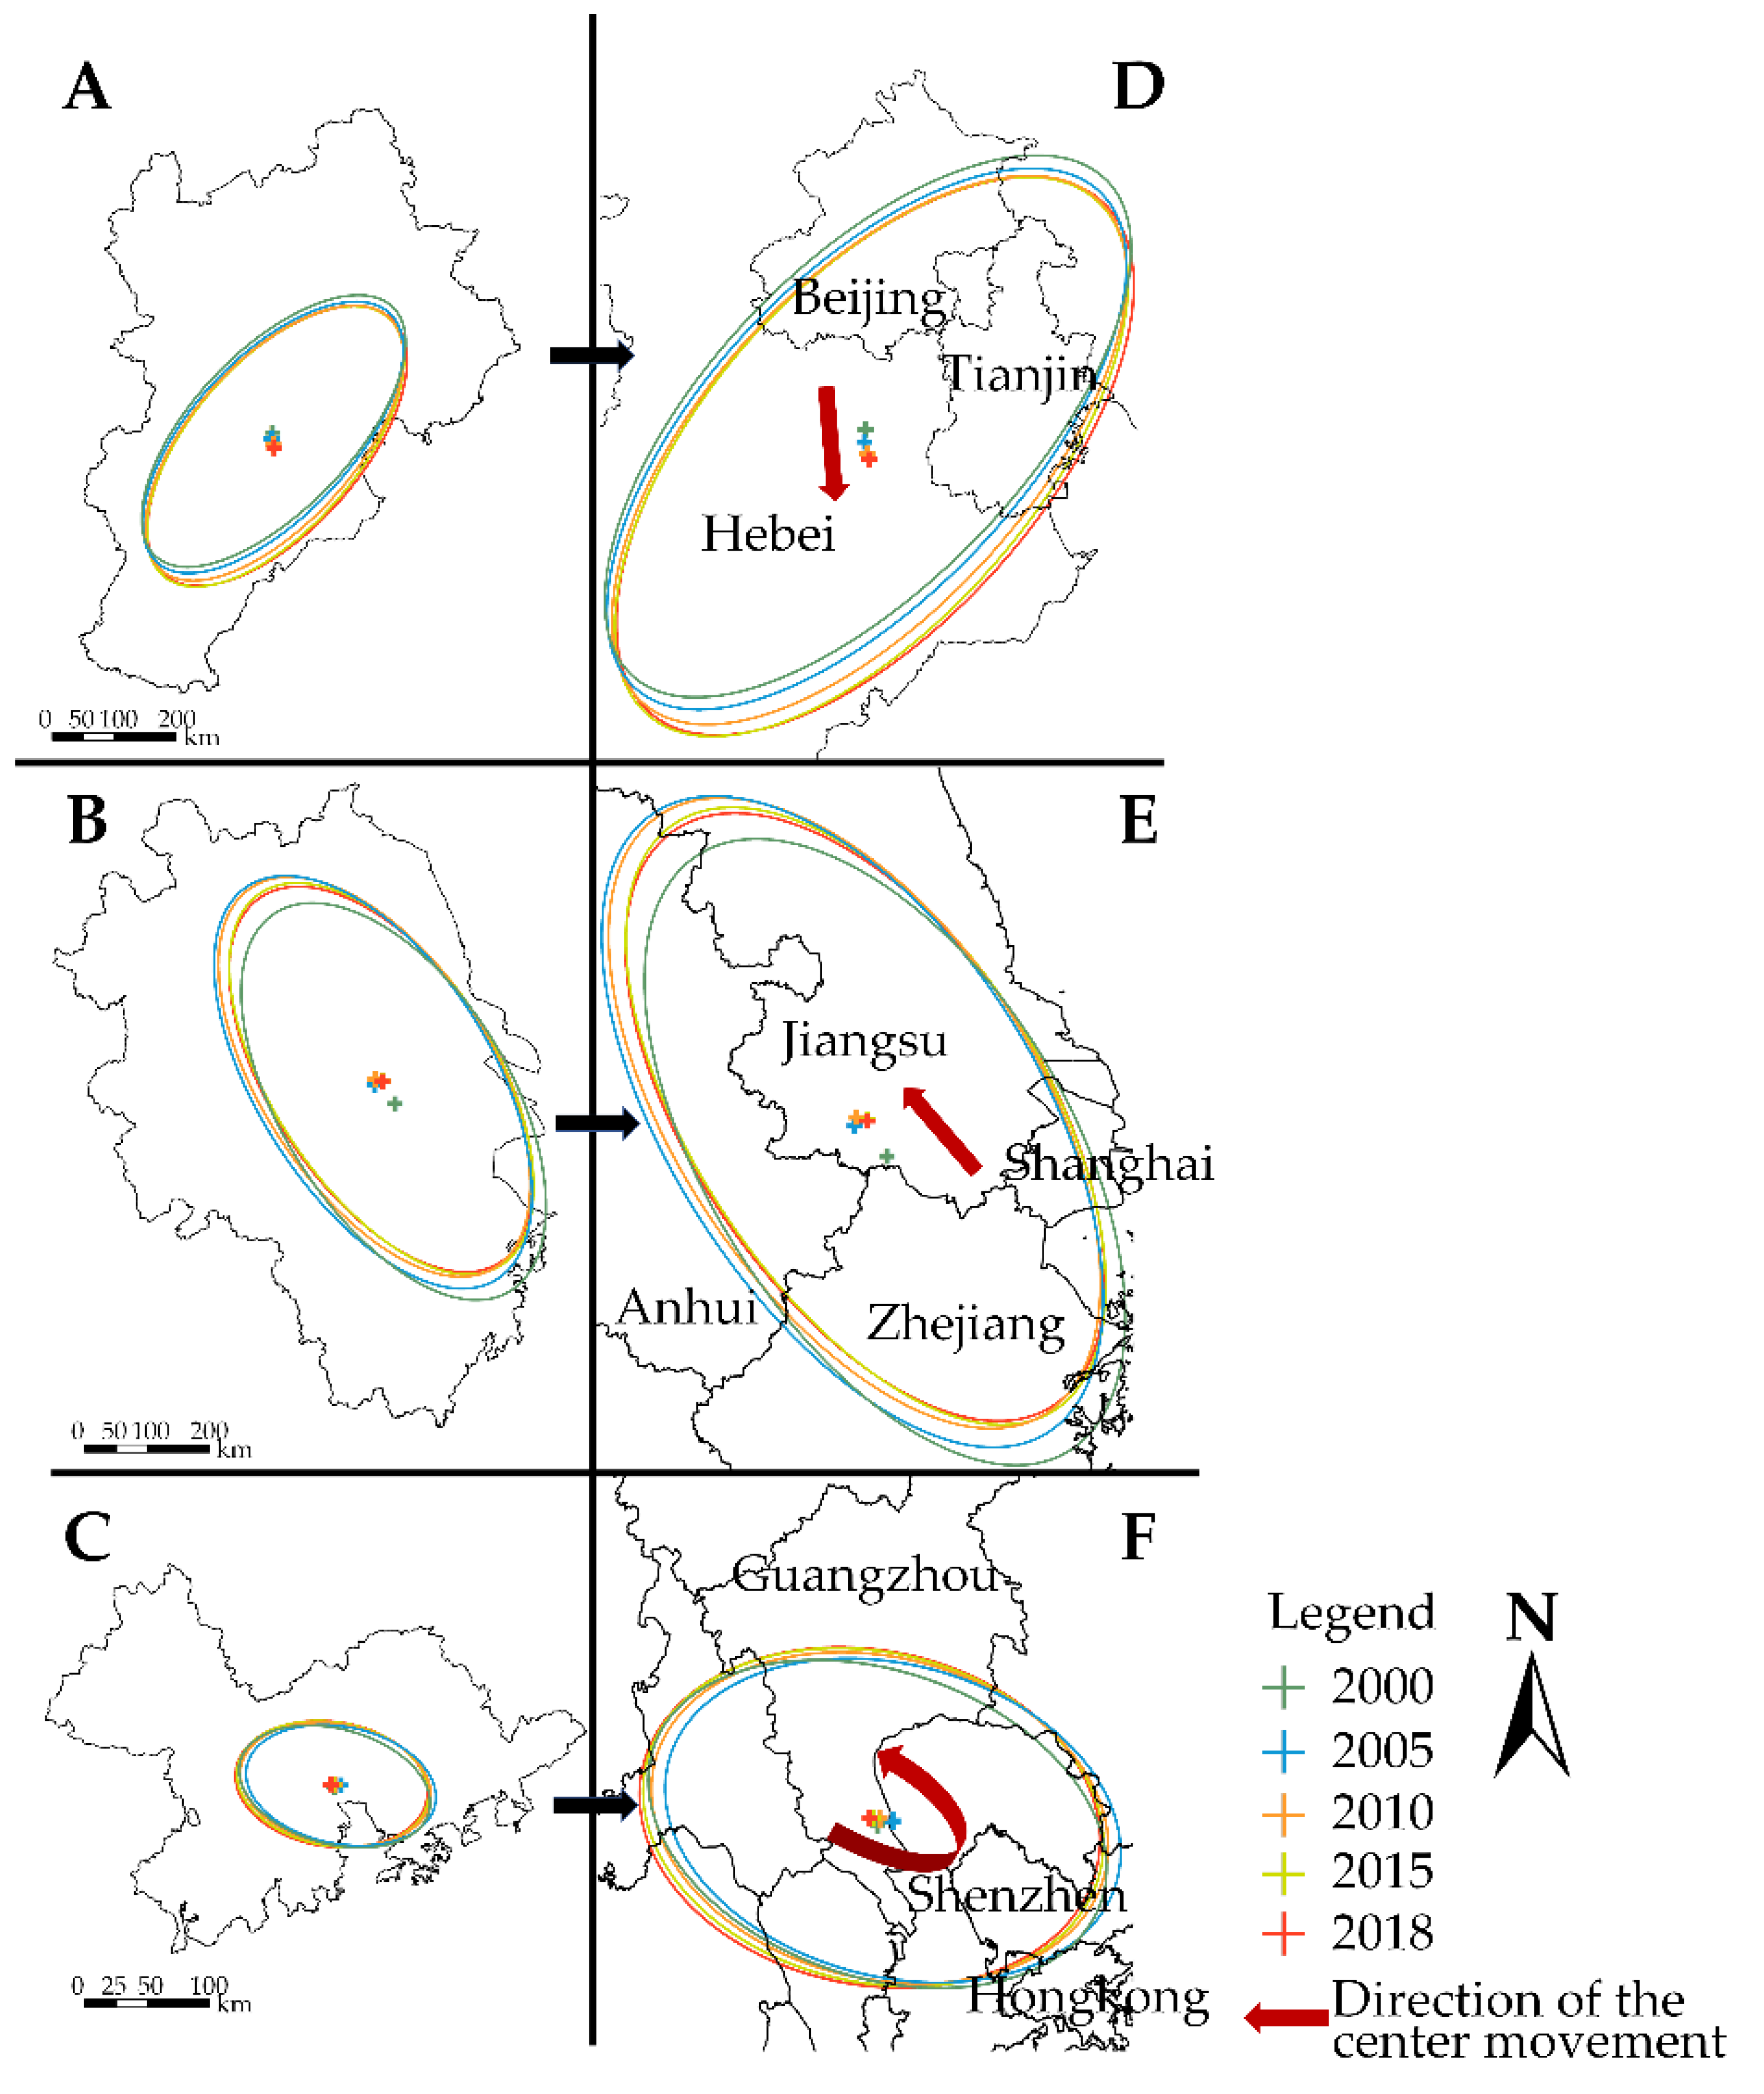
4.2. Analysis of Spatiotemporal Patterns of Urbanization Based on Multiple Metrics

The NTLAI, dynamic thresholds, SDE, cohesion index, and characteristics of urban area expansion played important roles in understanding the spatiotemporal patterns of the rapid urbanization process in the three urban agglomerations. Combined with the multiple metrics, it can be concluded that these urbanization processes could be divided into three stages.
The first stage was the rapid development of urbanization, with consistently increasing human activity intensity and significant urban central area expansion from 2000 to 2010. During this period, the relative expansion rate was larger than 3%, with NTLAI and the thresholds presenting obvious increasing trends. Meanwhile, the migration of the center points and the decrease in the rotation for the ellipses were significant (Figure 7 and Table 3). Considering that the outline of China’s Tenth and Eleventh Five-Year Plans emphasize the development of core cities in urban agglomerations, a possible explanation for these phenomena is that the rapid expansion mainly occurred in the core cities rather than the surrounding municipalities. Strong growth in both land-use intensity and economic activities, with population migration in the core areas of megacities, made the urban agglomeration enter its rapid urbanization stage. At this stage, the main manifestation of NTL was the drastic intensity increase in local areas such as Beijing, Shanghai, Shenzhen, and Guangzhou. Due to the increase in the overall NTL intensity, dynamic thresholds experienced significant growth. The rapid urbanization of megacities intensively promoted the whole region’s development. Previous studies showed that coastal areas exhibited the most dramatic growth rate in urban areas [68] and a higher urbanization level [6] in this period. The urbanization of GBA was much more developed than the other two regions, with a higher GDP per capita, more intensified NTL, larger thresholds, and a higher cohesion index.
In the second stage, the urbanization level increased at a fluctuating rate, with obvious discrepancies between the three urban agglomerations, from 2010 to 2015. Since the urban development in GBA was ahead of the other two regions, the urbanization progress in GBA significantly slowed down at this stage, while BTH and YRD were still in relatively high-speed development. Combining the variation in the NTLAI and lit pixel count with spatial patterns of urban expansion, this study found that human activities and urban expansion in YRD and GBA gradually shifted to satellite cities, such as Nanjing (YRD), Hangzhou (YRD), and Foshan (GBA), which might have resulted from the Strategies of Regional Coordinated Development proposed by the Chinese government. Due to the relative dimming of NTL in subordinate cities, the thresholds in this period fluctuated. However, the gravity center of development in BTH was still strongly affected by Beijing and Tianjin. At this stage, the sizes and magnitudes, as well as the spatiotemporal patterns of the urban areas, varied significantly. GBA and YRD gradually formed into megapolises with scattered urban development patterns and subordinate cities or satellite cities sprawled outward, while BTH grew mainly due to the impetus from core cities.
In the third stage, areas still undergoing the urbanization process mainly transformed from core cities to satellite cities in the three urban agglomerations with a stable expansion rate after 2015. China’s Thirteenth Five-Year Plan accelerated the construction of medium-sized cities in the urban agglomerations studied to optimize the regional structure. It was apparent that the count of lit pixels with low NTL intensity, compared with the high-brightness pixels, increased much more rapidly after 2015 (Figure 3). Meanwhile, the thresholds of NTL in the three agglomerations slightly increased. These signals indicated that urbanization in the three agglomerations focused on subordinated cities, even in BTH, which was relatively less developed. At this stage, quite a large number of medium-sized cities underwent urbanization processes due to the “saturated status” in major megacities [77]. Hence, the relatively slow urbanization development in these surrounding cities led to only a slight increase in the NTLAI, thresholds, and expansion rate in the agglomerations. This study also found that NTLAI in YRD and BTH was much lower than that of GBA in the three stages. A recent paper provided outlines of the urban agglomerations in a consistent, data-driven way and reported that the morphological urban area of GBA was the largest in the world, while that of YRD and BTH ranked at numbers 10 and 17, respectively [78]. Consequently, the significant differences in NTLAI between the three agglomerations could presumably be attributed to a much larger discrepancy between administrative areas and morphological areas in BTH and YRD compared with GBA.

4.3. Limitations and Future Study

This research was conducted for BTH, YRD, and GBA, which are typical urban agglomerations in China. This study defined urban agglomerations using their administrative boundaries; however, Taubenböck et al. stated that the actual morphological urban areas are smaller than the administrative units [78]. This requires further consideration in future studies. Although previous studies pointed out that YRD met the world-level standard, discrepancies between the three urban agglomerations and the most developed regions of the entire globe were shown [53]. Comparison studies on the urbanization processes at the global scale using long-term time-series observation data are recommended. This study used extended time-series NTL data without any comparison with other products, such as Luojia satellite images [79,80] and ground-based measurements [81]. Hence, using composited NTL data from multiple sources might assure the robustness of consistent time-series images. In addition, China’s “ghost neighborhoods” phenomenon has been identified in dynamic regions, such as YRD and GBA [82], which might underestimate the NTL intensity. Therefore, further studies that combine NTL images with real-world activity intensity are desirable.

5. Conclusions

This study conducted a multi-metric-based analysis of the three most developed urban agglomerations in China from 2000 to 2018 based on long-term time-series NTL data by characterizing the spatiotemporal patterns of rapid urbanization in the regions. The three urban agglomerations, namely, BTH, YRD, and GBA, had significantly different urbanization patterns and rates. In general, the urbanization level of GBA was the highest among the study areas. Not only the high NTL intensity but also the large urban area and the developed satellite cities indicated that GBA was the most developed urban agglomeration in China. However, the economic development and rapid population growth dramatically and intensively accelerated the urbanization processes in YRD, of which the NTLAI almost surpassed that of GBA. The satellite cities in both GBA and YRD entered a stage of rapid expansion and high connectivity with the megacities of each urban agglomeration. The development of BTH was still very competitive due to the strong impetus from Beijing and Tianjin, but peripheral cities should be paid more attention to regional urbanization.
Based on the spatiotemporal patterns of urban development in the study areas, the urbanization processes can be divided into three stages. In the first stage, from 2000 to 2010, all three urban agglomerations experienced rapid urbanization, including a significant increase in NTLAI and thresholds, and a rapid expansion of the urban central areas. In the second stage, from 2010 to 2015, the urbanization level increased at a fluctuating rate, with emerging discrepancies between the three urban agglomerations. The peripheral cities in GBA and YRD played increasingly important roles in regional development, while the urbanization of BTH was still driven by megacities. The third stage, starting in 2015, was the developed stage. The spatial distribution of areas where urbanization was still in process mainly moved from megacities to medium-sized cities with a relatively low NTL intensity. A comparative analysis of spatiotemporal patterns of urbanization in the three urban agglomerations might provide valuable lessons for urban management in other regions at different development phases.

Author Contributions

Conceptualization, H.Y.; methodology, Y.L. and H.Y.; validation, X.L. and D.M.; formal analysis, H.Y.; investigation, H.Y.; resources, H.Y.; data curation, H.Y. and N.Z.; writing—original draft preparation, Y.L., H.Y., X.G., Z.L., D.S., and X.L.; writing—review and editing, H.Y.; supervision, H.Y. and J.Z.; project administration, Y.L.; funding acquisition, Y.L. All authors have read and agreed to the published version of the manuscript.

Funding

This research was funded by the National Natural Science Foundation of China, grant number 41771182, and the National Earth System Science Data Center “High spatial and temporal resolution data of long-term positioning monitoring of urban ecology and human activities in Beijing”.

Institutional Review Board Statement

Not applicable.

Informed Consent Statement

Not applicable.

Data Availability Statement

Extended time-series NTL data can be obtained here: https://0-doi-org.brum.beds.ac.uk/10.7910/DVN/YGIVCD (accessed on 7 June 2021). Land-use/cover data can be obtained from http://www.esa-landcover-cci.org/?q=node/164 (accessed on 7 June 2021). Statistical data of urban agglomerations can be found here: http://www.stats.gov.cn/english/ (accessed on 7 June 2021).

Acknowledgments

We thank Zuoqi Chen for sharing the nighttime light data in the Harvard Dataverse, and we thank the reviewers for their invaluable comments. We also thank the efforts of anonymous reviewers and the editor for their valuable comments and suggestions to improve the quality of the paper.

Conflicts of Interest

The authors declare no conflict of interest.

References

  1. United Nations. World Urbanization Prospects 2018: Key Facts; United Nations: New York, NY, USA, 2018. [Google Scholar]
  2. Anas, A.; Arnott, R.; Small, K.A. Urban spatial structure. J. Econ. Lit. 1998, 36, 1426–1464. [Google Scholar]
  3. Taubenböck, H.; Wurm, M.; Geiss, C.; Dech, S.; Siedentop, S. Urbanization between compactness and dispersion: Designing a spatial model for measuring 2D binary settlement landscape configurations. Int. J. Digit. Earth 2019, 12, 679–698. [Google Scholar] [CrossRef]
  4. Angel, S.; Blei, A.M. The spatial structure of American cities: The great majority of workplaces are no longer in CBDs, employment sub-centers, or live-work communities. Cities 2016, 51, 21–35. [Google Scholar] [CrossRef]
  5. Fang, C.; Yu, D. Urban agglomeration: An evolving concept of an emerging phenomenon. Landsc. Urban Plan. 2017, 162, 126–136. [Google Scholar] [CrossRef]
  6. Peng, J.; Lin, H.; Chen, Y.; Blaschke, T.; Luo, L.; Xu, Z.; Hu, Y.N.; Zhao, M.; Wu, J. Spatiotemporal evolution of urban agglomerations in China during 2000–2012: A nighttime light approach. Landsc. Ecol. 2020, 35, 421–434. [Google Scholar] [CrossRef]
  7. Ma, X.; Chen, Y.; Li, Z. The History, Characteristics and prospects of regional urban cluster planning in the Guangdong–Hong Kong–Macao Greater Bay Region. Urban Plan. Forum 2019, 6, 15–24. [Google Scholar]
  8. Wu, J. Urban ecology and sustainability: The state-of-the-science and future directions. Landsc. Urban Plan. 2014, 125, 209–221. [Google Scholar] [CrossRef]
  9. Zheng, Y. Spatial pattern of China’s urban agglomerations: Theoretical background, formation mechanisms, and latest progress of research of dispersed regional concentration. Prog. Geogr. 2020, 39, 339–352. [Google Scholar] [CrossRef]
  10. Zhou, D.; Bonafoni, S.; Zhang, L.; Wang, R. Remote sensing of the urban heat island effect in a highly populated urban agglomeration area in East China. Sci. Total Environ. 2018, 628–629, 415–429. [Google Scholar] [CrossRef]
  11. Fang, C. Important progress and prospects of china’s urbanization and urban agglomeration in the past 40 years of Reform and Opening-Up. Econ. Geogr. 2018, 38, 1–9. (In Chinese) [Google Scholar]
  12. Han, J.; Gao, M.; Sun, Y. Research on the measurement and path of urban agglomeration growth effect. Sustainability 2019, 11, 5179. [Google Scholar] [CrossRef] [Green Version]
  13. Portnov, B.A.; Schwartz, M. Urban clusters as growth foci. J. Reg. Sci. 2009, 49, 287–310. [Google Scholar] [CrossRef]
  14. Levin, N.; Kyba, C.C.M.; Zhang, Q.; de Miguel, A.S.; Roman, M.O.; Li, X.; Portnov, B.A.; Molthan, A.L.; Jechow, A.; Miller, S.D.; et al. Remote sensing of night lights: A review and an outlook for the future. Remote Sens. Environ. 2020, 237, 111443. [Google Scholar] [CrossRef]
  15. Doll, C.N.H.; Muller, J.P.; Elvidge, C.D. Night-time imagery as a tool for global mapping of socioeconomic parameters and greenhouse gas emissions. Ambio 2000, 29, 157–162. [Google Scholar] [CrossRef]
  16. Elvidge, C.D.; Baugh, K.E.; Hobson, V.R.; Kihn, E.A.; Kroehl, H.W.; Davis, E.R.; Cocero, D. Satellite inventory of human settlements using nocturnal radiation emissions: A contribution for the global toolchest. Glob. Chang. Biol. 1997, 3, 387–395. [Google Scholar] [CrossRef]
  17. Yu, B.; Shu, S.; Liu, H.; Song, W.; Wu, J.; Wang, L.; Chen, Z. Object-based spatial cluster analysis of urban landscape pattern using nighttime light satellite images: A case study of China. Int. J. Geogr. Inf. Sci. 2014, 28, 2328–2355. [Google Scholar] [CrossRef]
  18. Elvidge, C.D.; Baugh, K.; Zhizhin, M.; Hsu, F.C.; Ghosh, T. VIIRS night-time lights. Int. J. Remote Sens. 2017, 38, 5860–5879. [Google Scholar] [CrossRef]
  19. Forbes, D.J. Multi-scale analysis of the relationship between economic statistics and DMSP-OLS night light images. Giscience Remote Sens. 2013, 50, 483–499. [Google Scholar] [CrossRef]
  20. Liu, Z.; He, C.; Zhou, Y.; Wu, J. How much of the world’s land has been urbanized, really? A hierarchical framework for avoiding confusion. Landsc. Ecol. 2014, 29, 763–771. [Google Scholar] [CrossRef]
  21. Small, C.; Elvidge, C.D.; Baugh, K. Mapping Urban Structure and Spatial Connectivity with VIIRS and OLS Night Light Imagery. In Proceedings of the Joint Urban Remote Sensing Event 2013, Sao Paulo, Brazil, 21–23 April 2013; pp. 230–233. [Google Scholar]
  22. Xie, Y.; Weng, Q. Updating urban extents with nighttime light imagery by using an object-based thresholding method. Remote Sens. Environ. 2016, 187, 1–13. [Google Scholar] [CrossRef]
  23. Zhang, J.; Zhou, Z.; Shuai, G.; Liu, H. Support vector data description model to map urban extent from National Polar-Orbiting Partnership Satellite-Visible Infrared Imaging Radiometer Suite nightlights and normalized difference vegetation index. J. Appl. Remote Sens. 2016, 10, 026012. [Google Scholar] [CrossRef]
  24. Zhang, P.; Liu, S.; Du, J. A map spectrum-based spatiotemporal clustering method for GDP variation pattern analysis using nighttime light images of the Wuhan urban agglomeration. ISPRS Int. J. Geo-Inf. 2017, 6, 160. [Google Scholar] [CrossRef] [Green Version]
  25. Zhang, W.; Li, M.; Yu, C.; Meng, L. The city gravity migration of the urban agglomeration in the Middle Reach of Yangtze River based on DMSP nighttime light. In Proceedings of the 2018 26th International Conference on Geoinformatics, Kunming, China, 28–30 June 2018. [Google Scholar]
  26. Liu, Z.; He, C.; Zhang, Q.; Huang, Q.; Yang, Y. Extracting the dynamics of urban expansion in China using DMSP-OLS nighttime light data from 1992 to 2008. Landsc. Urban Plan. 2012, 106, 62–72. [Google Scholar] [CrossRef]
  27. Ma, T.; Zhou, C.; Pei, T.; Haynie, S.; Fan, J. Quantitative estimation of urbanization dynamics using time series of DMSP/OLS nighttime light data: A comparative case study from China’s cities. Remote Sens. Environ. 2012, 124, 99–107. [Google Scholar] [CrossRef]
  28. Ma, T.; Zhou, Y.; Zhou, C.; Haynie, S.; Pei, T.; Xu, T. Night-time light derived estimation of spatio-temporal characteristics of urbanization dynamics using DMSP/OLS satellite data. Remote Sens. Environ. 2015, 158, 453–464. [Google Scholar] [CrossRef]
  29. Yi, K.; Tani, H.; Li, Q.; Zhang, J.; Guo, M.; Bao, Y.; Wang, X.; Li, J. Mapping and evaluating the urbanization process in Northeast China using DMSP/OLS nighttime light data. Sensors 2014, 14, 3207–3226. [Google Scholar] [CrossRef] [Green Version]
  30. Pandey, B.; Joshi, P.K.; Seto, K.C. Monitoring urbanization dynamics in India using DMSP/OLS night time lights and SPOT-VGT data. Int. J. Appl. Earth Obs. Geoinf. 2013, 23, 49–61. [Google Scholar] [CrossRef]
  31. Zhang, Q.; Seto, K.C. Mapping urbanization dynamics at regional and global scales using multi-temporal DMSP/OLS nighttime light data. Remote Sens. Environ. 2011, 115, 2320–2329. [Google Scholar] [CrossRef]
  32. Alvarez-Berrios, N.L.; Pares-Ramos, I.K.; Aide, T.M. Contrasting patterns of urban expansion in Colombia, Ecuador, Peru, and Bolivia between 1992 and 2009. Ambio 2013, 42, 29–40. [Google Scholar] [CrossRef] [Green Version]
  33. Florida, R.; Mellander, C.; Gulden, T. Global metropolis: Assessing economic activity in urban centers based on nighttime satellite images. Prof. Geogr. 2012, 64, 178–187. [Google Scholar] [CrossRef]
  34. Zhang, Q.; Pandey, B.; Seto, K.C. A robust method to generate a consistent time series from DMSP/OLS nighttime light data. IEEE Trans. Geosci. Remote Sens. 2016, 54, 5821–5831. [Google Scholar] [CrossRef]
  35. Georg, I.; Blaschke, T.; Taubenböck, H. A global inventory of urban corridors based on perceptions and night-time light imagery. ISPRS Int. J. Geo-Inf. 2016, 5, 233. [Google Scholar] [CrossRef] [Green Version]
  36. Zhou, Y.; Li, X.; Asrar, G.R.; Smith, S.J.; Imhoff, M. A global record of annual urban dynamics (1992–2013) from nighttime lights. Remote Sens. Environ. 2018, 219, 206–220. [Google Scholar] [CrossRef]
  37. Chen, Z.; Yu, B.; Zhou, Y.; Liu, H.; Yang, C.; Shi, K.; Wu, J. Mapping global urban areas from 2000 to 2012 using time-series nighttime light data and MODIS products. IEEE J. Sel. Top. Appl. Earth Obs. Remote Sens. 2019, 12, 1143–1153. [Google Scholar] [CrossRef]
  38. Zou, Y.; Peng, H.; Liu, G.; Yang, K.; Xie, Y.; Weng, Q. Monitoring urban clusters expansion in the Middle Reaches of the Yangtze River, China, using time-series nighttime light images. Remote Sens. 2017, 9, 1007. [Google Scholar] [CrossRef] [Green Version]
  39. Gao, B.; Huang, Q.; He, C.; Dou, Y. Similarities and differences of city-size distributions in three main urban agglomerations of China from 1992 to 2015: A comparative study based on nighttime light data. J. Geogr. Sci. 2017, 27, 533–545. [Google Scholar] [CrossRef]
  40. Huang, Q.; Yang, X.; Gao, B.; Yang, Y.; Zhao, Y. Application of DMSP/OLS nighttime light images: A meta-analysis and a systematic literature review. Remote Sens. 2014, 6, 6844–6866. [Google Scholar] [CrossRef] [Green Version]
  41. Zhao, M.; Zhou, Y.; Li, X.; Cao, W.; He, C.; Yu, B.; Li, X.; Elvidge, C.D.; Cheng, W.; Zhou, C. Applications of satellite remote sensing of nighttime light observations: Advances, challenges, and perspectives. Remote Sens. 2019, 11, 1971. [Google Scholar] [CrossRef] [Green Version]
  42. Wei, Y.; Liu, H.; Song, W.; Yu, B.; Xiu, C. Normalization of time series DMSP-OLS nighttime light images for urban growth analysis with Pseudo Invariant Features. Landsc. Urban Plan. 2014, 128, 1–13. [Google Scholar] [CrossRef]
  43. Zheng, Q.; Weng, Q.; Wang, K. Developing a new cross-sensor calibration model for DMSP-OLS and Suomi-NPP VIIRS night-light imageries. ISPRS J. Photogramm. Remote Sens. 2019, 153, 36–47. [Google Scholar] [CrossRef]
  44. Chen, H.; Xiong, X.; Sun, C.; Chen, X.; Chiang, K. Suomi-NPP VIIRS day-night band on-orbit calibration and performance. J. Appl. Remote Sens. 2017, 11, 036019. [Google Scholar] [CrossRef]
  45. Hillger, D.; Kopp, T.; Lee, T.; Lindsey, D.; Seaman, C.; Miller, S.; Solbrig, J.; Kidder, S.; Bachmeier, S.; Jasmin, T.; et al. First-Light Imagery from Suomi NPP VIIRS. Bull. Am. Meteorol. Soc. 2013, 94, 1019–1029. [Google Scholar] [CrossRef]
  46. Liao, L.B.; Weiss, S.; Mills, S.; Hauss, B. Suomi NPP VIIRS day-night band on-orbit performance. J. Geophys. Res. Atmos. 2013, 118, 12705–12718. [Google Scholar] [CrossRef]
  47. Miller, S.D.; Straka, W., III; Mills, S.P.; Elvidge, C.D.; Lee, T.F.; Solbrig, J.; Walther, A.; Heidinger, A.K.; Weiss, S.C. Illuminating the capabilities of the Suomi National Polar-Orbiting Partnership (NPP) Visible Infrared Imaging Radiometer Suite (VIIRS) Day/Night band. Remote Sens. 2013, 5, 6717–6766. [Google Scholar] [CrossRef] [Green Version]
  48. Chowdhury, P.K.R.; Maithani, S. Monitoring growth of built-up areas in Indo-Gangetic Plain using multi-sensor remote sensing data. J. Indian Soc. Remote Sens. 2010, 38, 291–300. [Google Scholar] [CrossRef]
  49. Imhoff, M.L.; Lawrence, W.T.; Stutzer, D.C.; Elvidge, C.D. A technique for using composite DMSP/OLS ‘‘city lights’’ satellite data to map urban area. Remote Sens. Environ. 1997, 61, 361–370. [Google Scholar] [CrossRef]
  50. Shi, K.; Huang, C.; Yu, B.; Yin, B.; Huang, Y.; Wu, J. Evaluation of NPP-VIIRS night-time light composite data for extracting built-up urban areas. Remote Sens. Lett. 2014, 5, 358–366. [Google Scholar] [CrossRef]
  51. Sutton, P.C.; Anderson, S.J.; Elvidge, C.D.; Tuttle, B.T.; Ghosh, T. Paving the planet: Impervious surface as proxy measure of the human ecological footprint. Prog. Phys. Geogr. Earth Environ. 2009, 33, 510–527. [Google Scholar] [CrossRef]
  52. Yang, Y.; He, C.; Zhang, Q.; Han, L.; Du, S. Timely and accurate national-scale mapping of urban land in China using Defense Meteorological Satellite Program’s Operational Linescan System nighttime stable light data. J. Appl. Remote Sens. 2013, 7, 073535. [Google Scholar] [CrossRef]
  53. Kuang, W.H.; Chi, W.F.; Lu, D.S.; Dou, Y.Y. A comparative analysis of megacity expansions in China and the U.S.: Patterns, rates and driving forces. Landsc. Urban Plan. 2014, 132, 121–135. [Google Scholar] [CrossRef]
  54. Fang, C. Theoretical foundation and patterns of coordinated development of the Beijing–Tianjin–Hebei Urban Agglomeration. Prog. Geogr. 2017, 36, 15–24. (In Chinese) [Google Scholar]
  55. World Bank. East Asia’s Changing Urban Landscape: Measuring a Decade of Spatial Growth; World Bank: Washington, DC, USA, 2015. [Google Scholar]
  56. Gu, C.L.; Min, Z.; Cheng, Z.; XiaoMing, Z.; Chun, W.; Lu, C. Prospects of urban agglomeration in the Changjiang (Yangtze) River Delta. Sci. Geogr. Sin. 2007, 27, 1–8. (In Chinese) [Google Scholar]
  57. Yu, X.; Wu, Z.; Zheng, H.; Li, M.; Tan, T. How urban agglomeration improve the emission efficiency? A spatial econometric analysis of the Yangtze river delta urban agglomeration in China. J. Environ. Manag. 2020, 263, 110399. [Google Scholar] [CrossRef]
  58. Dong, H.; Li, R.; Li, J.; Li, S. Study on urban spatiotemporal expansion pattern of three first-class urban agglomerations in china derived from integrated DMSP-OLS and NPP-VIIRS nighttime light data. J. Geo-Inf. Sci. 2020, 22, 1161–1174. (In Chinese) [Google Scholar]
  59. Chen, Z.; Yu, B.; Yang, C.; Zhou, Y.; Yao, S.; Qian, X.; Wang, C.; Wu, B.; Wu, J. An extended time series (2000–2018) of global NPP-VIIRS-like nighttime light data from a cross-sensor calibration. Earth Syst. Sci. Data 2021, 13, 889–906. [Google Scholar] [CrossRef]
  60. European Space Agency. Land Cover CCI Product User Guide Version 2. Tech. Rep. 2017. Available online: Maps.elie.ucl.ac.be/CCI/viewer/download/ESACCI-LC-Ph2-PUGv2_2.0.pdf (accessed on 7 June 2021).
  61. Yang, Y.; Xiao, P.; Feng, X.; Li, H. Accuracy assessment of seven global land cover datasets over China. ISPRS J. Photogramm. Remote Sens. 2017, 125, 156–173. [Google Scholar] [CrossRef]
  62. Zhao, M.; Cheng, W.; Zhou, C.; Li, M.; Huang, K.; Wang, N. Assessing spatiotemporal characteristics of urbanization dynamics in southeast asia using time series of DMSP/OLS nighttime light data. Remote Sens. 2018, 10, 47. [Google Scholar] [CrossRef] [Green Version]
  63. Chen, J.; Zhuo, L.; Shi, P.; Ichinose, T. The study on urbanization process in china based on DMSP/OLS Data: Development of a light index for urbanization level estimation. J. Remote Sens. 2003, 7, 168–175. (In Chinese) [Google Scholar]
  64. Xu, M.; Li, C.; Liu, H.; Wang, H. Delta based on DMSP/OLS data. Remote Sens. Land Resour. 2011, 3, 106–112. [Google Scholar]
  65. Zhuo, L.; Shi, P.; Chen, J.; Ichinose, T. Application of compound night light index derived from DMSP/OLS data to urbanization analysis in China in the 1990s. Acta Geogr. Sin. 2003, 58, 893–902. (In Chinese) [Google Scholar]
  66. He, C.; Liu, Z.; Gou, S.; Zhang, Q.; Zhang, J.; Xu, L. Detecting global urban expansion over the last three decades using a fully convolutional network. Environ. Res. Lett. 2019, 14. [Google Scholar] [CrossRef]
  67. Cao, X.; Chen, J.; Imura, H.; Higashi, O. A SVM-based method to extract urban areas from DMSP-OLS and SPOT VGT data. Remote Sens. Environ. 2009, 113, 2205–2209. [Google Scholar] [CrossRef]
  68. Shi, L.; Taubenböck, H.; Zhang, Z.; Liu, F.; Wurm, M. Urbanization in China from the end of 1980s until 2010-spatial dynamics and patterns of growth using EO-data. Int. J. Digit. Earth 2019, 12, 78–94. [Google Scholar] [CrossRef]
  69. Yu, Z.; Yao, Y.; Yang, G.; Wang, X.; Vejre, H. Spatiotemporal patterns and characteristics of remotely sensed region heat islands during the rapid urbanization (1995–2015) of Southern China. Sci. Total Environ. 2019, 674, 242–254. [Google Scholar] [CrossRef]
  70. Liu, J.; Zhang, Q.; Hu, Y. Regional differences of China’s urban expansion from late 20th to early 21st century based on remote sensing information. Chin. Geogr. Sci. 2012, 22, 1–14. [Google Scholar] [CrossRef]
  71. Xiao, P.; Wang, X.; Feng, X.; Zhang, X.; Yang, Y. Detecting China’s urban expansion over the past three decades using nighttime light data. IEEE J. Sel. Top. Appl. Earth Obs. Remote Sens. 2014, 7, 4095–4106. [Google Scholar] [CrossRef]
  72. Chen, A.; Yao, L.; Sun, R.; Chen, L. How many metrics are required to identify the effects of the landscape pattern on land surface temperature? Ecol. Indic. 2014, 45, 424–433. [Google Scholar] [CrossRef]
  73. Zhou, W.; Huang, G.; Cadenasso, M.L. Does spatial configuration matter? Understanding the effects of land cover pattern on land surface temperature in urban landscapes. Landsc. Urban Plan. 2011, 102, 54–63. [Google Scholar] [CrossRef]
  74. Zhou, Y.; Smith, S.J.; Elvidge, C.D.; Zhao, K.; Thomson, A.; Imhoff, M. A cluster-based method to map urban area from DMSP/OLS nightlights. Remote Sens. Environ. 2014, 147, 173–185. [Google Scholar] [CrossRef]
  75. Zhou, Y.; Smith, S.J.; Zhao, K.; Imhoff, M.; Thomson, A.; Bond-Lamberty, B.; Asrar, G.R.; Zhang, X.; He, C.; Elvidge, C.D. A global map of urban extent from nightlights. Environ. Res. Lett. 2015, 10. [Google Scholar] [CrossRef]
  76. He, X.H.; Qiao, M.J. Research on coordination of urbanization and driving forces of urban agglomeration in China based on nighttime light data. In Proceedings of the 2018 7th International Conference on Agro-geoinformatics (Agro-geoinformatics), Hangzhou, China, 6–9 August 2018; pp. 108–113. (In Chinese). [Google Scholar]
  77. Li, Y.; Ye, H.; Sun, X.; Zheng, J.; Meng, D. Coupling analysis of the thermal landscape and environmental carrying capacity of urban expansion in Beijing (China) over the past 35 years. Sustainability 2021, 13, 584. [Google Scholar] [CrossRef]
  78. Taubenböck, H.; Weigand, M.; Esch, T.; Staab, J.; Wurm, M.; Mast, J.; Dech, S. A new ranking of the world’s largest cities-Do administrative units obscure morphological realities? Remote Sens. Environ. 2019, 232, 111353. [Google Scholar] [CrossRef]
  79. Li, X.; Li, X.; Li, D.; He, X.; Jendryke, M. A preliminary investigation of Luojia-1 night-time light imagery. Remote Sens. Lett. 2019, 10, 526–535. [Google Scholar] [CrossRef]
  80. Li, X.; Zhao, L.; Li, D.; Xu, H. Mapping urban extent using Luojia 1-01 nighttime light imagery. Sensors 2018, 18, 3665. [Google Scholar] [CrossRef] [PubMed] [Green Version]
  81. Wallner, S.; Kocifaj, M. Impacts of surface albedo variations on the night sky brightness—A numerical and experimental analysis. J. Quant. Spectrosc. Radiat. Transf. 2019, 239, 106648. [Google Scholar] [CrossRef]
  82. Shi, L.; Wurm, M.; Huang, X.; Zhong, T.; Leichtle, T.; Taubenböck, H. Urbanization that hides in the dark—Spotting China’s “ghost neighborhoods” from space. Landsc. Urban Plan. 2020, 200, 103822. [Google Scholar] [CrossRef]
Figure 1. Locations of the three urban agglomerations (B: YRD, C: BTH, D: GBA) in China and the distribution of the cities or provinces therein. The NTL image was derived from 2018 data. (A): NTL image of China in 2018. (BD): Locations of YRD, BTH, and GBA.
Remotesensing 13 02245 g001
Figure 2. The flow chart for extracting urban areas by determining dynamic thresholds.
Remotesensing 13 02245 g002
Figure 3. Temporal variations in the log-transformed NTL intensities and corresponding lit pixel counts in the three urban agglomerations (A: BTH, B: YRD, C: GBA) from 2000 to 2018. Panel (D) indicates the change in NTLAI in the three urban agglomerations from 2000 to 2018.
Remotesensing 13 02245 g003
Figure 4. The dynamics of thresholds and linear trends from 2000 to 2018 in the three urban agglomerations. In the equation, y denotes the thresholds, and x denotes the year.
Remotesensing 13 02245 g004
Figure 5. Extended time-series (2000–2018) nighttime light images in the three urban agglomerations. (AC) represent BTH, YRD, and GBA, respectively. The arrows and rectangles represented the core cities of each urban agglomeration. The NTL intensity of each image is different. The detailed intensity values can be obtained from Section 3.1.
Remotesensing 13 02245 g005
Figure 6. (AC) Urban area extracted from NTL images of BTH, YRD, and GBA, respectively. (DF) The trends of urban areas and their relative expansion rates in three urban agglomerations in different years from 2000 to 2018.
Remotesensing 13 02245 g006
Figure 7. Results of the standard deviation ellipses of urban areas for three urban agglomerations from 2000 to 2018. (AC) BTH, YRD, and GBA. (DF) The locally enlarged ellipse for each image.
Remotesensing 13 02245 g007
Table 1. Comparison of the socioeconomic statuses of the three most developed urban agglomerations in China in 2000 and 2018.
Urban AgglomerationTotal Area (km2)Core CitiesTotal Population (Million)Percentage of Urban Population (%)GDP (Billion USD)GDP per Capita (USD)
The Beijing–Tianjin–Hebei urban agglomeration (BTH)218,000Beijing, Tianjin107.57 (90.26)65.84 (38.97)1282.67 (124.06)11,089.24 (1364.07)
The Yangtze River Delta urban agglomeration (YRD)359,000Shanghai225.36 (195.53)67.26 (42.51)3195.81 (271.66)14,229.61 (1375.56)
The Guangdong–Hong Kong–Macao Greater Bay Area (GBA)56,000Guangzhou, Shenzhen, Hong Kong71.09 (49.99)84.33 (72.90)1653.96 (307.91)24,310.08 (5908.35)
Note: The statistical data are included for both 2018 and 2000 (shown in the brackets). This statistical data can be obtained from the National Bureau of Statistics: http://www.stats.gov.cn/english/ (accessed on 7 June 2021).
Table 2. Pearson correlation coefficients between the four NTL indexes and the urban statistical data of 2018.
NTL IndexPearson Correlation Coefficients (Significance: Two-Tailed)
Economic MetricsPopulation MetricsLand-Use Metrics
GDPGDP per CapitaProportion of Non-Agricultural Industry Product in GDPPopulation DensityUrban Population DensityRatio of Urban PopulationConstruction Land AreaBuilt-Up Area
Luminous Area0.0670.268 *0.0880.7250.3290.0680.5070.611
(0.599)(0.028)(0.634)(0.096)(0.635)(0.836)(0.432)(0.371)
Average NTL intensity0.928 **0.896 **0.593 **0.851 **0.643 **0.379 *0.753 *0.803 **
(0.000)(0.001)(0.000)(0.000)(0.000)(0.042)(0.017)(0.003)
Total NTL intensity0.830 **0.892 *0.482 *0.809 **0.631 **0.4360.648 *0.705 **
(0.000)(0.028)(0.023)(0.006)(0.000)(0.129)(0.043)(0.000)
Composited NTL index0.855 **0.830 **0.4770.793 **0.6030.3570.681 *0.763
(0.000)(0.000)(0.063)(0.000)(0.227)(0.085)(0.048)(0.067)
Note: The result included both the coefficients (shown in bold) and significance (included in the parentheses). The statistical data can be obtained from the National Bureau of Statistics: http://www.stats.gov.cn/english/ (accessed on 7 June 2021). * The correlation was significant at the 0.05 level (two-tailed). ** The correlation was significant at the 0.01 level (two-tailed).
Table 3. The parameters from the directional distribution analysis using standard deviation ellipses and cohesion indexes of urban areas in three urban agglomerations for 2000, 2005, 2010, 2015, and 2018.
RegionYearShort Axis (X) (km)Long Axis (Y) (km)Latitude of Center PointLongitude of Center PointRotationCohesion Index
BTH200097.95219.2339°03′24″116°15′21″23.5390.12
200598.02217.8838°59′06″116°14′50″23.0090.80
2010100.06218.4738°55′15″116°16′04″21.8390.86
2015101.96220.6238°53′00″116°16′53″20.7289.91
2018103.67220.2638°53′12″116°18′30″20.9891.25
YRD2000151.17317.2231°15′10″119°48′34″139.4387.17
2005154.33330.6531°29′16″119°30′54″139.1086.24
2010151.84320.3331°33′23″119°31′57″138.8089.18
2015146.61314.3231°32′07″119°38′08″138.5791.62
2018147.85309.6131°31′41″119°37′44″138.3592.83
GBA200072.7245.6522°51′45″113°31′40″96.8293.88
200571.3446.5022°52′17″113°34′32″92.6697.37
201071.3347.9022°52′41″113°32′04″91.7498.52
201571.7749.1122°52′47″113°30′51″91.2198.94
201871.5949.7422°52′44″113°30′11″89.7099.24
Publisher’s Note: MDPI stays neutral with regard to jurisdictional claims in published maps and institutional affiliations.

