
An Unmanned Lighter-Than-Air Platform for Large Scale Land Monitoring


1
Department of Mechanical and Aerospace Engineering, Politecnico di Torino, Corso Duca Degli Abruzzi, 24-10129 Turin, Italy
2
Interdipartimental Responsible Risk Resilience Centre (R3C), Politecnico di Torino, Corso Castelfidardo, 22-10128, Turin, Italy
3
Department of Structural, Geotechnical and Building Engineering, Politecnico di Torino, Corso Duca Degli Abruzzi, 24-10129 Turin, Italy
*
Author to whom correspondence should be addressed.
Remote Sens. 2021, 13(13), 2523; https://0-doi-org.brum.beds.ac.uk/10.3390/rs13132523
Submission received: 27 April 2021
/
Revised: 23 June 2021
/
Accepted: 24 June 2021
/
Published: 28 June 2021
(This article belongs to the Special Issue Single and Multi-UAS-Based Remote Sensing and Data Fusion)
Abstract
:The concept and preliminary design of an unmanned lighter-than-air (LTA) platform instrumented with different remote sensing technologies is presented. The aim is to assess the feasibility of using a remotely controlled airship for the land monitoring of medium sized (up to 107 m2) urban or rural areas at relatively low altitudes (below 1000 m) and its potential convenience with respect to other standard remote and in-situ sensing systems. The proposal includes equipment for high-definition visual, thermal, and hyperspectral imaging as well as LiDAR scanning. The data collected from these different sources can be then combined to obtain geo-referenced products such as land use land cover (LULC), soil water content (SWC), land surface temperature (LSC), and leaf area index (LAI) maps, among others. The potential uses for diffuse structural health monitoring over built-up areas are discussed as well. Several mission typologies are considered.
1. Introduction
It is well-known that the monitoring of land use and land cover (LULC) transformations is strongly linked to the availability, periodicity, (thematic) accuracy and (geometric) precision of territorial databases [1]. In turn, this knowledge allows for the prediction of the potential future environmental changes, both positive and detrimental ones, and support informed decision-making for short and long-term countermeasures [2].
In recent years, with the growing use of geographic information systems (GISs) as a support for the systematic analysis of large areas, a convergence has arisen between method and merit in the phases of acquisition, processing, and subsequent statistical and cartographic treatment of territorial data. That is, the production of cartography and data relating to environmental monitoring not only depends on the methodologies used for their production but also determines their information content. Therefore, new acquisition strategies have to be designed to accommodate the needs of land use planners. This is also particularly relevant for related objectives such as GIS-based land use suitability analysis [3].
In this sense, there is an evident gap in the current data sources. For instance, Diaz-Pacheco et al. [4] pointed out how the space-borne CORINE Land Cover (CLC) database, arguably the one most utilised by European planners, researchers, and policy makers, lacked accuracy at the local (e.g., urban) level as of the early 2010s. The same limitations can be extended to other land use/land cover geodatabases which rely on satellite data (see Wickham et al. [5]). Indeed, the CLC average scale (1:100,000) and extensive territorial coverage, while being well-suited for strategic analyses at national scale, can be deemed as ‘inappropriate’ [4] for understanding land use dynamic at a local scale, e.g., in an urban context.
While the CORINE Land Cover database has the great merit of having spread by now a universally recognised thematic nomenclature of classifying land use and land coverings, its shortcomings in terms of practical use in the context of territorial governance are well-known:
- (a)
- its limited periodicity (1990, 2000, 2006, 2012, 2018)
- (b)
- its minimum mapping unit (MMU) for coverage not lower than 25 hectares
- (c)
- the minimum width of the linear elements not lower than 100 m, and
- (d)
- its minimum mappable unit (MMU) for land cover changes (LCC) not lower than 5 hectares.
Therefore, the issue is not limited only to a matter of spatial resolution, but also of timely updating (which accounts for all the phases of data acquisition, pre-processing, LULC classification, and LULC change identification). It is no coincidence that since the mid-2000s almost all the Italian regions have used self-produced land use and land cover maps, mainly using orthophoto images produced by the Agenzia per le erogazioni in agricoltura (Italian Agricultural Payments Agency, AGEA) or other conventional or unconventional sources. Nevertheless, this was achieved at the cost of relevant acquisition and processing costs, with very long production times which often made maps and related data obsolete. Therefore, the cost-efficiency and immediate availability of raw data are two other main factors.
Thus, there is an undeniable need to integrate large-coverage databases with local acquisitions for improved accuracy at smaller territorial scales. These would require acquisition in the visible and in the infrared (IR) ranges of electromagnetic waves, performed at a relatively low cost per surface area, with an easily deployable platform.
For this aim, classic solutions include the use of ground-based, hand-held or truck-loaded technologies [6], fixed-wing [7] or multi-rotor [8] unmanned aerial systems (UASs), manned rotorcraft [9], and manned fixed-wing aircraft [10]. Recently, even stratospheric airships and near-space vehicle prototypes have been proposed for land observations, filling the gap between air- and space-borne imaging [11].
Each one of these local survey strategies has its own advantages and limitations (which will be detailed later in Section 1.3), also in comparison to satellite imagery. In general, none of these classic alternatives can simultaneously guarantee low operating costs, fast deployment, and large surface coverage.
There is therefore a well-recognised and unquestionable potential for robotic airships as a low-speed, low-altitude means for aerial monitoring, especially for tracking environmental changes over large surface areas [12].
This article proposes the concept and preliminary design of an innovative remotely piloted aircraft system (RPAS) for land survey, specifically, a lighter-than-air (LTA) platform equipped with a vast array of remote sensing devices. These include instruments for hyperspectral and thermal imaging, as well as laser imaging detection and ranging (LiDAR) and georeferencing capabilities.
The manuscript is organised as follows. In Section 1.1, the aim and scope of the envisioned prototype are stated. Section 1.2 describes the various LTA platforms available for remote sensing, while Section 1.3 provides a detailed comparison with other alternative remote sensing platforms. Section 2 describes the various regulations governing the airship design and establishes the final mission requirements for the envisioned airship prototype. Section 3 presents the proposed airship concept and details the various sensors included as part of the payload. Section 4, Section 5 and Section 6 describe the design of the various airship subsystems based on the operational requirements of the mission. Section 4 focuses on the structural design of the primary load-bearing structure of the semi-rigid airship. The selection and sizing of the onboard power system are discussed in Section 5, while Section 6 describes the design of the main propulsion system, comprising of six propellers, and a thrust vector control system for mid-air manoeuvring. Section 7 briefly discusses the various components of the ground station, and Section 8 gives a cost analysis for the entire proposal. Finally, Section 9 (Discussion) and Section 10 (Conclusions) discuss the overall design and present the major conclusions and directions for future work.
1.1. Aim and Scopes
There are several potential uses for the proposed RPAS LTA platform. The main aim, as specified previously, is (i) the accuracy improvement and correction of LULC maps defined at national or regional levels with localised surveys, and (ii) their constant and regular updating for LULC change detection. This can be achieved with supervised and/or unsupervised classification techniques, using visual, thermal, and hyperspectral data as a combined input (the specifics of signal processing is not the main focus of this paper and are not discussed here; one can refer to the vast scientific literature [13,14,15] for the several ambits of application).
Other potential uses include, but are not limited to, environmental monitoring in a broader sense. This encompasses soil and water quality monitoring [16]; crop classification and precision agriculture [17]; forest monitoring [12]; mineralogical and geophysical survey and monitoring of surface mines [18]; and risk mapping (e.g., for fire, rockslide, snowfall hazards, or flooding [19]). Desertification, ice melting, and other phenomena induced by climate change can be tracked, as well as human activities detection in ecological protection areas. In the case of large-scale natural disasters, outdoor aerial systems can be utilised for search and rescue (SAR) efforts, performing patrolling over disaster-stricken areas, victim searching, and mapping activities. LTA platforms are particularly convenient in this sense thanks to their capability to hover with low fuel consumption [20]. Visual assessment can be used for post-earthquake surveys as well, with the potential to monitor the aftermath on both the natural and the built environment. The addition of other sensing technologies will further increase the platform potentiality (e.g., using hyperspectral data for the evaluation of soil liquefaction).
The RPAS LTA platforms can be used as well for maintenance and continuous monitoring, and protection of critical structures, e.g., bridge monitoring [21]. Long endurance, low cost platforms will also be essential for the future development of (aerial) non-contact structural health monitoring (SHM) systems. This concept is gaining traction in the structural engineering community for the damage assessment of monuments, infrastructures, or built-up areas. Aerial monitoring can record seasonal changes in both the structure(s) of interest and the topsoil composition of the neighbouring ground and the soil underneath, which influences the dynamic behaviour of the structure. This can be more conveniently done with a remotely controlled platform [22]. Finally, apart from civil applications, aerial platforms with optical instruments can be retrofitted for persistent intelligence, surveillance, and reconnaissance (ISR) for homeland, border, and maritime security.
All these tasks can be fulfilled with image-based data processing, land surface temperature (LST) directly extracted from thermal imaging or indirectly estimated from hyperspectral imaging, and other indirect indices such as leaf area index (LAI [23]), soil water content (SWC) and similar soil moisture indices [24], etc. These latter ones can all be estimated from the hyperspectral signature (i.e., the repartition of the captured reflectance, depurated of atmospheric and other confounding factors, in specific wavelength bands) of the target areas and objects. LST can be achieved directly from thermal infrared (TIR) measurements or indirectly from the hyperspectral signature. When available, this first option is generally much more accurate, especially in built-up environments for the assessment of waste hast-induced urban heat islands [25] and for the detection of anomalous surface thermal patterns. Both hyperspectral bands and temperature can then be used to classify urban and rural land use and land cover.
The sensor data can be combined with a LiDAR and integrated global positioning system (GPS) to produce a hypercloud, i.e., a representation of the hyperspectral data cube and other acquired data (or their derived indices) on a geometrically correct, 3-dimensional model of the land surface. This will allow for an intuitive visualisation of the acquired/processed information.
In comparison with similar projects (detailed in the following Subsection), it is evident that there is a lack of multi-instrumented LTA platforms for land surveys and environmental monitoring. The prototype most similar to the design proposed here is the ACC15X multi-sensor airship [26], intended for the mapping of medium-sized areas (1–10 km2) [27]. The onboard instrumentation included a SICK LD-LRS1000 LiDAR with conical modification, an Olympus E-PM1 digital camera in the visible spectrum, and an FLIR SC645 thermometric camera. However, the Czech prototype did not include any sensor for multi- or hyper-spectral imaging, which are currently considered one of the most effective tools for remote sensing in general and LULC specifically [28]. This addition also allows covering, without gaps, the wavelength spectrum from visible to infrared (i.e., ~380 to ~14,000 nm).
1.2. Manned and Unmanned LTA Platforms for Remote Sensing
Some previous proposals and prototypes of similar RPAS LTA platforms for remote sensing are enlisted in Table 1.
Another project, the “NARVAL”, proposed in 2000 by the Instituto Superior Técnico-Instituto de Sistemas e Robótica (IST-ISR) [29] was tested only as a miniaturised model for indoor use; it also included a video-based control system [30] (length: 2.13 m, max diameter: 0.74 m).
Remote sensing platforms for militarised warzones deserve a separate mention. In this specific context, the main reasons behind the use of an LTA platform over standard helicopter surveys are the absence of rotor downwash (which can detonate unexploded bombs), the ‘friendlier’ shape and reduced noise, perceived as less threatening in a conflict zone, the reduced amount of metallic structural components, and the capability to withstand more bullet holes (with respect to a rotorcraft) before falling [31]. However, only manned airships have been proposed for this role, e.g., the 45 m-long “MineSeeker” project [31], operated first in 2000 in Kosovo to perform video and photo surveys of minefields, and the US Navy and Loral Defense Systems-Akron (“LDSA”), which attached a laser-based system for underwater mine detection to the 63-m-long, 14-m-wide “Spirit of Akron” manned non-rigid airship [32]. However, it is quite self-evident that an unmanned LTA platform would be preferable for visual surveying in a combat scenario.
The RPAS LTA presented here is distinguished from these and other designs due to the following features: (1) the proposed shape (prolate spheroid) of the envelope, (2) the propulsion system with thrust vectoring control, inherited from previous projects (Battipede et al. (2006) [33]), and (3) the vast number of devices carried for remote sensing, covering the broadest range of electromagnetic wavelengths conceived so far (uninterruptedly from the visible to the thermal infrared radiation).
All these aspects, plus the advantages which stem from them, will be described in detail in dedicated sections.
1.3. Comparison with Other Land Survey Strategies
The convenience of LTA-based airborne measurements depends on the size of the surveyed area. In this sense, the other direct competitors in the field of remote sensing are fixed and rotary-wing manned and unmanned aircraft, as well as space-borne measurements [38]. The size of the surveyed area increases proportionally with the operating altitude, as qualitatively shown in Figure 1. Conversely, the ground resolution decreases as altitude increases. Therefore, none of these strategies are seen to present an ideal solution. Some of the commonly used land survey strategies are briefly discussed below.
On-site surveys using ground-based instruments are the classic and most common form of land survey, especially for small and very small areas. While they are the most flexible and versatile solution from a logistic perspective, they still require personnel to be dispatched locally, making them labour intensive and cost-inefficient. The integration of ground-based systems with UASs has been proposed by Kirsch et al. [43] to achieve close-range hyperspectral imagery with higher spatial resolutions from different angles of view.
Low-altitude, low-cost small UAS solutions are a natural extension to standard field surveys due to the larger operational range, combined with very flexible and generally non-standardised survey procedures. Khaliq et al. [44] showed that UAV-based local and low-altitude imagery produced more reliable results for precision agriculture purposes when compared to space-born satellite mapping. A similar comparison between UAV and satellite data was made by Pádua et al. [45] for post-fire monitoring. Boon et al. [46] showed that fixed-wing UAVs reported less accurate information for environmental mapping than multirotor UAVs due to the lower image quality caused by the longer exposure times at higher flight speeds. An issue with small-sized UASs is related to the limited payload volume: payload is restricted to one or two lightweight devices, and onboard magnetic disturbances increases, affecting the sensors’ readings and navigation performances [47].
Manned rotorcraft surveys are a good solution for covering large areas (inaccessible to small UAVs) and allows hovering performance similar to an LTA platform. However, compared to LTAs, rotorcrafts do not allow silent flight and generate rotor downwash, making them non-ideal candidates for night-time surveys above inhabited areas. Moreover, their surveillance and the total flight time are much more limited and expensive (in terms of cost per flight hour), making them a poor solution when long endurance is required. Vallet [48] describes an interesting system for integrating helicopter-borne LiDAR and photogrammetry sensing systems.
Low or medium-altitude manned aircraft surveys are a ‘halfway’ option between satellite and UAV-based solutions considering the surveyed area size. Matese et al. [49] compared the cost per hectare of surveyed areas for aircraft, UAV, and satellite multispectral imaging, and showed that aircraft survey costs did not scale up as rapidly as for UAVs, making it more cost-efficient for areas slightly larger than 5 ha. However, the costs of flight hours for a fixed-wing aircraft still exceed the operating costs of an LTA solution for the same amount of surveyed area. Also, the acquired data suffers from the high flight speed, resulting in overall poorer quality of results. Similar to helicopter surveys, small fixed-wing surveys are not cost-efficient over large areas and have poor eco-compatibility, both in pollution and noise.
Space-borne measurements are the standard for large-scale land surveys offering good performance but have an extremely high initial cost of launching the satellite into orbit. Compared to local solutions, which can be deployed rapidly and when needed, space-borne acquisitions are available only at certain times (depending on the orbit) and may be unusable during cloudy weather conditions.
Figure 2 reports a qualitative comparison of the main features between the proposed LTA platform and other comparable alternatives described above. Very few comparative studies for remote sensing, including LTA solutions, are found in the literature. For instance, Koska et al. [27] compared the already-mentioned ACC15X prototype with measurements from fixed-wing UAVs and a conventional aircraft for waste heap monitoring. The ACC15X (which has similarities to the design proposed here) performed comparatively well in photogrammetric and LiDAR measurements (with a data density of 15 laser-scanned points per m2 at an average span of ~0.20 m) and good vegetation penetrability for forested areas. In terms of the time elapsed for the survey of the whole area, the airship and the UAV spanned a roughly similar area in about 4–5 h with no major differences. In this regard, the longer flight preparation time of the LTA vehicle, mainly due to the gas compression phase, should also be considered [27]. Nevertheless, the install time of the LTA vehicle is expected to be low enough to make it competitive with other aircraft options.
2. Design Regulations and Requirements
2.1. European Regulations
According to the European Aviation Safety Agency (EASA), RPASs represent a subgroup of unmanned aircraft systems (UASs). To ensure the safety of persons on the ground and other airspace users during unmanned aircraft operations, appropriate requirements relating to airworthiness and personnel involved have been established. For European Union (EU) and EASA member states, the current (2021) legal framework is defined by the EU Regulations 2019/947 and 2019/945 [50]. Due to its take-off mass (>25 kg limit of the ‘open’ category), flight height (>120 m above ground level), its potential use beyond visual line of sight (VLOS), and in particular, its intended use over urban centres (i.e., over assemblies of people), the proposed LTA platform falls into the ‘certified’ category of UAS operations. These are therefore subject to the applicable operational requirements laid down in the Commission Implementing Regulation (EU) No 923/2012 [51] and Commission Regulations (EU) No 965/20122 [52] and (EU) No 1332/2011 [53]. In Italy, the EU requirements have been very recently implemented by the Italian Civil Aviation Authority (ENAC) in the new first edition of the UAS regulations [54]. The preventive risk analysis of the whole system is strictly required as well, similarly to other platforms [55].
2.2. Survey Strategy
For airborne surveys, the target area is generally divided into a grid, resulting in rows corresponding to flight paths. The length of the survey lines and the interline spacing or overlapping can be selected depending on the type of survey being performed, as well as the aircraft survey speed and altitude. The aerial platform flies a straight path for a certain distance to collect survey data along that path. In this sense, forward and side overlap are expected to be at least 60–65% and 30–35%, respectively for optimal acquisition [39]. Zhang [56] suggests 80% forward and 75% side overlap for high altitude precision from photogrammetry and aerial triangulation, while the side overlap can be slightly reduced (down to 50%) if the focus is limited to planar precision. These settings are intended to improve the adjacent image matching process to achieve the final image mosaic of the whole surveyed area.
In the most classic strategy (depicted in Figure 3a) the airship reverses directions to fly a straight path to collect survey data from the terrain along the strip adjacent and parallel to the first flight path. Thus, the airship can fly in a series of nominally parallel survey lines until the total target area has been covered. The manoeuvrability of the airship allows for straight lines to be flown, yet the turning manoeuvre is generally much slower than the rest of the operation.
Figure 3b shows another flight pattern that can be used to cover the same survey area instead of the one described above. This alternative flight pattern uses what is known as “race-tracking”, i.e., the reverse path is flown along a row that is spaced apart from the immediately preceding one to increase the efficiency of the turns made by the airship when the survey lines are closely spaced.
The proposed survey strategy, graphically portrayed in Figure 3c, and allowed by the peculiar envelope design, eliminates the need for 180° turns, thus reducing the manoeuvre time and the survey time overall.
2.3. Mission Requirements
The standard course of action of a typical airborne land survey mission comprises of:
- -
- Stand-by (definition of the course plan while grounded and ready for flight).
- -
- Take-off (ideally from a location as close as possible to the reconnaissance area; automated start-up and take-off in safe weather conditions can be included in this step).
- -
- Cruise flight (required operations include continuous wireless communication with the ground base, semi-automated obstacle avoidance, continuous fuel analysis, continuous structural health monitoring (SHM) analysis, and automated activation of protocols for emergency landing).
- -
- Survey (required operations include stable positioning, active control of the camera and other sensing equipment, high-quality data acquisition, continuous wireless communication with the ground base, and semi-automated obstacle avoidance).
- -
- Landing (required operation include automated landing, quick data transfer and backup, automated confirmation of safe landing, and semi-automated set-up for next flight).
The design of these phases must satisfy the mission requirements. In this specific case, to make the proposed solution competitive for urban-scale mapping, the mission requirements defined are
- Capability to survey a maximum area of 107 m2,
- Maximum take-off to survey site distance (cruise distance) of 20 km.
These values represent the standard scenarios envisioned for the proposed LTA platform. The airship is designed to achieve these requirements for the multi-sensor payload (which is described in detail in Section 3.1). The sensors are defined to meet the following criteria of ground resolution for fine mapping (for any mission typology and flight height):
- Not lower than 1 point every 0.05 m for the photogrammetry.
- Not lower than 1 point every 1 m for the thermographic and hyperspectral measurements.
- Not lower than 1 point every 0.5 m for LiDAR measurements.
The requirements for the optical acquisitions derive from the comparison with satellite ground resolution (e.g., the PRISMA satellite has a ground resolution of 5 m in the visible range and 30 m for the hyperspectral bands [57]). The requirements for the LiDAR acquisitions have been defined in order to be suitable for accurate 3D urban modelling (level of detail LOD3 according to Gröger et al. [58]).
The payload is thus estimated to weigh 100 kg. This operational load needs to be
- Carried while proceeding at a speed of 14–22 m/s and an altitude of 500–1000 m during the cruise to the target area, and
- Carried and power-supplied at a speed of 7.5–15 m/s (optimally 13 m/s) and an altitude of 450–900 m (optimally 500 m) above mean sea level during survey operations.
This last condition is derived from the data acquisition speed of several devices to enforce reliable measurements at low speeds (as mentioned above, more details will be discussed in Section 3). It also accounts for the forward overlap needed to acquire shared reference points in consecutive frames for image mosaicking. The calculations for the covered area accounted for the side overlap between parallel strips as well, again for image mosaicking purposes. The optimal altitude for surveying is considered to be 500 m above ground level which, in most cases, ensures operation below cloud level.
Survey speed and the total area covered (including overlaps) define the maximum duration of the mission i.e., the time needed for autonomous uninterrupted operation, also accounting for the energy consumption of the sensors and onboard instruments.
For comparison, the second phase of the AURORA project was intended to fulfil the following requirements [12]: (1) typical mission duration up to 8 h, (2) typical distance from base to target area between 10–50 km, and (3) payload of ~50 kg. The first phase (limited to a 10 kg payload and to missions lasting up to 2 h within a radius of 10 km) was expected to be achieved with a 9 m long, 30 m3 airship equipped with two engines with thrust vector control. This sizing is proportionally in line with the output of the proposal presented here for much larger distances and greater payload weight.
3. The Proposed Airship Concept
The main limitations of conventional airships can be summarised as:
- Strong sensitivity to lateral winds and gusts,
- Limited manoeuvrability and flight envelope,
- Poor control capabilities in hovering and at low speeds,
- Poor capability of operating in adverse environmental conditions,
- Relatively wide ground area required for take-off and landing,
- Multiple ground crew members required, and
- Slow to reverse the direction of travel during survey operations (also requires a large turning radius).
The structural and design innovations presented in this concept are intended to overcome these limitations. Specifically, points 1–6 can be solved using the thrust vectoring technology, described in detail in Section 6.2). An ellipsoidal envelope (more precisely, a prolate spheroid shape, as defined in Carichner et al. [59], Chapter 3) is proposed to make the airship capable of moving backwards without manoeuvring, thus reducing survey time.
Therefore, the proposed RPAS LTA platform (shown in Figure 4) has a single-hull with a prolate spheroid envelope, a single-rib (exoskeletal) load-bearing structure, six external propellers for propulsion and thrust vector control, and a four-legged landing system. All these aspects will be addressed in detail later. The structural convenience of the single-hull exoskeletal solution was highlighted in Cappadona et al. [60].
The envisioned onboard remote sensing instrumentation is intended to be as complete as possible and superior to any concept proposed so far. The payload can be fully contained in the airship gondola and it will be detailed in the next Subsection.
3.1. Payload Design
Regarding the payload, it is important to notice that
- The LTA platform allows for a larger payload than the alternatives described before,
- The payload weight is a modest percentage of the total weight (roughly ~5%); it can be increased further with minimal design variations and additional operating costs to accommodate other sensors (e.g., magnetometers as presented in Kim et al. [61] for aeromagnetic geosurveys, radar systems, or even microwave sensors for subsurface imaging [62]).
3.1.1. Remote Sensors
Sensor selection among all possible useful remote sensing tools is carried out considering their operating costs (due to their weight and energy consumption) and expected output (i.e., the products which can be defined from their measurements). The four devices deemed most cost-efficient are: a high-definition (HD) video camera, a large-range hyperspectral sensing system, a thermometric camera, and a light detection and ranging (LiDAR) sensor.
The LiDAR has been included for georeferencing the measurements and for profiling the land surface topography, potentially for 3D geographic information system (GIS) mapping. This can be achieved by exploiting the Global Positioning System (GPS), already present onboard for navigation purposes, through a dedicated high-precision time synchronisation board similar to the procedure described in Koska et al. [27], Section 2.1.3.
The digital camera is intended to collect visual information in the 380–700 nm wavelength range of the electromagnetic spectrum (even if the model actually selected allows for near IR acquisitions as well). The dual hyperspectral sensors can collect, respectively, in the visible and near-infrared (VNIR) and the short-wave infrared (SWIR) ranges (about 400–970 nm and 970–2500 nm, respectively). Finally, the thermometric camera captures information between ~1000–14,000 nm, i.e., spanning the SWIR as well as the mid-wave infrared (MWIR) and long-wave infrared (LWIR) light emissions (Figure 5).
It is important to recall that VNIR and SWIR wavelengths are mainly reflected radiations (“reflected infrared”, which can provide information regarding the chemical composition of the irradiated object, according to its absorbed bands), while MWIR and LWIR are mostly emitted from the object itself (“thermal infrared”), thus indicating its physical or thermal state and energy content. These two wavelength ranges can therefore carry different information and have distinct uses in remote sensing [25]. The intended acquisition system can span uninterruptedly over a band of more than 104 nm and with overlaps between all sensors, which can be exploited for double-checking or discerning the observed phenomena.
For illustration, the following commercial products are considered (see Figure 6):
- 1 Phase One® iXM-RS150F camera,
- 1 NEC® TH9260 thermographic camera,
- 1 SPECIM® AisaDUAL hyperspectral system,
- 1 Optech® ALTM Galaxy T1000 laser scanner.
The actual commercially available or purposely made sensors may vary in their exact specifications; to present a potential configuration, the following sensors have been deemed as appropriate.
For instance, the Phase One® iXM-RS150F camera [63] (see Figure 6a) is a product specifically made for aerial survey uses. It can acquire simultaneously in the RGB and near IR bands within four bands, combining them in automatic data fusion to generate distortion-free images co-registered with an estimated normalised difference vegetation index (NDVI). For uses in urban areas, it can be combined with LiDAR measurements for high resolution (up to 150 megapixels) 3D city modelling. With 10 cm per pixel over an area of 1.5 km2, the camera reaches a ground resolution compliant with the minimum requirements for all survey speeds and altitudes envisioned. It can operate with minimal power demand (maximum of 16 W), encumbrance (maximum of 90 × 90 × 224 mm3 with a 90 mm lens), and weight (maximum of 2150 g with a 90 mm lens). The operational range of temperature (−10 °C to +40 °C) and humidity (15% to 80% to avoid condensation) are compatible with the expected conditions. The acquisition rate (2 fps) allows a maximal flight speed of 15 m/s.
The NEC® TH9260 thermographic camera (see Figure 6b) easily meets the requirements as well for all survey settings (flight speed and altitude). Specifically, the ground resolution is always larger than 1 point per 0.5 m up to altitudes as high as 900 m above ground level. For a total weight of 1.7 kg (battery included), and encumbrance of 110 × 110 × 210 mm3, it allows visual and thermal imaging simultaneously at 30 fps to display the fusion image for easy identification of thermal spots. Its thermal resolution in the range −20 °C to +60 °C is 0.06 °C (or better) with an accuracy of ±2 °C. The operational range of temperatures (−15 °C to +50 °C) is compatible with the expected conditions [64].
The hyperspectral system, the SPECIM® AisaDUAL (see Figure 6c), combines two sensors: the AisaEAGLE (for the VNIR range) and AisaHAWK (for the SWIR range) in a single dual sensor bracket mount. The system largely satisfies the ground resolution requirements, reaching the minimum 1 m ground pixel size only at about 2500 m for the AisaEAGLE sensor (18.5 mm lens) and at 1000 m for the AisaHAWK (30 mm lens), well above the expected survey height. For a total mass of 50 kg (including dedicated data acquisition, power, and data storage units, as well as GPS and Inertia Measurement Unit (IMU) sensors, and an encumbrance of 490 × 680 × 420 mm3. It allows up to 100 fps for a peak consumption of 815 W (including rack pc), with up to 244 bands in the VNIR range (sampling 2.3 nm per band) and 254 in the SWIR one (5.8 nm per band) [65]. It has the strictest operational temperature range among all sensors, being limited to +5 °C to +40 °C for optimal acquisitions. However, this can be compensated by proper thermal insulation.
Finally, the Optech® ALTM Galaxy T1000 airborne LiDAR terrain mapper (see Figure 6d), can operate between 0 °C and +35 °C. For a total weight of about 33.5 kg (including the power distribution unit), an encumbrance of 340 × 250 × 340 mm3, and a power consumption of 300 W, it guarantees an acquisition rate of 1,000,000 measurements per second, a maximum reachable distance of 3500 m above ground level (for 20% reflective targets e.g., vegetation), and a ground resolution of >20 points/m2 below 1150 m above ground level, which is compatible with the mission requirements. This commercial product is also available with its gyro-stabilizer, capable of accommodating the iXM-RS150F camera as well for integrated use [66].
All these devices require one or more external units for data storage (they can potentially be integrated with the one built-in the hyperspectral and LiDAR systems) and other instruments for data syncing, e.g., a high precision digital clock (this can be achieved with low-cost and lightweight solutions, e.g., an Arduino® module).
Considering the different acquisition rates for all the sensors, the optimal survey speed at an altitude ~500 m above ground level ranges between 12–14 m/s (45–50 km/h). At the target altitude, the HD camera, which has the strictest limitation due to its low frame rate. Considering a square survey area of 10 km2, with 80% forward and 60% side overlaps between strips, the maximum acquisition time needed can be estimated (with a large safety margin) as ≤3 h. This is well below the stricter autonomy limit (4 h due to the memory limit of some sensing devices).
3.1.2. Other Onboard Hardware
Other onboard hardware includes several sensing devices dedicated to (1) guidance navigation and control, including the flight path execution, (2) the monitoring of external atmospheric data (i.e., weather and air conditions), and (3) structural health monitoring (SHM) of the structural components of the airship. The sensors for (1) and (2) include anemometers and thermometers. Wind sensors are intended to provide the relative airship air speed along all three axes, the aerodynamic incidence angles, and the barometric altitude. For SHM, uni- and/or tri-axial accelerometers (even relatively cheap inertial measurement units) can be used, screwed to the most critical structural components. The recorded vibrational time-histories can be then analysed by means of signal processing, for which there are plenty of available techniques (e.g., [67,68,69]).
The internal sensor suite for flight path execution purposes will include a GPS receiver with differential correction systems and inertial navigation sensors (i.e., a compass, oriented accelerometers, inclinometers, and gyroscopes). These latter components will provide the roll, pitch, and yaw (heading) attitude, as well as the angular rates and body axes linear acceleration, which are needed not only for control and inertial navigation but also to depurate the measured data from the airship movements and rotations during the acquisition phase.
The non-rigid gas envelope can be easily penetrated by signals from GPS satellites so that the GPS receiver located under it can receive satellite signals without interference from the airship structure. This allows a true location reading for the actual survey equipment to be determined with greater accuracy.
The compass, inclinometers, and GPS receiver will be directly connected, via serial ports, to a dedicated central processing unit (CPU) mounted nearby. Another GPS receiver, located in the ground station, will be used to send real-time correction data to the onboard GPS. All the other sensors for control, navigation, and diagnosis (monitoring the engine speed, altitude, control surface position, wind speed, fuel and battery level, structural vibrations, and engine temperature) and actuators (engines and control surfaces) will be connected to a microprocessor. The microprocessor will send all sensor readings to the computer and the commands to the actuators (assuring a smooth transition from manual control through a standard radio control unit and the automatic control mode). A remote-control unit will be installed to override the commands sent to the actuators if needed. Apart from the high-quality cameras dedicated to ground observations, lower-quality and relatively low-cost digital cameras will be mounted on the airship’s gondola to provide aerial images to the operator on the ground to facilitate visual navigation (even automated if available) based on the geographical features of the terrain. In the case of autonomous flight, these cameras can be used as well in conjunction with vision-based tracking algorithms, to provide some collision avoidance capabilities with respect to flying obstacles in low altitude airspace [70].
The software architecture will be developed to return a reliable and robust configuration between the onboard and the ground station hardware, similar to Battipede et al. (2005) [71]. The human–machine interface (HMI) provides the communication and visualisation between the operator and the navigation system onboard the airship. A physical model-based virtual reality (VR) airship simulator can be developed for training the human user.
The airship can be planned in order to sustain autonomous or semi-autonomous flight, as proved feasible for similar prototypes in Ramos et al. [34] and Azinheira et al. [72]. The onboard CPU will use predefined algorithms to assure the execution of mission flight profiles uploaded from the ground station and accounting for all the features required for a safe flight in accordance with the law prescriptions.
3.1.3. Total Payload Energy Consumption
The power consumption is estimated for the sensor devices enlisted before considering their declared peak demand, assuming cautiously that this scenario happens simultaneously for all instruments. This corresponds to a power requirement that can be estimated to 1 kW, accounting for all the other onboard instrumentation as well.
3.1.4. Total Payload Weight
The total sensor mass weights can be estimated at around 75 kg (overestimated for safety). For design’s sake, the LTA platform has been sized to carry all the equipment; however, individual sensors can be detached if not needed, thus reducing the load carried and increasing autonomy.
Airborne acquisitions, especially push broom images, may present severe geometric distortions induced by the large pitch and roll angles (caused in turn by the effects of changing air pressure, temperature, and airflow, especially at relatively high altitudes). To improve measurement quality, all devices can be accommodated on three-axis stabilisation platforms (as few as possible, joining different sensors on the same ones). This is not strictly required (e.g., hyperspectral imaging without a three-axis stabilized platform is possible as demonstrated by Zhang et al. [40]), yet this simple solution has been proved to be very effective for low-altitude stable imaging from LTA platforms [73], by keeping the line of sight of all measurement devices parallel to the vertical axis at all times. The weights of these structures are not negligible in the definition of the total payload.
For this reason, the total weight of the stabilisation platforms, plus the cables and the other onboard devices, described in the previous Subsection, has been accounted here at the design stage with a one-third increase of the sensors’ total weight (which was already overestimated) to 100 kg.
4. Structural Design
The design of an airship is a multi-disciplinary optimization problem involving multiple interdependent airship subsystems like the envelope, structural frame (for a semi-rigid/rigid airship), propulsion system, buoyancy control, landing legs, energy storage, electrical systems, payload, etc., [74,75]. The design stage begins with an initial definition of the mission requirements, such as altitude, range, and operating speeds. Based on the mission requirements, an airship shape (geometry) and possible materials are proposed. Each geometry and material combination are investigated under different airship operating conditions, and the designs are evaluated in their ability to guarantee vertical equilibrium and maintain the structural integrity of the supporting frame. The sizing of the airship continues till a convergent solution is obtained. An optimal solution should guarantee airship manoeuvrability and stability under normal operating conditions while reducing structural mass.
4.1. Design Parameters
The envisioned airship design relies exclusively on aerostatic thrust to achieve vertical balance and uses propeller thrust only for trajectory and attitude control. The current work proposes a semi-rigid ellipsoidal airship (prolate-spheroid) with a pressure-stabilized envelope and a single-rib (exoskeletal) load-bearing structure for structural support. The load-bearing rib structure has a thin-walled cross-section (see Figure 7, adapted from Porta [76]) designed to facilitate the structure-to-envelope connection. The cross-section also contains hollow cells for routing wires for powering the electric motors of the propulsion units located at various lengths along the central rib structure.
As the rib acts as the primary load-bearing structural frame of the airship, the structural design focuses on optimizing the geometrical parameters of this structure. Two geometrical parameters are used for defining the structural frame: airship length (equal to the semi-major axis of the ellipse), and half-width of the rib cross-section, (see Figure 7). Based on aerodynamic considerations, an airship slenderness of 3 (ratio between semi-major and semi-minor axis) is chosen for the structural frame. This ensures an airship envelope with a high carrier gas volume and low aerodynamic resistance due to drag [77]; further considerations will follow in Section 4.3. These two geometrical parameters control the overall size and weight of the airship, and therefore the structural frame, and are used for the airship sizing.
The size and position of the various airship subsystems also play a critical role in the design of the structural frame. The major airship subsystems considered for the design are (see Table 2):
- Structural frame: depends on airship length, rib cross-section, and density of the material used.
- Onboard systems: dependent on the mission requirements. Comprises of the energy system, cables, etc. For the current study, an estimated mass of 300 kg is assumed.
- Propulsion system: This is a function of the power required from the propeller and is sensitive to the cruising speed and aerodynamic drag. Based on these considerations, the current study assumed a mass of 25 kg for each propulsion unit.
- Payload: Represents the mass of the transported load and is dependent on mission requirements. An estimated mass of 100 kg is considered (see Section 3.1.4).
As structural mass is the predominant mass of the airship, the primary motivation behind the choice of structural material is high strength and stiffness, combined with low density (high specific properties). Hence, the priority of airship sizing is to minimize the weight of the structural frame. In addition, limitations due to production costs exist and will be discussed in a later section. Based on these requirements, two potential structural materials have been identified:
- 2024-T3 Aluminium alloy: Commonly used alloy for aerospace applications, offering the highest specific strength among the metal alloys [78].
- Carbon/Epoxy composite: A polymer matrix composite of high modulus (HM) series offering high specific strength and excellent stiffness in comparison with metal alloys.
A safety factor SF = 1.5 is also considered to offer a safety margin for the design. This safety factor will be used in assessing the observed stresses with respect to the material limit values shown in Table 3.
4.2. Preliminary Design and Structural Analysis
The structural response of the airship under different operational conditions is simulated using a numerical model of the airship in ABAQUS. Only the primary load-bearing members of the structural frame are modelled, which in the present design is the rib structure. The frame is meshed using the S4R element [79], which is a 4-node shell element with reduced integration. The payload, propulsion units and other onboard systems are modelled as point masses attached to the structural frame using rigid links at various locations of the frame. Buoyancy loads are calculated based on the volume available in the airship for the enclosed gas and are modelled as a vertical distributed load applied on the upper portion of the structural frame. To simulate the structural response when the airship is unconstrained in mid-air, the inertial relief condition is used [79,80]. These settings follow the analysis procedures developed for previous airship designs [81].
Various airship geometries are investigated by iterating geometrical parameters, and , and each airship geometry is evaluated under the following airship operating conditions:
- Hovering: The airship is parked in mid-air and maintains static vertical equilibrium without using propeller power. External loads acting on the structural frame include buoyancy loads and the weight of the various airship subsystems. Inertia relief is specified to simulate the mid-air equilibrium condition.
- Parking: The airship is parked on the ground and the entire weight of the airship is supported on two rigid landing legs connected to the structural frame. The buoyancy load is small due to inflated ballonets, and propellers are inoperative.
- Crash: A ground impact simulation of the airship. Similar boundary and loading conditions to that of parking are used, but a vertical acceleration of 3 g (29.43 m/s2) is imposed to simulate the accelerations generated during a sudden descent.
The above three scenarios are used for initial airship sizing. Those viable airship geometries are subsequently evaluated to withstand stresses developed during mid-air manoeuvres of the airship. These manoeuvres are executed using thrust from the propulsion system, modelled as concentrated forces, applied at their respective locations on the structural frame. The various manoeuvres investigated are described below
- Pull-up: A mid-air manoeuvre where the airship rises from the ground (gaining altitude) using the two vertical thrusters providing a thrust of 1000 N and −1000 N, respectively.
- Descent: A mid-air manoeuvre where the airship approaches the ground (losing altitude) using the two vertical thrusters providing a thrust of 1000 N and 1000 N, respectively.
- Control system failure: Simulating various failure conditions of the airship due to the incorrect use of the horizontal propellers. Three cases are explored with various combinations of the horizontal propeller thrusts: traction (propeller thrusts oriented symmetrically away from the minor axis), compression (propeller thrusts oriented symmetrically towards the minor axis), and flexure (asymmetric use of propeller thrust) of the structural frame.
For the manoeuvres, in addition to the propeller loads, buoyancy loads, and gravity loads are also specified. The inertia-relief condition is used to simulate the unconstrained mid-air structural equilibrium.
The choice of airship length is a trade-off between its ability to generate sufficient buoyancy and difficulties due to excess dimensioning such as assembly, transport, economics etc. Three lengths, 26, 30, and 34 m are considered for the present study and present a suitable range for environmental monitoring. For each length, , a suitable cross-section dimension, is sought to guarantee the following requirements for each operating condition described above:
- Maximum displacement: This is a trade-off between aerodynamic performance (requiring minimal slenderness change) and avoid oversizing the material for high stiffness requirements. Based on these two considerations a maximum displacement value, equal to 100 cm is chosen [77].
- Maximum stresses (Von Mises): Based on the tensile limits of the materials considered for the structure. The tensile yield stress is 230 MPa for the Aluminium alloy, and 450 MPa for the Carbon/Epoxy composite.
- Vertical Equilibrium: Design should ensure that aerostatic buoyancy can sustain the total weight of the airship.
The initial sizing of the airship is obtained by investigating the case of the airship during hovering. The results for the hovering condition indicated that none of the geometries using the aluminium alloy guaranteed a convergence between ensuring vertical equilibrium and not exceeding the structural limits of the material. In comparison, the carbon/epoxy composite (HM) offers greater performance (see Figure 8a). For each airship length , the solid line represents cross-sections ensuring vertical equilibrium (satisfying condition C), and the dashed line indicates cross-sections ensuring optimal structural behaviour (conditions A and B). Figure 8a shows an intersection of both lines at = 30 m. For < 30 m, buoyancy load is not sufficient to ensure the vertical equilibrium of the airship and hence presents a range of values not suitable for the airship geometry. For > 30 m, the region between the dashed and solid line represents the lower and upper limits of the cross-sections half-width, , respectively. This region offers a wide range of solutions for each length . For any value of within the region, when approaching the dashed line, we get an airship geometry offering surplus vertical thrust, but with the structural frame operating close to its material limits. This excess vertical thrust produced can be balanced using ballast or by increasing the onboard payload. Similarly, approaching the solid line, we get an airship geometry operating much safer compared to the material limits but producing reduced vertical thrust. The vertical thrust produced is also deficient when the airship lengths are increased further (L > 34 m). The results of the hovering analysis show that for a structural frame made of carbon/epoxy composite (HM), the intersection of the two lines ( = 30 m and = 0.225 m) presents an optimal airship geometry. This geometry is used for the remaining analysis as well.
Results of the parking analysis (using carbon/epoxy composite, = 30 m, and = 0.225 m) are shown in Figure 8b. For the parking case, the landing legs are placed symmetrically with respect to the minor axis of the airship and the distance between the legs is varied as a fraction of . Figure 8b shows the plot of maximum displacement as the distance between the legs is varied from 0.65 to 0.95 . The results show a decrease in the maximum stress and displacement with an increase in distance between the legs. Although the results indicate a high separation distance between the legs to be more favourable (0.95 ), it introduces manufacturing and integration difficulties due to the proximity with the vertical propellers. Therefore, a leg separation of 0.9 is chosen as an acceptable compromise between structural performance and vicinity to the vertical propellers. This is further corroborated when investigating the case of a crash, where even under higher vertical accelerations the selected geometry could withstand the loads developed. The results of the parking and crash analysis demonstrate the effectiveness of using a carbon/epoxy composite (HM) structural frame 30 m long and 10 m wide at its maximum diameter (according to the selected slenderness ratio), with a cross-section width of 0.225 m, in maintaining vertical equilibrium and operating within the structural limits of the material.
The selected geometry faces a more rigorous assessment of its structural integrity when performing the various manoeuvres using the active thrusters. The analysis using active thrusters revealed that the descent manoeuvre is the most critical as it produced the highest displacements in the structural frame. The results showed that for the various manoeuvres, the maximum displacement and the stresses developed on the structure do not exceed the structural limits of the material.
The final conclusions of the study are presented in Table 4. Carbon/epoxy composite is seen to be the only viable choice for the structural material, with airship length = 30 m satisfying the conditions of vertical equilibrium and structural integrity. Also, lengths > 30 m offers a range of solutions allowing flexibility in the selection of the half-width, . The viable solution ranges for airship length and diameter, corresponding structural mass and resultant buoyancy loads are shown in Table 4.
4.3. Aerodynamic Considerations
For the design and sizing of the onboard propulsion system, it is essential to estimate the aerodynamic characteristics of the platform, i.e., the aerodynamic forces developed on the platform during relative motion with respect to the outside air. During platform hovering in calm air, it is sufficient to estimate the buoyancy, generated by the difference in specific weight between external air and the gas enclosed in the envelope. However, when the platform is in relative motion with respect to the air, the aerodynamic forces generated can be classified as steady (e.g., when a body in uniform motion in a calm atmosphere), and unsteady (e.g., in response to manoeuvres or in the presence of atmospheric turbulence). Both cases must be evaluated during airship design. For the latter, it is possible to proceed with a rough assessment based on the atmospheric situation in which the aircraft can statistically operate and on the basis of the performance in terms of manoeuvring and control to be obtained. In this way, the maximum values of the propeller thrust required, the relative power of the electric motors, as well as their weights and consumption can be defined. For the former, it is necessary to proceed with a precise assessment of the aerodynamic drag by estimating the minimum drag coefficient of the aircraft. The evaluation of the minimum drag in a steady situation is essential to proceed with the basic sizing of the propulsion system: once the maximum allowable aircraft speed is defined, the aircraft drag can be calculated, and correspondingly the required thrust. During calculations, an overestimated value of drag force is used to provide an adequate safety margin to cope with some of the unsteady situations such as manoeuvres, wind, atmospheric turbulence, etc.
The total aerodynamic drag is composed of several components:
- Skin friction drag, i.e., the resisting force caused by the loss of velocity of the air flow that touches the surface of the envelope (boundary layer).
- Pressure drag, i.e., the integral component in the speed direction of local distribution of pressure induced by the velocity of the flow at different locations along the envelope. This resisting force can be reduced by properly shaping the front part of the body according to the flow lines.
- For a non-axisymmetric flow, the induced drag must be considered as well. This force derives from a difference in pressure between the upper and lower part of the horizontal longitudinal plane, or between one part and the other of the vertical longitudinal plane, which induces an increase in the velocity component perpendicular to the upstream flow direction and a corresponding increase in the drag force.
An airship envelope is normally affected by all these drag components, being subjected to a flow with typical three-dimensional characteristics deriving from complex whirlwinds and associated strong transverse flows. The foregoing mainly takes into consideration these forces, but it should be remembered that local pressures also produce moments around the reference axes, which play a fundamental role in the control of the aircraft.
In the present design problem, as the envelope is a solid of revolution of length , maximum diameter , volume and external surface , it is possible to use or the external surface as the reference surface for the drag coefficient. Having defined the slenderness , calculated using Young’s relations (valid for these types of bodies if ), there is a constant relationship between the drag coefficients of spindle-shaped bodies:
As a first approximation, the Hoerner formula can be used for calculating the drag coefficient as a function of airship slenderness. The equation is valid for a prolate ellipsoidal aircraft (i.e., ellipsoid rotated around its major axis) or similar bodies of revolution, and is defined as
where is the turbulent skin friction coefficient of a flat plate, which in turn is a function of the Reynolds number . In the range of interest, a good approximation of this parameter is:
Although this formula may seem like a rough extrapolation, it actually provides a reasonable approximation for the drag coefficients of optimized bodies of revolution in incompressible fluids, over a wide range of . These relations have been validated through wind tunnel tests for various asymmetrical bodies (with polygonal and circular sections) in the interval .
A key limitation of this relation is related to the Reynolds number since the flow must be turbulent on most of the aircraft surface for these relations to be valid. For a much lower Reynolds number, the equation gives an overestimation of the real result, as the laminar boundary layer persists over a significant portion of the surface.
Based on these relations, an airship slenderness value of 3, which minimizes the drag coefficient, is chosen for the preliminary design. Future works will include a more elaborate aerodynamic evaluation using computational fluid dynamic (CFD) analyses (resorting to the Ansys® Fluent software) to analyse the entire LTA platform. Such an analysis will allow the parasitic drag due to the appendages, such as the gondola, the landing gears, and the ducted propellers to be considered. These contributions are ignored in the present assessment but must also be included for a more accurate assessment of the total drag coefficient. The consideration of fluid viscosity is key in calculating the three drag contributions stated above and an inviscid assumption would not be acceptable for a fusiform shape such as that of the airship as the drag forces will be substantially underestimated.
5. Onboard Energy System
The onboard power supply system of the airship is used to provide the energy required to reach a specific mission location and carry out a series of surveys along a predetermined area. In addition, it must power the flight controls, the various measuring instruments and must cope with brief and sudden peaks in energy demand during in-air manoeuvres. The current section investigates the selection and sizing of the onboard energy system based on the mission requirements and geometry of the airship previously discussed. Specifically, the power consumed by the control system (regulating the propellers’ orientation using electric stepper motors) is highly variable, thus a time average estimate of 2000 W is chosen. For the propulsion, a simplified dependence on the airship mass is considered as 300 W/kg. Finally, the peak power consumption by the payload is estimated at 1000 W (see Section 3.1.3).
5.1. Power Systems
Among the different technologies available for powering an airship, two are investigated for the present design: fuel cell and batteries. These technologies are selected due to their ability to provide sufficient power to carry out missions (duration of a few hours), without the need to have power systems of excess size or dimensions.
5.1.1. Fuel Cell
A fuel cell is a device that converts the chemical energy of a fuel into electric power and heat without the use of thermal cycles [82]. Hydrogen () powered fuel cells convert hydrogen and oxygen into electric power, heat, and water. Use of as the fuel reduces the environmental impact due to lower emissions [83]. Fuel cells are advantageous from the point of efficiency, with values between 40–60% (depending on the temperature). Among the different types of fuel cells commercially available, the polymeric electrolyte cells (PEM polymer electrolyte membrane) are considered for the present study. The main limitations of the fuel cell system are due to the use of hydrogen as a fuel; it is costly, flammable, and difficult to store safely aboard the airship (requires low temperatures and suitable storage structures).
The mass of a fuel cell system can be calculated with an initial estimate of fuel cell efficiency. An efficiency of 45% (between 40% and 60%) is considered for the present study. By comparing the performance of commercially available fuel cells, a specific power [84], is also estimated. Using this data, the mass of the fuel cell can be calculated using the formula
where is the efficiency of the fuel cell, and is the total power required for the mission. The mass of hydrogen fuel required can be calculated using and flight time, as follows
where is the specific energy of hydrogen (). The weight of the hydrogen fuel tank is also a key component of the fuel cell design and has also been considered.
5.1.2. Batteries
Batteries are electrochemical energy conversion devices that use the chemicals stored within the battery cover to produce electric energy. Lithium-ion batteries are considered for the present study, as they are commonly used in the aeronautical field due to their high energy density and good recharging capabilities [85]. They have an energy density (or specific energy) that can reach as high as 300–400 Wh/kg. Certain key limitations of batteries include energy losses during charging and discharging phases, and electrode wear (worsens as power use increases). The mass of the battery system can be computed using the energy density, [86] as follows
5.1.3. Supercapacitors
For handling stages of the cruise flight with above-average power peaks, e.g., during manoeuvres, a supercapacitor (electrochemical double-layer capacitor (EDLC)) is used for backing the primary power system. Supercapacitors have a high energy density, high capacitance, fast recharge ability, high recharge life cycle, good reliability, and low performance losses. The supercapacitor considered for the present study is assumed to have a nominal discharge power of 3000 W/kg and weighs 0.5 kg. The number of supercapacitors required for a mission can be calculated using the formula
The supercapacitor is assumed to have an efficiency of 0.95 and is designed to handle power peaks (corresponding to 200% of the nominal power) occurring at time intervals lasting 30 s for 7% of the flight time.
5.2. Sizing the Power System
The sizing of the power system is based on defining the energy required by the airship to complete a given mission. Four design parameters are selected for the sizing study: cruise speed, cruise altitude, airship length and envelope thickness. For a given combination of these parameters, the airship weight, size, and power required for a specified mission can be estimated. An iterative exercise is performed for the sizing where different combinations of the four design parameters are iterated within certain predefined limits (see Table 5). A minimum cruise speed is specified to allow the airship to reach reasonably distant mission locations and the maximum limit is set to avoid considering airships of excessive size and weight. Increasing airship speed increases the aerodynamic drag and leads to larger energy consumption. Consequently, this requires a larger sized energy system with a higher mass. The values of survey speed and altitude are kept constant and are selected based on the requirements of the onboard sensors. Table 5 describes the iteration range of some design parameters as well as some operational requirements of the airship (based on Section 2.3).
Those combinations of design parameter values that guarantee the achievement of the mission requirements, i.e., cruise to the survey site, perform mission operations and subsequent return, plus ensuring sufficient volume for supporting the airship, are deemed viable solutions (see Table 5). Among the viable solutions, the one with the lowest weight is deemed to be optimal. Additionally, the mission requirements are also iterated, i.e., different values for distance to the survey site (cruise distance) and survey areas are considered, and an optimal configuration, minimizing airship weight and power required, is calculated for each cruise length.
The results of the power system sizing are shown in Figure 9. The results show an overwhelming convenience in using the fuel cell over the battery. The difference in weights increases as the mission cruise distance increases. For lower cruise distance values, the battery system could be more convenient for a lighter payload (<100 kg). However, even under such conditions, this would be a relatively small distance range, and the weight savings are rather limited (<10 kg). Therefore, the battery system can be realistically considered useful only for a scaled demonstrator prototype and not for a fully-fledged, real-scale LTA platform. The greater weight of the battery system is due to the lower efficiency (low power to weight ratio). This also leads to an increase in the volume necessary to guarantee the buoyancy of the aircraft, which in turn causes an increase in drag and consequently in the electrical power to be supplied to the propulsion system.
Figure 10 shows a comparative weight breakdown of two airships: one using the fuel cell system and the other using the battery system. These results correspond to a mission cruise distance of 2 × 10⁴ m and a survey area of 107 m2. Considering the lengthiest option among the range provided in Table 4, the fuel cell-powered airship has a total weight of 2163 kg. In contrast, the battery-powered airship reached a final weight of 2646 kg.
The results of the sizing study indicate that the fuel cell system with compressed hydrogen as the fuel is the optimal choice, in term of reducing airship weight and volume, for long-duration missions with a large survey area. In contrast, the battery system is seen to be more convenient for short duration missions involving small survey areas.
6. Propulsion and Control System
6.1. Propeller
The present section discusses the design of a propeller used for the propulsion of an airship operating at low altitudes (tropospheric). Six propeller units are used in total: two vertical-axis propellers for providing additional vertical thrust during climbing or descent, and four horizontal axis propellers which are used for manoeuvring the airship. Additionally, as the propulsion units are attached to the gas envelope, and not directly to the gondola, the effects of any vibrations from the propulsion units are extensively damped. This provides a relatively vibration-free environment for survey equipment located in the gondola. The design of the propulsion system is also affected by the data acquisition requirements of the various sensors used. For optimal data acquisition, it would be preferable not to have any deviation from the predefined flight strip not larger than ~±10 m (horizontally) and ~±3 m (vertically) [39].
The various design steps involved in the propeller design are reported here for the reader’s convenience. A numerical model of the propeller is developed to evaluate propeller performance for various blade geometries and operating conditions. This numerical model is used in an iterative study to identify an optimal propeller design offering maximum efficiency and satisfying the operational requirements of the airship.
6.1.1. BEMT Design
The numerical model of the propeller is based on the blade element momentum theory (BEMT) [87,88]. Using the propeller blade geometry and operating conditions as input, the BEMT model can be used for predicting the aerodynamic performance of any propeller design. BEMT derives from the union of two lower-order models, called blade element theory and momentum theory, respectively. The blade element theory assumes the entire 3-dimensional (3D) propeller blade to be divided into infinitesimal radial elements, called blade elements, and 2-dimensional (2D) wing theory is used to analyze the flow, and calculate the aerodynamic performance over each blade element. The momentum theory assumes the propeller to be an actuator disk in a stream tube, imparting energy and increasing the downstream pressure of the incoming flow. The BEMT model is solved by equating the local aerodynamic force acting on an infinitesimal blade element at any radial location, to the bulk momentum transfer through the elemental stream tube, to obtain a system of non-linear equations with axial inflow factor, , and swirl factor, , as the unknowns. These parameters represent the factor of increment in axial velocity and reduction in tangential velocity induced by the rotating propeller blade. Evaluating the radial distribution of and are key to evaluating the performance of the BEMT propeller model. The aerodynamic data required by the BEMT model is calculated beforehand using the software, XFOIL. The curves of coefficient of lift , and coefficient of drag are evaluated as a function of the angle of incidence , and Reynolds number . Multiple airfoil profiles are iterated, and the NACA 4412 profile is selected for the propeller blades due to its superior aerodynamic characteristics.
6.1.2. Analysis and Results
The numerical model of the propeller is implemented in MATLAB. The propeller blade geometry is described by a series of parameters which are passed as input to the numerical model. Using the aerodynamic data and blade geometry as input, the system of the nonlinear equation of the BEMT model can be solved to evaluate and . In the present analysis, the equations are solved numerically in MATLAB using the non-linear least-squares solver ‘Isqnonlin’, with a solution tolerance of . Once the radial distributions of and are known, the aerodynamic forces acting on each blade element can be evaluated. The total propeller thrust and torque can be calculated by integrating over the length of the propeller blade. Propeller efficiency can be calculated as the ratio of output power corresponding to the thrust and input power required to produce the torque.
Certain design parameters are used in sizing and optimizing the propeller and they correspond to the shape and operational requirements of the airship. These parameters include the minimum propeller thrust, , required to keep the airship in motion at a constant speed during nominal operating conditions, average cruise flight speed, , and the cruise altitude, . The aim of the analysis is to identify a propeller design providing a thrust, , and operating with maximum efficiency, , to minimize energy consumption. Considering the proposed LTA platform with six propeller units, the values of the design parameters considered are shown in Table 6 (based on Section 2.3).
Certain key assumptions are used for simplifying the current analysis. The number of blades, , for each propeller unit is chosen as two. This maximizes the distance between blades and reduces blade interaction with the distributed flow in the wake of another blade. Also, the angle of incidence of each blade, , is set as a constant along its span. An initial analysis is performed using an iterative procedure, where propeller thrust, , and efficiency, , is evaluated as a function of outer radius, , and angular velocity, , of the propeller. Other geometrical parameters of the propeller such as propeller hub radius, , maximum chord length, , hub and tip chord length, and , of the propeller blades are kept fixed for this analysis and their values are detailed in Table 7.
The results of the initial analysis are shown in Figure 11. The results are shown as surface plots, and for ease of interpretability, as isolines. It should be noted that not all regions of the plots are of interest due to the constraints imposed by the design requirements. An upper limit for of 1.5 m is used to avoid excessively long propeller blades and a minimum thrust, , is imposed to satisfy the minimum thrust condition. Implementing these constraints, the region of viable solutions in the and plots reduce, and the updated plots are shown in Figure 12.
Figure 12a shows that the highest propeller efficiencies are obtained when is large and is low, while higher values of the thrust are obtained when both and are high (Figure 12b). Based on these results, a propeller with long blades and operating at low speeds is identified as an ideal choice, due to its high operational efficiency. A secondary iterative analysis is also conducted to study the effect of the maximum chord length, , and angle of incidence, , on the propeller performance. As the greatest efficiency is observed for large values of, , a constant value of 1.5 m is used for this new analysis. Figure 13 shows the results of this analysis, where the propeller efficiency is plotted as isolines and the minimum thrust condition has been enforced.
These results indicate that lower values of produces greater efficiency, but with a corresponding reduction in thrust. A similar relationship is observed for the angle of incidence as well. Increasing , increases and , leading to increased lift (greater thrust) and drag (poor efficiency), respectively. Hence a suitable compromise between propeller thrust and efficiency is required for the final design. Based on the two iterative analyses, all propeller designs satisfying the minimum thrust condition are selected as viable solutions, and the design providing the greatest efficiency is selected as the final optimal solution for the propeller. The optimal propeller geometry selected is described in Table 8.
The propeller is optimized to have maximum efficiency in horizontal straight flight conditions (cruise) where it operates most of the time. Thrust can be increased for the same propeller design by increasing the value of , but with a corresponding drop in . This extra thrust is useful in the transitional phases of the airship, for accelerating the airship or carrying out airship manoeuvres. The current design can produce a thrust of 2 when is increased to 724 rpm. Figure 14 and Figure 15 illustrate some of the characteristics of the final optimized propeller design.
6.2. Thrust Vectoring
Instead of aerodynamic control surfaces, the proposed airship concept uses a system of thrust vectoring propellers, suitably controlled to manoeuvre the vehicle with high accuracy. The thrust vectoring (depicted in Figure 16) is designed to overcome the specific limitations of conventional airships and to satisfy those operational needs that cannot be achieved by other existing conventional flying systems. This particular configuration requires specific procedures for the definition of some aerodynamic derivatives, which had been developed in Gili et al. [89].
The two vertical axis propellers (at the two opposite ends of the airship major axis) facilitate rapid climbs and descents. The four horizontal axis propellers can rotate around their own axis. This feature makes the airship easier to control during forward or reverse flight even at low speeds, less sensitive to lateral gusts (guaranteeing that heading direction will always be coincident with the intended route) and reduces the turning radius required. These aspects are important during the cruise phase between the take-off and target locations, and especially during survey operations, to ensure stable and low-speed data acquisition. During hovering, lift is produced by a hybrid system that combines the buoyancy force due to helium and the vertical thrust of the vertical axis propellers. The absence of aerodynamic control surfaces means that in any wind condition, hovering can be performed with heading direction, while the airship weight is easily balanced by thrust vectoring the propellers. The propellers ensure good yaw control even with no wind and the presence of symmetrically located propellers avoids the typical rolling moment observed in conventional airships having propellers only at the tail. Again, all these aspects are necessary for stable and uninterrupted data acquisition. The specific longitudinal, lateral, and directional control law can be found in Battipede et al. (2004) [90] and Battipede et al. (2006) [33]. The thrust vectoring configuration is also useful in the event of failure, as it allows the machine to remain operational (in “reduced functionality” mode) even with the loss of one or two motors [55].
With respect to conventional airships, landing operations only require a landing site diameter roughly equal to the airship length. Furthermore, landing can be performed with the heading independent of the wind direction. The operation is also facilitated by the retractable landing gear system, constituted of rods connected to a helicoidal gear, which is connected to the airship’s rib.
Finally, the envisioned platform is not expected to operate in bad weather conditions, as good natural illumination is essential for good quality data acquisition; yet, in case of necessity (e.g., after a seismic event, or during a flood), thrust vectoring allows airship operations in conditions otherwise impossible for standard propulsion and control systems (tenths of knots wind, low intensity rain).
7. Ground Station
The mobile ground station (MGS; see Figure 17a) is intended to fit into a commercial camping vehicle (specifically equipped and modified for the purpose), based on the design proposed in Battipede et al. (2005) [71]. It can host both the control and pilot stations (CS and PS, respectively). The PS is located in a cabin placed on a moving platform that can be lifted over the camper roof, providing the pilot with a 360° view of the airship when in visual line of sight. Beyond VLOS, the tracking system for the airship is based on a directional antenna, potentially with satellite communications included.
The MGS also consists of additional instruments such as: a GPS receiver, a radio transmitter, a microwave data radio, and two human–machine interface (HMI) systems. The HMI in the pilot station is largely derived from the future operator console system (FOCS), designed and integrated by Galileo Avionica, and consists of three monitors dedicated to the onboard and ground real-time cameras, the 3D virtual third-person view from behind the platform, and the virtual cockpit, respectively (see Figure 17b). The flight controls consist of a joystick and two thrust levers (Figure 17c). During airship activities, while the PS is responsible for sending commands to the airship, the CS receives all diagnostic signals from the onboard sensors (e.g., the engine speed, altitude, position, angle of pitch, and gas pressure) and can download the acquired data (or a part of them). The acquisition of real-time diagnostic data guarantees the online risk assessment, which is particularly useful during the preliminary development of the whole system and/or in test flights.
Therefore, the ground station HMI can provide the user with real-time sensory and flight data visualization, mission programming and mission control interfaces, and on flight setup of control system parameters, etc. The ground station computer will also be used for flight data storage, data visualisation, and post-flight data playback. The ground station communicates to the onboard CPU through two radio links; one to transmit analogical video imagery from the airship to the ground, and a second, composed of a pair of spread spectrum radio modems to transmit digital command data and sensor telemetry between the stations. The integration with a command and control center can also be achieved. For specific purposes, ship or aircraft-based remote-control stations may be deployed. Such stations operated based on the technical solution described above has already proved to be reliable and efficient in [71].
8. Cost Analysis
The present section provides a brief assessment of the various costs expected over the operational life of the airship. Costs related to production, regular operation, maintenance, and logistics have been discussed. The initial design and development of various airship prototypes are also expected to contribute to the overall cost, but they have not been discussed in the present work.
8.1. Expected Production Costs
The recurring production cost per unit of the proposed unmanned LTA platform is expected to be in the range of 0.8–1.4 million euros (M€). The non-recurring costs associated with the design, development, integration, and certification are not included. The costs of the payload and the ground station are also not included. The platform can be designed to be integrated with new and/or existing ground stations and can be equipped with various payloads, available on the market and selected according to the specific mission requirements.
The low production cost is one of the key elements which allows the proposed LTA platform to be very competitive on the international market in specific market sectors. The final market price is expected to be 1/6 to 1/3 with respect to the price of existing platforms used for similar applications.
8.2. Expected Operative Costs
It is very difficult to assess the economic aspects of the prototype technology since survey costs vary greatly from country to country and depending on other economic and practical aspects. Many variables can affect the operating costs for a given type of platform. These estimates may represent varying durations of operating time, various configurations (basic versus configurations with optional equipment), different types of costs (fixed versus variable, direct versus indirect), may include different types of maintenance costs (heavy maintenance, labour costs, consumables) and similar platforms of different age groups.
For instance, according to the estimates reported in Koska et al. [27] (2017, Czech Republic), the cost of UAV photogrammetry surveying is about 300–700 EUR per km2 depending on many practical factors. The LiDAR survey of the same area is indicatively 600–1400 EUR per km2. Therefore, only a qualitative rough estimate of the hourly cost is given. For a more detailed discussion, as already mentioned in Section 1.3, Matese et al. [49] compared the cost-effectiveness of UAV, Aircraft and Satellite Remote Sensing Platforms also in terms of surveying costs.
The innovative architecture, the technical characteristics, and the performance of the proposed airship are such to ensure significant operational cost or effectiveness with respect to existing platforms used for similar applications. In particular,
- Energy consumption for airship flight is far lower than for aircraft and helicopters, on a per hour or per nautical mile basis.
- Strong reduction of operation cost for ground infrastructures and operator training.
- Long endurance, including hovering.
A qualitative comparison of the operating cost of the relevant platforms for large scale ground monitoring is shown in Figure 18.
For comparison, the helicopter alternative is very flexible and effective but largely exceeds acceptable cost limits when long endurance is required, even over small areas. The fixed-wing aircraft shows reduced cost with respect to the helicopter but presents a high cost in case of wide areas of interest. UAVs can provide some cost reductions but also shows high operational costs for missions requiring long endurance and heavy payloads. Satellite-borne observations provide good performances, when operable, but also have a very high cost.
Based on the above considerations, a target hourly cost in the range of 600–900 euro/hour (€/h) is a firm design requirement for the proposed RPAS LTA platform. This constitutes just 1/4 to 1/3 of the hourly cost of existing fixed and rotary-wing aircraft performing similar missions.
8.3. Expected Maintenance Costs
The costs associated with the scheduled maintenance of the proposed platform are estimated to be in the range of 2–4% of the total platform cost per year and include helium refilling (estimated 2% per week) and helium washing every 6 months. These costs are included in the hourly cost of the previous paragraph. Similar costs for other platforms are expected to reach (indicatively) 7% per year.
8.4. Expected Logistic Costs
The storage and ground handling of airships and similar large inflatable flying structures, including take-off and landing, requires dedicated infrastructure and specific equipment and tools. Although infrastructure is not required during airship operation, hangar storage is needed for home basing, helium washing and refilling and for conducting major maintenance activities. While airships can operate independent of airfields, some potential disadvantages, operational limitations, and logistics constraints exist for conventional airships.
The existing conventional airships show strong operational limitations, mainly due to the poor efficiency of the conventional control system, even for standard manoeuvres and light gusts. Some of these limitations, like the limited manoeuvrability and flight envelope, the sensitivity to lateral wind, the wide ground surface and the ground crew required for take-off and landing, have a significant impact on the logistics costs. The thrust vectoring system introduced overcomes these operational limitations of conventional airships, with a consequent reduction in logistic costs.
9. Discussion
In the previous sections, the preliminary design of the proposed RPAS LTA platform has been detailed. Table 9 summarizes the main aspects of the final design as envisioned for the fuel cell-powered version, which is found to be the most cost-effective solution. These are specified in the requirements identified in Section 2.
As stated in Section 4, the design of an airship is a multi-disciplinary optimization problem involving multiple interdependent subsystems. Figure 19 gives a general layout of such an optimization scheme. The optimization procedure aims to size the airship subsystems with the objective of minimizing airship mass and ensuring sufficient airship volume required for operation. The design of the RPAS LTA, described in Section 4, Section 5 and Section 6, is based on this scheme, but for a fixed set of mission requirements.
A more general code for the automatic multidisciplinary design, based on the scheme of Figure 19 and considering all the several aspects as a function of the mission requirements, is currently under development.
10. Conclusions
For remote sensing, satellite and drone-based acquisitions represent the most common UAS-based technologies as of today. However, the use of satellites is significantly limited by clouds, time-revisit period, and lack of accuracy at the scale of urban areas. Satellite imaging is costly and limited by long visit cycles and delivery time. The spatial resolution is not accurate enough for many urban or local level applications. On the other hand, fixed and rotary-wing UAVs simply lacks the autonomy to be cost-efficient over areas larger than a few hectares. Operating manned aircraft and rotorcraft can be expensive and inconvenient due to their limited fuel efficiency and range, which also necessitates access to an airfield or landing pad relatively close to the survey site.
An RPAS LTA platform is here envisioned as an intermediate solution for urban and rural small or medium-scale monitoring, with long endurance and high payload capacity, allowing multi-sensor acquisitions. Apart from its intended original uses (land use or land cover survey), the proposed airship can be easily and rapidly retrofitted for similar purposes related to environmental monitoring such as infrared-based air composition and pollution monitoring or limnological and mineralogical surveys and studies.
The aim of this paper was therefore to assess the feasibility of using such an airship for these intended goals. A preliminary design was proposed in this sense, to accommodate a range of sensors, selected according to their potential uses for fine mapping. Beneficial synergies have been also considered during the payload design phase. e.g., HD video and thermometric cameras cover the electromagnetic wavelength range uncaptured by VNIR and SWIR hyperspectral sensors; all the large-spectrum information can be then used in combination for better LULC classification. Based on the derived payload weight and energy consumption, the structure, as well as the propulsion and control systems have been properly sized. The costs and the airship performances have then been evaluated accordingly, allowing as well to discuss its potential convenience in comparison to the other standard remote sensing systems.
In conclusion, the envisaged design proved to be feasible with the current technologies. The concept was found to be potentially cost-efficient for remote sensing applications over the intended medium-sized areas, even carrying a large, relatively heavy, and power-demanding array of sensing devices. These findings suggest that the proposal is viable from both an economic and an engineering point of view.
More specifically, a generic LTA platform for land monitoring can ensure:
- -
- Increased operational effectiveness for spatial and time coverage (long-endurance, including the possibility to hover, not depending upon aerodynamic lift)
- -
- High payload capacity, adapted for multi-sensor acquisition
- -
- Easy adaptability to specific customer requirements
- -
- Allows for a more versatile deployment than manned aircraft
- -
- Ecological compatibility (low chemical and noise emissions)
- -
- Possibility to operate at low or medium heights
- -
- Possibility to operate at low speeds for better surveying
- -
- Suffer lower levels of turbulence than other higher-than-air aircraft platforms
- -
- Suffer less mechanical vibrations, especially damped by the non-metallic envelope
- -
- Allow more stable acquisitions, with better resolution and lower noise levels within signals
- -
- Highly survivable LTA envelopes in case of damage
- -
- Relatively low acquisition, operation, and logistic support cost
- -
- Therefore, major cost efficiency per surveyed area with respect to direct competitors on the urban scale (up to ~107 m2)
The use of a remotely piloted system also negates any risk for the personnel, while reducing dramatically the required buoyancy and therefore envelope volume. The proposed geometry and thrust vectoring system also add to all the other specific benefits described in the dedicated sections. Importantly, the deleterious effects of the engine vibrations are expected to be less severe than in other aircraft solutions with more rigid structural parts.
A significant issue concerning the RPAS is the airworthiness certification for civilian use. The LTA RPAS are expected to achieve the airworthiness certification well in advance with respect to the fixed and rotary wing RPAS of the same size and payload capabilities. Future works will focus on the use of the acquired data and how to combine the georeferenced quantities measured from different sensing devices in the most informative way, by employing sensor fusion strategies.
Author Contributions
Conceptualization, C.S., M.C. and P.G.; methodology, C.S., M.C., R.R. and P.G.; software, M.C. and R.R., validation, M.C. and R.R.; formal analysis, M.C. and R.R.; investigation, M.C. and R.R.; resources, C.S. and P.G.; data curation, M.C. and R.R.; writing—original draft preparation, M.C. and R.R.; writing—review and editing, M.C., P.G. and C.S.; visualization, M.C. and R.R.; supervision, P.G. and C.S.; project administration, P.G. and C.S. All authors have read and agreed to the published version of the manuscript.
Funding
This research received no external funding.
Data Availability Statement
The data of this study are available from the authors, upon reasonable request.
Acknowledgments
The authors wish to thank the Interdipartimental Responsible Risk Resilience Centre (R3C) of Politecnico di Torino for the support of this project.
Conflicts of Interest
The authors declare no conflict of interest.
References
- Office for Official Publications of the European Communities. Manual of Concepts on Land Cover and Land Use Information Systems; European Communities: Brussels, Belgium, 2001. [Google Scholar]
- Ronchi, S.; Salata, S.; Arcidiacono, A.; Piroli, E.; Montanarella, L. Policy instruments for soil protection among the EU member states: A comparative analysis. Land Use Policy 2019, 82, 763–780. [Google Scholar] [CrossRef]
- Malczewski, J. GIS-based land-use suitability analysis: A critical overview. Prog. Plann. 2004, 62, 3–65. [Google Scholar] [CrossRef]
- Diaz-Pacheco, J.; Gutiérrez, J. Exploring the limitations of CORINE Land Cover for monitoring urban land-use dynamics in metropolitan areas. J. Land Use Sci. 2014, 9, 243–259. [Google Scholar] [CrossRef]
- Wickham, J.; Stehman, S.V.; Gass, L.; Dewitz, J.A.; Sorenson, D.G.; Granneman, B.J.; Poss, R.V.; Baer, L.A. Thematic accuracy assessment of the 2011 National Land Cover Database (NLCD). Remote Sens. Environ. 2017, 191, 328–341. [Google Scholar] [CrossRef] [Green Version]
- Mishra, P.; Asaari, M.S.M.; Herrero-Langreo, A.; Lohumi, S.; Diezma, B.; Scheunders, P. Close range hyperspectral imaging of plants: A review. Biosyst. Eng. 2017, 164, 49–67. [Google Scholar] [CrossRef]
- Koh, L.P.; Wich, S.A. Dawn of Drone Ecology: Low-Cost Autonomous Aerial Vehicles for Conservation. Trop. Conserv. Sci. 2012, 5, 121–132. [Google Scholar] [CrossRef] [Green Version]
- Boon, M.A.; Greenfield, R.; Tesfamichael, S. Wetland Assessment Using Unmanned Aerial Vehicle (UAV) Photogrammetry. ISPRS Int. Arch. Photogramm. Remote Sens. Spat. Inf. Sci. 2016, XLI-B1, 781–788. [Google Scholar] [CrossRef] [Green Version]
- Lee, K.J.; Park, Y.; Bunkin, A.; Nunes, R.; Pershin, S.; Voliak, K. Helicopter-based lidar system for monitoring the upper ocean and terrain surface. Appl. Opt. 2002, 41, 401. [Google Scholar] [CrossRef]
- Senay, G.B.; Ward, A.D.; Lyon, J.G.; Fausey, N.R.; Nokes, S.E. Manipulation of High Spatial Resolution Aircraft Remote Sensing Data For Usein Site-specific Farming. Trans. ASAE 1998, 41, 489–495. [Google Scholar] [CrossRef]
- Wang, W.Q. Near-space vehicles: Supply a gap between satellites and airplanes for remote sensing. IEEE Aerosp. Electron. Syst. Mag. 2011, 26, 4–9. [Google Scholar] [CrossRef]
- Elfes, A.; Siqueira Bueno, S.; Bergerman, M.; Ramos, J.G. A semi-autonomous robotic airship for environmental monitoring missions. In Proceedings of the 1998 IEEE International Conference on Robotics and Automation, Leuven, Belgium, 20 May 1998; Volume 4, pp. 3449–3455. [Google Scholar]
- Ghamisi, P.; Plaza, J.; Chen, Y.; Li, J.; Plaza, A.J. Advanced Spectral Classifiers for Hyperspectral Images: A review. IEEE Geosci. Remote Sens. Mag. 2017, 5, 8–32. [Google Scholar] [CrossRef] [Green Version]
- Goetz, A.F.H. Three decades of hyperspectral remote sensing of the Earth: A personal view. Remote Sens. Environ. 2009, 113 (Suppl. 1), S5–S16. [Google Scholar] [CrossRef]
- Paoletti, M.E.; Haut, J.M.; Plaza, J.; Plaza, A. Deep learning classifiers for hyperspectral imaging: A review. ISPRS J. Photogramm. Remote Sens. 2019, 158, 279–317. [Google Scholar] [CrossRef]
- Liu, Z.; Wu, J.; Yang, H.; Li, B.; Zhang, Y.; Yang, S. Developing unmanned airship onboard multispectral imagery system for quick-response to drinking water pollution. In MIPPR 2009: Multispectral Image Acquisition and Processing; International Society for Optics and Photonics: Yichang, China, 2009; Volume 7494, p. 74940L. [Google Scholar] [CrossRef]
- Khaliq, A.; Musci, M.A.; Chiaberge, M. Analyzing relationship between maize height and spectral indices derived from remotely sensed multispectral imagery. In Proceedings of the 2018 IEEE Applied Imagery Pattern Recognition Workshop (AIPR), Washington, DC, USA, 9–11 October 2018. [Google Scholar]
- Vaughan, R.G.; Calvin, W.M.; Taranik, J.V. SEBASS hyperspectral thermal infrared data: Surface emissivity measurement and mineral mapping. Remote Sens. Environ. 2003, 85, 48–63. [Google Scholar] [CrossRef]
- Brunetta, G.; Salata, S. Mapping urban resilience for spatial planning-A first attempt to measure the vulnerability of the system. Sustainability 2019, 11, 2331. [Google Scholar] [CrossRef] [Green Version]
- Erdelj, M.; Natalizio, E. UAV-assisted disaster management: Applications and open issues. In Proceedings of the 2016 International Conference on Computing, Networking and Communications (ICNC), Kauai, HI, USA, 15–18 February 2016; pp. 1–5. [Google Scholar]
- Bestaoui, Y. Bridge Monitoring by a Lighter than Air Robot. In Proceedings of the 49th AIAA Aerospace Sciences Meeting including the New Horizons Forum and Aerospace Exposition, Orlando, FL, USA, 4–7 January 2011. [Google Scholar]
- Becker, W.; Worden, K.; Battipede, M.; Surace, C. Uncertainty Analysis of a Dynamic Model of a Novel Remotely Piloted Airship. J. Aircr. 2012, 48, 1028–1035. [Google Scholar] [CrossRef]
- Borzuchowski, J.; Schulz, K. Retrieval of Leaf Area Index (LAI) and Soil Water Content (WC) Using Hyperspectral Remote Sensing under Controlled Glass House Conditions for Spring Barley and Sugar Beet. Remote Sens. 2010, 2, 1702. [Google Scholar] [CrossRef] [Green Version]
- Yue, J.; Tian, J.; Tian, Q.; Xu, K.; Xu, N. Development of soil moisture indices from differences in water absorption between shortwave-infrared bands. ISPRS J. Photogramm. Remote Sens. 2019, 154, 216–230. [Google Scholar] [CrossRef]
- Weng, Q. Thermal infrared remote sensing for urban climate and environmental studies: Methods, applications, and trends. ISPRS J. Photogramm. Remote Sens. 2009, 64, 335–344. [Google Scholar] [CrossRef]
- Jon, J.; Koska, B.; Pospíšil, J. Autonomous Airship Equipped by Multi-Sensor Mapping Platform. ISPRS Int. Arch. Photogramm. Remote Sens. Spat. Inf. Sci. 2013, XL-5/W1, 119–124. [Google Scholar] [CrossRef] [Green Version]
- Koska, B.; Jirka, V.; Urban, R.; Křemen, T.; Hesslerová, P.; Jon, J.; Pospíšil, J.; Fogl, M. Suitability, characteristics, and comparison of an airship UAV with lidar for middle size area mapping. Int. J. Remote Sens. 2017, 38, 2973–2990. [Google Scholar] [CrossRef]
- Xu, B.; Gong, P. Land-use/land-cover classification with multispectral and hyperspectral EO-1 data. Photogramm. Eng. Remote Sens. 2007, 73, 955–965. [Google Scholar] [CrossRef] [Green Version]
- Van der Zwaan, S.; Bernardino, A.; Santos-Victor, J. Vision based station keeping and docking for an aerial blimp. IEEE Int. Conf. Intell. Robot. Syst. 2000, 1, 614–619. [Google Scholar]
- da Silva Metelo, F.M.; Garcia Campos, L.R. Vision based control of an autonomous blimp. In Proceedings of the 2013 IEEE International Conference on Control Applications (CCA), Hyderabad, India, 28–30 August 2013. [Google Scholar]
- Cramer, E.A. The Mineseeker Airship: “Supporting the UN”. J. Conv. Weapons Destr. 2001, 5, 23. [Google Scholar]
- Lavan, C.K., Jr. Remote sensing using airships. J. Appl. Geophys. 2007, 61, 165–167. [Google Scholar]
- Battipede, M.; Lando, M.; Gili, P. Mathematical modelling of an innovative unmanned airship for its control law design. IFIP Int. Fed. Inf. Process. 2006, 202, 31–42. [Google Scholar]
- Ramos, J.G.; De Paiva, E.C.; Azinheira, J.R.; Bueno, S.S.; Maeta, S.M.; Mirisola, L.G.B.; Bergerman, M.; Faria, B.G. Autonomous flight experiment with a robotic unmanned airship. In Proceedings of the 2001 ICRA IEEE International Conference on Robotics and Automation, Seoul, Korea, 21–26 May 2001; Volume 4, pp. 4152–4157. [Google Scholar]
- Bueno, S.; Azinheira, J.R.; Ramos, G.; Paiva, E.; Rives, P.; Elfes, A.; Carvalho, J.R.H.; Silveira, G.F. Project AURORA: Towards an Autonomous Robotic Airship. In Proceedings of the IEEE International Conference on Intelligent Robots and Systems, Lausanne, Switzerland, 30 September–4 October 2002; pp. 43–54. [Google Scholar]
- Kantor, G.; Wettergreen, D.; Ostrowski, J.P.; Singh, S. Collection of environmental data from an airship platform. In Sensor Fusion and Decentralized Control in Robotic Systems IV; International Society for Optics and Photonics: Boston, MA, USA, 2001; Volume 4571, pp. 76–83. [Google Scholar]
- Fleury, S.; Herrb, M.; Lacroix, S.; Dollat, X.; Marcoul, P.; Jacquet, A. Available online: https://homepages.laas.fr/simon/eden/robots/blimp.php (accessed on 25 January 2021).
- Onosato, M.; Tadokoro, S.; Nakanishi, H.; Nonami, K.; Kawabata, K.; Hada, Y.; Asama, H.; Takemura, F.; Maeda, K.; Miura, K.; et al. Disaster information gathering aerial robot systems. In Rescue Robotics: DDT Project on Robots and Systems for Urban Search and Rescue; Springer: London, UK, 2009; pp. 33–55. [Google Scholar]
- Ren, P.; Meng, Q.; Zhang, Y.; Zhao, L.; Yuan, X.; Feng, X. An Unmanned Airship Thermal Infrared Remote Sensing System for Low-Altitude and High Spatial Resolution Monitoring of Urban Thermal Environments: Integration and an Experiment. Remote Sens. 2015, 7, 14259–14275. [Google Scholar] [CrossRef] [Green Version]
- Zhang, A.; Hu, S.; Meng, X.; Yang, L.; Li, H. Toward High Altitude Airship Ground-Based Boresight Calibration of Hyperspectral Pushbroom Imaging Sensors. Remote Sens. 2015, 7, 17297–17311. [Google Scholar] [CrossRef] [Green Version]
- Clark, M. Available online: https://www.suasnews.com/2012/04/galaxy-airships-flying-a-cineflex-in-2008/ (accessed on 25 January 2021).
- White, J. Available online: https://galaxyuas.com/2019/10/16/galaxy-selected-for-phase-i-army-sbir-for-aerostat-airship-hybrid/ (accessed on 25 January 2021).
- Kirsch, M.; Lorenz, S.; Zimmermann, R.; Tusa, L.; Möckel, R.; Hödl, P.; Booysen, R.; Khodadadzadeh, M.; Gloaguen, R. Integration of Terrestrial and Drone-Borne Hyperspectral and Photogrammetric Sensing Methods for Exploration Mapping and Mining Monitoring. Remote Sens. 2018, 10, 1366. [Google Scholar] [CrossRef] [Green Version]
- Khaliq, A.; Comba, L.; Biglia, A.; Ricauda Aimonino, D.; Chiaberge, M.; Gay, P. Comparison of Satellite and UAV-Based Multispectral Imagery for Vineyard Variability Assessment. Remote Sens. 2019, 11, 436. [Google Scholar] [CrossRef] [Green Version]
- Pádua, L.; Guimarães, N.; Adão, T.; Sousa, A.; Peres, E.; Sousa, J.J. Effectiveness of sentinel-2 in multi-temporal post-fire monitoring when compared with UAV Imagery. ISPRS Int. J. Geo-Inf. 2020, 9, 225. [Google Scholar] [CrossRef] [Green Version]
- Boon, M.A.; Drijfhout, A.P.; Tesfamichael, S. Comparison of a fixed-wing and multi-rotor UAV for environmental mapping applications: A case study. Int. Arch. Photogramm. Remote Sens. Spat. Inf. Sci. ISPRS Arch. 2017, 42, 47–54. [Google Scholar] [CrossRef] [Green Version]
- Opromolla, R.; Esposito, G.; Fasano, G. In-flight estimation of magnetic biases on board of small UAVs exploiting cooperation. In Proceedings of the 2019 IEEE 5th International Workshop on Metrology for AeroSpace, Turin, Italy, 19–21 June 2019; pp. 655–660. [Google Scholar]
- Vallet, J. GPS/IMU and LiDAR integration to aerial photogrammetry: Development and practical experiences with Helimap System®. Vorträge Dreiländertagung 2007, 27, 1–10. [Google Scholar]
- Matese, A.; Toscano, P.; Di Gennaro, S.F.; Genesio, L.; Vaccari, F.P.; Primicerio, J.; Belli, C.; Zaldei, A.; Bianconi, R.; Gioli, B. Intercomparison of UAV, aircraft and satellite remote sensing platforms for precision viticulture. Remote Sens. 2015, 7, 2971–2990. [Google Scholar] [CrossRef] [Green Version]
- EASA. Easy Access Rules for Unmanned Aircraft Systems (Regulations (EU) 2019/947 and (EU) 2019/945); European Union: Brussels, Belgium, 2021.
- EASA. Commission Implementing Regulation (EU) No 923/2012; OJ L 281; European Union: Brussels, Belgium, 2012; pp. 1–66.
- EASA. Commission Regulation (EU) No 965/2012; OJ L 296; European Union: Brussels, Belgium, 2012; pp. 1–148.
- EASA. Commission Regulation (EU) No 1332/2011; OJ L 336; European Union: Brussels, Belgium, 2011; p. 20.
- Regolamento ENAC UAS-IT, 1st ed.; Ente Nazionale per l’Aviazione Civile: Rome, Italy, 4 January 2021.
- Battipede, M.; Gili, P.; Maggiore, P.; Lando, M. Risk assessment and failure analysis for an innovative remotely-piloted airship. In Proceedings of the 6th AIAA Aviation Technology, Integration and Operations Conference (ATIO), Wichita, Kansas, 25–27 September 2006; Volume 1, pp. 119–129. [Google Scholar]
- Zhang, Y. Photogrammetric Processing of Low Altitude Image Sequences by Unmanned Airship. Int. Arch. Photogramm. Remote Sens. Spat. Inf. Sci. 2008, 37, 751–757. [Google Scholar]
- Galeazzi, C.; Sacchetti, A.; Cisbani, A.; Babini, G. The prisma program. In Proceedings of the 2008 IEEE International Geoscience and Remote Sensing Symposium, Boston, MA, USA, 7–11 July 2008; Volume 4. [Google Scholar]
- Gröger, G.; Kolbe, T.H.; Nagel, C.; Häfele, K.H. OGC City Geography Markup Language (Citygml) Encoding Standard; Open Geospatial Consortium Inc.: Wayland, MA, USA, 2008. [Google Scholar]
- Carichner, G.E.; Nicolai, L.M. Fundamentals of Aircraft and Airship Design 2012, Volume 2–Airship Design and Case Studies; American Institute of Aeronautics and Astronautics, Inc.: Washington, DC, USA, 2013. [Google Scholar]
- Cappadona, A.; Lecca, R.; Vazzola, M.; Gili, P.; Farina, P.; Surace, C. Innovative unmanned airship structural analysis: Dual-hull and exoskeletal configurations. J. Phys. Conf. Ser. 2009, 181, 12097. [Google Scholar] [CrossRef] [Green Version]
- Kim, B.; Lee, S.; Park, G.; Cho, S.J. Development of an unmanned airship for magnetic exploration. Explor. Geophys. 2020. [Google Scholar] [CrossRef]
- Ludeno, G.; Catapano, I.; Renga, A.; Vetrella, A.R.; Fasano, G.; Soldovieri, F. Assessment of a micro-UAV system for microwave tomography radar imaging. Remote Sens. Environ. 2018, 212, 90–102. [Google Scholar] [CrossRef]
- iXM-RS150F Technical Data Sheet. Available online: https://downloads.phaseone.com/7e71b0a2-f42d-42c7-896b-2c16968f79c3/English/iXM-RS_Brochure_letter.pdf (accessed on 8 March 2021).
- Thermo Tracer TH9260 Technical Data Sheet. Available online: https://www.infrared.avio.co.jp/en/products/ir-thermo/lineup/th9260/index.html (accessed on 8 March 2021).
- AISA DUAL Hyperspectral Sensor Technical Data Sheet. Available online: http://www.adept.net.au/cameras/specim/systems/pdf/Aisa_Dual.pdf (accessed on 8 March 2021).
- ALTM Galaxy T1000 Airborne Lidar Terrain Mapper Technical Data Sheet. Available online: https://geo3d.hr/sites/default/files/2018-06/2017-11-02_Optech_Galaxy-Brochure_HR.pdf (accessed on 8 March 2021).
- Ferraris, M.; Civera, M.; Ceravolo, R.; Surace, C.; Betti, R. Using Enhanced Cepstral Analysis for Structural Health Monitoring; Springer: Singapore, 2020; pp. 150–165. [Google Scholar]
- Civera, M.; Ferraris, M.; Ceravolo, R.; Surace, C.; Betti, R. The Teager-Kaiser Energy Cepstral Coefficients as an Effective Structural Health Monitoring Tool. Appl. Sci. 2019, 9, 5064. [Google Scholar] [CrossRef] [Green Version]
- Civera, M.; Surace, C. A Comparative Analysis of Signal Decomposition Techniques for Structural Health Monitoring on an Experimental Benchmark. Sensors 2021, 21, 1825. [Google Scholar] [CrossRef]
- Opromolla, R.; Fasano, G.; Accardo, D. Perspectives and sensing concepts for small UAS sense and avoid. In Proceedings of the 2018 IEEE/AIAA 37th Digital Avionics Systems Conference (DASC), London, UK, 23–27 September 2018; pp. 1–10. [Google Scholar]
- Battipede, M.; Gili, P.; Lando, M. Ground station and flight simulator for a remotely-piloted non conventional airship. In Proceedings of the AIAA Guidance, Navigation, and Control Conference and Exhibit, San Francisco, CA, USA, 15–18 August 2005; Volume 5, pp. 3660–3671. [Google Scholar]
- Azinheira, J.R.; de Paiva, E.C.; Ramos, J.G.; Bueno, S.S. Mission path following for an autonomous unmanned airship. In Proceedings of the 2000 ICRA, Millennium Conference. IEEE International Conference on Robotics and Automation, Symposia Proceedings, San Francisco, CA, USA, 24–28 April 2000; Volume 2, pp. 1269–1275. [Google Scholar]
- Yang, Y.; Lin, Z.; Liu, F. Stable Imaging and Accuracy Issues of Low-Altitude Unmanned Aerial Vehicle Photogrammetry Systems. Remote Sens. 2016, 8, 316. [Google Scholar] [CrossRef] [Green Version]
- Battipede, M.; Gili, P.; Vazzola, M. Structural and aerodynamics analysis on different architectures for the elettra twin flyer prototype. J. Intell. Robot. Syst. Theory Appl. 2013, 72, 123–144. [Google Scholar] [CrossRef] [Green Version]
- Liang, H.; Zhu, M.; Guo, X.; Zheng, Z. Conceptual design optimization of high altitude airship in concurrent subspace optimization. In Proceedings of the 50th AIAA Aerospace Sciences Meeting Including the New Horizons Forum and Aerospace Exposition, Nashville, TN, USA, 9–12 January 2012; pp. 1–17. [Google Scholar]
- Porta, M. Subsystems Mass Estimation of a UAV-LTA Stratospheric Platform. Master’s Thesis, Politecnico di Torino, Turin, Italy, 2016. [Google Scholar]
- Khoury, G.A.; Gillett, J.D. Airship Technology; Cambridge University Press: Cambridge, UK, 1981. [Google Scholar]
- Matweb Matweb Aluminium 2024-T3. Available online: http://www.matweb.com/search/DataSheet.%0Aaspx?MatGUID=57483b4d782940faaf12964a1821fb61&ckck=1 (accessed on 20 May 2020).
- Dassault Systemes Simulia Corp. Abaqus Analysis User’s Guide 2016; Dassault Systemes Simulia Corp.: Providence, RI, USA, 2013. [Google Scholar]
- Liao, L. A Study of Inertia Relief Analysis. In Proceedings of the 52nd AIAA/ASME/ASCE/AHS/ASC Structures, Structural Dynamics and Materials Conference, Denver, CO, USA, 4–7 April 2011; pp. 1–10. [Google Scholar]
- Becker, W.; Oakley, J.E.; Surace, C.; Gili, P.; Rowson, J.; Worden, K. Bayesian sensitivity analysis of a nonlinear finite element model. Mech. Syst. Signal Process. 2012, 32, 18–31. [Google Scholar] [CrossRef]
- Karunarathne, L.; Economou, J.T.; Knowles, K. Power and energy management system for fuel cell unmanned aerial vehicle. Proc. Inst. Mech. Eng. Part G J. Aerosp. Eng. 2012, 226, 437–454. [Google Scholar] [CrossRef]
- Sürer, M.G.; Arat, H.T. State of art of hydrogen usage as a fuel on aviation. Eur. Mech. Sci. 2017, 2, 20–30. [Google Scholar]
- Misra, A. Summary of 2017 NASA Workshop on Assessment of Advanced Battery Technologies for Aerospace Applications. In Proceedings of the 2018 SciTech Forum, Kissimmee, FL, USA, 11 January 2018; pp. 1–18. [Google Scholar]
- Scrosati, B.; Garche, J. Lithium batteries: Status, prospects and future. J. Power Sources 2010, 195, 2419–2430. [Google Scholar] [CrossRef]
- Kokam. Available online: https://kokam.com/cell (accessed on 5 May 2020).
- Winarto, H. BEMT Algorithm for the Prediction of the Performance of Arbitrary Propellers; Technical Report; Royal Melbourne Institute of Technology: Melbourne, Australia, 2004. [Google Scholar]
- McCrink, M.; Gregory, J.W. Blade Element Momentum Modeling of Low- Re Small UAS Electric Propulsion Systems. In Proceedings of the 33rd AIAA Applied Aerodynamics Conference, Dallas, TX, USA, 22–26 June 2015; pp. 1–23. [Google Scholar]
- Gili, P.; Lerro, A.; Vazzola, M.; Visone, M. A New Approach for the Estimation of the Aerodynamic Damping Characteristics of the ETF Demonstrator. SAE Int. J. Aerosp. 2011, 4, 1115–1124. [Google Scholar] [CrossRef]
- Battipede, M.; Lando, M.; Battipede, M.; Lando, M.; Gili, P.A. Peculiar Performance of a New Lighter-Than-Air Platform for Monitoring. In Proceedings of the AIAA 4th Aviation Technology, Integration and Operations (ATIO) Forum, Chicago, IL, USA, 20–22 September 2004. [Google Scholar]
Figure 1.
Operating altitudes of (manned and unmanned) aerial monitoring systems.

Figure 2.
Comparison of the various land survey strategies.

Figure 3.
Typical flight route options for aerial surveys: (a) standard survey pattern, (b) race-tracking, and (c) proposed strategy with no 180° turns.
Figure 3.
Typical flight route options for aerial surveys: (a) standard survey pattern, (b) race-tracking, and (c) proposed strategy with no 180° turns.

Figure 4.
Conceptual sketch of the proposed LTA platform for land surveying. (a) Side view, (b) front view.
Figure 4.
Conceptual sketch of the proposed LTA platform for land surveying. (a) Side view, (b) front view.

Figure 5.
The range of the electromagnetic spectrum covered by the proposed onboard sensing devices (HD camera, hyperspectral, and thermographic camera).
Figure 5.
The range of the electromagnetic spectrum covered by the proposed onboard sensing devices (HD camera, hyperspectral, and thermographic camera).

Figure 6.
Examples of commercially available sensors which can fit the intended purposes. (a) Phase One® iXM-RS150F camera (b) NEC® TH9260 thermographic camera (c) SPECIM® AisaDUAL combined hyperspectral sensor (AisaHAWK and AisaEAGLE, for VNIR and SWIR wavelength) with its integrated stabilizer (d) Optech® ALTM Galaxy T1000 laser scanner mounted on its dedicated gyrostabilizer (which can accommodate the iXM-RS150F camera as well).

Figure 7.
Rib cross-section. The geometry is represented as a function of the half-width, w; height , and thickness .
Figure 7.
Rib cross-section. The geometry is represented as a function of the half-width, w; height , and thickness .

Figure 8.
Structural analysis results: (a) hovering results showing airship geometries ensuring vertical equilibrium and structural integrity, plotted as a function of airship length, for a carbon/epoxy structural frame, (b) parking results showing maximum displacement of the structural frame as a function of the landing leg position.

Figure 9.
The plot of airship weight as a function of the distance to the survey site for a survey area of 107 m2 (10 km2).
Figure 9.
The plot of airship weight as a function of the distance to the survey site for a survey area of 107 m2 (10 km2).

Figure 10.
Mass breakdown of the airship using: (a) battery, and (b) fuel cell power system.

Figure 11.
Variation of propeller efficiency as a function of propeller outer radius and angular velocity: (a) surface plot, and (b) isolines.
Figure 11.
Variation of propeller efficiency as a function of propeller outer radius and angular velocity: (a) surface plot, and (b) isolines.

Figure 12.
Isoline plot presenting regions satisfying the minimum thrust condition: (a) propeller efficiency, and (b) propeller thrust, as a function of and .
Figure 12.
Isoline plot presenting regions satisfying the minimum thrust condition: (a) propeller efficiency, and (b) propeller thrust, as a function of and .

Figure 13.
Isoline plots representing regions satisfying the minimum thrust condition: propeller efficiency (a) as a function of and , and (b) as a function and .
Figure 13.
Isoline plots representing regions satisfying the minimum thrust condition: propeller efficiency (a) as a function of and , and (b) as a function and .

Figure 14.
Optimized propeller characteristics: (a) chord length, and (b) Reynolds number, along the span of the propeller blade.
Figure 14.
Optimized propeller characteristics: (a) chord length, and (b) Reynolds number, along the span of the propeller blade.

Figure 15.
Optimized propeller characteristics: (a) factors a and b, (b) lift and drag coefficients, along the span of the propeller blade.
Figure 15.
Optimized propeller characteristics: (a) factors a and b, (b) lift and drag coefficients, along the span of the propeller blade.

Figure 16.
Illustration of the airship propulsion system with thrust vector control.

Figure 17.
(a) the MGS with the details of the PS and CS, (b) the virtual cockpit, and (c) the flight controls.
Figure 17.
(a) the MGS with the details of the PS and CS, (b) the virtual cockpit, and (c) the flight controls.


Figure 18.
Qualitative cost comparison between platforms, according to the surveilled area.

Figure 19.
Flowchart of the procedure followed for the multidisciplinary design.


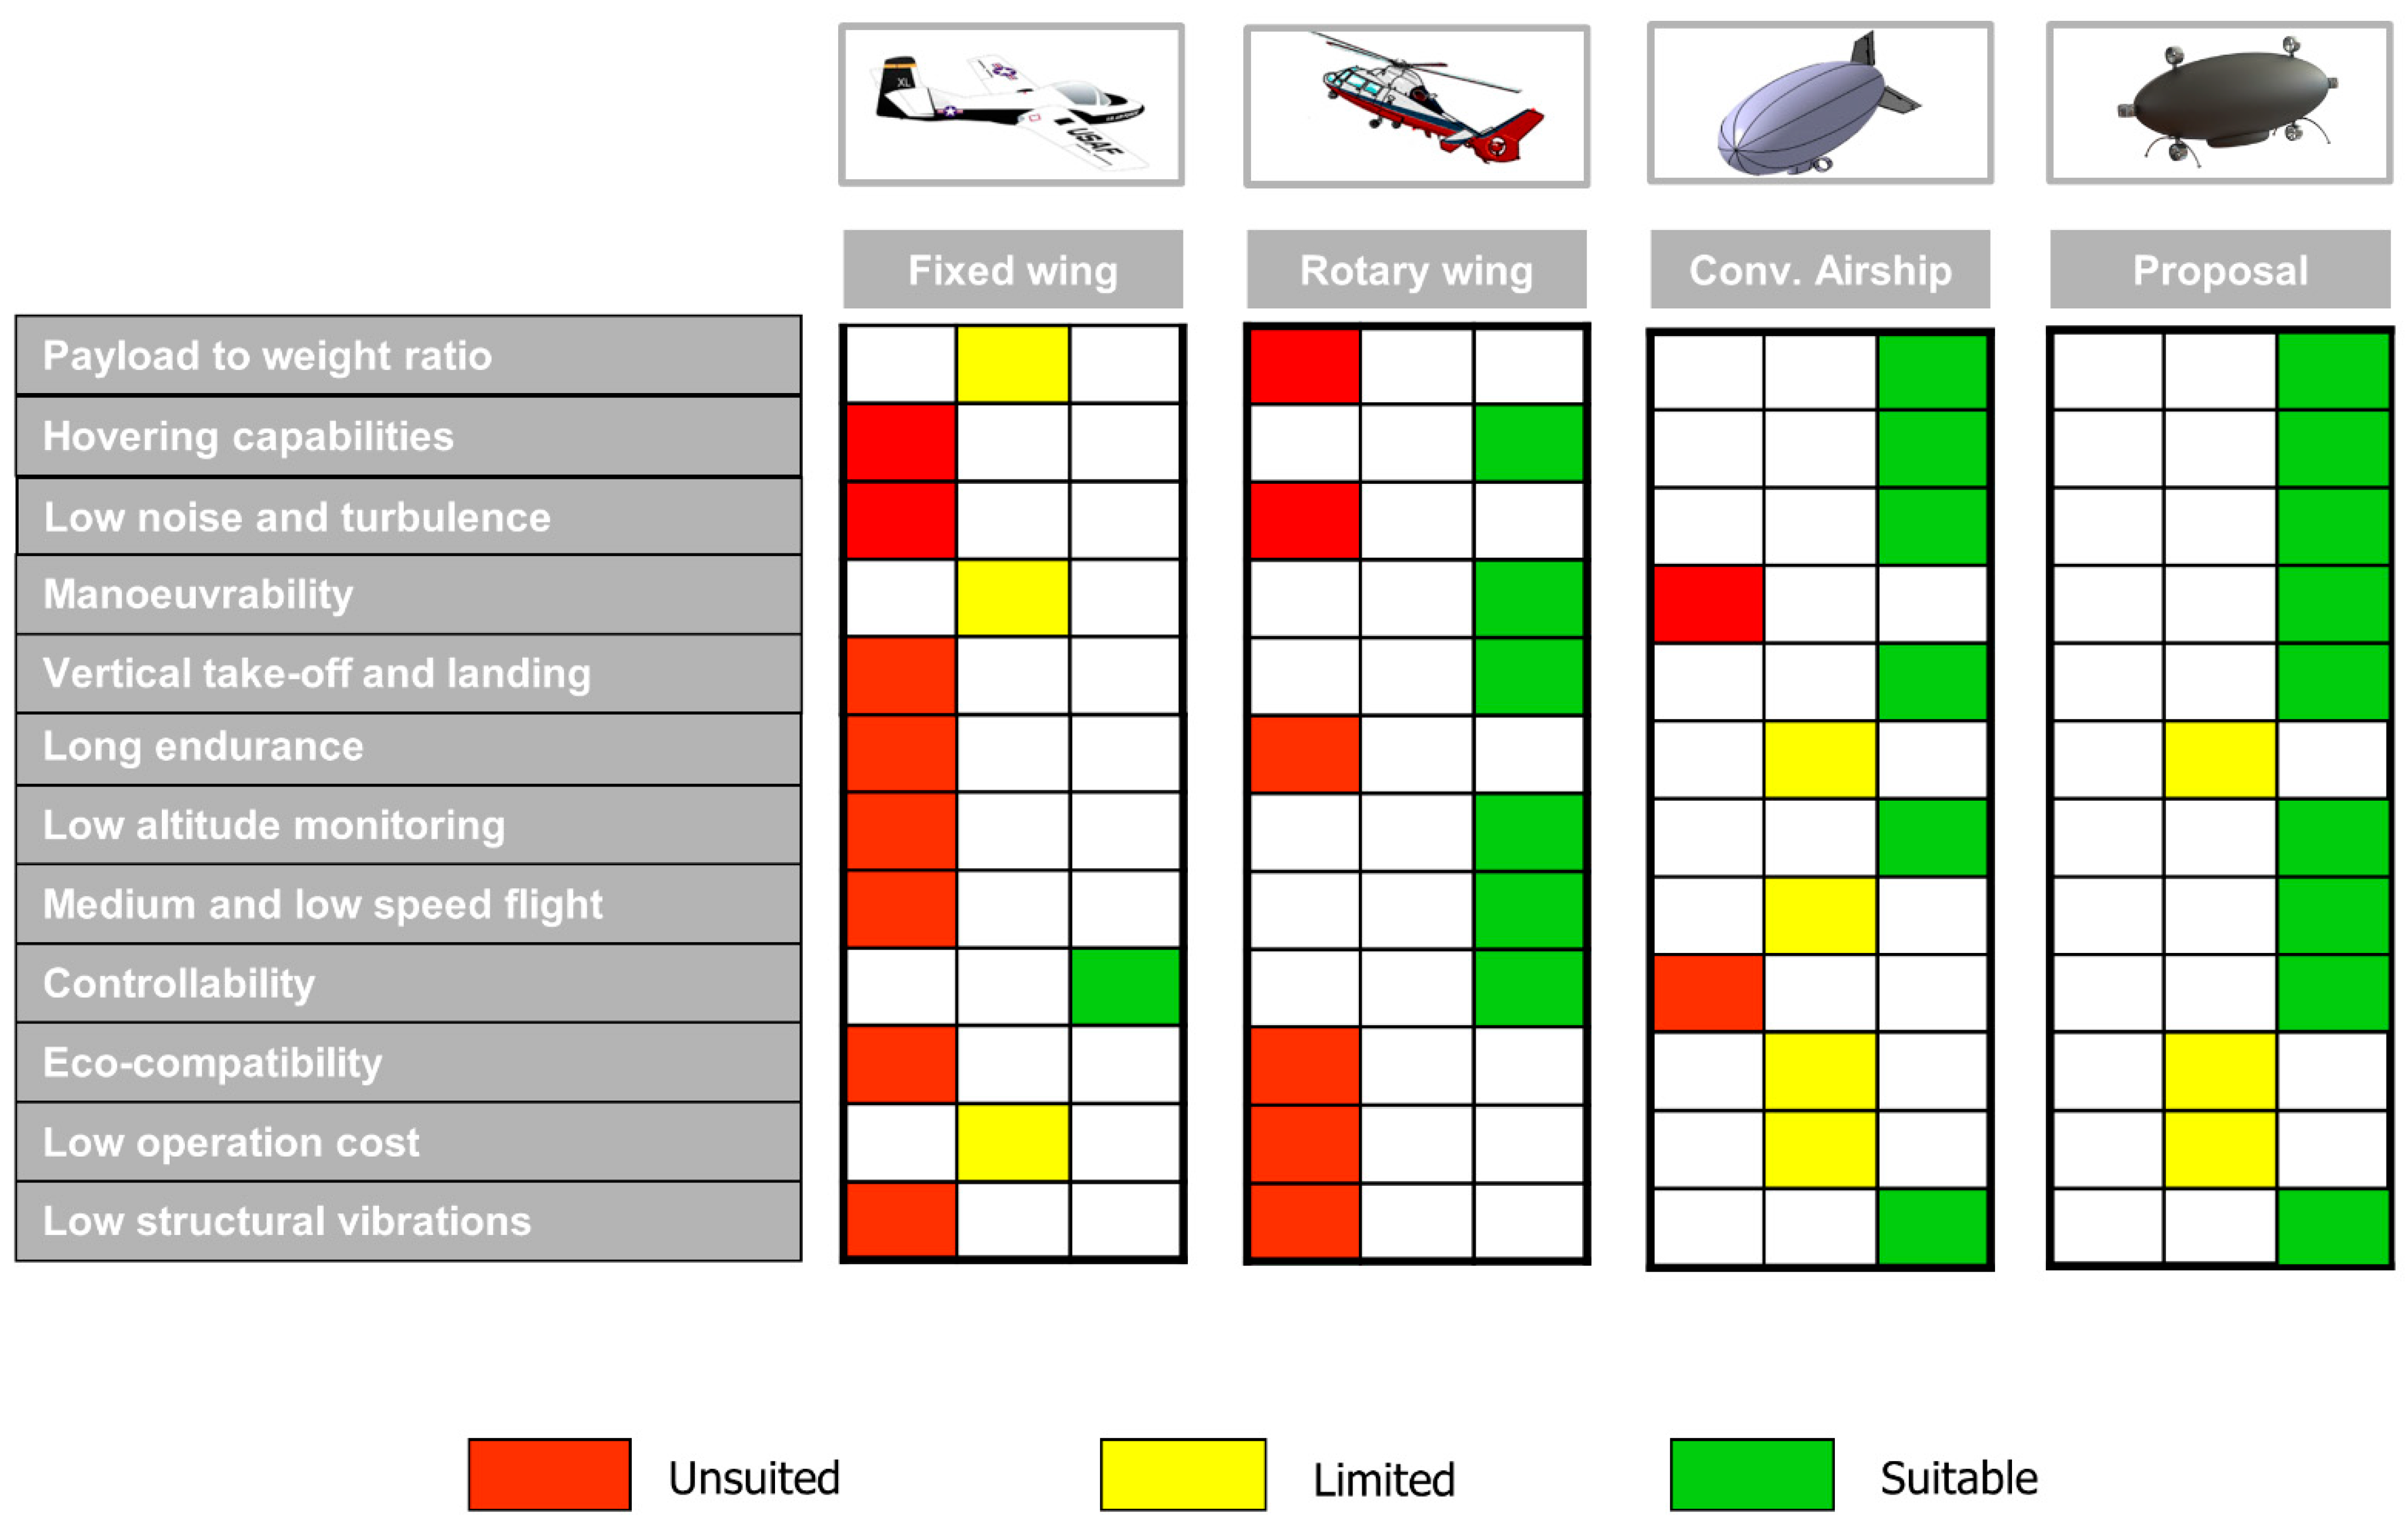
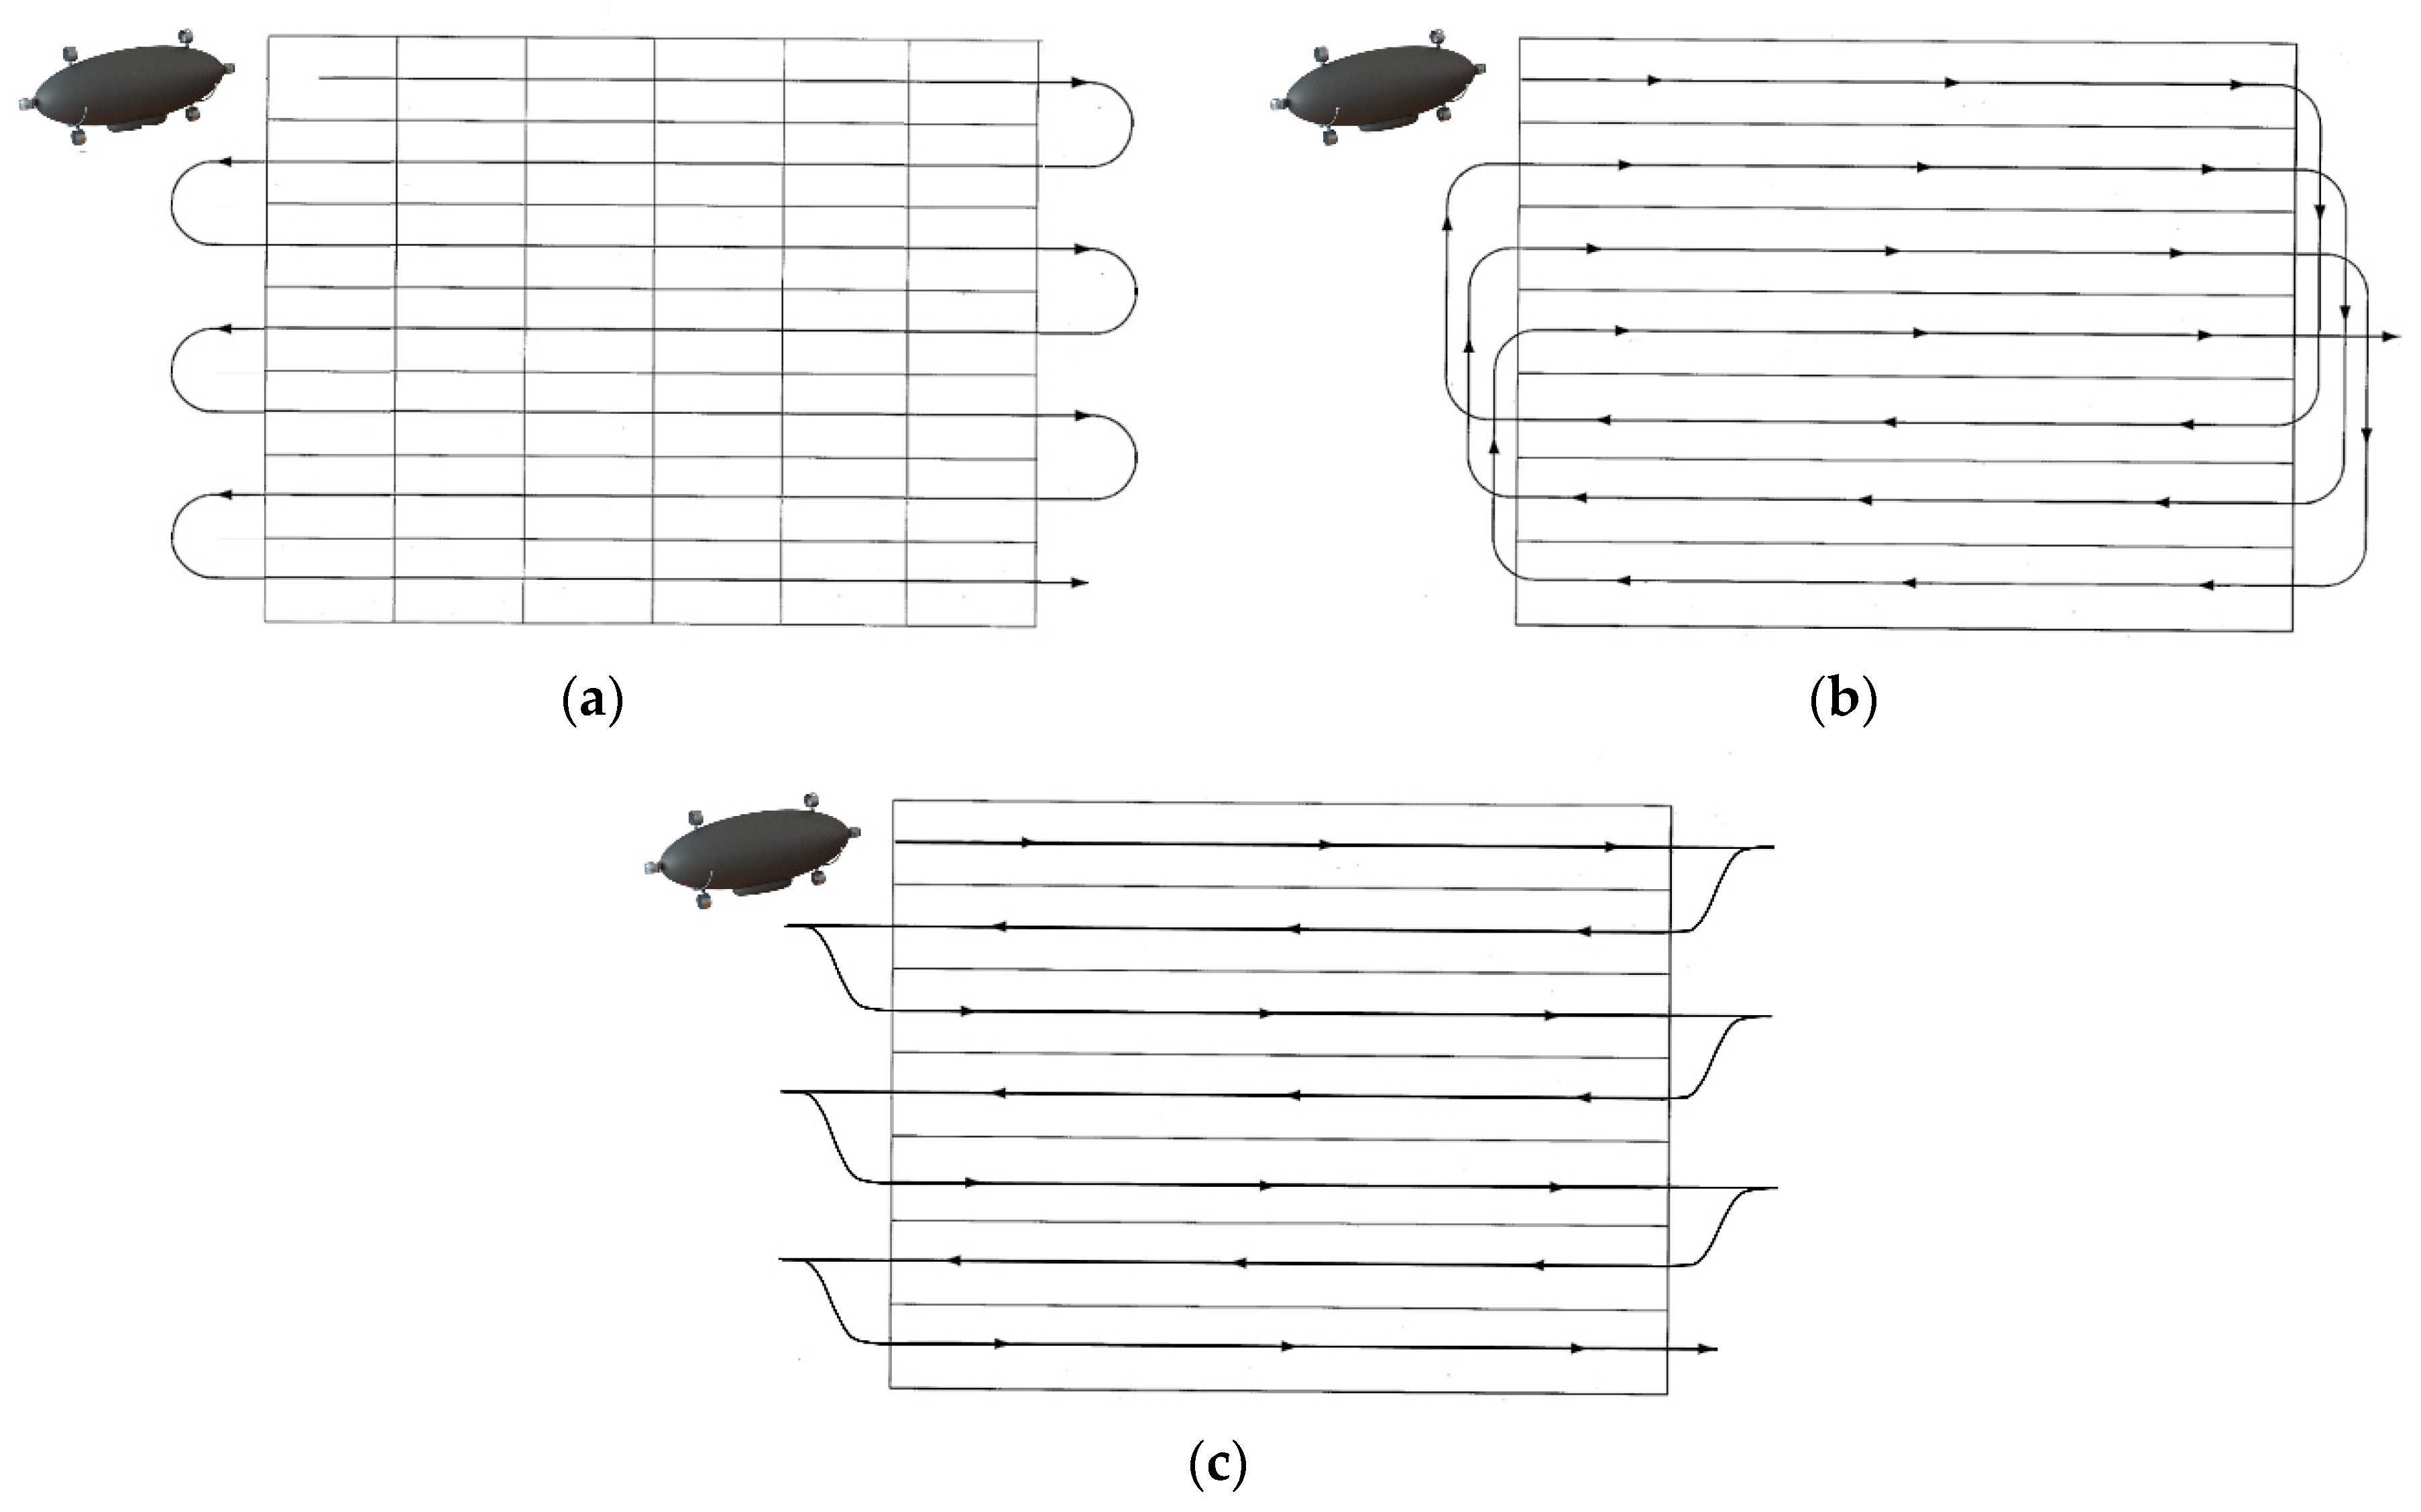
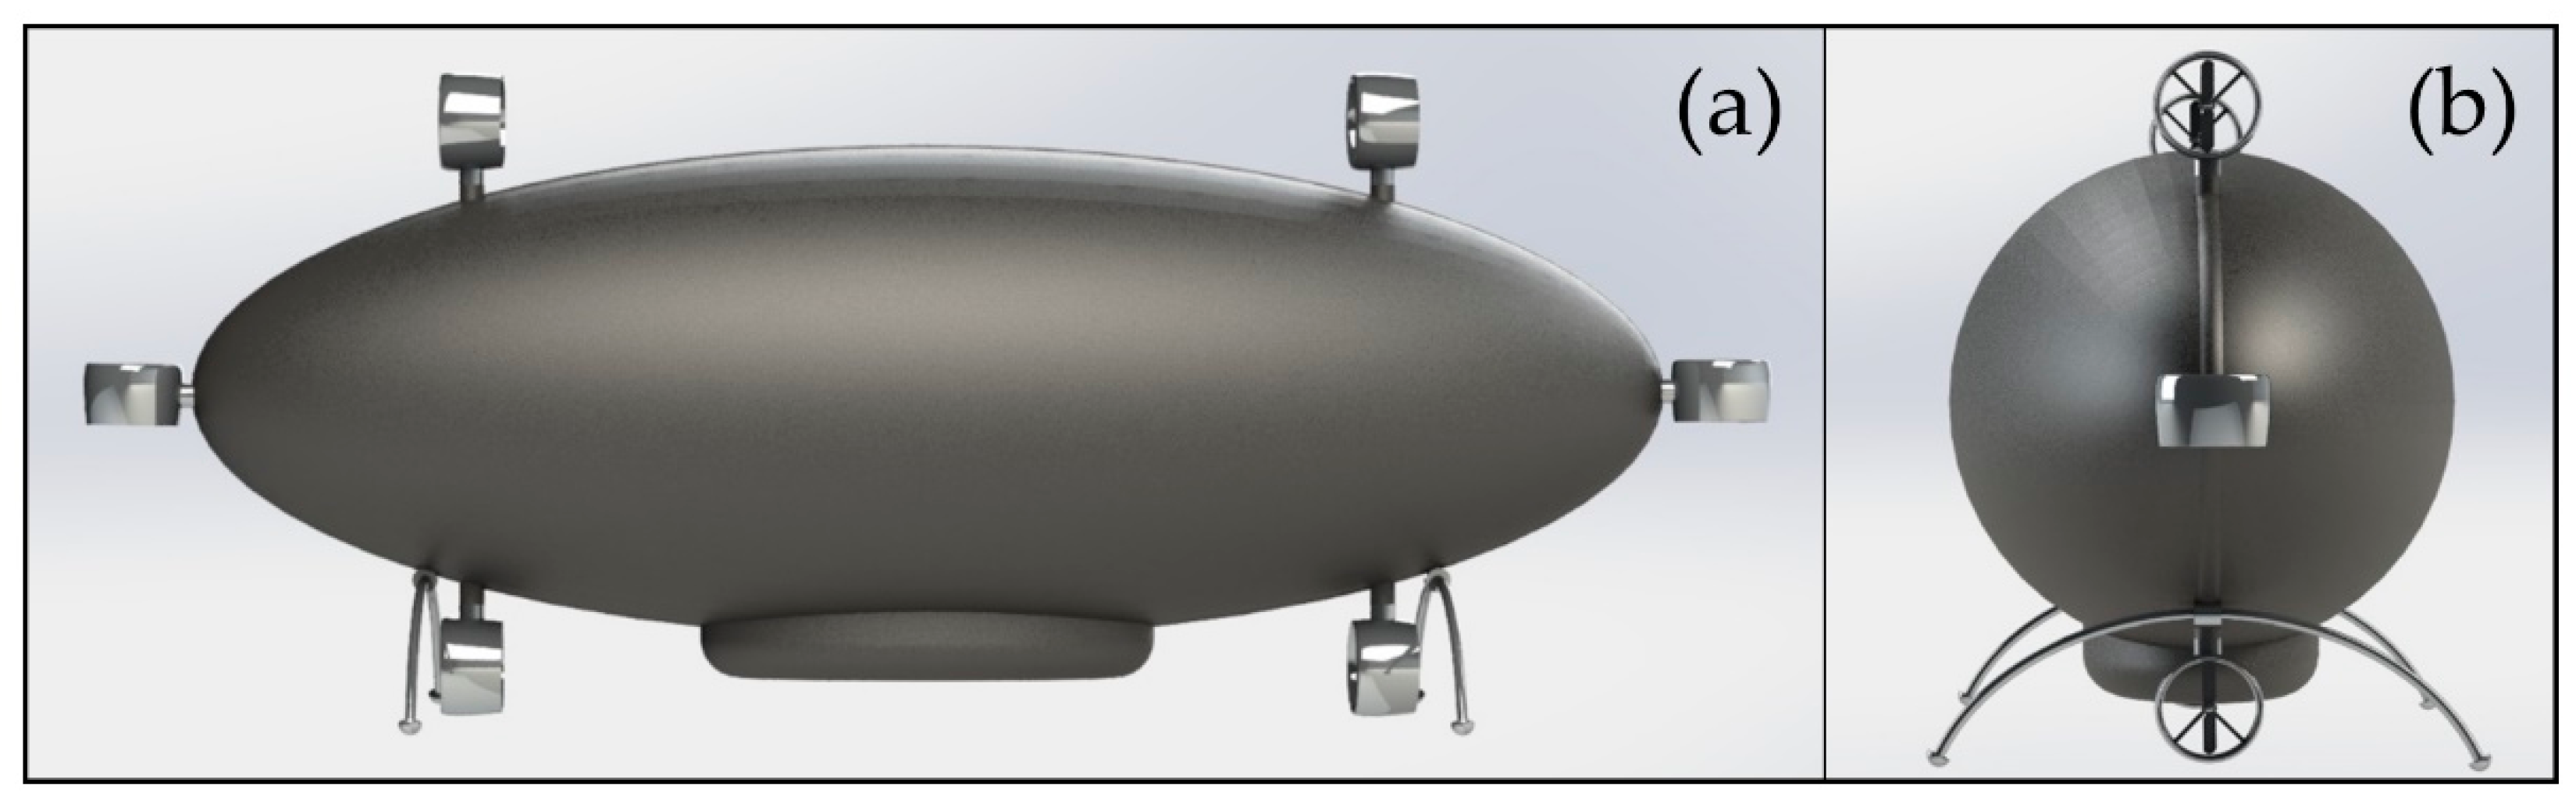
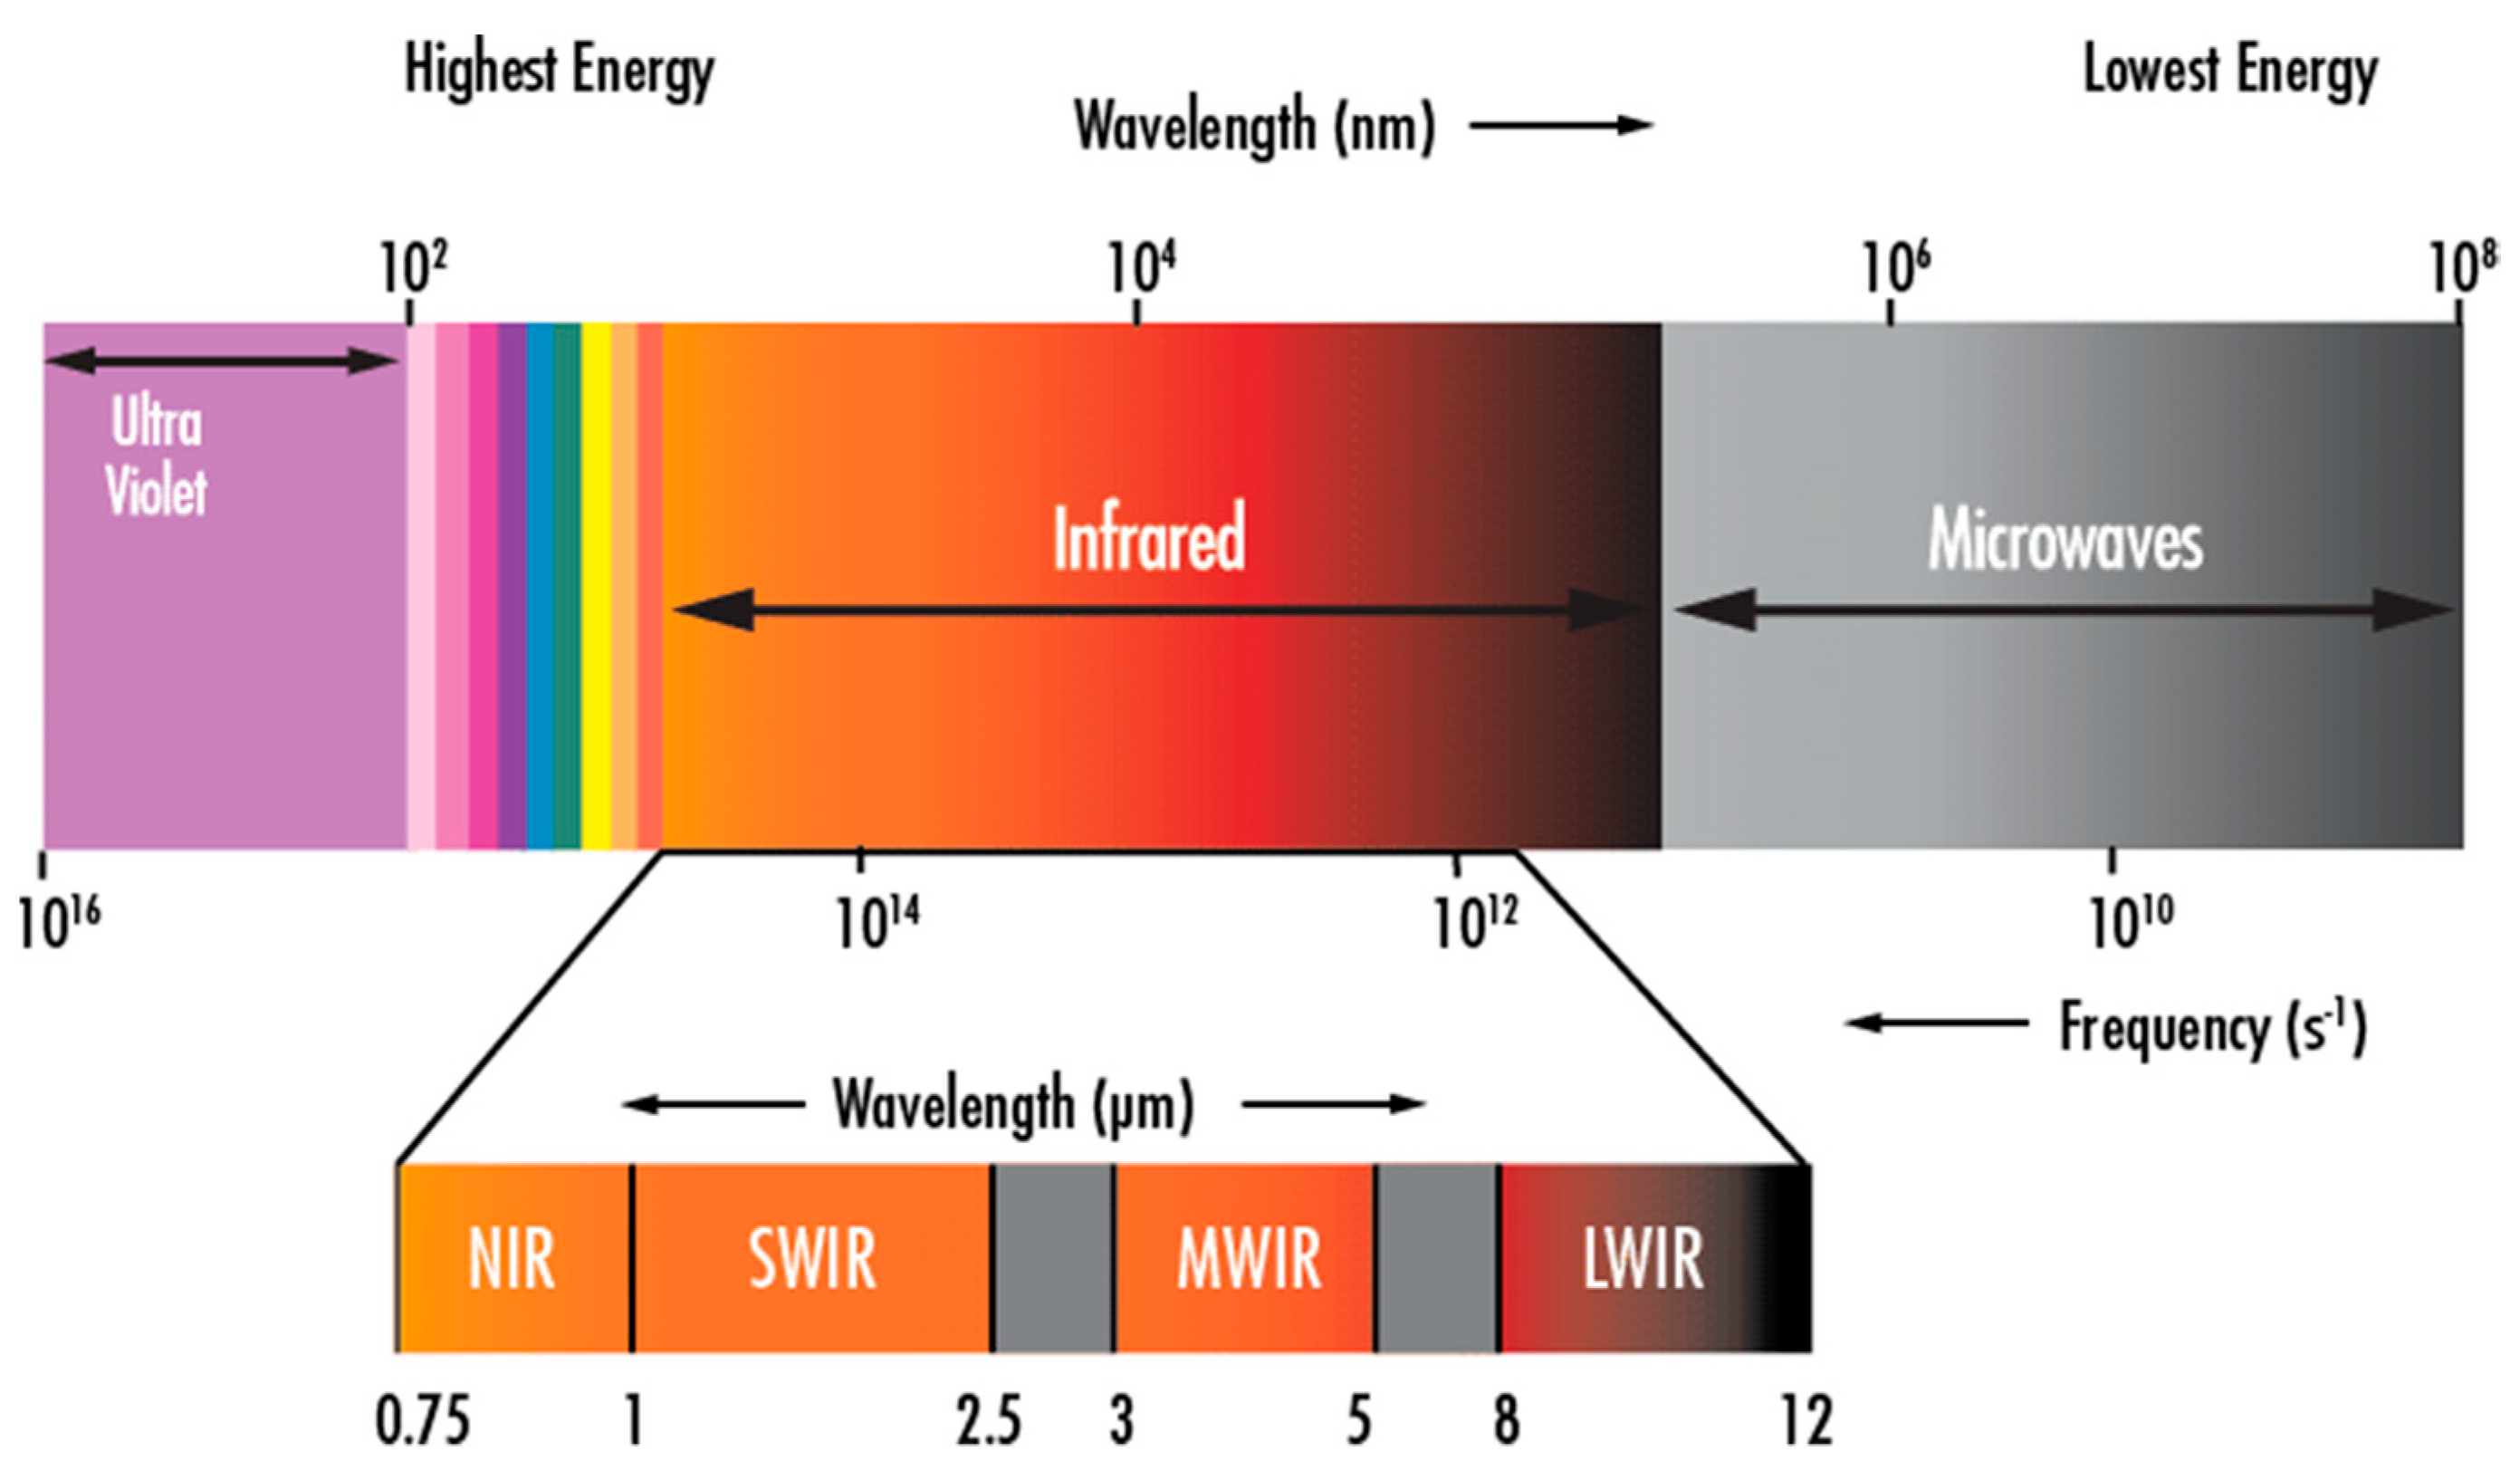
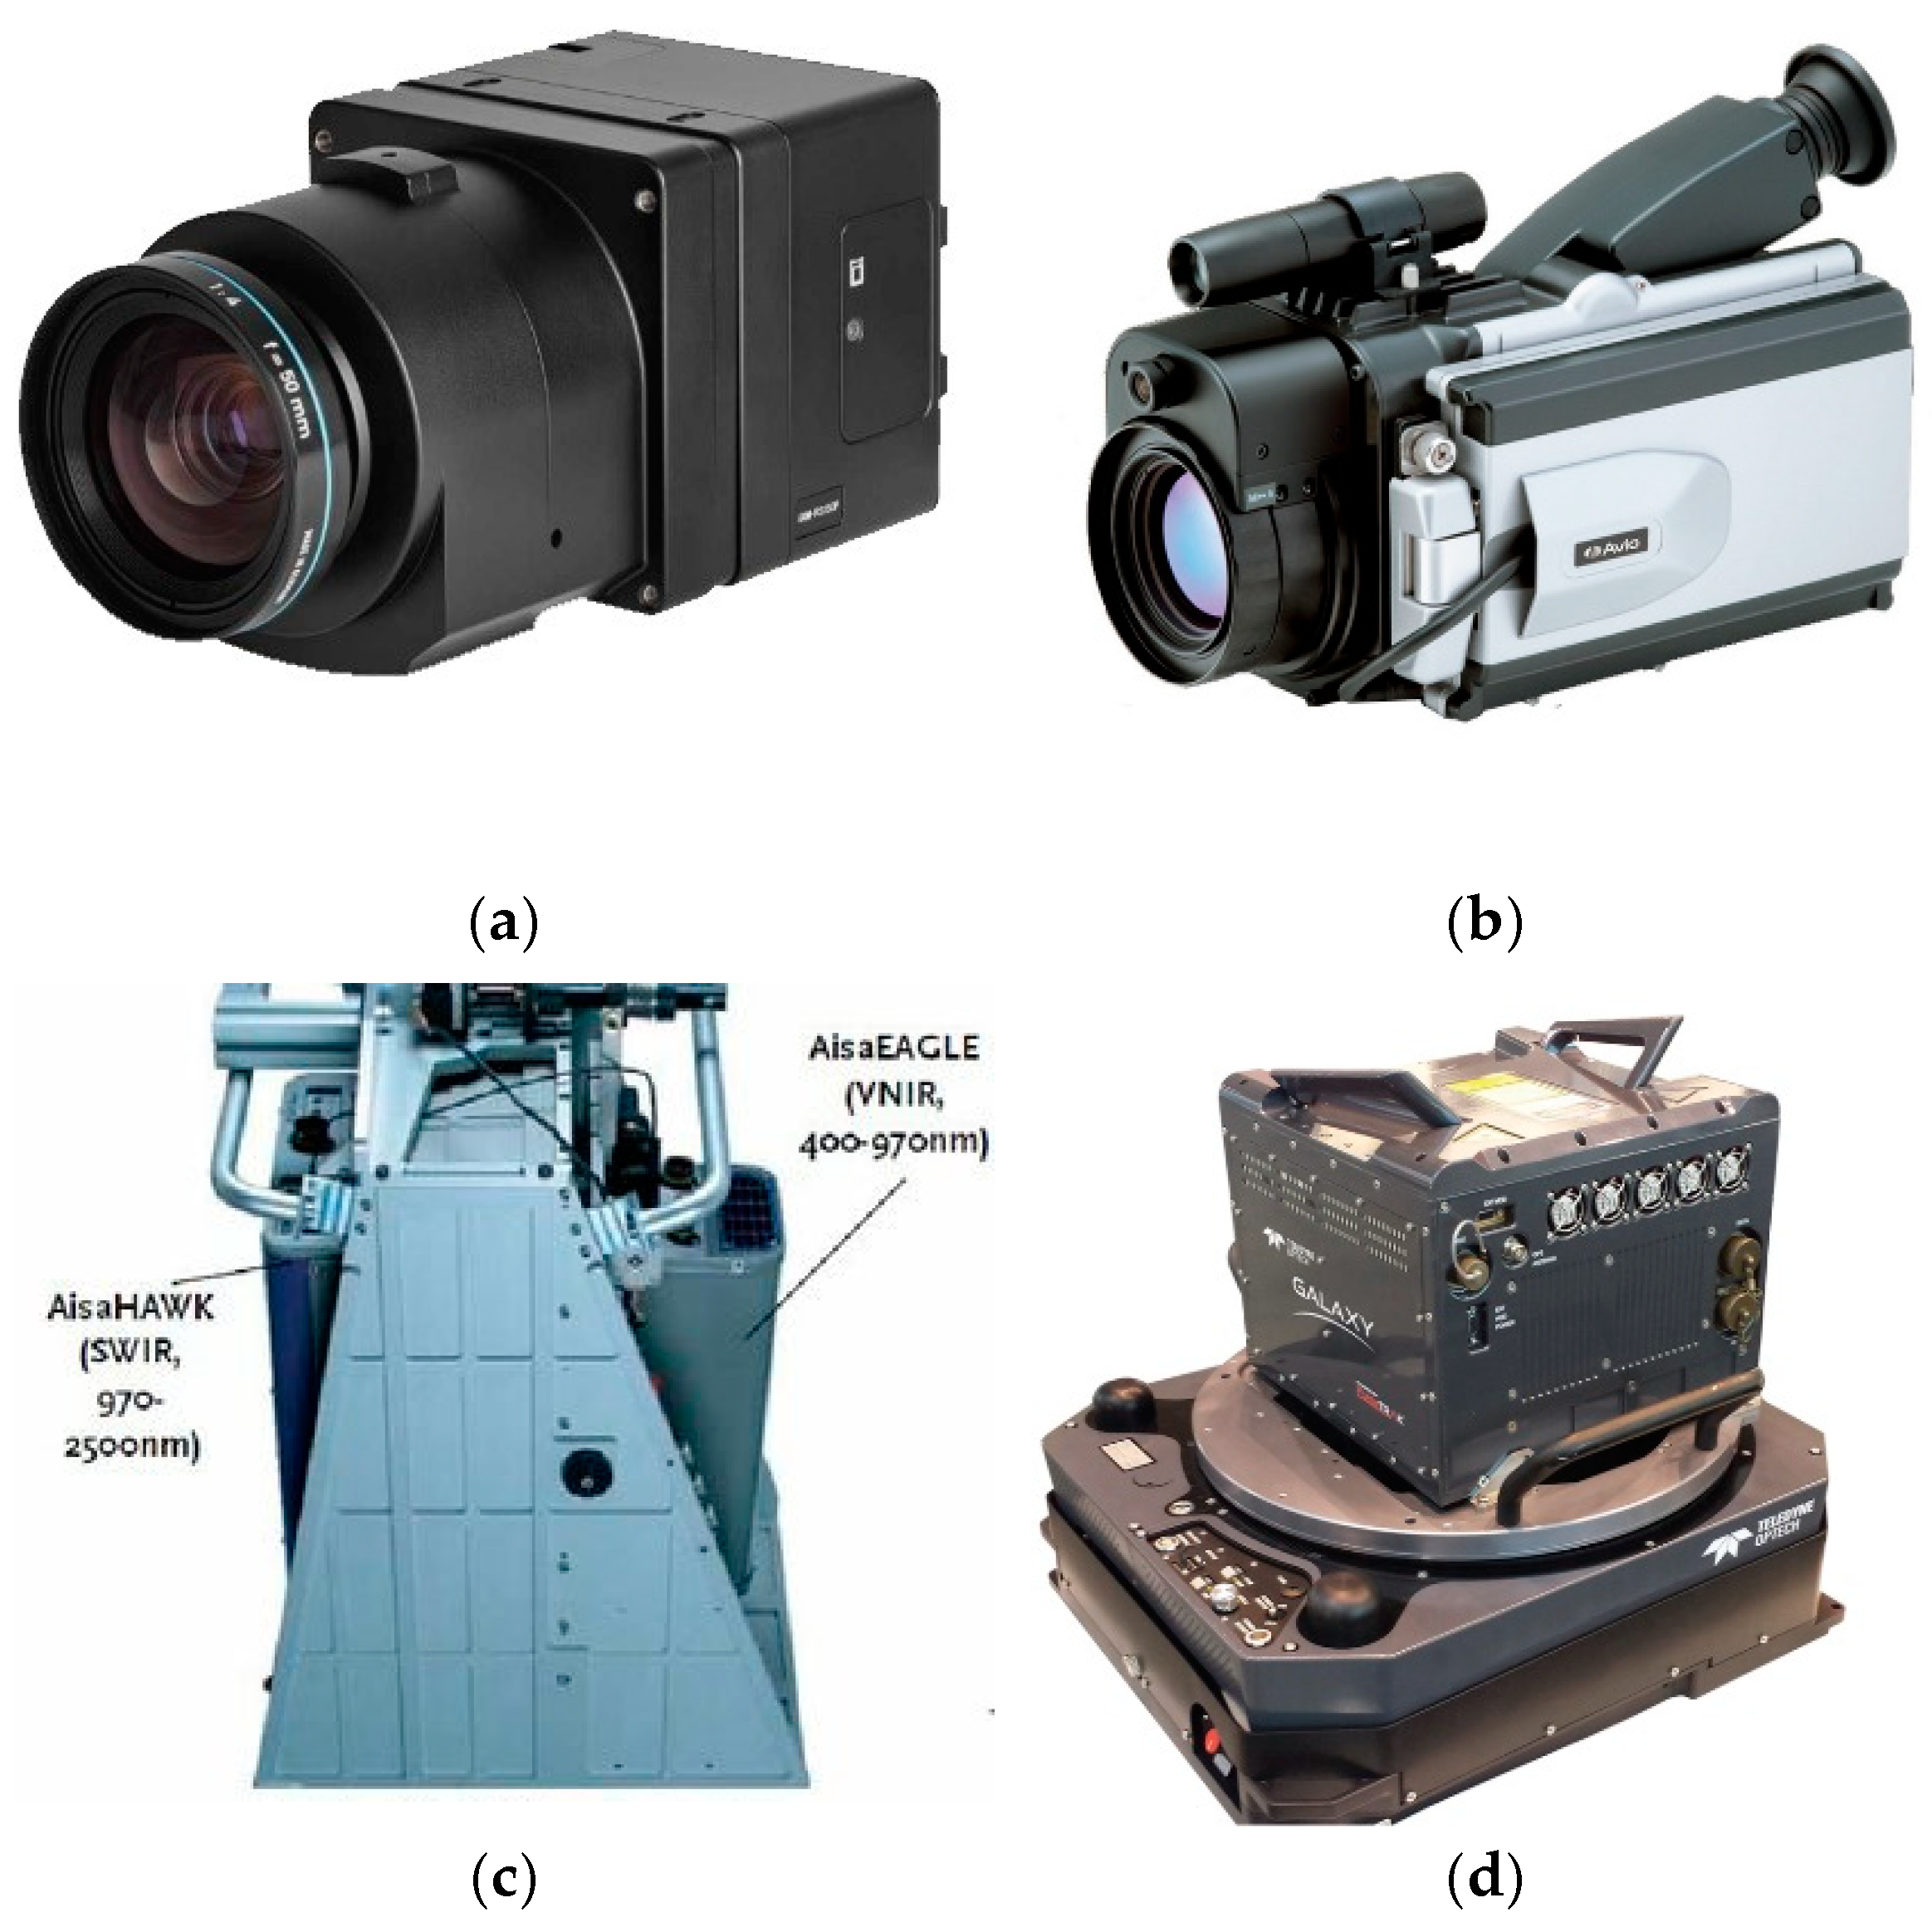
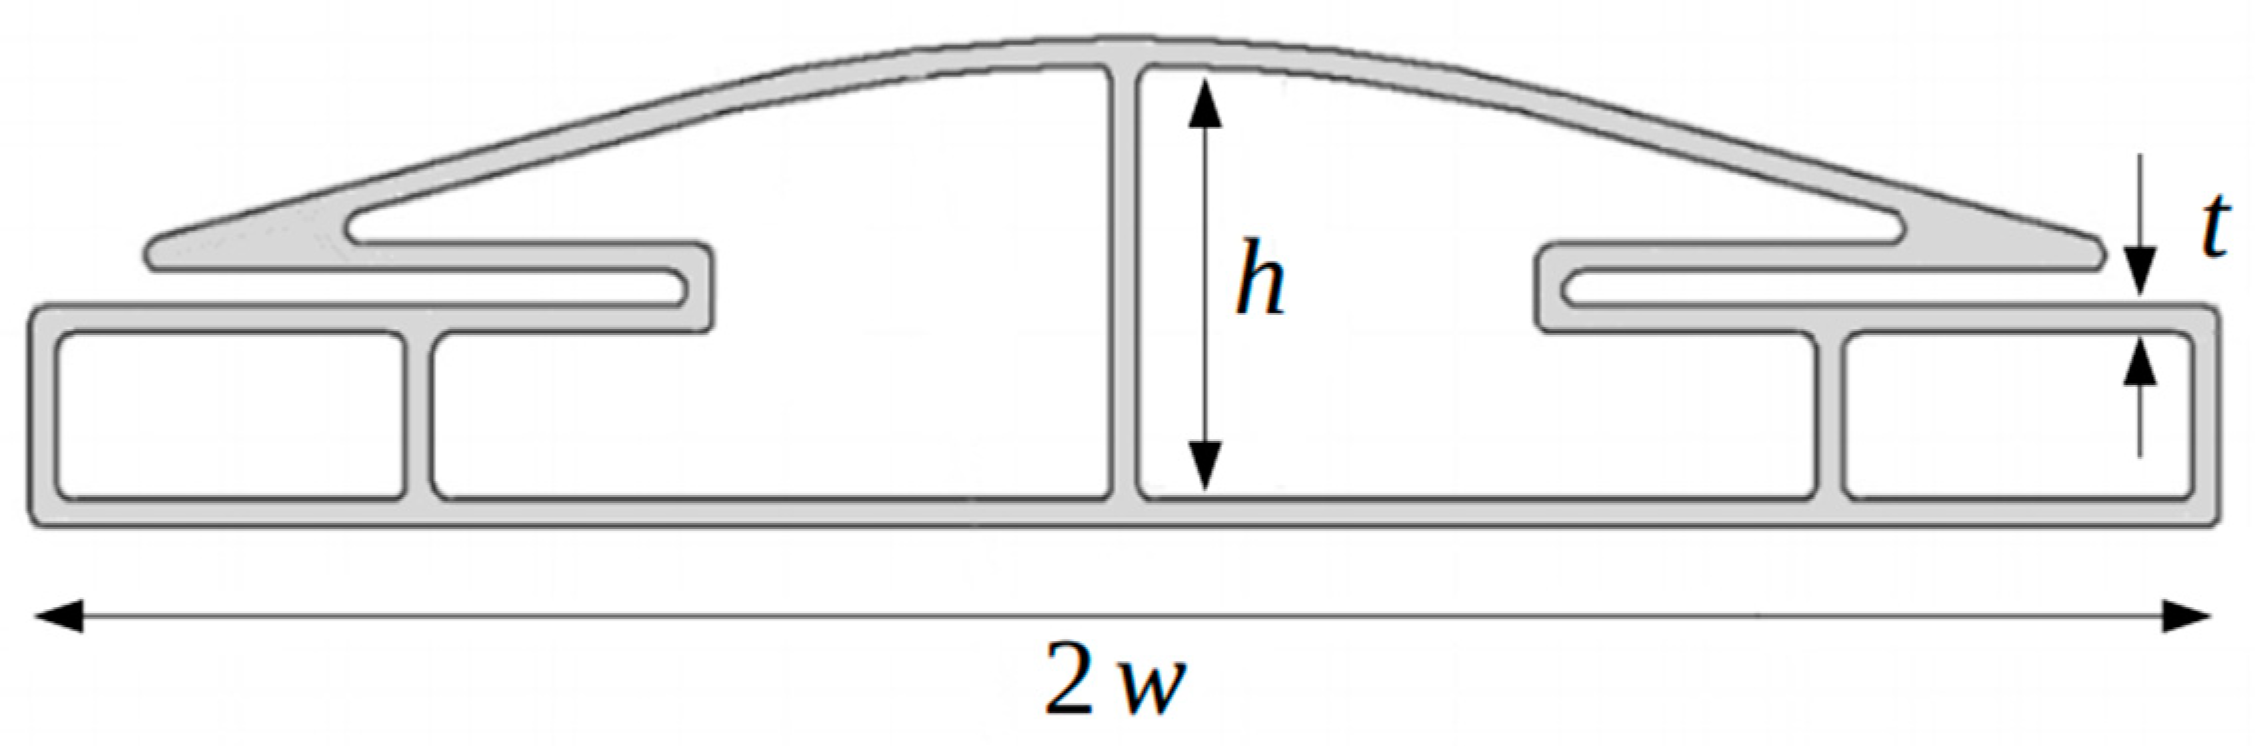
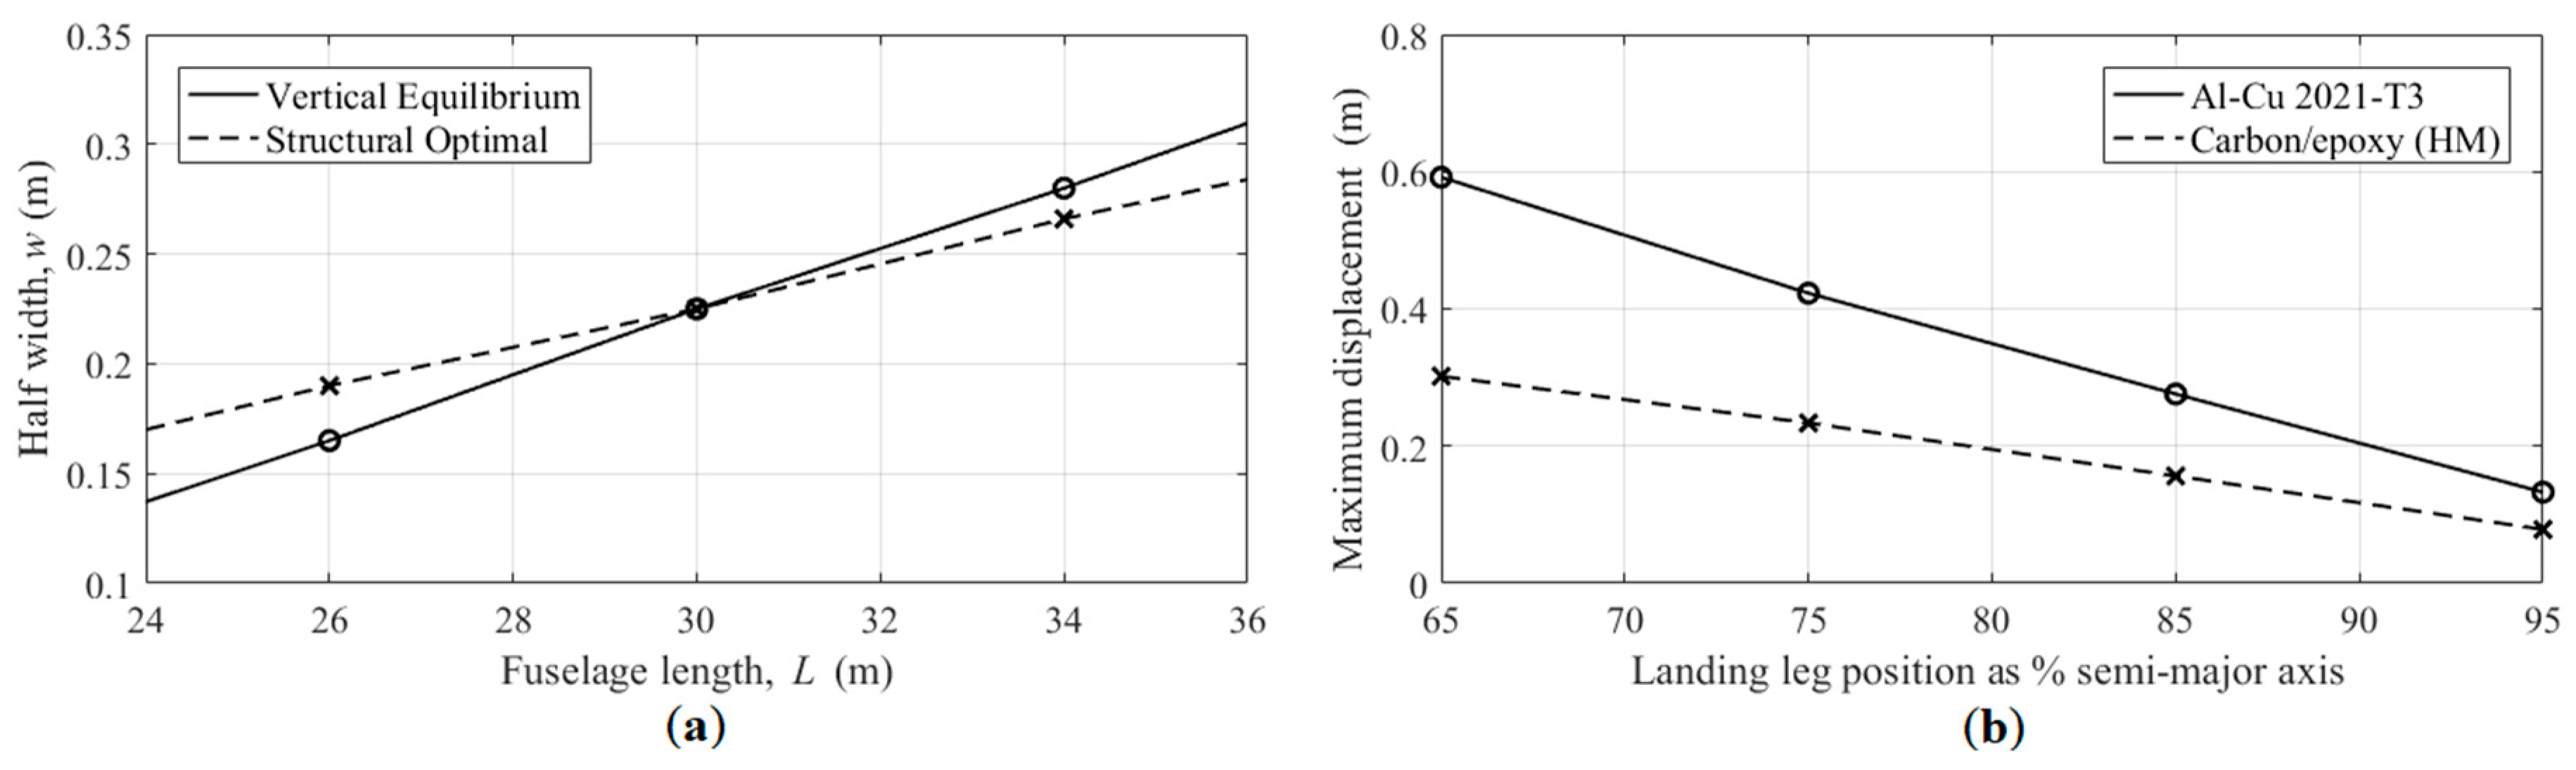
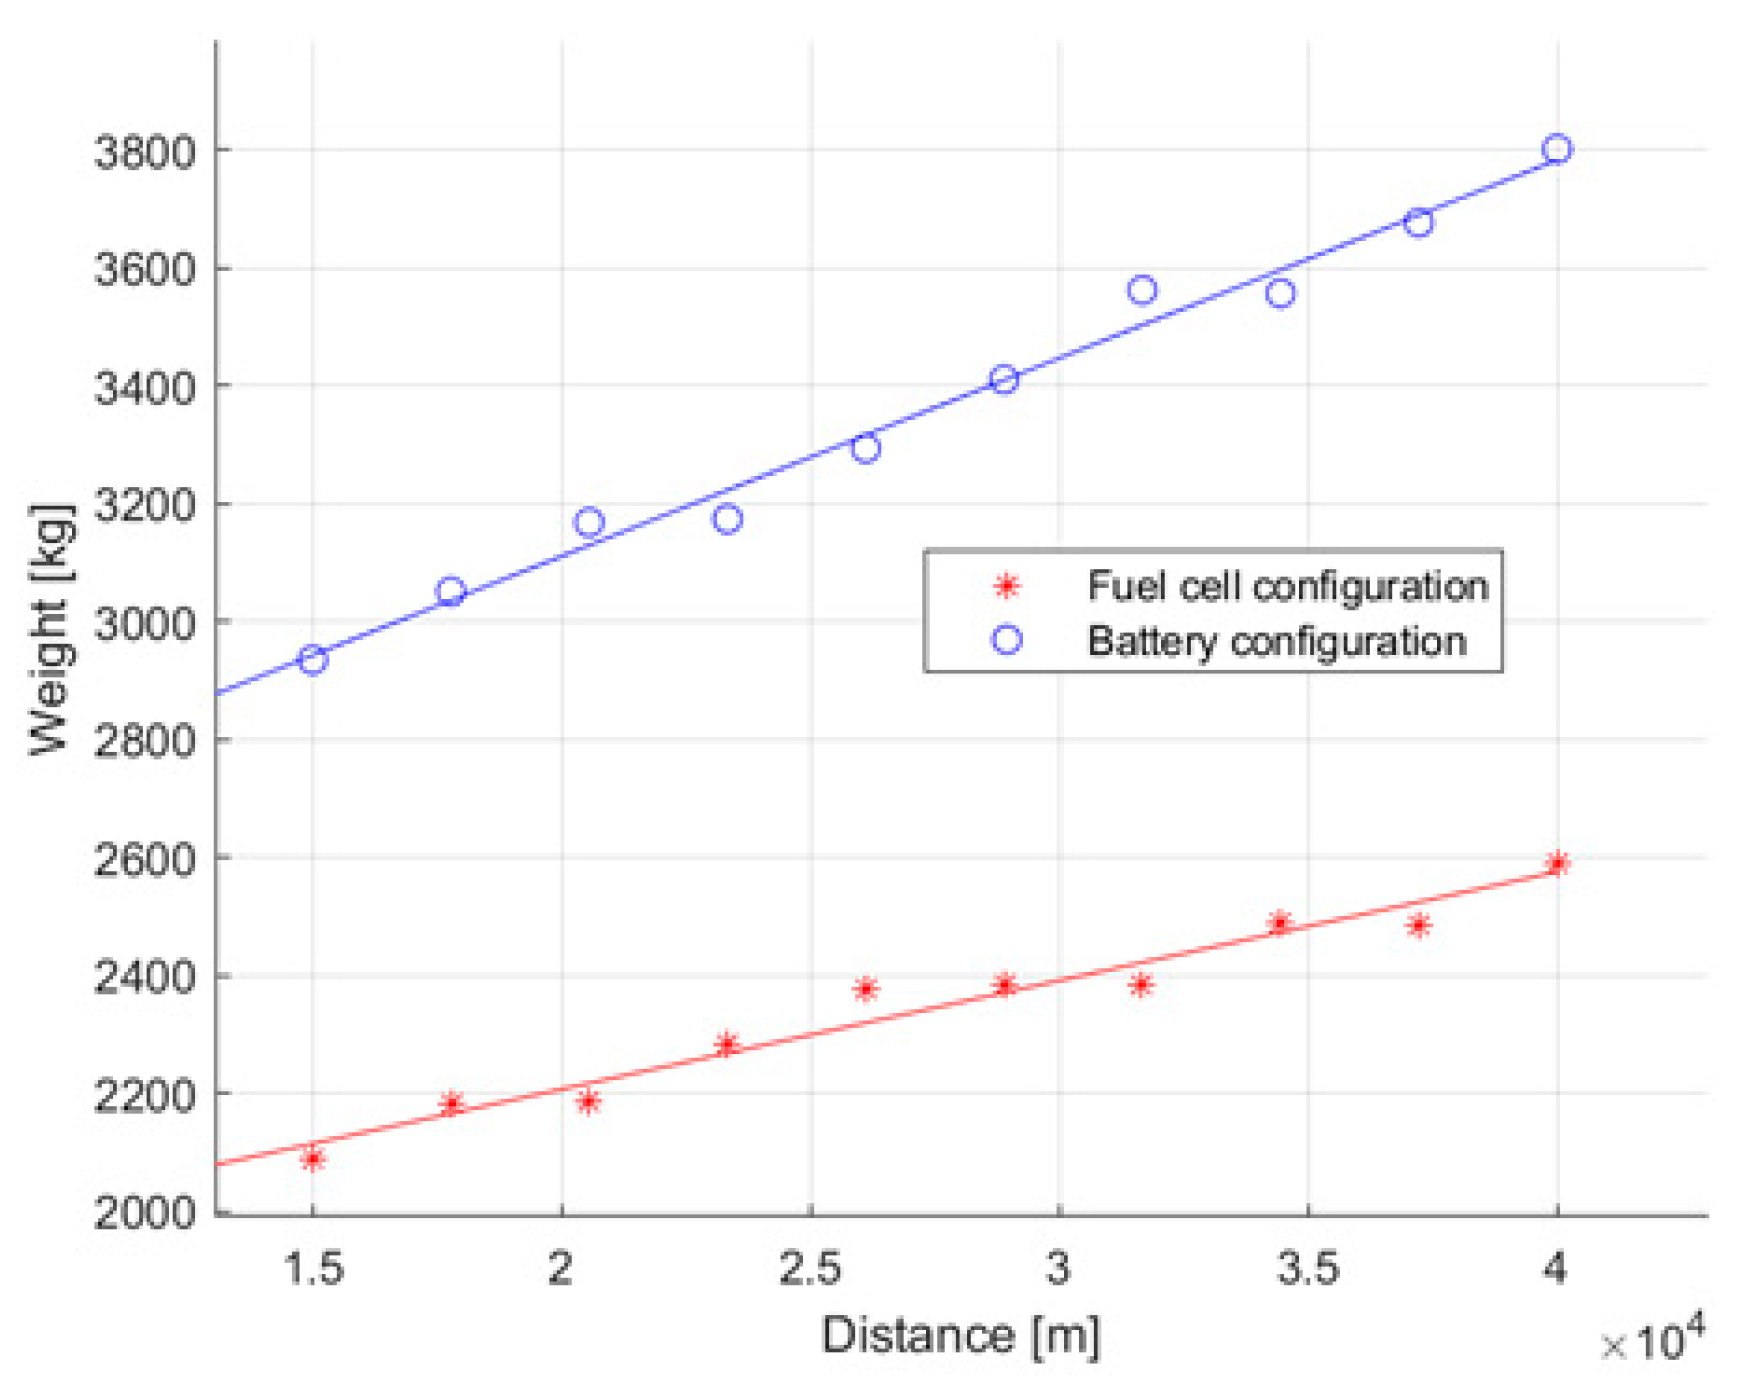
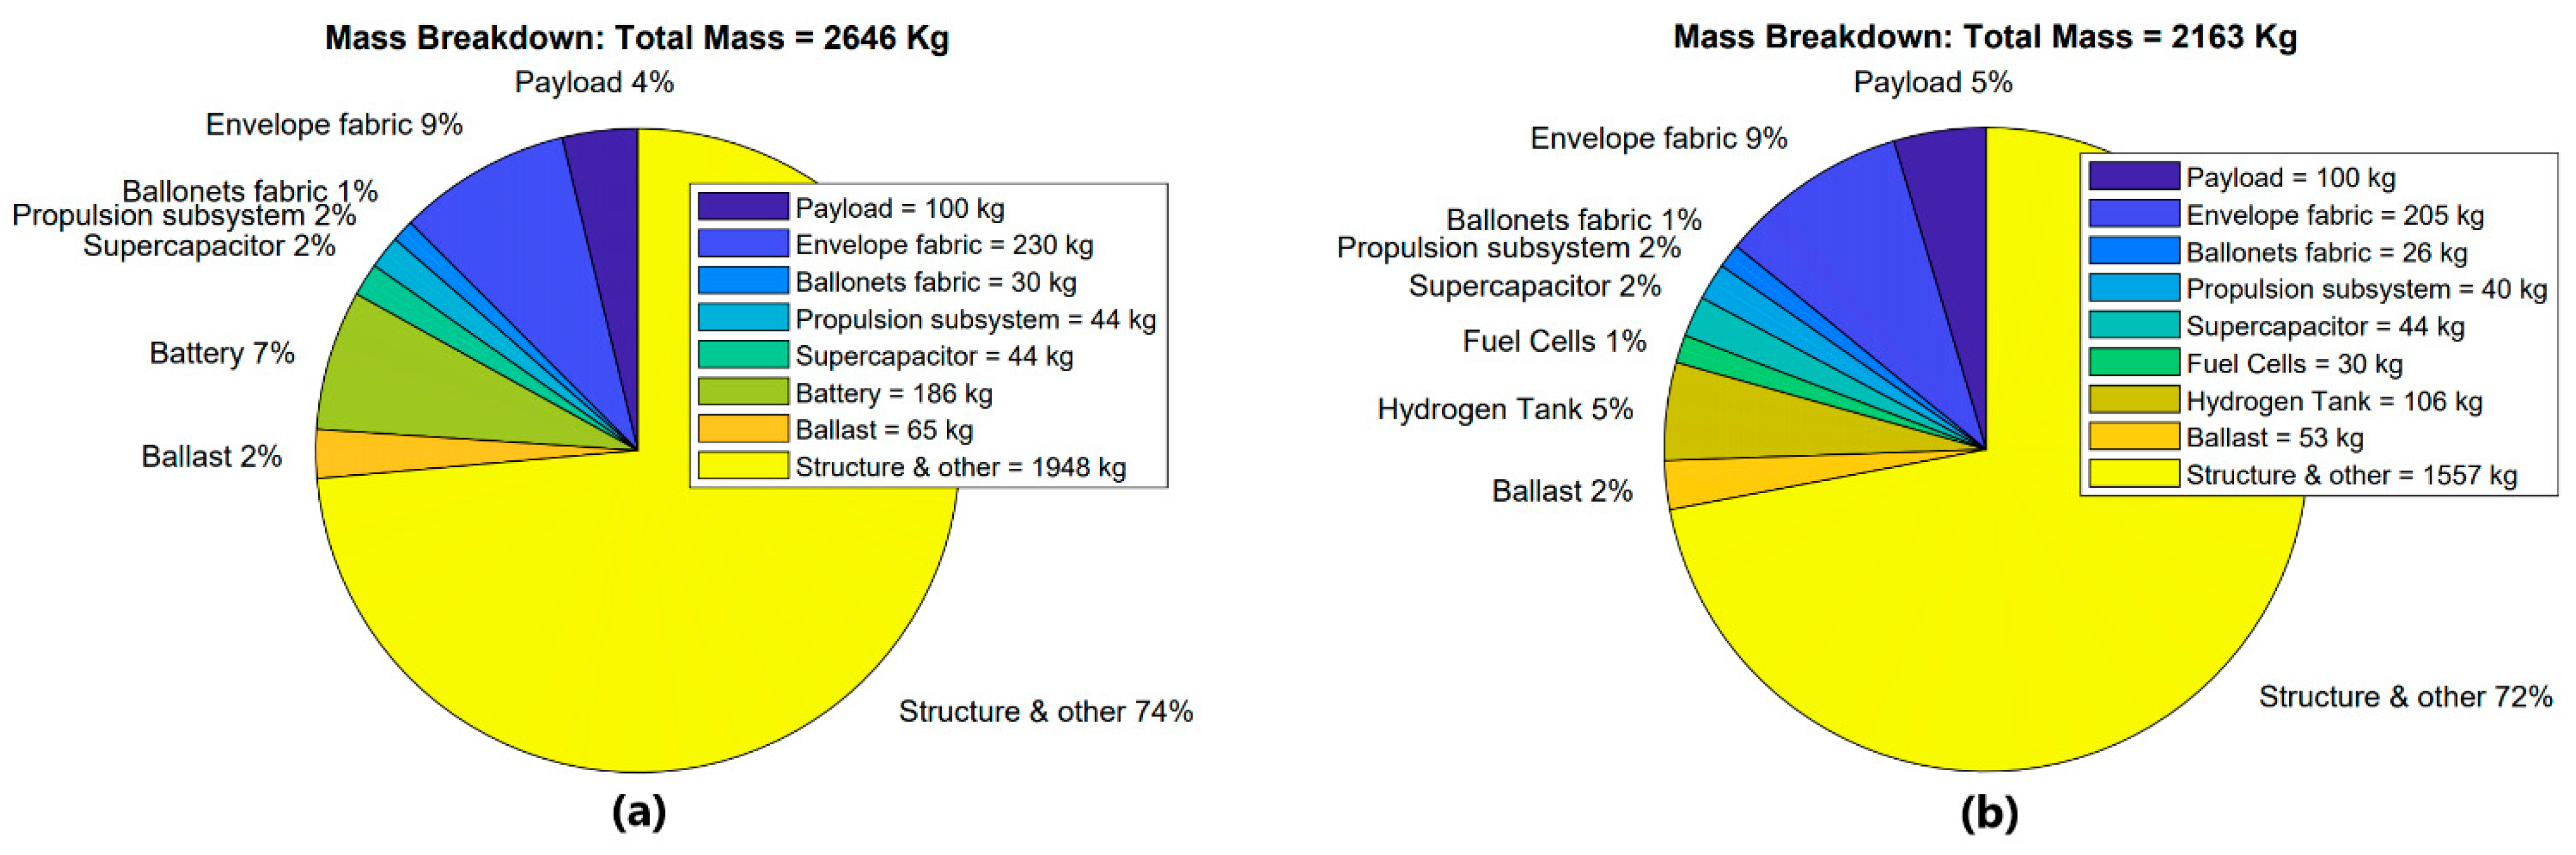
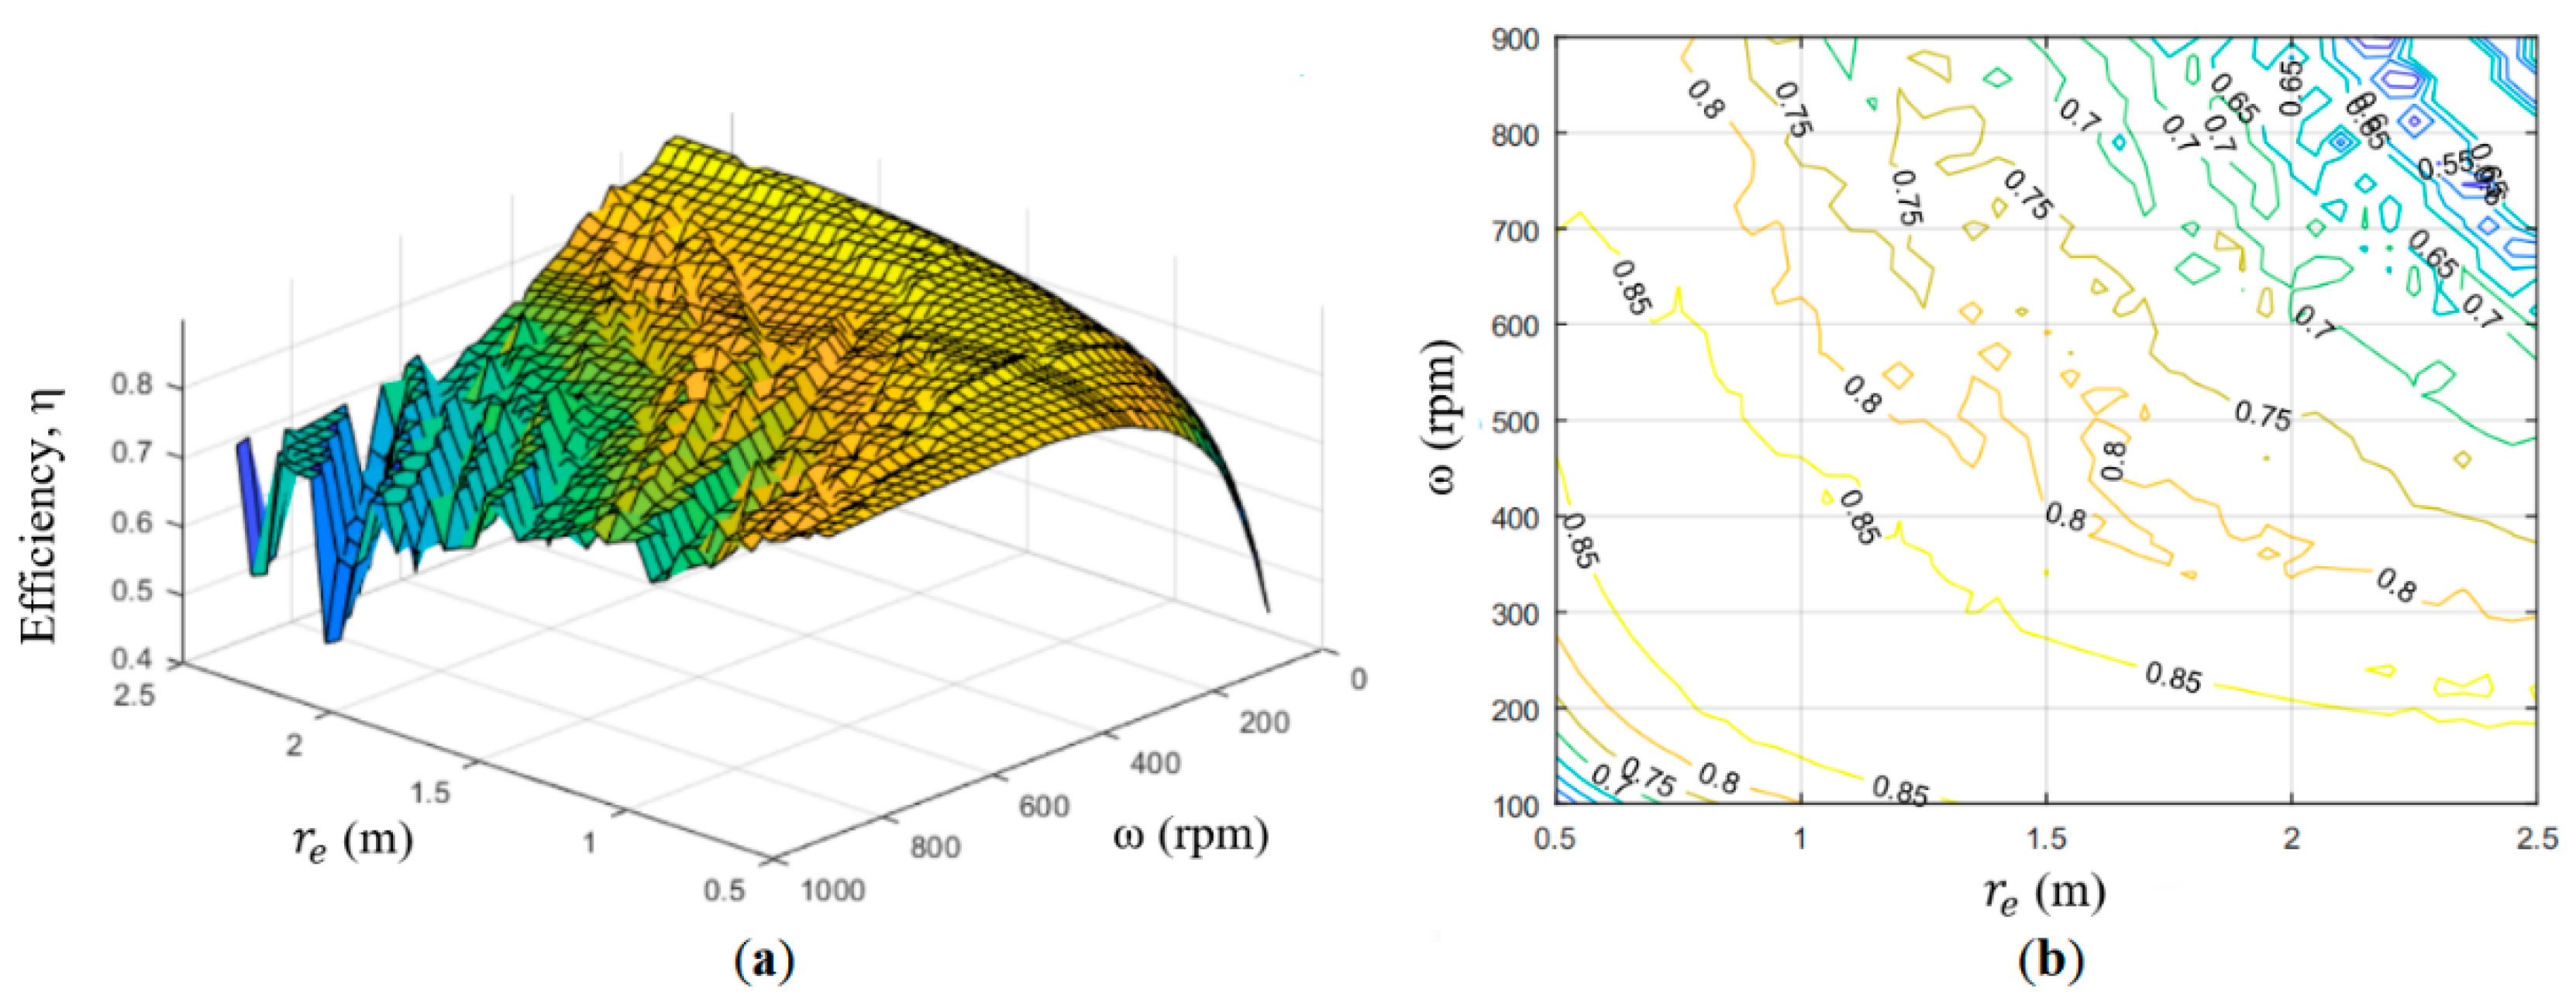
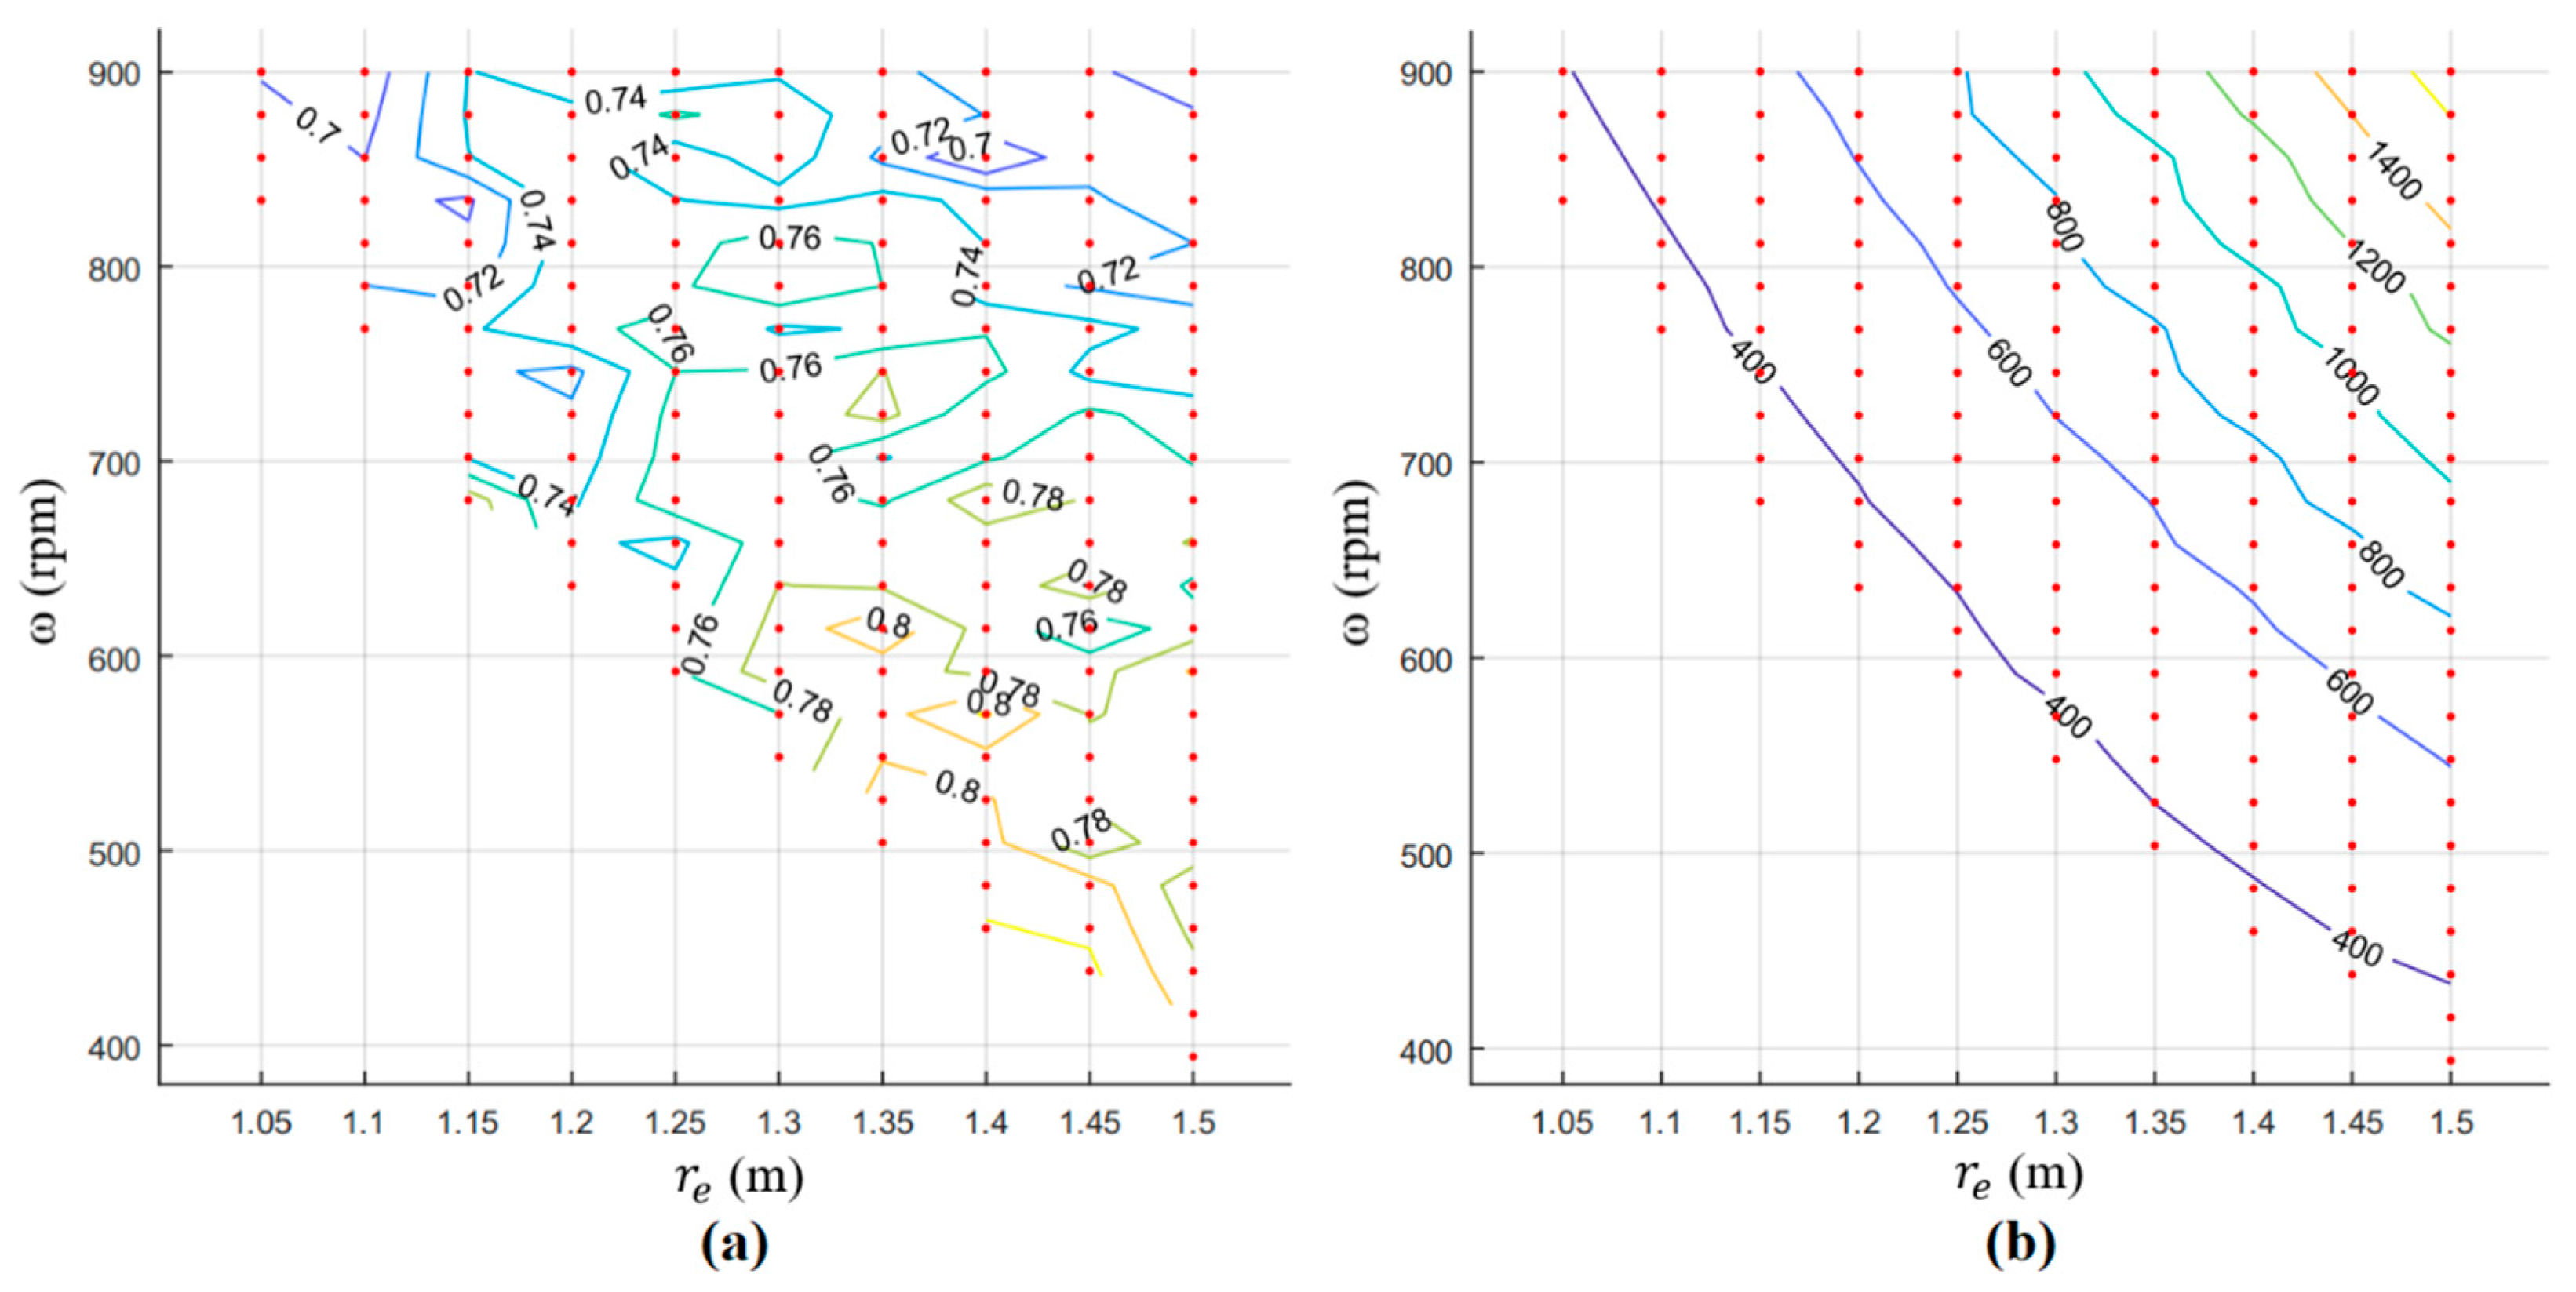
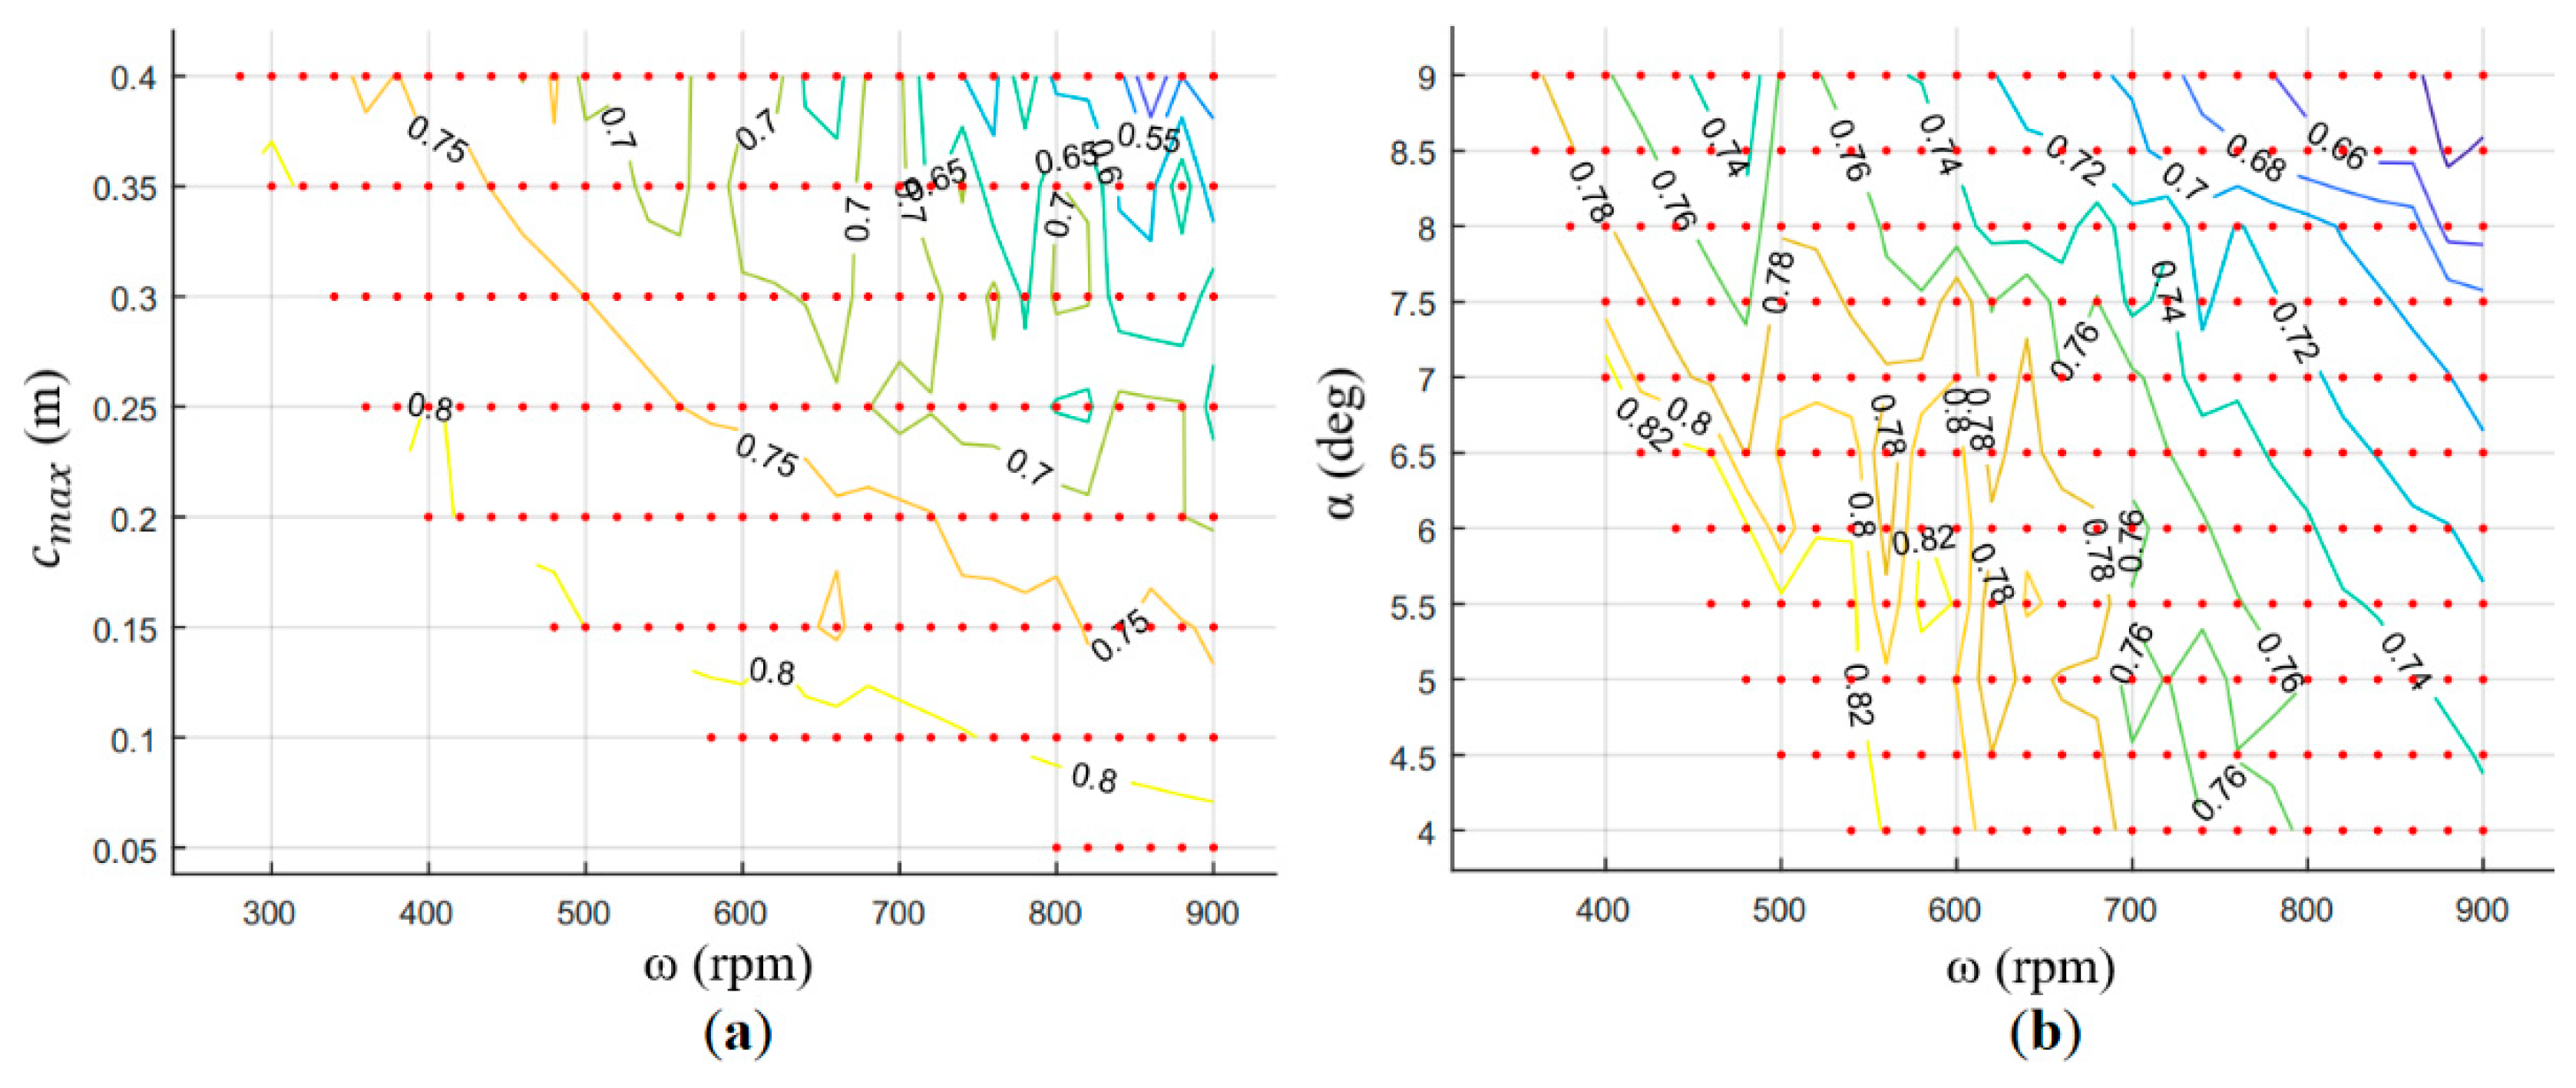
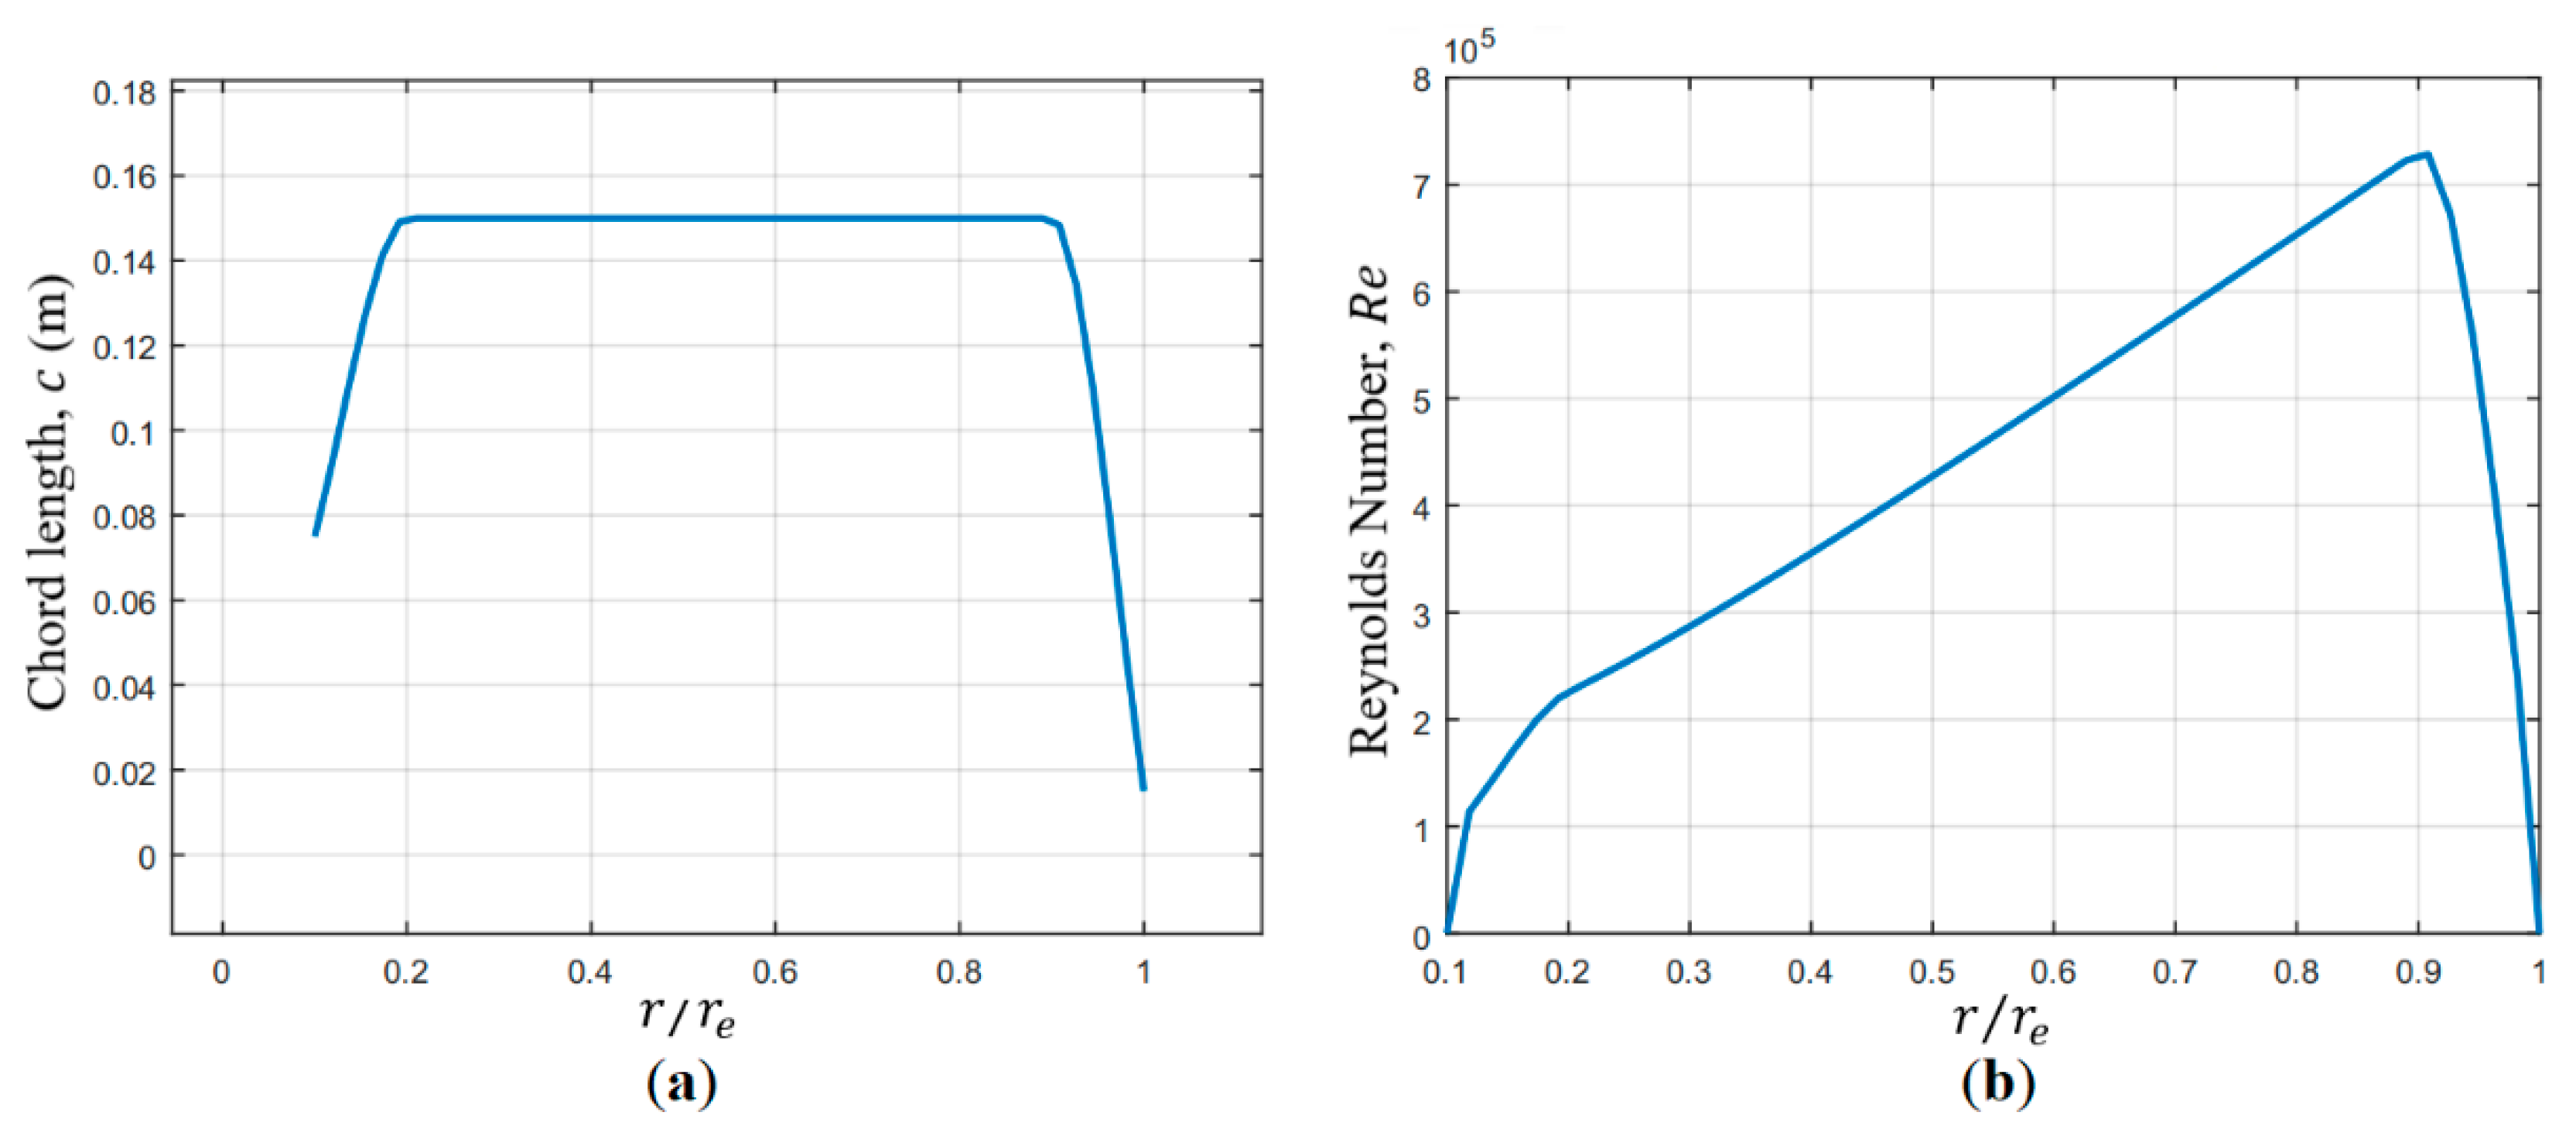
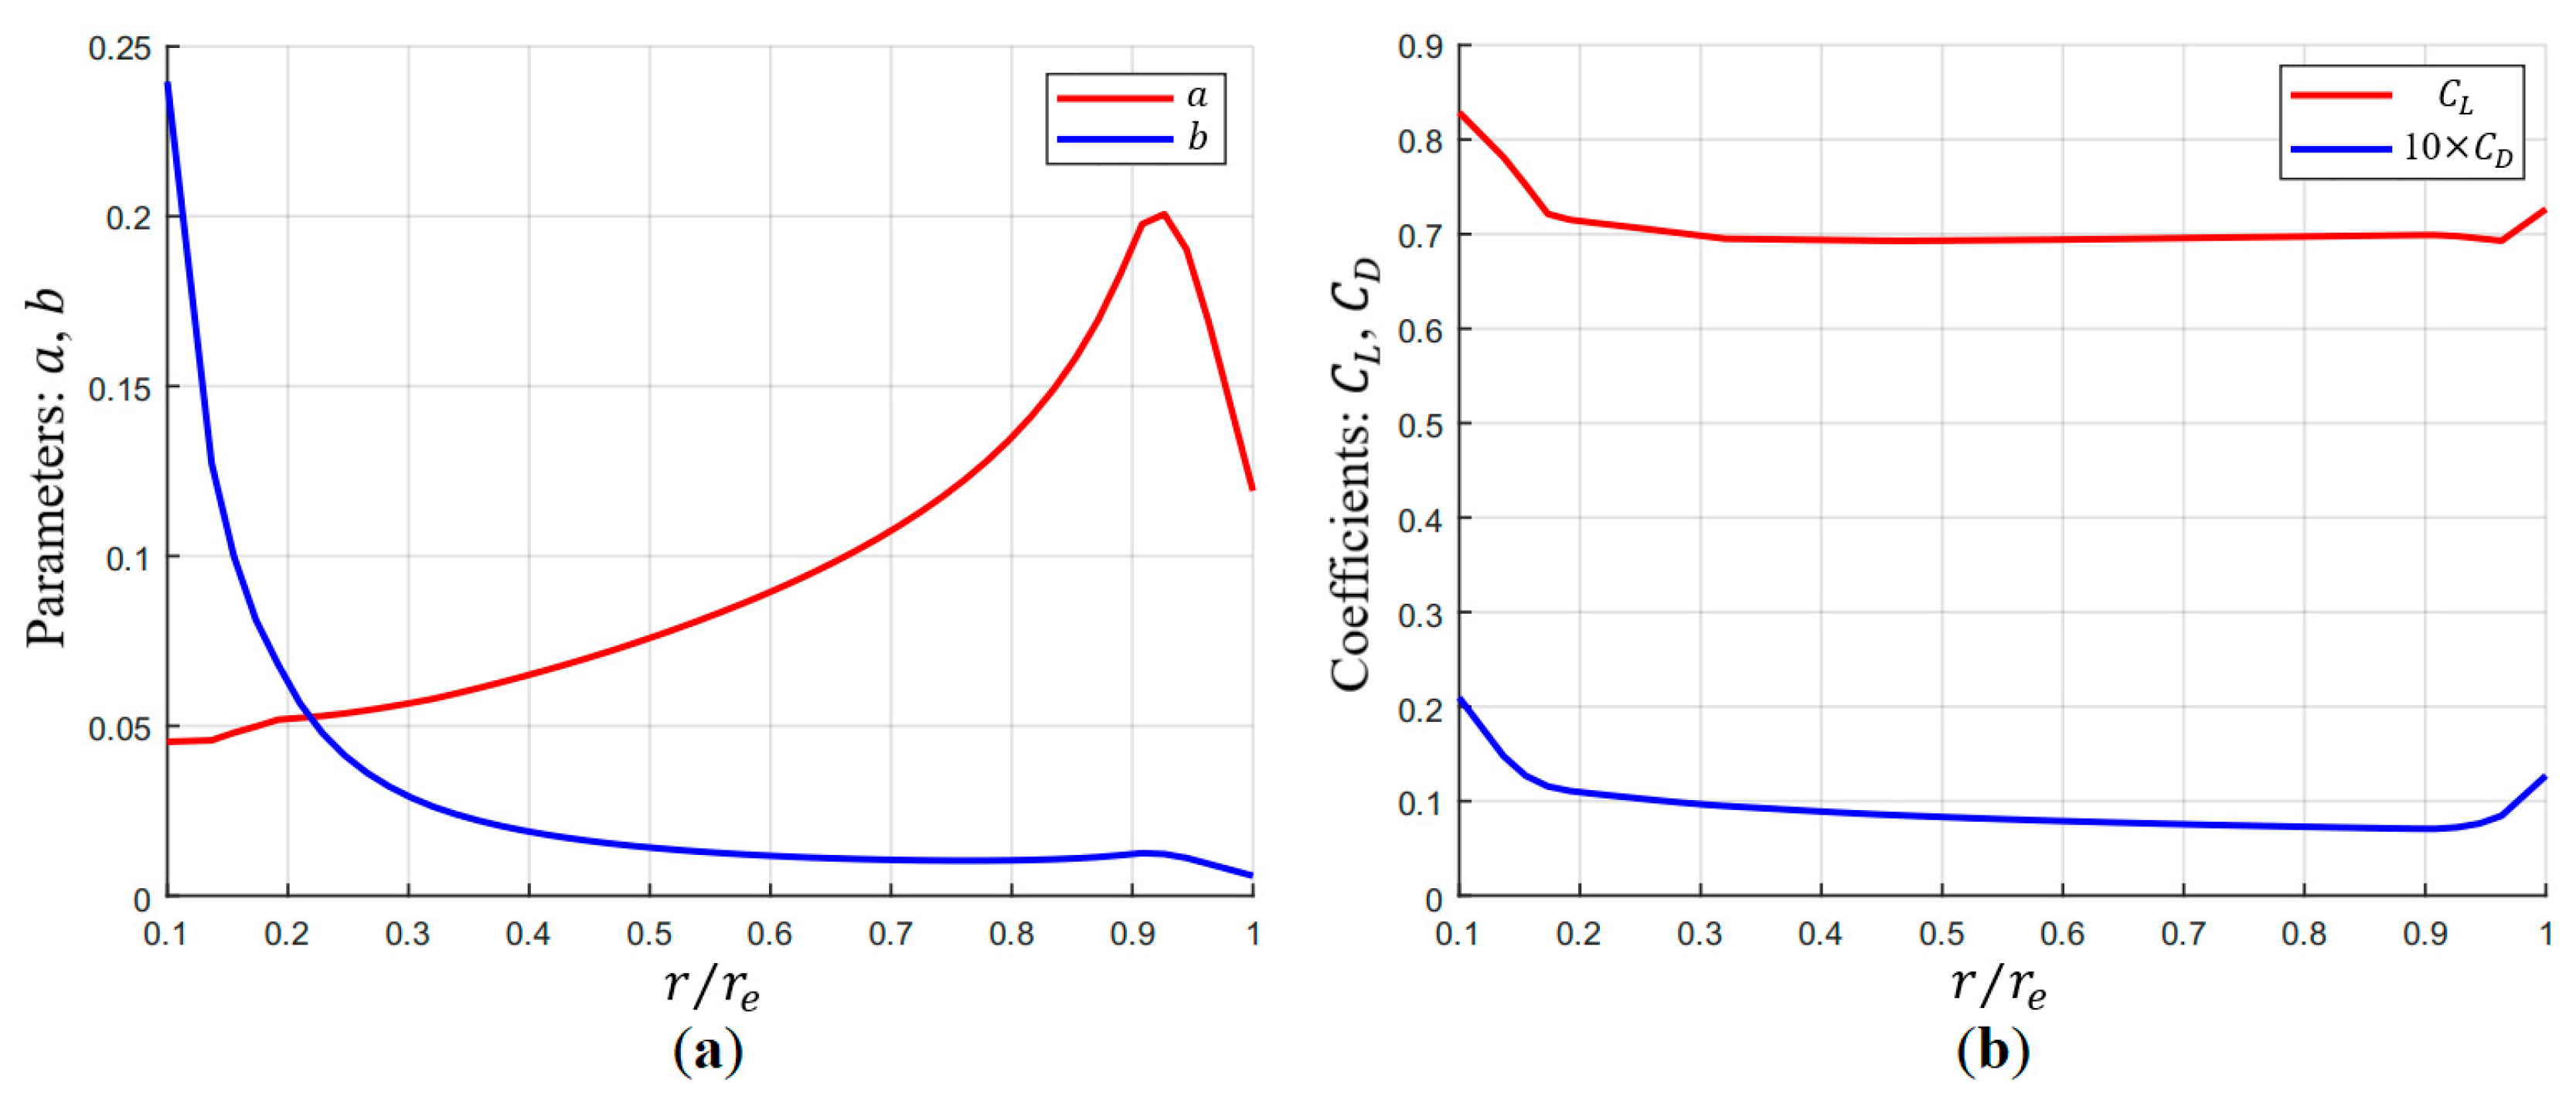
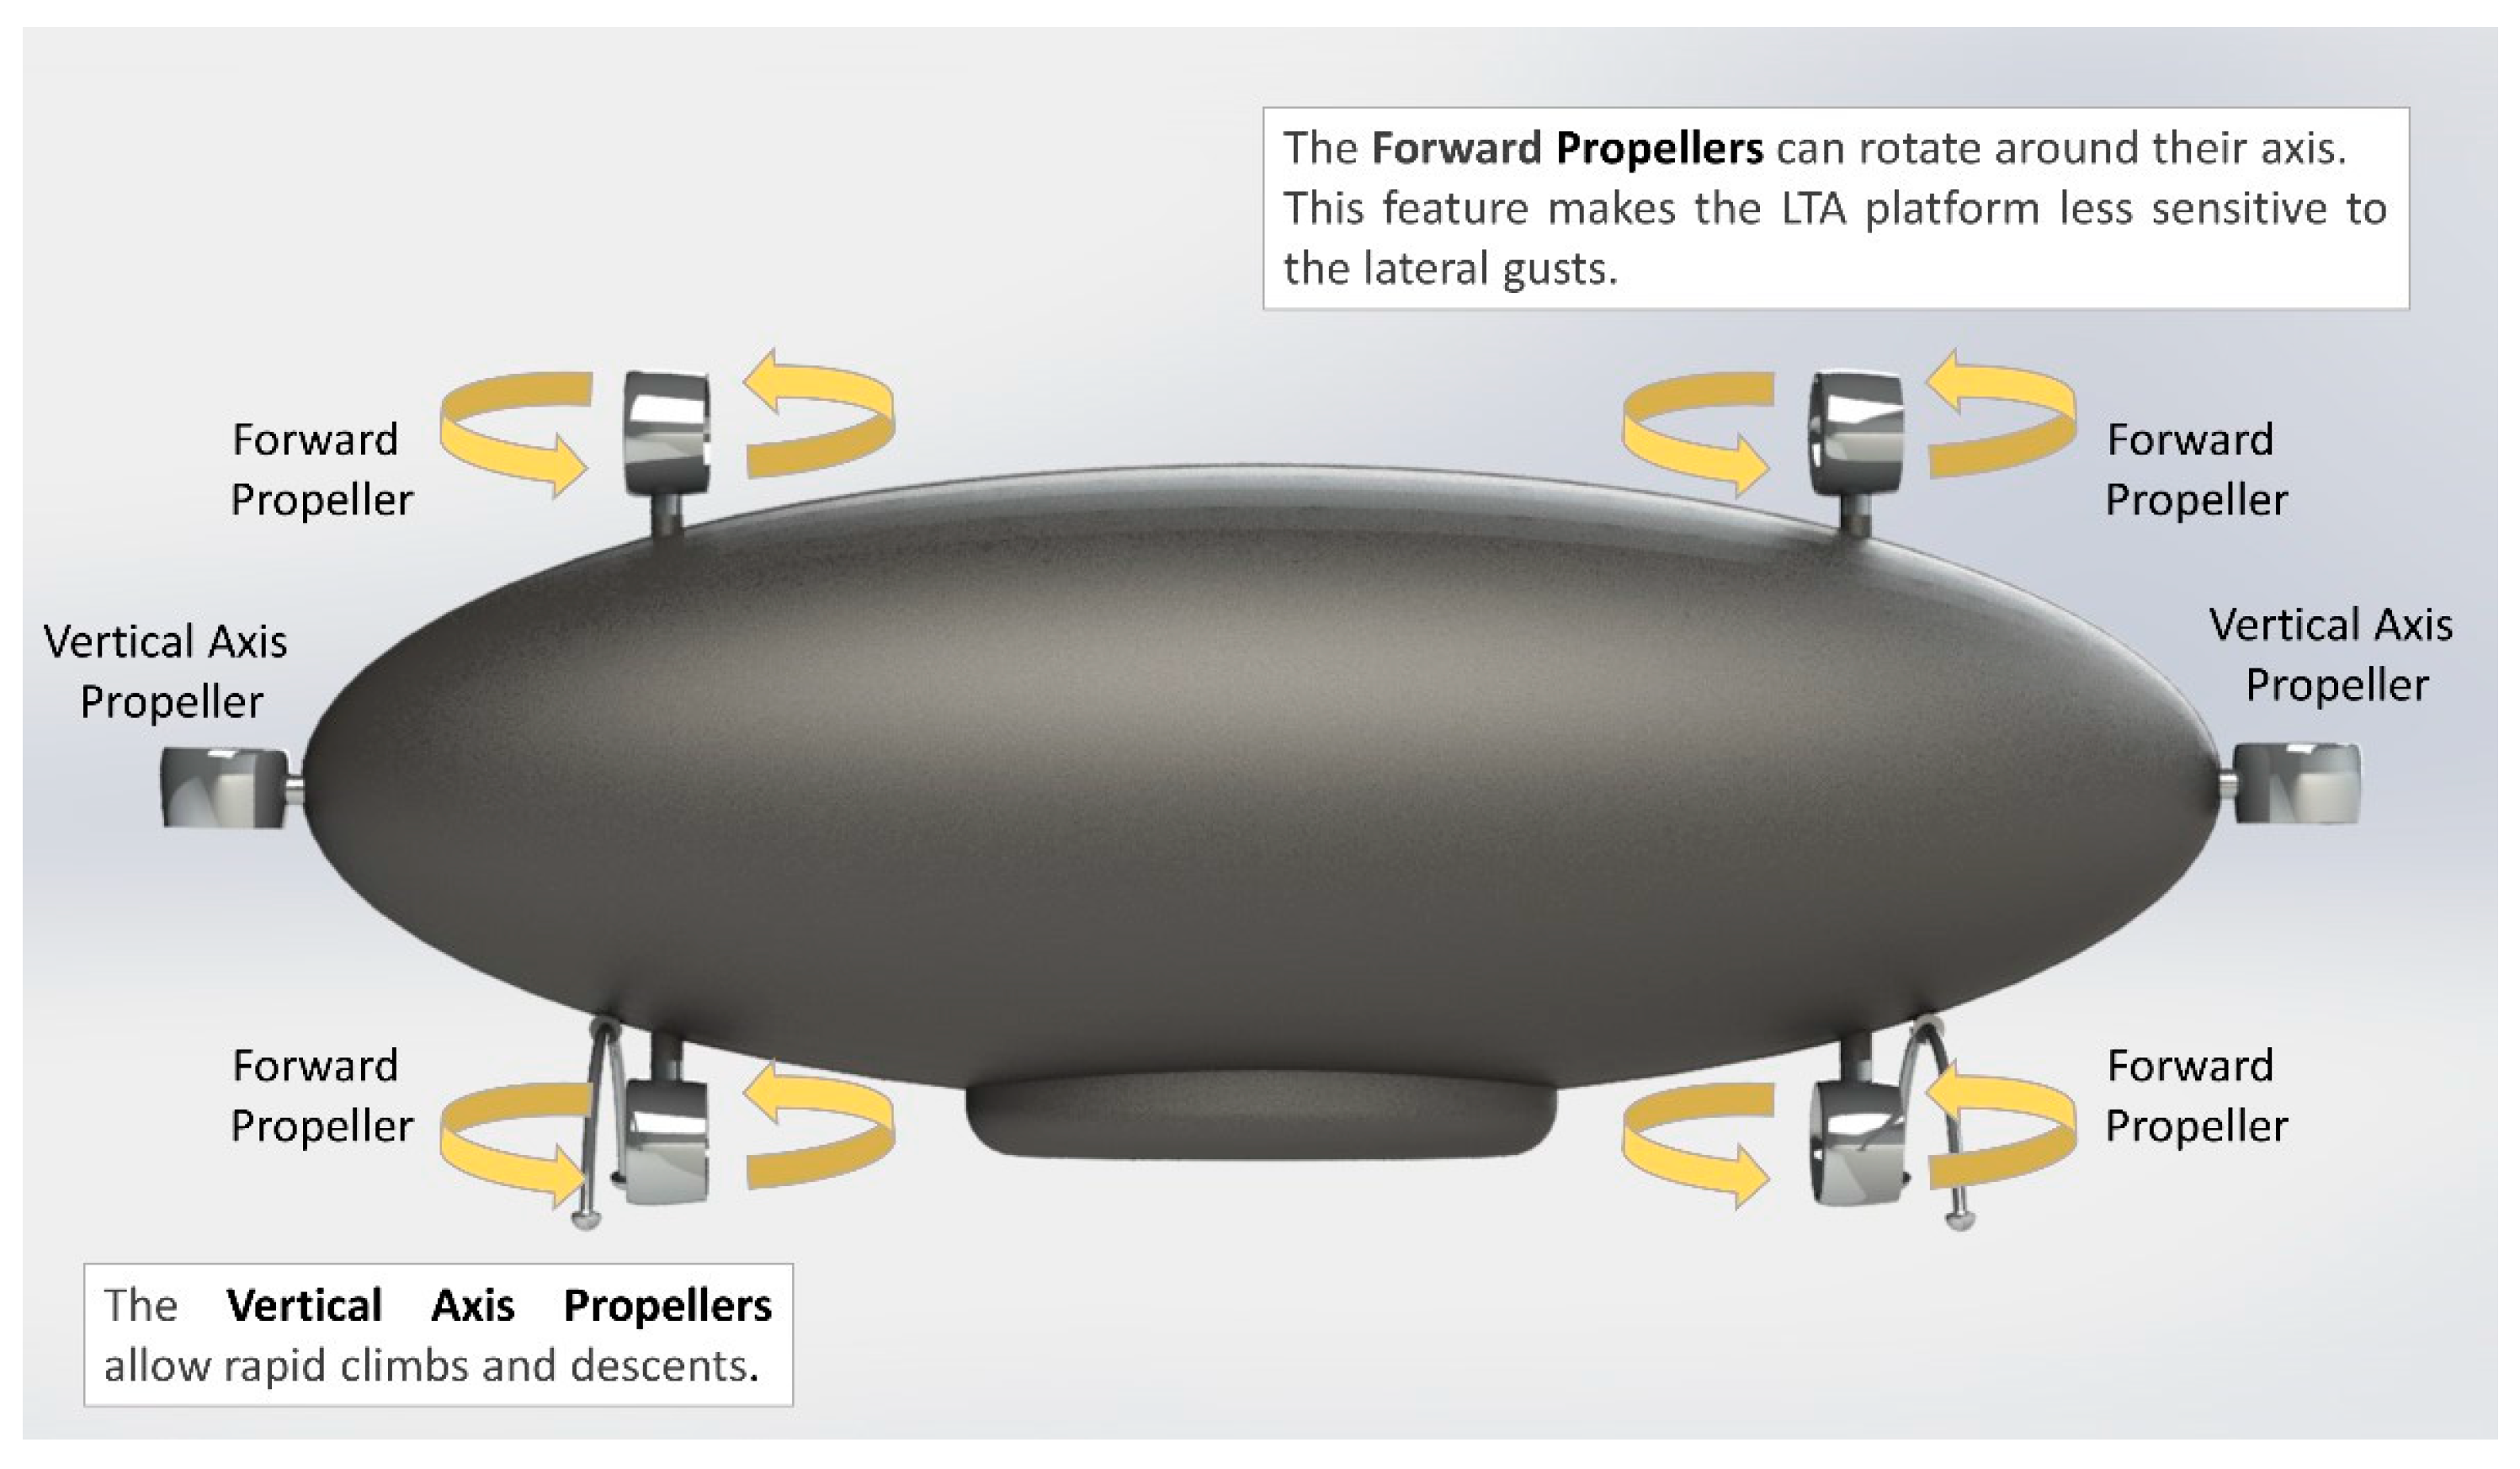
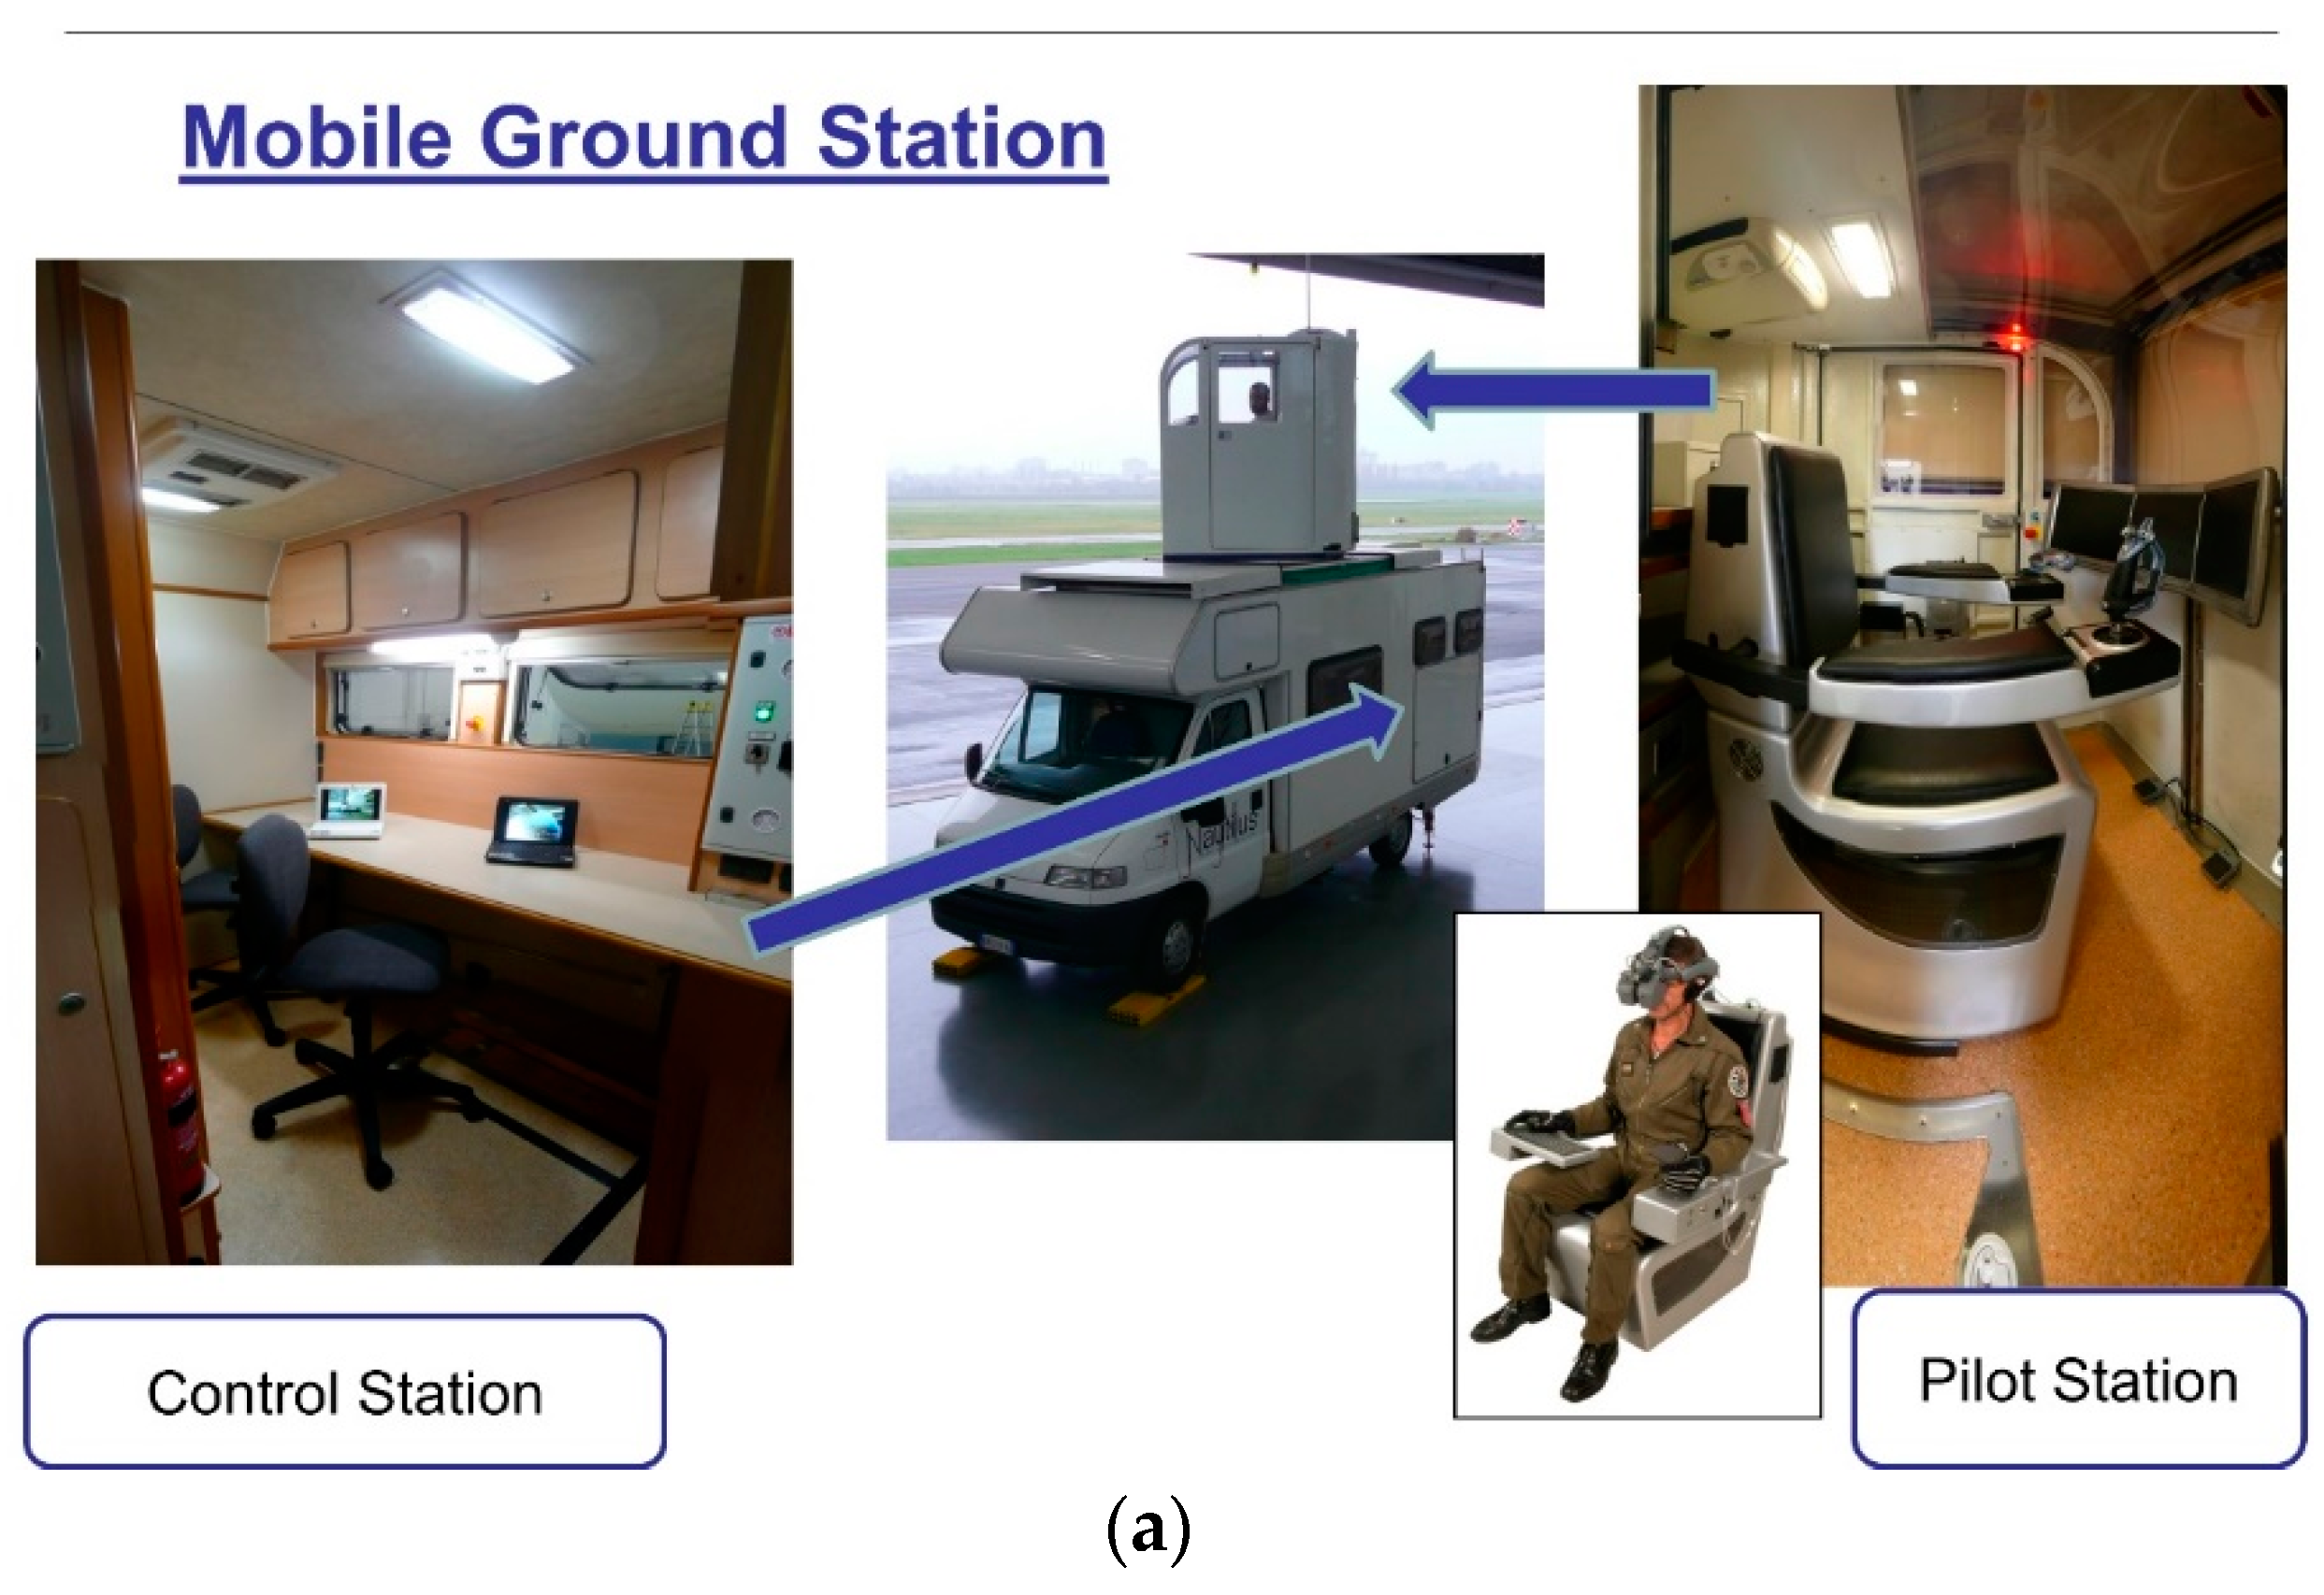
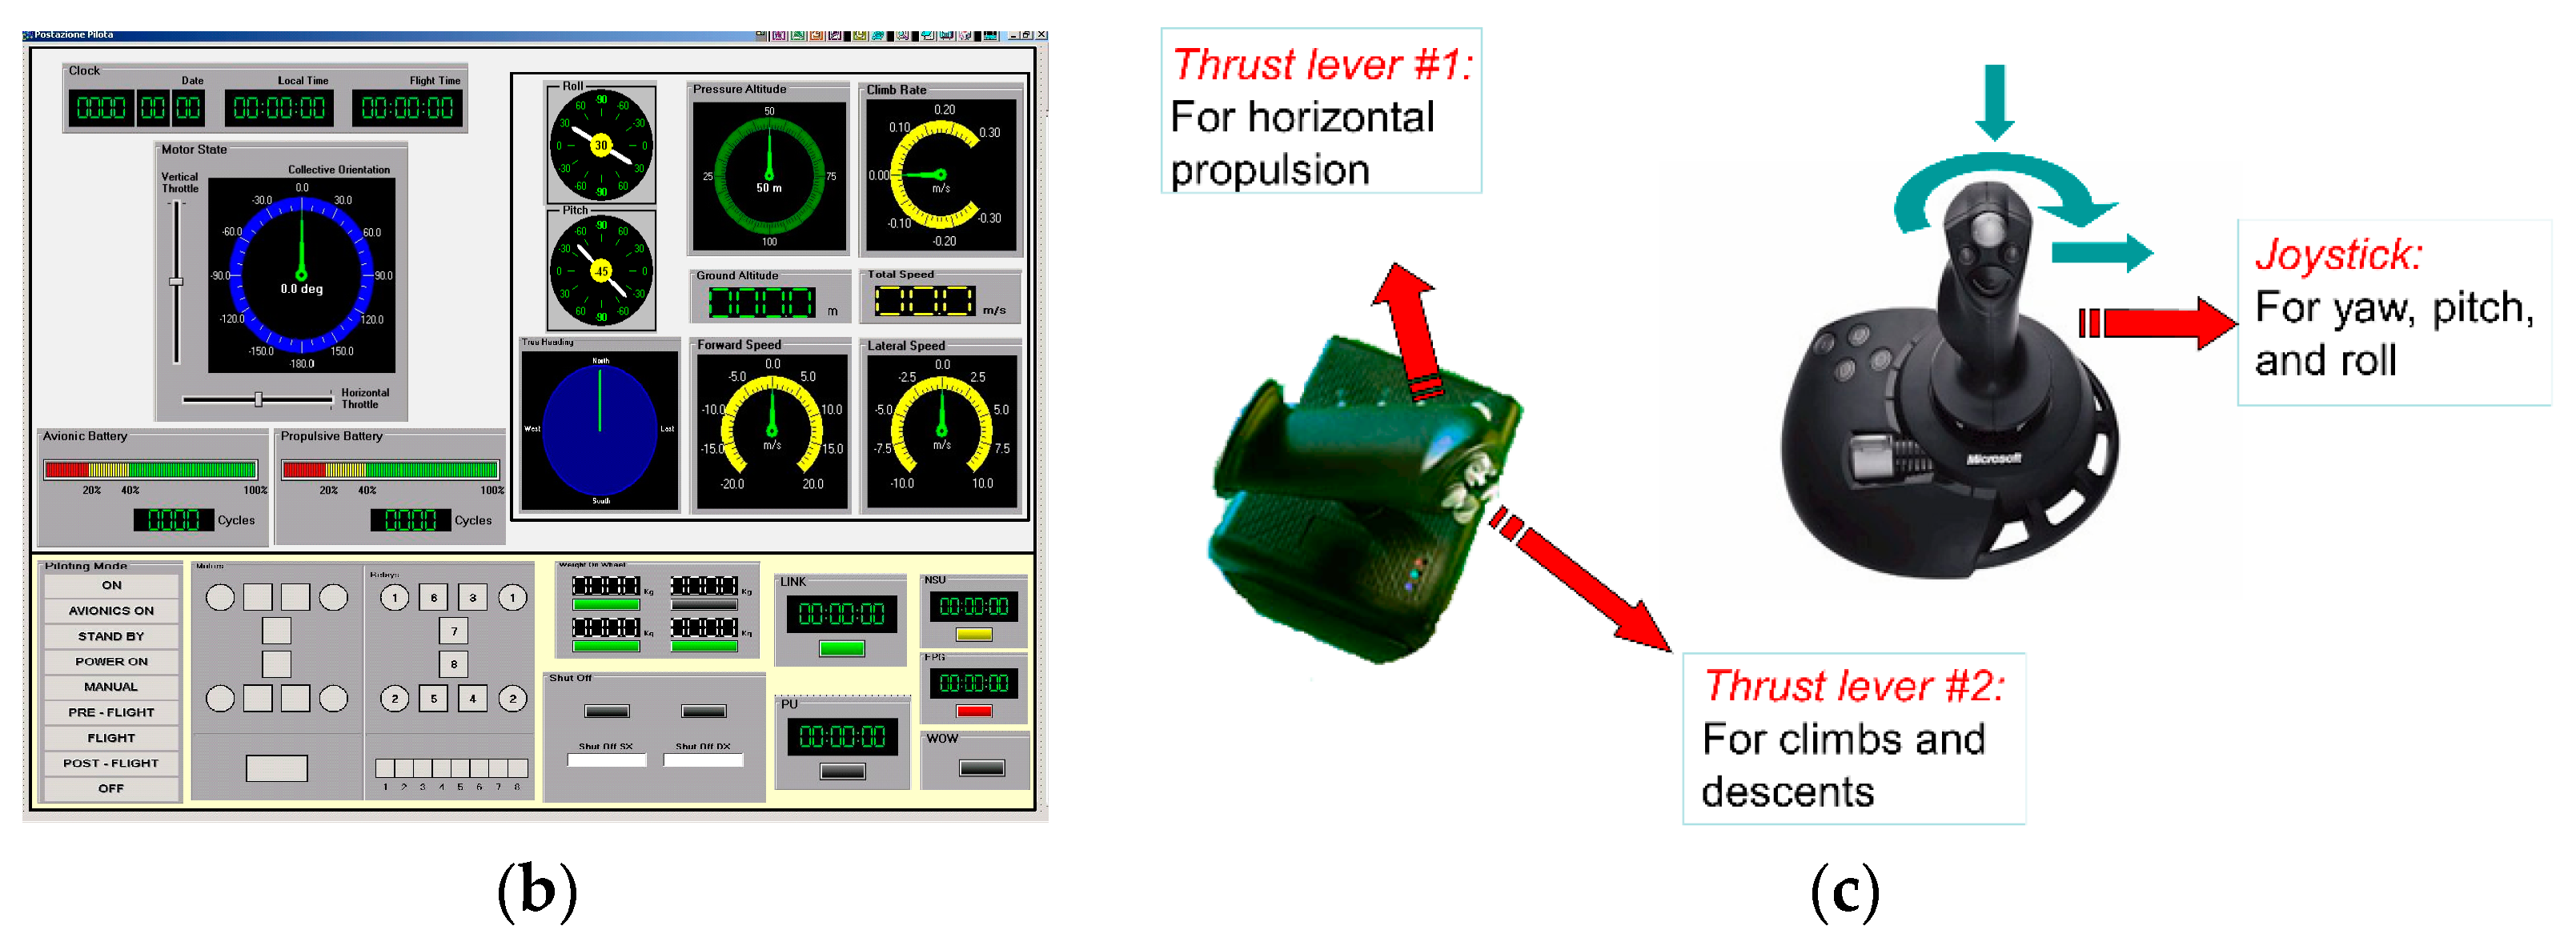
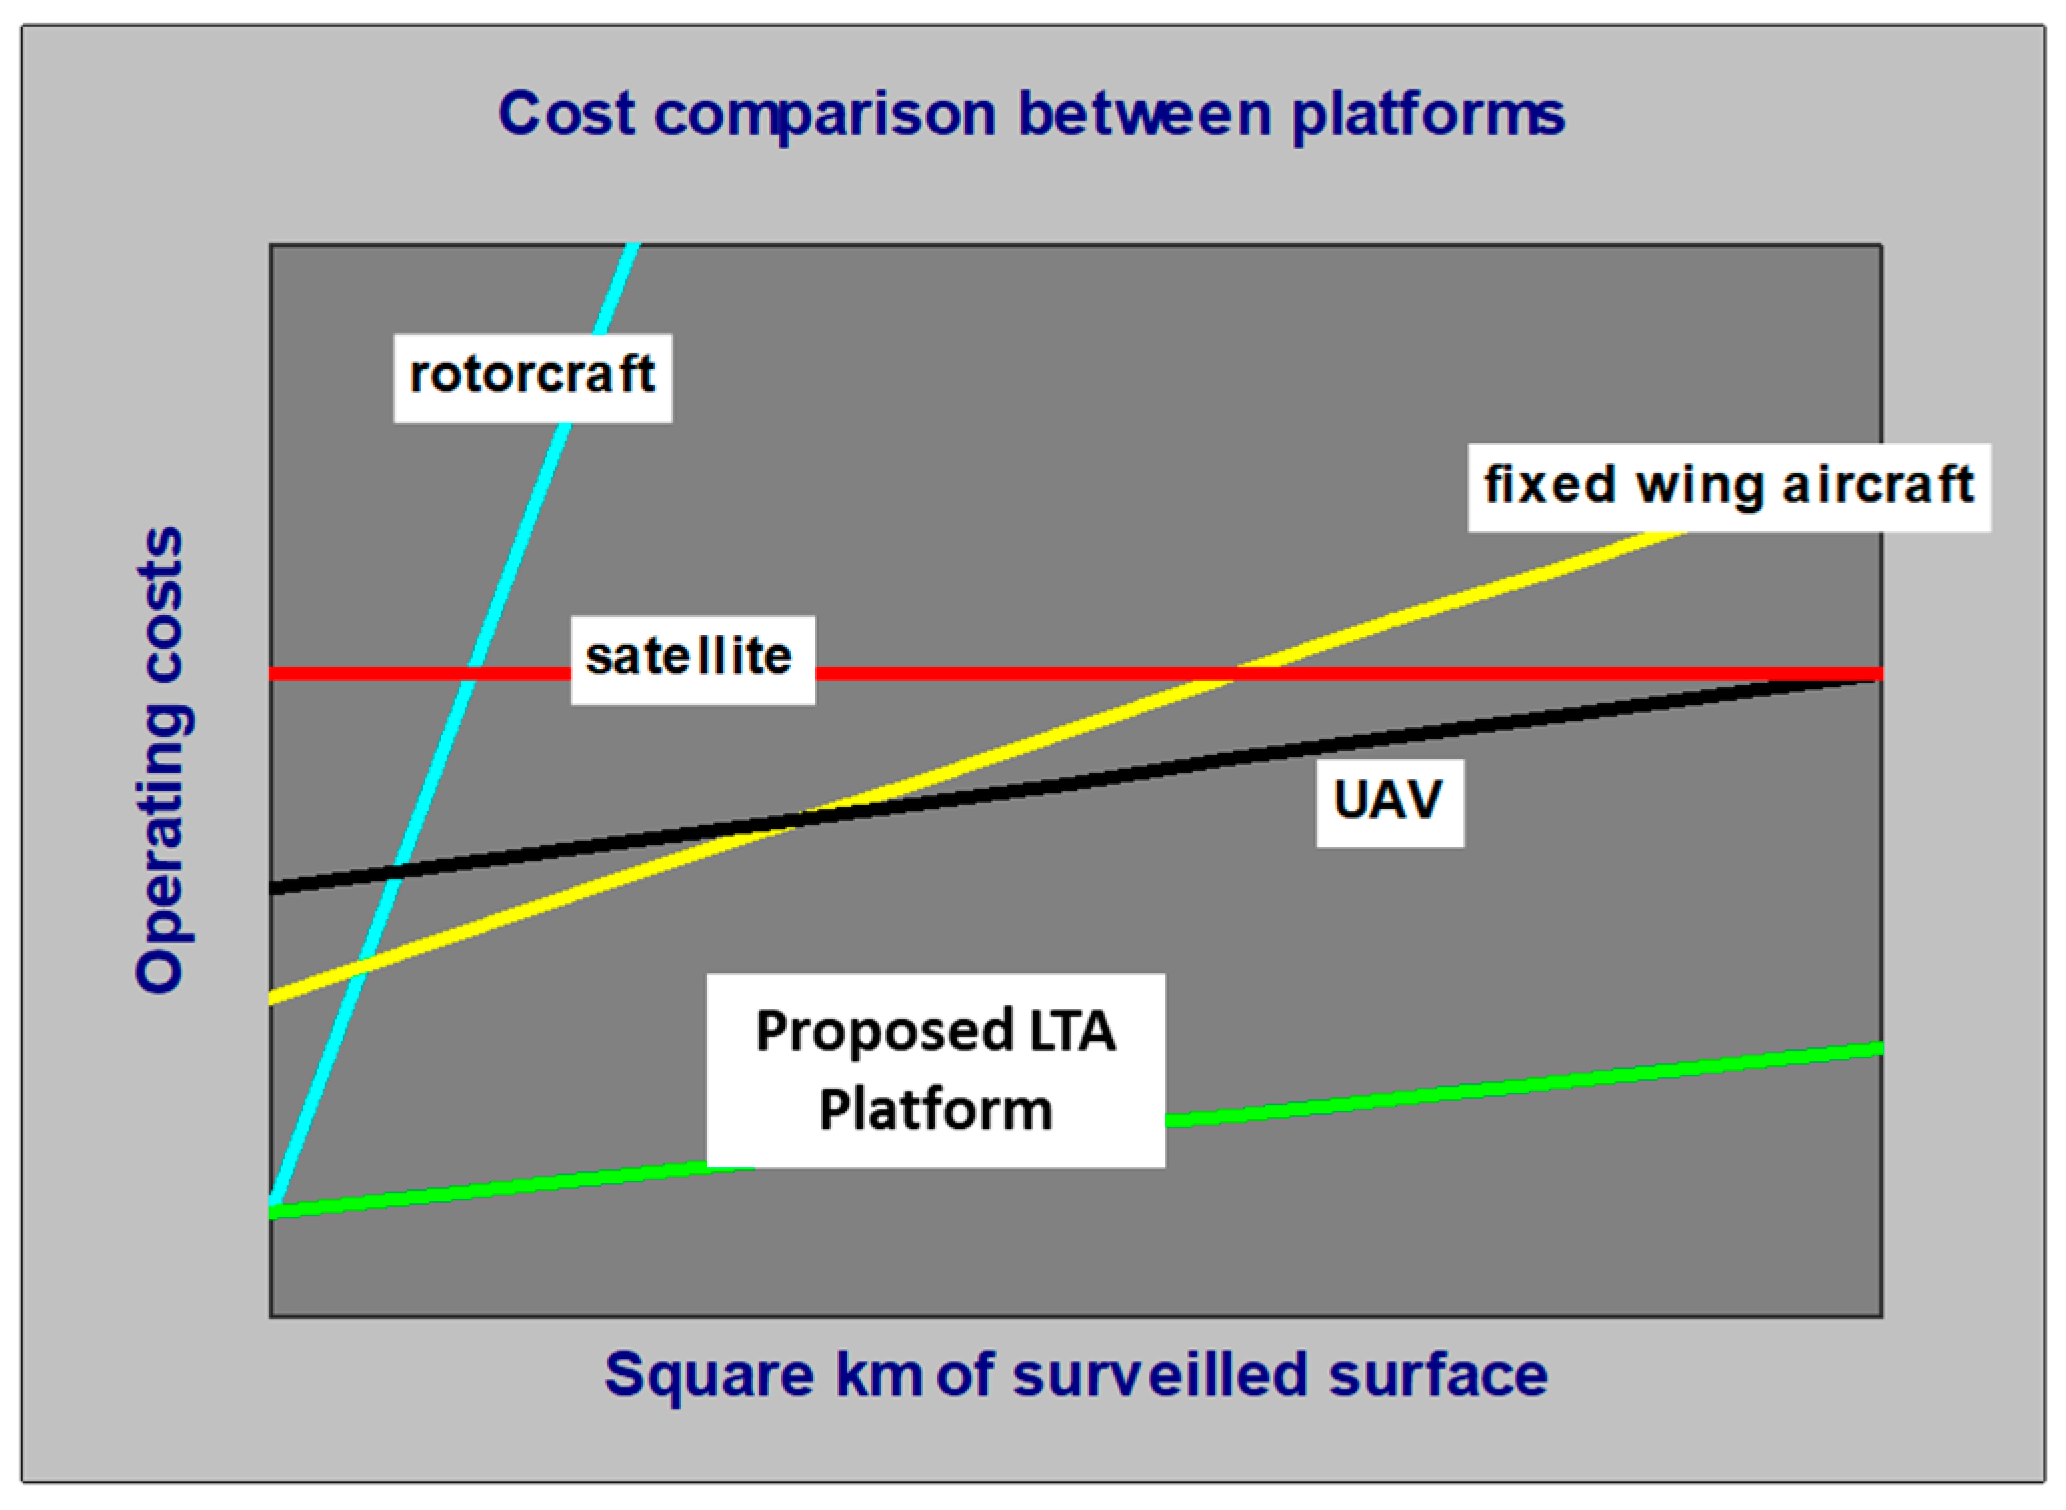
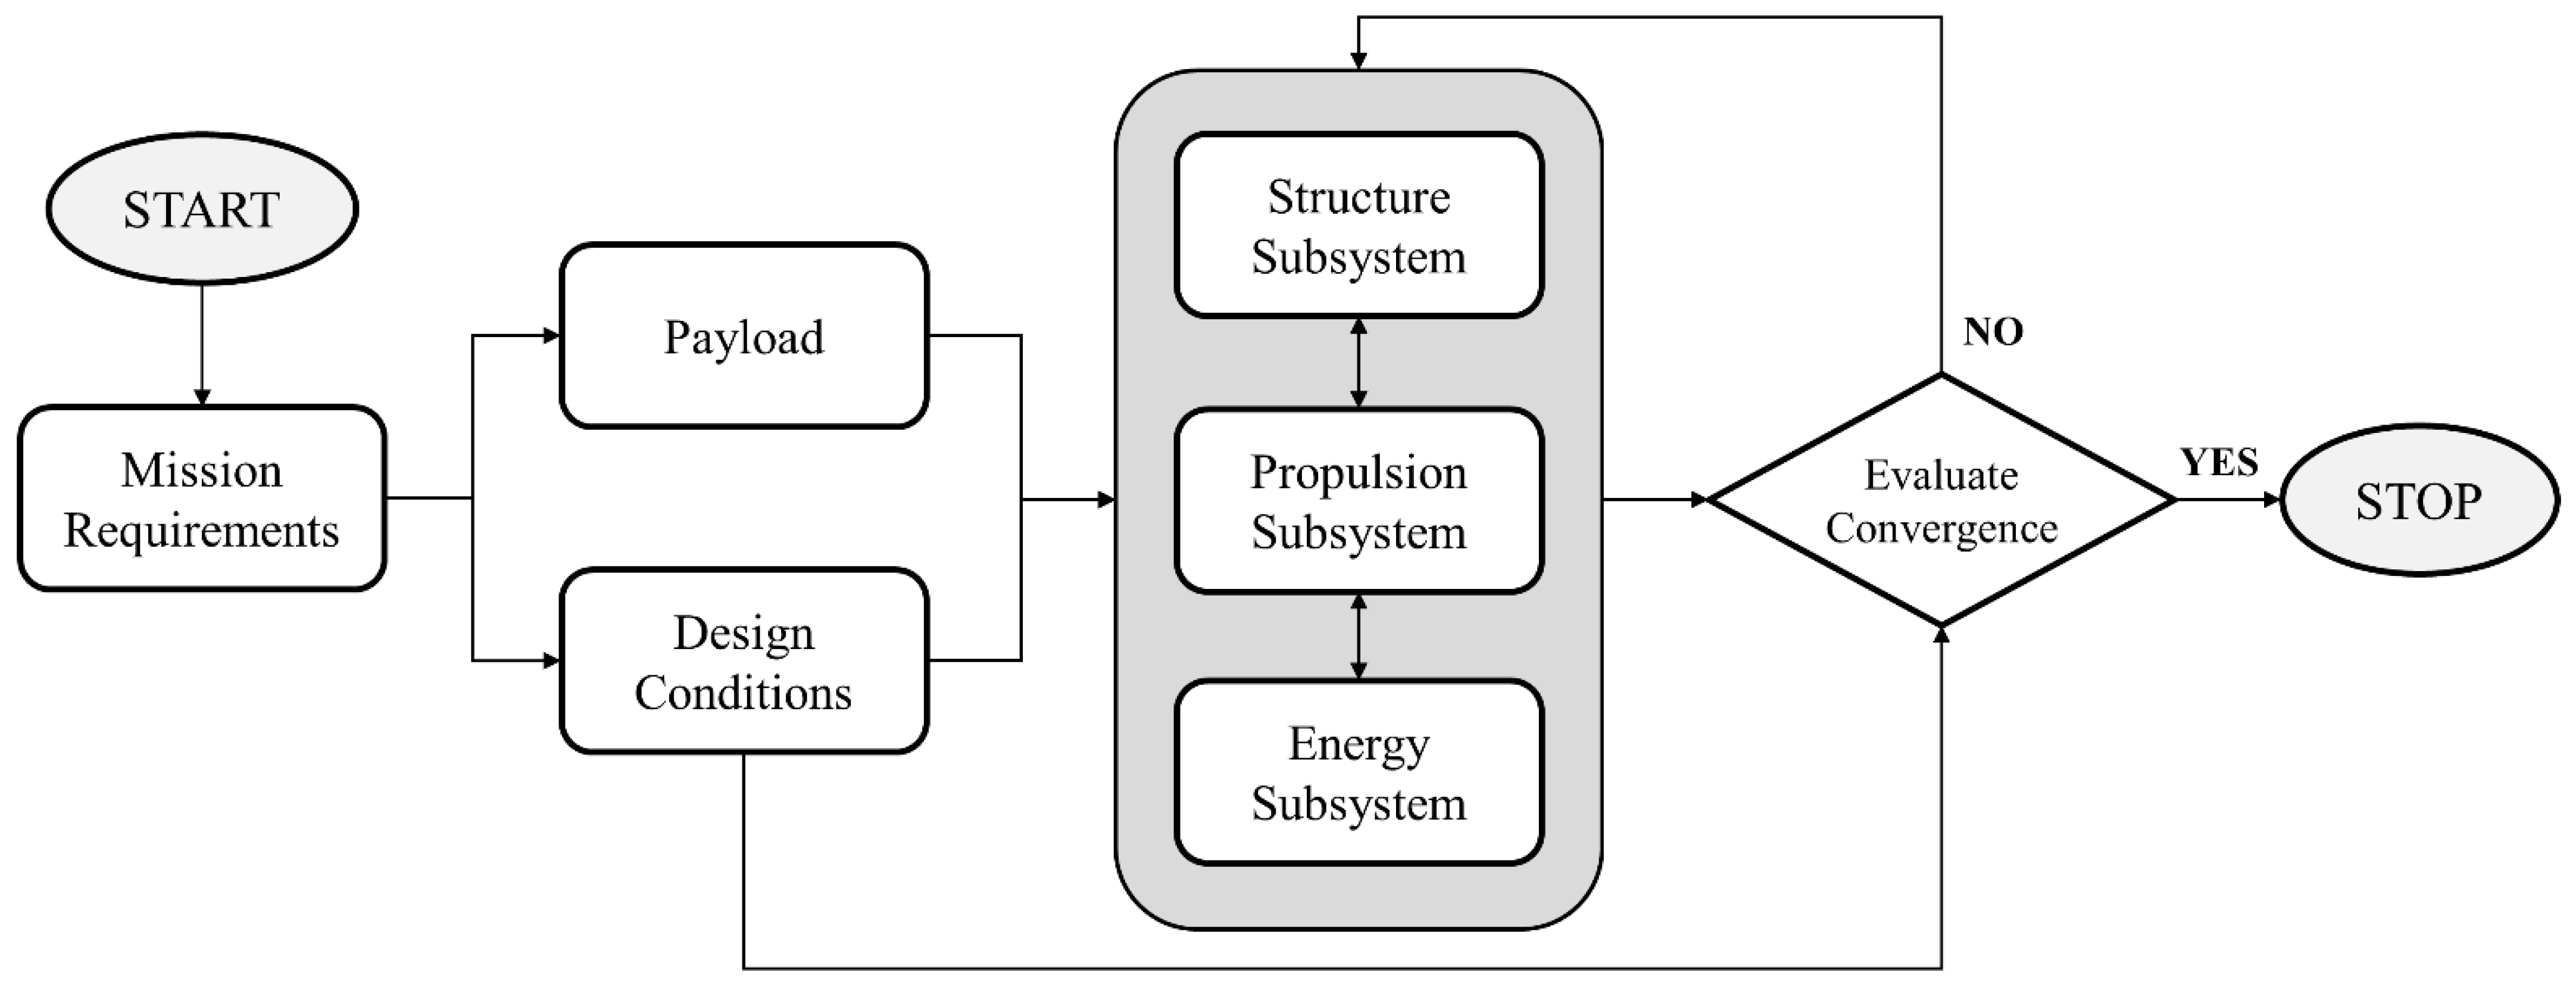
Table 1.
Similar RPAS LTA platforms.
| Project Name | Institution | Length, (m) | Max Diameter, (m) | Volume, (m3) | Years | Refs. |
|---|---|---|---|---|---|---|
| Autonomous unmanned remote monitoring robotic airship (“AURORA”) | Automation Institute of the Universidade de Campinas Informatics Technology Center | 10.5 | 3.0 | 34.0 | Late 1990s | [12,34,35] |
| Unnamed LTA platform | University of Pennsylvania | 9.0 | 2.2 | 26.0 | Early 2000s | [36] |
| Autonomous blimp “KARMA”, EDEN project | LAAS-CNRS | 8.0 | 1.9 | 15.0 | Early 2000s | [37] |
| Unnamed autonomous blimp-type robot | RIKEN research group of the Tokyo University | 6.5 | 3.0 | 24.9 | Late 2000s | [38] |
| “ACC15X” | Czech Technical University in Prague | 12.0 | 2.8 | 57.0 | Early 2010s | [26,27] |
| Unmanned airship low-altitude thermal infrared remote sensing system (“UALTIRSS”) | Key Laboratory of Subtropical Building Science of the South China University of Technology | 15.0 | 4.0 | 120.0 | Mid- 2010s | [39] |
| “LanTianHao” high altitude airship (HAA) 1 | Key Laboratory of 3D Information Acquisition and Application at Beihang University | 38.0 | 12.0 | n.a. | Mid- 2010s | [40] |
| Several LTA unmanned aerial systems (UAS) | US-based Galaxy Unmanned Systems LLC | 30, 35, 40, and 75-feet long (~9, 11, 12, and 23 m) | n.a. | n.a. | 2000–2019 | [41,42] |
1 This design is intended to operate at >4000 m above mean sea level. and with a payload of about 200 kg, thus it is larger in size with respect to the other reviewed designs.
Table 2.
Distribution of the airship weights.
| System | Weight, (kg) |
|---|---|
| Propeller (6 no.) | 25 (per propeller) |
| Onboard systems (e.g., energy systems) | 200 |
| Payload | 100 |
| Other non-structural weights (e.g., cables, etc.) | 100 |
Table 3.
Mechanical properties of the materials used for the airship design.
| Material | Density, (kg/m3) | Tensile Yield Stress, (MPa) | Ultimate Tensile Stress, (MPa) |
|---|---|---|---|
| Al-Cu 2024-T3 | 2780 | 230 | 345 |
| Carbon/Epoxy (HM) | 1500 | 450 | 900 |
Table 4.
Results of the structural analysis.
| Length, L (m) | Cross-Section Width, w (m) | Max Diameter, D (m) | Structural Weight (kg) | Buoyancy (N) |
|---|---|---|---|---|
| 30.00–34.00 | 0.225–0.280 | 10.00–11.34 | 964–1527 | 15,210–22,141 |
Table 5.
Design parameters and mission requirements used for sizing the power system.
| Cruise Speed, (m/s) | Cruise Altitude, (m) | Survey Speed, (m/s) | Survey Altitude, (m) | Cruise Distance, (m) | Survey Area, (m2) |
|---|---|---|---|---|---|
| 14–22 | 500–1000 | 13 | 500 | 2 × 10⁴ (max.) | 107 (max.) |
Table 6.
Design parameters used for sizing the propeller.
| Total Airship Mass, (kg) | Tp, (N) | V, (m/s) | z, (m) |
|---|---|---|---|
| 2163 | 343.75 | 16 | 500 |
Table 7.
Geometrical parameters used for describing the propeller blade.
| , (m) | , (m) | , (m) | , (m) | , (deg) |
|---|---|---|---|---|
| 7 |
Table 8.
Optimized propeller parameters.
| , (m) | , (rpm) | , (m) | , (deg) | , (N) | Torque, C(Nm) | ||
|---|---|---|---|---|---|---|---|
| 1.5 | 500 | 0.15 | 6 | 2 | 0.847 | 353 | 127 |
Table 9.
The final design for the LTA platform.
| Length (m) | Max Diameter, (m) | Structural and TotalWeight, (kg) | Max Speed, (m/s) | Max Flight Altitude, (m) | Propulsion and Control System |
|---|---|---|---|---|---|
| 34.00 | 11.34 | 1527 (structural) 2163 (total) | 22 (cruise) 13 (survey) | 1000 (cruise) 500 (survey) | 2 (1.5 m-long) blades per propeller, 4 forward propellers, 2 vertical axis propellers, 353 N thrust per propeller |
Publisher’s Note: MDPI stays neutral with regard to jurisdictional claims in published maps and institutional affiliations. |
© 2021 by the authors. Licensee MDPI, Basel, Switzerland. This article is an open access article distributed under the terms and conditions of the Creative Commons Attribution (CC BY) license (https://creativecommons.org/licenses/by/4.0/).
Share and Cite
MDPI and ACS Style
Gili, P.; Civera, M.; Roy, R.; Surace, C. An Unmanned Lighter-Than-Air Platform for Large Scale Land Monitoring. Remote Sens. 2021, 13, 2523. https://0-doi-org.brum.beds.ac.uk/10.3390/rs13132523
AMA Style
Gili P, Civera M, Roy R, Surace C. An Unmanned Lighter-Than-Air Platform for Large Scale Land Monitoring. Remote Sensing. 2021; 13(13):2523. https://0-doi-org.brum.beds.ac.uk/10.3390/rs13132523
Chicago/Turabian StyleGili, Piero, Marco Civera, Rinto Roy, and Cecilia Surace. 2021. "An Unmanned Lighter-Than-Air Platform for Large Scale Land Monitoring" Remote Sensing 13, no. 13: 2523. https://0-doi-org.brum.beds.ac.uk/10.3390/rs13132523
Note that from the first issue of 2016, this journal uses article numbers instead of page numbers. See further details here.