Technical Note

Water Ice Detection Research in Utopia Planitia Based on Simulation of Mars Rover Full-Polarimetric Subsurface Penetrating Radar

1
College of Geo-Exploration Science and Technology, Jilin University, Changchun 130026, China
2
Key Laboratory of Applied Geophysics, Ministry of Natural Resources, Jilin University, Changchun 130026, China
*
Author to whom correspondence should be addressed.
Remote Sens. 2021, 13(14), 2685; https://0-doi-org.brum.beds.ac.uk/10.3390/rs13142685
Submission received: 27 May 2021 / Revised: 4 July 2021 / Accepted: 6 July 2021 / Published: 8 July 2021
(This article belongs to the Special Issue Advanced Ground Penetrating Radar Theory and Applications)

Abstract

:
The probe of China’s first Mars exploration mission, Tianwen-1, has been successfully launched. It will carry out scientific exploration on the topography, soil characteristics, water ice, climate, ionosphere, and physical fields of Mars. Different from other rovers landing on the moon and Mars, the Zhurong rover is equipped with a full polarimetric subsurface penetrating radar (FP-SPR) system for the first time. The radar’s mission is to depict the shallow subsurface structure of Mars and search for possible water ice. Therefore, in this paper, a 3D realistic structure model is established and numerically simulated based on the possible subsurface structure of Utopia Planitia (the landing area). Influencing factors such as topographical fluctuations, rocks, water ice, and the variation of dielectric constant of different layers are added to the model. The analysis of the acquired FP-SPR data set shows that the two-dimensional principal component analysis (2D-PCA) method can extract effective reflected signals from the radar data with noise interference and improve the data quality. These clearly imaged targets may be water ice blocks, so the application of 2D-PCA to FP-SPR data increases the imaging quality of suspected water ice targets. The results of this paper are the basis for future processing of the measured FP-SPR data on Mars, which will help to identify more details of subsurface structures.

Graphical Abstract

1. Introduction

The probe of China’s first Mars exploration mission Tianwen-1 was successfully launched on 23 July 2020, and aims to complete orbiting, landing, and roving in one mission. It will carry out a global and comprehensive orbital exploration of the entire planet and conduct high-resolution detailed exploration in the landing area [1]. Tianwen-1 is comprised of an orbiter, a lander, and a rover. On 22 May 2021, the Zhurong rover successfully reached the pre-selected landing area in the southern Utopia Planitia of Mars. The scientific payloads on the rover include a subsurface penetrating radar (SPR), a surface composition detector, a surface magnetic field detector, a climate detector, and two cameras to characterize Mars’ topography, geological structure, soil characteristics, water ice distribution, physical field, Martian climate, and surface material composition [2]. The SPR carried on Zhurong consists of two channels for the completion of Martian terrain, subsurface structures, and water ice detection missions. In the low frequency mode, two monopole antennas installed under the apical plate of the rover are used, which operate in the frequency range 15 to 95 MHz. In the high frequency mode, the Vivaldi antennas installed on the front plate are used for full polarimetric exploration, and their operating frequency ranges from 0.45 to 2.15 GHz [3].
Water ice detection is an important way to explore for life on Mars. The Martian hydrological model shows that due to the low temperature, water ice can be distributed on the surface at a latitude greater than 40°, and it can be stable at a depth of 1~2 m in low latitude areas [4,5]. The radar installed on the orbiter has been successfully used for planetary detection many times, but only a few landing patrol missions are equipped with ground penetrating radar. The CH1 of Lunar Penetrating Radar on Chang’e-3 mission obtained poor quality radar data, which may be caused by the noise generated by the instrument and the complicated lunar acquisition situation [6]. Bandpass filtering is a commonly used method to improve the signal-to-noise ratio of radar data, and it is used in processing radar data from Chang’e-3 and Chang’e-4 missions [7,8]. However, bandpass filtering cannot completely filter out noise. Combining it with other methods can further improve the data quality. The high-frequency radar installed on the rover of Tianwen-1 can obtain full polarimetric subsurface penetrating radar (FP-SPR) data, so it is possible to find the correlation between the data set to improve data quality.
In this paper, a 3D realistic structure model is established based on the possible subsurface structure of Utopia Planitia (the landing site of Zhurong rover). The model contains influencing factors such as topographical fluctuations, rough interface, rocks buried in the soil, and water ice that may exist subsurface. The model consists of four layers, simulating the structure of Utopia Planitia from surface to two meters underground. For FP-SPR simulation data with Gaussian white noise, the two-dimensional principal component analysis (2D-PCA) method is used to extract the effective reflection signal from the background noise to improve the data quality [9]. These clearly imaged signals include reflections from water ice blocks, so the application of 2D-PCA to FP-SPR data increases the imaging quality of suspected water ice targets. The research results in this paper lay the foundation for future processing of Zhurong’s FP-SPR data, which will help to identify more details of the subsurface structure.

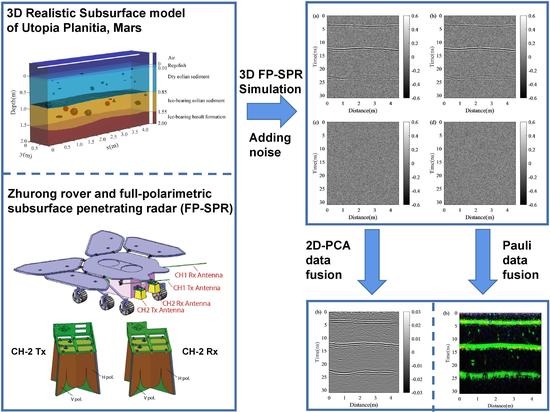
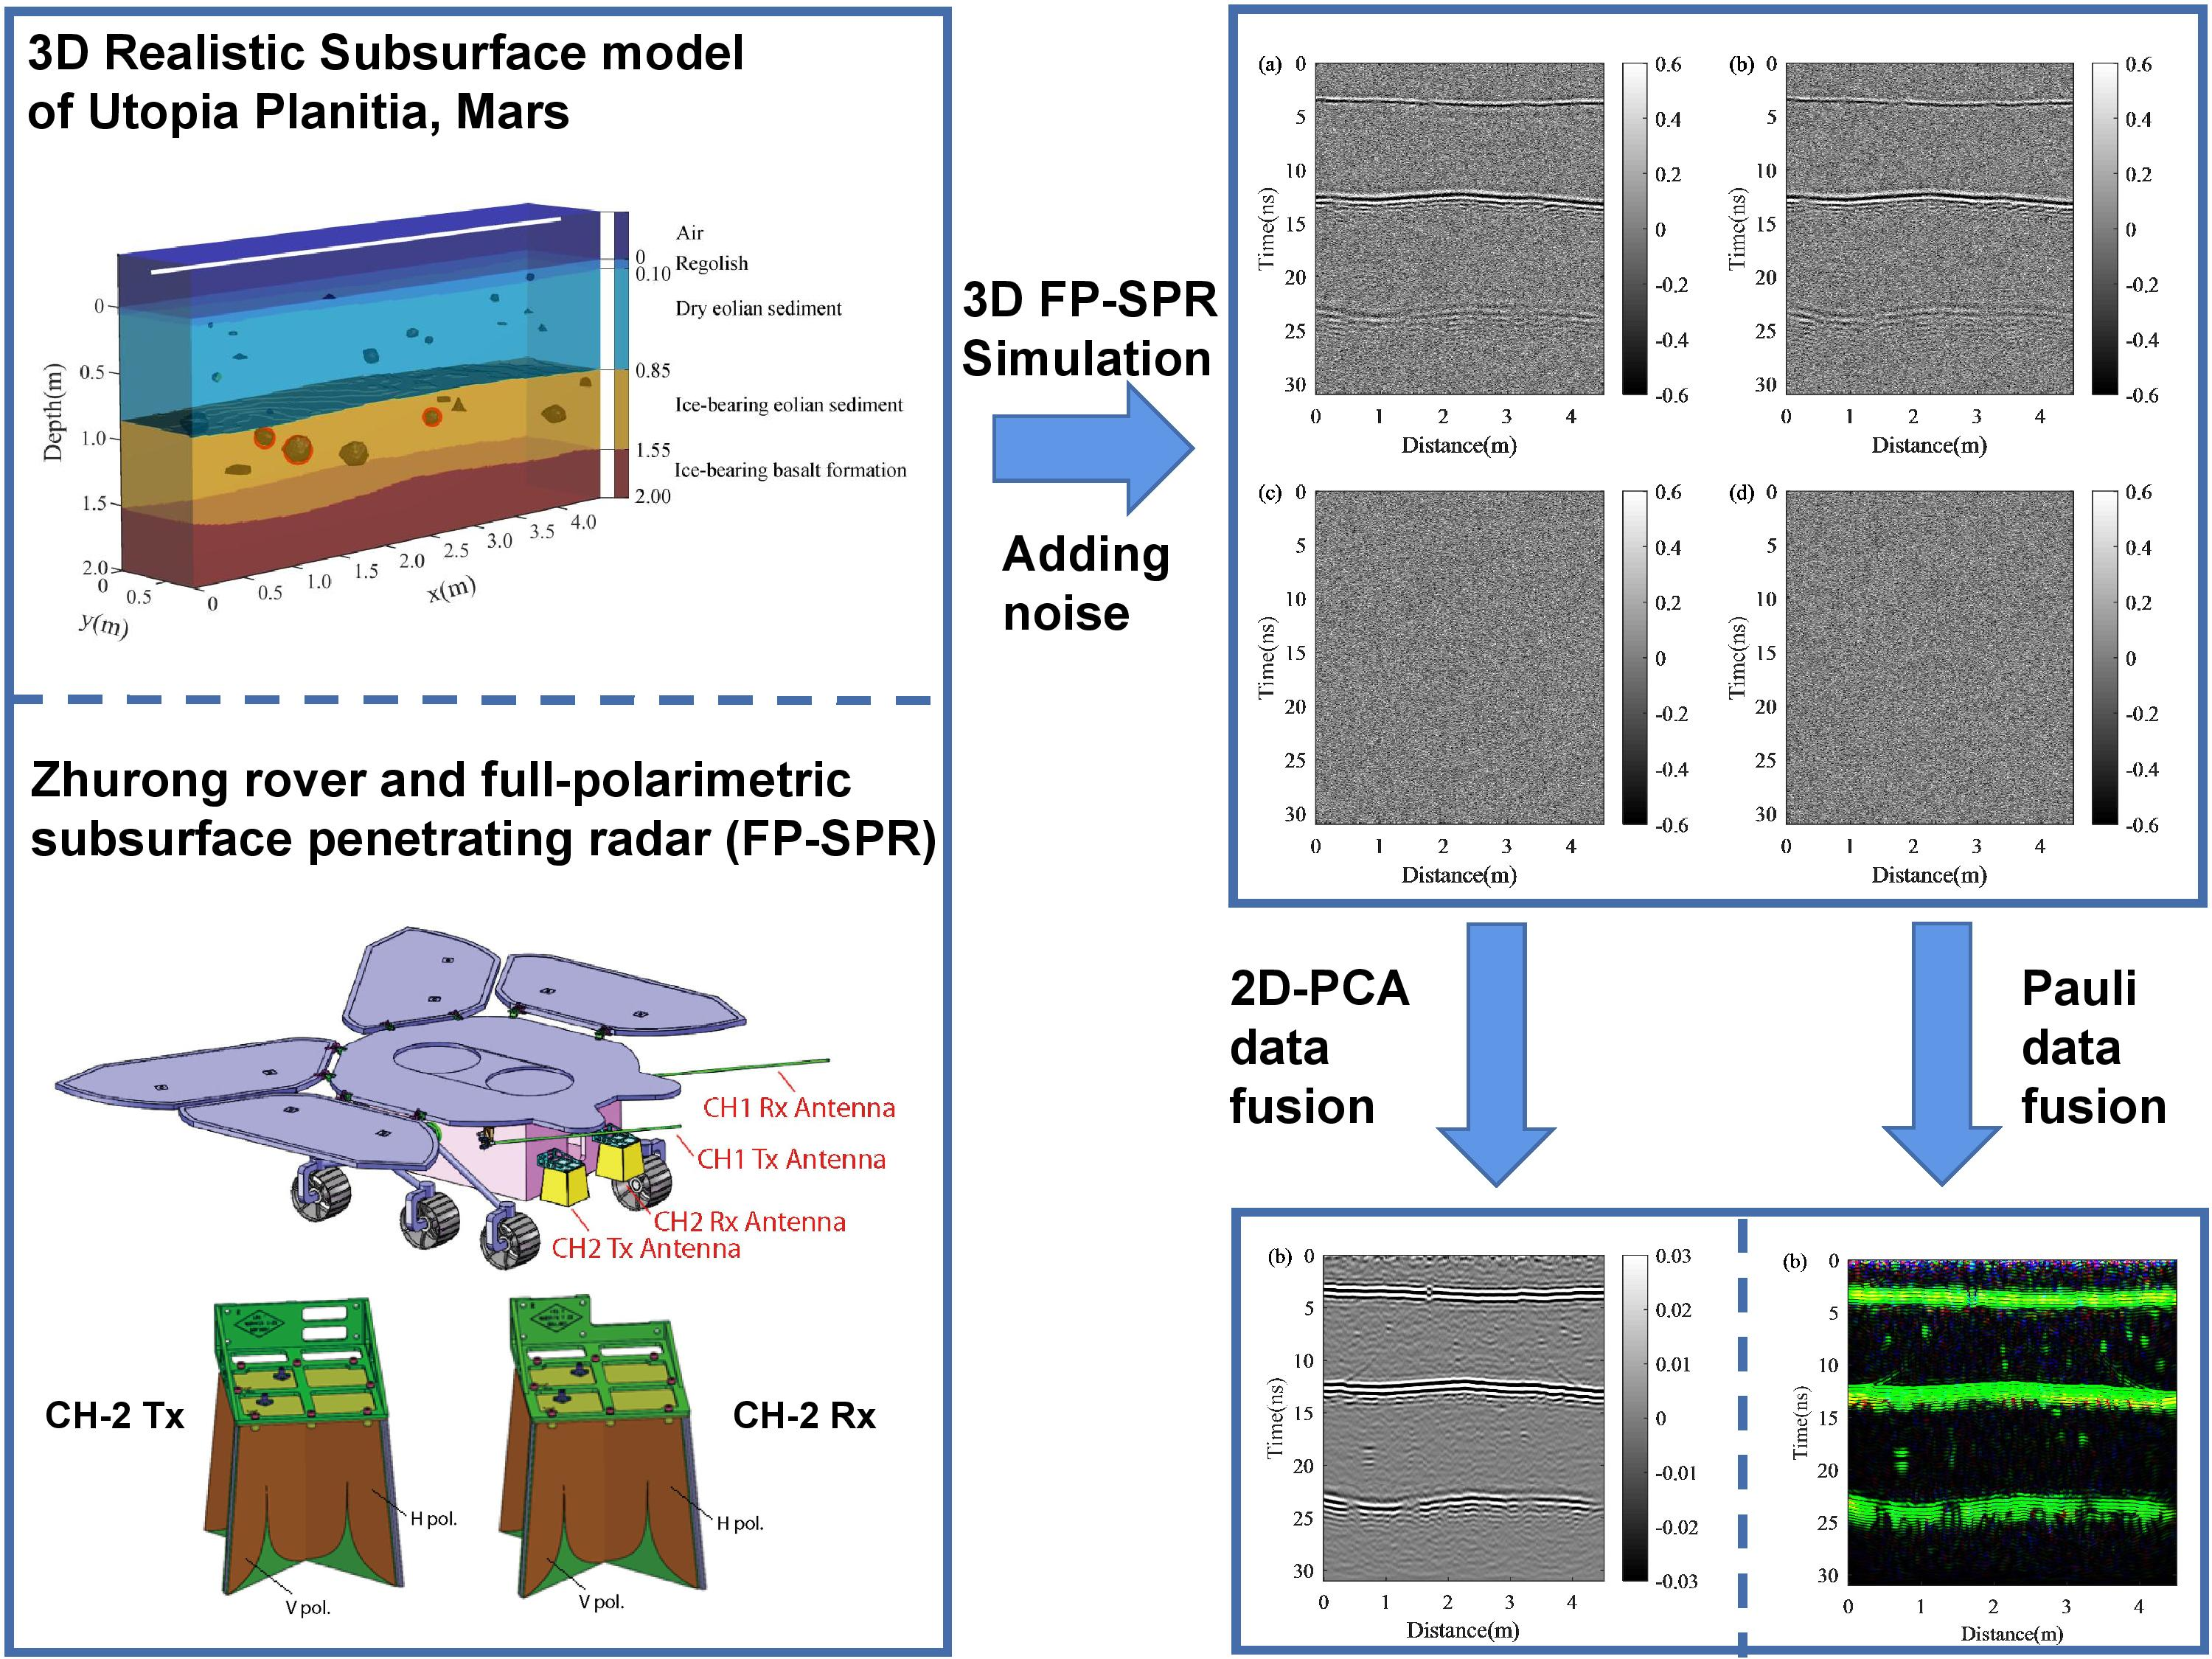
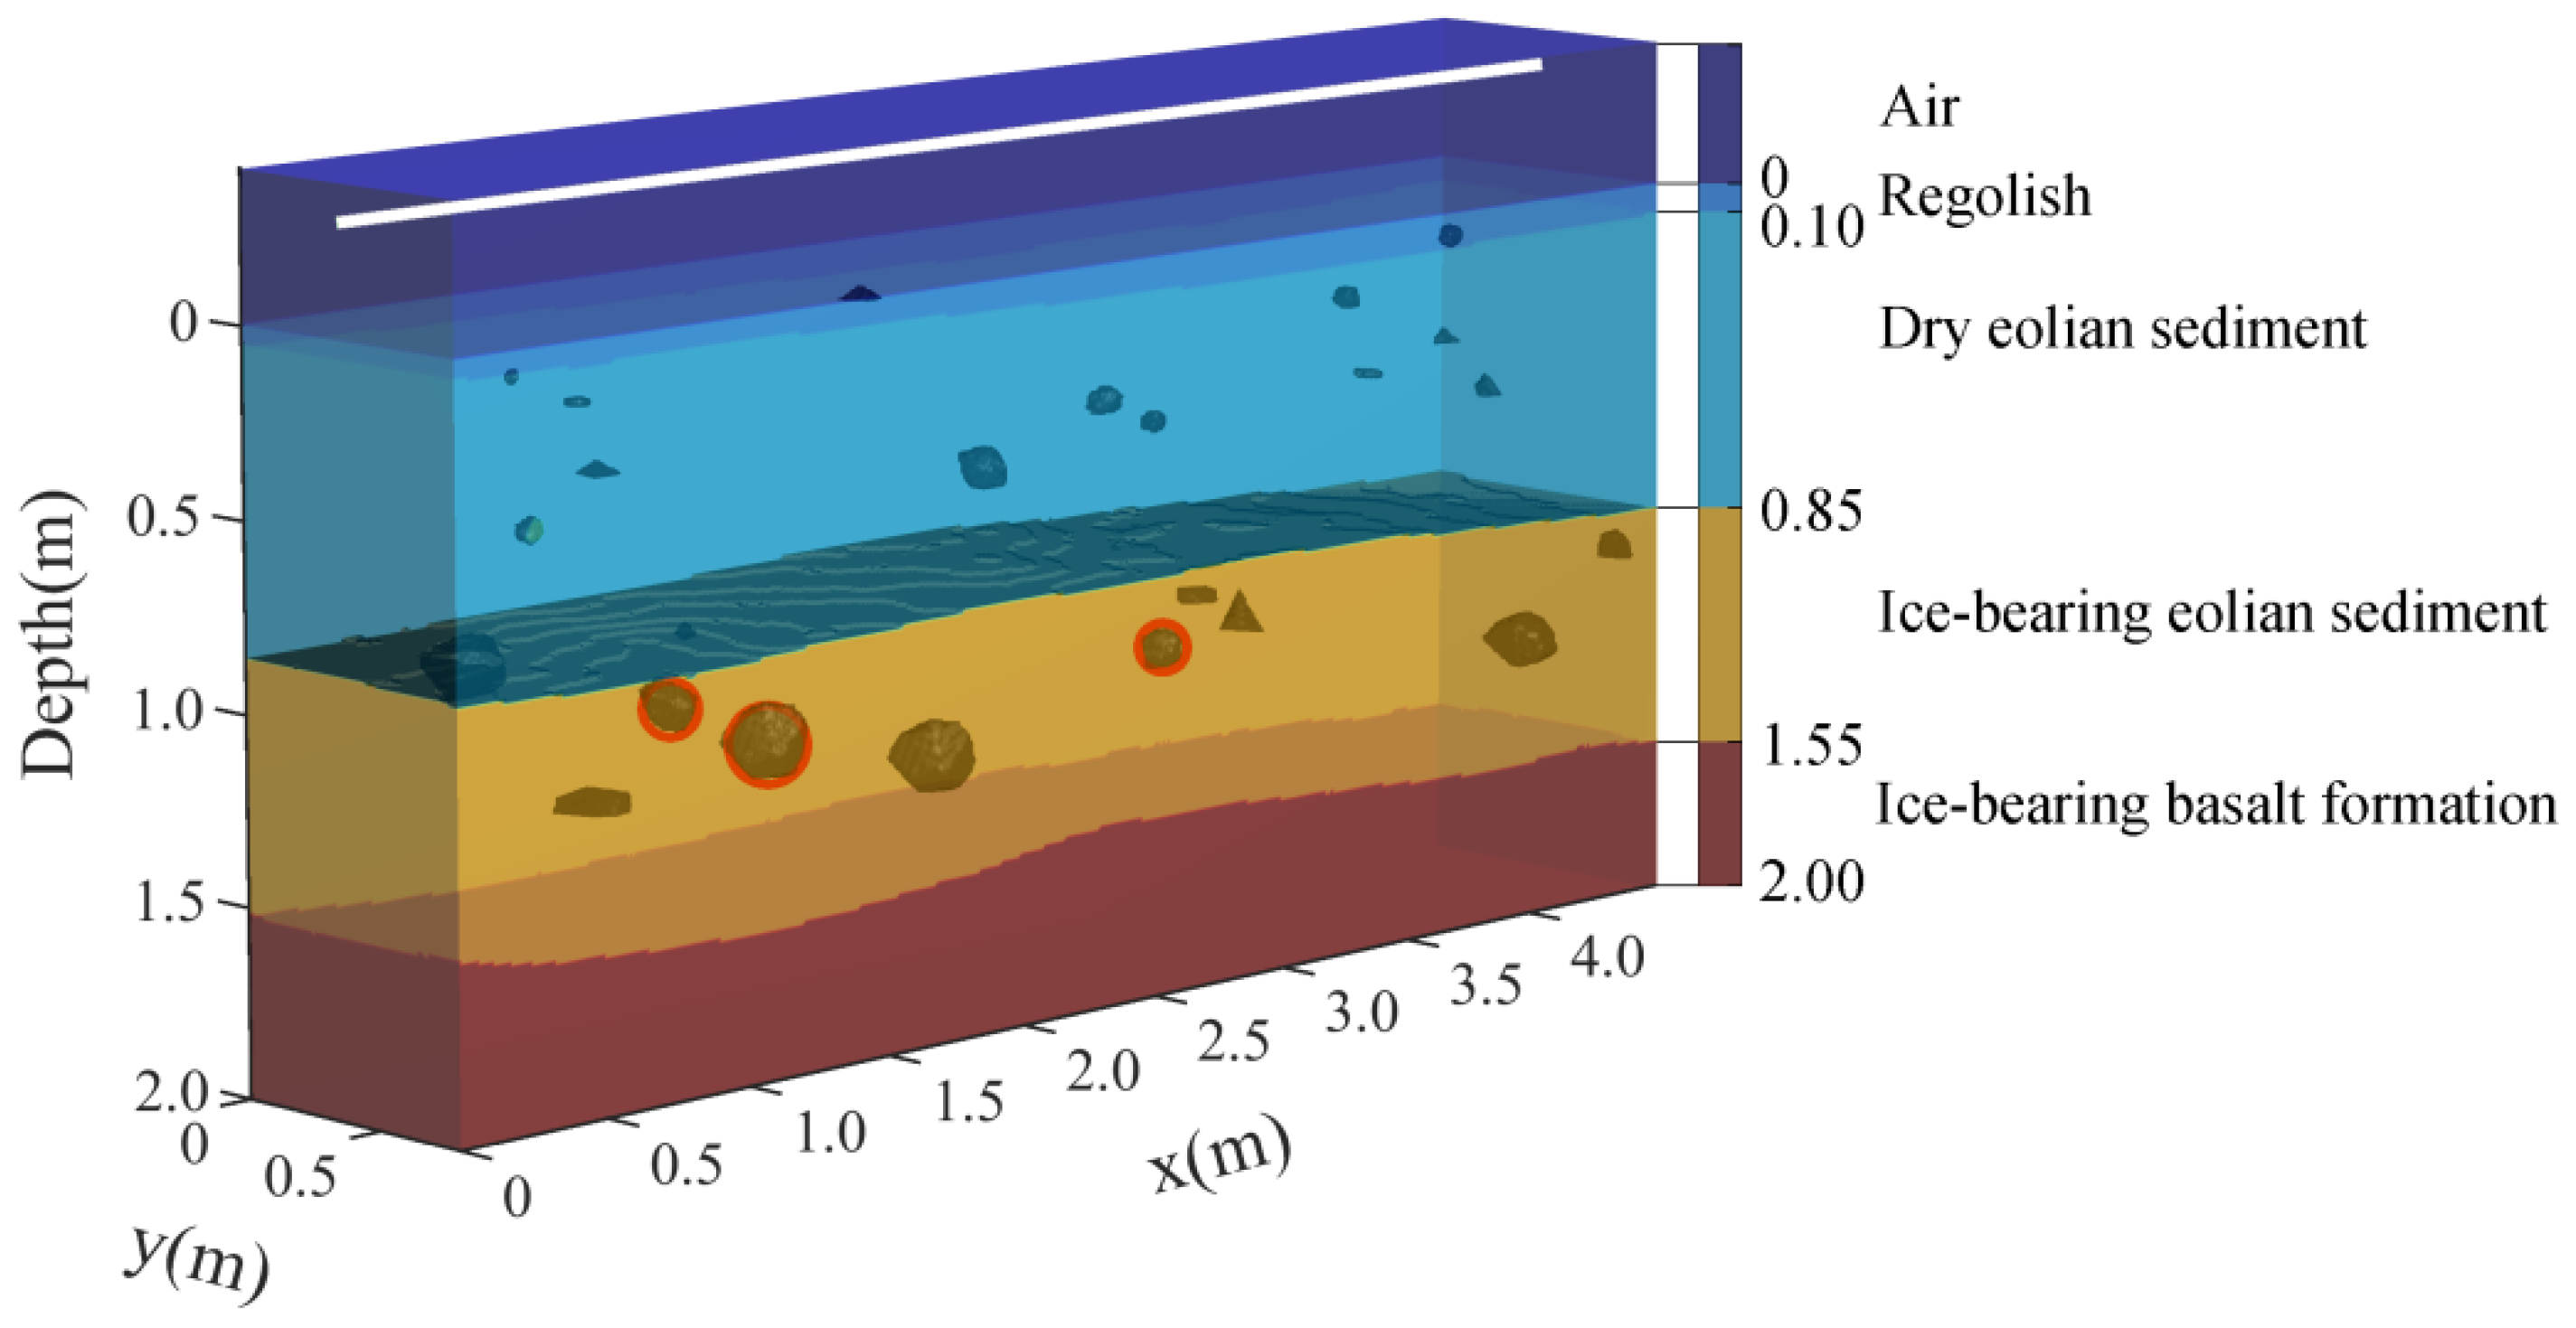
2. Establish a 3D Realistic Structure Model of Utopia Planitia

The chronostratigraphic age of the Lowland units in the northern hemisphere of Mars is concentrated in the Late Hesperian and Mid-Aazonian, and its material composition is mainly lava, pyroclastic rocks, water erosion sediments, and glacial clastic sediments [10]. In the Elysium-Utopia region, extensive basaltic lava flows erupted from the Elysium volcanic province covered the Vastitas Borealis Formation (VBF) unit [11]. Recent research indicates that the young terrain at 30–60° latitude in the northern hemisphere represents the recent and now-decaying expansion in the low latitude region. It is inferred to be an extensive and longer term, latitude-dependent near-surface ground-ice-cemented dust or loess layer [12]. Mars undergoes oscillations which strongly affect the climate cycle and lead to north polar layered deposits exchanging substantial amounts of water with the mid-latitudes over the course of an obliquity cycle, and sometimes causes Mars to have abundant ice coverage over a wide range of latitudes [13]. The lower and middle latitudes of Utopia Planitia showing many types of landforms suggest the presence of ice-rich permafrost, such as thermal contraction polygonal networks and scalloped terrains [14]. The periglacial landforms in Utopia Planitia including polygons and pingo-like features were suggested to be developed by melting of ground-ice and the sublimation process [15]. The estimate of the stability of water ice at the surface of Mars indicates that water ice should be stable at the mid-latitude at depth >1 m and at depth <1 m for higher latitudes [14]. As a result of volcanic flows and crater ejecta, there are a considerable amount of rocks buried within the near surface [16]. The global rock survey results of the Mars Global Surveyor show that the surface of Mars is mainly covered by basalt and andesite. The older surface in the south is rich in basalt, and andesite is concentrated in the younger northern plains [17].
The above analysis shows that the subsurface situation of Utopia Planitia may be: the basalt formation is covered with ice-rich permafrost; after the glacier melts, it condenses into water ice blocks locally, and the water ice sublimates within a depth of one meter below the surface of Mars to form dry eolian sediment. We considered the case where the subsurface rocks are andesite. In this case, the dielectric constants of rock and water ice are less than that of the formation, and the dielectric constants of rock and water ice are similar. The reflection signals of rock and water ice are relatively weak, so it is difficult to extract effective signals and distinguish these two types of anomalous bodies. Based on the possible subsurface structure of Utopia Planitia and the penetrating depth of FP-SPR, a four-layer 3D realistic structure model was established (Figure 1). The size of the model is 4.5 m × 0.8 m in the horizontal direction and 2 m in the depth direction. The model’s parameters are shown in Table 1. From the surface to the bottom, there are regolith, dry eolian sediment, ice-bearing eolian sediment, and basalt formations filled with water ice in pores. The estimated dielectric constant is 2.4 for drift (sand), 2.8 for cloddy (soil) measured by the Viking Landers and Mars’ average visible reflectivity [16]. The permittivity is 5.1 when the eolian sediment has a porosity of 50% and is completely filled with water ice [18]. When the porosity of the basalt formation is 10% and 50% of which is filled with water ice, the real part of the dielectric constant is 6.9 [18]. The dielectric constant of andesite is 3.5 quoted from the study of Jin [19]. On the top of the model, a vacuum layer (0.4 m thick above the surface) is placed so that the emitter can be placed 0.3 m above the surface. In the process of model design, influencing factors such as topographical fluctuations, rough interface, rocks buried in the soil, and possible water ice were added to make the model more realistic. The model contains three pieces of pure water ice blocks, whose centers in x, y and depth directions are (0.96, 0.55, 1.04), (1.44, 0.41, 1.22), and (2.94, 0.40, 1.16) in meters (red circles in Figure 1). The positions of water ice blocks in the depth direction are designed according to the depth at which the water ice can exist stably. The positions of water ice blocks in x and y directions are randomly selected in the model, and there is no contact between water ice blocks and rocks. The specific algorithms for constructing the model include using “Diamond-Square algorithm” to generate 3D stochastic fractal terrain, and abrasive grains to simulate irregular rocks and water ice blocks [20].

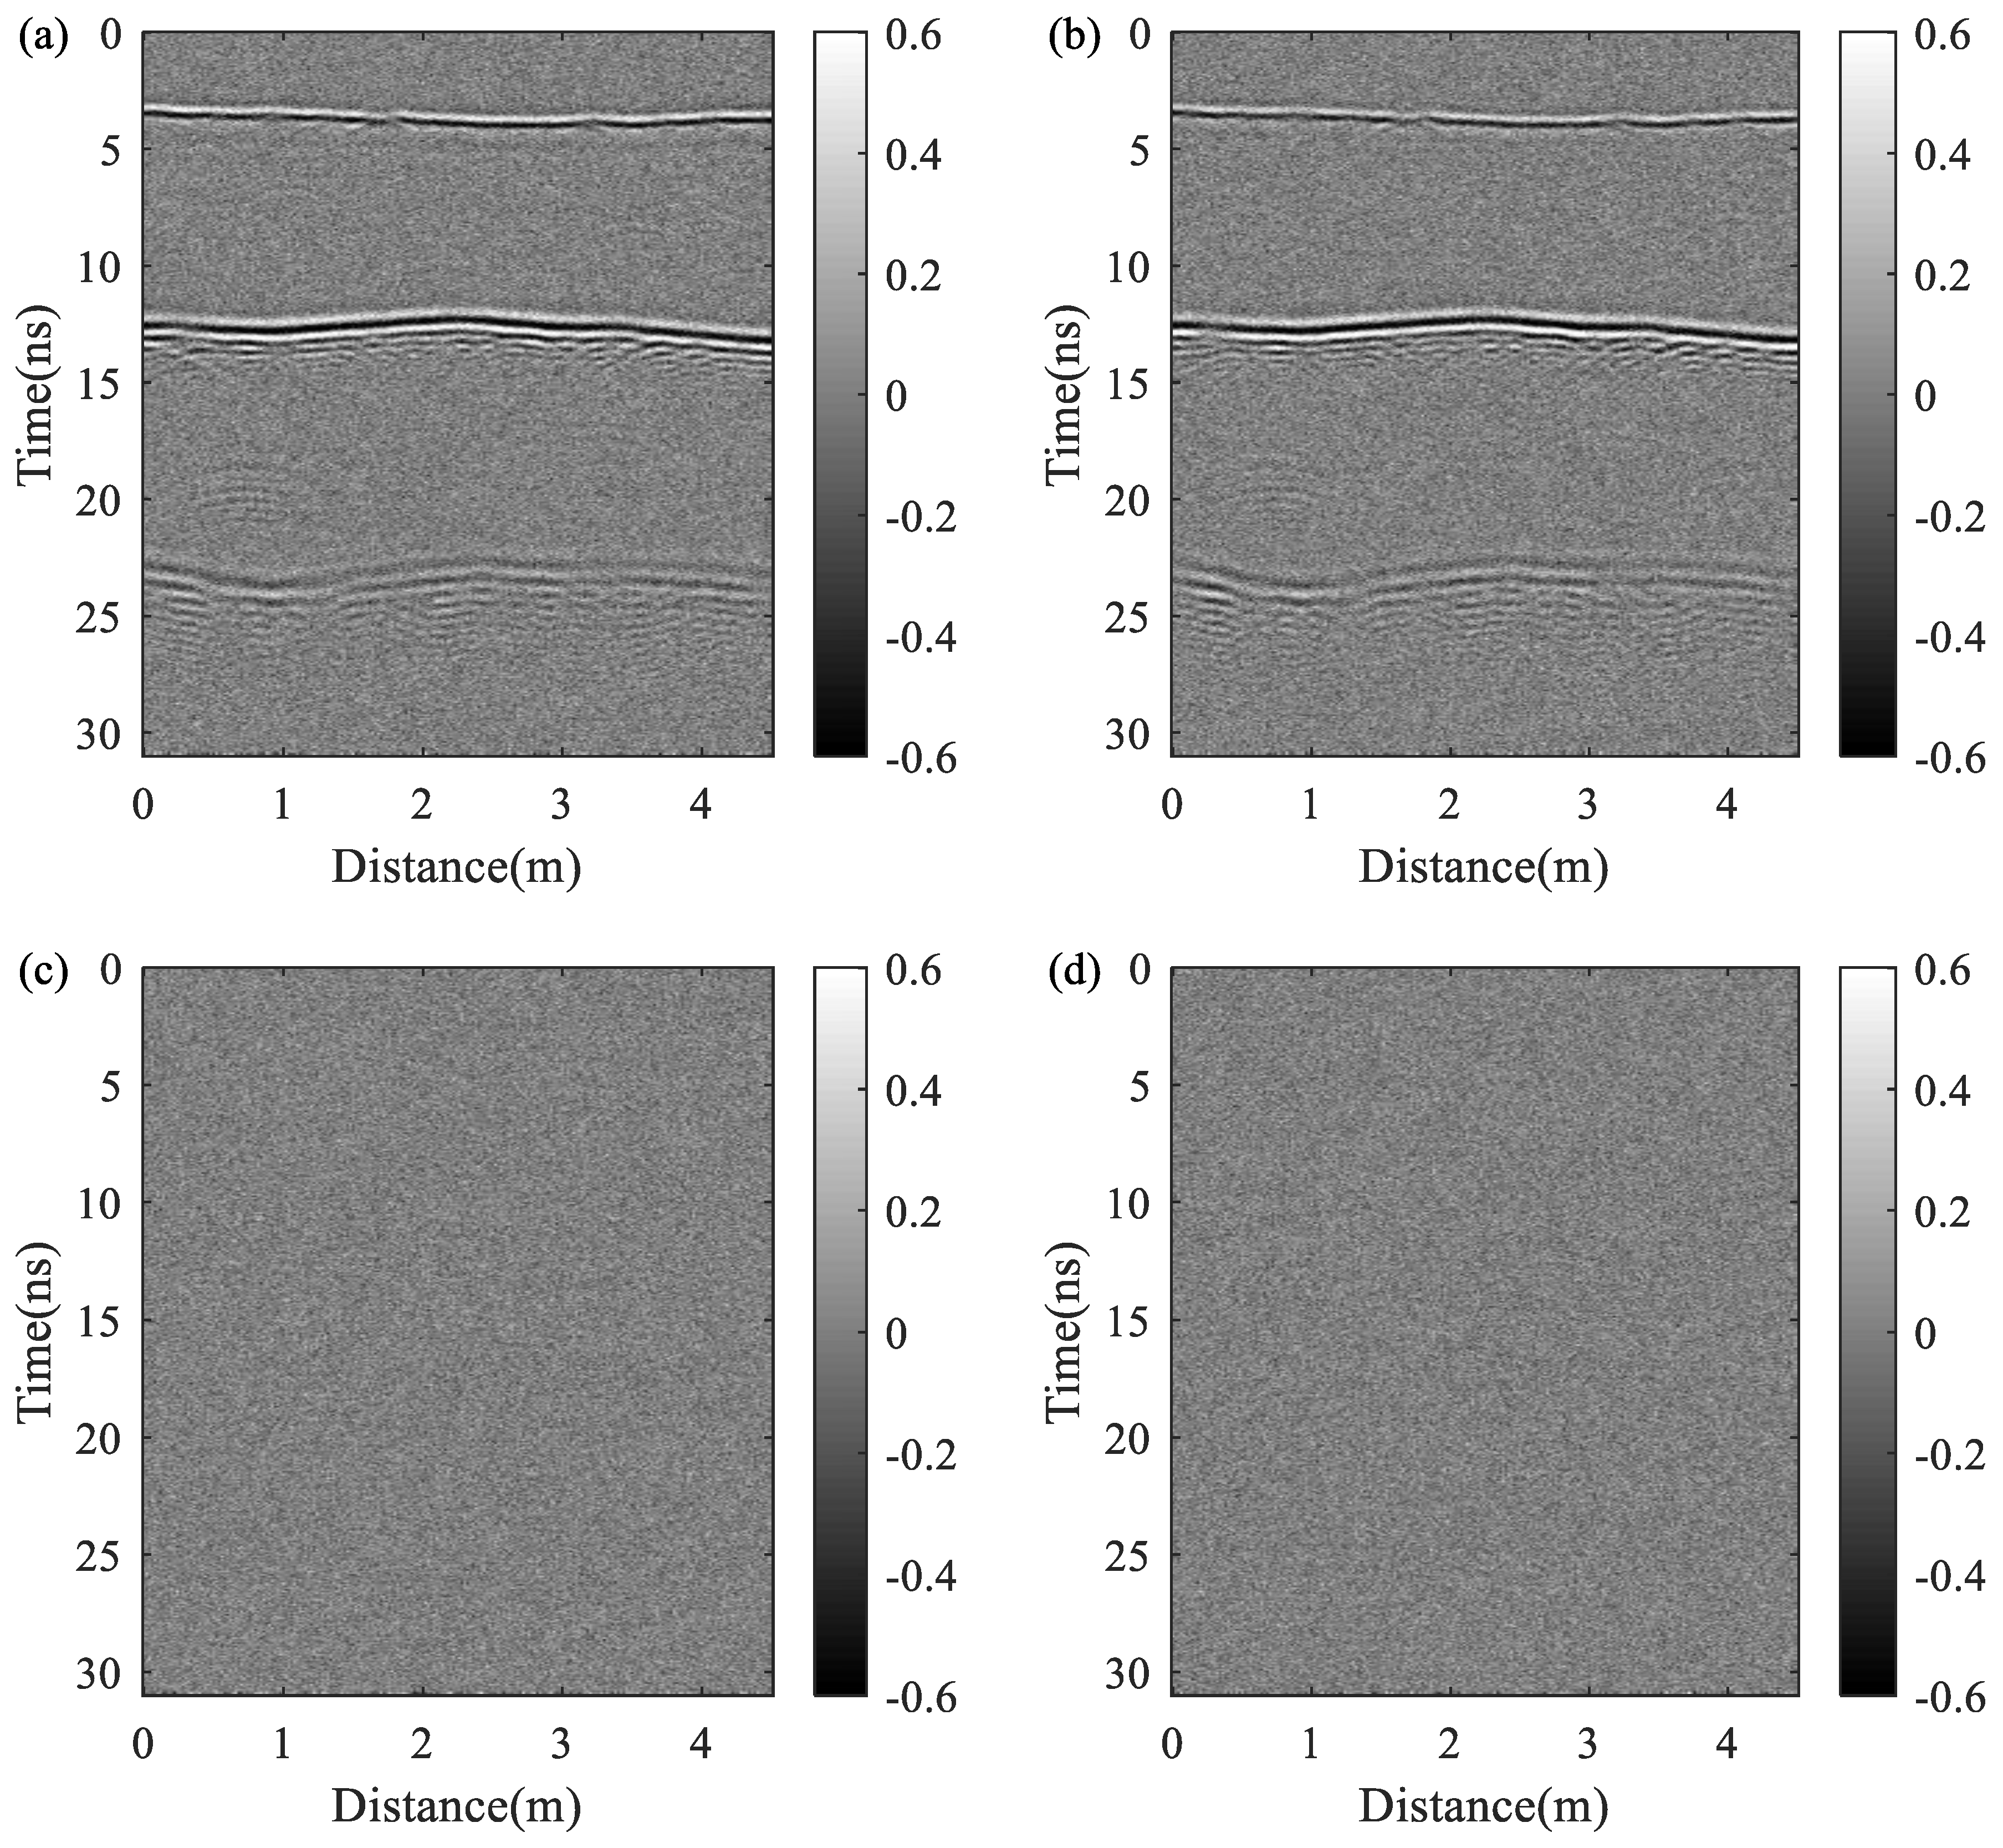
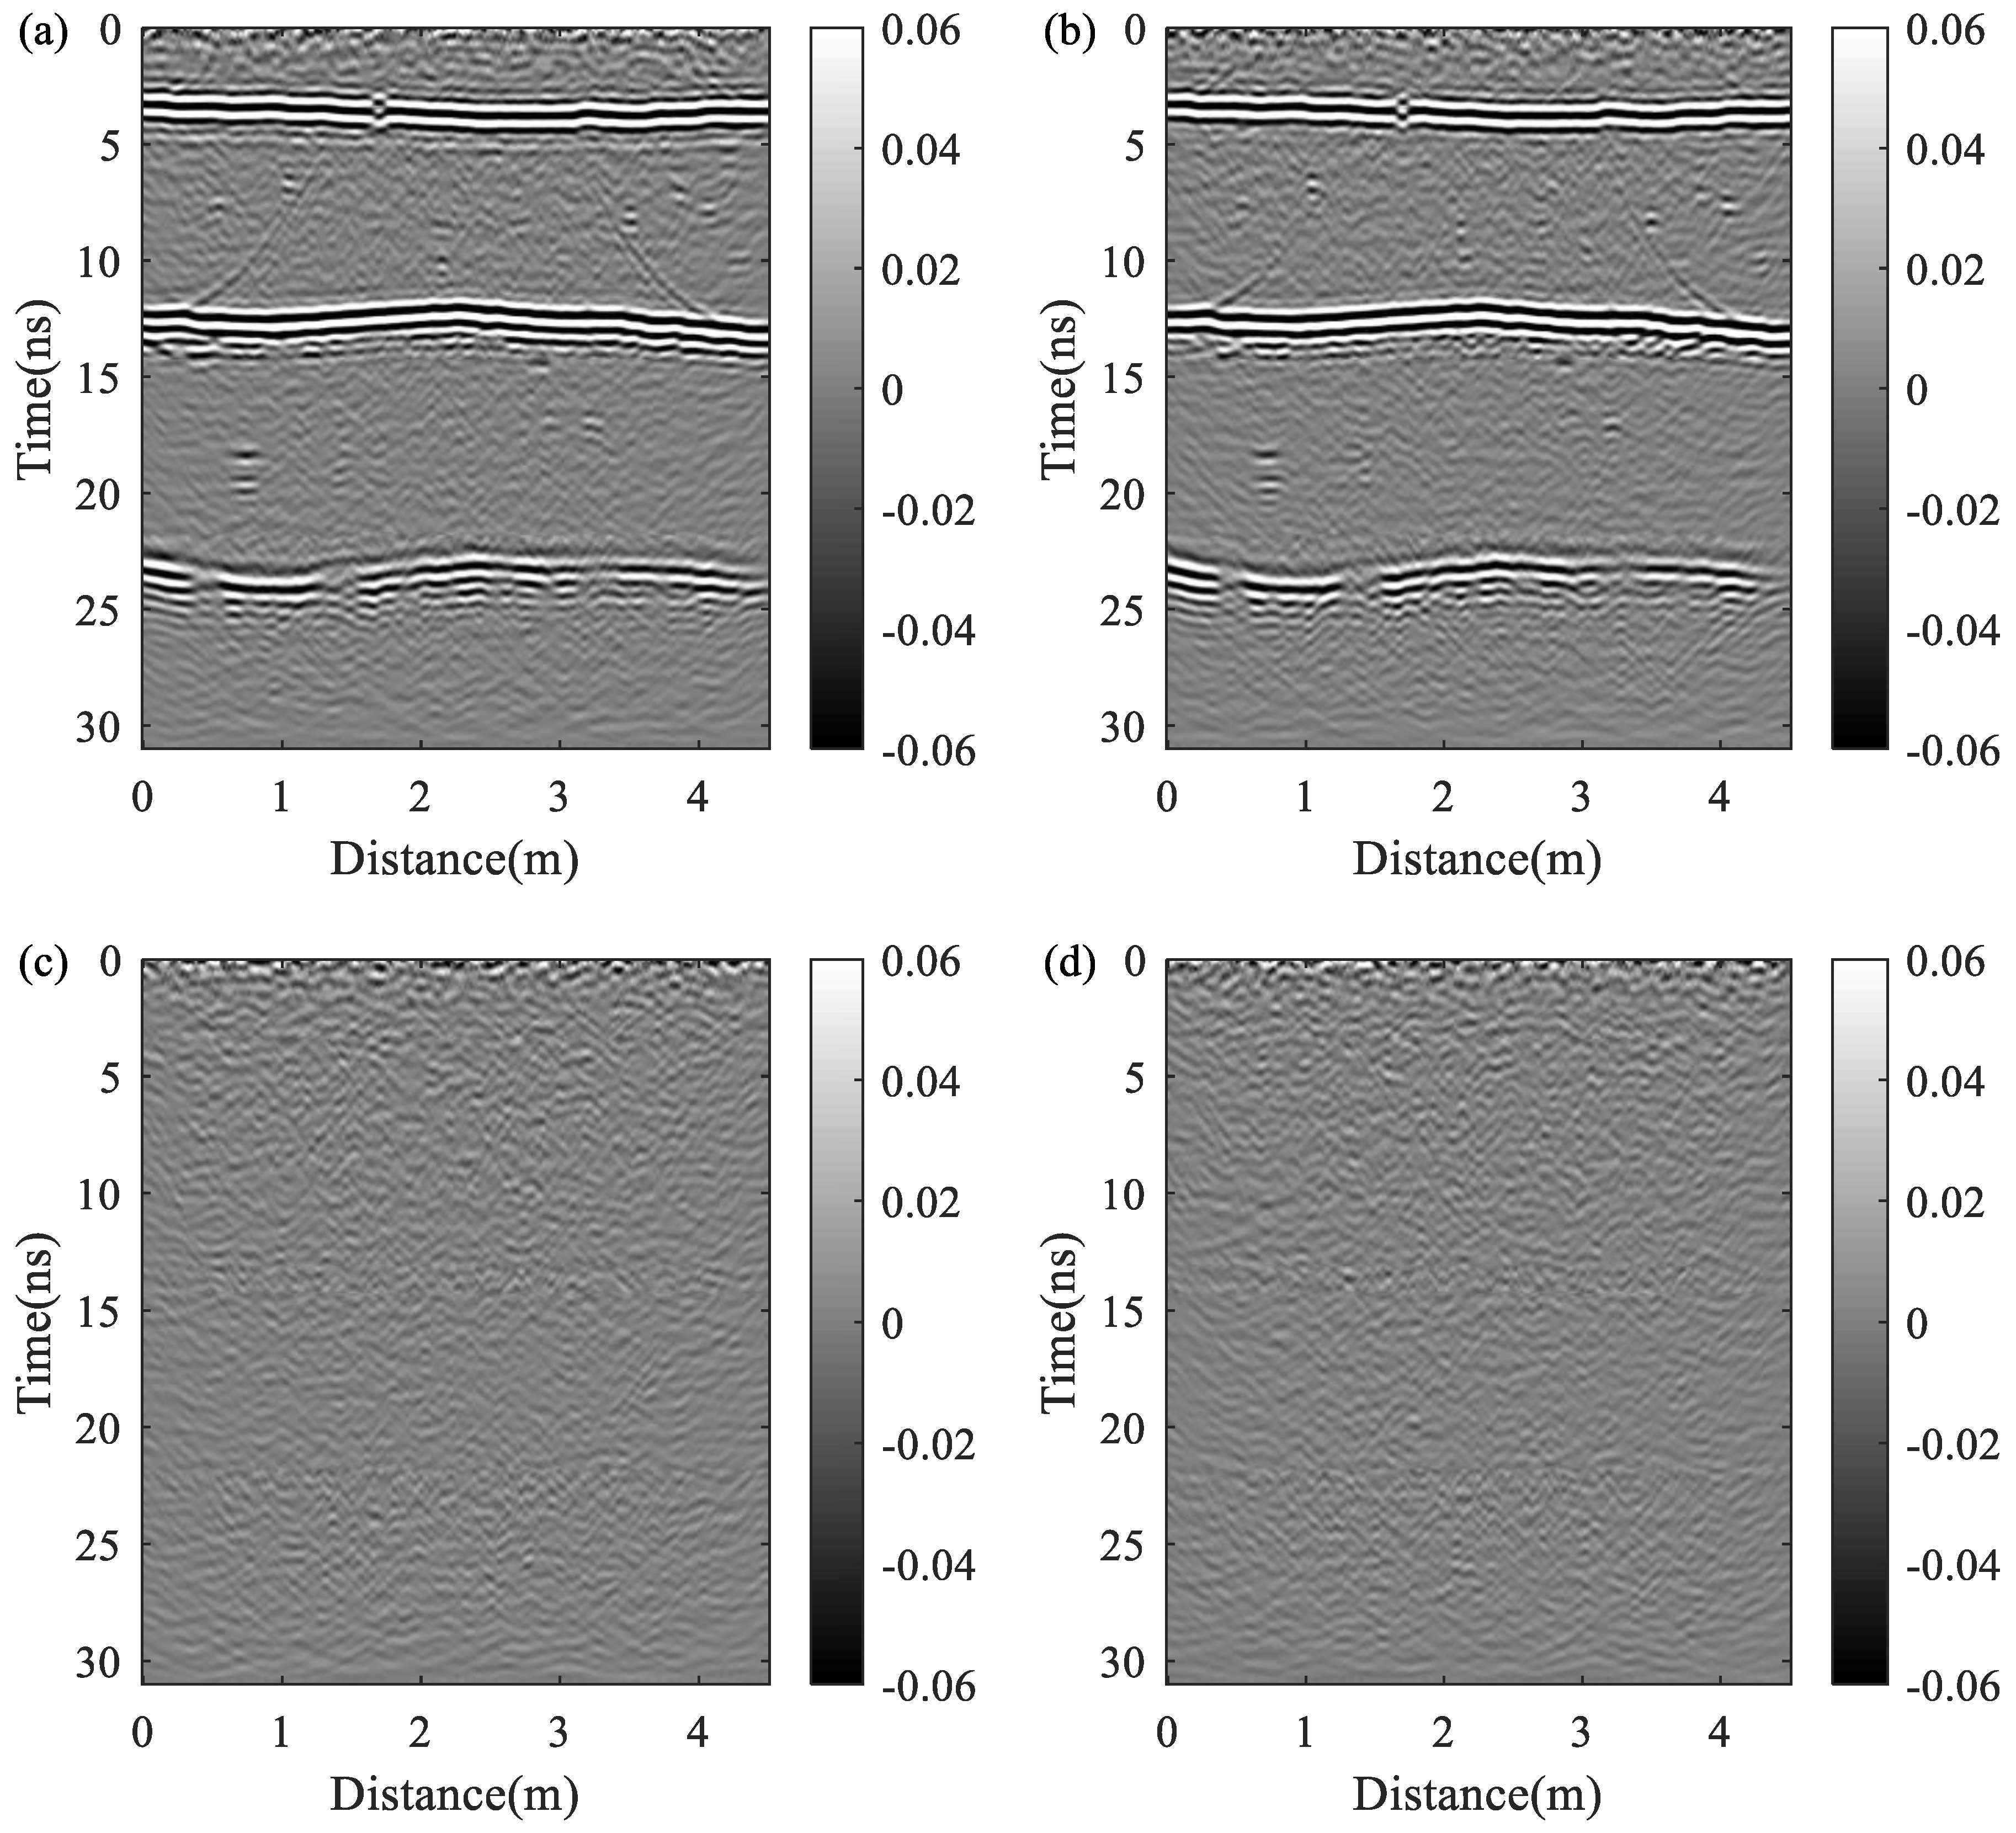
3. Simulation of the 3D Realistic Structure Model

In this paper, 3D finite-difference time-domain (FDTD) approach has been used to simulate the 3D realistic structure model of Utopia Planitia to obtain FP-SPR data. The main code of FDTD was written by Feng et al. [21]. The FP-SPR system includes four polarization modes, VV mode, HH mode, VH mode, and HV mode, in which HH and VV are co-polarization modes, VH and HV are cross-polarization modes. The 1.3 GHz Ricker wavelet is selected as the transmitting source. In the forward simulation process, the transmitter is placed 0.3 m above the ground surface, the receiver and the transmitter are at the same height, and the distance between the two is 0.3 m. We arrange the survey line along the x direction when y is equal to 0.37 m, and the distance between the survey points is 2 cm. The position of the survey line is shown in white in Figure 1. We obtain the FP-SPR data through forward simulation of the 3D model, and the normalized data can be represented as follow:
[ S ] = [ S V V S V H S H V S H H ] ,
where SVV, SHH, SVH, and SHV are the radar data in VV, HH, VH, and HV polarimetric modes, respectively. During the FP-SPR detection process on Mars, the signal artifacts generated by the system and the electromagnetic interaction between the system and the metallic rover are to be expected. We ignored the artifacts generated by the rover on the radar response in simulation, because the overall coupling between the full polarimetric radar antennas and the rover structure is minimized by adjusting the angle between the antenna element and the rover to 45° [22]. In addition, the SPR system was calibrated and tested on earth before launching, and the false reflections caused by the rover can be eliminated through the comparative analysis of the data of earth and Mars [23]. In addition to the interference from the rover and other instruments, Mars also oscillates, which affects the climate cycle. Mars contains an atmosphere and sometimes there are sandstorms, so the FP-SPR will also be disturbed by the Martian environment. Therefore, Gaussian noise is added into the normalized FP-SPR data to simulate the strong noise interference received by the radar in deep space exploration. The formula used to add noise is as follows:
S x y N = S x y m a x ( | S | ) + m a x ( | S | ) 10 S N R 20 · R a n d n ( 0 , 1 ) ,
where the S x y N and S x y represent the noise added signal and the original signal, respectively. x and y represent the polarimetric modes of receiving and transmitting electromagnetic waves, respectively. Randn(0,1) denotes the Gaussian noise with the mean and variance are 0 and 1, respectively. SNR is the signal-to-noise ratio (SNR) of the noise. In this text, the SNR is set to be 15. The noisy FP-SPR data can be expressed as:
[ S N ] = [ S V V N S V H N S H V N S H H N ] .
The noise added data are shown in Figure 2. In the radar profile of the co-polarization modes, only reflections from the stratum interfaces can be seen. In the cross-polarization modes, the response from the smooth interfaces is weaker than that of the co-polarization modes due to the weak polarization rotation effect. Under the strong noise interference, the effective reflection information is masked and difficult to be picked up directly from the acquired radar profile.
For the acquired noise added FP-SPR data, the preliminary processing including the direct wave removal and the weakening of surface reflections is performed. Bandpass filtering is used to weaken the high-frequency and low-frequency interference caused by background noise; Parameters for the filter included a low stopband cutoff frequency, a low passband cutoff frequency, a high passband cutoff frequency, and a high stopband cutoff frequency of 0.2, 0.6, 1.8, and 2.3 GHz. Then, the velocity analysis method is used to determine the interval velocity of each layer, and then the root mean square velocity of each depth position is obtained. The root mean square velocity is used for Kirchhoff integral migration to make the diffraction wave return to a diffraction point (Figure 3). After processing, FP-SPR data can be expressed in the following form:
[ S P ] = [ S V V P S V H P S H V P S H H P ] ,
where S V V P , S V H P , S H V P , and S H H P are the processed radar data in VV, HH, VH, and HV polarimetric modes, respectively. In our model, the ground surface is horizontal, so the reflection signal of the surface is lost after processing, but the arriving time of the ground surface can be obtained by the antenna height and the propagation velocity of electromagnetic wave in vacuum. The reflection information from the stratigraphic interface and some interlayer abnormal targets can be picked up from the radargrams of the co-polarization modes. It is difficult to pick up the positions of the reflective interfaces in the profile of cross-polarization. Bandpass filtering and Kirchhoff integral migration processing reduce the background noise, and the position information of the stratigraphic interface and reflector can be obtained from the profile. Since the data of the four polarization modes should contain the reflected signals from the anomalies, we can extract effective signals based on the correlation of the data to improve data quality.

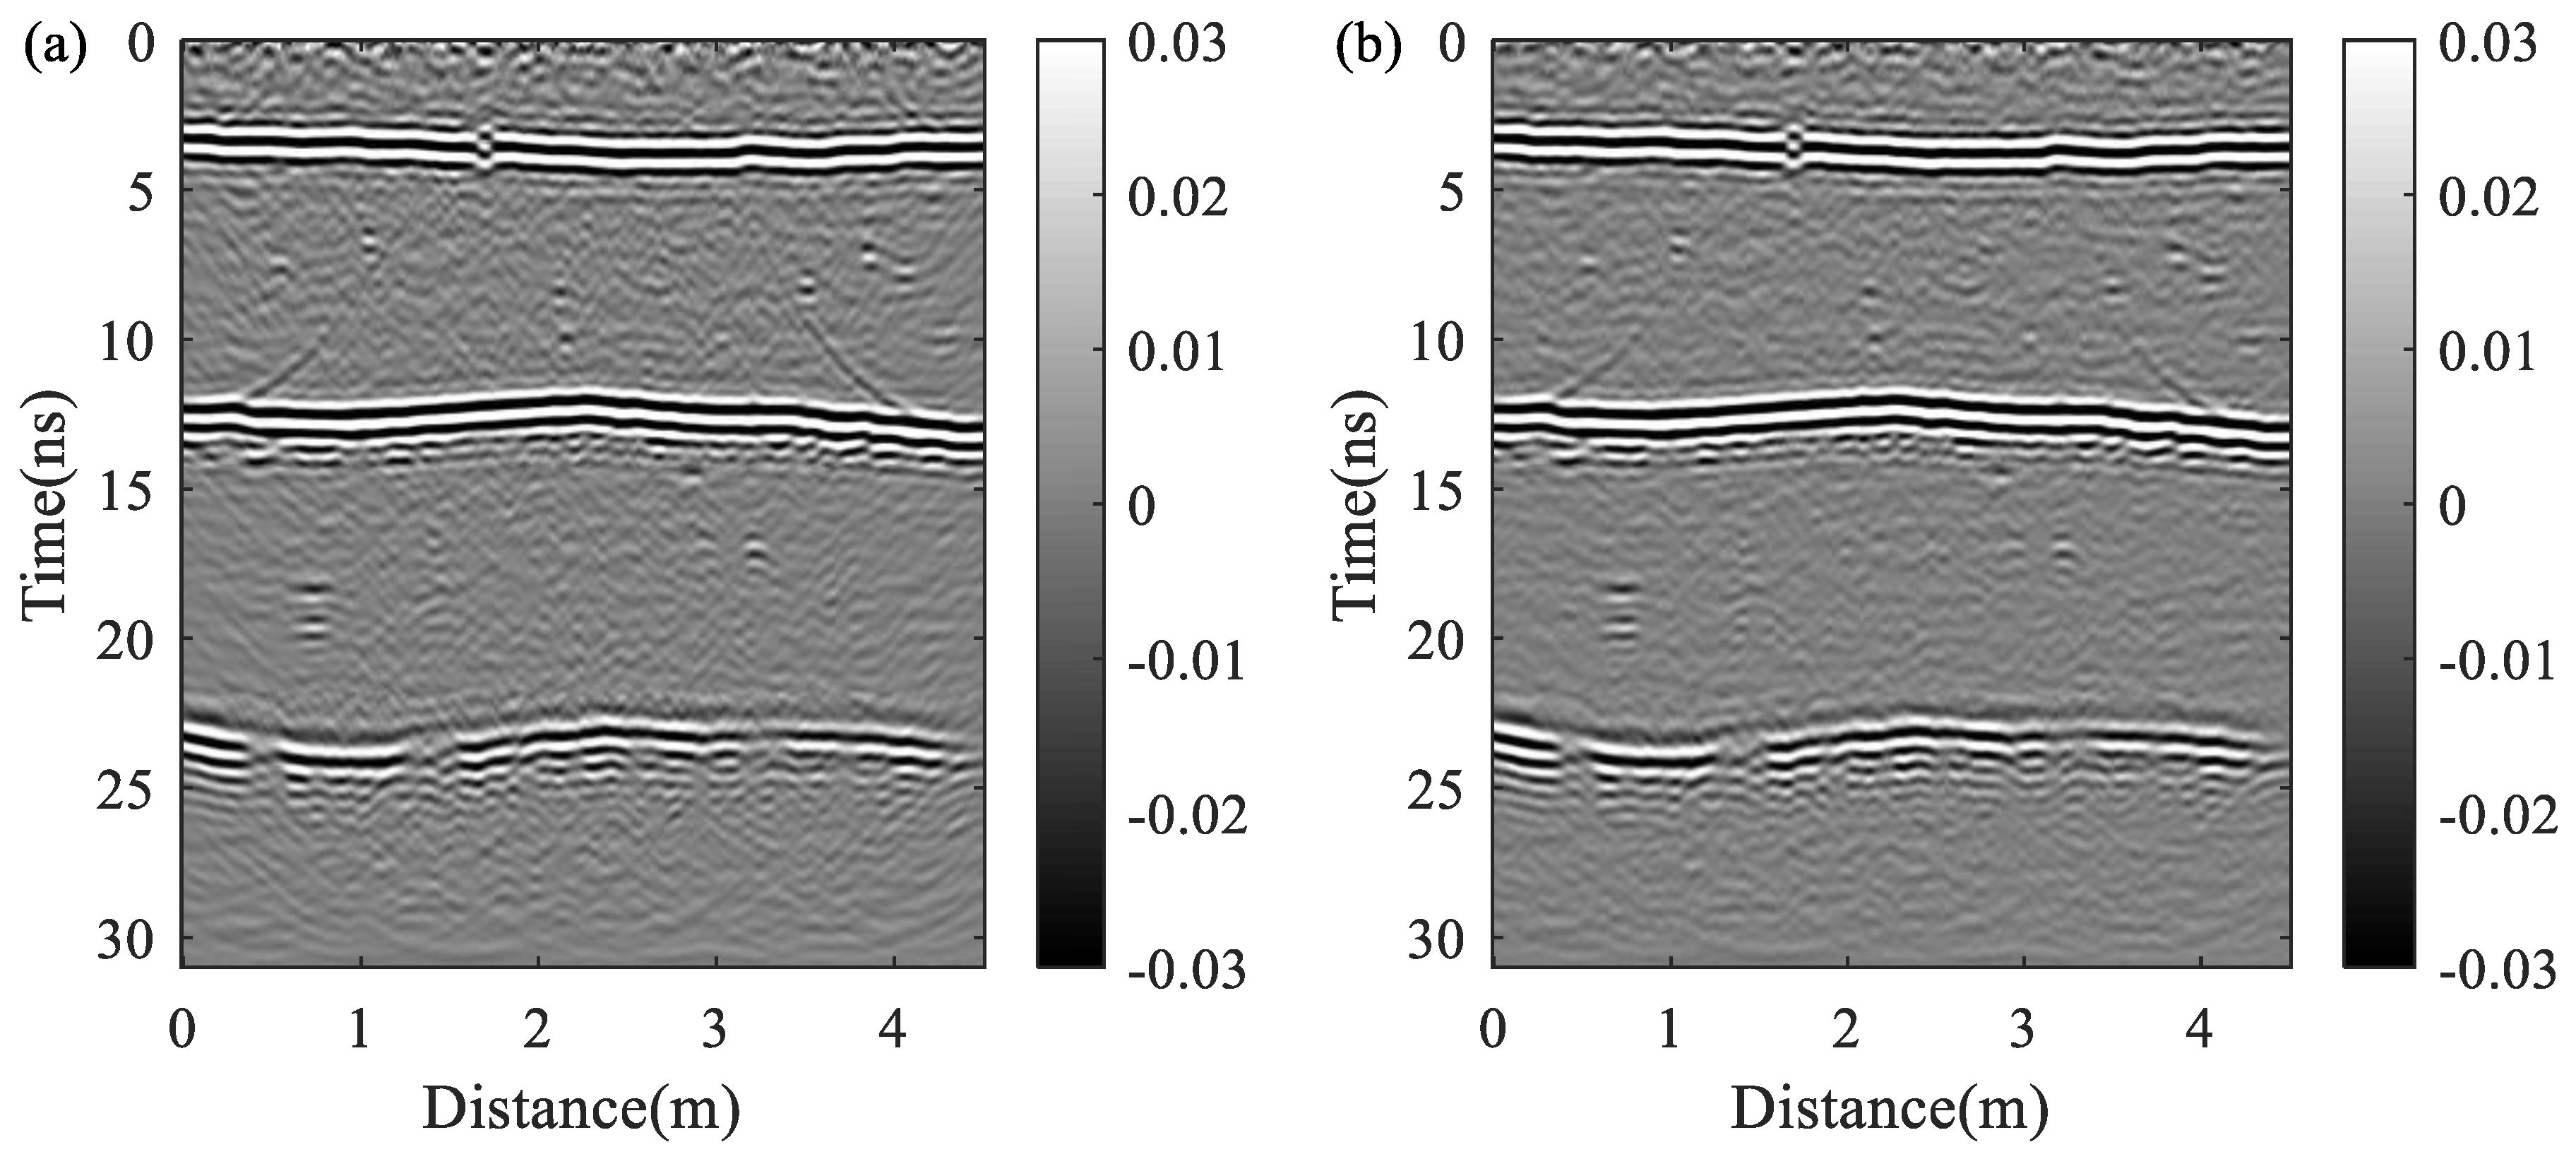
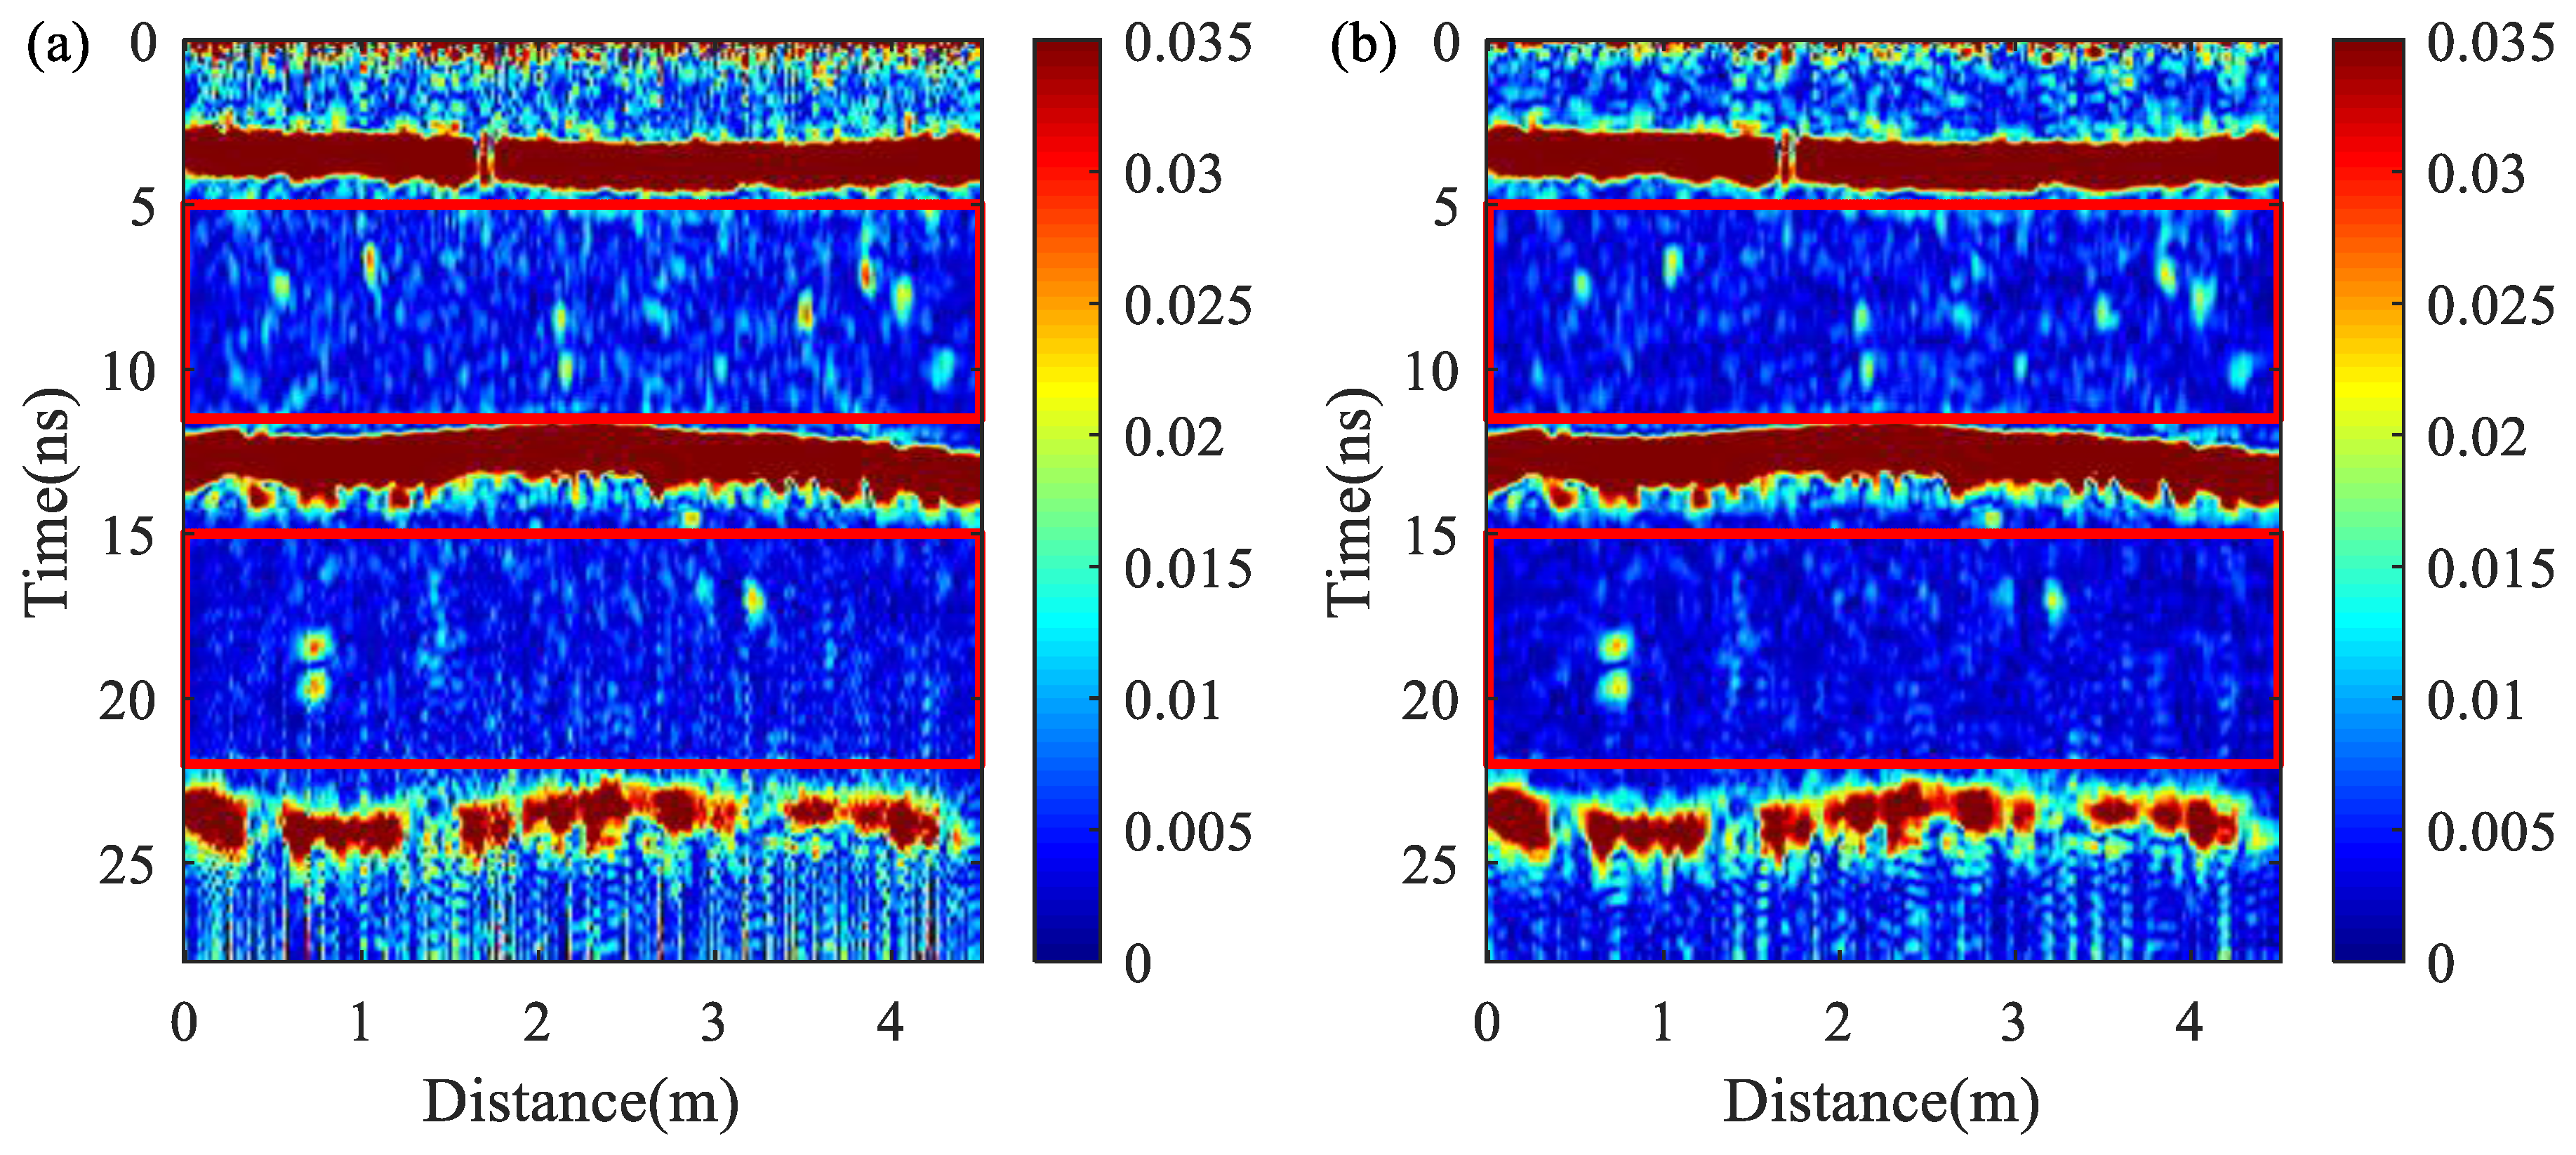
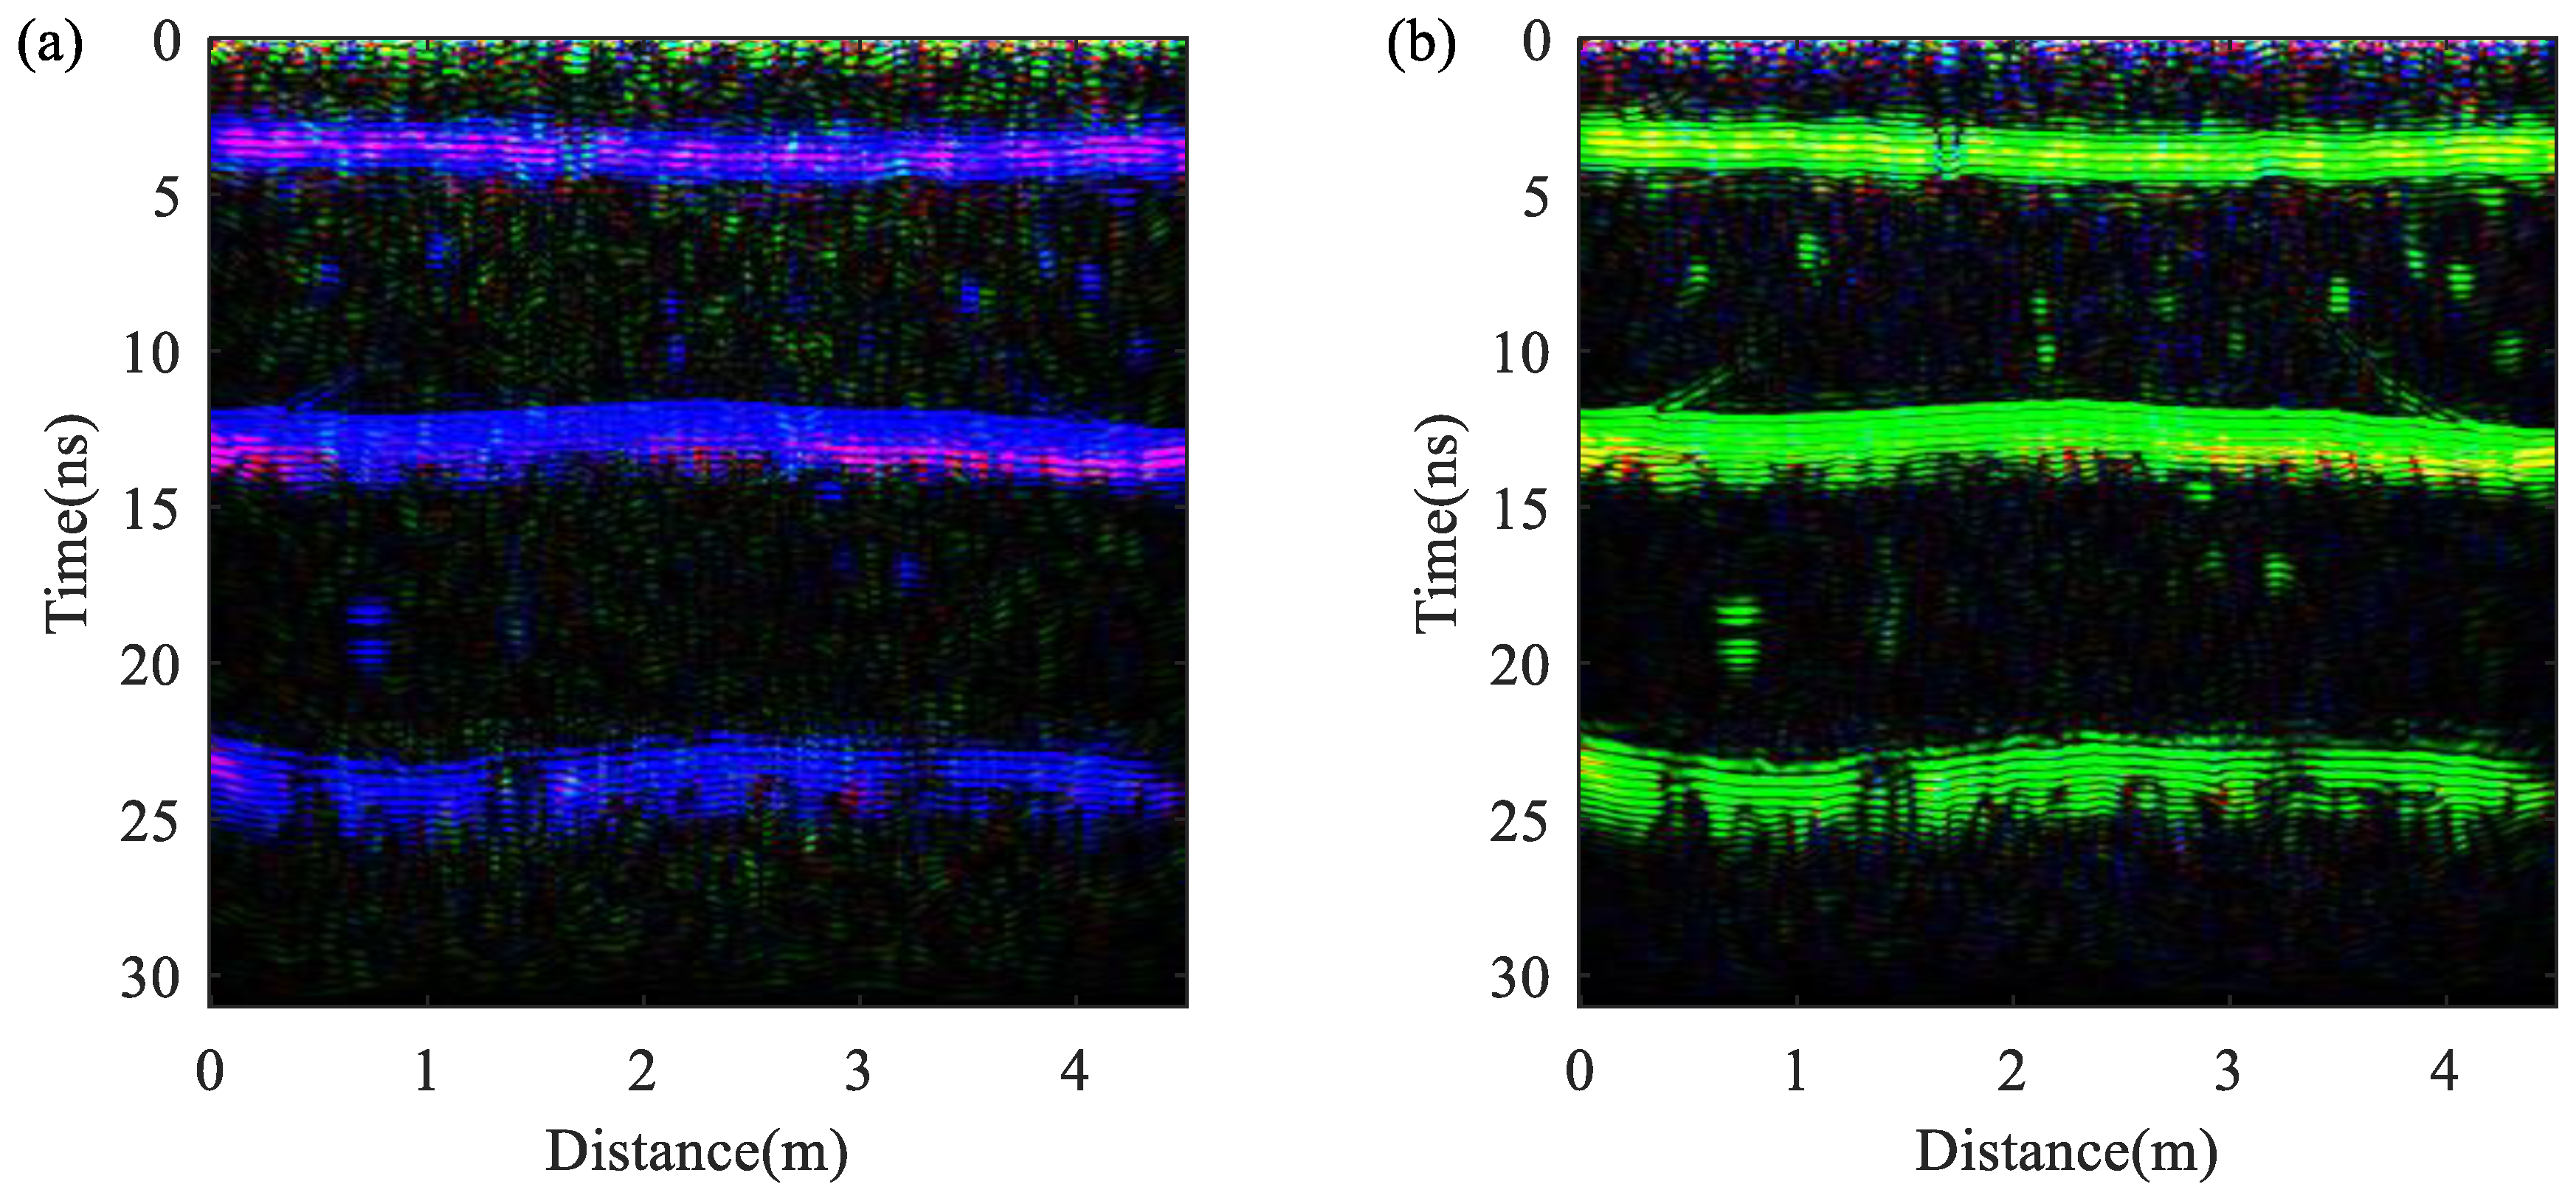
4. Extract Effective Reflection Signal Based on 2D-PCA

The principal component analysis (PCA) is a widely used feature extraction technique in the field of SAR, but the image matrices must be transformed into vectors previously, which will destroy the structure of the 2D SAR image [9]. The 2D-PCA method directly extracts features from 2D SAR image matrices, which can keep and extract the scattering information of the target.
{ S V V P , S H H P , S V H P , S H V P } is the imagery data set of m × n dimensions, X is the projection space represented by the n-dimensional column vector, and Y is the m-dimensional projection eigenvector that projects matrix S x y P to X [24]:
Y = S x y P X ,
where the S x y p represents the processed FP-SPR data, x and y represent the polarization mode of transmitter and receiver, respectively. In the 2D-PCA algorithm, the optimal projection vector X depends on the dispersion degree of the sample after projection. The higher the dispersion degree is, the stronger the resolution of the projection vector X to the samples is [24]. The trace of the covariance matrix constructed by projected features is introduced to measure the optimal projection vector X. The trace of covariance matrix is defined as follows:
J ( X ) = t r a c e ( S x )
where Sx denotes the covariance matrix of the projection feature vectors. The covariance matrix Sx can be expressed as:
S x = E ( Y E Y ) ( Y E Y ) T = E [ ( S x y P E S x y P ) X ] [ ( S x y P E S x y P ) X ] T .
Therefore,
J ( X ) = t r a c e ( S x ) = X T [ E ( S x y P E S x y P ) T ( S x y P E S x y P ) ] X .
The image covariance matrix G is defined as:
G = E [ ( S x y P E S x y P ) T ( S x y P E S x y P ) ] .
when X takes the eigenvector corresponding to the maximum eigenvalue of G, J(X) takes the maximum value. The covariance matrix G can be directly calculated from the original training image sample matrix by:
G = 1 4 [ ( S V V P S ¯ ) T ( S V V P S ¯ ) + ( S V H P S ¯ ) T ( S V H P S ¯ ) + ( S H V P S ¯ ) T ( S H V P S ¯ ) + ( S H H P S ¯ ) T ( S H H P S ¯ ) ] ,
where the notation T is the transposition operation; S ¯ represents the average of all matrices which is given by:
S ¯ = 1 4 ( S V V P + S H H P + S V H P + S H V P ) ,
and the image of S ¯ is shown in Figure 4a. Finally, J(X) is converted to:
J ( X ) = X T G X .
We can obtain the eigenvalues and eigenvectors of the covariance matrix G. The eigenvalues are arranged from large to small, and the eigenvectors corresponding to the first L eigenvalues are selected to form the projection space, X = [x1, x2, …, xL] (L < n), xi is the eigenvector corresponding to the eigenvalue, and each eigenvector is orthogonal to each other. In this text, the L is set to be 70. Such an optimal vector X can maximize J(X).
{ [ x 1 , x 2 , x L ] = a r g m a x J ( X ) x i T x j = 0 ,   i j , i , j = 1 , 2 , , L .
The reconstructed matrix S ˜ of the data set S ¯ can be evaluated by:
S ˜ = S ¯ X X T ,
and the profile is shown in Figure 4b. Comparing the reconstructed profile with the average profile after preliminary processing, it can be found that the 2D-PCA method retains the reflection information of the original image, makes the background smoother, and highlights the positions of the effective reflection signals.
In the field of ground penetrating radar, the instantaneous amplitude reflects the energy size and energy attenuation of the reflected signal at a given moment, which can infer the change of underground medium properties. Therefore, it can be used to highlight the change of medium. In order to analyze the denoising effect of the 2D-PCA method more clearly, the difference between them is further analyzed by instantaneous amplitude. The instantaneous amplitudes of the two profiles are shown in Figure 5. The image entropy (IE) is introduced to quantitatively analyze the denoising effect of 2D PCA which is given by:
I E = | m n | S ˜ ( m , n ) | 2 | 2 m n | S ˜ ( m , n ) | 4 ,
where m and n denote the vertical and horizontal size of the matrix. The larger IE value indicates the greater interference of noises [25]. In this text, the IE values before and after denoising are 4.79 × 10⁴ and 4.73 × 10⁴ within 5–11.5 ns, and 3.81 × 10⁴ and 3.14 × 10⁴ within 15–22 ns. After 2D PCA processing, the image entropy is reduced, the clutter is effectively minimized. Therefore, we have achieved the purpose of reducing the background noise and improve the data quality for subsequent analysis. These clearly imaged targets may be water ice blocks, so the application of 2D-PCA to FP-SPR data increases the imaging quality of suspected water ice targets.

5. Discussions

In this section, the denoising effects of 2D-PCA and Pauli decomposition are discussed. The processed FP-SPR data can form the scattering matrix shown in Formula (4). Since the antenna system satisfies the principle of reciprocity, VH and HV are regarded as the same polarization mode. So, SVH = SHV and the Formula (4) can be changed to (16).
[ S P ] = [ S V V P S V H P S V H P S H H P ] .
Pauli decomposition is a method of extracting polarization characteristics by defining different polarimetric basis matrices. Different polarimetric basis matrices represent different types of ground objects. The Pauli basis {[s]a, [s]b, [s]c} denotes single scattering mechanism, even scattering mechanism, and volume scattering mechanism, respectively, which can be represented by the following matrix:
[ S ] a = 1 2 [ 1 0 0 1 ] ,   [ S ] b = 1 2 [ 1 0 0 1 ] ,   [ S ] c = 1 2 [ 0 1 1 0 ] .
Based on the defined Pauli basis, the scattering matrix [ S P ] can be written as follows:
[ S P ] = α [ S ] a + β [ S ] b + γ [ S ] c ,
where α, β, and γ are the coefficients representing the contribution of [S]a, [S]b, and [S]c to [ S P ] , respectively [26]. They are given by:
α = S H H + S V V 2 , β = S H H S V V 2 , γ = 2 S V H .
Pauli decomposition is applied to the processed FP-SPR data set, and three parameters, α , β , and γ , are obtained. We fuse the above three parameters to draw the RGB image, in which single scattering is represented by blue, even scattering is represented by red, and volume scattering is represented by green, the result is shown in Figure 6a. It can be found that the subsurface scattering mechanism is dominated by single scattering. Both the stratum interfaces and interlayer reflectors present strong single scattering characteristics, which can be used to locate the underground anomalies; due to the influence of roughness added in the design of formation, the interfaces exhibit not only single scattering mechanism but also the phenomenon of even scattering; the entire profile contains weak volume scattering, and effective underground scattering information is not specified. This color assignment method can distinguish three scattering mechanisms in the image, but it is not clear enough to use blue to distinguish reflectors, so we use green to represent single scattering, red to represent even scattering, blue to represent volume scattering, and get the result shown in Figure 6b. In this image, the green single scattering conceals the other two scattering intensities, but the underground reflectors can be located more clearly.
Pauli decomposition extracts the effective reflection information from the profile based on the polarization properties of the target to achieve the purpose of denoising. 2D-PCA is a widely used feature extraction method. Compared with Pauli decomposition, its advantage lies in that it does not destroy the structure of the original profile, so that the reconstructed image retains the waveform information and can be further processed by other methods in the future. However, the extraction ability of the reflector is slightly weaker than that of the Pauli decomposition method, the background interference removal effect is weak, the difference between the energy cluster and the background amplitude is not obvious enough, and part of the strong interference also gathers in the form of energy clusters, which brings disturbance to artificial interpretation. Therefore, in the process of FP-SPR data processing, the choice should be based on the advantages of the two methods: choosing the Pauli decomposition method can pick up the underground reflection information more clearly; choosing the 2D-PCA method, the denoising ability is slightly weaker, but the structure of the original image is not destroyed, and the waveform signal in the profile is retained.

6. Conclusions

In this paper, a 3D realistic structure model is established and numerically simulated based on the possible subsurface structure of Utopia Planitia. Influencing factors such as topographical fluctuations, rough interfaces, rocks, and water ice are added to make the model more realistic. Then multiple 3D forward simulations are performed along the x direction at y = 0.37 m to obtain FP-SPR data. Gaussian noise is added to the data to simulate the background noise interference of the radar during patrol detection. Preliminary processing results show that the position of the formation interfaces and some interlayer reflectors can be identified in the co-polarization profile. However, since the polarization rotation effect of the cross-polarization mode on the smooth interface is weak, the effective signal in the cross-polarization profile is covered by background noise and is difficult to identify. Then, we introduced the 2D-PCA method to achieve the purpose of weakening the background noise and extracting the effective reflected signal. The reconstructed radar profile can more clearly image the underground targets, which contain the suspected water ice signal, so the application of 2D-PCA to FP-SPR data increases the imaging quality of suspected water ice targets. Finally, the denoising effects are discussed, Pauli decomposition has stronger ability to pick up reflectors; 2D-PCA has a weaker denoising effect, but it does not destroy the structure of the original profile, and can retain the waveform signal.

Author Contributions

Conceptualization, Y.W. and X.F.; data curation, Y.W.; formal analysis, Y.W., H.Z., Z.D., W.L., C.X. and X.L.; funding acquisition, X.F.; investigation, Y.W., X.F., H.Z. and Z.D.; methodology, Y.W., X.F., H.Z. and Z.D.; project administration, X.F.; resources, X.F.; software, Y.W.; supervision, X.F.; validation, Y.W. and Z.D.; visualization, Y.W., H.Z., X.F. and Z.D.; writing—original draft, Y.W. and H.Z.; writing—review and editing, Y.W., H.Z., X.F. and Z.D. All authors have read and agreed to the published version of the manuscript.

Funding

This work was funded by the National Key Research and Development Program of China under Grant 2018YFC1503705, and Aerospace Information Research Institute Chinese Academy of Science, the special fund of Key Laboratory of Geo-Exploration Instruments, Ministry of Education under Grant 3S2190230537.

Data Availability Statement

The data is generated during the study which can be obtained by contacting the corresponding author.

Conflicts of Interest

The authors declare no conflict of interest.

References

  1. Wan, W.; Wang, C.; Li, C.; Wei, Y. China’s first mission to Mars. Nat. Astron. 2020, 4, 721. [Google Scholar] [CrossRef]
  2. Ye, P.; Sun, Z.; Rao, W.; Meng, L. Mission overview and key technologies of the first Mars probe of China. Sci. China-Technol. Sci. 2017, 60, 649–657. [Google Scholar] [CrossRef]
  3. Zhou, B.; Shen, S.; Lu, W.; Liu, Q.; Tang, C.; Li, S.; Fang, G. The Mars rover subsurface penetrating radar onboard China’s Mars 2020 mission. Earth Planet Phys. 2020, 4, 345–354. [Google Scholar] [CrossRef]
  4. Clifford, S.; HILLEL, D. The stability of ground ice in the equatorial region of Mars. J. Geophys. Res. Solid Earth 1983, 88, 2456–2474. [Google Scholar] [CrossRef]
  5. Mellon, M.; Jakosky, B. The distribution and behavior of Martian ground ice during past and present epochs. J. Geophys. Res. Planet 1995, 100, 11179–11781. [Google Scholar] [CrossRef] [Green Version]
  6. Zhang, L.; Zeng, Z.; Li, J.; Huang, L.; Huo, Z.; Wang, K.; Zhang, J. Parameter Estimation of Lunar Regolith from Lunar Penetrating Radar Data. Sensors 2018, 9, 2907. [Google Scholar] [CrossRef] [Green Version]
  7. Su, Y.; Fang, G.; Feng, J.; Xing, S.; Ji, Y.; Zhou, B.; Gao, Y.; Han, L.; Dai, S.; Xiao, Y.; et al. Data processing and initial results of Chang’e–3 lunar penetrating radar. Res. Astron. Astrophys. 2014, 14, 1623–1632. [Google Scholar] [CrossRef]
  8. Zhang, L.; Li, J.; Zeng, Z.; Xu, Y.; Liu, C.; Chen, S. Stratigraphy of the Von Kármán crater based on Chang’E-4 lunar penetrating radar data. Geophys. Res. Lett. 2020, 47, e2020GL088680. [Google Scholar]
  9. Pei, J.; Huang, Y.; Huo, W.; Wu, J.; Yang, J.; Yang, H. SAR imagery feature extraction using 2DPCA–based two–dimensional neighborhood virtual points discriminant embedding. IEEE J. Sel. Top. Appl. Earth Observ. Remote Sens. 2016, 9, 2206–2214. [Google Scholar] [CrossRef]
  10. Tanaka, K.; Robbins, S.; Fortezzo, C.; Skinner, J.; Hare, T. The digital global geologic map of Mars: Chronostratigraphic ages, topographic and crater morphologic characteristics, and updated resurfacing history. Planet Space Sci. 2014, 95, 11–24. [Google Scholar] [CrossRef]
  11. Meng, X.; Xu, Y.; Xiao, L.; Xiao, Z. Permittivity estimation of subsurface deposits in the Elysium–utopia region on Mars with MRO shallow radar sounder data. Astron. J. 2020, 159, 156. [Google Scholar] [CrossRef]
  12. Kreslavsky, M.; Head, J. Mars: Nature and evolution of young latitude–dependent water–ice–rich mantle. Geophys. Res. Lett. 2002, 29, 1719. [Google Scholar] [CrossRef] [Green Version]
  13. Smith, I.; Putzig, N.; Holt, J.; Phillips, R. An Ice Age recorded in the polar deposits of Mars. Science 2016, 352, 1075–1078. [Google Scholar] [CrossRef] [Green Version]
  14. Costard, F.; Sejourne, A.; Kargel, J.; Godin, E. Modeling and observational occurrences of near–surface drainage in Utopia Planitia, Mars. Geomorphology 2016, 275, 80–89. [Google Scholar] [CrossRef]
  15. Hass, G.; Saunders, W.; Miller, J.; Dale, M. Bearded profile with avian headdress within the southeast–facing slope of an impact crater in the Utopia Planitia region of Mars. J. Space Explor. 2016, 5, 1–27. [Google Scholar]
  16. Leuschen, C.; Clifford, S.; Gogineni, P. Simulation of a surface–penetrating radar for Mars exploration. J. Geophys. Res. Planets 2003, 108, 8035. [Google Scholar] [CrossRef]
  17. Bandfield, J.; Hamilton, V.; Christensen, P. A global view of Martian surface compositions from MGS–TES. Science 2000, 287, 1626–1630. [Google Scholar] [CrossRef] [Green Version]
  18. Leuschen, C.; Gogineni, S.; Clifford, S.; Raney, R. Simulation and design of ground-penetrating radar for Mars exploration. In IGARRS 2001. Scanning the Present and Resolving the Future, Proceedings of IEEE 2001 International Geoscience and Remote Sensing Symposium, Sydney, Australia, 9–13 July 2001; IEEE: Sydney, Australia, 2001. [Google Scholar]
  19. Jin, Y.; Fa, W.; Xu, F. Overview of the advance for Mars exploration using microwave remote sensing. Chin. J. Space Sci. 2008, 264–272. [Google Scholar] [CrossRef]
  20. Zhang, L.; Zeng, Z.; Li, J.; Lin, J.; Hu, Y.; Wang, X.; Sun, X. Simulation of the lunar regolith and Lunar–Penetrating radar data processing. IEEE J. Sel. Top. Appl. Earth Observ. 2018, 11, 655–663. [Google Scholar] [CrossRef]
  21. Feng, X.; Zou, L.; Liu, C.; Lu, Q.; Liang, W.; Li, L.; Wang, S. Forward modeling for full–polarimetric ground penetrating radar. Chin. J. Geophys. Chin. Ed. 2011, 54, 349–357. [Google Scholar]
  22. Valérie, C.; Charlotte, C.; Dirk, P.; Philippe, C.; Stephen, M.; Hamran, S. Wisdom GPR designed for shallow and High–Resolution sounding of the Martian subsurface. Proc. IEEE 2011, 99, 824–836. [Google Scholar]
  23. Li, C.; Xing, S.; Lauro, S.; Su, Y.; Dai, S.; Feng, J.; Cosciotti, B. Pitfalls in GPR data interpretation: False reflectors detected in lunar radar cross sections by Chang’e–3. IEEE Trans. Geosci. Remote Sens. 2018, 56, 1325–1335. [Google Scholar] [CrossRef]
  24. Yang, J.; Zhang, D.; Frangi, A.; Yang, J. Two–dimensional PCA: A new approach to appearance–based face representation and recognition. IEEE Trans. Pattern Anal. Mach. Intell. 2004, 26, 131–137. [Google Scholar] [CrossRef] [Green Version]
  25. Zhou, H.; Feng, X.; Ding, C.; Dong, Z.; Liu, C.; Zhang, Y.; Meng, Z. Yutu-2 Radar Sounding Evidence of a Buried Crater at Chang’E-4 Landing Site. IEEE Trans. Geosci. Remote Sens. 2021. [Google Scholar] [CrossRef]
  26. Feng, X.; Yu, Y.; Liu, C.; Michael, F. Subsurface polarimetric migration imaging for full polarimetric ground–penetrating radar. Geophys. J. Int. 2015, 202, 1324–1338. [Google Scholar] [CrossRef] [Green Version]
Figure 1. The 3D realistic structure model of Utopia Planitia.
Remotesensing 13 02685 g001
Figure 2. Profiles of noise added FP-SPR data. (a) VV mode. (b) HH mode. (c) VH mode. (d) HV mode.
Remotesensing 13 02685 g002
Figure 3. Profiles of preliminary processed FP-SPR data. (a) VV mode. (b) HH mode. (c) VH mode. (d) HV mode.
Remotesensing 13 02685 g003
Figure 4. 2D-PCA denoising effect comparison. (a) Average profile of FP-SPR data after Kirchhoff integral migration processing. (b) Profile reconstructed by 2D-PCA.
Remotesensing 13 02685 g004
Figure 5. Instantaneous amplitude profiles. (a) Original profile. (b) 2D-PCA processing results.
Remotesensing 13 02685 g005
Figure 6. The RGB image obtained by Pauli decomposition. (a) The single scattering mechanism is shown in blue. (b) The single scattering mechanism is shown in green.
Remotesensing 13 02685 g006
Table 1. Parameters of the 3D realistic structure model.
InterfacesTypesRange of Fluctuation (m)
Regolith surface±0.02
Eolian sediment (dry/icy)±0.03
Ice-bearing eolian sediment/ Basalt formation±0.05
Rocks &
Water ice
TypesQuantityDiameter (m)Relative permittivity
Rocks210.05–0.353.50
Water ice30.10–0.303.15
LayersTypesDepth (m)Relative Permittivity
Regolith0–0.102.4
Dry eolian sediment0.10–0.852.8
Ice-bearing eolian sediment0.85–1.555.1
Ice-bearing basalt formation1.55–2.006.9
Publisher’s Note: MDPI stays neutral with regard to jurisdictional claims in published maps and institutional affiliations.

