
A Validated and Accurate Method for Quantifying and Extrapolating Mangrove Above-Ground Biomass Using LiDAR Data


School of Earth, Atmospheric and Life Sciences, University of Wollongong, Wollongong, NSW 2522, Australia
*
Author to whom correspondence should be addressed.
Remote Sens. 2021, 13(14), 2763; https://0-doi-org.brum.beds.ac.uk/10.3390/rs13142763
Submission received: 12 May 2021
/
Revised: 25 June 2021
/
Accepted: 30 June 2021
/
Published: 14 July 2021
(This article belongs to the Special Issue Ensuring a Long-Term Future for Mangroves: A Role for Remote Sensing)
Abstract
:LiDAR data and derived canopy height models can provide useful information about mangrove tree heights that assist with quantifying mangrove above-ground biomass. This study presents a validated method for quantifying mangrove heights using LiDAR data and calibrating this against plot-based estimates of above-ground biomass. This approach was initially validated for the mangroves of Darwin Harbour, in Northern Australia, which are structurally complex and have high species diversity. Established relationships were then extrapolated to the nearby West Alligator River, which provided the opportunity to quantify biomass at a remote location where intensive fieldwork was limited. Relationships between LiDAR-derived mangrove heights and mean tree height per plot were highly robust for Ceriops tagal, Rhizophora stylosa and Sonneratia alba (r2 = 0.84–0.94, RMSE = 0.03–0.91 m; RMSE% = 0.07%–11.27%), and validated well against an independent dataset. Additionally, relationships between the derived canopy height model and field-based estimates of above-ground biomass were also robust and validated (r2 = 0.73–0.90, RMSE = 141.4 kg–1098.58 kg, RMSE% of 22.94–39.31%). Species-specific estimates of tree density per plot were applied in order to align biomass of individual trees with the resolution of the canopy height model. The total above-ground biomass at Darwin Harbour was estimated at 120 t ha−1 and comparisons with prior estimates of mangrove above-ground biomass confirmed the accuracy of this assessment. To establish whether accurate and validated relationships could be extrapolated elsewhere, the established relationships were applied to a LiDAR-derived canopy height model at nearby West Alligator River. Above-ground biomass derived from extrapolated relationships was estimated at 206 t ha−1, which compared well with prior biomass estimates, confirming that this approach can be extrapolated to remote locations, providing the mangrove forests are biogeographically similar. The validated method presented in this study can be used for reporting mangrove carbon storage under national obligations, and is useful for quantifying carbon within various markets.
1. Introduction
Mangrove forests have amongst the highest carbon storage of any ecosystem [1]. Known as blue carbon, due to its connection to marine environments, mangrove carbon may play an important role in mitigating climate change by sequestering atmospheric carbon within living biomass and storing decomposing material within substrates. Whilst the bulk of mangrove carbon storage is below-ground within roots and muddy substrates, the carbon storage in mangrove above-ground biomass is significant and comparable to above-ground carbon storage of terrestrial forests. Quantifying this above-ground carbon storage is critical for leveraging the capacity of mangrove carbon storage to contribute to climate change mitigation efforts.
Traditionally, above-ground biomass has been calculated initially using destructive methods, often with the objective of developing allometric relationships that describe biomass at the plot level and based on field measurements such as diameter at breast height (DBH), tree height (H), tree density, and wood gravity [2,3]. Plot based estimates are then extrapolated on the basis of area to estimate total above-ground biomass for a forest [4,5]. However, this traditional approach may not provide the necessary precision for the inclusion of mangrove carbon within market-based carbon off-setting mechanisms. Field-based measurements of mangrove structural parameters are resource intensive and dependent upon plot-based estimates adequately describing the variation in mangrove structural parameters. This can be particularly difficult when tree heights are beyond the range whereby direct measurements using standard field equipment (e.g., measuring poles and range finders) can be effectively used [6]. Accordingly, and for pragmatic reasons, many allometric relationships that have been developed do not incorporate mangrove height as a parameter; this is despite evidence indicating greater accuracy when height, DBH, and wood gravity are parameterized [3].
Remotely sensed data that describes mangrove structure may address these limitations in using field-based approaches to estimate above-ground biomass. Active sensors, such as LiDAR and Radar, have been used to estimate above-ground biomass using various approaches in regions with low and highly productive mangroves, including Malaysia, French-Guiana Amazon, and Africa [7,8,9,10,11,12,13,14,15,16,17,18,19,20]. However, some difficulty remains when calibrating allometric approaches that have been developed for individual trees to remotely sensed products that have a defined resolution that differs from the areal coverage of individual trees [6]. High resolution analyses of individual mangrove trees have been successfully undertaken using terrestrial laser scanning to quantify tree volume, structure, and above-ground biomass [21,22,23,24], and may perform better than estimates derived from allometry [23]. ntegration of these non-destructive remote-sensing approaches for estimating individual of plot-level biomass may improve relationships between biomass and LiDAR data at the scale of a forest.
This study builds upon an approach that used relationships between LiDAR return signals and plot-based estimates of above-ground biomass derived from field measurements of structural parameters to improve estimates of mangrove forest above-ground biomass and carbon storage [6]. The previous study was undertaken at Guarás Island, Brazil, located on the coast near the mouth of the Amazon River. Mangroves at this site are dominated by three species of the Atlantic East Pacific region, with large variation in tree height due to the productivity of the forest. These factors improved the capacity of field-based measurements to adequately describe variation in structural parameters, and subsequently increased the likelihood that LiDAR-derived above-ground biomass estimates were accurate and well-validated [6].
The overall aim of the current study was to advance the LiDAR technique undertaken in Brazil [6] by focusing on a location dominated by mangroves of the Indo-West Pacific biogeographic region, and in doing so, confirm that LiDAR data can be used to estimate mangrove above-ground biomass in a range of climatic, biogeographic, and geomorphological settings. Accordingly, this study intentionally focuses on the tropical mangroves of Darwin Harbour, Australia, where mangroves occupy a drowned river valley exposed to a macrotidal regime and exhibit marked community zonation [25]. Additionally, this study also assesses whether it is feasible to extrapolate relationships between LiDAR data and field-based structural measurements from one location to another location with similar mangrove species diversity and structure, as this provides the means to estimate mangrove biomass at locations. This was undertaken because access to undertake field-based mangrove structural measurements may often be limited; however, extrapolation of relationships with LiDAR data may overcome this limitation. The ability to extrapolate relationships was specifically undertaken at the West Alligator River, located 165 km east of Darwin Harbour, which, despite being a different geomorphological setting (i.e., tide-dominated river at West Alligator River, drowned ria valley at Darwin Harbour), does exhibit similar species composition and climate, and was expected to exhibit similar structural diversity as Darwin Harbour. The specific objectives of this study were to:
- Collect field data of mangrove structure at Darwin Harbour as a training set to model relationships with remotely sensed LiDAR data;
- Establish optimal relationships between field-derived mangrove structural measurements and remotely sensed data describing mangrove structure;
- Validate relationships against field-based validation data;
- Apply optimal relationships to LiDAR data, estimate mangrove above-ground biomass at Darwin Harbour, and compare with published estimates of mangrove above-ground biomass [26]; and
- Extrapolate relationships to the West Alligator River and compare with published estimates of mangrove above-ground biomass.
It is anticipated that this study will provide a validated workflow for using LiDAR data to estimate mangrove above-ground biomass at a site with reasonable access to generate training and validation datasets, and proximal locations where fieldwork may be limited by resources or access. This workflow will form the basis of a validated method for estimating mangrove above-ground biomass at a ground resolution of 100 m2.
2. Materials and Methods
2.1. Study Sites
2.1.1. Darwin Harbour, Northern Territory, Australia
Darwin Harbour (Figure 1c) is reported to support 204 km2 of mangroves [5] within a relatively stable drowned river valley or ria [25]. Three rivers drain into Darwin Harbour; the Elizabeth River drains the East Arm and Middle Arm mangroves, while the Darwin and Blackmore Rivers drain the West Arm mangroves [27,28,29,30,31]. Darwin Harbour has a maximum spring tidal range of 7.5 m, and the tidal range varies between a mean spring tidal range of 5.5 m and a mean neap tidal range of 1.9 m [32]. The frequency of tidal inundation is significantly correlated with the distribution of mangrove communities [29].
Mangrove species diversity, variation in tree density and structure are reportedly high [26]; however, species assemblages have been identified to occur in geomorphologically defined units [31]. This formed the basis of high resolution mapping of mangrove communities from aerial photography and an extensive field campaign [5], and subsequent zonation mapping from Landsat imagery [25]. Striking species zonation arises as a result of variations in salinity and inundation [27,29,31,33]. Sonneratia alba, Rhizophora stylosa, and Ceriops tagal (C.T. White Bailment, T.J. Sm., and J.A. Stoddart, respectively) dominate the canopy and there is very little understorey evident at Darwin Harbour. S. alba grows to heights of up to 12 m and occurs at locations where they are inundated on most tides near mean sea level. R. stylosa dominates tidal creeks, growing to heights of up to 16 m, and A. marina has been noted to emerge from R. stylosa dominated canopies [34]. A tidal flat zone has been noted to occur and landward of this C. tagal occurs in dense thickets extending to heights of 6 m. The species Brugueira exaristata Ding Hou, B. parviflora (Roxb, Wight, and Arn. Ex. Griffith, respectively), and Avicennia marina (Forssk. Vierh) are also reasonably extensive, and often occur with C. tagal [5,25,31]. Field-based estimates of mangrove above-ground biomass report an average density of 120 t ha−1 and high biodiversity of 32 species occurring in this region [26]. For the last 20 years, this area has not suffered excessive deforestation [12].
2.1.2. West Alligator River, Northern Territory, Australia
The West Alligator River is located approximately 165 km east of Darwin Harbour. The estuary of the West Alligator River has a macro-tidal regime with mixed semi-diurnal tides. The estuary drains into Van Diemans Gulf and has a tidal range of 6 m at its entrance [35]. The mangroves are conserved in the world heritage listed Kakadu National Park [28]. Within Kakadu National Park, mangroves are primarily located along the coastal margins and the tide-dominated estuaries of the East, South, and West Alligator and Wildman Rivers and Field and Barrow Island, and occupy an area of approximately 183.4 km2. The mangroves are most extensive and tallest along the banks of the West Alligator River. The river is a mature tide-dominated estuary that is positioned on the low-lying coastal and estuarine floodplains. The Holocene distribution of mangroves in this region has been used to confirm the evolution of the estuary from its immature stages when sea level stabilized approximately 7000 years ago, through a phase where mangroves dominated, known as the ‘big-swamp’ phase. Now the mangroves are less extensive, but remain a significant component of the West Alligator River’s ecology [36].
Dominant mangrove species include A. marina, R. stylosa, and S. alba, and some saltmarsh species occupy the hypersaline tidal flats adjacent to the mangroves [37]. Mangroves exhibit distinct zonation that relates to the geomorphology, with S. alba occupying the seaward zone, R. stylosa occupying the central intertidal zone, and A. marina occupying the landward zone, although some A. marina occur in the seaward zone [38]. Both seaward and landward expansion of mangroves have been documented throughout Kakadu National Park from analyses of Landsat observations from 1987 onwards [39]. However, mangrove expansion was arrested when dieback was reported in 2015. This dieback occurred at a time with coincident higher air and ocean temperatures, lower rainfall, and a drop in sea level associated with the positive phase of the Indian Ocean Dipole and the negative phase of the El Niño Southern Oscillation [29,38]. Much of this dieback has been restricted to A. marina occupying higher elevations within the landward zone that has been expanding since 1987.
2.2. Study Approach, LiDAR Data, and Processing
The workflow for this study is provided in Figure 2 and included LiDAR processing, field-based measurements of mangrove forest characteristics, and model development.
LiDAR overflights were conducted at Darwin Harbour in December 2009, within 2 h of low tide to ensure measurements were not impeded by tidal influences (Table 1). LiDAR overflights of the West Alligator River were conducted in October–November 2011. The reported horizontal accuracy of the survey was 0.8 m [41]. A Leica ALS60 was used, which provided 0.5 m resolution and 4903 tiled files [42].
The full waveform LiDAR data were used to generate two data products, namely: a digital surface model (DSM) indicating landform surface elevations and a canopy height model (CHM) to indicate mangrove tree heights. A preliminary DSM was created using the LiDAR data; however, as a result of issues with the classification of last-return signals and surface interpolation, a decision was made to use the digital elevation model for Darwin Harbour developed by Geosciences Australia [43]. These difficulties can arise from last-return signals not reaching the substrate because of the presence of dense root structures, particularly within cells dominated by R.stylosa and C.tagal The DSM maximum height was initially created by selecting the highest return signals and creating a surface using the binning interpolation technique with a resolution of 10 m [39]. A CHM was subsequently created by subtracting the Geosciences Australia (5 m) developed DEM from the DSM, which indicated the maximum tree height within a cell of 100 m2; this product was subsequently termed CHMmax.
A pit-free CHM was also generated using the method of Khosravipour et al. [44], which applies an algorithm to remove pits that are generated when the LiDAR laser penetrates canopies. This technique has been shown to significantly improve tree detection and involves the normalization of all LiDAR return points against the height of the substrate, which is estimated using a triangulated-irregular network (TIN) interpolation applied to the last return signals. An initial CHM was created by applying a TIN interpolation to the highest returns of the height normalized data, and converting this to a rasterized surface. Subsequent CHMs were also created by selecting points >1 m in height to remove any returns associated with roots, applying a TIN interpolation, and rasterizing the surface. All rasterized surfaces were stacked and the maximum value within each cell was used to generate the pit-free CHM, subsequently termed CHMpf.
Relating above-ground biomass from individual trees to a CHM derived from a LiDAR point cloud has limited the wider application of LiDAR data to assess biomass [6]. Selecting field-based plot sizes that matched the resolution of the CHM cell size resolved the problem of scaling above-ground biomass from individual trees. To ensure that the CHM resolution corresponded to the size of field-based plots, each surface was rasterized to a resolution of 100 m2. Additional care was taken to confirm that mean plot-based estimates of H, DBH, and density, as well as the total AGB per plot, were similar to values previously reported for Darwin Harbour [5]. Justification of the decision to use 10 m × 10 m plots is provided in Section 2.4.
2.3. Classifying Species Distribution
Maps of species distribution at both study sites were developed using high and low-tide composite images and validated in advance of estimating above-ground biomass. These composite images were created from Landsat scenes from the archive in DEA that correspond to the highest 10% and lowest 10% of tides at each location. Using tidal composite images has been shown to improve capacity to differentiate communities [25], and this is because tidal inundation regimes have a significant influence on mangrove zonation. Leveraging the influence of water and sediments within reflectance signatures therefore improves differentiation of species that are inundated more or less frequently. Maps of dominant species distribution were generated at the same resolution as Landsat imagery, that is, approximately 25 m. These maps relied upon using the spectra to assign to a class based on the dominant species that emerged at the canopy; cells with a mixed spectral signal generally comprised C. tagal and other species, and were therefore assigned the class of “Mixed Ceriops”. Dominant species distribution maps were used to limit the extent of outputs that corresponded to each species.
2.4. Field-Based Measurements of Mangrove Forest Characteristics
Previous studies of mangrove biomass in the region used plot sizes of 5 m × 5 m, 10 m × 10 m, or 20 m × 20 m [26,40]. Preliminary scoping of the study site confirmed that tree density within plots dominated by S. alba or R. stylosa were representative within plots of 10 m × 10 m. Plots of 10 m × 10 m provided the benefit of aligning with the resolution of generated CHMs, and facilitated developing relationships between field estimates of above-ground biomass and the CHM. Plots of 20 m × 20 m would significantly increase fieldwork effort. As an objective of using LiDAR data was to reduce fieldwork effort, a decision was made prior to undertaking fieldwork that plot sizes would equal or easily scale to the size of cells within generated CHMs. The density of trees in plots dominated by C. tagal was remarkably high, and to reduce effort, plots dominated by this species were reduced to 5 m × 5 m, which is consistent with other field campaigns undertaken in the region [40]. Density and above-ground biomass estimates were quadrupled to correspond to the area of plots dominated by R. stylosa and S. alba. Selecting plots sizes that scaled to the same resolution as rasterized surfaces resolved issues associated with transposing above-ground biomass of individual trees of varying canopy coverage to cells on a CHM of a defined area [6]. Additional care was taken to confirm that mean plot-based estimates of H, DBH, and density, as well as the total AGB per plot, were similar to the values previously reported for Darwin Harbour [5].
CHMmax was used to guide selection of plots, with the objective to select plots across the range of mangrove above-ground biomass and height gradients for the principal species at Darwin Harbour. This was achieved by using species distribution mapping as a mask to select all points associated with each species, and then randomly extracting 10,000 LiDAR points; these points were used to generate a frequency distribution histogram and to characterize tree height variation and range. Morans index was applied to the data to test for spatial autocorrelation (I = 0.99 for all species combined). Both Morans index and the frequency distribution histogram were used to identify optimal locations for field-based plots.
Transposing field estimates of above-ground biomass from individual trees to a cell of an explicit resolution requires advance consideration. Some studies have addressed this by selecting individual trees from a CHM, whilst others have applied a tree density factor to ensure above-ground biomass of individual trees can be scaled to the resolution of cells in a CHM. Previous work undertaken in Brazil applied an average tree density factor to each cell to transpose biomass from individual trees to a cell [6]. In this study, a decision was made in the field-work stage to size plots to ensure that total biomass per plot could be established. Hence, plot size equaled or could be scaled to match CHM resolution, and plots were co-located both in the field and on the CHM. Plots were established on the basis of species composition: species with high density per plot plot were characterized in plots of 25 m2 (i.e., C. tagal), whilst other species were characterized in plots of 100 m2 (i.e., R. stylosa and S. alba). As mangrove canopies can be dense, the use of a real time kinematic (RTK)-GPS can be limited. Consequently, a decision was made to use differential GPS (DGPS) to geo-locate plot centroids and a hand-held GPS was used to register the corners of plots. DGPS measurements produced a root mean square error (RMSE) of 5 cm.
Within each plot, height (H) and diameter at breast height (DBH) were measured for each individual, and the number of trees per plot was determined to provide an indication of tree density. A Nikon Laser Rangefinder Pro was used to quantify tree heights for trees >5 m, whilst a surveying staff was used to quantify height for trees <5 m. DBH was quantified using a metric measuring tape. The density of trees within plots was also determined, and while this variable was not used to model above-ground biomass, it does provide an indication of the canopy consistency. It was anticipated that this variable would provide more confidence in our estimates of field-based above-ground biomass per plot.
Above-ground biomass for R. stylosa and C. tagal was determined using allometric equations developed for mangroves of Darwin Harbour [45], as it was expected that these allometric equations would be superior. Previous studies have confirmed that allometric equations derived for the same species, structurally similar vegetation, and within the same climatic/bio-region provide superior accuracy [46]. As an allometric equation for S. alba has not been generated for Darwin Harbour [45], an allometric equation generated for the same species in Indonesia was selected [47]. The equations used to quantify above-ground biomass (AGB) in plots are:
- DBH = diameter at breast height.
- β0 and β1 = regression coefficients.
- β0 and β1 for Rhizophora stylora = −0.696 and 2.465.
- β0 and β1 for Ceriops tagal = −0.494 and 2.056.
- β0 and β1 for Sonneratia alba = 0.258 and 2.287.
2.5. Modelling and Validating Relationships between Mangrove Forest Characteristics and LiDAR Data
Parametric regressions were initially generated between field-based measurements of tree height and CHMmax and CHMpf so as to validate the accuracy of CHMs and calibrate CHMs to correspond to field-based measurements. Calibrated CHMs are henceforth termed cal-CHMmax and cal-CHMpf. Cal-CHMmax provided superior accuracy and a decision was made after validation to undertake all subsequent calculations using cal-CHMmax. Prior to application of parametric regressions between field-based measurements of tree heights and CHMmax and CHMpf at a species level, the normality of CHMmax and CHMpf heights was tested using the Shapiro−Wilk test. Only 80% of plot-based data were used for subsequent model development, leaving the remaining 20% of data to be used for model validation. Parametric regressions were subsequently applied to generate relationships between field-based estimates of H, DBH, and above-ground biomass against cal-CHMmax. Model performance was assessed on the basis of coefficient of determination (r2), k-fold cross validation, and root mean square error (RMSE). Models were subsequently validated using the remaining 20% of field-based data, with RMSE calculated on the basis of comparisons between observed (field-based estimates) and predicted values of H, above-ground biomass, and tree density for each model. As there were few plots dominated by C. tagal, 10-fold cross validation was undertaken to assess model performance. Maps of above-ground biomass were subsequently generated by choosing the models with the optimal r2 and RMSE for each species.
On the basis of optimal model performance, cal-CHMmax was used to generate a surface of total above-ground biomass for each species, with each surface masked on the basis of its distribution defined in species classification mapping. Combining above-ground biomass surfaces for each species provided the opportunity to determine above-ground biomass for each species and for the entire region. Model performance was also determined on the basis of comparison with field-based estimates of above-ground biomass and prior estimates of above-ground biomass for Darwin Harbour [26].
2.6. Model Extrapolation and Comparison at West Alligator River
Considerable effort was required in order to collect field-based data, and this can often be a factor limiting mangrove above-ground biomass assessments. However, like allometric equations, it may be reasonable to extrapolate relationships derived from field-based measurements to other locations, providing the vegetation composition, structure, and climatic/bioregion remains consistent. This was tested by applying relationships derived from field-based measurements of height and above-ground biomass with cal-CHMmax from Darwin Harbour to cal-CHMmax developed for the West Alligator River to generate an above-ground biomass surface for each species at the West Alligator River.
Previous plot-based measurements [40] provided the means to calibrate the generated CHM. These previous measurements also included plot-based estimates of height for two A. marina dominated plots, five R. stylosa dominated plots, and three S. alba dominated plots. Unfortunately, too few plots were determined for A. marina and a decision was made to use the allometric equation created for C. tagal at Darwin Harbour as a substitute for A. marina. This was deemed reasonable, as both C. tagal and A. marina are considered to exhibit similar heights and spatial positions in Darwin Harbour and the West Alligator River. The estimated values of height and above-ground biomass derived from CHMmax at the West Alligator River corresponding to the plot locations were extracted, and an analysis of variance was undertaken to confirm whether there was a significant difference between extrapolated model values and previous estimates of mangrove above-ground biomass [40].
3. Results
3.1. Mangrove Forest Characteristics
A total of 1921 trees were measured for their structural parameters within 40 plots; 10 plots dominated by C. tagal, 18 plots dominated by R. stylosa, and 12 plots dominated by S. alba (Table 2). R. stylosa had the tallest trees (maximum height = 14.57 m), whilst C. tagal had the smallest trees (minimum height = 1.78 m; Figure 3a). The largest diameter at breast height (DBH) was observed in S. alba (maximum DBH = 26.95 cm), while C. tagal had the smallest DBH (minimum DBH = 5.03 cm; Figure 3b). The density of trees varied considerably between species, with mean values ranging from four individuals of S. alba per plot to 48 individuals per 100 m2 (converted from 25 m2) for C. tagal. Despite this variation in density, the mean above-ground biomass for each of these species was similar at 1263 kg and 1225 kg, respectively. The highest above-ground biomass per plot reflected patterns in height and DBH, with plots dominated by R. stylosa having a greater mean above-ground biomass (Figure 3c). The variation in each of these variables was within the range of field-based estimates previously reported for Darwin Harbour and provided further confidence that plots sizes were appropriate for model development.
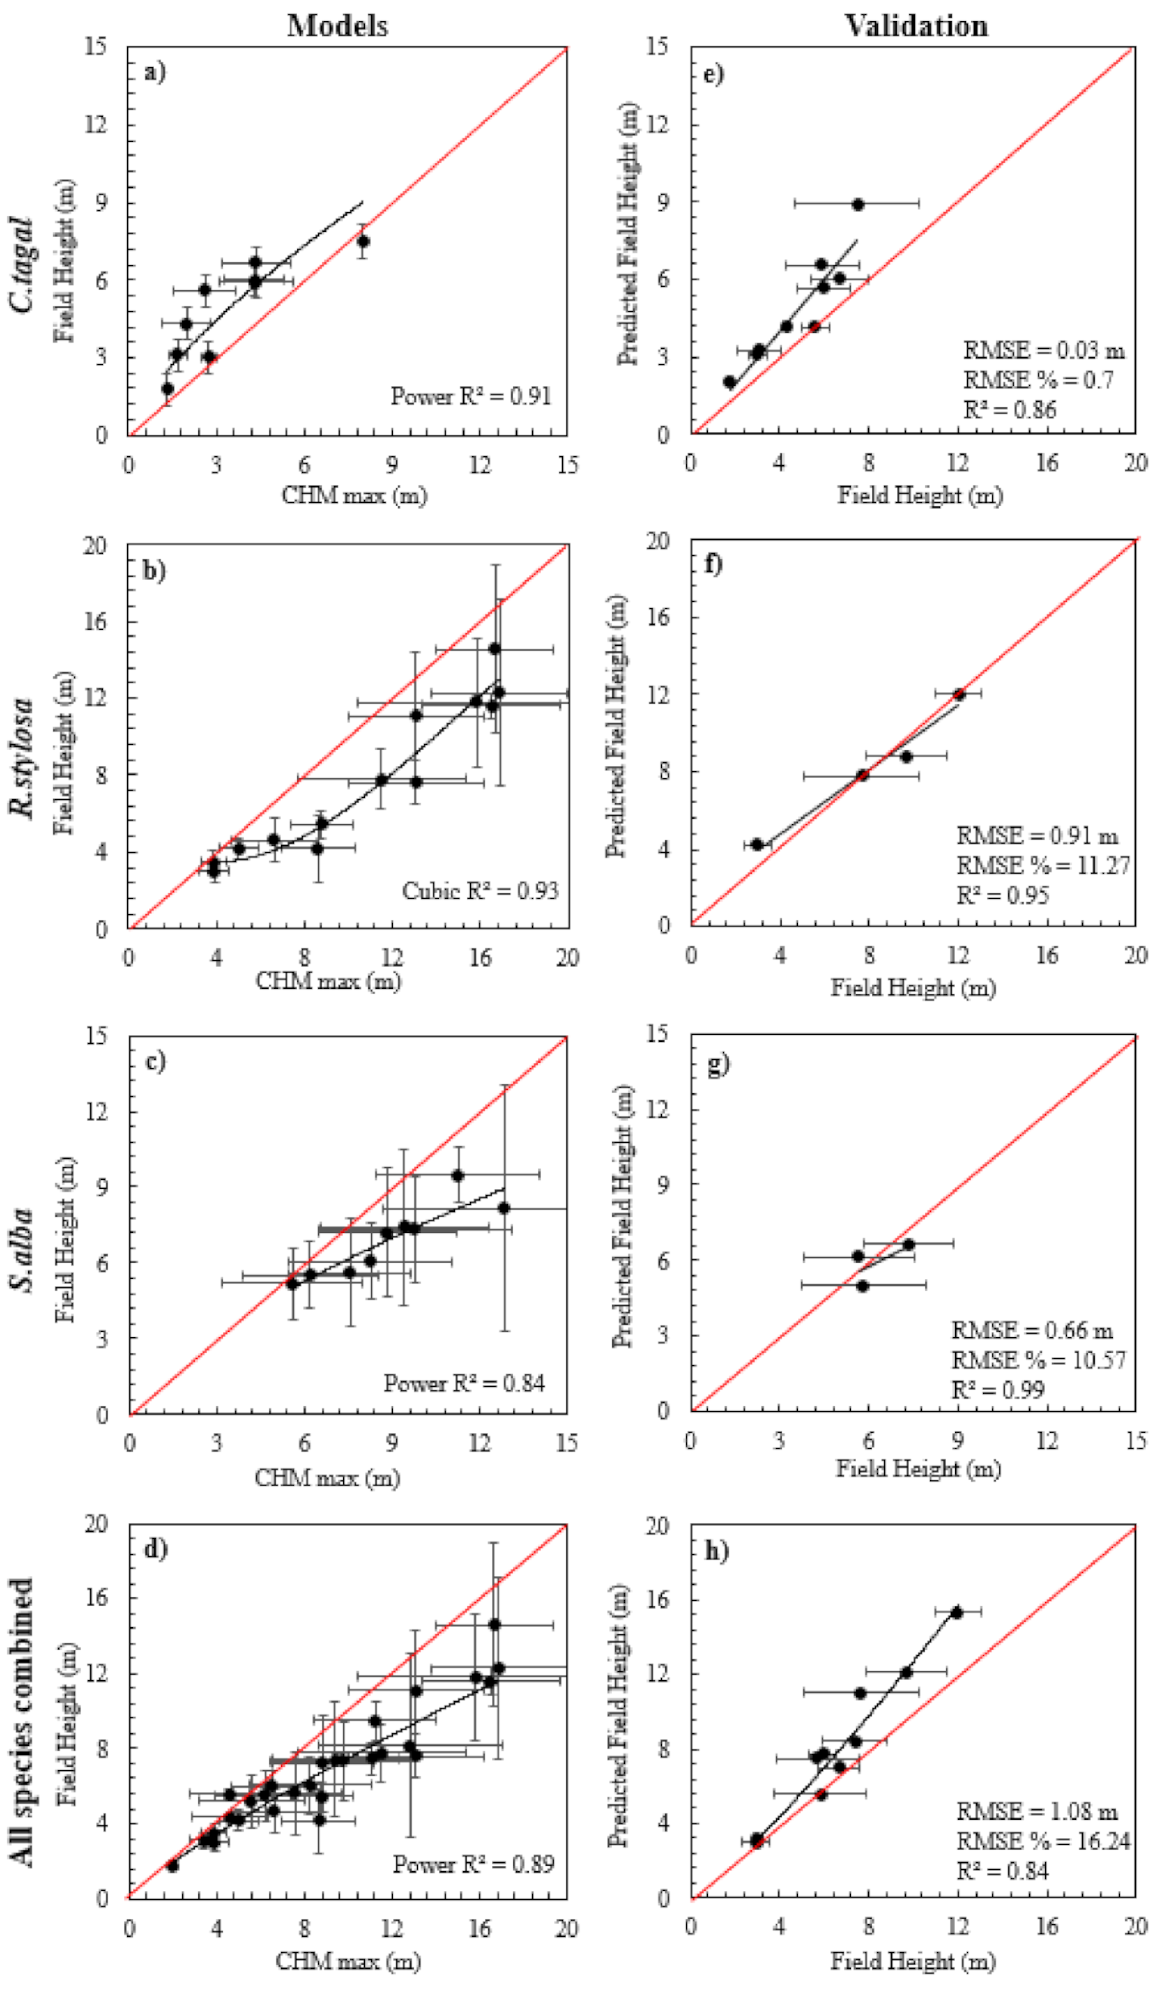
Normality tests applied to height (H) were accepted for each species (p < 0.0005, Appendix A). Relationships established between field-based height and CHMmax were robust for C. tagal (r2 = 0.94; Figure 4a) and R. stylosa (r2 = 0.92; Figure 4b), but the S. alba model (r2 = 0.84; Figure 4c) did not perform as well. The optimal models for each species were either power or cubic models, and as linear models were not optimal, it was determined that calibration of the CHMmax would be best. As care was taken in selecting plots that characterized the range of anticipated heights, it was deemed reasonable to validate these optimal models, as it was unlikely that the model would be applied beyond the upper and lower height limits used in the model. Validation of relationships between field-based-H and the best performing model resulted in RMSE values of 0.03 m (0.7%) for C. tagal (Figure 4e), 0.91 m (11.27%) for R. stylosa (Figure 4f), 0.66 m (10.57%) for S. alba (Figure 4g), and 2.89 m (46.01%) for all species combined (Figure 4h). This validation provided further confidence that decisions to align plot sizes with cell resolution of CHMmax were reasonable. Model validation for CHMpf is provided in Appendix B. As relationships with CHMmax were superior to relationships with CHMpf, CHMmax was used for all subsequent analyses.
On the basis of relationships provided in Figure 4 and assessments of r2, RMSE, and 10-fold cross validation for C. tagal, CHMmax was calibrated against mean plot height using a cubic function to create cal-CHMmax.
Regression models, and validation of field-based height and CHMmax, are provided in Figure 4. Similar models for DBH indicated relationships between field-based DBH and cal-CHMmax for C. tagal (r2 = 0.63; Figure 5a) and S. alba (r2 = 0.67; Figure 5c), but there was less confidence in the relationship for R. stylosa (r2 = 0.14; Figure 5b) and all species combined (r2 = 0.34; Figure 5d). The optimal models for each species were either power or cubic models. The cubic model for R. stylosa indicated significant changes in trajectory when the mean cell height was 9 m; however, error bars indicated significant variation in DBH in cells of this height. Relationships between DBH and cal-CHMmax were markedly less robust than similar relationships with height (indicated in Figure 4). Following the rationale established in a similar study [6], the relationship between DBH was not considered to be strong enough to generate a raster surface of DBH and to apply a traditional allometric approach using raster surfaces indicating height and DBH. Hence, further validation was not undertaken, and a decision was made to develop relationships between AGB per plot and cal-CHMmax instead. Similar comparisons using cal-CHMpf are provided in Appendix C.
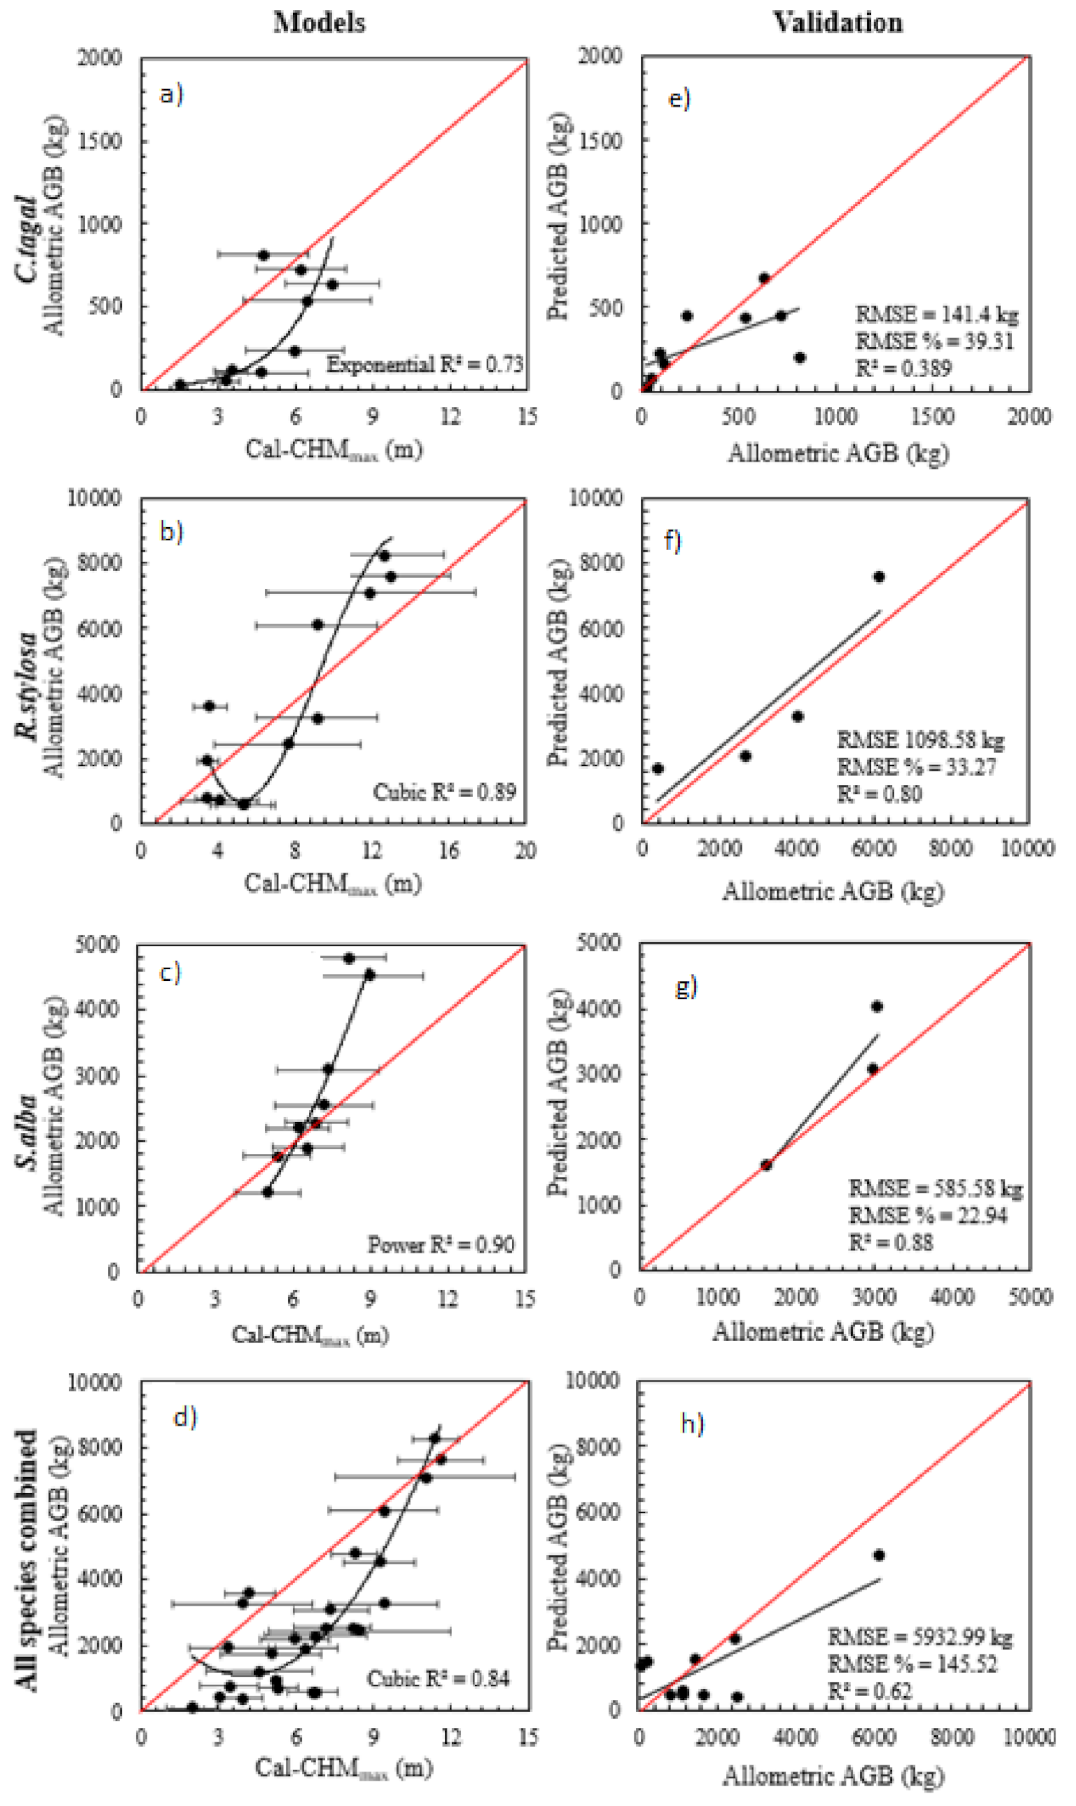
Cubic regression relationships between cal-CHMmax and field-based estimates of above-ground biomass performed best for R. stylosa (r2 = 0.89; Figure 6b) and a power regression relationship performed best for S. alba (r2 = 0.90; Figure 6c), while an exponential regression performed best for C. tagal (r2 = 0.72; Figure 6a) and a cubic function per formed best for all species combined (r2 = 0.51; Figure 6d). It was anticipated that cubic relationships would not be applied beyond the limits defined by the model. The implications of the change in trajectory of the cubic relationship for R. stylosa when cell height in cal-CHMmax was <6 m was likely to have a relatively low effect on the final model outputs, as the majority of individuals lay within the tree height range where the model performed best (i.e., mean plot height >6 m). Validation data confirmed that functions performed reasonably well across all species, with RMSE ranging between 141.4 kg (39.31%) for C. tagal (Figure 6e), 937.88 kg (39.83%) for R. stylosa (Figure 6f), 585.58 kg (22.94%) for S. alba (Figure 6g), and 2204.47 kg (123.75%) for all species combined (Figure 6h). Similar analyses against cal-CHMpf are provided in Appendix D.
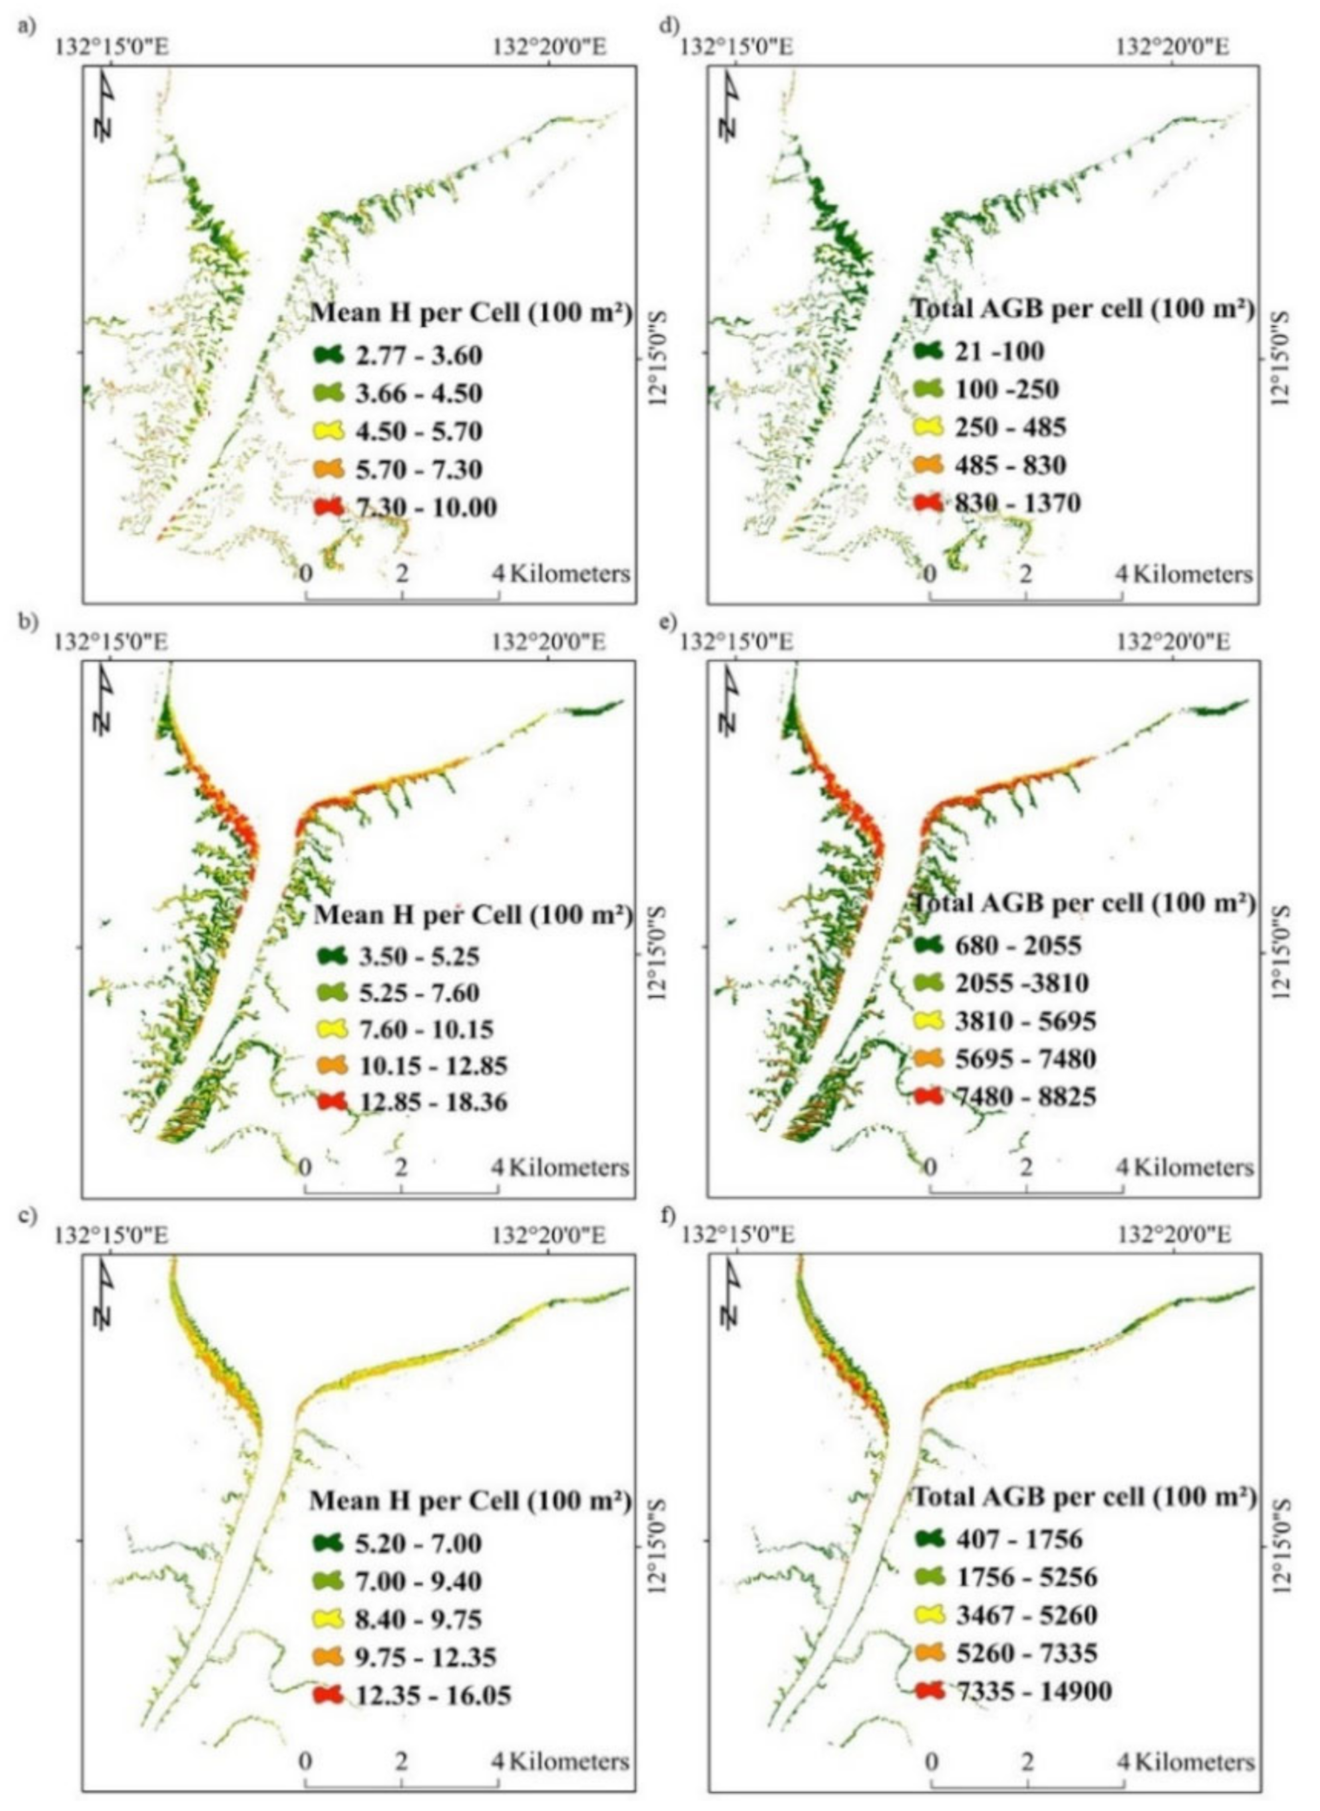
The distribution of height and above-ground biomass for C. tagal, R. stylosa, and S. alba is provided in Figure 7. The total above-ground biomass for each species at Darwin Harbour is indicated in Table 3, and is based on the application of regression functions from Figure 6 for each species. The mean above-ground biomass was estimated to be in the order of 7 t ha−1 for C. tagal, 178.51 t ha−1 for R. stylosa, and 252.12 t ha−1 for S. alba, based on relationships with above-ground biomass derived from species specific allometric equations. The average above-ground biomass for the region was estimated to be 118.38 t ha−1, and is remarkably close to the average above-ground biomass density previously reported of 120 t ha−1 [26].
3.2. Model Extrapolation and Comparison at the West Alligator River
Extrapolation of the best performing relationships between cal-CHMmax, height, and above-ground biomass to model height and above-ground biomass at the West Alligator River is provided in Figure 8. The average above-ground biomass density for the West Alligator River was estimated to be 205.67 t ha−1, which is 15.28% higher than the previous above-ground biomass estimate of 174.35 t ha−1 [42]. The highest average above-ground biomass density was associated with R. stylosa (329.11 t ha−1), followed by S. alba (266.23 t ha−1) and C. tagal (33.7 t ha−1). Comparison of the cal-CHMmax derived height estimates generated from the extrapolation of relationships at Darwin Harbour to the West Alligator River with previous field-based estimates of height at the West Alligator River [40] achieved an RMSE of 2.19 m (20%) and RMSE of 3499.81 kg (76%), respectively. Some of this discrepancy may have arose from the allometric equations [48] applied previously to estimate mangrove biomass at the West Alligator River [40], as these allometrics were developed for tropical mangroves in Queensland, rather than the more recent allometric equations used in this study, which were developed for mangroves in the same biogeographic region by Comley and McGuinness [45]. Additionally, it is feasible that an increase in mangrove biomass may have occurred since prior calculations in 2003 [40] and the time of LiDAR data collection; this increase is supported by recent evidence of landward expansion of mangroves since 2003 (some of which has been subsequently impacted by a dieback event) [38]. Further investigation, including an uncertainty analysis, may clarify whether the discrepancy is due to an increase in biomass, the application of different allometric equations, or model uncertainty.
4. Discussion
4.1. Quantifying and Extrapolating Mangrove Biomass Using LiDAR Data
Determining mangrove above-ground biomass is critical for quantifying carbon storage; however, the resource intensive nature of biomass assessments limits the capacity to undertake extensive assessments, particularly in remote locations. Using LiDAR data to characterize mangrove structural variation offers the opportunity to improve the efficiency of mangrove biomass assessments and the prospect of undertaking assessments in remote locations. In this study, LiDAR data from Darwin Harbour that was calibrated against field-based estimates of mangrove biomass were used to quantify that Darwin Harbour has an average mangrove above-ground biomass of 120 t ha−1. By extrapolating these relationships elsewhere, we also quantified 206 t ha−1 of mangrove biomass at the nearby, yet remote, West Alligator River. Prior to this study, there were methodological problems that limited the capacity to use LiDAR data to assess mangrove biomass. In this paper, we addressed these issues by adjusting the field-based estimates of biomass of individual trees to calibrate against LiDAR data of a given resolution, and recognized that the structure of individual species will have a significant influence on the relationship between above-ground biomass and CHMs. We also extrapolated relationships established at Darwin Harbour to the West Alligator River, resolving issues associated with accessing remote locations.
A prior study in Brazil [6] addressed tree density issues by applying a correction factor to a canopy height model that adjusted the heights on the basis of the average tree density derived from all field plots. In doing so, this approach presumed that tree density was relatively consistent across the entire forest and was well represented by the average value; this assumption ignored the variation that arises on the basis of species, stand age, and location [4,49]. Similar forest-wide correction factors have been applied to LiDAR-derived CHMs by others [50]. This study resolved tree density issues by focusing on describing the structural variation for each species instead of using a single correction factor for calculating tree density of an entire forest. Accordingly, accounting for variation in tree density per species will also improve the estimation of above-ground biomass, which was supported by strong values of r2 and RMSE in this study. This was particularly evident when compared with other methods for estimating above-ground biomass, which apply a single tree density factor to a canopy height model [2,3] or preserving only the tallest trees to guarantee a strong relationship between LiDAR CHM and above-ground biomass [13]. Even when considering the improvements associated with using highly confident species-specific mapping, this study found superior values of r2 and RMSE than other studies, and this was attributed to recognizing the variation in tree density between species [7,8,15]. An outcome of characterizing tree density for individual species was that an optimal plot size was established for each species on the basis of tree density, and CHM cell sizes were adjusted to correspond. In this study, plots of 100 m2 were optimal for measuring trees with low-density, such as species of R. stylosa and S. alba, and plots of 25 m2 were optimal for plots where tree density was high, in this case, C. tagal at Darwin Harbour and A. marina at the West Alligator River. Cell sizes for each species were adjusted to correspond to the field density of trees.
The extrapolation of tree heights and above-ground biomass from Darwin Harbour to the West Alligator River was considered successful, and results were more accurate than other extrapolation applications elsewhere [10,11,12,14]. The high accuracy of CHMs and, consequently, the above-ground biomass models, were because the CHM was calibrated in an area with high quality LiDAR data, and a thoughtful approach to fieldwork guaranteed that the position of plots and the tree heights in the plots were accurate. This approach helped to calibrate the CHM prior to extrapolation to the West Alligator River. Further improvements were achieved by applying species-specific allometric equations at both Darwin Harbour and the West Alligator River.
4.2. Implications for Blue Carbon Assessments
Mapping of above-ground biomass using the methods in this study, including applying the highest resolution LiDAR data and recognizing variation in biomass between species, demonstrates the ability to improve mangrove above-ground biomass quantification. Maps of above-ground biomass provide critical information that highlights hotspots of ecosystem service delivery, such as provision of habitat for fish and waterbirds, storm protection, and carbon cycling [51]. This information can be directly applied to local environmental plans to inform the management and protection of mangrove habitats in Darwin Harbour and the West Alligator River.
There is increasing interest in the carbon storage and cycling of mangrove forests, and this study demonstrates that this interest is not misplaced, as both Darwin Harbour and the West Alligator River store high volumes of mangrove carbon within their biomass. Currently, Australia has obligations under the United Nations Framework Convention on Climate Change (UNFCCC) to report mangrove carbon storage, and this requires a validated accurate methodology. Additionally, there is interest in improving carbon mitigation in Australia by leveraging carbon storage within mangroves [52]. National efforts under the Emissions Reduction Fund (ERF) are currently in place to develop a methodology for quantifying mangrove carbon storage [53,54]. This paper presents a method that meets both the obligations for reporting under the UNFCCC and provides a validated method that could be used within the ERF framework.
5. Conclusions
This study demonstrates the capacity to estimate mangrove above-ground biomass in complex mangroves such as those at Darwin Harbour and the utility to extrapolate above-ground biomass and tree height relationships to nearby locations, as was undertaken at the West Alligator River. This approach can be useful for improving national estimates of carbon storage within above-ground biomass of mangroves, and will improve the capacity to report carbon storage at Darwin Harbour, the West Alligator River, and elsewhere.
Author Contributions
Conceptualization, K.R. and R.B.S.; methodology, software, validation, and formal analysis, R.B.S.; investigation, R.B.S. and K.R.; resources, K.R.; data curation, R.B.S., S.A.R., and K.R.; original draft preparation, K.R. and R.B.S.; writing—K.R., R.B.S., and S.A.R.; visualization, R.B.S., K.R., and S.A.R.; project administration and funding acquisition, K.R. All authors have read and agreed to the published version of the manuscript.
Funding
This research received finding from the University of Wollongong Global Challenges Program and the GeoQuEST Research Centre. Rafaela Salum was the recipient of an International Postgraduate Tuition Award from the University of Wollongong.
Institutional Review Board Statement
Not applicable.
Informed Consent Statement
Not applicable.
Data Availability Statement
Data available on request due to restrictions.
Acknowledgments
The authors wish to acknowledge the traditional owners of the land of Darwin Harbour The Larrakia or saltwater people, and the traditional owners of Kakadu, the Bininj and Mungguy. The authors also wish to thank Professor Lindsay Hutley and Madeleine Goddard for their logistical assistance undertaking fieldwork in Darwin Harbour, and Adam Bourke and Erin Porritt who provided both passionate and competent assistance in the field. Professor Colin Woodroffe is acknowledged for his contribution to conceptualization of this project and for providing feedback on the manuscript.
Conflicts of Interest
The authors declare no conflict of interest.
Appendix A
Details of normality tests as applied to height data at Darwin Harbour.
Appendix B
Relationships between field-based height and CHMpf, and best fit parametric models (linear, logarithmic, quadratic, cubic, power, and exponential) for (a) C. tagal, (b) R. stylosa, (c) S. alba, and (d) all mangrove species combined, as well as the validation of the best fit model against field-based validation data for (e) C.tagal, (f) R. stylosa, (g) S. alba, and (h) all mangrove species combined.
Appendix C
Relationships between field-based DBH and CHMpf, and best fit parametric models (linear, logarithmic, quadratic, cubic, power, and exponential) for (a) C. tagal, (b) R. stylosa, (c) S. alba, and (d) all mangrove species combined.
Appendix D
Relationships between field-based above-ground biomass and CHMpf, and best fit parametric models (linear, logarithmic, quadratic, cubic, power, and exponential) for (a) C. tagal, (b) R. stylosa, (c) S. alba, and (d) all mangrove species combined, and validation of the best fit model against field-based validation data for (e) C. tagal, (f) R. stylosa, (g) S. alba, and (h) all mangrove species combined.
References
- Donato, D.C.; Kauffman, J.B.; Murdiyarso, D.; Kurnianto, S.; Stidham, M.; Kanninen, M. Mangroves among the most carbon-rich forests in the tropics. Nat. Geosci. 2011, 4, 293–297. [Google Scholar] [CrossRef]
- Komiyama, A. Common allometric equations for estimating the tree weight of mangroves. J. Trop. Ecol. 2005, 21, 471–477. [Google Scholar] [CrossRef]
- Chave, J.; Andalo, C.; Brown, S.; Cairns, M.A.; Chambers, J.Q.; Eamus, D.; Folster, H.; Fromard, F.; Higuchi, N.; Kira, T.; et al. Tree allometry and improved estimation of carbon stocks and balance in tropical forests. Oecologia 2005, 145, 87–99. [Google Scholar] [CrossRef] [PubMed]
- Shaffer-Novelli, Y.; Molero-Cintron, G. Guia PARA ESTUDO DE AREAS DE MANGUEZAL: Estrutura, Funcao e Flora; Caribbean Ecological Research: Sao Paulo, Brazil, 1985. [Google Scholar]
- Brocklehurst, P.S.; Edmeades, B.F. The Mangrove Communities of Darwin Harbor; Department of Lands, Planning and Environment: Darwin, Australia, 1996; p. 171. [Google Scholar]
- Salum, R.B.; Souza-Filho, P.W.M.; Simard, M.; Silva, C.A.; Fernandes, M.E.B.; Cougo, M.F.; do Nascimento, W.; Rogers, K. Improving mangrove above-ground biomass estimates using LiDAR. Estuarine Coast. Shelf Sci. 2020, 236. [Google Scholar] [CrossRef]
- Hu, T.; Zhang, Y.; Su, Y.; Zheng, Y.; Lin, G.; Guo, Q. Mapping the Global Mangrove Forest Aboveground Biomass Using Multisource Remote Sensing Data. Remote Sens. 2020, 12, 1690. [Google Scholar] [CrossRef]
- Wang, D.; Wan, B.; Liu, J.; Su, Y.; Guo, Q.; Qiu, P.; Wu, X. Estimating aboveground biomass of the mangrove forests on northeast Hainan Island in China using an upscaling method from field plots, UAV-LiDAR data and Sentinel-2 imagery. Int. J. Appl. Earth Observ. Geoinf. 2020, 85. [Google Scholar] [CrossRef]
- Qiu, P.; Wang, D.; Zou, X.; Yang, X.; Xie, G.; Xu, S.; Zhong, Z. Finer Resolution Estimation and Mapping of Mangrove Biomass Using UAV LiDAR and WorldView-2 Data. Forests 2019, 10, 871. [Google Scholar] [CrossRef] [Green Version]
- Simard, M.; Fatoyinbo, L.; Smetanka, C.; Rivera-Monroy, V.H.; Castañeda-Moya, E.; Thomas, N.; Van der Stocken, T. Mangrove canopy height globally related to precipitation, temperature and cyclone frequency. Nat. Geosci. 2018, 12, 40–45. [Google Scholar] [CrossRef]
- Tang, W.; Zheng, M.; Zhao, X.; Shi, J.; Yang, J.; Trettin, C. Big Geospatial Data Analytics for Global Mangrove Biomass and Carbon Estimation. Sustainability 2018, 10, 472. [Google Scholar] [CrossRef] [Green Version]
- Hickey, S.M.; Callow, N.J.; Phinn, S.; Lovelock, C.E.; Duarte, C.M. Spatial complexities in aboveground carbon stocks of a semi-arid mangrove community: A remote sensing height-biomass-carbon approach. Estuarine Coast. Shelf Sci. 2018, 200, 194–201. [Google Scholar] [CrossRef] [Green Version]
- Fatoyinbo, T.; Feliciano, E.A.; Lagomasino, D.; Lee, S.K.; Trettin, C. Estimating mangrove aboveground biomass from airborne LiDAR data: A case study from the Zambezi River delta. Environ. Res. Lett. 2018, 13. [Google Scholar] [CrossRef] [Green Version]
- Staben, G.; Lucieer, A.; Scarth, P. Modelling LiDAR derived tree canopy height from Landsat TM, ETM+ and OLI satellite imagery—A machine learning approach. Int. J. Appl. Earth Observ. Geoinf. 2018, 73, 666–681. [Google Scholar] [CrossRef]
- Rocha de Souza Pereira, F.; Kampel, M.; Gomes Soares, M.; Estrada, G.; Bentz, C.; Vincent, G. Reducing Uncertainty in Mapping of Mangrove Aboveground Biomass Using Airborne Discrete Return Lidar Data. Remote Sens. 2018, 10, 637. [Google Scholar] [CrossRef] [Green Version]
- Fatoyinbo, T.E.; Simard, M. Height and biomass of mangroves in Africa from ICESat/GLAS and SRTM. Int. J. Remote Sens. 2013, 34, 668–681. [Google Scholar] [CrossRef]
- Heenkenda, M.; Maier, S.; Joyce, K. Estimating Mangrove Biophysical Variables Using WorldView-2 Satellite Data: Rapid Creek, Northern Territory, Australia. J. Imaging 2016, 2, 24. [Google Scholar] [CrossRef] [Green Version]
- Cougo, M.; Souza-Filho, P.; Silva, A.; Fernandes, M.; Santos, J.; Abreu, M.; Nascimento, W.; Simard, M. Radarsat-2 Backscattering for the Modeling of Biophysical Parameters of Regenerating Mangrove Forests. Remote Sens. 2015, 7, 5873. [Google Scholar] [CrossRef] [Green Version]
- Proisy, C.; Couteron, P.; Fromard, F. Predicting and mapping mangrove biomass from canopy grain analysis using Fourier-based textural ordination of IKONOS images. Remote Sens. Environ. 2007, 109, 379–392. [Google Scholar] [CrossRef]
- Lucas, R.; Van De Kerchove, R.; Otero, V.; Lagomasino, D.; Fatoyinbo, L.; Omar, H.; Satyanarayana, B.; Dahdouh-Guebas, F. Structural characterisation of mangrove forests achieved through combining multiple sources of remote sensing data. Remote Sens. Environ. 2020, 237. [Google Scholar] [CrossRef]
- Owers, C.J.; Rogers, K.; Woodroffe, C.D. Terrestrial laser scanning to quantify above-ground biomass of structurally complex coastal wetland vegetation. Estuarine Coast. Shelf Sci. 2018, 204, 164–176. [Google Scholar] [CrossRef] [Green Version]
- Olagoke, A.; Proisy, C.; Féret, J.-B.; Blanchard, E.; Fromard, F.; Mehlig, U.; de Menezes, M.M.; Dos Santos, V.F.; Berger, U. Extended biomass allometric equations for large mangrove trees from terrestrial LiDAR data. Trees 2016, 30, 935–947. [Google Scholar] [CrossRef] [Green Version]
- Calders, K.; Newnham, G.; Burt, A.; Murphy, S.; Raumonen, P.; Herold, M.; Culvenor, D.; Avitabile, V.; Disney, M.; Armston, J. Nondestructive estimates of above-ground biomass using terrestrial laser scanning. Methods Ecol. Evol. 2015, 6, 198–208. [Google Scholar] [CrossRef]
- Kargar, A.R.; MacKenzie, R.A.; Apwong, M.; Hughes, E.; van Aardt, J. Stem and root assessment in mangrove forests using a low-cost, rapid-scan terrestrial laser scanner. Wetlands Ecol. Manag. 2020, 28, 883–900. [Google Scholar] [CrossRef]
- Rogers, K.; Lymburner, L.; Salum, R.; Brooke, B.P.; Woodroffe, C.D. Mapping mangrove extent and zonation using high and low tide composites of Landsat data. Hydrobiologia 2017, 803, 49–68. [Google Scholar] [CrossRef]
- Brocklehurst, P.S.; Edmeades, B.F. The Mangrove Communities of Darwin Harbor Biomass Update; NT Government: Darwin, Australia, 2013. [Google Scholar]
- Leong, R.C.; Friess, D.A.; Crase, B.; Lee, W.K.; Webb, E.L. High-resolution pattern of mangrove species distribution is controlled by surface elevation. Estuarine Coast. Shelf Sci. 2018, 202, 185–192. [Google Scholar] [CrossRef]
- Lucas, R.; Finlayson, C.M.; Bartolo, R.; Rogers, K.; Mitchell, A.; Woodroffe, C.D. Historical perspectives on the mangroves of Kakadu National Park. Marine Freshwater Res. 2017, 69, 1047–1063. [Google Scholar] [CrossRef]
- Crase, B.; Liedloff, A.; Vesk, P.A.; Burgman, M.A.; Wintle, B.A. Hydroperiod is the main driver of the spatial pattern of dominance in mangrove communities. Global Ecol. Biogeogr. 2013, 22, 806–817. [Google Scholar] [CrossRef]
- Woodroffe, C.D.; Bardsley, K.N.; Ward, P.J.; Hanley, J.R. Production of Mangrove Litter in a Macrotidal Embayment, Darwin Harbor, N.T., Australia. Estuarine Coast. Shelf Sci. 1988, 26, 581–598. [Google Scholar] [CrossRef]
- Semeniuk, V. Mangrove enviroments of Port Darwin Northern Territory: The physical framework and habitats. J. R. Soc. West. Aust. 1985, 67, 81–97. [Google Scholar]
- Williams, D.; Wolanski, E.; Spagnol, S. Hydrodynamics of Darwin harbour. In The Environment in Asia Pacific Harbours; Springer: Berlin, Germany, 2006; pp. 461–476. [Google Scholar]
- Walpole, B.P.; Crohn, P.W.; Dunn, P.R.; Randal, M.A. Geology of the Katherine-Darwin Region Northen Territory; Bureau of Mineral Resources, Geology and Geophysics: Canberra, Australia, 1968; p. 304. [Google Scholar]
- Woodroffe, C.; Bardsley, K. The distribution and productivity of mangroves in Creek H, Darwin Harbor. In Proceedings of the Workshop on Research and Management, Darwin, Australia, 2–3 September 1987; pp. 2–3. [Google Scholar]
- Woodroffe, C.D.; Chappell, J.; Thom, B.G.; Wallensky, E. Depositional model of a macrotidal estuary and floodplain, South Alligator River, Northern Australia. Sedimentology 1989, 36, 737–756. [Google Scholar] [CrossRef]
- Woodroffe, C.D.; Thom, B.G.; Chappell, J. Development of widespread mangrove swamps in mid-Holocene times in Northern Australia. Nature 1985, 317, 711–713. [Google Scholar] [CrossRef]
- Woodroffe, C.D. Mangrove response to sea level rise: Palaeoecological insights from macrotidal systems in Northern Australia. Mar. Freshwater Res. 2018, 69. [Google Scholar] [CrossRef] [Green Version]
- Asbridge, E.; Bartolo, R.; Finlayson, C.; Lucas, R.; Rogers, K.; Woodroffe, C. Assessing the distribution and drivers of mangrove dieback in Kakadu National Park, northern Australia. Estuarine Coast. Shelf Sci. 2019, 228, 106353. [Google Scholar] [CrossRef]
- Asbridge, E. Mangrove Response to Environmental Changes Predicted Under Varying Climates: Case Studies from Australia. Curr. For. Rep. 2015, 1, 178–194. [Google Scholar] [CrossRef] [Green Version]
- Mitchell, A.L. Remote Sensing Techniques for Assessment of Mangrove Forest Structure, Species Composition and Biomass, and Response to Environmental Change. Ph.D. Thesis, The University of New South Wales High Street, Kensington, NSW, Australia, 2003. [Google Scholar]
- Temby, O. Project Report for Aerial LiDAR Survey of Darwin, and Surrounds; Fugro Spatial Solutions Pty Ltd.: Perth, Australia, 2009. [Google Scholar]
- Schroeder, T.; Anstee, J.; Botha, H.; Byrne, G.; Dyce, P. Kakadu LIDAR Project 2011 0.5m Contours maps. v3; CSIRO and Geoscience Australia: Canberra, Australia, 2013. [Google Scholar] [CrossRef]
- Geoscience Australia. Digital Elevation Model (DEM) of Australia Derived from LiDAR 5 Metre Grid; Geoscience Australia: Canberra, Australia, 2015. [Google Scholar]
- Khosravipour, A.; Skidmore, A.K.; Isenburg, M.; Wang, T.; Hussin, Y.A. Generating Pit-free Canopy Height Models from Airborne Lidar. Photogramm. Eng. Remote Sens. 2014, 80, 863–872. [Google Scholar] [CrossRef]
- Comley, B.W.T.; McGuinness, K.A. Above- and below-ground biomass, and allometry, of four common northern Australian mangroves. Aust. J. Bot. 2005, 53, 431. [Google Scholar] [CrossRef]
- Owers, C.J.; Rogers, K.; Woodroffe, C.D. Spatial variation of above-ground carbon storage in temperate coastal wetlands. Estuar. Coast. Shelf Sci. 2018, 2010, 55–67. [Google Scholar] [CrossRef]
- Kusmana, C.; Hidayat, T.; Tiryana, T.; Rusdiana, O. Allometric models for above- and below-ground biomass of Sonneratia spp. Glob. Ecol. Conserv. 2018, 15. [Google Scholar] [CrossRef]
- Clough, B.; Scott, K. Allometrics relationships for estiamting above ground biomass in six mangrove speceis. For. Ecol. Manag. 1989, 27, 117–127. [Google Scholar] [CrossRef]
- Rogers, K.; Krauss, K.W. Moving from Generalisations to Specificity about Mangrove–Saltmarsh Dynamics. Wetlands 2018. [Google Scholar] [CrossRef] [Green Version]
- Chadwick, J. Integrated LiDAR and IKONOS multispectral imagery for mapping mangrove distribution and physical properties. Int. J. Remote Sens. 2011, 32, 6765–6781. [Google Scholar] [CrossRef]
- Barbier, E.B.; Hacker, S.D.; Kennedy, C.; Koch, E.W.; Stier, A.C.; Silliman, B.R. The value of estuarine and coastal ecosystem services. Ecol. Monogr. 2011, 81, 169–193. [Google Scholar] [CrossRef]
- Rogers, K.; Boon, P.I.; Branigan, S.; Duke, N.C.; Field, C.D.; Fitzsimons, J.A.; Kirkman, H.; Mackenzie, J.R.; Saintilan, N. The state of legislation and policy protecting Australia’s mangrove and salt marsh and their ecosystem services. Mar. Policy 2016, 72, 139–155. [Google Scholar] [CrossRef]
- Kelleway, J.; Serrano, O.; Baldock, J.; Cannard, T.; Lavery, P.; Lovelock, C.; Macreadie, P.; Masqué, P.; Saintilan, N.; Steven, A.J.C. Technical Review of Opportunities for Including Blue Carbon in the Australian Government’s Emissions Reduction Fund; CSIRO: Canberra, Australia, 2017. [Google Scholar]
- Kelleway, J.J.; Serrano, O.; Baldock, J.A.; Burgess, R.; Cannard, T.; Lavery, P.S.; Lovelock, C.E.; Macreadie, P.I.; Masqué, P.; Newnham, M.J.G.E.C. A national approach to greenhouse gas abatement through blue carbon management. Glob. Environ. Chang. 2020, 63, 102083. [Google Scholar] [CrossRef]
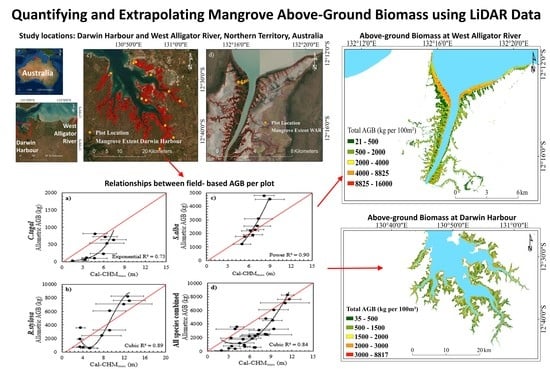
Figure 1.
Study locations in (a,b) the Northern Territory of Australia focused on (c) Darwin Harbour and (d) the West Alligator River. Plot locations indicated at Darwin Harbour represent field-based measurements undertaken by the authors; plot locations at the West Alligator River represent field-based measurements undertaken by Mitchell [40].

Figure 2.
Workflow to develop relationships between field-based mangrove structural information, above-ground biomass (AGB), and LiDAR data, which was subsequently applied to a canopy height model (CHM) to estimate above-ground biomass for each species and was validated at Darwin Harbour and the West Alligator River (WAR). DSM—digital surface model; H—height.

Figure 3.
Distribution of mangrove forest characteristics of (a) height, (b) diameter at breast height (DBH), (c) density of trees, and (d) above-ground biomass (AGB) for C. tagal, R. stylosa, and S. alba at Darwin Harbour. Forest characteristics determined within 100 m2 for plots dominated by R. stylosa and S. alba, and 25 m2 for plots dominated by C. tagal. C. tagal density and AGB were converted from values for plots of 25 m2 to 100 m2 by multiplying by a factor of four.

Figure 4.
Relationships between field-based height and CHMmax, and best fit parametric models (linear, logarithmic, quadratic, cubic, power, and exponential) for (a) C. tagal, (b) R. stylosa, (c) S. alba, and (d) all mangrove species combined, and validation of the best fit model against field-based validation data for (e) C. tagal, (f) R. stylosa, (g) S. alba, and (h) all of the mangrove species combined.

Figure 5.
Relationships between field-based DBH and CHMmax, and best fit parametric models (linear, logarithmic, quadratic, cubic, power, and exponential) for (a) C. tagal, (b) R. stylosa, (c) S. alba, and (d) all mangrove species combined.
Figure 5.
Relationships between field-based DBH and CHMmax, and best fit parametric models (linear, logarithmic, quadratic, cubic, power, and exponential) for (a) C. tagal, (b) R. stylosa, (c) S. alba, and (d) all mangrove species combined.

Figure 6.
Relationships between field-based above-ground biomass and CHMmax, and best fit parametric models (linear, logarithmic, quadratic, cubic, power, and exponential) for (a) C. tagal, (b) R. stylosa, (c) S. alba, and (d) all mangrove species combined, and validation of best fit model against field-based validation data for (e) C. tagal, (f) R. stylosa, (g) S. alba, and (h) all mangrove species combined.

Figure 7.
Modelled average height (H) (m) per cell for (a) C. tagal, (b) R. stylosa and (c) S. alba, and total AGB per 100 m2 cell (kg) for (d) C. tagal, (e) R. stylosa and (f) S. alba at Darwin Harbour.
Figure 7.
Modelled average height (H) (m) per cell for (a) C. tagal, (b) R. stylosa and (c) S. alba, and total AGB per 100 m2 cell (kg) for (d) C. tagal, (e) R. stylosa and (f) S. alba at Darwin Harbour.

Figure 8.
Modelled average height (H, m) per cell (100 m2) for (a) A. marina, (b) R. stylosa, and (c) S. alba, and the total above-ground biomass (AGB, kg) per cell (100 m2) for (d) A. marina, (e) R. stylosa, and (f) S. alba at the West Alligator River.
Figure 8.
Modelled average height (H, m) per cell (100 m2) for (a) A. marina, (b) R. stylosa, and (c) S. alba, and the total above-ground biomass (AGB, kg) per cell (100 m2) for (d) A. marina, (e) R. stylosa, and (f) S. alba at the West Alligator River.


Table 1.
LiDAR flight acquisition parameter summary for Darwin Harbour and the West Alligator River.
Table 1.
LiDAR flight acquisition parameter summary for Darwin Harbour and the West Alligator River.
| LiDAR Details (Fugro Spatial Solutions) | Darwin Harbour Study Site | West Alligator River Study Site |
|---|---|---|
| Laser model | ALS50 | ALS60 |
| Nominal flying height | 2012 m AGL | 1425 m AGL |
| Full swath width | 1425 m | 997 m |
| Distance between runs | 1276 m | 468 m |
| Airspeed | 145 knots | 145 knots |
| Average point density | 1.1 pts/m2 | 2 pts/m2 |
| Footprint diameter | 0.45 m | 0.32 m |
| Navigation mode | GPS-based | GPS-based |
| Position mode | DGPS | DGPS |
| Vertical accuracy | ±0.15 m | ±0.3 m |
| Metadata source | [43] | [44] |
Table 2.
Summary of structural measurements of height, diameter at breast height (DBH), density, and above-ground biomass (AGB) derived from field measurements. Note: C. tagal density and AGB were converted from values for plots of 25 m2 to 100 m2 by multiplying by a factor of four.
Table 2.
Summary of structural measurements of height, diameter at breast height (DBH), density, and above-ground biomass (AGB) derived from field measurements. Note: C. tagal density and AGB were converted from values for plots of 25 m2 to 100 m2 by multiplying by a factor of four.
| Parameter | Species | Field Measurements (Per 10 m × 10 m) | |||
|---|---|---|---|---|---|
| Minimum | x | Sx | Maximum | ||
| Height (m) | C. tagal | 1.78 | 4.88 | 1.92 | 7.48 |
| R. stylosa | 2.95 | 8.02 | 3.71 | 14.57 | |
| S. alba | 5.18 | 6.74 | 1.29 | 9.47 | |
| DBH (cm) | C. tagal | 5.03 | 6.13 | 0.97 | 7.59 |
| R. stylosa | 6.34 | 11.66 | 5.92 | 26.95 | |
| S. alba | 13.91 | 19.52 | 4.16 | 27.72 | |
| Density (trees with DBH >5 cm per plot) | C. tagal | 16 | 76 | 48 | 140 |
| R. stylosa | 8 | 28 | 15 | 55 | |
| S. alba | 5 | 10 | 4 | 19 | |
| AGB (kg) | C. tagal | 110 | 1439 | 1263 | 3257 |
| R. stylosa | 374 | 3747 | 3222 | 10,930 | |
| S. alba | 592 | 2576 | 1225 | 4793 | |
Table 3.
Summary of mangrove extent and total AGB at Darwin Harbour derived from species-specific allometric equations and relationships between biomass per plot and LiDAR data.
Table 3.
Summary of mangrove extent and total AGB at Darwin Harbour derived from species-specific allometric equations and relationships between biomass per plot and LiDAR data.
| Species | Area (ha) | AGB (Mt) | AGB (t ha−1) |
|---|---|---|---|
| C. tagal | 6161 | 0.05 | 7.4 |
| R. stylosa | 9656 | 1.72 | 179 |
| S. alba | 766 | 0.19 | 252 |
| All species | 16,584 | 1.94 | 118 |
Publisher’s Note: MDPI stays neutral with regard to jurisdictional claims in published maps and institutional affiliations. |
© 2021 by the authors. Licensee MDPI, Basel, Switzerland. This article is an open access article distributed under the terms and conditions of the Creative Commons Attribution (CC BY) license (https://creativecommons.org/licenses/by/4.0/).
Share and Cite
MDPI and ACS Style
Salum, R.B.; Robinson, S.A.; Rogers, K. A Validated and Accurate Method for Quantifying and Extrapolating Mangrove Above-Ground Biomass Using LiDAR Data. Remote Sens. 2021, 13, 2763. https://0-doi-org.brum.beds.ac.uk/10.3390/rs13142763
AMA Style
Salum RB, Robinson SA, Rogers K. A Validated and Accurate Method for Quantifying and Extrapolating Mangrove Above-Ground Biomass Using LiDAR Data. Remote Sensing. 2021; 13(14):2763. https://0-doi-org.brum.beds.ac.uk/10.3390/rs13142763
Chicago/Turabian StyleSalum, Rafaela B., Sharon A. Robinson, and Kerrylee Rogers. 2021. "A Validated and Accurate Method for Quantifying and Extrapolating Mangrove Above-Ground Biomass Using LiDAR Data" Remote Sensing 13, no. 14: 2763. https://0-doi-org.brum.beds.ac.uk/10.3390/rs13142763
Note that from the first issue of 2016, this journal uses article numbers instead of page numbers. See further details here.