
Superior PM2.5 Estimation by Integrating Aerosol Fine Mode Data from the Himawari-8 Satellite in Deep and Classical Machine Learning Models


Abstract
:
1. Introduction
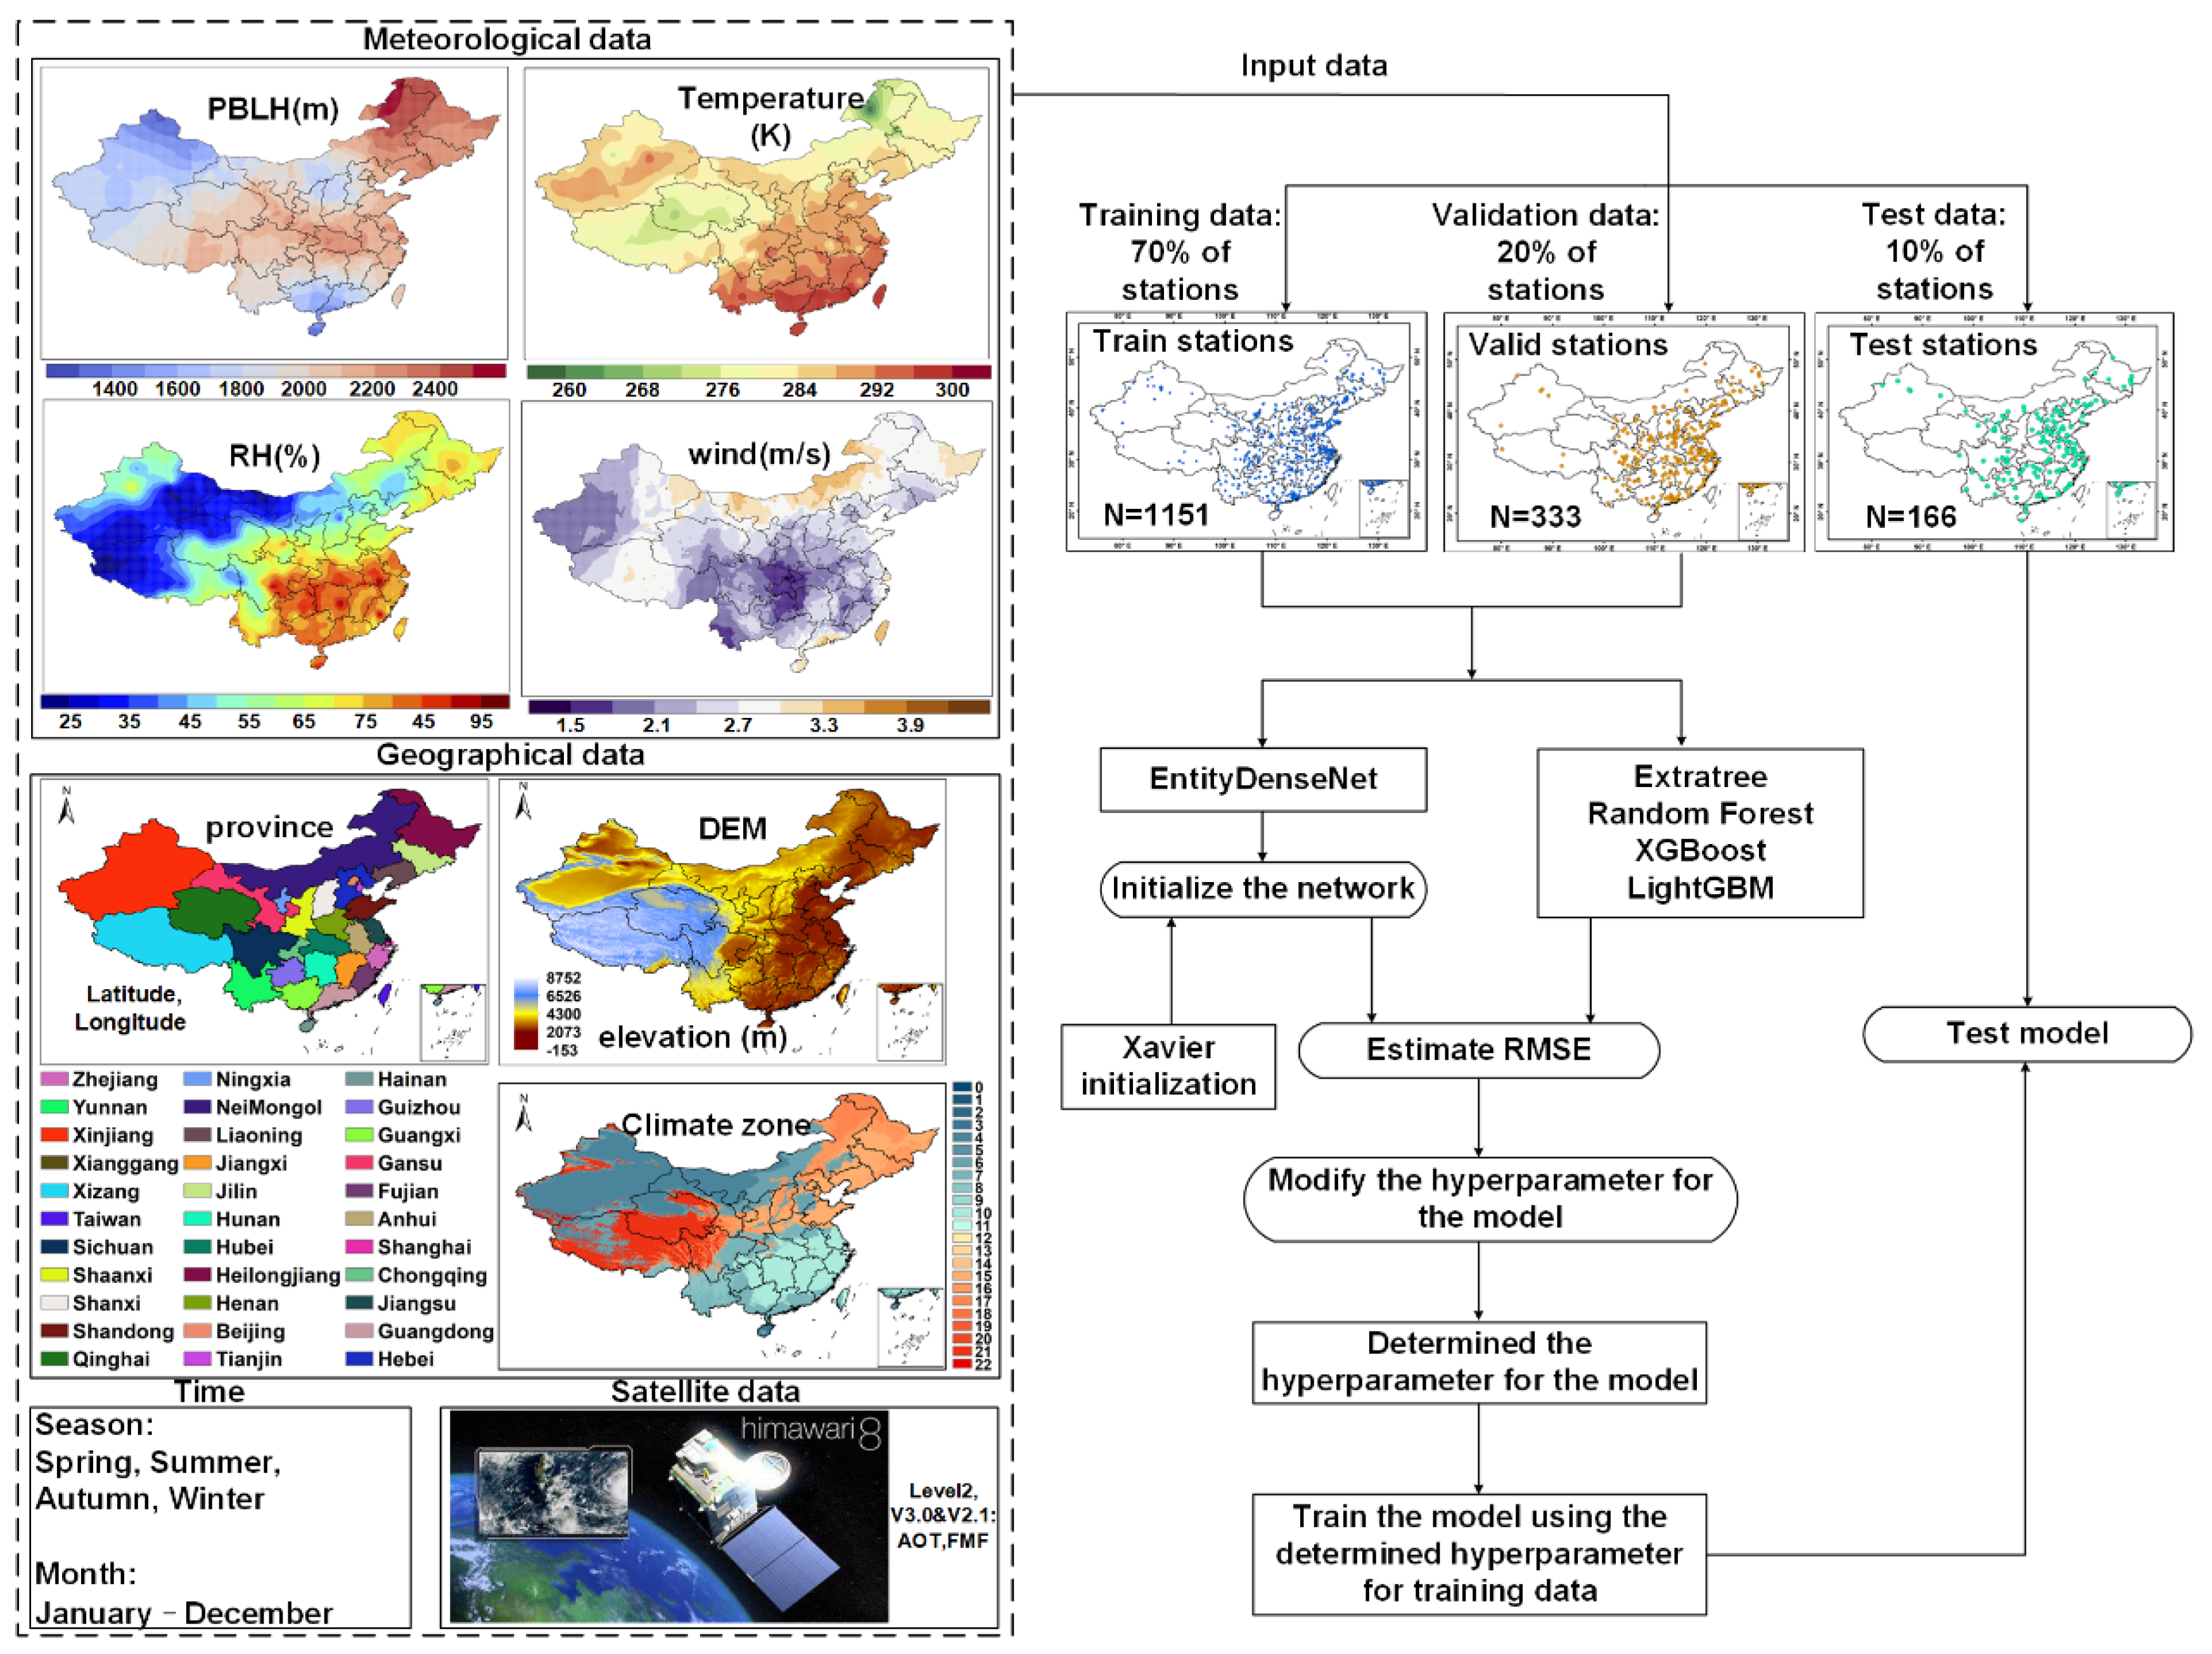
2. Data and Methods
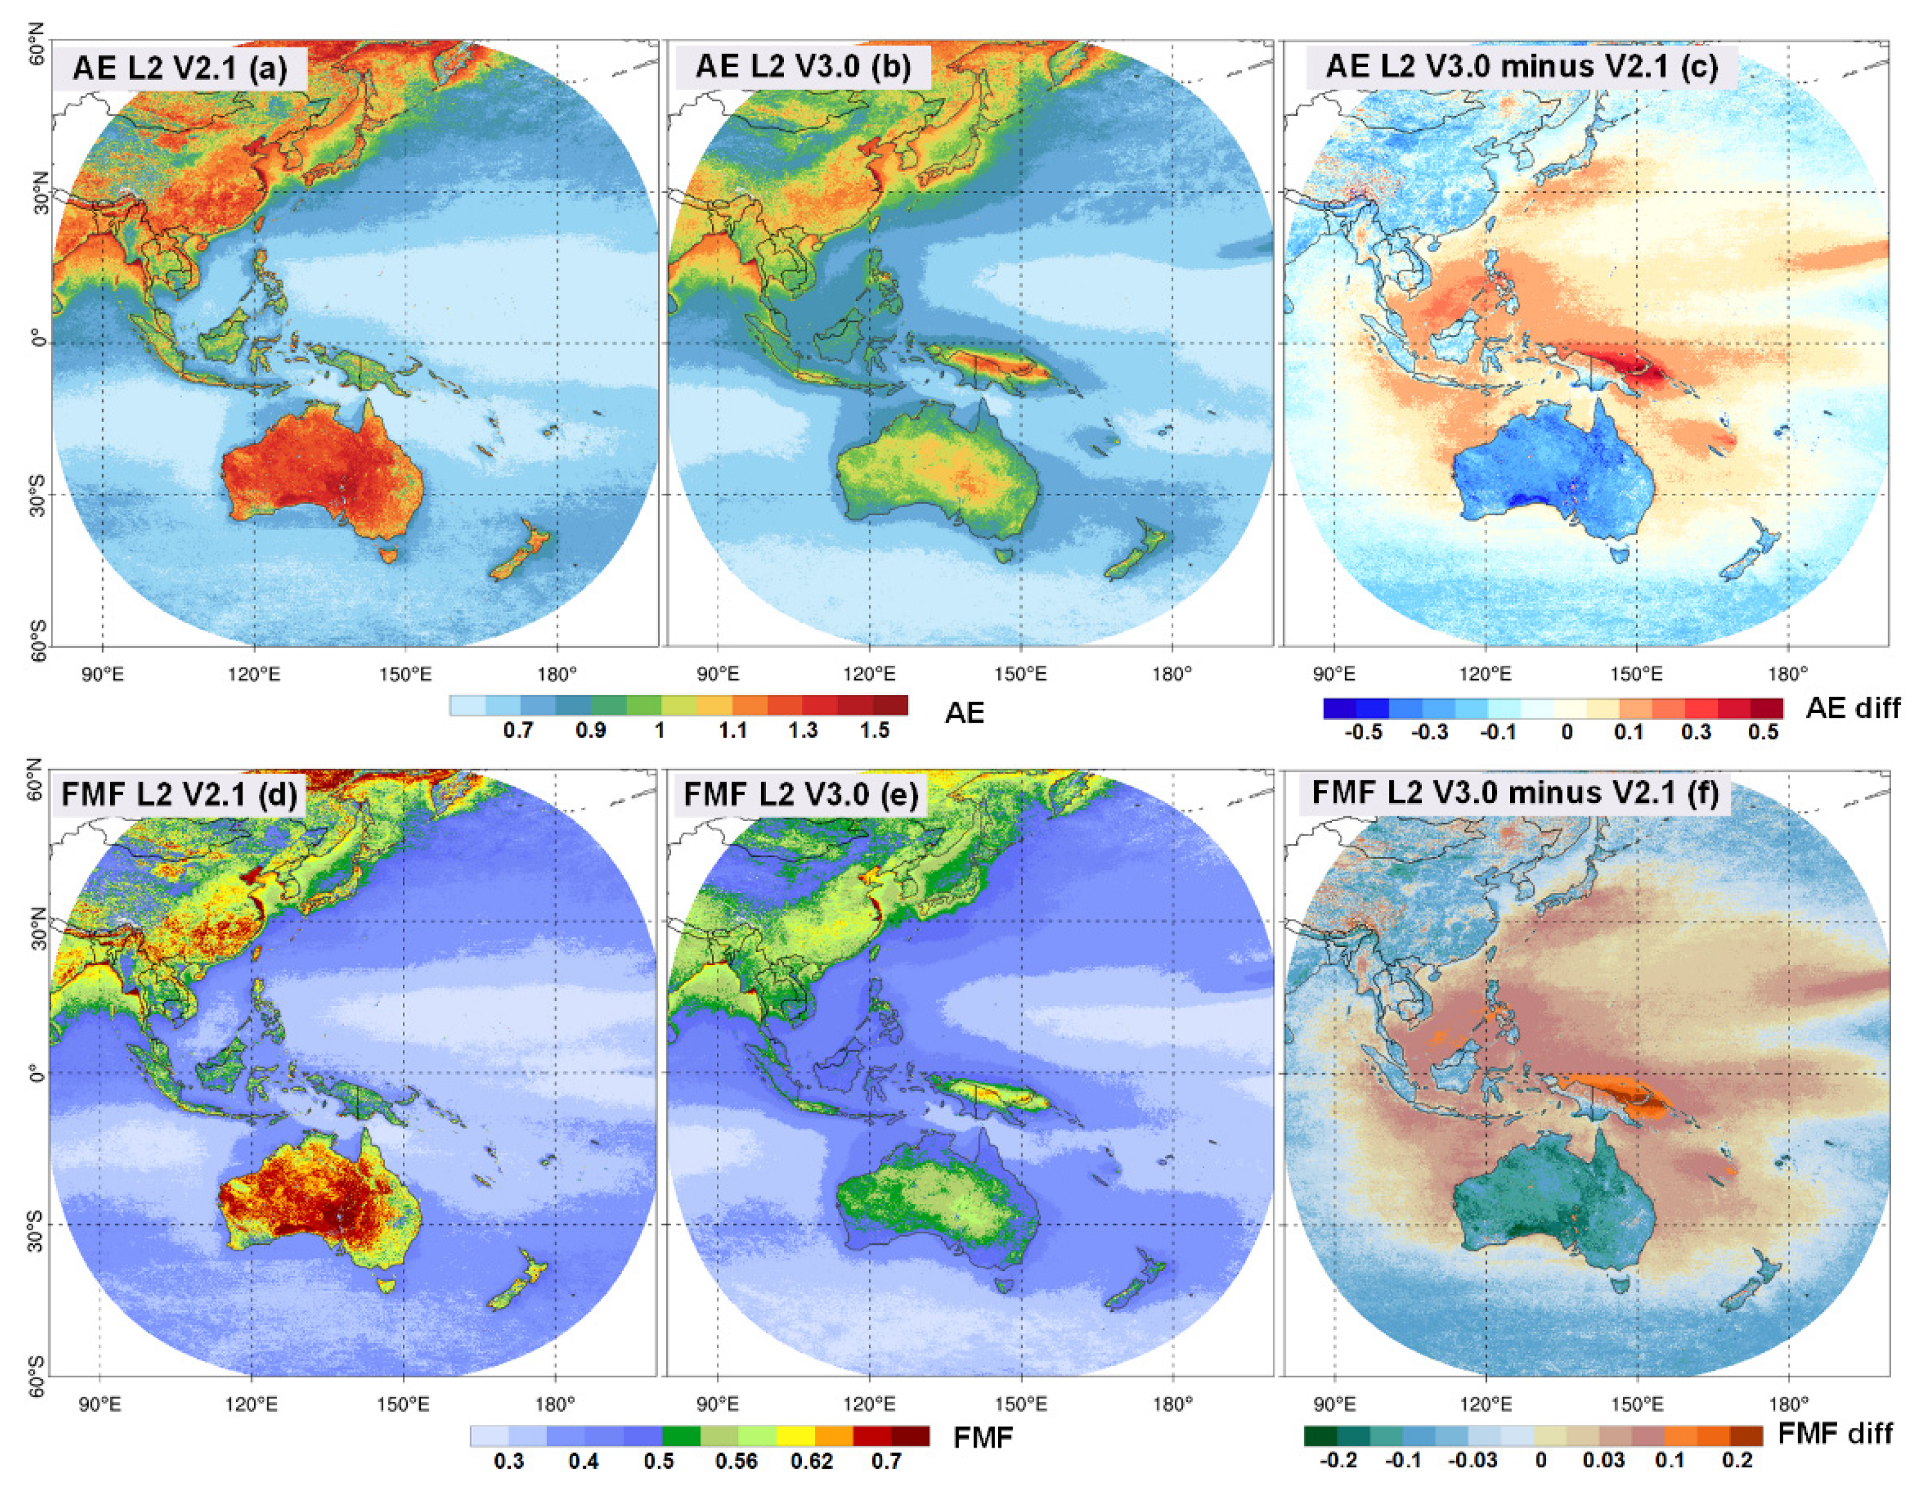
2.1. Study Area and Himawari-8 V2.1 & V3.0 Aerosol Products
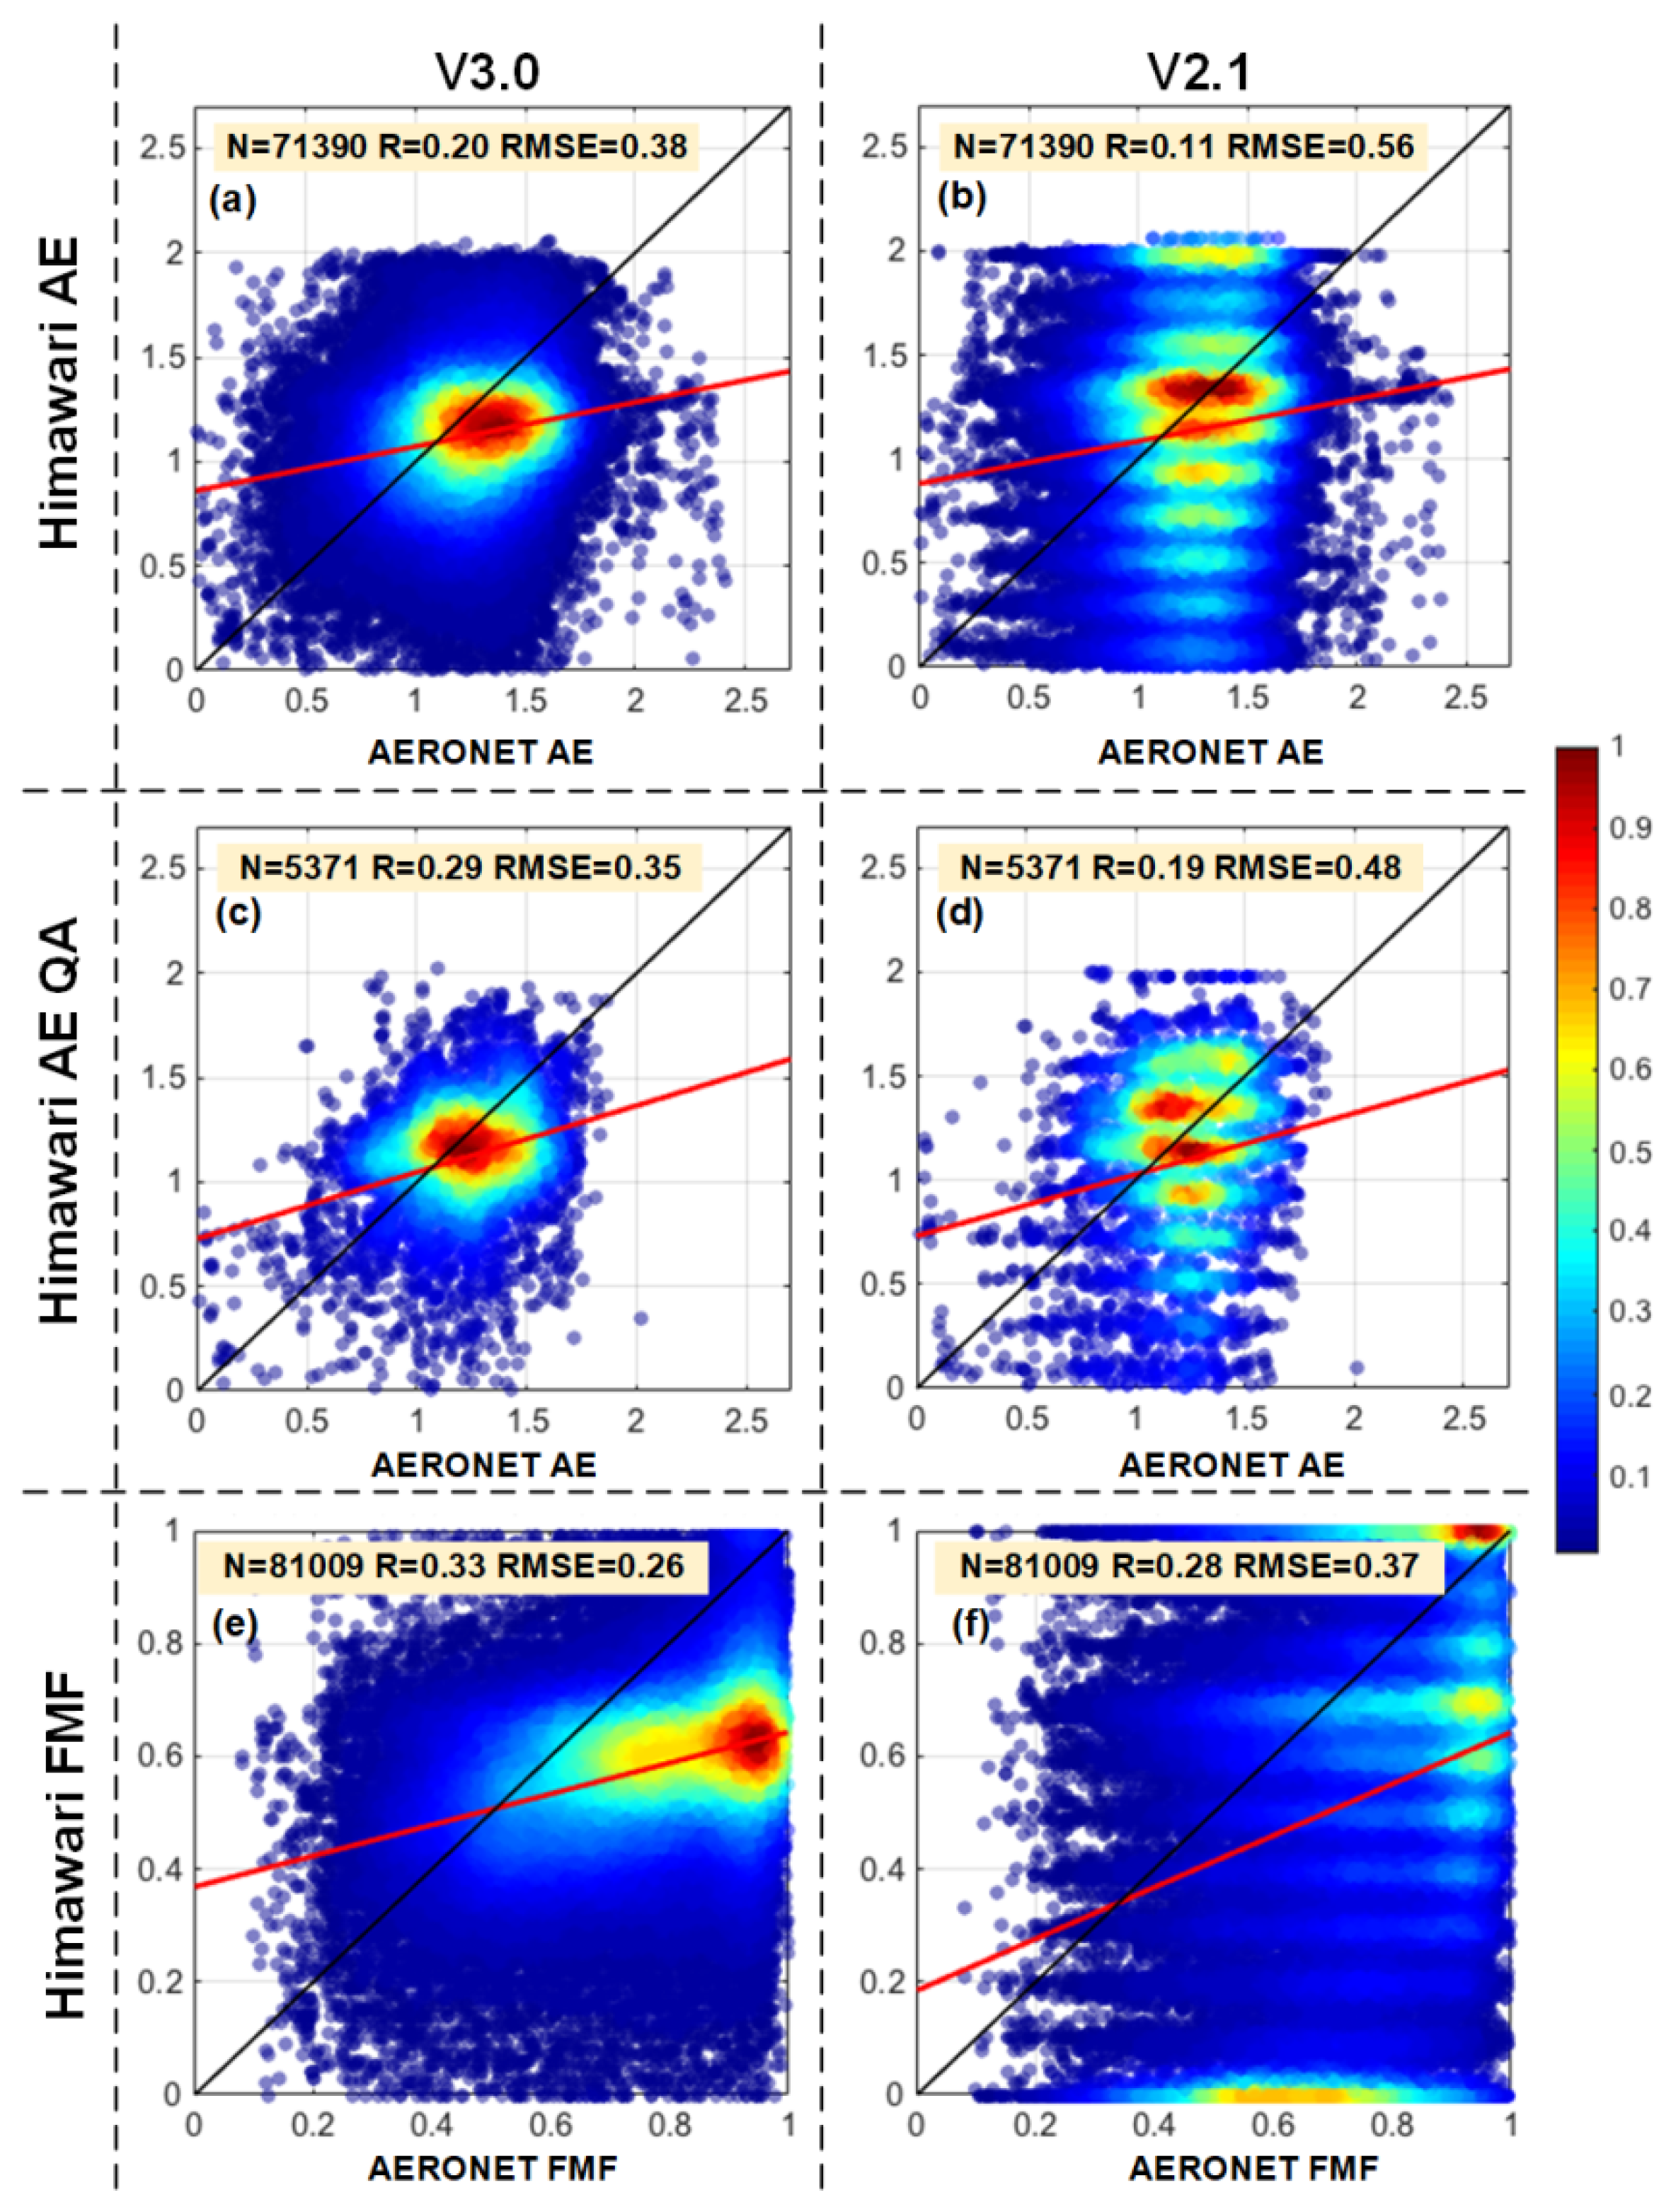
2.2. AERONET V3.0 Level 1.5 and Level 2.0
2.3. Ground-Based PM2.5, Meteorological, and Radiosonde Data
2.4. Classical Machine Learning Models
- (1)
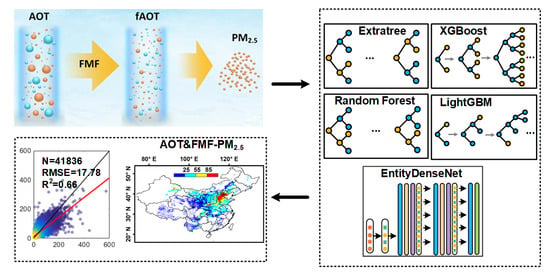
- Extratree is a supervised ensemble learning model that consists of the ensembles of unpruned classification or regression trees [43]. It uses a random value for the split of each node, which leads to more diversified trees and fewer splitters. Previous studies have used Extratree in both prediction [44] and classification [45].
- (2)
- Random Forest (RF) is a supervised ensemble learning model introduced by Ho [46], and its construction is based on the ensembles of unpruned classification or regression trees. It operates by selecting random features in the tree induction and bootstrap samples of the training data, and it splits each node in accordance with the largest information gain. RF has been widely applied in PM2.5 estimations in previous studies [17].
- (3)
- Extreme Gradient Boosting (XGBoost) is a machine learning algorithm based on the gradient boosting decision tree (GBDT) proposed by Chen and Guestrin [47]. It can conduct parallel computation efficiently, and it uses fewer computing resources than other methods. In XGBoost, each decision tree is split by a level-wise algorithm that is based on different independent variables. Pan [48] used XGBoost to forecast hourly PM2.5 in Tianjin based on data from air-monitoring stations.
- (4)
- LightGBM also has a GBDT framework. It grows trees using a leaf-wise algorithm and it only grows a leaf with the max delta loss. Compared to a level-wise algorithm, LightGBM shows higher loss reduction on the same leaf. Zhong et al. [49] utilized LightGBM to predict historical PM2.5 based on meteorological observations.
2.5. Deep Learning Model EntityDenseNet
2.6. Model Training and Validation
3. Results
3.1. Linear and Non-Linear Relationships between fAOT and PM2.5
3.2. Evaluation of Himawari-8 V3.0 Aerosol Size Data and Its Performance in PM2.5 Retrievals
3.3. Application of FMF for Conducting PM2.5 Estimations in China
4. Discussion
5. Conclusions
Supplementary Materials
Author Contributions
Funding
Data Availability Statement
Acknowledgments
Conflicts of Interest
References
- Bell, M.L.; Ebisu, K.; Peng, R.D. Community-level spatial heterogeneity of chemical constituent levels of fine particulates and implications for epidemiological research. J. Expo. Sci. Environ. Epidemiol. 2011, 21, 372–384. [Google Scholar] [CrossRef] [Green Version]
- Xu, P.; Chen, Y.; Ye, X. Haze, air pollution, and health in China. Lancet 2013, 382, 2067. [Google Scholar] [CrossRef]
- Van Donkelaar, A.; Martin, R.; Brauer, M.; Hsu, N.C.; Kahn, R.A.; Levy, R.C.; Lyapustin, A.; Sayer, A.; Winker, D.M. Global Estimates of Fine Particulate Matter using a Combined Geophysical-Statistical Method with Information from Satellites, Models, and Monitors. Environ. Sci. Technol. 2016, 50, 3762–3772. [Google Scholar] [CrossRef]
- Schaap, M.; Apituley, A.; Timmermans, R.M.A.; Koelemeijer, R.B.A.; De Leeuw, G. Exploring the relation between aerosol optical depth and PM2.5 at Cabauw, the Netherlands. Atmos. Chem. Phys. Discuss. 2009, 9, 909–925. [Google Scholar] [CrossRef] [Green Version]
- Gupta, P.; Christopher, S.A.; Wang, J.; Gehrig, R.; Lee, Y.; Kumar, N. Satellite remote sensing of particulate matter and air quality assessment over global cities. Atmos. Environ. 2006, 40, 5880–5892. [Google Scholar] [CrossRef]
- Guo, Y.; Feng, N.; Christopher, S.A.; Kang, P.; Zhan, F.B.; Hong, S. Satellite remote sensing of fine particulate matter (PM2.5) air quality over Beijing using MODIS. Int. J. Remote Sens. 2014, 35. [Google Scholar] [CrossRef]
- Van Donkelaar, A.; Martin, R.V.; Brauer, M.; Kahn, R.; Levy, R.; Verduzco, C.; Villeneuve, P.J. Global Estimates of Ambient Fine Particulate Matter Concentrations from Satellite-Based Aerosol Optical Depth: Development and Application. Environ. Health Perspect. 2010, 118, 847–855. [Google Scholar] [CrossRef] [Green Version]
- Zhang, Y.; Li, Z.; Bai, K.; Wei, Y.; Xie, Y.; Zhang, Y.; Ou, Y.; Cohen, J.; Zhang, Y.; Peng, Z.; et al. Satellite remote sensing of atmospheric particulate matter mass concentration: Advances, challenges, and perspectives. Fundam. Res. 2021, 1, 240–258. [Google Scholar] [CrossRef]
- Remer, L.A.; Kaufman, Y.J.; Tanré, D.; Mattoo, S.; Chu, D.A.; Martins, J.V.; Li, R.R.; Ichoku, C.; Levy, R.C.; Kleidman, R.G.; et al. The MODIS Aerosol Algorithm, Products, and Validation. J. Atmos. Sci. 2005, 62, 947–973. [Google Scholar] [CrossRef] [Green Version]
- Veihelmann, B.; Levelt, P.P.; Stammes, P.; Veefkind, J.P. Simulation study of the aerosol information content in OMI spectral reflectance measurements. Atmos. Chem. Phys. Discuss. 2007, 7, 3115–3127. [Google Scholar] [CrossRef] [Green Version]
- Jackson, J.M.; Liu, H.; Laszlo, I.; Kondragunta, S.; Remer, L.A.; Huang, J.; Huang, H.-C. Suomi-NPP VIIRS aerosol algorithms and data products. J. Geophys. Res. Atmos. 2013, 118, 12673–12689. [Google Scholar] [CrossRef]
- Bessho, K.; Date, K.; Hayashi, M.; Ikeda, A.; Imai, T.; Inoue, H.; Kumagai, Y.; Miyakawa, T.; Murata, H.; Ohno, T.; et al. An Introduction to Himawari-8/9—Japan’s New-Generation Geostationary Meteorological Satellites. J. Meteorol. Soc. Jpn. 2006, 94, 151–183. [Google Scholar] [CrossRef] [Green Version]
- Zhao, A.; Li, Z.; Zhang, Y.; Zhang, Y.; Li, D. Merging MODIS and Ground-Based Fine Mode Fraction of Aerosols Based on the Geostatistical Data Fusion Method. Atmosphere 2017, 8, 117. [Google Scholar] [CrossRef] [Green Version]
- Zhang, Y.; Li, Z. Remote sensing of atmospheric fine particulate matter (PM2.5) mass concentration near the ground from satellite observation. Remote Sens. Environ. 2015, 160, 252–262. [Google Scholar] [CrossRef]
- Liang, C.; Zang, Z.; Li, Z.; Yan, X. An Improved Global Land Anthropogenic Aerosol Product Based on Satellite Retrievals From 2008 to 2016. IEEE Geosci. Remote Sens. Lett. 2021, 18, 944–948. [Google Scholar] [CrossRef]
- Yan, X.; Shi, W.; Li, Z.; Li, Z.; Luo, N.; Zhao, W.; Wang, H.; Yu, X. Satellite-based PM2.5 estimation using fine-mode aerosol optical thickness over China. Atmos. Environ. 2017, 170, 290–302. [Google Scholar] [CrossRef]
- Geng, G.; Meng, X.; He, K.; Liu, Y. Random forest models for PM2.5 speciation concentrations using MISR fractional AODs. Environ. Res. Lett. 2020, 15, 034056. [Google Scholar] [CrossRef]
- Huang, K.; Xiao, Q.; Meng, X.; Geng, G.; Wang, Y.; Lyapustin, A.; Gu, D.; Liu, Y. Predicting monthly high-resolution PM2.5 concentrations with random forest model in the North China Plain. Environ. Pollut. 2018, 242, 675–683. [Google Scholar] [CrossRef]
- Li, L. A Robust Deep Learning Approach for Spatiotemporal Estimation of Satellite AOD and PM2.5. Remote Sens. 2020, 12. [Google Scholar] [CrossRef] [Green Version]
- Wang, Q.; Ding, X.; Tong, X.; Atkinson, P. Spatio-temporal spectral unmixing of time-series images. Remote Sens. Environ. 2021, 259, 112407. [Google Scholar] [CrossRef]
- Levy, R.C.; A Remer, L.; Kleidman, R.; Mattoo, S.K.; Ichoku, C.; Kahn, R.; Eck, T.F. Global evaluation of the Collection 5 MODIS dark-target aerosol products over land. Atmos. Chem. Phys. Discuss. 2010, 10, 10399–10420. [Google Scholar] [CrossRef] [Green Version]
- Yang, X.; Zhao, C.; Luo, N.; Zhao, W.; Shi, W.; Yan, X. Evaluation and Comparison of Himawari-8 L2 V1.0, V2.1 and MODIS C6.1 aerosol products over Asia and the oceania regions. Atmos. Environ. 2020, 220, 117068. [Google Scholar] [CrossRef]
- Choi, M.; Kim, J.; Lee, J.; Kim, M.; Park, Y.J.; Jeong, U.; Kim, W.; Hong, H.; Holben, B.; Eck, T.F.; et al. GOCI Yonsei Aerosol Retrieval (YAER) algorithm and validation during the DRAGON-NE Asia 2012 campaign. Atmos. Meas. Tech. 2016, 9, 1377–1398. [Google Scholar] [CrossRef] [Green Version]
- Wei, Y.; Li, Z.; Zhang, Y.; Chen, C.; Dubovik, O.; Xu, H.; Li, K.; Chen, J.; Wang, H.; Ge, B.; et al. Validation of POLDER GRASP aerosol optical retrieval over China using SONET observations. J. Quant. Spectrosc. Radiat. Transf. 2020, 246, 106931. [Google Scholar] [CrossRef]
- Zhang, Y.; Li, Z.; Liu, Z.; Wang, Y.; Qie, L.; Xie, Y.; Hou, W.; Leng, L. Retrieval of aerosol fine-mode fraction over China from satellite multiangle polarized observations: Validation and comparison. Atmos. Meas. Tech. 2021, 14, 1655–1672. [Google Scholar] [CrossRef]
- Wang, Q.; Tang, Y.; Tong, X.; Atkinson, P. Virtual image pair-based spatio-temporal fushion. Remote Sens. Environ. 2020, 249, 112009. [Google Scholar] [CrossRef]
- Okuyama, A.; Andou, A.; Date, K.; Hoasaka, K.; Mori, N.; Murata, H.; Tabata, T.; Takahashi, M.; Yoshino, R.; Bessho, K. Preliminary validation of Himawari-8/AHI navigation and calibration. Earth Obs. Syst. XX 2015, 9607, 96072. [Google Scholar] [CrossRef]
- Xu, Q.; Chen, X.; Yang, S.; Tang, L.; Dong, J. Spatiotemporal relationship between Himawari-8 hourly columnar aerosol optical depth (AOD) and ground-level PM2.5 mass concentration in mainland China. Sci. Total Environ. 2021, 765, 144241. [Google Scholar] [CrossRef]
- Fukuda, S.; Nakajima, T.; Takenaka, H.; Higurashi, A.; Kikuchi, N.; Nakajima, T.Y.; Ishida, H. New approaches to removing cloud shadows and evaluating the 380 nm surface reflectance for improved aerosol optical thickness retrievals from the GOSAT/TANSO-Cloud and Aerosol Imager. J. Geophys. Res. Atmos. 2013, 118, 13520–13531. [Google Scholar] [CrossRef]
- Yoshida, M.; Kikuchi, M.; Nagao, T.M.; Murakami, H.; Nomaki, T.; Higurashi, A. Common Retrieval of Aerosol Properties for Imaging Satellite Sensors. J. Meteorol. Soc. Jpn. 2018, 96B, 193–209. [Google Scholar] [CrossRef] [Green Version]
- Gao, L.; Chen, L.; Li, C.; Li, J.; Che, H.; Zhang, Y. Evaluation and possible uncertainty source analysis of JAXA Himawari-8 aerosol optical depth product over China. Atmos. Res. 2021, 248, 105248. [Google Scholar] [CrossRef]
- Eck, T.F.; Holben, B.N.; Reid, J.S.; Dubovik, O.; Smirnov, A.; O’Neill, N.T.; Slutsker, I.; Kinne, S. Wavelength dependence of the optical depth of biomass burning, urban, and desert dust aerosols. J. Geophys. Res. Atmos. 1999, 104, 31333–31349. [Google Scholar] [CrossRef]
- Giles, D.M.; Sinyuk, A.; Sorokin, M.G.; Schafer, J.S.; Smirnov, A.; Slutsker, I.; Eck, T.F.; Holben, B.N.; Lewis, J.R.; Campbell, J.R.; et al. Advancements in the Aerosol Robotic Network (AERONET) Version 3 database–automated near-real-time quality control algorithm with improved cloud screening for Sun photometer aerosol optical depth (AOD) measurements. Atmos. Meas. Tech. 2019, 12, 169–209. [Google Scholar] [CrossRef] [Green Version]
- O’Neill, N.T.; Eck, T.F.; Smirnov, A.; Holben, B.N.; Thulasiraman, S. Spectral discrimination of coarse and fine mode optical depth. J. Geophys. Res. Space Phys. 2003, 108, 4559–4573. [Google Scholar] [CrossRef]
- Levy, R.C.; Remer, L.A.; Mattoo, S.; Vermote, E.F.; Kaufman, Y.J. Second-generation operational algorithm: Retrieval of aerosol properties over land from inversion of Moderate Resolution Imaging Spectroradiometer spectral reflectance. J. Geophys. Res. Space Phys. 2007, 112. [Google Scholar] [CrossRef] [Green Version]
- Levy, R.C.; Munchak, L.A.; Mattoo, S.K.; Patadia, F.; Remer, L.A.; Holz, R.E. Towards a long-term global aerosol optical depth record: Applying a consistent aerosol retrieval algorithm to MODIS and VIIRS-observed reflectance. Atmos. Meas. Tech. 2015, 8, 4083–4110. [Google Scholar] [CrossRef] [Green Version]
- Kleidman, R.G.; O’Neill, N.T.; Remer, L.A.; Kaufman, Y.J.; Eck, T.F.; Tanré, D.; Dubovik, O.; Holben, B.N. Comparison of Moderate Resolution Imaging Spectroradiometer (MODIS) and Aerosol Robotic Network (AERONET) remote-sensing retrievals of aerosol fine mode fraction over ocean. J. Geophys. Res. Space Phys. 2005, 110. [Google Scholar] [CrossRef]
- Yan, X.; Li, Z.; Shi, W.; Luo, N.; Wu, T.; Zhao, W. An improved algorithm for retrieving the fine-mode fraction of aerosol optical thickness, part 1: Algorithm development. Remote Sens. Environ. 2017, 192, 87–97. [Google Scholar] [CrossRef] [Green Version]
- Chen, C.; Dubovik, O.; Fuertes, D.; Litvinov, P.; Lapyonok, T.; Lopatin, A.; Ducos, F.; Derimian, Y.; Herman, M.; Tanré, D.; et al. Validation of GRASP algorithm product from POLDER/PARASOL data and assessment of multi-angular polarimetry potential for aerosol monitoring. Earth Syst. Sci. Data 2020, 12, 3573–3620. [Google Scholar] [CrossRef]
- Yan, X.; Zang, Z.; Jiang, Y.; Shi, W.; Guo, Y.; Li, D.; Zhao, C.; Husi, L. A Spatial-Temporal Interpretable Deep Learning Model for improving interpretability and predictive accuracy of satellite-based PM2.5. Environ. Pollut. 2021, 273, 116459. [Google Scholar] [CrossRef]
- Holzworth, G.C. Estimates of Mean Maximum Mixing Depths in the Contiguous United States. J. Mon. Weather Rev. 1964, 92, 235. [Google Scholar] [CrossRef] [Green Version]
- Seibert, P.; Beyrich, F.; Gryning, S.-E.; Joffre, S.; Rasmussen, A.; Tercier, P. Chapter 20 Review and intercomparison of operational methods for the determination of the mixing height. Atmos. Environ. 2000, 34, 1001–1027. [Google Scholar] [CrossRef]
- Geurts, P.; Ernst, D.; Wehenkel, L. Extremely randomized trees. Mach. Learn. 2006, 63, 3–42. [Google Scholar] [CrossRef] [Green Version]
- Chu, Z.; Yu, J.; Hamdulla, A. Throughput prediction based on ExtraTree for stream processing tasks. Comput. Sci. Inf. Syst. 2021, 18, 1–22. [Google Scholar] [CrossRef]
- Carruba, V.; Aljbaae, S.; Domingos, R.C.; Lucchini, A.; Furlaneto, P. Machine learning classification of new asteroid families members. Mon. Not. R. Astron. Soc. 2020, 496, 540–549. [Google Scholar] [CrossRef]
- Ho, T.K. Random decision forests. In Proceedings of the 3rd International Conference on Document Analysis and Recognition, Montreal, QC, Canada, 14–16 August 1995; Volume 1, p. 278. [Google Scholar]
- Chen, T.; Guestrin, C. XGBoost: A Scalable Tree Boosting System. In Proceedings of the 22nd ACM Sigkdd International Conference on Knowledge Discovery and Data Mining, San Francisco, CA, USA, 13–17 August 2016; pp. 785–794. [Google Scholar]
- Pan, B. Application of XGBoost algorithm in hourly PM2.5 concentration prediction. IOP Conf. Ser. Earth Environ. Sci. 2018, 113, 012127. [Google Scholar] [CrossRef] [Green Version]
- Zhong, J.; Zhang, X.; Gui, K.; Wang, Y.; Che, H.; Shen, X.; Zhang, L.; Zhang, Y.; Sun, J.; Zhang, W. Robust prediction of hourly PM2.5 from meteorological data using LightGBM. Natl. Sci. Rev. 2021. [Google Scholar] [CrossRef]
- Yan, X.; Zang, Z.; Luo, N.; Jiang, Y.; Li, Z. New interpretable deep learning model to monitor real-time PM2.5 concentrations from satellite data. Environ. Int. 2020, 144, 106060. [Google Scholar] [CrossRef] [PubMed]
- Guo, C.; Berkhahn, F. Entity Embeddings of Categorical Variables. arXiv 2016, arXiv:1604.06737. [Google Scholar]
- Yan, X.; Liang, C.; Jiang, Y.; Luo, N.; Zang, Z.; Li, Z. A Deep Learning Approach to Improve the Retrieval of Temperature and Humidity Profiles from a Ground-Based Microwave Radiometer. IEEE Trans. Geosci. Remote Sens. 2020, 58, 8427–8437. [Google Scholar] [CrossRef]
- Nair, V.; Hinton, G.E. Rectified linear units improve restricted boltzmann machines. In Proceedings of the 27th International Conference on Machine Learning, Haifa, Israel, 21 June 2010; pp. 807–814. [Google Scholar]
- Ioffe, S.; Szegedy, C. Batch normalization: Accelerating deep network training by reducing internal covariate shift. In Proceedings of the 32nd International Conference on International Conference on Machine Learning, Lille, France, 6–11 July 2015; Volume 37, pp. 448–456. [Google Scholar]
- Srivastava, N.; Hinton, G.; Krizhevsky, A.; Sutskever, I.; Salakhutdinov, R. Dropout: A Simple Way to Prevent Neural Networks from Overfitting. J. Mach. Learn. Res. 2014, 15, 1929–1958. [Google Scholar]
- Beck, H.E.; Zimmermann, N.E.; McVicar, T.; Vergopolan, N.; Berg, A.; Wood, E.F. Present and future Köppen-Geiger climate classification maps at 1-km resolution. Sci. Data 2018, 5, 180214. [Google Scholar] [CrossRef] [PubMed] [Green Version]
- Wang, B.; Yuan, Q.; Yang, Q.; Zhu, L.; Li, T.; Zhang, L. Estimate hourly PM2.5 concentrations from Himawari-8 TOA reflectance directly using Geo-intelligent long short-term memory network. Environ. Pollut. 2020, 271, 116327. [Google Scholar] [CrossRef] [PubMed]
- Glorot, X.; Bengio, Y. Understanding the difficulty of training deep feedforward neural networks. J. Mach. Learn. Res. Proc. Track 2010, 9, 249–256. [Google Scholar]
- Zhang, Y.; Li, Z. Estimation of PM2.5 from fine-mode aerosol optical depth. J. Remote Sens. 2013, 17, 929–943. [Google Scholar]
- Tian, S.; Pan, Y.; Liu, Z.; Wen, T.; Wang, Y. Size-resolved aerosol chemical analysis of extreme haze pollution events during early 2013 in urban Beijing, China. J. Hazard. Mater. 2014, 279, 452–460. [Google Scholar] [CrossRef]
- Lang, H.; Qin, K.; Yuan, L.; Xiao, X.; Hu, M.; Rao, L.; Wang, L. Particles size distributions and aerosol optical properties during haze-fog episodes in the winter of Xuzhou. China Environ. Sci. 2016, 36, 2260–2269. [Google Scholar]
- Jiang, Q.; Wang, F.; Sun, Y.-L. Analysis of Chemical Composition, Source and Evolution of Submicron Particles in Xianghe, Hebei Province. China Environ. Sci. 2018, 39, 3022–3032. [Google Scholar]
- Butler, T.; Lawrence, M.; Gurjar, B.R.; van Aardenne, J.; Schultz, M.; Lelieveld, J. The representation of emissions from megacities in global emission inventories. Atmos. Environ. 2008, 42, 703–719. [Google Scholar] [CrossRef]
- De Meij, A.; Pozzer, A.; Lelieveld, J. Global and regional trends in aerosol optical depth based on remote sensing products and pollutant emission estimates between 2000 and 2009. Atmos. Chem. Phys. Discuss. 2010, 10, 30731–30776. [Google Scholar]
- Kaskaoutis, D.G.; Kharol, S.K.; Sinha, P.R.; Singh, R.P.; Badarinath, K.V.S.; Mehdi, W.; Sharma, M. Contrasting aerosol trends over South Asia during the last decade based on MODIS observations. Atmos. Meas. Tech. Discuss. 2011, 4, 5275–5323. [Google Scholar]
- Reisen, F.; Meyer, C.P.; Keywood, M. Impact of biomass burning sources on seasonal aerosol air quality. Atmos. Environ. 2013, 67, 437–447. [Google Scholar] [CrossRef]
- Sawyer, V.; Levy, R.C.; Mattoo, S.; Cureton, G.; Shi, Y.; Remer, L.A. Continuing the MODIS Dark Target Aerosol Time Series with VIIRS. Remote Sens. 2020, 12, 308. [Google Scholar] [CrossRef] [Green Version]
- Choi, Y.-S.; Park, R.J.; Ho, C.-H. Estimates of ground-level aerosol mass concentrations using a chemical transport model with Moderate Resolution Imaging Spectroradiometer (MODIS) aerosol observations over East Asia. J. Geophys. Res. Atmos. 2009, 114. [Google Scholar] [CrossRef] [Green Version]
- Di Nicolantonio, W.; Cacciari, A.; Bolzacchini, E. MODIS Aerosol Optical Properties Over North Italy for Estimating Surface-level PM2.5. In Proceedings of the Envisat Symposium, Montreux, Switzerland, 23–27 April 2007; pp. 3–27. [Google Scholar]
- Yang, Q.; Yuan, Q.; Yue, L.; Li, T.; Shen, H.; Zhang, L. The relationships between PM2.5 and aerosol optical depth (AOD) in mainland China: About and behind the spatio-temporal variations. Environ. Pollut. 2019, 248, 526–535. [Google Scholar] [CrossRef] [PubMed]
- Zheng, C.; Zhao, C.; Zhu, Y.; Wang, Y.; Shi, X.; Wu, X.; Chen, T.; Wu, F.; Qiu, Y. Analysis of influential factors for the relationship between PM2.5 and AOD in Beijing. Atmos. Chem. Phys. Discuss. 2017, 17, 13473–13489. [Google Scholar] [CrossRef] [Green Version]
- She, Q.; Choi, M.; Belle, J.H.; Xiao, Q.; Bi, J.; Huang, K.; Meng, X.; Geng, G.; Kim, J.; He, K.; et al. Satellite-based estimation of hourly PM2.5 levels during heavy winter pollution episodes in the Yangtze River Delta, China. Chemosphere 2020, 239, 124678. [Google Scholar] [CrossRef]
- Chen, X.; de Leeuw, G.; Arola, A.; Liu, S.; Liu, Y.; Li, Z.; Zhang, K. Joint retrieval of the aerosol fine mode fraction and optical depth using MODIS spectral reflectance over northern and eastern China: Artificial neural network method. Remote Sens. Environ. 2020, 249, 112006. [Google Scholar] [CrossRef]
- Yan, X.; Zang, Z.; Liang, C.; Luo, N.; Ren, R.; Cribb, M.; Li, Z. New global aerosol fine-mode fraction data over land derived from MODIS satellite retrievals. Environ. Pollut. 2021, 276, 116707. [Google Scholar] [CrossRef]


Publisher’s Note: MDPI stays neutral with regard to jurisdictional claims in published maps and institutional affiliations. |
© 2021 by the authors. Licensee MDPI, Basel, Switzerland. This article is an open access article distributed under the terms and conditions of the Creative Commons Attribution (CC BY) license (https://creativecommons.org/licenses/by/4.0/).
Share and Cite
Zang, Z.; Li, D.; Guo, Y.; Shi, W.; Yan, X. Superior PM2.5 Estimation by Integrating Aerosol Fine Mode Data from the Himawari-8 Satellite in Deep and Classical Machine Learning Models. Remote Sens. 2021, 13, 2779. https://0-doi-org.brum.beds.ac.uk/10.3390/rs13142779
Zang Z, Li D, Guo Y, Shi W, Yan X. Superior PM2.5 Estimation by Integrating Aerosol Fine Mode Data from the Himawari-8 Satellite in Deep and Classical Machine Learning Models. Remote Sensing. 2021; 13(14):2779. https://0-doi-org.brum.beds.ac.uk/10.3390/rs13142779
Chicago/Turabian StyleZang, Zhou, Dan Li, Yushan Guo, Wenzhong Shi, and Xing Yan. 2021. "Superior PM2.5 Estimation by Integrating Aerosol Fine Mode Data from the Himawari-8 Satellite in Deep and Classical Machine Learning Models" Remote Sensing 13, no. 14: 2779. https://0-doi-org.brum.beds.ac.uk/10.3390/rs13142779