
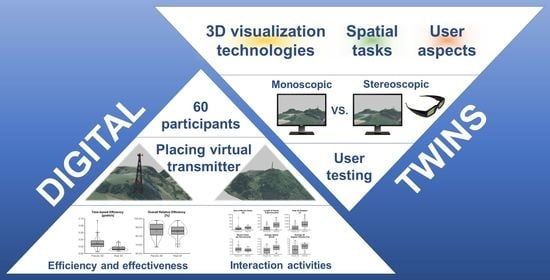
A Comparison of Monoscopic and Stereoscopic 3D Visualizations: Effect on Spatial Planning in Digital Twins

 , , , , , , and
Abstract
:
1. Introduction
2. Related Work
2.1. Technologies for 3D Geovisualizations
2.2. 3D Geovisualizations and Spatial Tasks
2.3. User Aspects
3. Materials and Methods
- RQ1: Does a user’s performance in spatial decision making differ between pseudo-3D and real-3D visualizations?
- o
- H1: Real-3D visualizations decrease participant effectiveness (correctness) in task solving.
- o
- H2: Real-3D visualizations decrease participant efficiency (response time) in task solving.
- RQ2: How the 3D visualization type affects a user’s strategy during spatial decision making?
- o
- H3: The interaction strategy is affected by the type of 3D visualization.
- o
- H4: The interaction activity relativized by task time (activity per second) is affected by the type of 3D visualization.
3.1. Participants
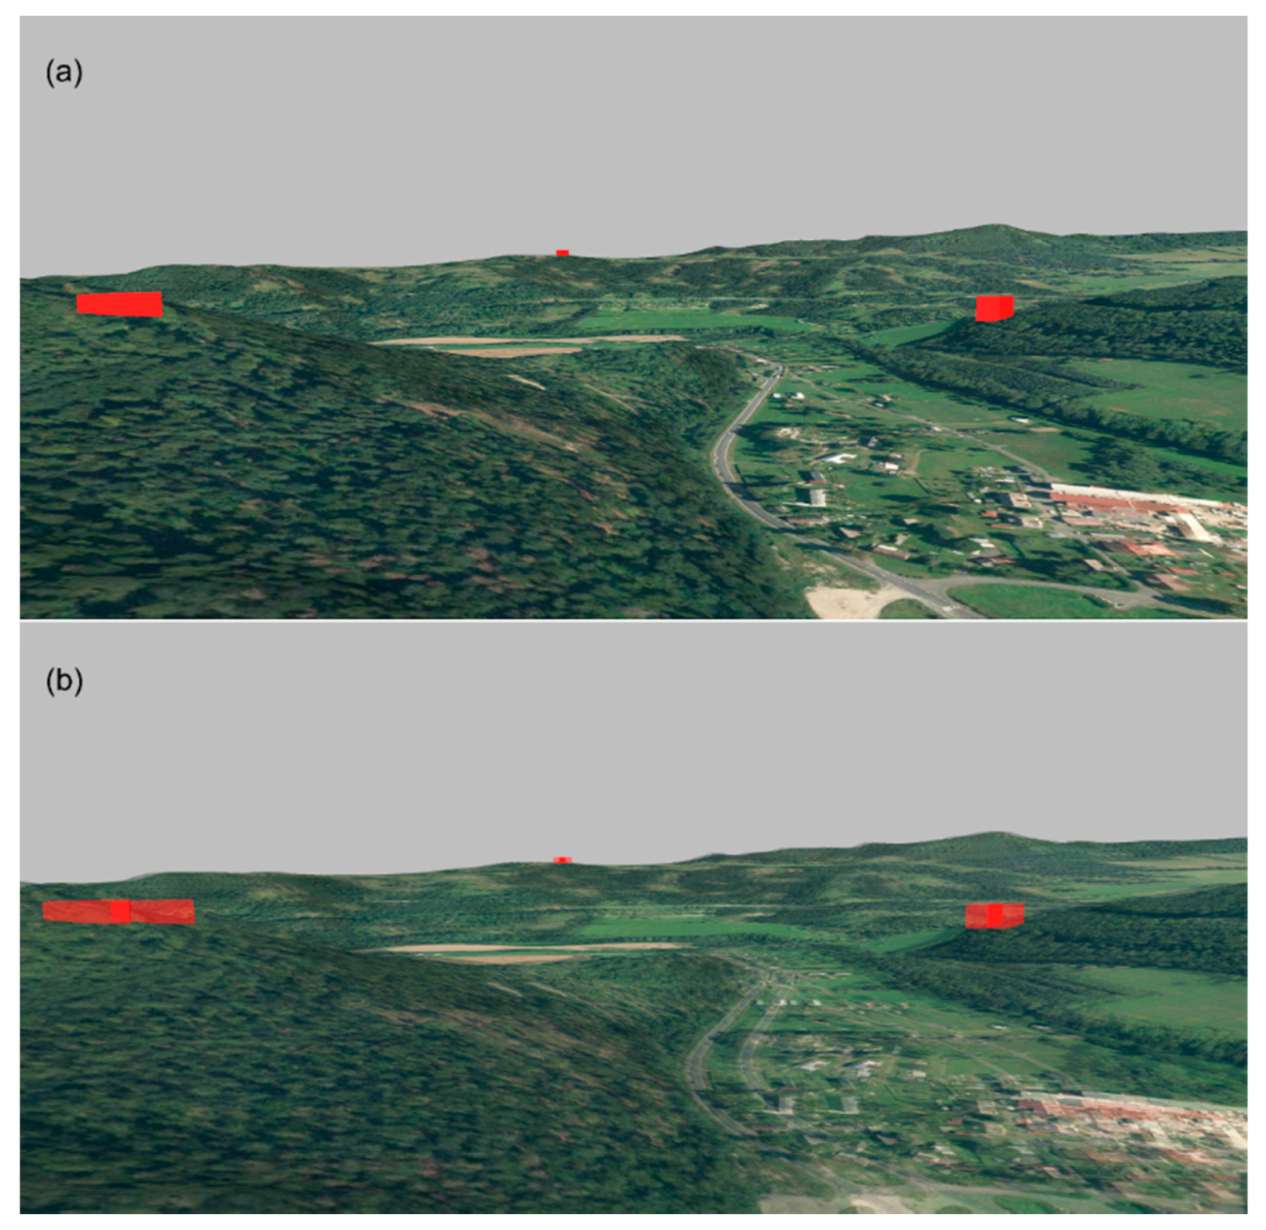
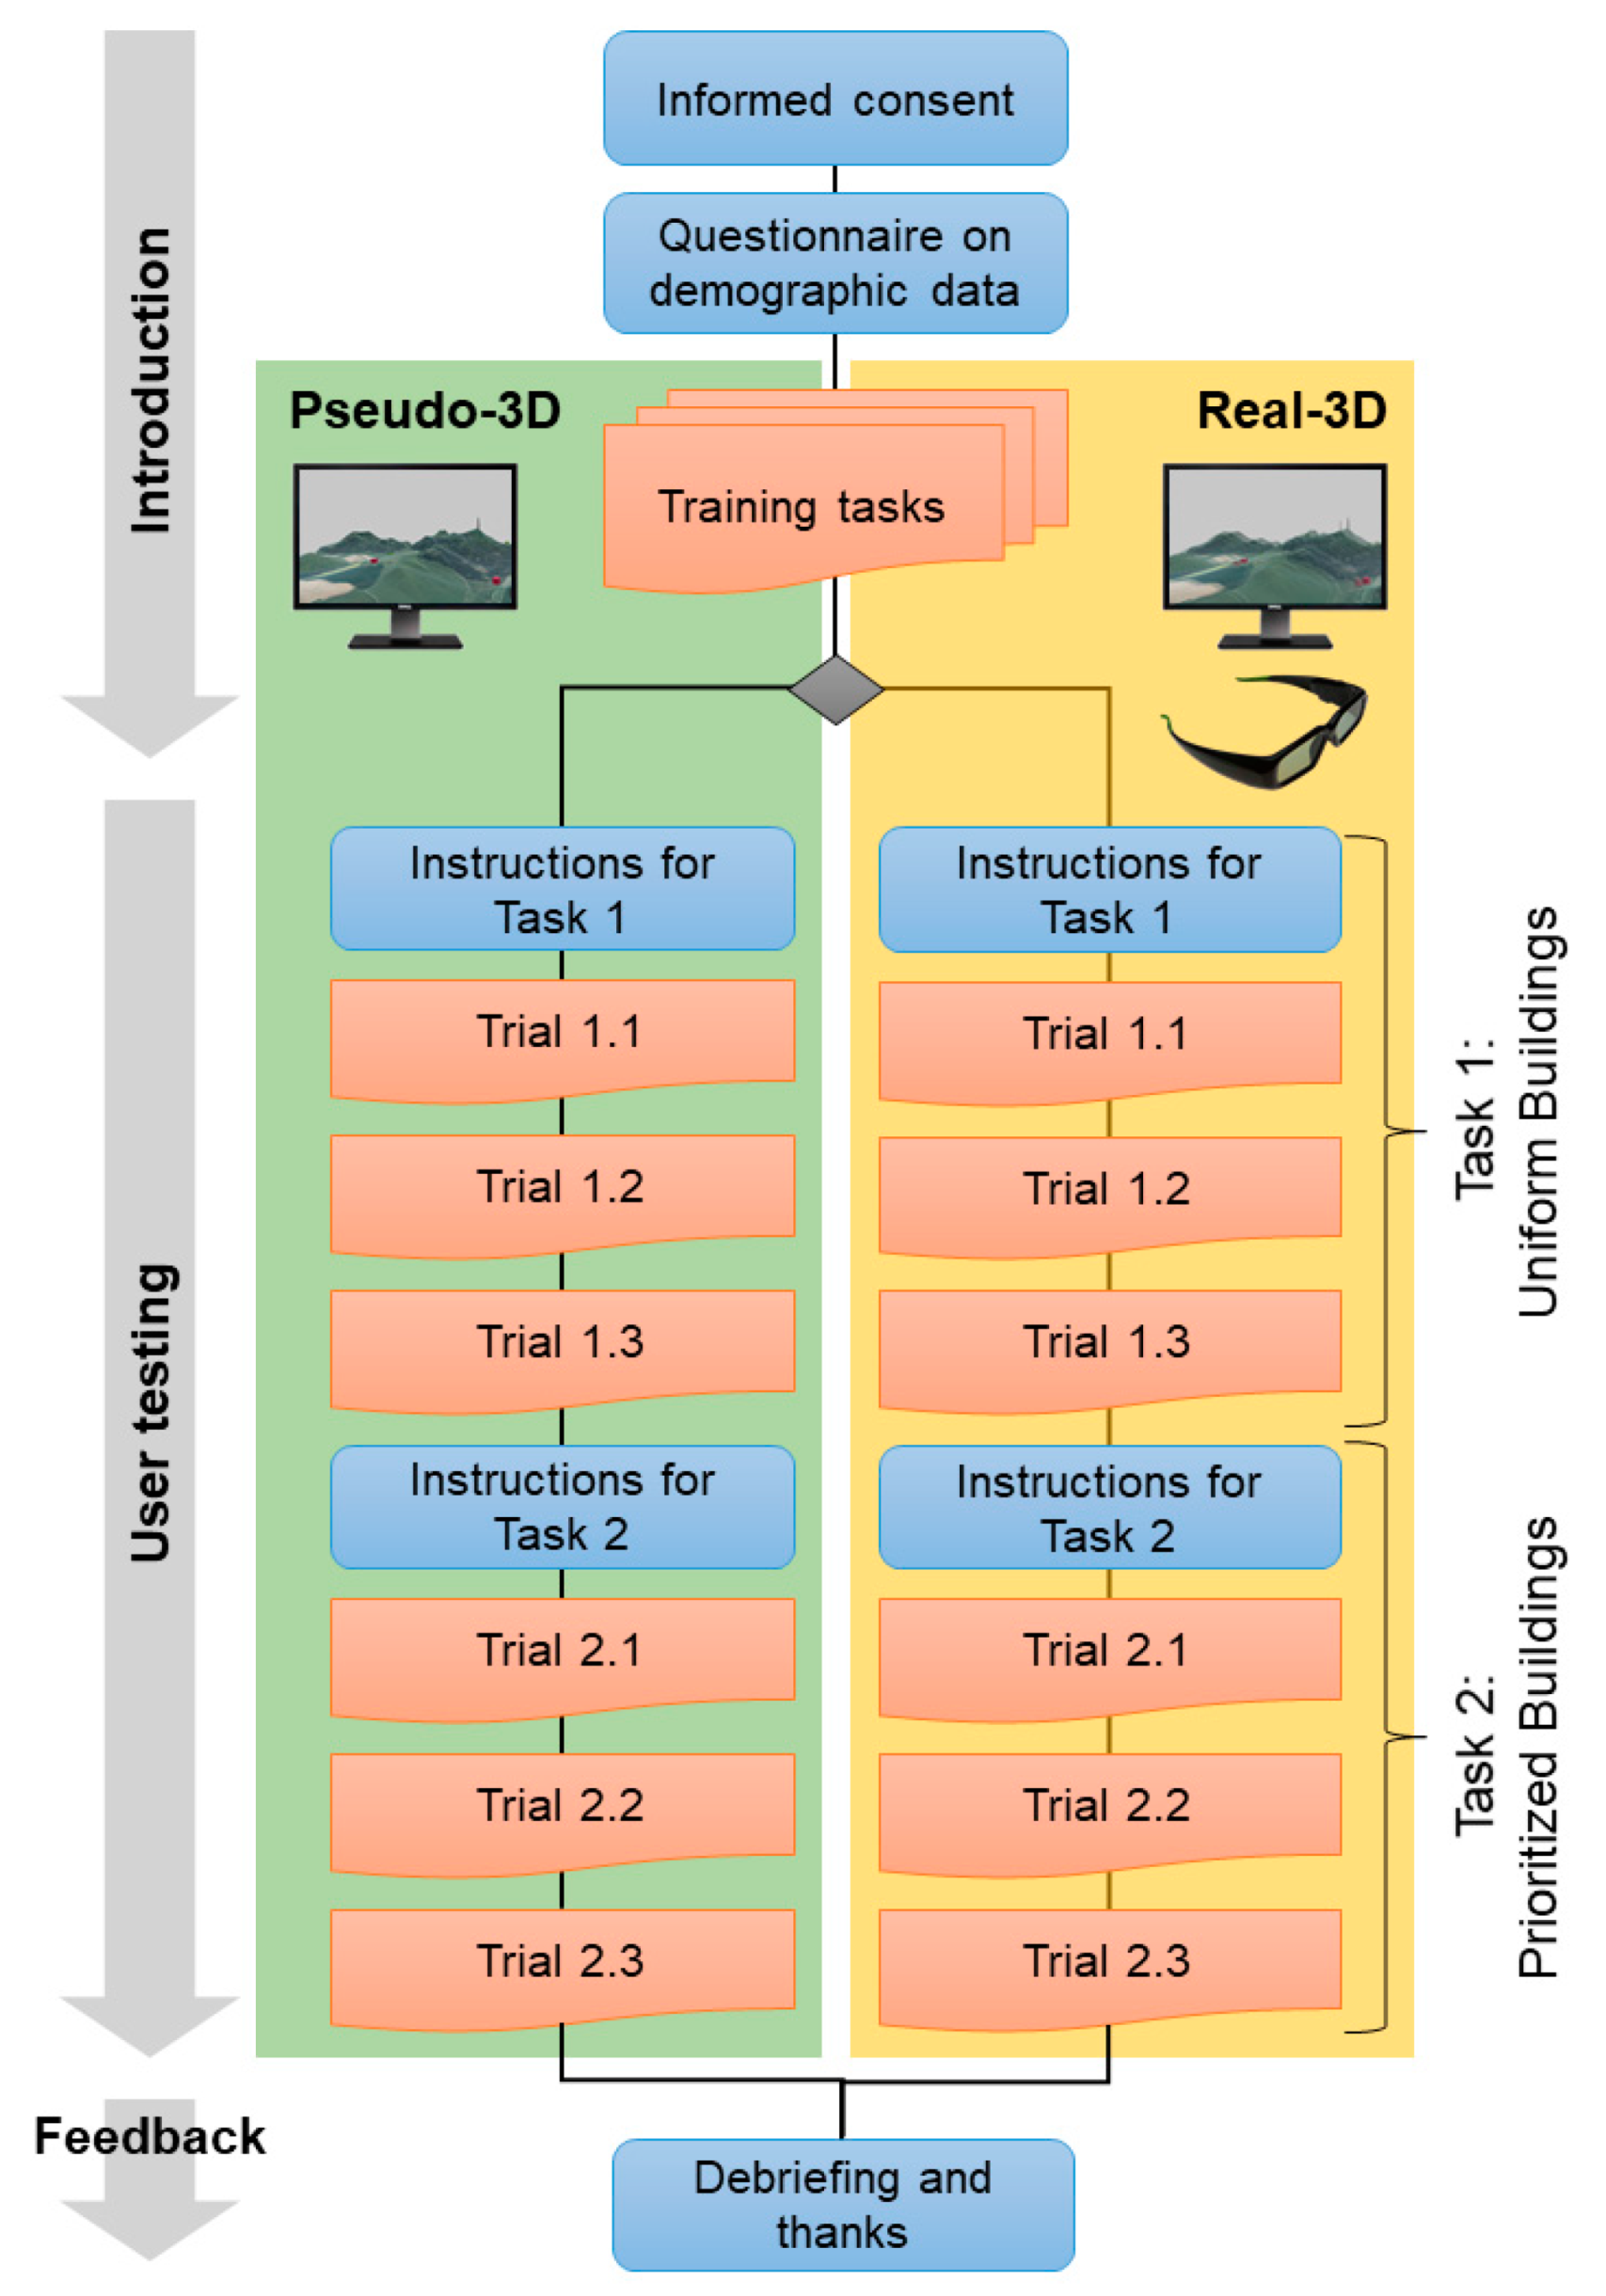
3.2. Procedure
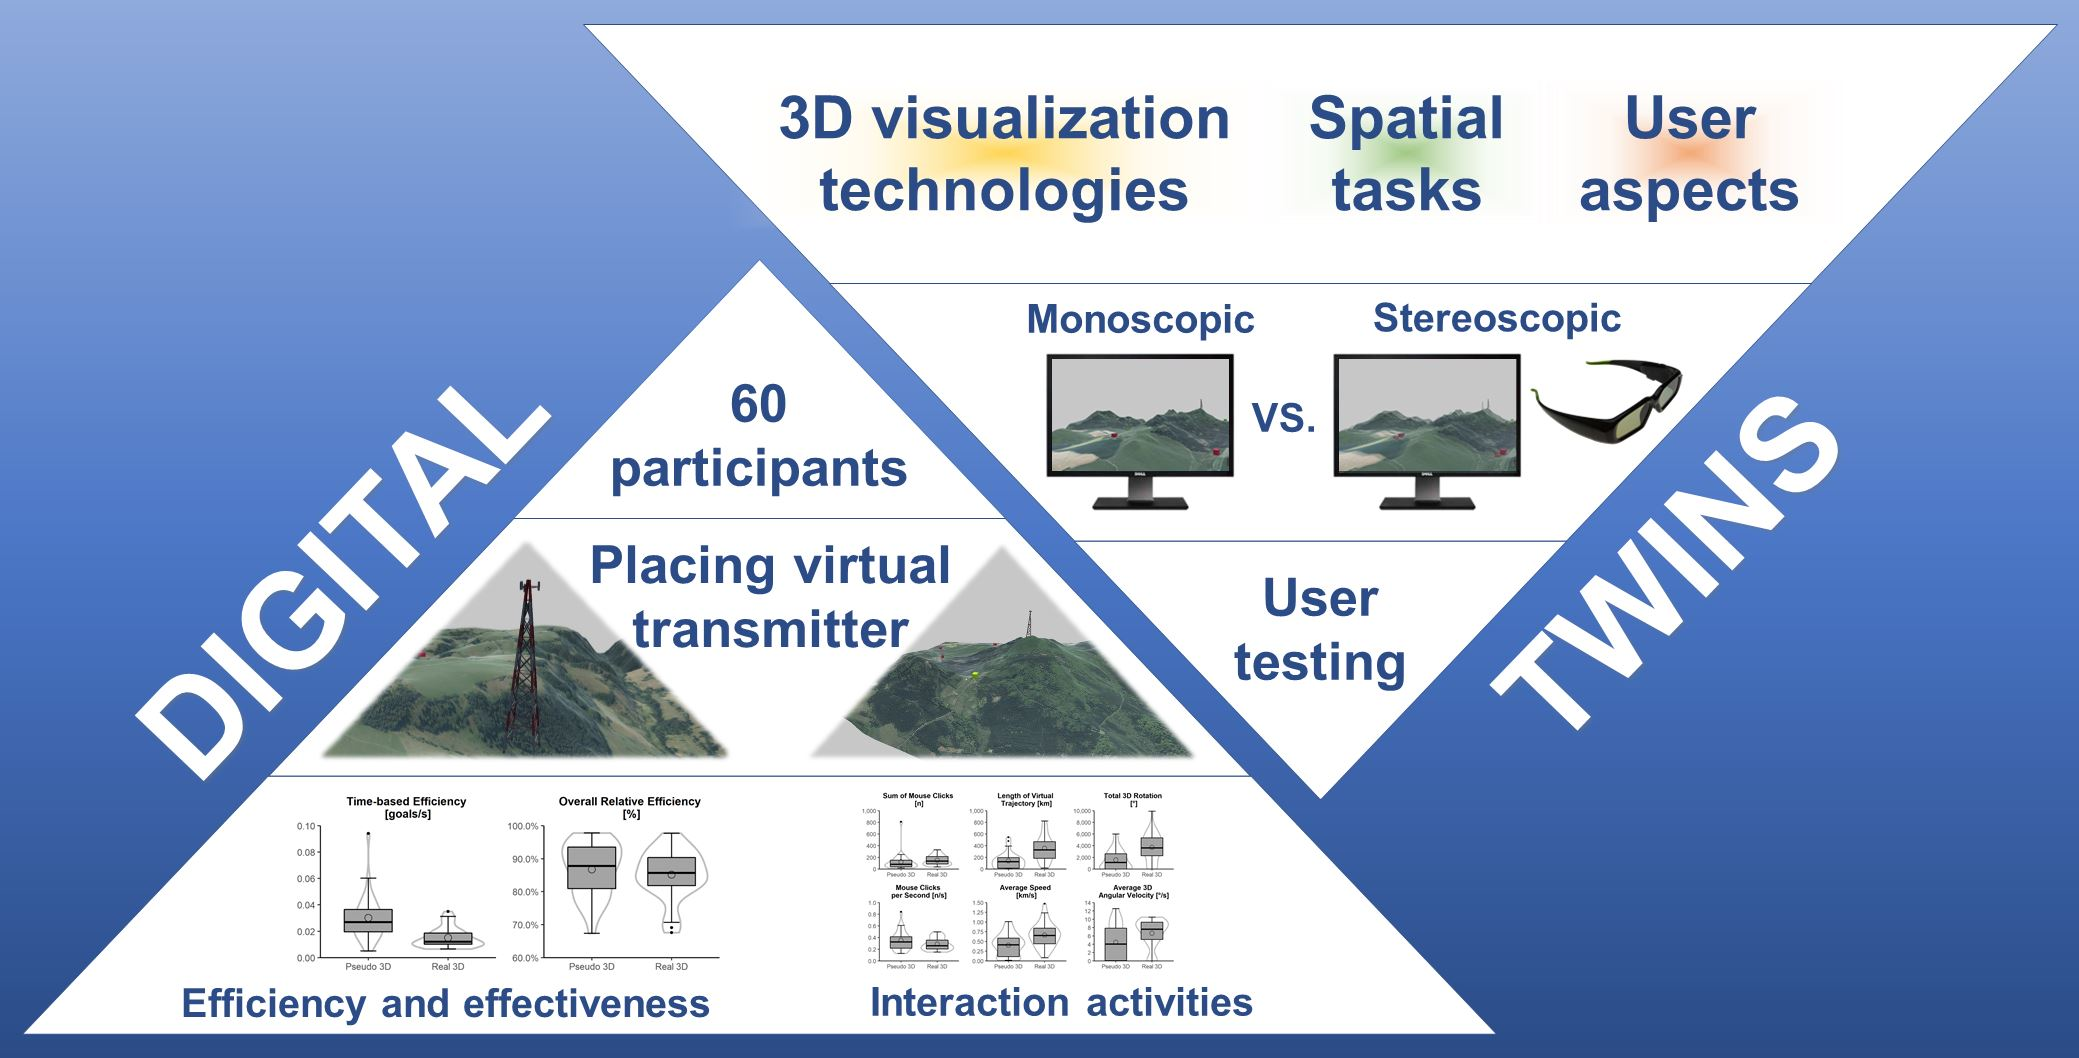
3.3. Stimuli and Tasks
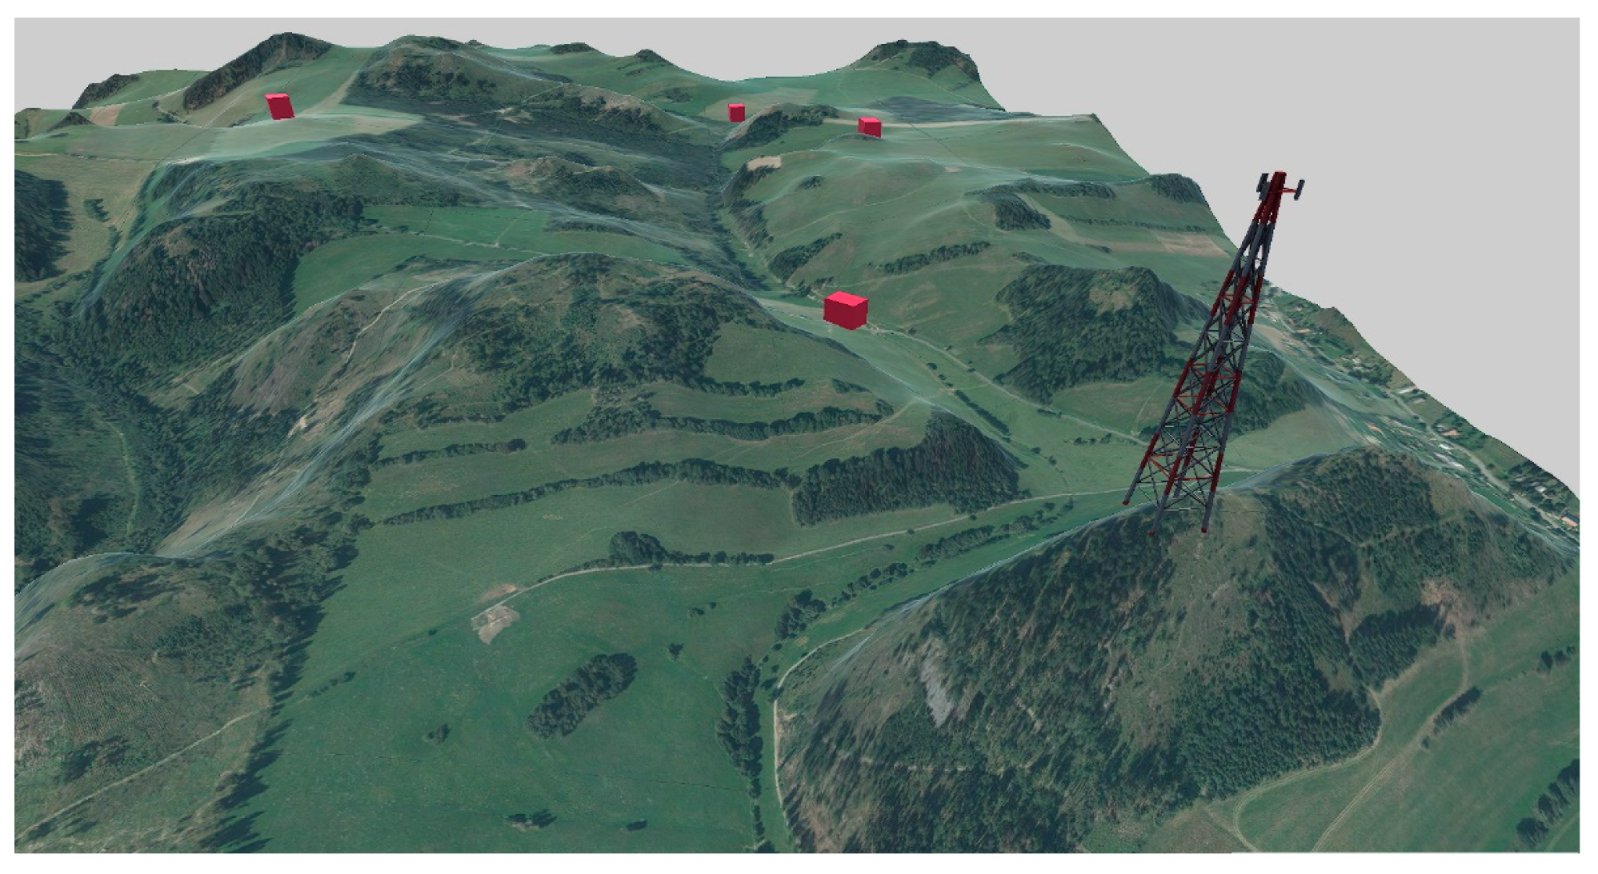
3.3.1. Task 1: Uniform Buildings
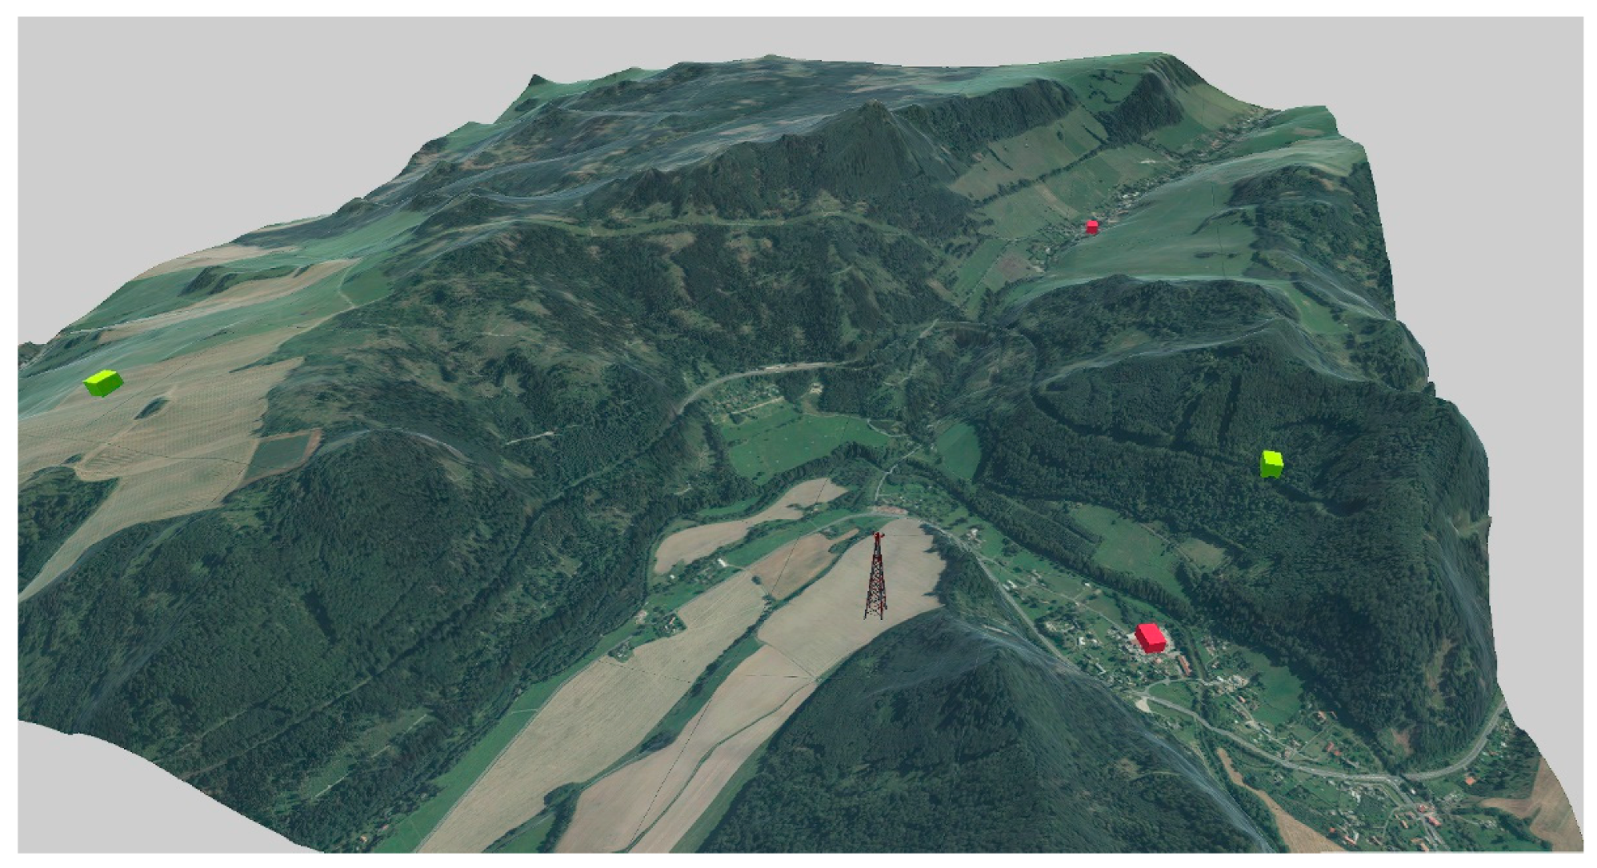
3.3.2. Task 2: Prioritized Buildings
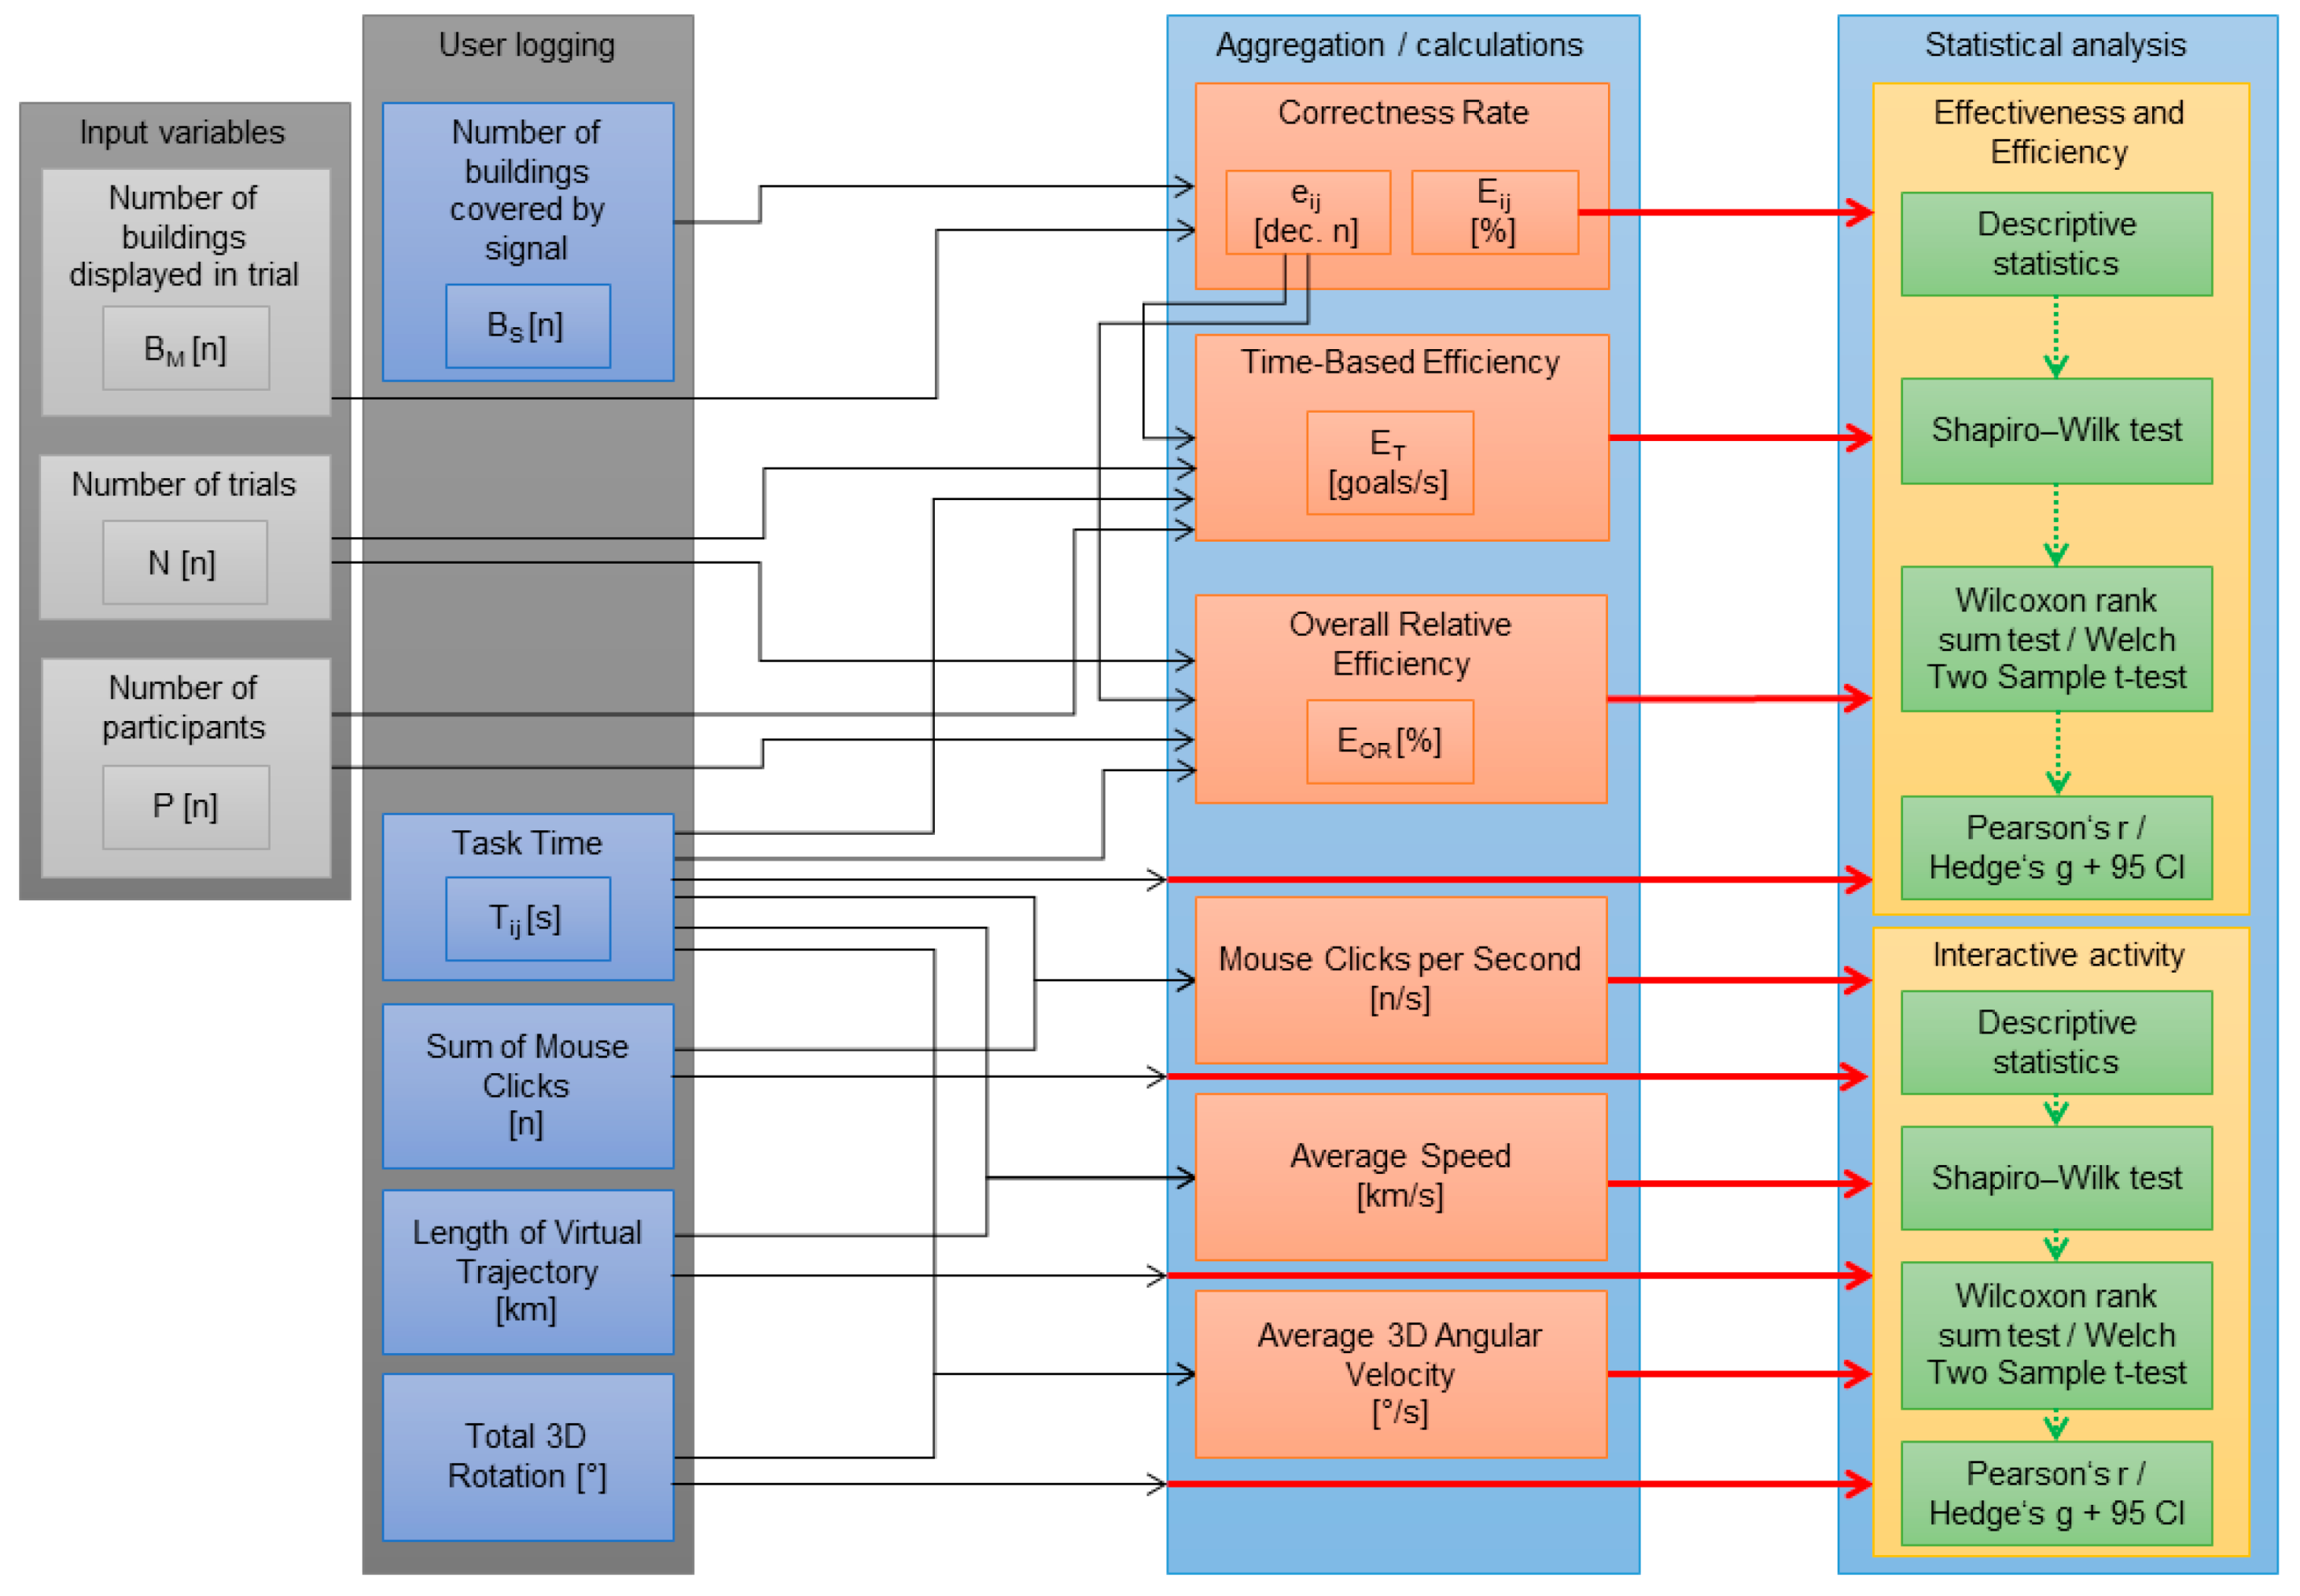
3.4. Analysis
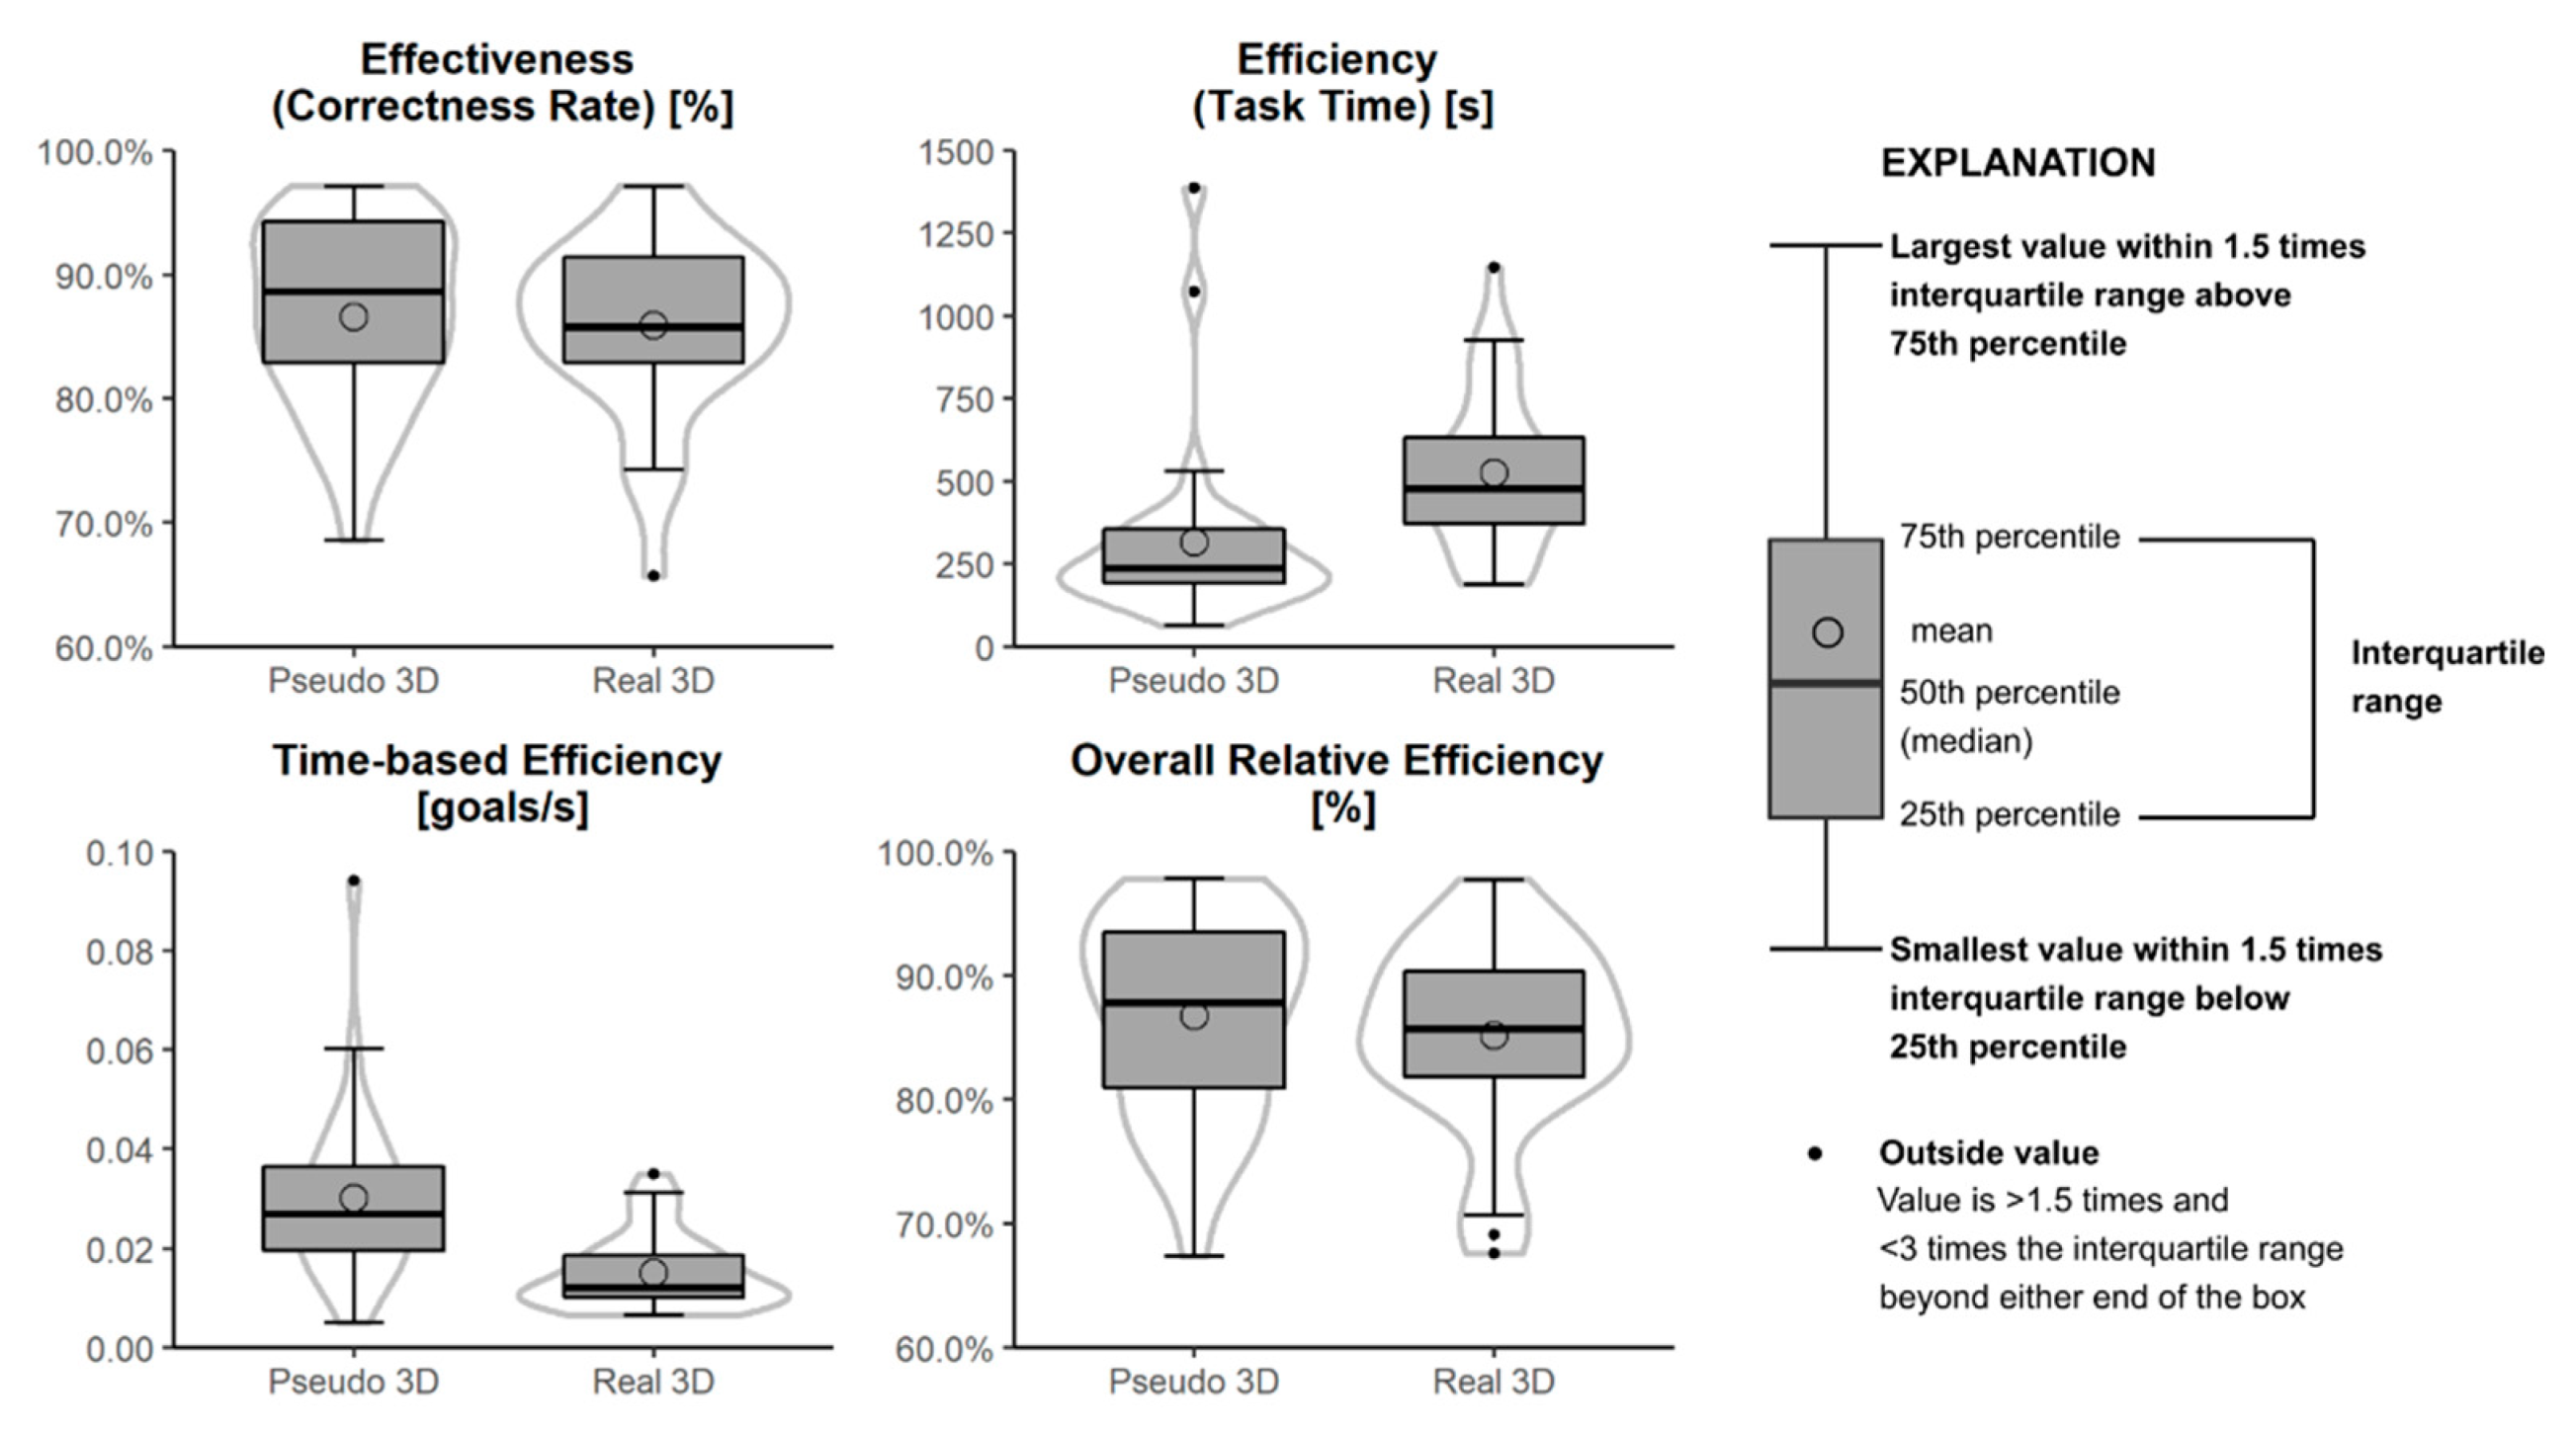
3.4.1. Effectiveness and Efficiency
- Eij: Effectiveness of participant j in trial i (correctness rate) as a percentage; if the user successfully completes the trial, then Eij = 100%; if the participant positions the transmitter in a position where 6 out of the 8 possible buildings are covered by the signal, then Eij = 75%.
- Bs: Number of buildings which participants successfully cover with the signal from the transmitter.
- Bm: Maximum number of buildings which can be covered by the signal from the transmitter.
- ET: Time-based efficiency (in goals per second).
- N: Total number of trials.
- P: Number of participants (1 in the case of time-based efficiency, calculated per user).
- eij: Effectiveness of participant j in trial i (decimal number); if the participant successfully completes the trial, then eij = 1; if the participant positions the transmitter in a position where 3 out of the 6 possible buildings are covered by the signal, then eij = 0.5.
- tij: Time spent by participant j to complete trial i.
- EOR: Overall relative efficiency (as a percentage).
- N: Total number of trials.
- P: Number of participants (1 in the case of overall relative efficiency, calculated per user),
- eij: Effectiveness of participant j in trial i (decimal number); if the user successfully completes the trial, then eij = 1; if the participant positions the transmitter in a position where 3 out of the 6 possible buildings are covered by the signal, then eij = 0.5.
- tij: Time spent by participant j to complete trial i.
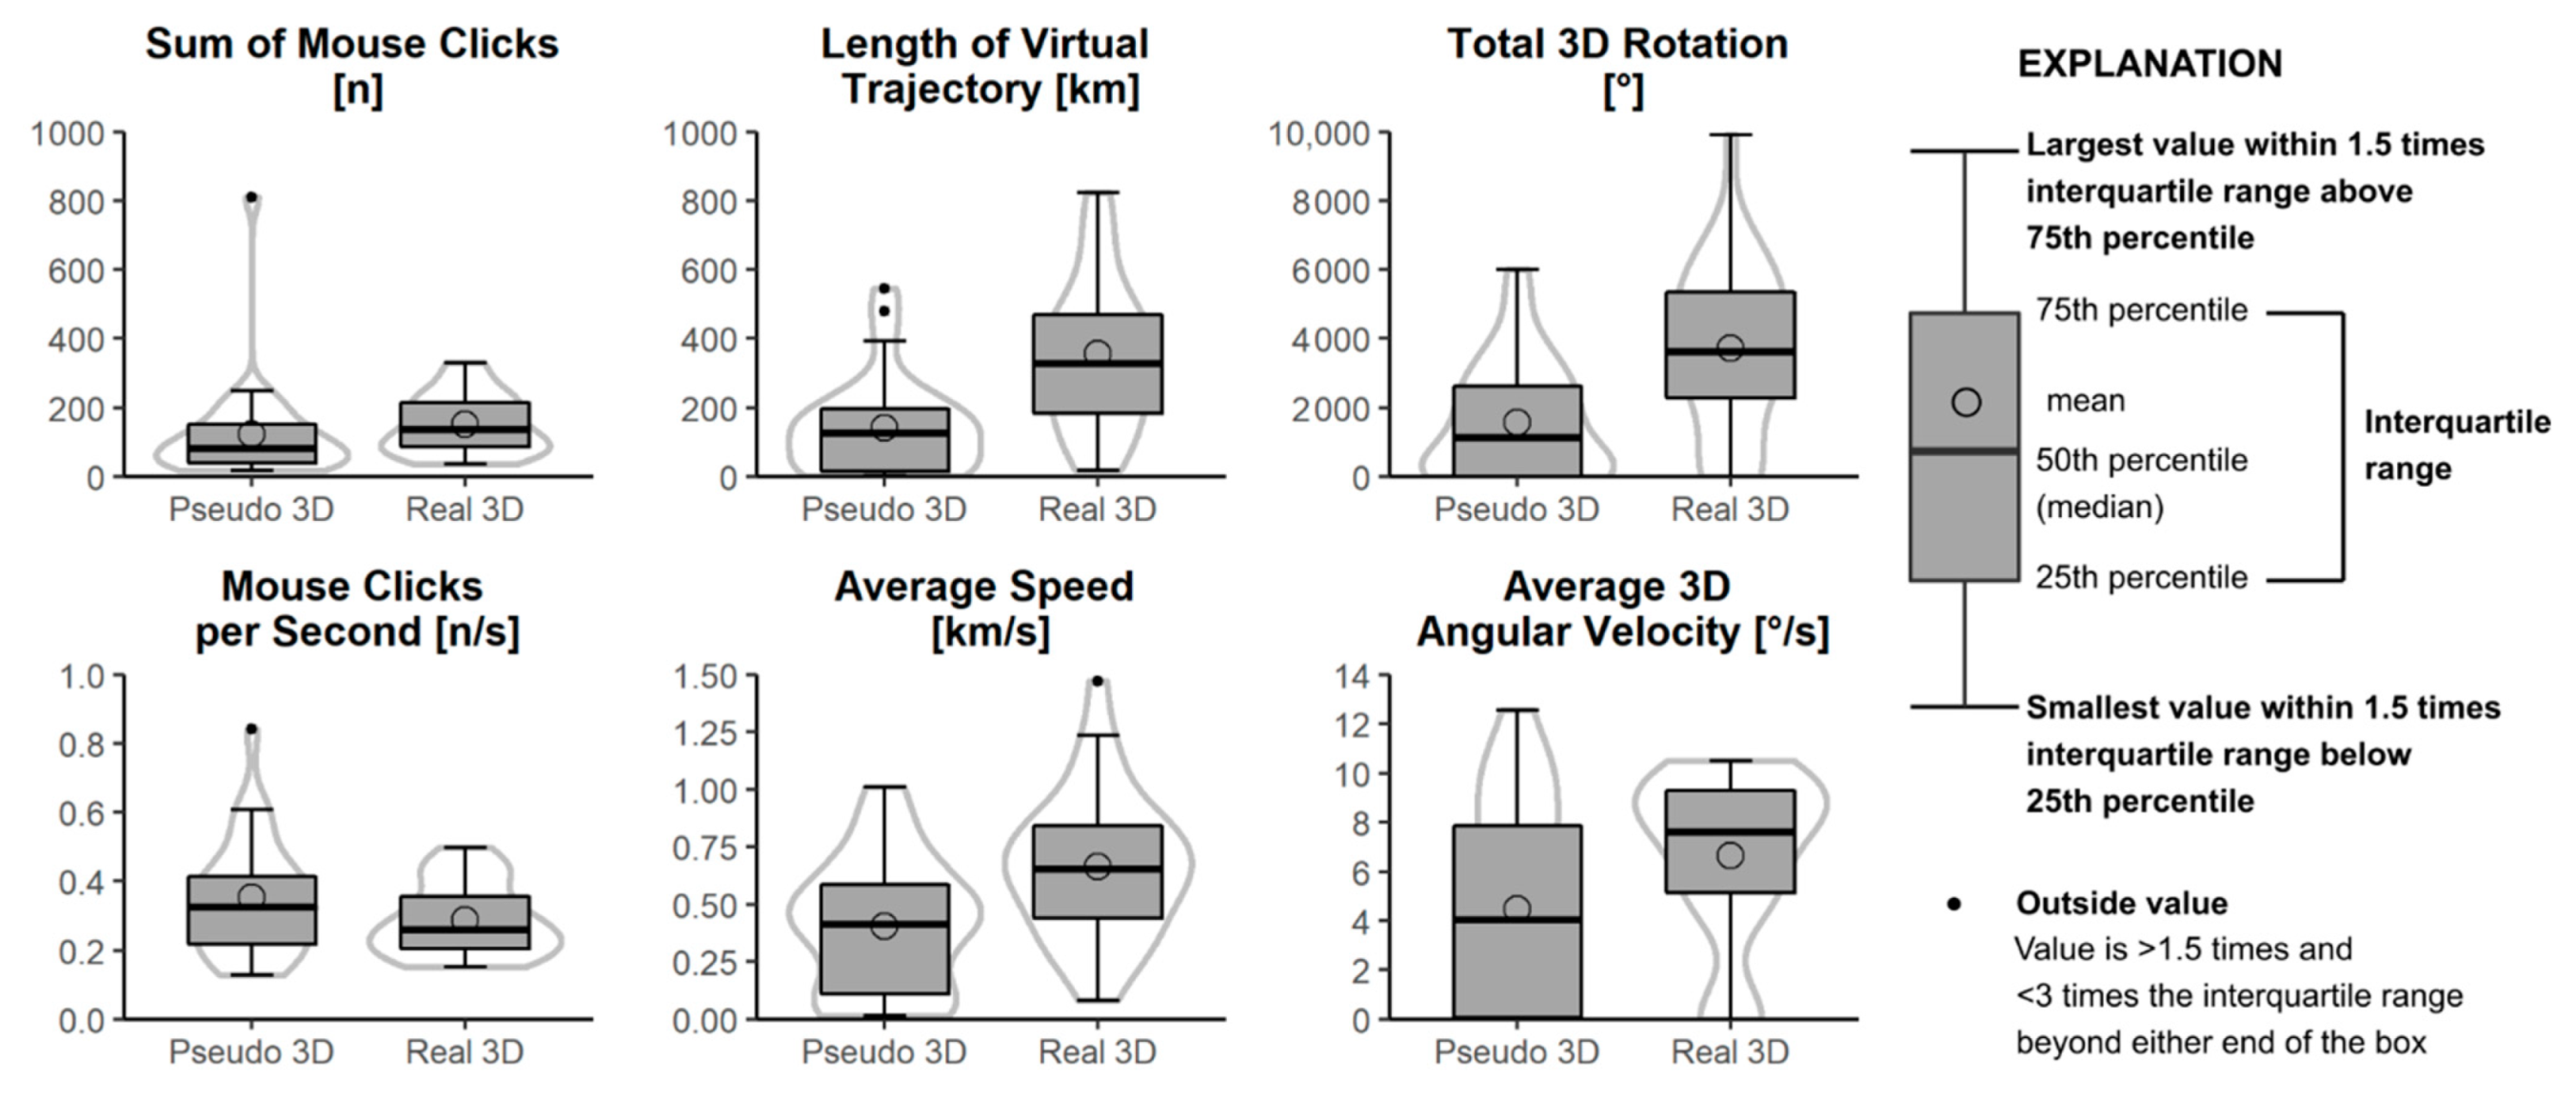
3.4.2. Interactive Activity
- Interactive activity data obtained from user logs, especially:
- o
- Sum of mouse-clicks: the total number of mouse clicks during task solution.
- o
- Length of virtual trajectory: overall length of the movement trajectory travelled during task solution (kilometres—units of length and scale of the digital twin environment are explained in Section 3.3.).
- o
- Total 3D rotation: overall rotation in virtual space during task solution (in degrees).
- Interactive activity from the user logs divided by the length of time to solve the task.
- o
- Mouse clicks per second (number of mouse-clicks per second).
- o
- Average speed of virtual movement (kilometres per second).
- o
- Average angular 3D velocity of virtual movement (degrees per second).
3.4.3. Statistical Analysis
4. Results
4.1. Effectiveness and Efficiency
4.2. Interactive Activity
5. Discussion
- Uncertainties of the input DTM (that were described by the data producer) and uncertainties related to DTM generalization (that affects our research). For more accurate modelling, it would be appropriate to use a digital surface model (DSM; including buildings and vegetation) instead of DTM in order for the spatial planning task to more closely reflect the reality.
- Uncertainties originating from modelling simplification: a signal from transmitters is in reality influenced by other factors (e.g., diffraction, absorption) while the modelling approach was solely based on direct visibility.
- Uncertainties related to limitations of human perception: each person uniquely perceives the presented digital terrain replica. In general, the human perception-related uncertainties were limited by comparing the results from user groups instead of individuals.
- Time-based efficiency and overall relative efficiency usability metrics were used as a novel methodological approach to find a balance between the quality and rapidness of evidence-based decision making in spatial planning based on digital twins. We also analysed the interaction activity, which is not a common feature in similar studies.
- A higher complexity of tasks used for evaluations in our experiment can be identified in comparison to similar studies [15,20,22,52,53]. Such a higher complexity implies, among other things, (1) a digital twin closer to reality, (2) a task that better simulates evidence-based decision making, and (3) a higher impact in practice.
- Based on the findings presented in this paper, we do consider pseudo-3D (monoscopic) visualization to be a more suitable and, at the same time, more accessible way of digital twins presentation in practice. The interactive pseudo-3D visualization of digital twins makes it possible to involve a wider range of experts and the general public in spatial planning, which promotes the principles of participation to increase public acceptance.
6. Conclusions and Future Work
- Exploration of the differences between user performance in the use of pseudo-3D geovisualizations compared to real-3D using different hardware as HMD that provide a higher degree of immersion.
- Ecological validity of tasks, i.e., an improvement of the experimental tasks to appear more realistic. For instance, it would be useful to test more complex tasks, such as planning optimal routes through a digital terrain replica.
- The testing of realistic 3D digital twins of more complex environments as cities, building interiors or complex natural environments (like caves or tropical forests).
- Focus on differences resulting from gender, cultural background, knowledge and other factors need to be verified for digital twins.
Supplementary Materials
Author Contributions
Funding
Institutional Review Board Statement
Informed Consent Statement
Data Availability Statement
Acknowledgments
Conflicts of Interest
References
- Li, M.; Wenjie, S. Application of virtual reality technology and digital twin in digital media communication. J. Intell. Fuzzy Syst. 2021, 40, 6655–6667. [Google Scholar] [CrossRef]
- Tadeja, S.; Seshadri, P.; Kristensson, P. AeroVR: An immersive visualisation system for aerospace design and digital twinning in virtual reality. Aeronaut. J. 2020, 124, 1615–1635. [Google Scholar] [CrossRef]
- Negri, E.; Fumagalli, L.; Macchi, M. A Review of the Roles of Digital Twin in CPS-based Production Systems. Procedia Manuf. 2017, 11, 939–948. [Google Scholar] [CrossRef]
- MacEachren, A.M.; Robinson, A.; Hopper, S.; Gardner, S.; Murray, R.; Gahegan, M.; Hetzler, E. Visualizing Geospatial Information Uncertainty: What We Know and What We Need to Know. Cartogr. Geogr. Inf. Sci. 2005, 32, 139–160. [Google Scholar] [CrossRef] [Green Version]
- Kinkeldey, C.; MacEachren, A.; Schiewe, J. How to Assess Visual Communication of Uncertainty? A Systematic Review of Geospatial Uncertainty Visualisation User Studies. Cartogr. J. 2014, 51, 372–386. [Google Scholar] [CrossRef]
- Goodchild, M.F. How well do we really know the world? Uncertainty in GIScience. J. Spat. Inf. Sci. 2020, 20, 97–102. [Google Scholar] [CrossRef]
- Klippel, A.; Sajjadi, P.; Zhao, J.; Wallgrün, J.O.; Huang, J.; Bagher, M.M. Embodied Digital Twins for Environmental Applications. In ISPRS Annals of Photogrammetry, Remote Sensing and Spatial Information Sciences; ISPRS: Leopoldshöhe, Germany, 2021; Volume V-4-2021, pp. 193–200. [Google Scholar] [CrossRef]
- Dembski, F.; Wössner, U.; Letzgus, M. The Digital Twin Tackling Urban Challenges with Models, Spatial Analysis and Numerical Simulations in Immersive Virtual Environments. In Proceedings of the 37 eCAADe and XXIII SIGraDi Joint Conference: “Architecture in the Age of the 4th Industrial Revolution”, Porto, Portugal, 11–13 September 2019; pp. 795–804. Available online: https://www.proceedings.blucher.com.br/download-pdf/331/34238 (accessed on 1 July 2021).
- Schrotter, G.; Hürzeler, C. The Digital Twin of the City of Zurich for Urban Planning. PFG J. Photogramm. Remote Sens. Geoinf. Sci. 2020, 88, 99–112. [Google Scholar] [CrossRef] [Green Version]
- Shahat, E.; Hyun, C.T.; Yeom, C. City Digital Twin Potentials: A Review and Research Agenda. Sustainability 2021, 13, 3386. [Google Scholar] [CrossRef]
- Ruzinoor, C.M.; Shariff, A.R.M.; Pradhan, B.; Rodzi Ahmad, M.; Rahim, M.S.M. A Review on 3D Terrain Visualization of GIS Data: Techniques and Software. Geo Spatial Inform. Sci. 2012, 15, 105–115. [Google Scholar] [CrossRef]
- Biljecki, F.; Stoter, J.; Ledoux, H.; Zlatanova, S.; Çöltekin, A. Applications of 3D City Models: State of the Art Review. ISPRS Int. J. Geo-Inf. 2015, 4, 2842–2889. [Google Scholar] [CrossRef] [Green Version]
- Çöltekin, A.; Lochhead, I.; Madden, M.; Christophe, S.; Devaux, A.; Pettit, C.; Lock, O.; Shukla, S.; Herman, L.; Stachon, Z.; et al. Extended Reality (XR: VR, AR, MR) in Spatial Sciences: A Review of Research Challenges and Future Directions. ISPRS Int. J. Geo-Inf. 2020, 9, 439. [Google Scholar] [CrossRef]
- Wood, J.; Kirschenbauer, S.; Döllner, J.; Lopes, A.; Bodum, L. Using 3D in Visualization. In Exploring Geovisualization, 1st ed.; Dykes, J., MacEachren, A.M., Kraak, M.-J., Eds.; Elsevier: Amsterdam, The Netherlands, 2005; pp. 295–312. [Google Scholar]
- Jurik, V.; Herman, L.; Snopkova, D.; Galang, A.J.; Stachon, Z.; Chmelik, J.; Kubicek, P.; Sasinka, C. The 3D Hype: Evaluating the Potential of Real 3D Visualization in Geo-related Applications. PLoS ONE 2020, 15, e0233353. [Google Scholar] [CrossRef] [PubMed]
- Atorf, L.; Roßmann, J. Interactive Analysis and Visualization of Digital Twins in High-Dimensional State Spaces. In Proceedings of the 15th International Conference on Control, Automation, Robotics and Vision (ICARCV), Singapore, 18–21 November 2018. [Google Scholar] [CrossRef]
- Kwok, P.K.; Yan, M.; Qu, T.; Lau, H.Y.K. User acceptance of virtual reality technology for practicing digital twin-based crisis management. Int. J. Comput. Integr. Manuf. 2020, 1–14. [Google Scholar] [CrossRef]
- Buchroithner, M.F.; Knust, C. True-3D in Cartography—Current Hard and Softcopy Developments. In Geospatial Visualisation, 1st ed.; Moore, A., Drecki, I., Eds.; Springer: Berlin, Germany, 2013; pp. 41–65. [Google Scholar] [CrossRef]
- Larkin, J.H.; Simon, H.A. Why a Diagram is (Sometimes) Worth Ten Thousand Words. Cogn. Sci. 1987, 11, 65–100. [Google Scholar] [CrossRef]
- Kubicek, P.; Sasinka, C.; Stachon, Z.; Herman, L.; Jurik, V.; Urbanek, T.; Chmelik, J. Identification of Altitude Profiles in 3D Geovisualizations: The Role of Interaction and Spatial Abilities. Int. J. Digit. Earth 2019, 12, 156–172. [Google Scholar] [CrossRef]
- Kirschenbauer, S. Applying “True 3D” Techniques to Geovisualization: An Empirical Study. In Exploring Geovisualization, 1st ed.; Dykes, J., MacEachren, A.M., Kraak, M.-J., Eds.; Elsevier: Amsterdam, The Netherlands, 2005; pp. 363–387. [Google Scholar]
- Seipel, S. Evaluating 2D and 3D Geovisualisations for Basic Spatial Assessment. Behav. Inf. Technol. 2013, 32, 845–858. [Google Scholar] [CrossRef]
- Kraak, M.J. Geovisualization Illustrated. ISPRS J. Photogramm. Remote Sens. 2003, 57, 390–399. [Google Scholar] [CrossRef]
- Bleisch, S. 3D Geovisualization—Definition and Structures for the Assessment of Usefulness. In ISPRS Annals of Photogrammetry, Remote Sensing and Spatial Information Sciences; ISPRS: Leopoldshöhe, Germany, 2012; Volume I-2, pp. 129–134. [Google Scholar] [CrossRef] [Green Version]
- MacEachren, A.M.; Kraak, M.J. Research Challenges in Geovisualization. Cartogr. Geogr. Inf. Sci. 2001, 28, 3–12. [Google Scholar] [CrossRef]
- Bektas, K.; Çöltekin, A. A Survey of Stereoscopic Visualization Support in Mainstream Geographic Information Systems. In Proceedings of the 1st International Conference on 3D Maps, Dresden, Germany, 24–28 August 2009. [Google Scholar]
- Zanola, S.; Fabrikant, S.I.; Coltekin, A. The Effect of Realism on the Confidence in Spatial Data Quality in Stereoscopic 3D Displays. In Proceedings of the 24th International Cartography Conference, Santiago, Chile, 15–21 November 2009. [Google Scholar]
- Abulrub, A.-H.G.; Budabuss, K.; Mayer, P.; Williams, M.A. The 3D Immersive Virtual Reality Technology Use for Spatial Planning and Public Acceptance. Procedia Soc. Behav. Sci. 2013, 75, 328–337. [Google Scholar] [CrossRef] [Green Version]
- Torres, J.; Ten, M.; Zarzoso, J.; Salom, L.; Gaitan, R.; Lluch, J. Comparative Study of Stereoscopic Techniques Applied to a Virtual Globe. Cartogr. J. 2013, 50, 369–375. [Google Scholar] [CrossRef]
- Hirmas, D.R.; Slocum, T.; Halfen, A.F.; White, T.; Zautner, E.; Atchey, P.; Liu, H.; Johnson, W.C.; Egbert, S.; McDermott, D. Effects of Seating Location and Stereoscopic Display on Learning Outcomes in an Introductory Physical Geography Class. J. Geosci. Educ. 2014, 62, 126–137. [Google Scholar] [CrossRef]
- Carbonell-Carrera, C.; Saorín, J.L. Geospatial Google Street View with Virtual Reality: A Motivational Approach for Spatial Training Education. ISPRS Int. J. Geo-Inf. 2017, 6, 261. [Google Scholar] [CrossRef] [Green Version]
- Yang, Y.; Dwyer, T.; Jenny, B.; Marriott, K.; Cordeil, M.; Chen, H. Origin-Destination Flow Maps in Immersive Environments. IEEE Trans. Vis. Comput Graph. 2018, 25, 693–703. [Google Scholar] [CrossRef] [PubMed] [Green Version]
- Yang, Y.; Jenny, B.; Dwyer, T.; Marriott, K.; Chen, H.; Cordeil, M. Maps and Globes in Virtual Reality. Comput Graph. Forum. 2018, 37, 427–438. [Google Scholar] [CrossRef] [Green Version]
- Filho, J.A.W.; Stuerzlinger, W.; Nedel, L. Evaluating an Immersive Space-Time Cube Geovisualization for Intuitive Trajectory Data Exploration. IEEE. Trans. Vis. Comput. Graph. 2019, 26, 514–524. [Google Scholar] [CrossRef] [Green Version]
- Quach, Q.; Jenny, B. Immersive Visualization with Bar Graphics. Cartogr. Geogr. Inf. Sci. 2020, 47, 471–480. [Google Scholar] [CrossRef]
- Yang, Y.; Dwyer, T.; Marriott, K.; Jenny, B.; Goodwin, S. Tilt Map: Interactive Transitions between Choropleth Map, Prism Map and Bar Chart in Immersive Environments. IEEE. Trans. Vis. Comput. Graph. 2020. [Google Scholar] [CrossRef]
- Zhao, J.; Sensibaugh, T.; Bodenheimer, B.; McNamara, T.P.; Nazareth, A.; Newcombe, N.; Minear, M.; Klippel, A. Desktop versus immersive virtual environments: Effects on spatial learning. Spat. Cogn. Comput. 2020, 20, 328–363. [Google Scholar] [CrossRef]
- Jurik, V.; Herman, L.; Kubicek, P.; Stachon, Z.; Sasinka, C. Cognitive Aspects of Collaboration in 3D Virtual Environments. In International Archives of the Photogrammetry, Remote Sensing and Spatial Information Sciences; ISPRS: Leopoldshöhe, Germany, 2016; Volume XLI-B2, pp. 663–670. [Google Scholar]
- Kraak, M.J. Computer-Assisted Cartographical 3D Imaging Techniques. Ph.D. Thesis, Delft University, Delft, The Netherlands, 1988. [Google Scholar]
- Cruz-Neira, C.; Sandin, D.J.; DeFanti, T.A.; Kenyon, R.V.; Hart, J.C. The CAVE: Audio Visual Experience Automatic Virtual Environment. Commun. ACM 1992, 35, 64–72. [Google Scholar] [CrossRef]
- Milgram, P.; Kishino, F. Taxonomy of Mixed Reality Visual Displays. IEICE Trans. Inf. Syst. 1994, E77-D12, 1321–1329. [Google Scholar]
- Ware, C.; Franck, G. Evaluating Stereo and Motion Cues for Visualizing Information Nets in Three Dimensions. ACM Trans. Graph. 1996, 15, 121–140. [Google Scholar] [CrossRef]
- Rydmark, M.; Kling-Petersen, T.; Pascher, R.; Philip, F. 3D Visualization and Stereographic Techniques for Medical Research and Education. Stud. Health Technol. Inform. 2001, 81, 434–439. [Google Scholar] [CrossRef] [PubMed]
- Van Beurden, M.H.P.H.; Kuijsters, A.; Ijsselsteijn, W.A. Performance of a Path Tracing Task Using Stereoscopic and Motion based Depth Cues. In Second International Workshop on Quality of Multimedia Experience (QoMEX); IEEE: Trondheim, Norway, 2010. [Google Scholar] [CrossRef] [Green Version]
- Livatino, S.; De Paolis, L.T.; D’Agnostino, M.; Zocco, A.; Agrimi, A.; De Santis, A.; Bruno, L.V. Stereoscopic Visualization and 3-D Technologies in Medical Endoscopic Teleoperation. IEEE Trans. Ind. Electron. 2015, 62, 525–535. [Google Scholar] [CrossRef]
- Lange, M.; Hjalmarsson, J.; Cooper, M.; Ynnerman, A.; Duong, V. 3D Visualization and 3D and Voice Interaction in Air Traffic Management. In The Annual SIGRAD Conference. Special Theme-Real-Time Simulations. Conference Proceedings from SIGRAD2003; Linköping University Electronic Press: Linköping, Sweden, 2003; No. 010. [Google Scholar]
- Wickens, C.D. Aviation Displays. In Principles and Practice of Aviation Psychology, 1st ed.; Tsang, P.M., Vidulich, M.A., Eds.; CRC Press: Boca Raton, FL, USA, 2003; pp. 435–471. [Google Scholar]
- Bourgois, M.; Cooper, M.; Duong, V.; Hjalmarsson, J.; Lange, M.; Ynnerman, A. Interactive and Immersive 3D Visualization for ATC. In Proceedings of the 6th USA-Europe ATM R&D Seminar; ATM: Bruxelles, Belgium, 2005. [Google Scholar]
- Fuhrmann, S.; Komogortsev, O.; Tamir, D. Investigating Hologram-Based Route Planning. Trans. GIS 2009, 13, 177–196. [Google Scholar] [CrossRef]
- Kjellin, A.; Pettersson, L.W.; Seipel, S.; Lind, M. Evaluating 2D and 3D Visualizations of Spatiotemporal Information. ACM Trans. Appl. Percep. 2010, 7, 1–23. [Google Scholar] [CrossRef]
- Seipel, S.; Carvalho, L. Solving Combined Geospatial Tasks Using 2D and 3D Bar Charts. In Proceedings of the 16th International Conference on Information Visualisation, Montpellier, France, 11–13 July 2012. [Google Scholar] [CrossRef] [Green Version]
- Sprinarova, K.; Jurik, V.; Sasinka, C.; Herman, L.; Sterba, Z.; Stachon, Z.; Chmelik, J.; Kozlikova, B. Human-computer Interaction in Real 3D and Pseudo-3D Cartographic Visualization: A Comparative Study. In Cartography—Maps Connecting the World: 27th International Cartographic Conference 2015—ICC2015, 1st ed.; Sluter, C.R., Ed.; Springer: Berlin, Germany, 2015; pp. 59–73. ISBN 978-3-319-17737-3. [Google Scholar]
- Jurik, V.; Herman, L.; Sasinka, C.; Stachon, Z.; Chmelik, J. When the Display Matters: A Multifaceted Perspective on 3D Geovisualizations. Open Geosci. 2017, 9, 89–100. [Google Scholar] [CrossRef]
- Dong, W.; Yang, T.; Liao, H.; Meng, L. How Does Map Use Differ in Virtual Reality and Desktop-based Environments? Int. J. Digit. Earth 2020, 13, 1–20. [Google Scholar] [CrossRef]
- Laha, B.; Bowman, D.A.; Laidlaw, D.H.; Socha, J.J. A Classification of User Tasks in Visual Analysis of Volume Data. In Proceedings of the 2015 IEEE Scientific Visualization Conference (SciVis), Chicago, IL, USA, 25–30 October 2015. [Google Scholar] [CrossRef]
- Rautenbach, V.; Coetzee, S.; Çöltekin, A. Towards Evaluating the Map literacy of Planners in 2D Maps and 3D Models in South Africa. In Proceedings of the AfricaGEO 2014 Conference, Cape Town, South Africa, 1–3 July 2014. [Google Scholar]
- Çöltekin, A.; Lokka, I.E.; Boer, A. The utilization of publicly available map types by non-experts—A choice experiment. In Proceedings of the 27th International Cartographic Conference (ICC2015), Rio de Janeiro, Brazil, 23–28 August 2015. [Google Scholar]
- Roth, R.E. Cartographic Interaction Primitives: Framework and Synthesis. Cartogr. J. 2012, 49, 376–395. [Google Scholar] [CrossRef]
- Roth, R.E. An Empirically-Derived Taxonomy of Interaction Primitives for Interactive Cartography and Geovisualization. IEEE Trans. Vis. Comput. Graph. 2013, 19, 2356–2365. [Google Scholar] [CrossRef]
- Herman, L.; Jurik, V.; Stachon, Z.; Vrbik, D.; Russnak, J.; Reznik, T. Evaluation of User Performance in Interactive and Static 3D Maps. ISPRS Int. J. Geo-Inf. 2018, 7, 415. [Google Scholar] [CrossRef] [Green Version]
- Roth, R.E.; Çöltekin, A.; Delazari, L.; Filho, H.F.; Griffin, A.; Hall, A.; Korpi, J.; Lokka, I.E.; Mendonça, A.; Ooms, K.; et al. User Studies in Cartography: Opportunities for Empirical Research on Interactive Maps and Visualizations. Int. J. Cartogr. 2017, 3, 61–89. [Google Scholar] [CrossRef]
- Jobst, M.; Germanchis, T. The Employment of 3D in Cartography–An Overview. In Multimedia Cartography; Springer: Berlin, Germany, 2007; pp. 217–228. [Google Scholar]
- Ware, C. Information Visualization: Perception for Design; Morgan Kaufmann: San Francisco, CA, USA, 2004; ISBN 1-55860-819-2. [Google Scholar]
- ISO. ISO 9241-210. Ergonomics of Human-System Interaction—Part. 210: Human-Centred Design for Interactive Systems; Technical Committee ISO/TC 159, Ergonomics, Subcommittee SC 4; Ergonomics of Human-System Interaction: Geneva, Switzerland, 2010. [Google Scholar]
- Kudrnovska, O.; Kousal, J. Výšková členitost reliéfu ČSR [Height Segmentation of the Relief of Czechoslovakia]; Map 1:500 000; Geografický Ústav ČSAV Institute of Geography of the Czechoslovak Academy of Sciences: Brno, Czech Republic, 1971. [Google Scholar]
- Bevan, N. Measuring Usability as Quality of Use. Softw. Qual. J. 1995, 4, 115–130. [Google Scholar] [CrossRef]
- Chittka, L.; Skorupski, P.; Raine, N. Speed–accuracy Tradeoffs in Animal Decision-making. Trends Ecol Evol. 2009, 24, 400–407. [Google Scholar] [CrossRef]
- Faul, F.; Erdfelder, E.; Lang, A.G.; Buchner, A. G*Power 3: A Flexible Statistical Power Analysis Program for the Social, Behavioral, and Biomedical Sciences. Behav. Res. Methods 2007, 39, 175–191. [Google Scholar] [CrossRef]
- Shapiro, S.S.; Wilk, M.B. An analysis of variance test for normality (complete samples). Biometrika 1965, 52, 591–611. [Google Scholar] [CrossRef]
- Welch, B.L. The generalization of “Student’s” problem when several different population variances are involved. Biometrika 1947, 34, 28–35. [Google Scholar] [CrossRef] [PubMed]
- Mann, H.B.; Whitney, D.R. On a Test of Whether one of Two Random Variables is Stochastically Larger than the Other. Ann. Math. Stat. 1947, 18, 50–60. [Google Scholar] [CrossRef]
- Wilcoxon, F. Individual comparisons by ranking methods. Biom. Bull. 1945, 1, 80–83. [Google Scholar] [CrossRef]
- Rosenthal, R. Science and Ethics in Conducting, Analyzing, and Reporting Psychological Research. Psychol. Sci. 1994, 5, 127–134. [Google Scholar] [CrossRef]
- Hedges, L.V. Distribution theory for Glass’ estimator of effect size and related estimators. J. Educ. Stat. 1981, 6, 107–128. [Google Scholar] [CrossRef]
- Cumming, G. Understanding the New Statistics: Effect Sizes, Confidence Intervals, and Meta-Analysis, 1st ed.; Routledge: New York, NY, USA, 2012; 536p, ISBN 9780203.807002. [Google Scholar]
- Lokka, I.E.; Çöltekin, A.; Wiener, J.; Fabrikant, S.I.; Röcke, C. Virtual environments as memory training devices in navigational tasks for older adults. Sci. Rep. 2018, 8, 10809. [Google Scholar] [CrossRef] [PubMed]
- Brydges, C.R. Effect Size Guidelines, Sample Size Calculations, and Statistical Power in Gerontology. Innov. Aging 2019, 3, igz036. [Google Scholar] [CrossRef] [PubMed]
- R Core Team. R: A Language and Environment for Statistical Computing; R Foundation for Statistical Computing: Vienna, Austria, 2017; Available online: https://www.R-project.org/ (accessed on 15 May 2021).
- Wickham, H. ggplot2: Elegant Graphics for Data Analysis, 1st ed.; Springer: New York, NY, USA, 2016; 213p, ISBN 978-3-319-24277-4. [Google Scholar]
- Hoekstra, R.; Morey, R.; Rouder, J.; Wagenmakers, E. Robust Misinterpretation of Confidence Intervals. Psychon. Bull. Rev. 2014, 21, 1157–1164. [Google Scholar] [CrossRef] [PubMed]


| Effectiveness (Correctness Rate) [%] | Min | Max | Median | Mean | S.d. | Shapiro–Wilk Test | Wilcoxon Rank Sum Test | Pearson’s | 95 CI | |||
| p-Value | W | p-Value | r | Lower | Upper | |||||||
| Condition | Real-3D | 65.71% | 97.14% | 85.71% | 85.90% | 6.96% | 0.034 | 478.500 | 0.670 | 0.056 | −0.196 | 0.292 |
| Pseudo-3D | 68.57% | 97.14% | 88.57% | 86.60% | 7.29% | 0.048 | ||||||
| Efficiency (Task Time) [s] | Min | Max | Median | Mean | S.d. | Shapiro–Wilk test | Wilcoxon rank sum test | Pearson’s | 95 CI | |||
| p-value | W | p-value | r | lower | upper | |||||||
| Condition | Real-3D | 188.000 | 1146.900 | 476.400 | 525,600 | 275.478 | 0.155 | 175.000 | <0.001 | −0.524 | −0.711 | −0.305 |
| Pseudo-3D | 64.720 | 1386.460 | 236.340 | 316.010 | 239.336 | <0.001 | ||||||
| Time-Based Efficiency [goals/s] | Min | Max | Median | Mean | S.d. | Shapiro–Wilk test | Wilcoxon rank sum test | Pearson’s | 95 CI | |||
| p-value | W | p-value | r | lower | upper | |||||||
| Condition | Real-3D | 0.006 | 0.035 | 0.012 | 0.015 | 0.008 | 0.004 | 732.000 | <0.001 | 0.54 | 0.329 | 0.716 |
| Pseudo-3D | 0.005 | 0.094 | 0.027 | 0.030 | 0.018 | 0.002 | ||||||
| Overall Relative Efficiency [%] | Min | Max | Median | Mean | S.d. | Shapiro–Wilk test | Welch Two Sample t-test | Hedge’s | 95 CI | |||
| p-value | t | p-value | g | lower | upper | |||||||
| Condition | Real-3D | 67.59% | 97.73% | 85.70% | 85.14% | 7.50% | 0.149 | 0.792 | 0.432 | 0.202 | −0.309 | 0.714 |
| Pseudo-3D | 67.37% | 97.78% | 87.81% | 86.73% | 8.01% | 0.100 | ||||||
| Sum of Mouse Clicks [n] | Min | Max | Median | Mean | S.d. | Shapiro–Wilk Test | Wilcoxon Rank Sum Test | Pearson’s | 95 CI | |||
| p-Value | W | p-Value | r | Lower | Upper | |||||||
| Condition | Real-3D | 36 | 331 | 135 | 151.2 | 85.105 | 0.041 | 300.500 | 0.028 | −0.284 | −0.519 | −0.008 |
| Pseudo-3D | 19 | 811 | 80 | 122.8 | 148.313 | <0.001 | ||||||
| Mouse Clicks per Second [n/s] | Min | Max | Median | Mean | S.d. | Shapiro–Wilk test | Wilcoxon rank sum test | Pearson’s | 95 CI | |||
| p-value | W | p-value | r | lower | upper | |||||||
| Condition | Real-3D | 0.152 | 0.499 | 0.260 | 0.287 | 0.104 | 0.031 | 553.000 | 0.128 | 0.198 | −0.085 | 0.440 |
| Pseudo-3D | 0.127 | 0.842 | 0.326 | 0.353 | 0.163 | 0.043 | ||||||
| Length of Virtual Trajectory [km] | Min | Max | Median | Mean | S.d. | Shapiro–Wilk test | Wilcoxon rank sum test | Pearson’s | 95 CI | |||
| p-value | W | p-value | r | lower | upper | |||||||
| Condition | Real-3D | 18.020 | 824.460 | 328.340 | 355.410 | 212.753 | 0.371 | 172.000 | <0.001 | −0.529 | −0.709 | −0.342 |
| Pseudo-3D | 1.713 | 545.999 | 125.079 | 142.385 | 140.126 | <0.001 | ||||||
| Average Speed [km/s] | Min | Max | Median | Mean | S.d. | Shapiro–Wilk test | Welch Two Sample t-test | Hedge’s | 95 CI | |||
| p-value | t | p-value | g | lower | upper | |||||||
| Condition | Real-3D | 0.083 | 1.471 | 0.652 | 0.664 | 0.310 | 0.838 | −3.364 | 0.001 | −0.855 | −1.388 | −0.322 |
| Pseudo-3D | 0.015 | 1.01 | 0.412 | 0.406 | 0.285 | 0.100 | ||||||
| Total 3D Rotation [°] | Min | Max | Median | Mean | S.d. | Shapiro–Wilk test | Wilcoxon rank sum test | Pearson’s | 95 CI | |||
| p-value | W | p-value | r | lower | upper | |||||||
| Condition | Real-3D | 0.000 | 9902.000 | 3625.000 | 3720.000 | 2443.027 | 0.265 | 218.000 | 0.001 | −0.442 | −0.638 | −0.221 |
| Pseudo-3D | 0.000 | 6011.380 | 1130.870 | 1577.400 | 1683.764 | 0.002 | ||||||
| Average 3D Angular Velocity [°/s] | Min | Max | Median | Mean | S.d. | Shapiro–Wilk test | Wilcoxon rank sum test | Pearson’s | 95 CI | |||
| p-value | W | p-value | r | lower | upper | |||||||
| Condition | Real-3D | 0.000 | 10.505 | 7.611 | 6.638 | 3.423 | <0.001 | 332.000 | 0.083 | −0.225 | −0.472 | 0.020 |
| Pseudo-3D | 0.000 | 12.567 | 4.036 | 4.462 | 4.138 | 0.003 | ||||||
Publisher’s Note: MDPI stays neutral with regard to jurisdictional claims in published maps and institutional affiliations. |
© 2021 by the authors. Licensee MDPI, Basel, Switzerland. This article is an open access article distributed under the terms and conditions of the Creative Commons Attribution (CC BY) license (https://creativecommons.org/licenses/by/4.0/).
Share and Cite
Herman, L.; Juřík, V.; Snopková, D.; Chmelík, J.; Ugwitz, P.; Stachoň, Z.; Šašinka, Č.; Řezník, T. A Comparison of Monoscopic and Stereoscopic 3D Visualizations: Effect on Spatial Planning in Digital Twins. Remote Sens. 2021, 13, 2976. https://0-doi-org.brum.beds.ac.uk/10.3390/rs13152976
Herman L, Juřík V, Snopková D, Chmelík J, Ugwitz P, Stachoň Z, Šašinka Č, Řezník T. A Comparison of Monoscopic and Stereoscopic 3D Visualizations: Effect on Spatial Planning in Digital Twins. Remote Sensing. 2021; 13(15):2976. https://0-doi-org.brum.beds.ac.uk/10.3390/rs13152976
Chicago/Turabian StyleHerman, Lukáš, Vojtěch Juřík, Dajana Snopková, Jiří Chmelík, Pavel Ugwitz, Zdeněk Stachoň, Čeněk Šašinka, and Tomáš Řezník. 2021. "A Comparison of Monoscopic and Stereoscopic 3D Visualizations: Effect on Spatial Planning in Digital Twins" Remote Sensing 13, no. 15: 2976. https://0-doi-org.brum.beds.ac.uk/10.3390/rs13152976