
Measuring Gas Flaring in Russia with Multispectral VIIRS Nightfire
by
 , ,
, ,
Mikhail Zhizhin
1,2,*, 
Alexey Matveev
2,
Tilottama Ghosh
1 ,
,
Feng-Chi Hsu
1, 
Martyn Howells
3 and
Christopher Elvidge
1 1
Earth Observation Group, Payne Institute, Colorado School of Mines, Golden, CO 80401, USA
2
Space Dynamics and Mathematical Information Processing, Space Research Institute of the Russian Academy of Sciences, 117997 Moscow, Russia
3
Global Gas Flaring Reduction Partnership (GGFR), Energy & Extractives, The World Bank, Washington, DC 20433, USA
*
Author to whom correspondence should be addressed.
Remote Sens. 2021, 13(16), 3078; https://0-doi-org.brum.beds.ac.uk/10.3390/rs13163078
Submission received: 30 April 2021
/
Revised: 24 July 2021
/
Accepted: 28 July 2021
/
Published: 5 August 2021
(This article belongs to the Special Issue Remote Sensing of Nighttime Observations)
Abstract
:According to the data reported by the international and governmental agencies, the Russian Federation remains one of the world’s major associated petroleum gas (APG) flaring nations. In the past decade, numerous studies have shown the applicability of satellite-based methods to estimate gas flaring. New satellite-based observations might offer an insight in region-, company-, and site-specific gas flaring patterns, as the reported data are often incomplete. We provide a detailed catalog of the upstream and downstream gas flares and an in-depth analysis at the country, region, company and site level of the satellite monitoring results of flaring in Russia from 2012 to 2020. Our analysis is based on the VIIRS Nightfire data and validated against high-resolution daytime satellite images and geographical and geological metadata published by the oil and gas companies and the Russian government. Gas flaring volumes in Russia are estimated to average at 23 billion cubic meters (BCM) annually (15% of global flaring), with 19 BCM (82% on national scale) corresponding to the oil upstream flaring, which has been subject to heavy government regulations since 2013. Despite initially dropping, observed flaring volumes have been on the climb since 2018. We are able to monitor seasonal variations, accidents in gas processing and to track the activities to reduce gas flaring. An effect of gas composition on the flare temperature is reported for oil and gas fields in Russia.
1. Introduction
For the past decade, Russia has stayed as the top country with regard to the gas flaring associated with oil and gas exploration, with reported annual flaring estimates ranging from 10 to 20.5 BCM depending on the year of estimate and the source [1,2,3,4]. Because of the lack of publicly available detailed reporting from flare operators in the country and the remote nature of many flare locations in Sakhalin and sub-arctic Siberia, satellite sensors are an attractive option for the monitoring of gas flares. Applications for the estimation of flared gas volumes include carbon cycle analyses that rely on site-specific knowledge of the locations and magnitudes of greenhouse gas emissions into the atmosphere, tracking of activities to reduce gas flaring, and the identification of potentially attractive locations for gas utilization. In this paper, we provide a detailed catalog of the gas flares situated at upstream (production sites), midstream (transportation infrastructure) and downstream (refineries) oil and gas sector facilities and an in-depth analysis at the country, regional, company and site level of the satellite monitoring results of flaring in Russia in the period of 2012–2020.
Our analysis is based on the VIIRS Nightfire data product originally developed and maintained by NOAA, and later by the Payne Institute for Public Policy at Colorado School of Mines [5,6] and validated against open sources of high spatial resolution daytime satellite images, together with the open access geographical and geological metadata published by the oil and gas companies and the Russian government.
The possibility of detecting and parameterizing gas flares using the satellite Defense Meteorological Satellite Program Operational Linescan System (DMSP-OLS) and Landsat platforms was first noted in the 1970s [7]. The authors of [8] performed the first estimate of the temperature and area of the gas flare using images from the AVHRR sensor of the TIROS-N satellites for the Persian Gulf (as further practice showed, the temperature was underestimated).
Declassifying digital images from DMSP satellite series with OLS sensors since 1992 has made possible the first global assessment of flaring based on the luminosity of flares in the visible spectrum band and its correlation with the World Bank expert estimates [9]. Gas flares were identified visually in DMSP data, because the sensor detects electric lights from cities and towns, as well as gas flares. Estimation of gas flaring volumes using DMSP data ended in 2012 due to orbit degradation, resulting in solar contamination.
In Russia, in the mid-2000s, an experimental method of gas flare volume estimation based on MODIS imagery was developed with a reported R2 = 0.81 for the experimental gas flare flowmeter data and compared against the available 2004–2010 reported data in Khanty-Mansi Autonomous Okrug, with a result of R2 = 0.92 for 17 separate gas flares [10].
The authors of [11] demonstrated a technique for using IR channels of ATSR sensors for the night-time detection of gas flares. Approaching the flaring problem, the authors applied the idea from volcanology to detect high-temperature sources (T > 1000 K) using night-time data from near-infrared channels, which are not subject to “noise” from solar reflection and are independent of the background temperature.
After the launch of the Suomi NPP satellite in 2012 with VIIRS multi-spectrometer onboard, Elvidge et al. developed the VIIRS Nightfire (VNF) method for multispectral detection and the measurement of temperature and radiative heat of the IR emitters on the ground at night, including gas flares, industrial sites, biomass burning, volcanoes, etc. [5]. In 2016, the same authors published the first global survey of gas flaring [6]. Other global-scale remote sensing products capable of detecting and estimating the radiative output of the gas flares include short-wavelength infrared (SWIR) adaptation of fire radiative power (FRP) estimates based on the Active Fire Products wildfire detection method [12] and Nightfire adaptation for the Sentinel-3A SLSTR sensor [13], although no continuous annual national scale and point-specific gas flaring volume estimates have been presented in both at the time of writing. Reviews of remote sensing in gas flare detection and monitoring have been published recently [14,15].
In recent studies, the Nightfire algorithm has been further extrapolated to the regional data and hotspots other than gas flares. VNF was demonstrated to be significantly more sensitive in the case of gas flare detection compared with MODIS and VIIRS based Active Fire Products [16]. For China as a case study region, Nightfire data have been successfully applied to categorize the industrial facilities based on their temperature and persistence characteristics [17]. A correlation of VIIRS Nightfire data with reported flaring volume data in Nigeria was developed by the author of [18]. VIIRS Nightfire data were also applied to evaluate gas flaring in Texas and North Dakota [19,20,21,22]. VIIRS Nightfire data were used to assess the impact of gas flaring reduction possibilities on meeting Paris Climate Agreement emission reduction goals [23], and potential global gas flaring black carbon emission levels were calculated using SLSTR Nightfire adaptation [13]. Elvidge et al. examined VIIRS Nightfire detection limits with the introduction of the VIIRS M11 SWIR band for night-time observations [24]. Zhizhin et al. conducted the ground truth validation of the VNF on the controlled gas flares [25]. A comparison of VIIRS Nightfire estimates with regionally reported offshore flaring volumes was conducted by the author of [26].
1.1. Context of Gas Flaring in Russia: Regulations and Reported Data Availability
According to the Russian Tax Code [27], only the gas that is extracted via oil wells is considered associated petroleum gas, or APG (P.II, Chapter 26, Article 337, s. 2, ss. 3: “…Natural fuel gas (dissolved gas or a mixture of dissolved gas and gas cap gas) from all kinds of raw hydrocarbon deposits which is extracted via oil wells (hereinafter referred to as ‘associated gas’)”). APG has been the main focus of governmental regulations aiming at reducing gas flaring in Russia, with higher taxation multipliers applied to the over-limit emission fees. Government regulation, in effect since 2013, aims to achieve 95% APG utilization (i.e., 95% of extracted petroleum gas must not be flared or vented), while increasing fees for over-limit gas flaring [28] (Order, Item 3), with a 25× emission fee multiplier applied to the fields with existing over-limit (i.e., >5%) flaring since 2014 (Provision, Item 2). However, there are several major cases in which this coefficient is not applied or is applied partially:
- The over-limit fee is not implemented unless either three years have passed since the start of commercial exploitation of the field (since 1% of the oil reserves have been extracted) or more than 5% of the oil reserves have been extracted (Order, Item 3);
- An increase in flaring volumes at the oil fields induced by temporary maintenance at the related gas processing plants is excluded from gas utilization efficiency calculations (Provision, Item 4);
- Investments into APG utilization infrastructure can be used to (partially) cover the over-limit part of the fee (Provision, Item 7).
According to the WWF Russia [29], near complete coverage of flaring facilities with flow meters measuring gas flow rate parameters inside the flaring stack was achieved in the mid-2010s. Still, it is reported that some companies may use other methods to assess flaring emissions even if the flow meter is installed, which may lead to biased interpretation of the data [30]. Together with potential errors in flow meter measurements in field conditions and uncontrolled flaring during maintenance procedures, this makes the reported data to some degree inaccurate, allowing companies to flare c. 20% of the over-limit APG, avoiding increased fees, while up to 30–40% of flaring is not taxed as it happens on greenfields, as cited in [30] (p. 236).
Annual gas flaring data in Russia at the highest level of regional subdivision (federal districts) and the national level are publicly available in the Unified Interdepartmental Information and Statistical System (UIISS) maintained by Rosstat (Russian Federal State Statistics Service) [3]. Regional- and subsidiary-level gas flaring data are also provided by “CDU TEK” (subsidiary of Ministry of Energy) on a commercial basis, while the Ministry of Energy publishes annual national- and major company-level reported data on APG production and utilization rates [1,2]. Subsidiary-level data by “CDU TEK” may in some cases correspond to single fields, thus partly yielding field-level data. In Khanty-Mansi Autonomous Okrug, Yugra, regional authorities (Department of Mineral Resources and Department of Supervision of Natural Resources) publish annual gas flaring data (quarterly data are available for 2012–2016 period) [31,32]. Company-level data are also published by the major oil companies in their annual or sustainability reports, usually in the form of APG production and utilization rates on a company scale. Such a way of reporting leaves a possibility of error in interpretation while converting the APG extraction and APG utilization efficiency data into gas flaring volumes. In recent years (c. since 2015), Gazprom, Gazprom Neft, and Lukoil directly reported company-level gas flaring volumes, while Rosneft reported flaring volumes or APG utilization rates among its major subsidiaries. Comparison with these data is presented in Section 3.3.
However, to our knowledge, no continuous field-specific data are made publicly available by any of the sources. Field-level APG utilization rates may also be a trade secret of the companies and may thus be reported to the supervisory authorities only, contributing to the lack of publicly available detailed gas flaring data in Russia.
2. Method
Our method for the estimation of flared gas volume is based on the multispectral night-time observations of flares from space with the VIIRS radiometer onboard the Suomi NPP and NOAA-20 meteorological satellites. For every minute of a night-time (descending) satellite half-orbit, a stack of images in visible and nine infrared spectral bands (we call it a granule) are processed in near-real time with the VIIRS Nightfire algorithm (VNF) [5]. The algorithm can independently detect subpixel IR emitters in SWIR and mid-wavelength infrared (MWIR) bands and characterize them by location, size and temperature, if the signal exceeds the noise level in two or more infrared bands.
VNF detections for the observation period from April 2012 to present are stored in a relational database and indexed by coordinates and time to accelerate the spatio-temporal queries. Currently, only Suomi NPP detections are used in annual gas flaring catalogs. The VNF algorithm also reports cloud state at the location and time of each detection based on the VIIRS cloud mask and atmosphere optical thickness data products [33,34]. Earlier, we observed a flaw in the VIIRS cloud mask algorithm for large gas flares, as it detects a small cloud above the flare even if the atmosphere is all clear in the local proximity [6]. The VNF algorithm corrects this flaw by clearing cloud mask for small isolated clouds above the IR emitters.
The method for estimating annually and monthly flared volumes involved the following steps. First, we defined approximate locations (centroids) and vector boundaries of individual persistent IR emitters by clustering VNF detections in the database. For each cluster centroid, we derived cloud state at every night-time satellite pass, regardless of whether the IR emitter was detected at this location or not. This information was used later to normalize for detection frequency of the flare in cloud-free conditions.
Second, we aggregated the time series of the VNF detections inside the cluster boundaries for the given time interval to estimate the mean temperature, flare shape and radiative heat (combustion energy). To avoid the signal bias through the clouds, we aggregated only cloud-free observations and normalized the mean radiative heat for the detection frequency. In addition, we corrected the source area of individual detections involved in the aggregation for the satellite view angle, based on the flare shape.
Third, we classified the persistent IR emitters into upstream gas flares, downstream refineries, LNG terminals, industrial sites, landfills, etc., based on our analysis of flaring in the past for the existing flares and using high spatial resolution daytime satellite imagery and geographical metadata for the new flares (see Section 2.2).
Finally, we aggregated the estimated flared volumes for individual flares by their type (upstream, downstream) and region (oilfield or country). Here, we used an empirical calibration regression model to derive flared gas volume from the mean radiative heat (see Section 2.5).
The method flowchart is presented in the Supplementary Materials text version in Figure S1.
VIIRS Nightfire ad hoc data were processed in close to real time mode (expected delivery lag is 6 h). At the end of each month, the ad hoc data were revised for potentially missing imagery; such imagery was processed and added to the ad hoc data comprising the definitive VIIRS Nightfire dataset, which was then used for gas flare analysis. The resulting annual gas flaring dataset is available online (requires registration) at the Colorado School of Mines Earth Observation group webpage (https://eogdata.mines.edu/download_global_flare.html (accessed on 27 July 2021)).
2.1. Flare Locations from Clusters in the VNF Detections Database
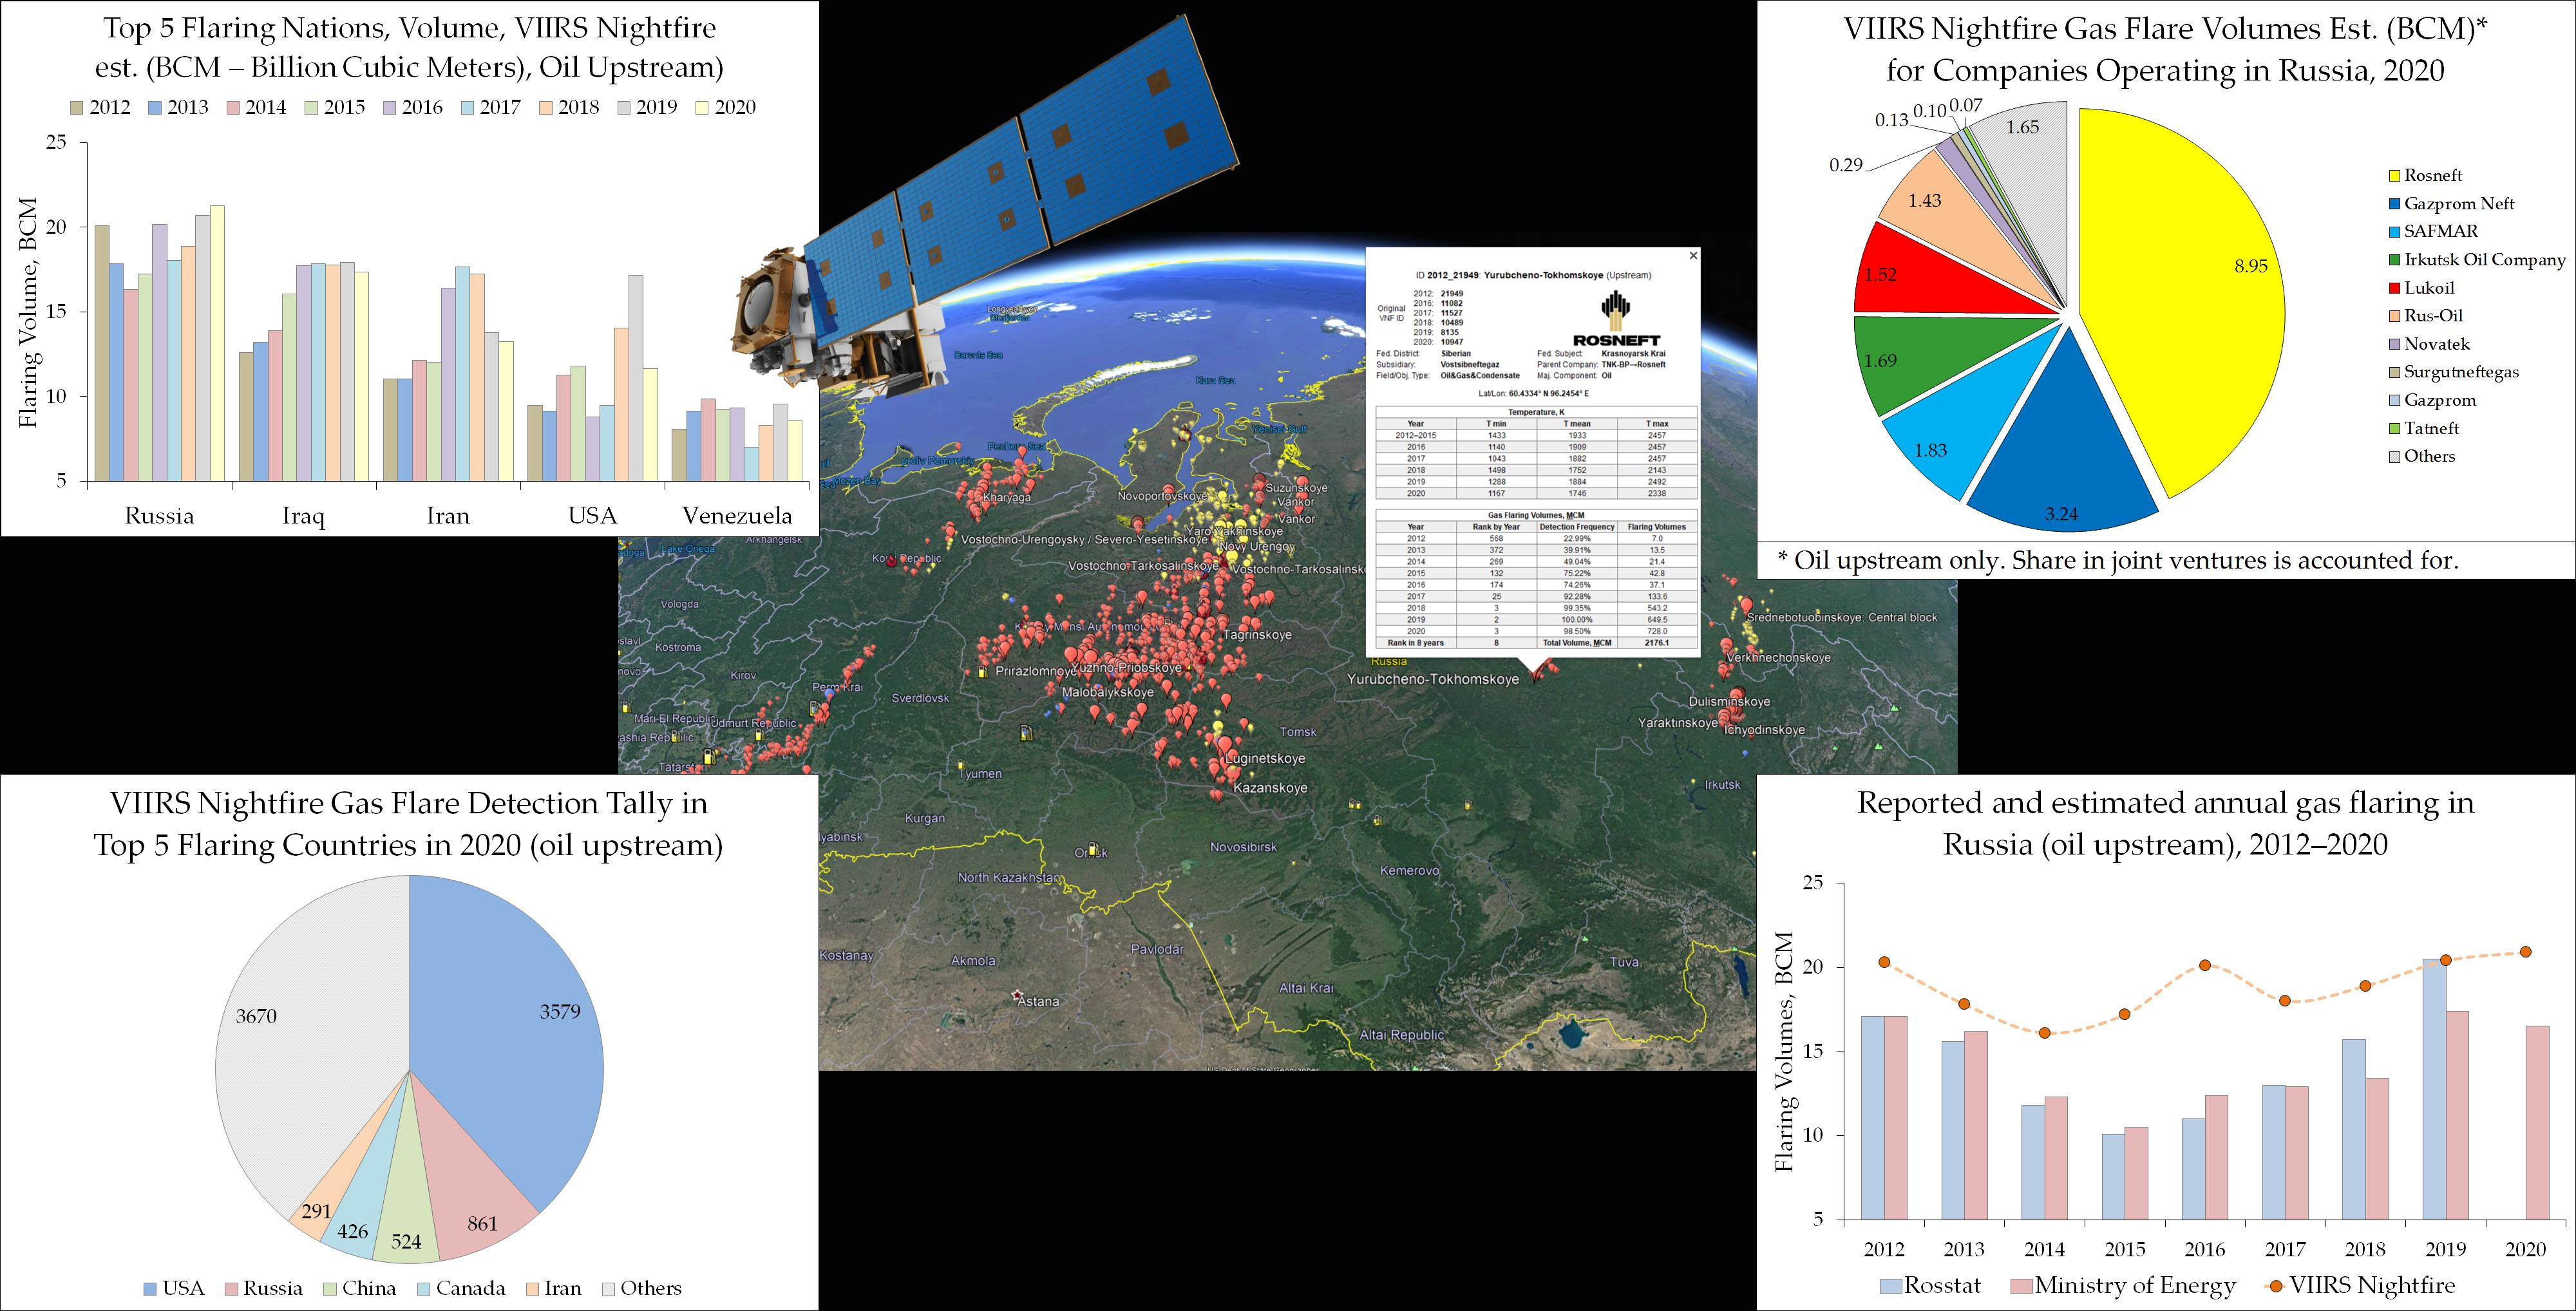
Candidate flare locations are defined as watershed features of a raster detection probability map. To map the detection probability, for each grid cell of the 15 arcsec latitude-longitude raster, we counted the VNF detections in the database when the combustion temperature T > 1200 K and the detection was a local maxima of radiance in the M10 spectral band. The temperature threshold T > 1200 K was derived from the bi-modal distribution of the combustion temperatures in the database with the 2 local maxima of 800 K for biomass burning and 1700 K for gas flares and the local minimum number of detections around 1200 K. By counting only high-temperature detections, we were able to filter out most of the persistent signal from forest and agricultural fires, as well as some industrial objects. Grid cells with less than three detections were considered as “random noise” and ignored (set to zero) in the further watershed analysis (Figure 1).
To define preliminary locations of gas flares and their vector boundaries, we applied watershed segmentation to the raster probability map [35]. Centers of mass of the watershed basins were used as preliminary coordinates of flares, and the vector boundaries of the basins, expanded outside by one pixel with the mathematical morphology dilation, were used in the aggregation of the time series of VNF detections as the flare boundaries.
This is a simplified version of the watershed algorithm used for flare location in [6]. The original algorithm was used to build the annual flare datasets in 2012–2017. Starting from January 2018, VIIRS has added one more night-time channel, M11. Enhanced sensitivity of the Nightfire algorithm after that addition [24] allowed us to simplify the watershed definition of the flare boundaries in 2018–2020 datasets.
Cross-Matching the Annual Nightfire Datasets
Gas flares have a subpixel source size compared to the footprint of a VIIRS M-band pixel. The latter depends on the satellite view angle and varies along a scanline from 0.75 to 1.6 km [36]. By averaging the VNF detection coordinates as described above, we were able to compile a list of persistent gas flare centroids and assign a unique ID to every flare.
Comparison with Google Earth high-resolution images reveals a possible offset of the watershed centroids up to 400 m from the gas flare stack, while single overpass detections may be offset by 1.1 km [16]. This creates a problem for cross-matching, as a different ID can potentially be issued for the same flare in various annual datasets. While single-year datasets are preferable as they help in lowering the complexity of annual data production, a continuously cross-matched gas flare contour ID catalog allows observing a “life cycle” of any given flare, distinguish newly lit flares, and spot abrupt surges or declines in flaring for specific objects.
Cross-matching of the gas flare contours was performed for the annual Nightfire dataset (most datasets are annual, except the 2012–2015 observations, which are compiled into a single dataset). Most of the gas flare contours from subsequent annual datasets were successfully cross-matched, applying the rule that if the centroid of the new contour (i.e., a gas flare from a more recent annual dataset) falls inside any contour previously (i.e., from an older dataset) identified as a gas flare, then it is assigned the ID of the “older” contour. However, infrequently detected flares (e.g., gas flares at the well clusters of large natural gas producing fields) may have their “older” contours ill-defined, which results in “duplicated” non-intersecting contours for a single flare. Other sources of the cross-matching errors are newly lit flares neighboring previously detected ones and dense clusters of gas flare stacks. The problem is further intensified by the thermal “halo” of Nightfire detections around the largest gas flares, which has been observed in Russia and Venezuela.
In the catalog, 2012–2016 entries remained unmodified. For 2017–2020, several manual corrections were implemented. In 2017–2018, new annual gas flares contours (i.e., those having no successful cross-match with the previous annual datasets) recognized as “duplicates” or “halo” based on available high spatial resolution imagery had their estimated flared volumes summed together. For 2019–2020, the same procedure was applied to all the identified gas flare contours which in 2019 resulted in a drop in flare tally from 1185 to 994 compared with the original watershed results.
2.2. Tagging of the Clusters with High-Resolution Daytime Imagery
The annual gas flare contours were visually inspected using high-spatial resolution daytime satellite imagery to validate the presence and categorize the gas flares. The gas flares which had been successfully cross-matched with the contours from the previous annual datasets were automatically merged with and inherited the metadata of the previous flare IDs. New (i.e., not cross-matched) contours were divided into two categories: with a mean temperature higher than 1300 K (“high-temperature”) and with a mean temperature lower than 1300 K but with 4 or more unique Nightfire observations (“low-temperature”). Both datasets were examined using high spatial resolution imagery and, if required (i.e., if the hotspot was not confirmed to be an outlier), following the steps described in Section 2.3.
Google Earth usually contains less than 5 years old imagery from the WorldView satellites for urbanized or traditional oil and gas regions of Russia (such as Khanty-Mansi Autonomous Okrug). However, for some remote regions, relatively fresh satellite high-resolution images were found to be missing. To fill the gap for 2019–2020, we used the PlanetScope satellite imagery available at Planet Explorer (https://planet.com/explorer/ (accessed on 27 July 2021)). PlanetScope imagery, while lower in spatial resolution and oversaturated if full snow cover is present, grants nearly daily coverage of the desired location, which allows detection of the gas flares at exploration facilities based on varying surroundings with the possibility to spot the flaring event itself.
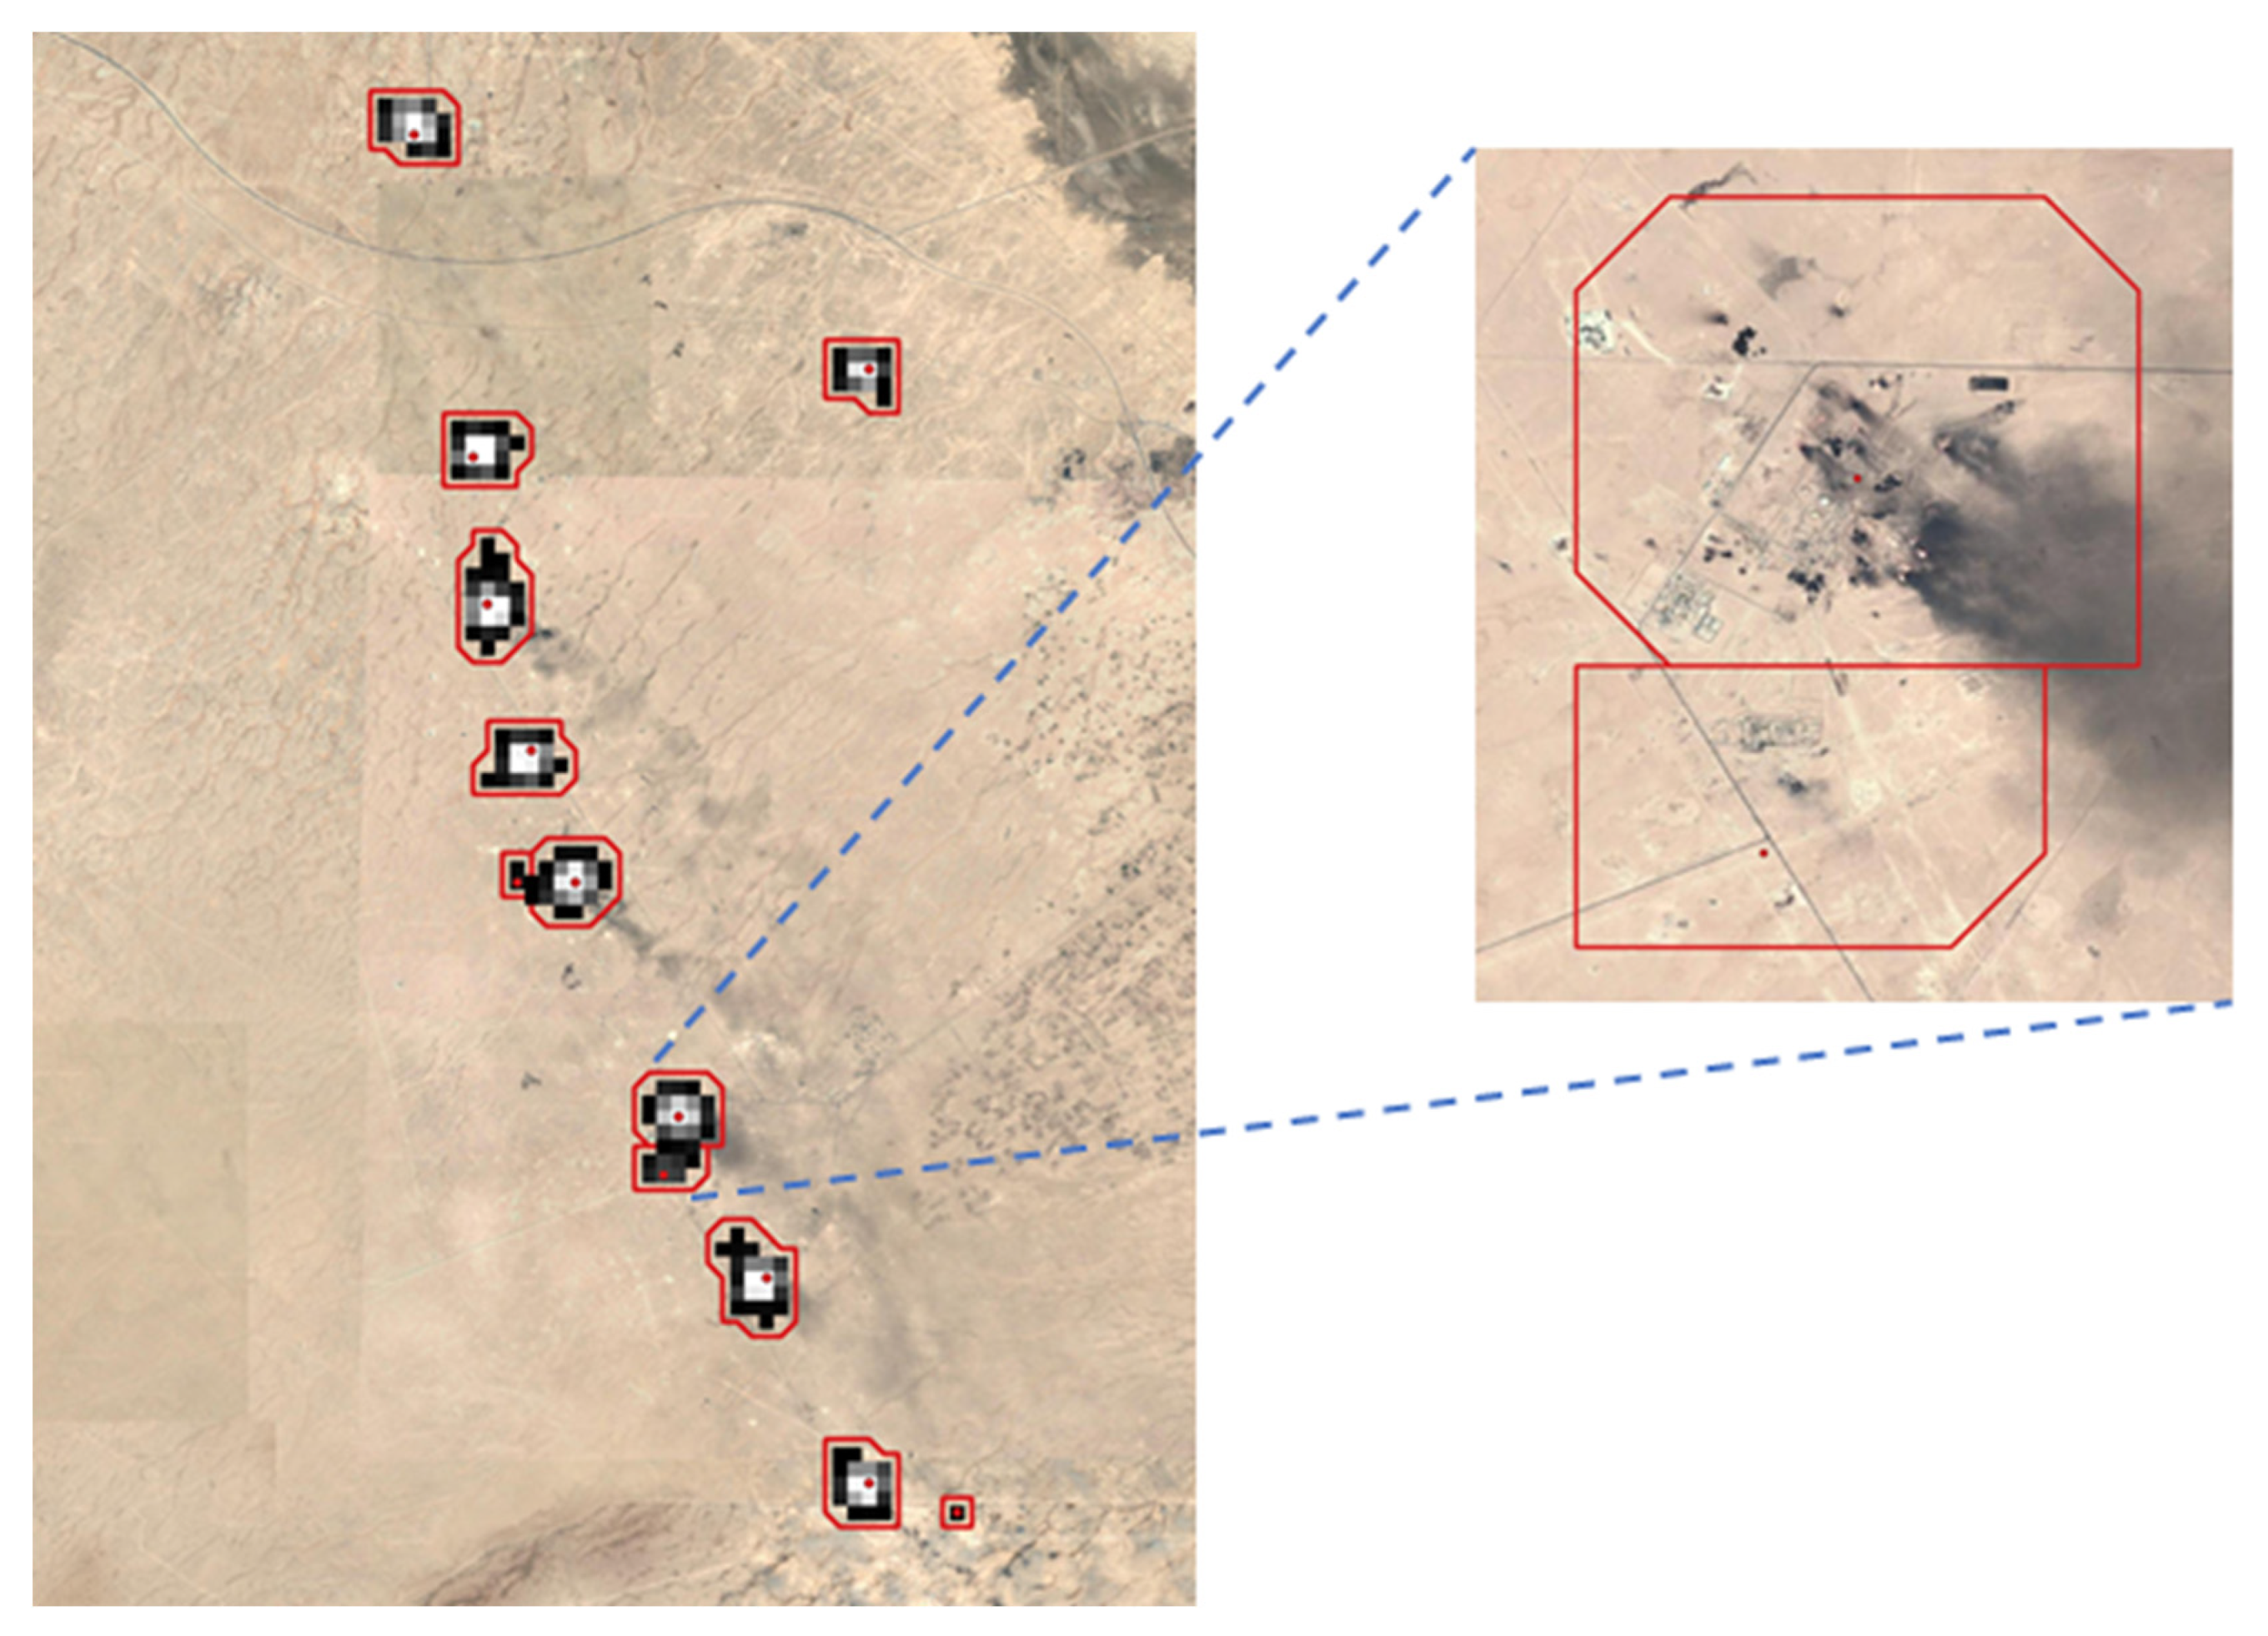
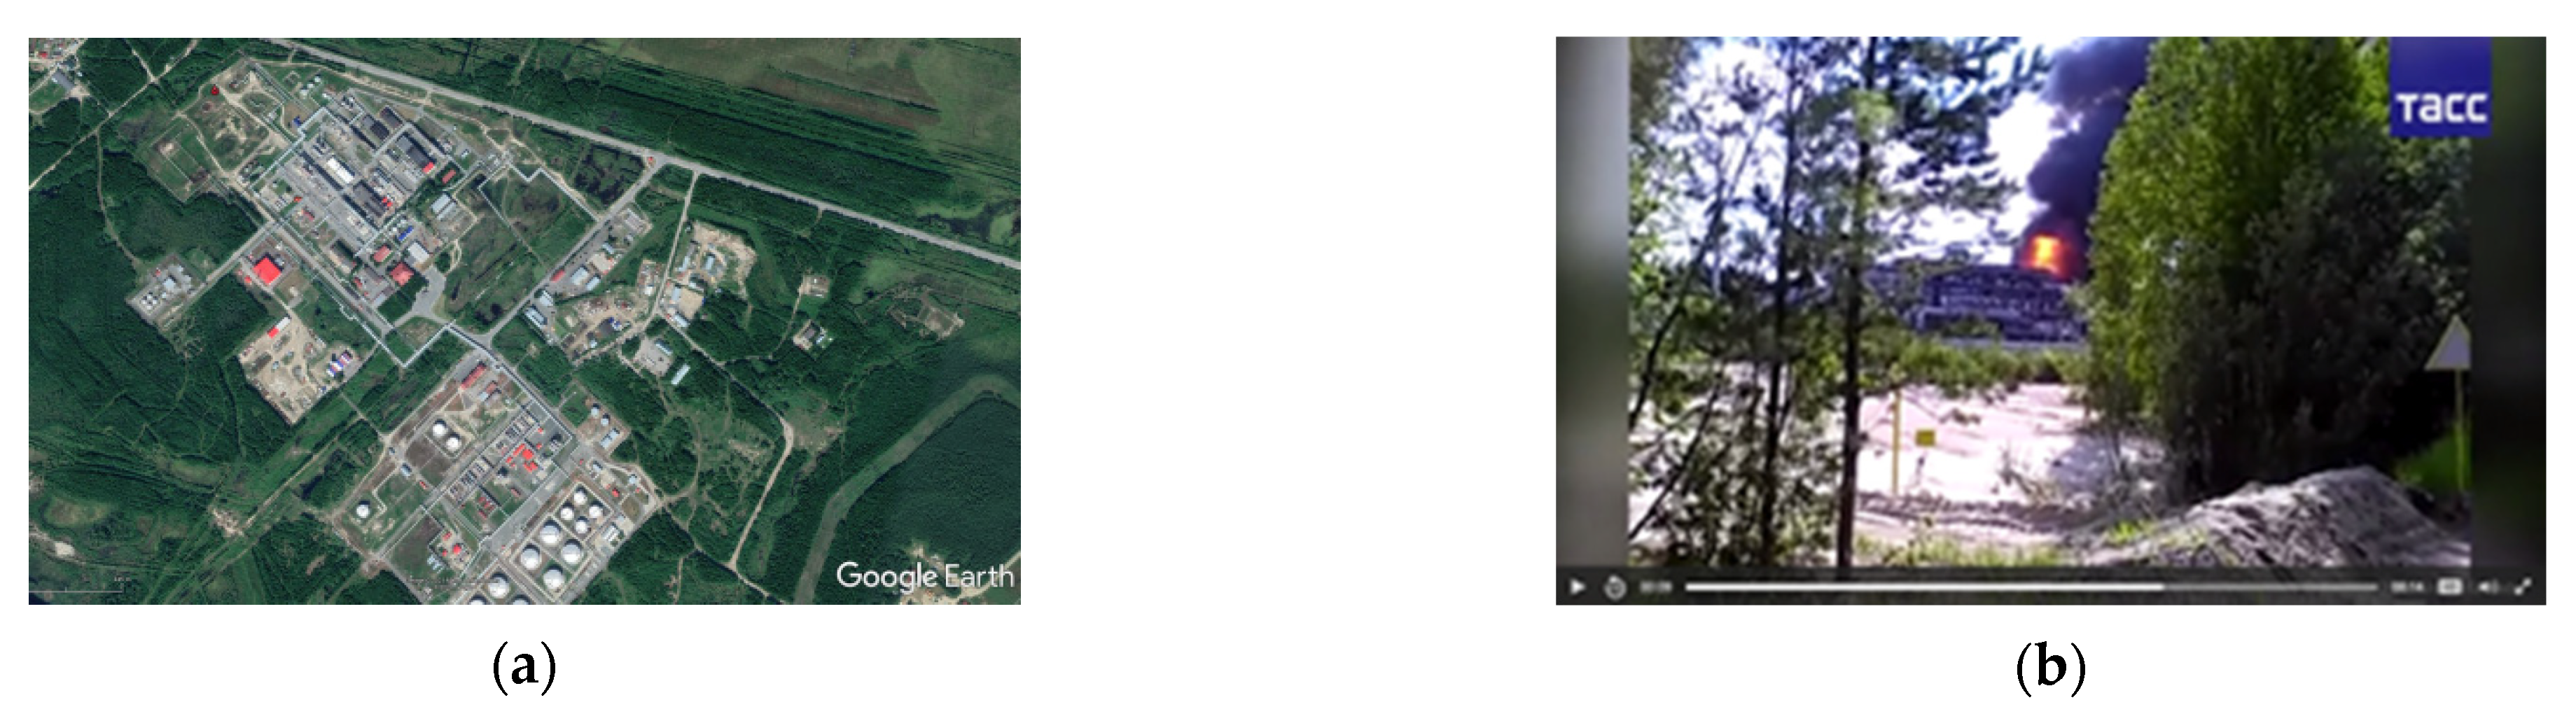
From the analysis of high-resolution images and metadata as described in Section 2.3, the “high-temperature” dataset was found to mainly consist of gas flares, while the “low-temperature” dataset mainly consisted of landfills (characterized by burning and smoldering), steel mills, chemical plants, sawmills, and, rarely, persistent forest fires and volcanoes. On a rare occasion, gas flares could be found in the “low-temperature” datasets, while other non-flare hotspots were present in the “high-temperature” dataset. Hotspots at coal chemistry plants, fertilizer plants, and landfills may correspond to gas flares burning methane (extracted from coal or natural gas) or biogas; however, as the focus of the study is the oil and gas industry, such hotspots were discarded. Examples of high-resolution images for different types of hotspots detected via VIIRS Nightfire are shown in Figure 2.
2.3. Validation of Geographical Metadata for Gas Flares in Russia
Alongside the daytime imagery analysis, geographical metadata were also collected from open sources—such as governmental agencies’ registries or collaborative mapping projects—to validate the detected gas flares and for later application in the gas flare catalog.
For the upstream sector, the main source of geographical metadata was an up-to-date oil and gas field lease information registry maintained by Rosgeolfond (Russian Geological Fund) which specifies the lease ID (which in turn contains information on the regional authority issuing the license), lease name and its owner (subsidiary company) [37], field name and type [38] based on Rosnedra (Russian Federal Agency for Mineral Resources) data, and the oil and gas field map of Russia compiled by “Mineral” based on Rosnedra data with the specified geographic boundaries of leases and deposits [39]. Hotspots from the “high-temperature” dataset (see Section 2.2) with no available imagery but with a high detection frequency (>10%) found within the boundaries of the oil and gas fields or Rosnedra leases in “Mineral” map were considered to be gas flares which are often related to exploration drilling with no oil or gas field registered and mapped yet.
For the downstream sector, a list of oil refineries in Russia is presented by the Ministry of Energy which only contains the legal address of the refinery [40]. As such, the website “Energy Base” was used instead, as it presents specified geographic coordinates of the plants as well as information on the gas processing plants (GPP) and liquified natural gas plants (LNG) [41]. Information on the oil and gas sector in Russia, especially for midstream and downstream facilities located in the urban centers, could usually be found in the collaborative mapping project Wikimapia [42]. Wikimapia can also be used to identify gas flares at the facilities not related to the oil and gas industry.
More specific information on obtaining the geographical metadata for gas flare catalog can be found in Section S1 of the Supplementary Materials text section.
2.4. Cloud-Free Aggregation of Radiative Heat from Flares
For the given aggregation time interval (month, year), we extracted time series of VNF detections inside the cluster boundaries of an individual flare to estimate the mean temperature, averaged coordinates, radiative heat RH (combustion energy, radiant heat) and flare shape. If the flare was detected in multiple pixels on the same image, we selected the detection with maximum radiance in M10 spectral band. By averaging the coordinates of the maximum radiance within the flare boundaries, with time we could locate an individual flare with a precision of a few hundred meters relative to the daytime images from Google Earth for frequently detected gas flares [16].
Before aggregation, we interpolated missing radiative heat values when the flare was detected only in one SWIR spectral band, and it was not possible in VNF to estimate its size and temperature by Planck curve fitting. For these detections in the Stefan–Boltzmann law of radiative heat,
we assume that the flare temperature T has its mean value, and the flare surface area S is a fraction of the pixel footprint equal to the ratio of the observed radiance in SWIR band M10 and the radiation of black body at the same temperature and wavelength, defined by the Planck law.
VIIRS observes the Earth at satellite zenith angles ranging from zero (nadir) to 70 degrees (edge of scan). In examining the observed signals from flares, we found that flares tend to have higher radiance when viewed at high satellite zenith angles due to the buoyancy of the hot gas relative to the surrounding air. Thus, flare footprints appear larger when viewed from the side and smaller when viewed from straight above (the nadir view) [6]. The expression of this in VIIRS data is that the flares have higher radiance when viewed at an oblique angle when compared to the nadir, yet the temperature remains stable across all viewing angles. The three-dimensional shape of flares can be modeled as an ellipsoid, based on the apparent size of flares versus the satellite zenith angle. The footprint viewed by satellite from a zenith angle α will be:
where H and R are flare width and height, respectively. For frequently observed flares, it is generally possible to calculate the aspect ratio H/R using non-linear regression of Equation (2) to the set of flare footprints from different satellite zenith angles. It has been previously observed that typical flare geometry has an aspect ratio in the range of 1–4, with an average of 1.6 [6] (p. 6). To compensate for the variability of the zenith angle, in the time series aggregation we correct the detected flare surface area as if it is viewed from aside (zenith angle 90°).
To avoid the signal attenuation through thick clouds, we aggregate only cloud-free observations and normalize the mean radiative heat (RH) for the detection frequency:
where cloud-free observations indicates the number of VIIRS scans for the Nightfire-identified hotspot contour of interest which are undisturbed by cloud cover, while cloud-free detections indicates the number of cloud-free observations with a successful gas flare detection within the same contour. The quotient of the two variables thus results in gas flare detection frequency (“pct” in the Nightfire catalog).
norm(RH) = mean(RH) * N(cloud-free detections)/N(cloud-free observations),
Cloud-free detections were identified with the VIIRS cloud mask product [33]. Testing indicated that detections through thin clouds with a cloud optical thickness less than 0.01 can also be used for the cloud-free aggregation [34]. Normalization in (3) for the Ndet/Nob ratio is needed to compensate for the short-time variability of flowrate and cloud-free coverage in the long-term averaging. For example, if two identical flares were observed by satellite 60 and 30 times in one month, but one was detected 6 times and another only 3 times, the normalized RH and the estimated flared volumes will be equal. Otherwise, the accumulated RH and flared volume will bias to the more frequently detected flares.
2.5. Calibration of the Flared Gas Volume Estimates Based on the Average Radiative Heat of Flares
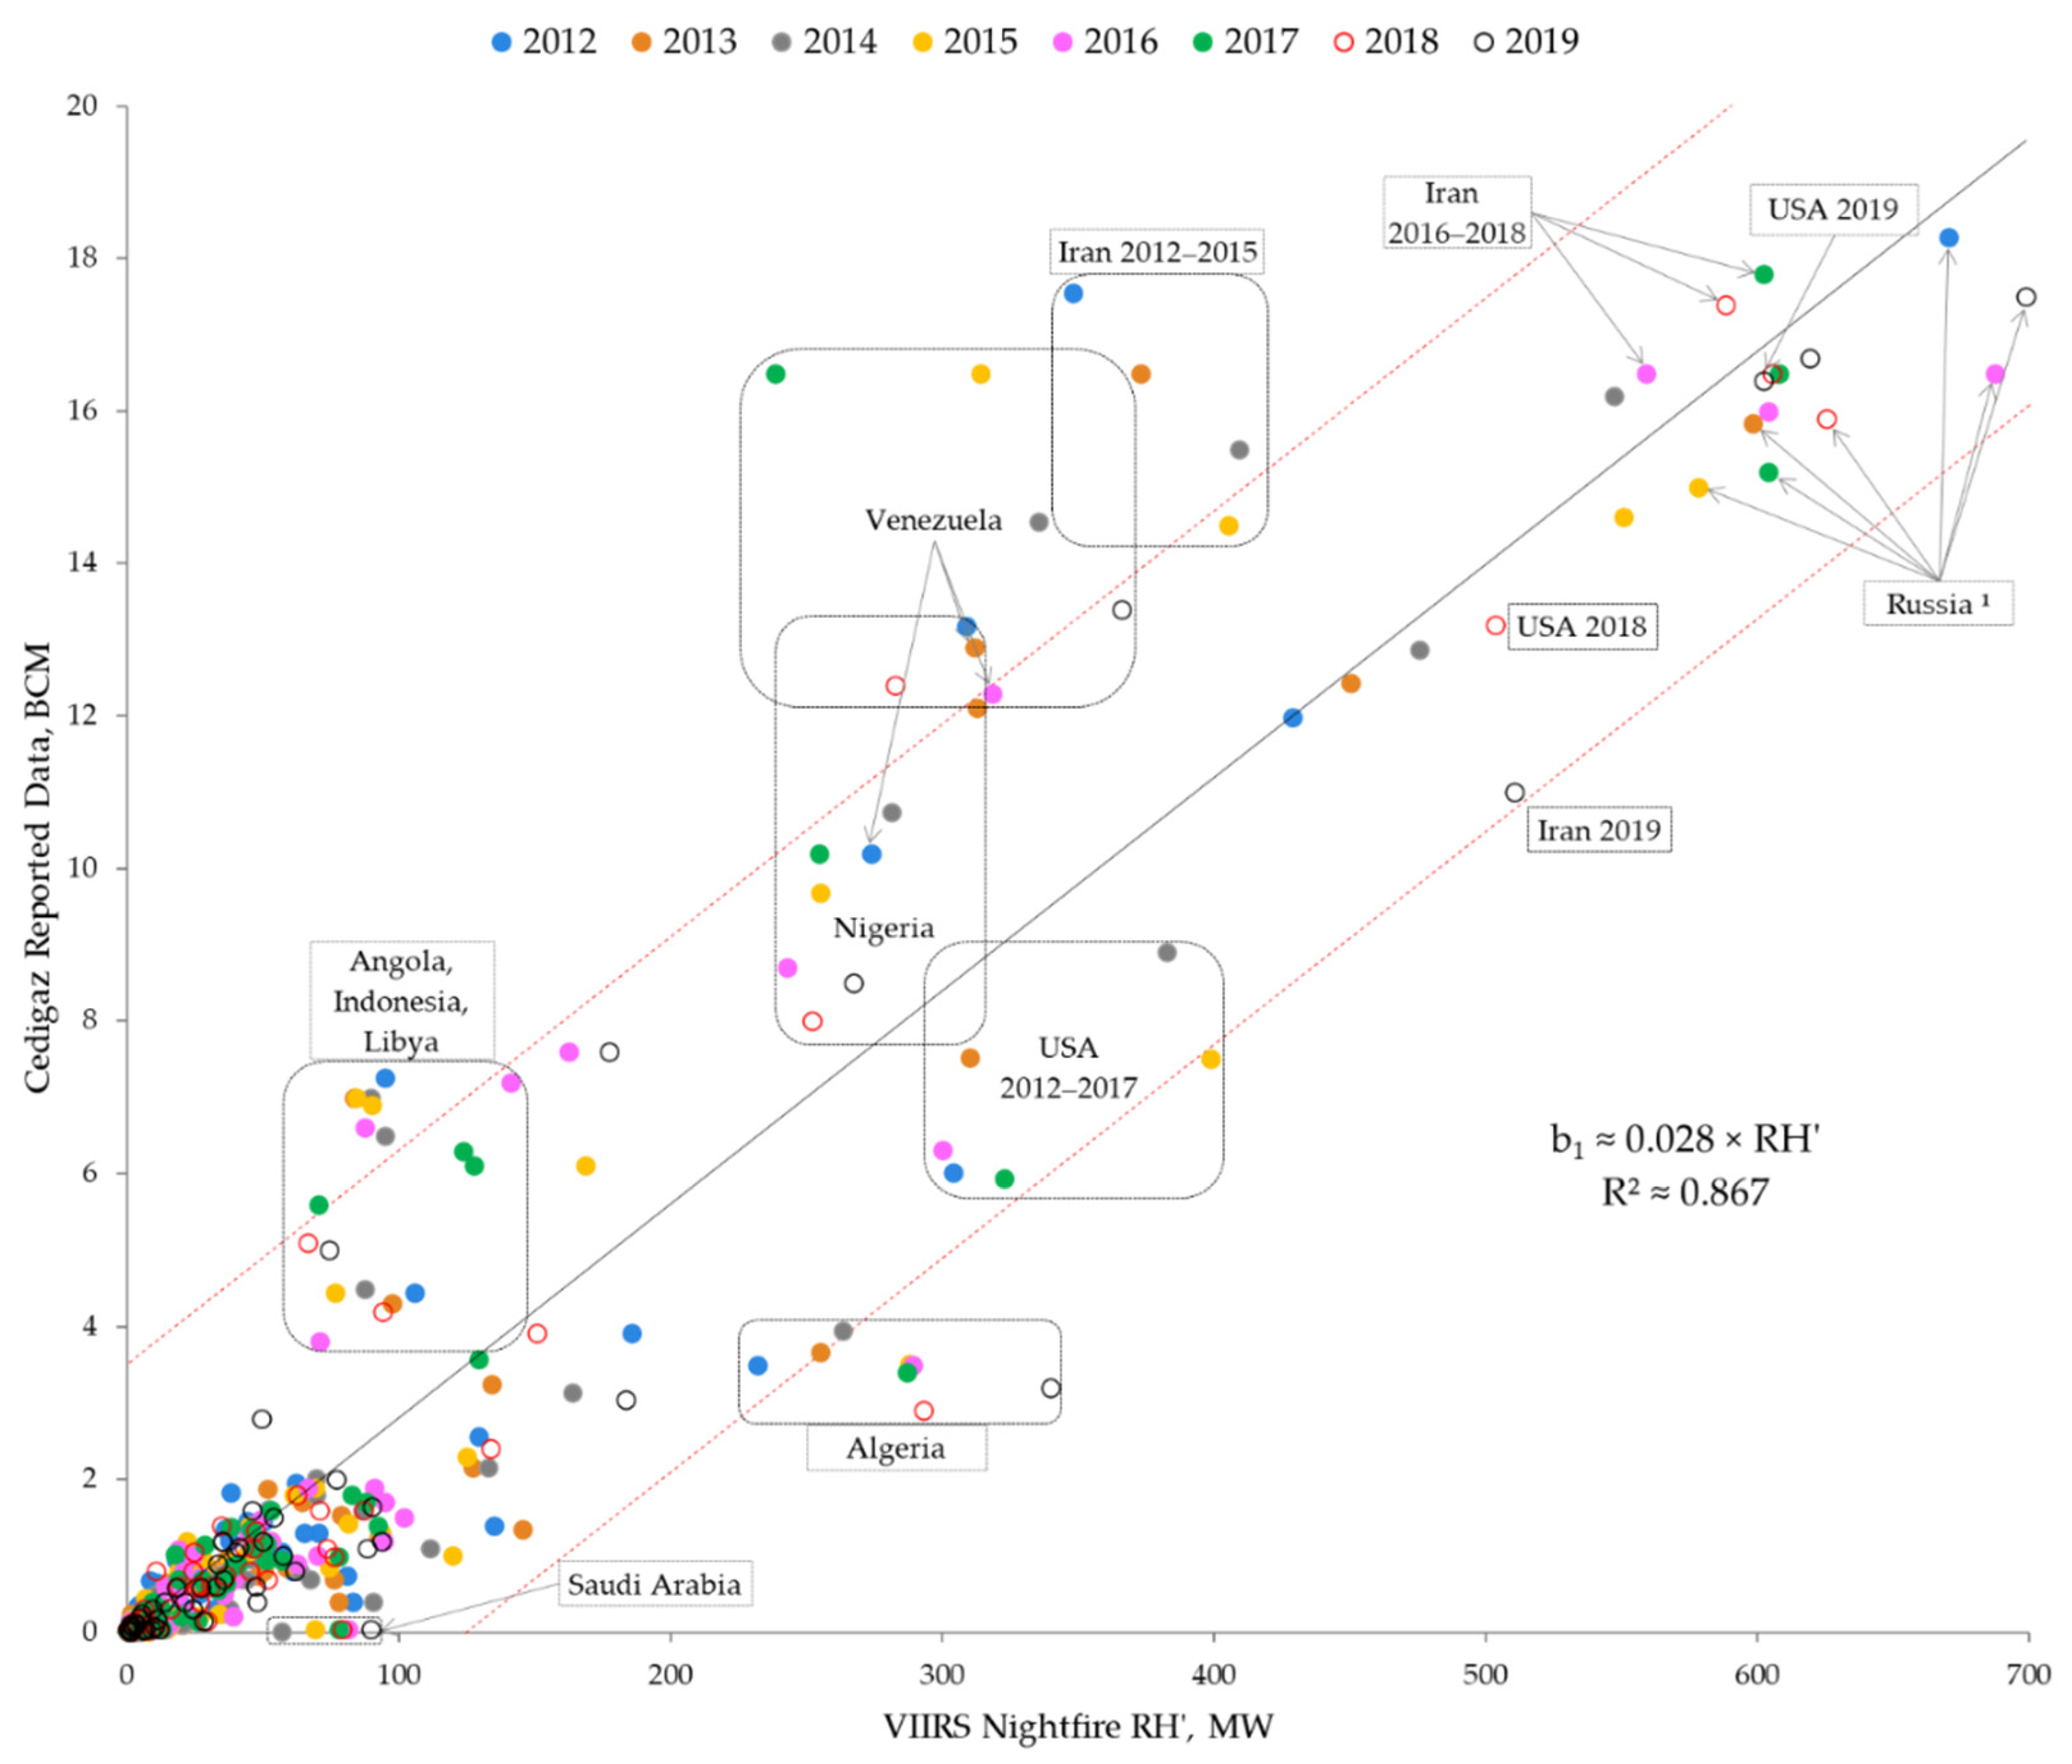
Regression methodology was developed to determine the calibration for the VIIRS Nightfire response in terms of flared gas volume using national-level reporting of upstream flaring for 47 countries provided by Cedigaz [6] (p. 8). Cedigaz includes only flare volumes at oil fields in its reported data [4]. In Russia in particular, there is a substantial volume of flaring at natural gas and gas condensate fields (see Section 3), which is not included in the Cedigaz estimates. Only flares related to oil fields in Russia were used for the calibration. At the time of the calibration study, the Cedigaz data were available for the years 2012–2017.
Non-linearity was introduced by applying an exponent to the source area in the calculation of a modified RH from Equation (1)’s estimate, RH’, for each flare. As part of the calibration process, the value of the exponent was tuned to achieve the highest possible R2 coefficient of determination between reported flare volumes and RH’. For the calibration, annual RH’ estimates from all of the upstream gas flaring sites within the national boundaries were summed, with normalization for cloud cover and the number of valid night-time observations. To determine the optimal exponent for modulating the source areas for estimating RH’, source areas were modulated using exponents ranging from 0.4 to 1.0 and evaluating the coefficient of determination R2 between RH’ and the reported data. The highest R2 occurred for an exponent D = 0.7 [6] (p. 8).
The linear regression relating the Cedigaz reported BCMi and RH’ estimated by VIIRS Nightfire is
where i = 1 … n, and n is the number of countries in the Cedigaz report, and the residuals εi are the regression errors [43]. The linear model is significant at the 5% level and it explains 83% of the variability in the response.
We found that the intercept b0 is not significant for the linear model at the 5% level, and thus simple regression through the origin (RTO) [44] can be used for calibration:
Using the ordinary least squares, the estimated RTO slope b1 with 95% confidence intervals is
b1 = 0.0294 ± 0.0017
The 95% prediction interval for an individual country/year varies in a narrow range from ±3 to ±3.5 BCM within the full range of the observed national-level sums of RH’ from 0 to 700. Predicted total flared volume for all the countries with the Nightfire-detected flares (not only from the Cedigaz dataset) varied year by year in a range from 137 to 142 BCM with 95% prediction interval ±30 BCM. National-level correlation between the sources is presented in Figure 3. Exact regression slope coefficients can be found in Table S1 in the Supplementary Materials section.
In Figure 3, it is apparent that observations for some countries form their own distinct groups. Cedigaz reported almost non-existent flaring in Saudi Arabia, while significant flaring activity is observed with Nightfire. Algeria appears to be another noticeable outlier, with Cedigaz’s estimates falling outside of the 95% confidence intervals, which could possibly be attributed to significant flaring at natural gas upstream and downstream facilities. Gas flaring in Venezuela and Iran tends to be underestimated with Nightfire, presumably due to Nightfire’s tendency to underestimate large flares (see Section 4.2), which are typical for these countries.
3. Results
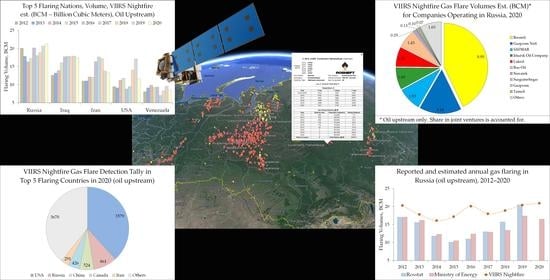
The main result of the present work is a gas flare catalog with detailed geographical metadata and annual VIIRS Nightfire BCM estimates for individual gas flares in Russia in 2012–2020. The catalog is available as the digital supplement both in a spreadsheet format (as an MS Excel file) and a keyhole markup language zipped (KMZ) format to review geo-located point data in Google Earth (see Supplementary Materials section). An example entry from the latter is presented in Figure S2 in the Supplementary Materials text section.
The annual catalog includes gas flares located at upstream, midstream, and downstream oil and gas industry facilities in Russia. In this work, “upstream” was defined as flaring occurring within the lease sector boundaries corresponding to an oil or gas field (including primary processing units and inner transportation infrastructure), “midstream” was applied to the units of transportation and storage of hydrocarbons outside the oil and gas fields, and “downstream” was reserved for oil and gas refineries with deep processing of the raw materials. Upstream sector is further divided into categories based on Rosgeolfond field classifications (including gas, oil, (natural) gas condensate, and mixed types) with the major component—oil or natural gas—stated alongside with Rosgeolfond classification; downstream facilities include oil refineries, gas processing plants (GPP), liquified natural gas (LNG) facilities, and petrochemical plants. The catalog contains 3220 unique entries (gas flare IDs), each containing 52 data entries including geographical metadata such as information on the field or object’s name and its type, administrative region, subsidiary and parent company or companies (in the case of joint ventures) in possession of the facility, as well as Nightfire data such as information on minimum, maximum and mean temperature, detection frequency, and flaring volumes of the flare ID in MCM (million cubic meters). The gas flaring catalog is described in more detail in Section S1 of the Supplementary Materials.
During the observation period, the maximum flare tally (unmodified original VIIRS Nightfire data) in Russia was observed in 2013–2014 (1495). Since then, it has been steadily declining, with a significant drop (142 unique flare IDs) to 1185 flares detected in 2019 and an increase to 1241 flares observed in 2020. Over the course of the observation period, flaring was detected at 1063 separate oil and gas fields, exploration drillings, midstream and downstream objects. For reference, 2093 oil fields were reported to be in industrial operation in Russia by January 2019 [45].
Among 3220 entries in the catalog, only 6% (190 entries) correspond to gas flares at midstream and downstream facilities. Approximately 33% (1050 entries) of flare IDs were identified at natural gas and gas condensate upstream facilities. Nineteen detected gas flares remained unidentified (i.e., no field/object name specified), while for ten entries, the major extracted component was not identified.
Total estimated gas flaring volumes in Russia in 2012–2020 averaged at 23 BCM, with the minimum observed in 2014 (20.1 BCM) and maximum observed in 2020 (25.6 BCM). Approximately 82% of the total gas flaring volume corresponds to the oil upstream sector, with the maximum 20.9 BCM in 2020 and minimum 16.1 BCM in 2014. Approximately 10% of gas flaring occurs at natural gas and gas condensate upstream facilities, with the peak observed in 2020 (3 BCM). The remaining 8% of the flaring volume is observed at midstream and downstream facilities, with a 2 BCM peak in 2015–2016 and the lowest volume, 1.4 BCM, in 2019.
3.1. Context of the Major Oil Producing and Gas Flaring Countries
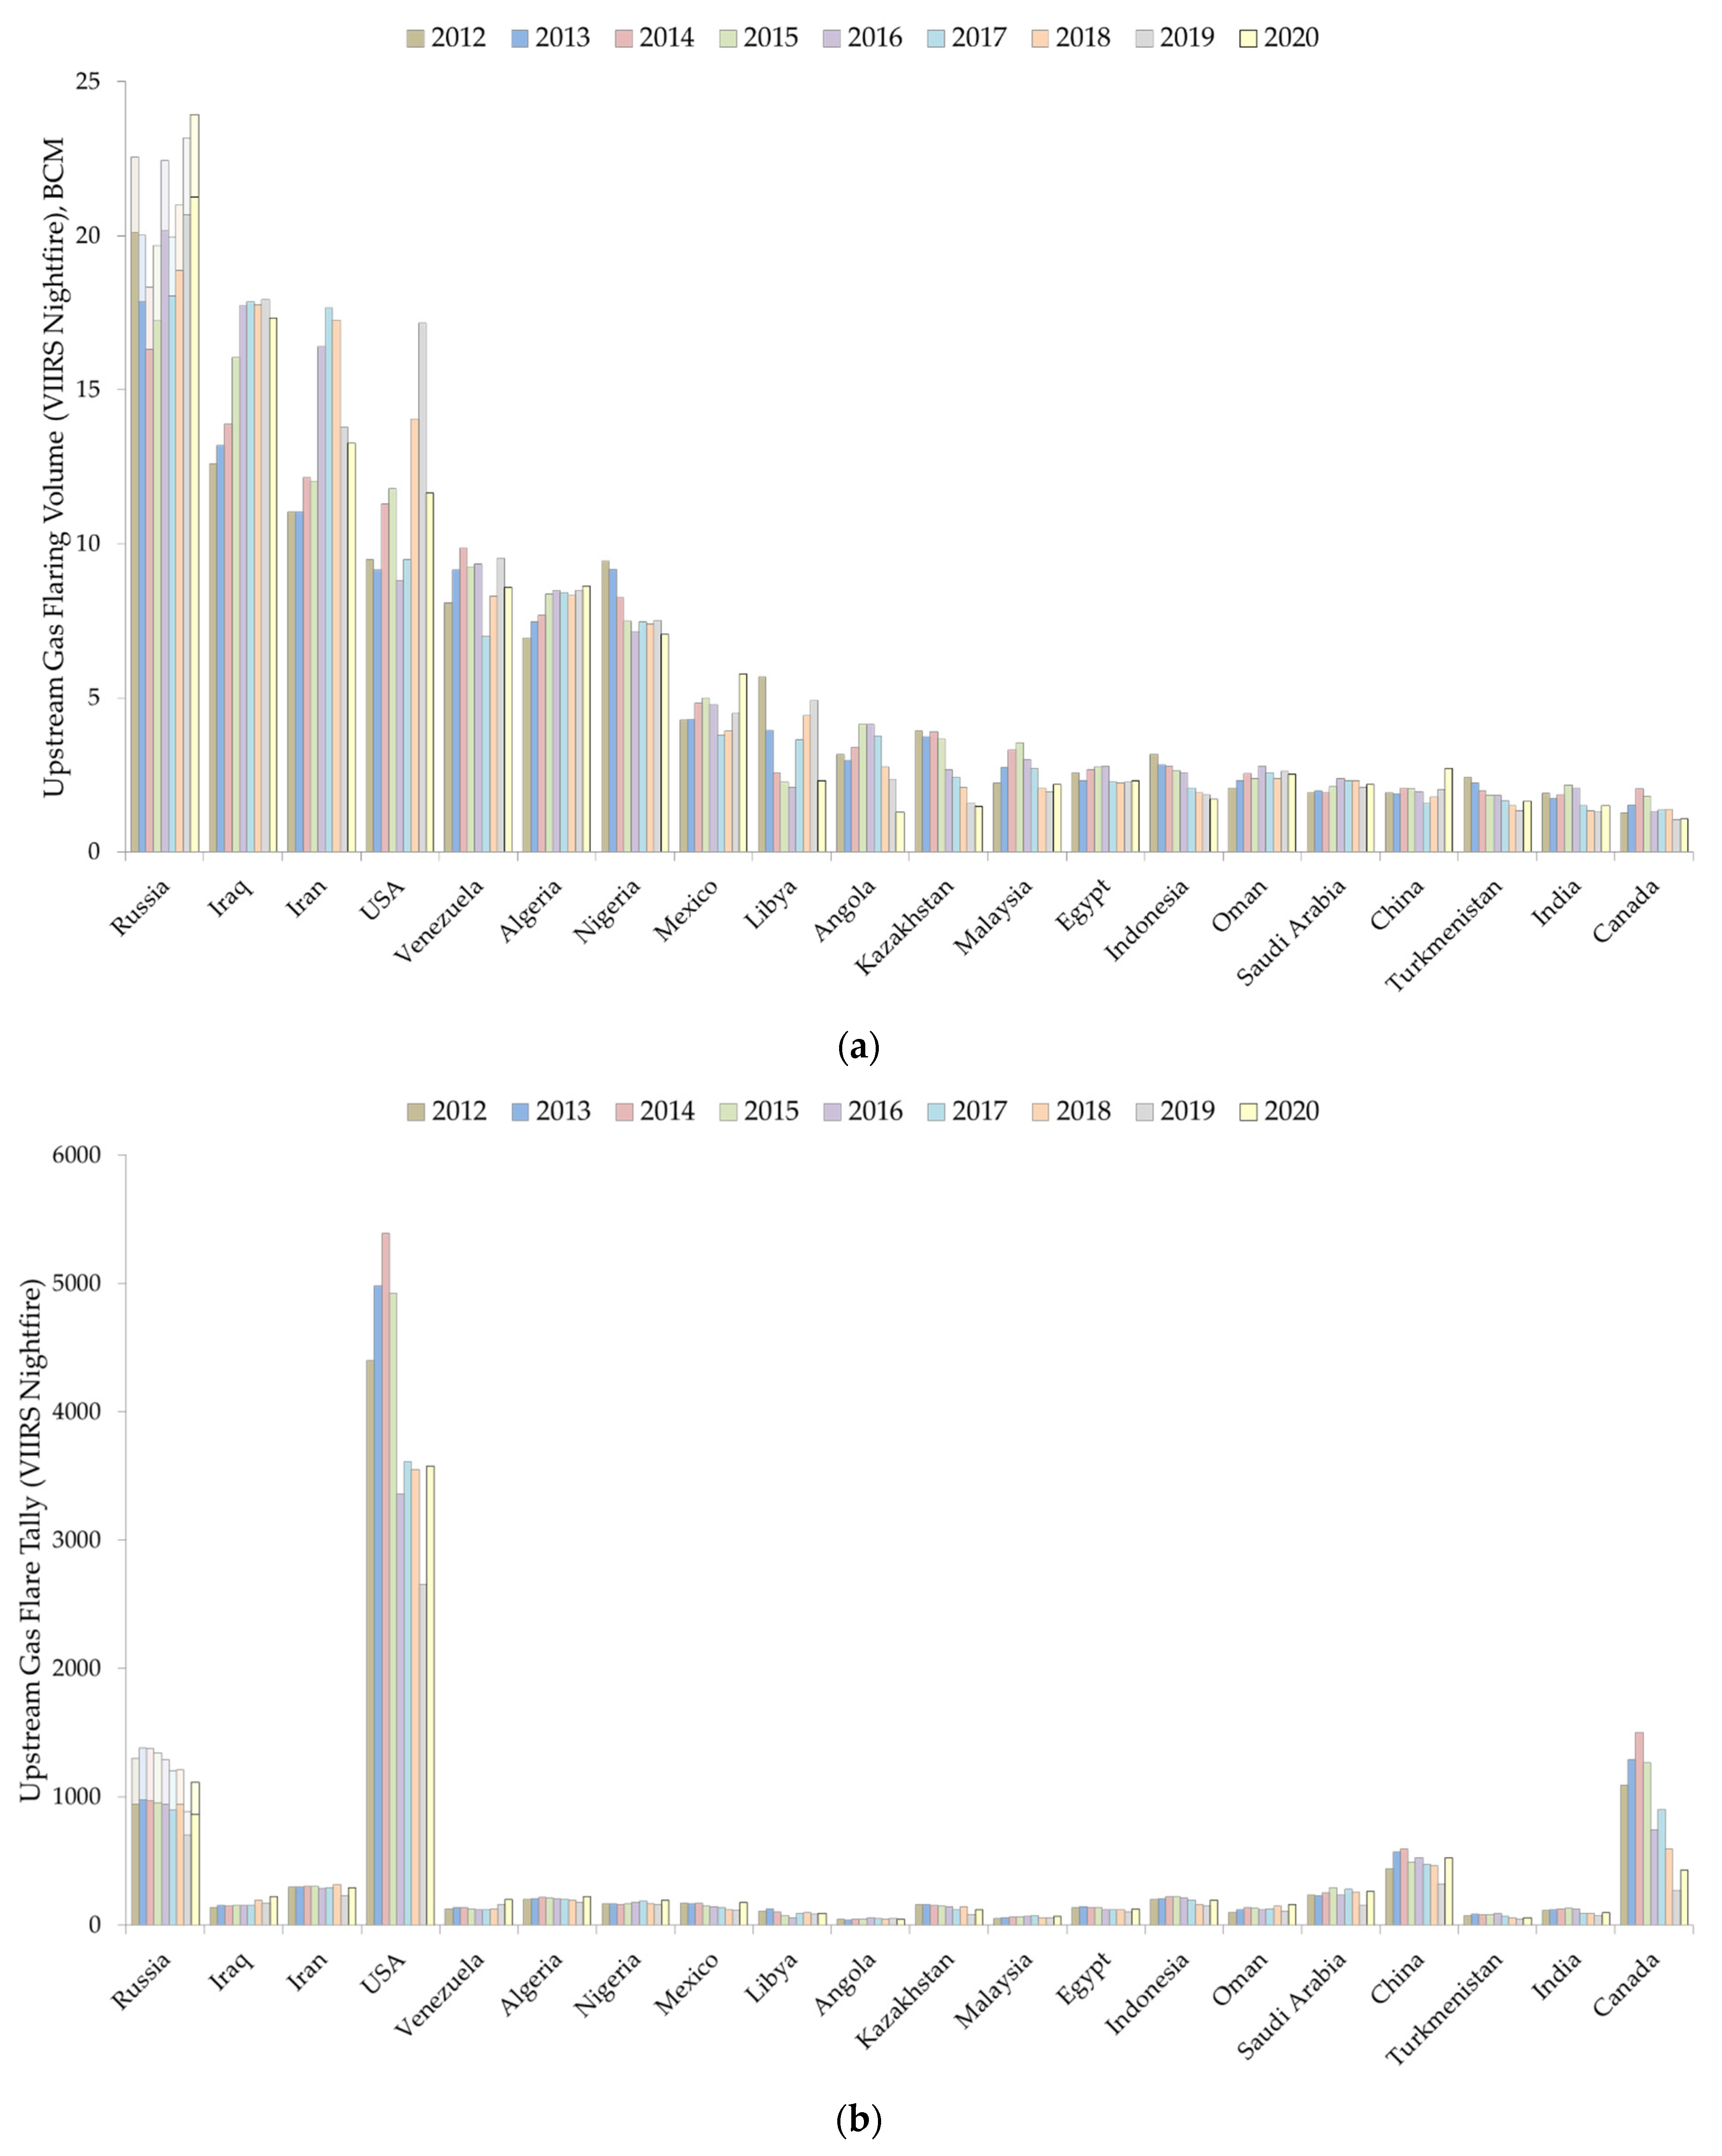
In Figure 4, the world’s largest flaring nations are listed by flaring volumes and number of gas flares at the upstream facilities only. As is evident from Figure 4b, the highest flaring volumes are annually detected in Russia, while the maximum number of gas flares is detected in the USA. Even if only the oil upstream sector was taken into consideration, Russia would still be the highest flaring nation, with flaring estimates being comparable with Iraq or Iran in 2017–2018.
Most countries experienced an increase in gas flare tally in 2020, which can be attributed to sudden shortages in processing facility capacities following the COVID-19 pandemic conditions. However, most countries, excluding Russia, Mexico and China, also experienced a drop in total flaring volumes, which is likely induced by the drop in worldwide oil production. With the exception of Russia, highest flaring volumes in 2020 were registered in Iraq (17 3 BCM), Iran (13.3 BCM), USA (11.7 BCM), Algeria and Venezuela (8.6 BCM). Compared with 2019, a conspicuous drop in flaring volumes can be observed in the USA (from 17.2 to 11.7 BCM), Libya (from 4.9 to 2.3 BCM), and Angola (2.4 to 1.3 BCM). Estimated global annual upstream gas flaring in 2020 dropped from 146 to 138.5 BCM, while overall flaring dropped from 160.5 to 152 BCM.
Figure S3 in Supplementary Materials text section presents scattergram detection frequency vs. gas flaring volumes for Russia and USA.
3.2. Flaring Estimates in Russia by Major Regions and Companies
3.2.1. Regional Estimates
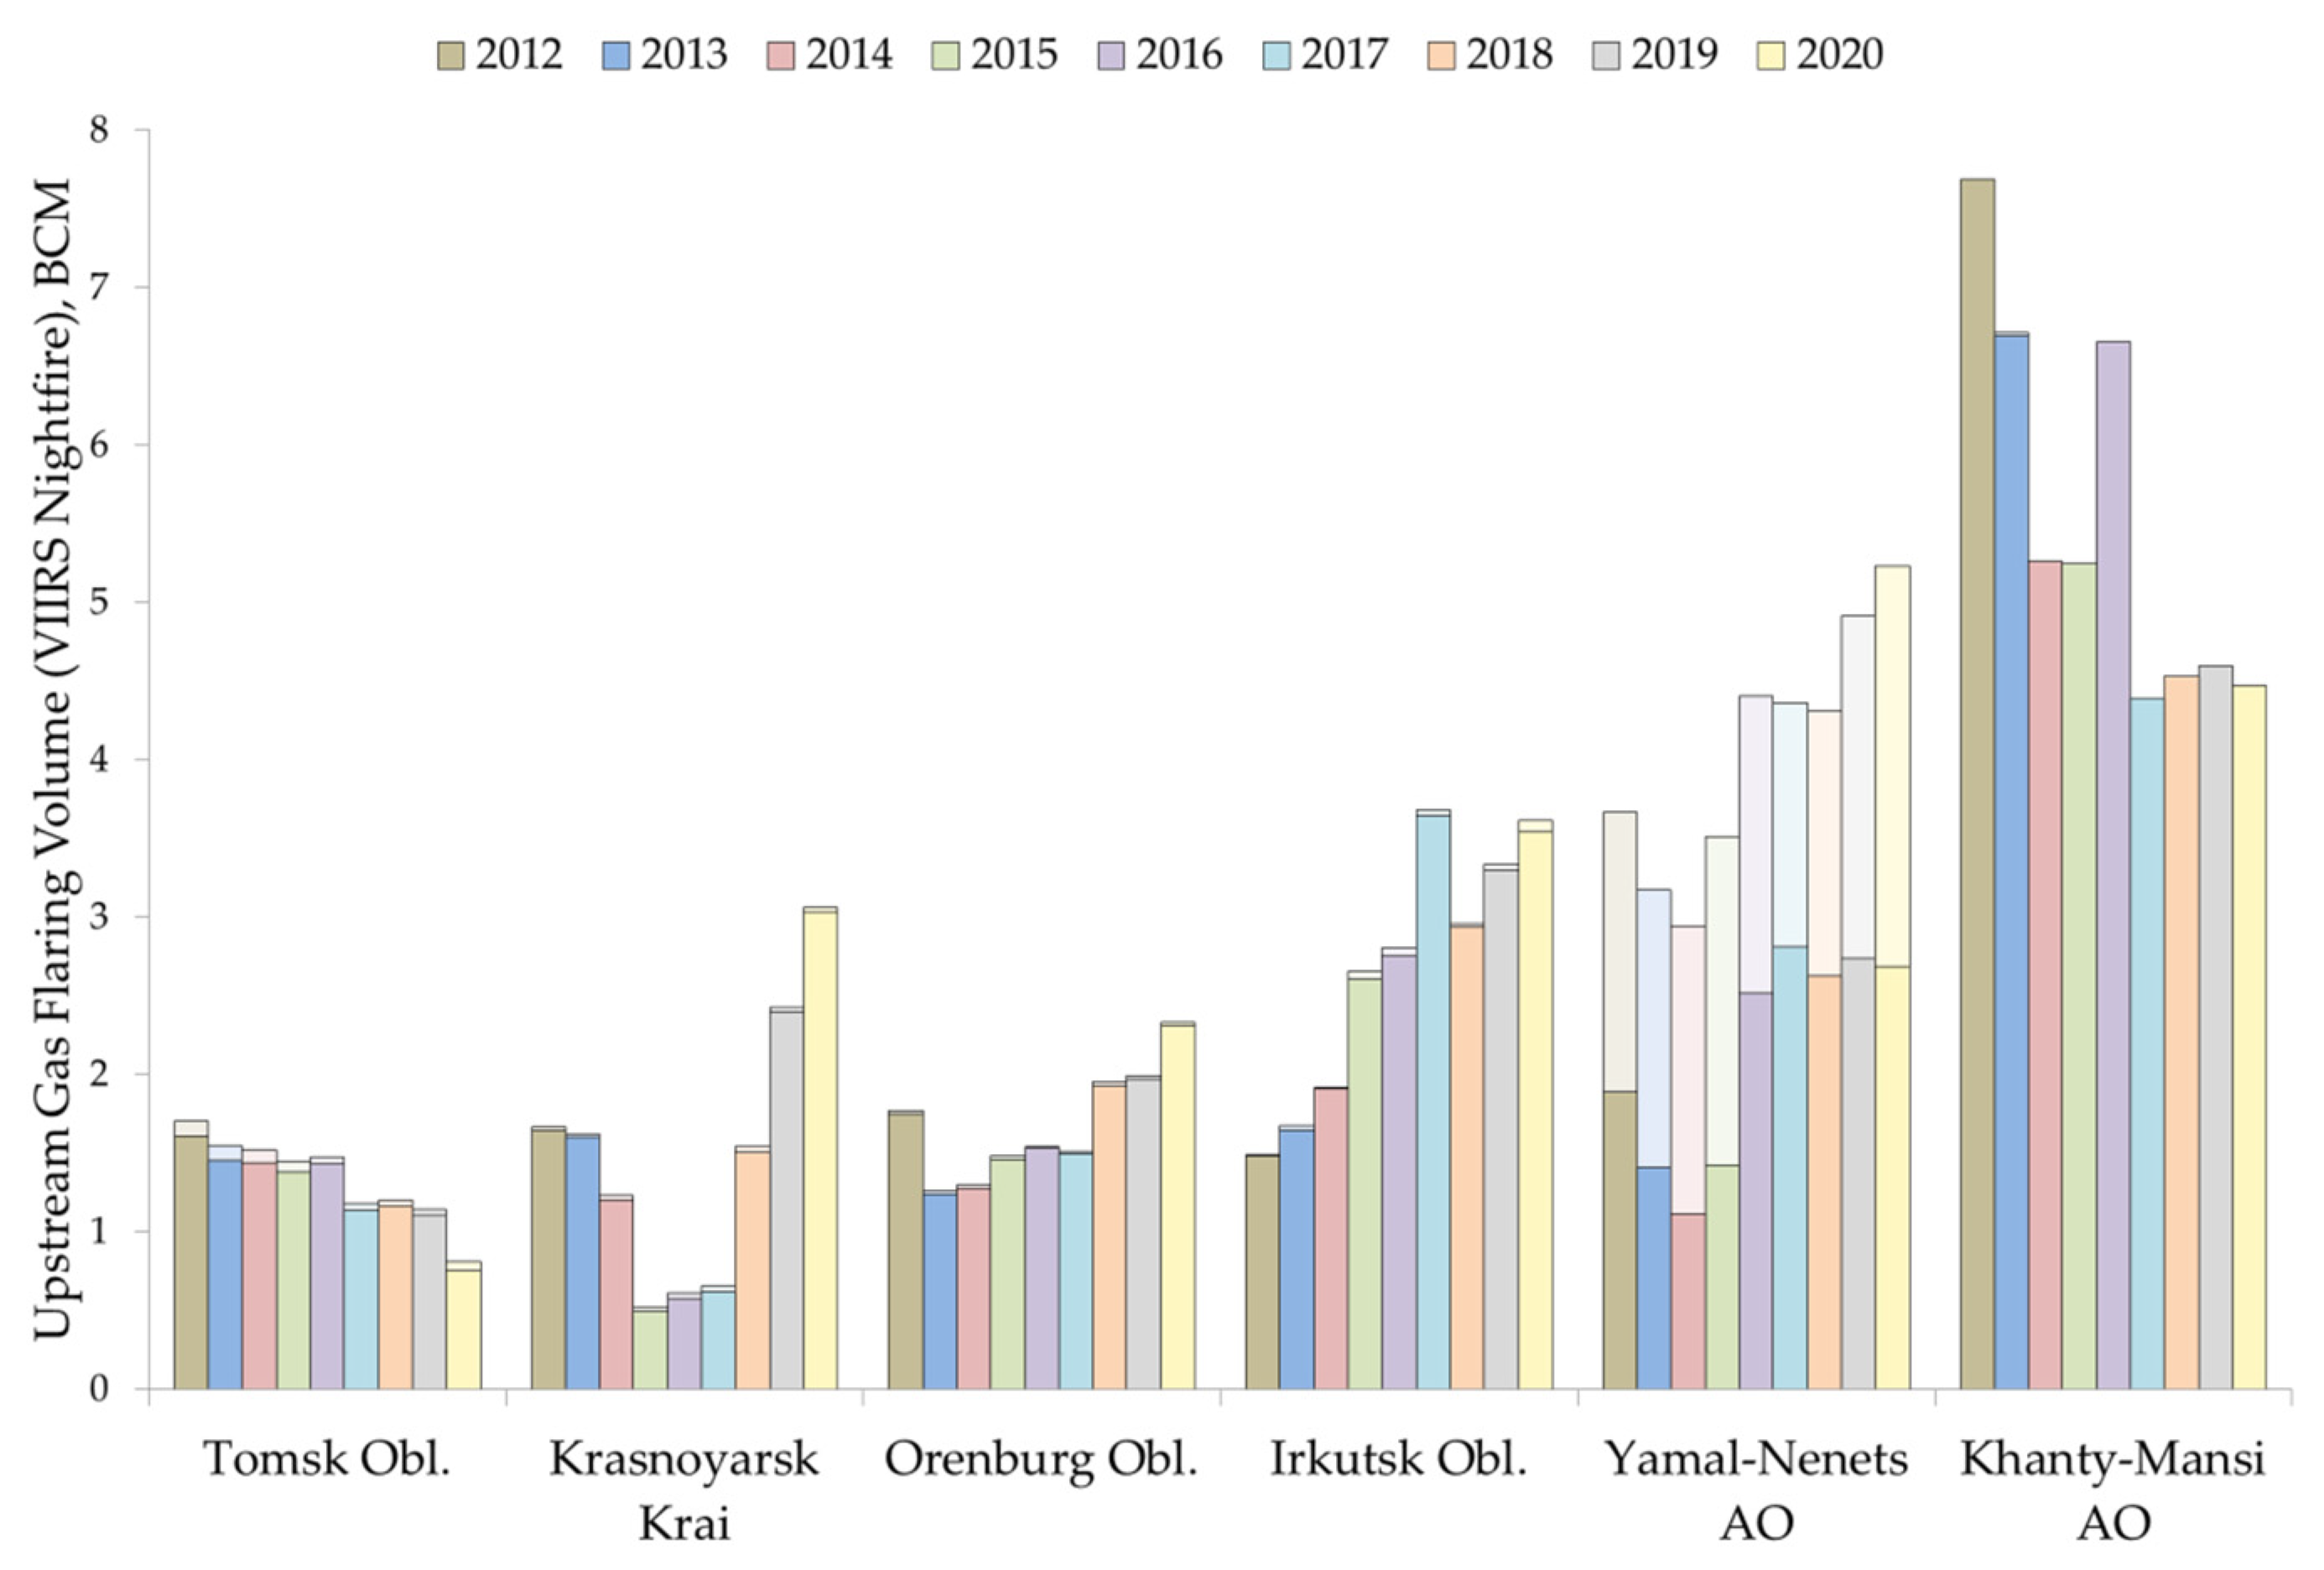
Upstream gas flaring was detected in 27 federal subjects of Russia as well as at 9 offshore platforms or offshore exploration vessels located on the shelf of Russian Federation, with downstream flaring occurring in 12 more regions. The histogram in Figure 5 presents a breakdown of gas flaring volumes in the major flaring regions of Russia.
The annual analysis reveals that Khanty-Mansi Autonomous Okrug (KhMAO) remains the major APG flaring region in Russia, albeit its share in total gas flaring volumes in Russia has dropped significantly since the start of observations in 2012, from 33% to 22%. As reported, annual APG extraction volumes in the region remain consistent [31,32], and it is evident that APG utilization in KhMAO, the major oil production region of Russia (42–50% of annual oil production [46]), has increased significantly.
Among the other regions, Yamal-Nenets Autonomous Okrug (YaNAO) produces 10% of oil and gas condensate in Russia; however, relatively high flaring rates were achieved as new large oil fields with no or limited connection with the existing gas pipeline infrastructure were commissioned during the observation period. Other major contributors in the region are large gas condensate and natural gas producing fields where, as described in Section 1.1, flaring occurring alongside natural gas and gas condensate production is likely not subjected to increased emission fees in effect only for associated petroleum gas. Unique for this region is that fields categorized as natural gas and gas condensate upstream contribute up to 40–60% of the gas flaring volume in YaNAO, with their share dropping in the recent years. Due to natural gas upstream flaring, Yamal-Nenets AO in 2019–2020 is estimated to have been the highest flaring region in Russia.
Substantial flaring is observed in Irkutsk Oblast and Krasnoyarsk Krai (each producing c. 3–4% of national oil output). In these regions, gas flaring mostly occurs at a small set of fields. For instance, more than 95% of estimated flaring volumes in Krasnoyarsk Krai in 2012–2013 occurred at the Vankor oil field, with the largest single flare in the world detected with VIIRS Nightfire in 2012. In Irkutsk Oblast, a continuous increase in oil production levels during the observation period led to a twofold increase in gas flaring volumes, as gas utilization capabilities in the region are limited.
Specific flaring volumes at the largest flaring oilfields in Russia are presented in Table S2 in Supplementary Materials text section.
3.2.2. Company-Level Estimates
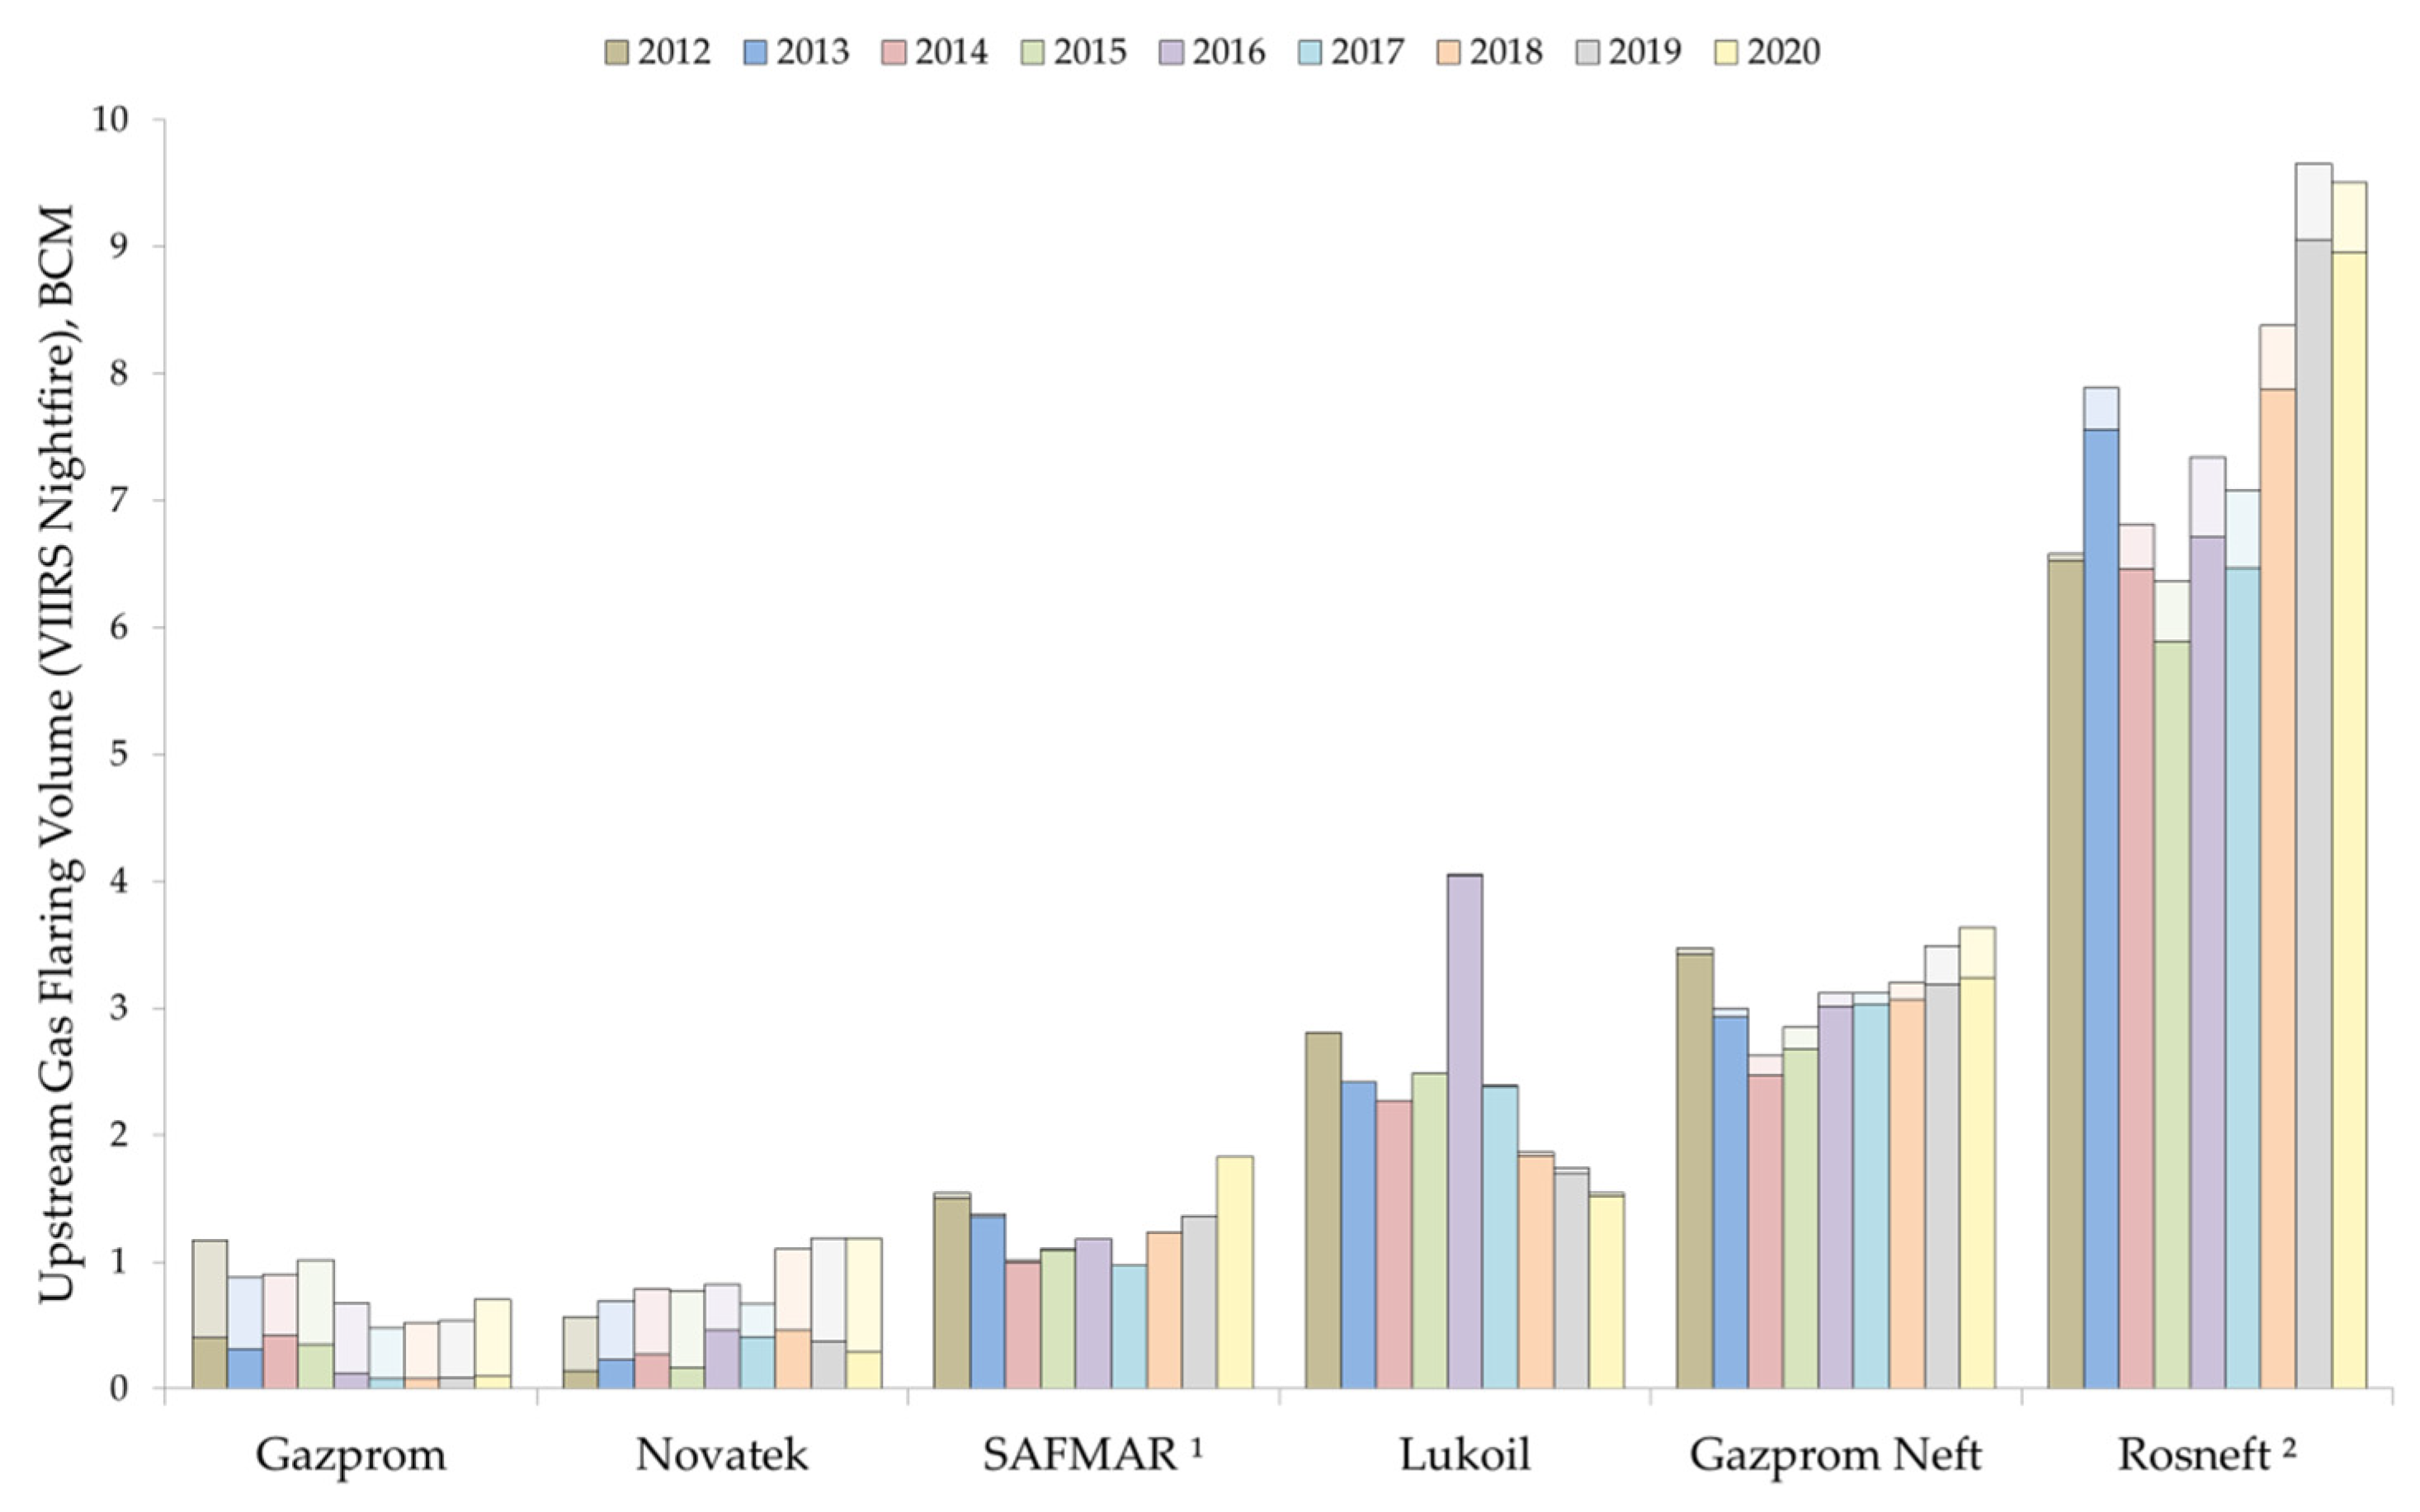
While the counting of operating parent companies is complicated due to transfers and joint ventures, 291 subsidiaries have been estimated to operate gas flaring in Russia in this study.
The histogram in Figure 6 presents gas flaring volumes among major producers in Russia, with the highest flaring rates (shares in joint ventures and company ownership transfers are accounted for as presented in list 2 (‘List of Joint Ventures’) of the gas flaring catalog MS Excel table available in the Supplementary Materials section). Table S3 in the Supplementary Materials text section specifies mean reported and Nightfire-estimated gas flaring volumes, as well as reported oil and APG production for the major oil companies at the national level in the 2018–2020 period.
Rosneft, the largest oil producer in Russia, is also the major flaring company averaging at c. 38% on national level in both APG production and flaring volumes (Nightfire est.). During the observation period, Rosneft acquired several major assets such as TNK-BP in 2013 (annual oil production c. 72 mln tons) and Bashneft in 2016 (annual oil production c. 20 mln tons), while rearranging its share in several joint ventures. The largest flaring assets of Rosneft, including joint ventures, correspond to remote gas flaring facilities, as well as several major oil fields in Khanty-Mansi Okrug. Rosneft also reported a significant drop in overall APG utilization rates (from 89% in 2017 to 78% in 2019) due to flaring at greenfields [47]. Gazprom Neft, comprising approximately 14% of the national gas flaring volume, follows the pattern of Rosneft, with major flaring occurring at remote fields. Both companies do not have a clear trend of declining flaring volumes, as their total flaring rates are significantly influenced by the commissioning of new greenfields offset by an increase in APG utilization at greenfields commissioned several years ago.
The second largest oil producer in Russia, Lukoil, has a limited presence in remote regions; instead, most flaring occurs in developed regions, such as Khanty-Mansi AO or the Komi Republic. A trend of declining flaring volumes is observed for the company, although it was disrupted in 2016, as discussed in Section 4.1.
Among the major oil and gas companies in Russia, the third and fifth largest oil producers, Surgutneftegas and Tatneft, according to the Nightfire estimates, have reached the goal of 95% APG utilization. Both companies primarily operate in developed oil regions with sufficient APG utilization infrastructure and have been reporting their APG utilization rates reaching 95% since 2008 [48].
For the major natural gas producers (Gazprom and Novatek), relatively high flaring volumes are observed at major natural gas and gas condensate fields of Yamal-Nenets Okrug; significant flaring is also observed at Rosneft gas condensate fields operated by its subsidiary Rospan International. Natural gas and gas condensate require primary processing prior to transportation, which may result in flaring in remote regions where no options to market the residuals of the processing are available. A significant portion is also related to oil fields operated by these companies.
Among the independent oil producers, high flaring volumes (exceeding 1 BCM since 2016 for each) are observed for companies operating in Irkutsk Oblast, Irkutsk Oil Company and Dulisma.
3.3. Comparison with the Reported Gas Flaring and Oil Extraction Data
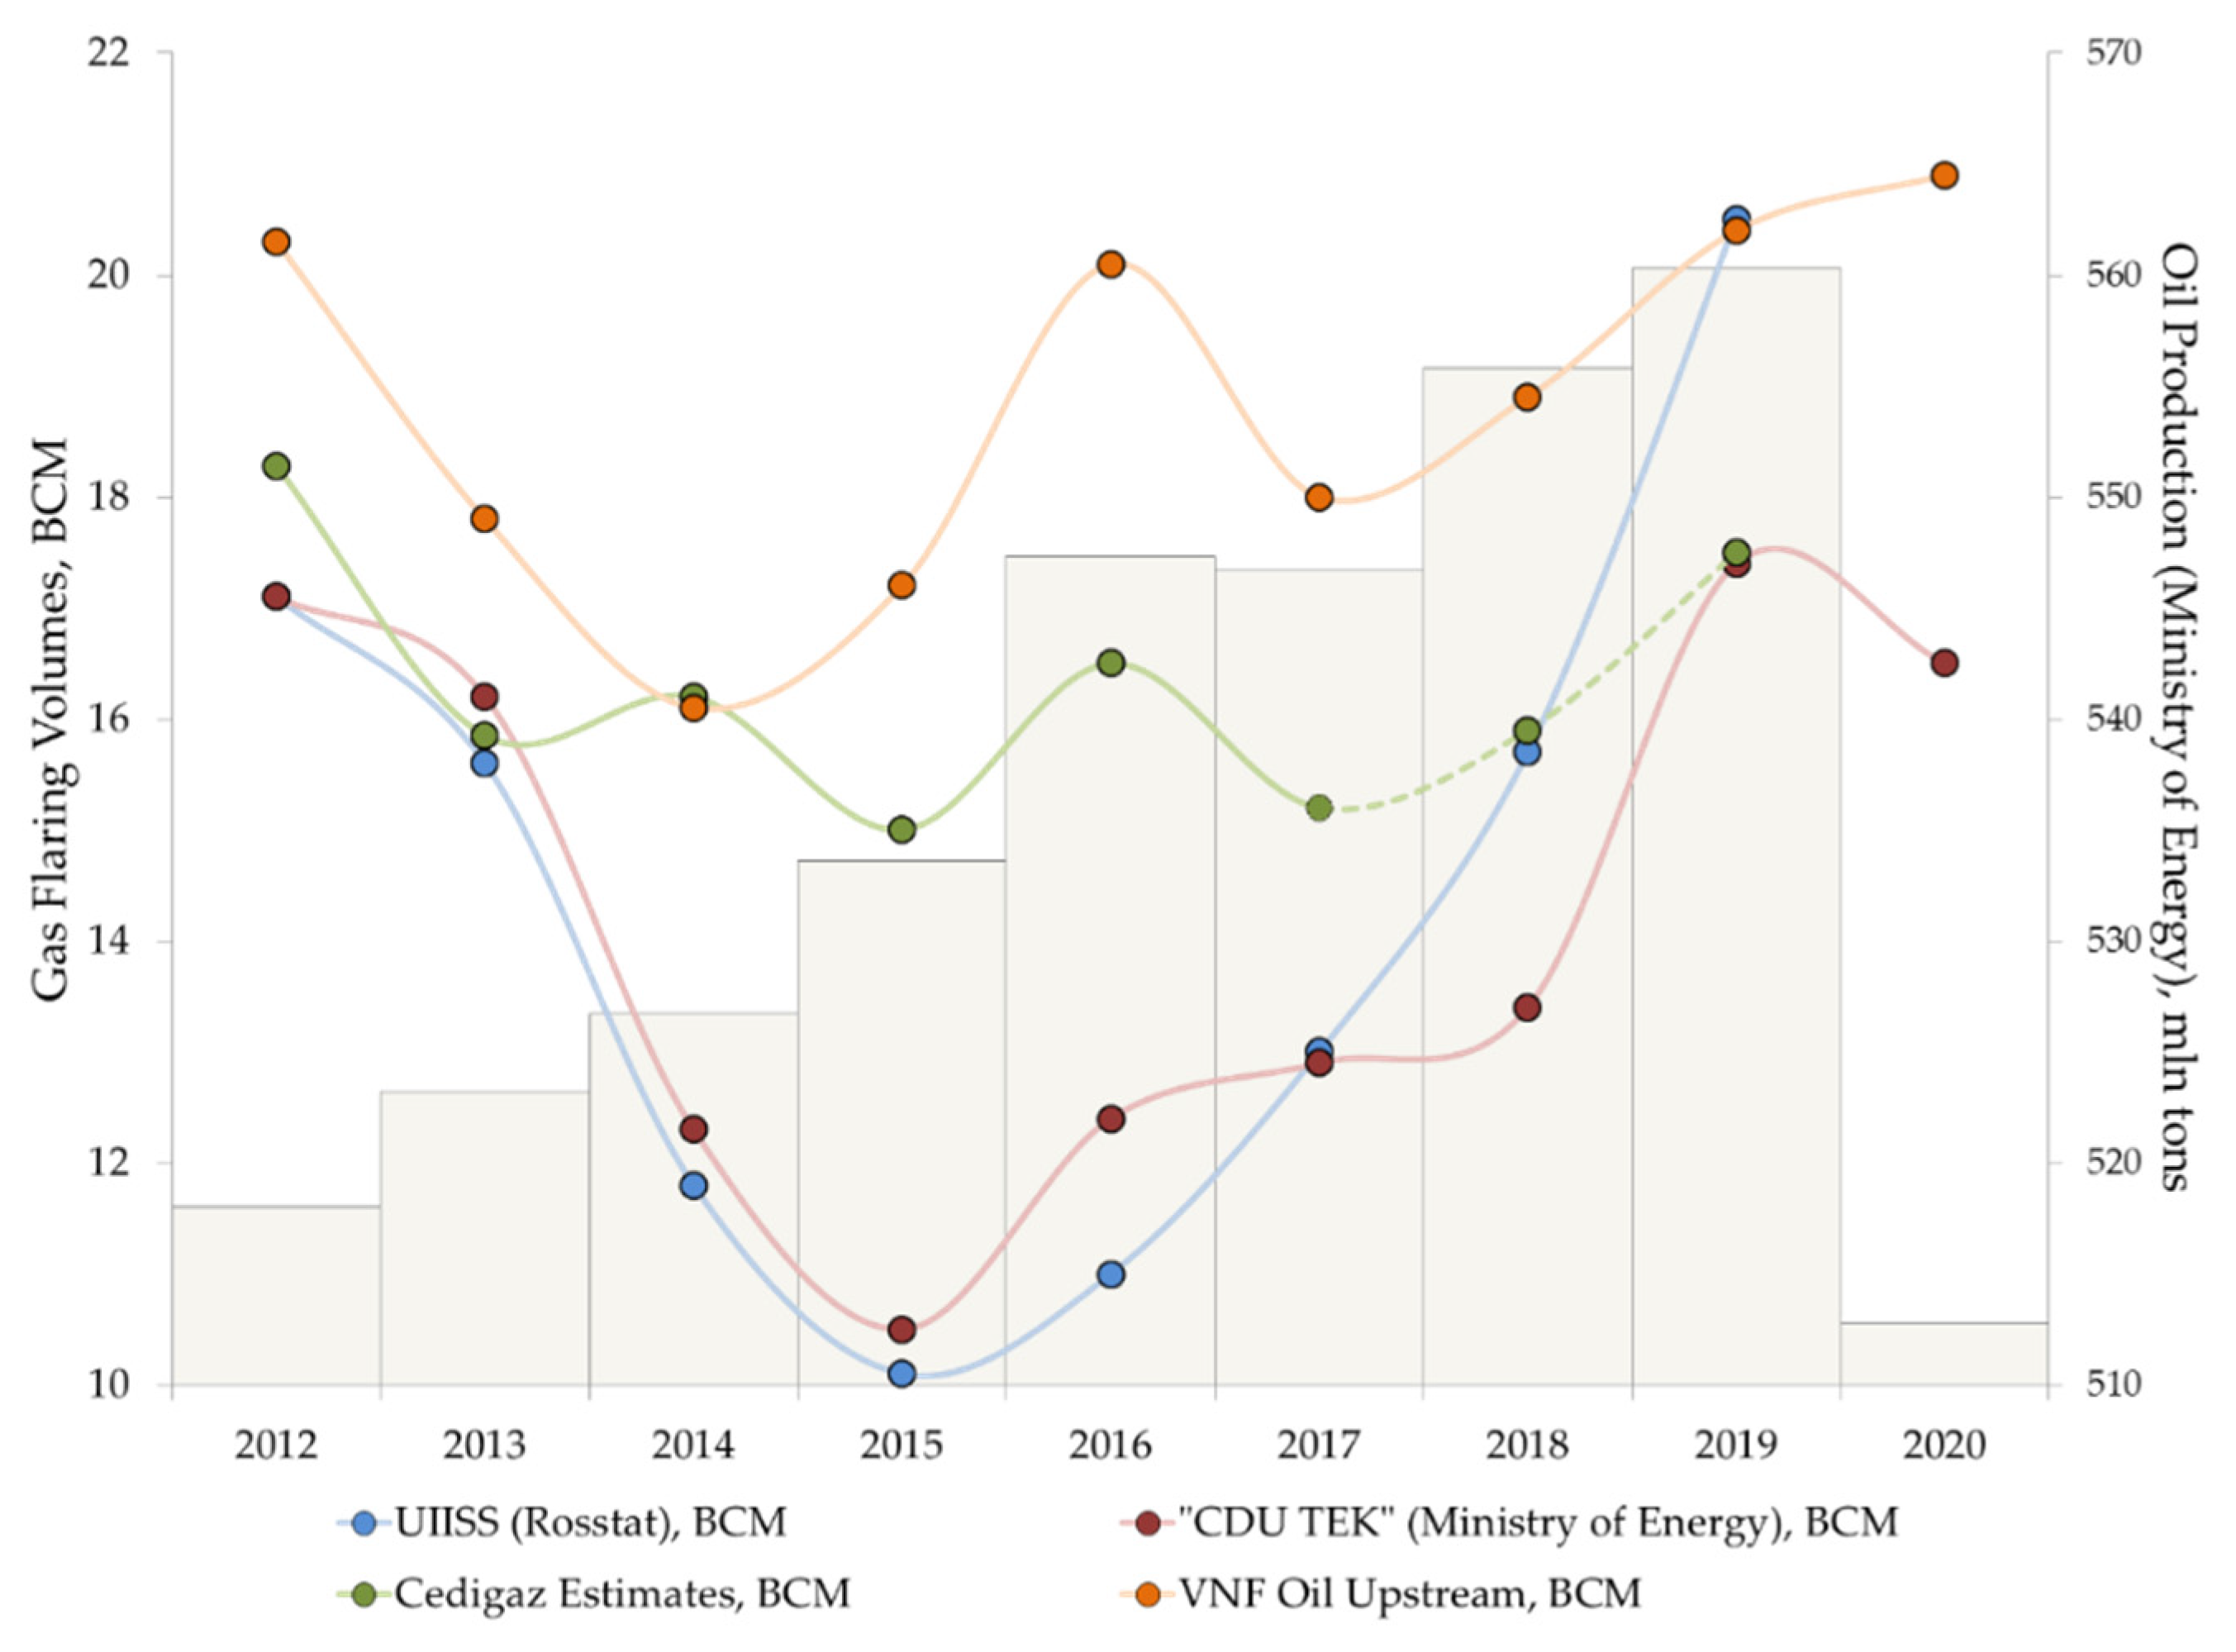
Annual gas flaring volumes in the oil upstream sector of Russia (i.e., APG flaring) according to the reported data, expert estimates, and VIIRS Nightfire computations are presented in Figure 7 and Table 1. It is observed that while all sources relatively agreed in the 2012–2013 period (with Nightfire estimates exceeding other sources data only by 15%), in the 2014–2016 period, the difference between Nightfire and the reported data progressively increased to 75%. The rising trend of gas flaring volumes in Russia since 2017 is depicted in all sources, although its magnitude varies significantly, with Rosstat data exceeding Nightfire estimates in 2019, while the Cedigaz and Ministry of Energy data value the country annual flaring volumes as being 3 BCM lower. In 2020, the Ministry of Energy reported a decline in APG flaring, while Nightfire estimates indicate an increase of 0.5 BCM in oil upstream flaring. In the same year, although national oil production level dropped by 8.4%, the Ministry of Energy reported a mild (+0.1%) increase in APG production. The general acceptance of VIIRS Nightfire and Cedigaz trends for Russia, excluding 2014, is also notable.

Table 1.
Annual APG flaring volumes and oil production levels in Russia.
| Source | 2012 | 2013 | 2014 | 2015 | 2016 | 2017 | 2018 | 2019 | 2020 |
|---|---|---|---|---|---|---|---|---|---|
| Flaring (Ministry of Energy), BCM [1,2,30] | 17.1 | 16.2 | 12.3 | 10.5 | 12.4 | 12.9 | 13.4 | 17.4 | 16.5 |
| Flaring, Rosstat, BCM [3] | 17.1 | 15.6 | 11.8 | 9.9 | 11 | 13 | 15.7 | 20.5 | N/A |
| Flaring, Cedigaz, BCM [4] | 18.3 | 15.9 | 16.2 | 15 | 16.5 | 15.2 | 15.9 | 17.5 | N/A |
| Flaring, Nightfire, BCM | 20.3 | 17.8 | 16.1 | 17.2 | 20.1 | 18 2 | 18.9 | 20.4 | 20.9 |
| Oil Production (Ministry of Energy), mln tons 1 [49] | 518 | 523 | 527 | 534 | 547 | 547 | 556 | 560 | 513 |
1 Including gas condensate production. 2 For reference, SLSTR Nightfire product estimate for Russia, 2017 is 18.1 BCM [13].
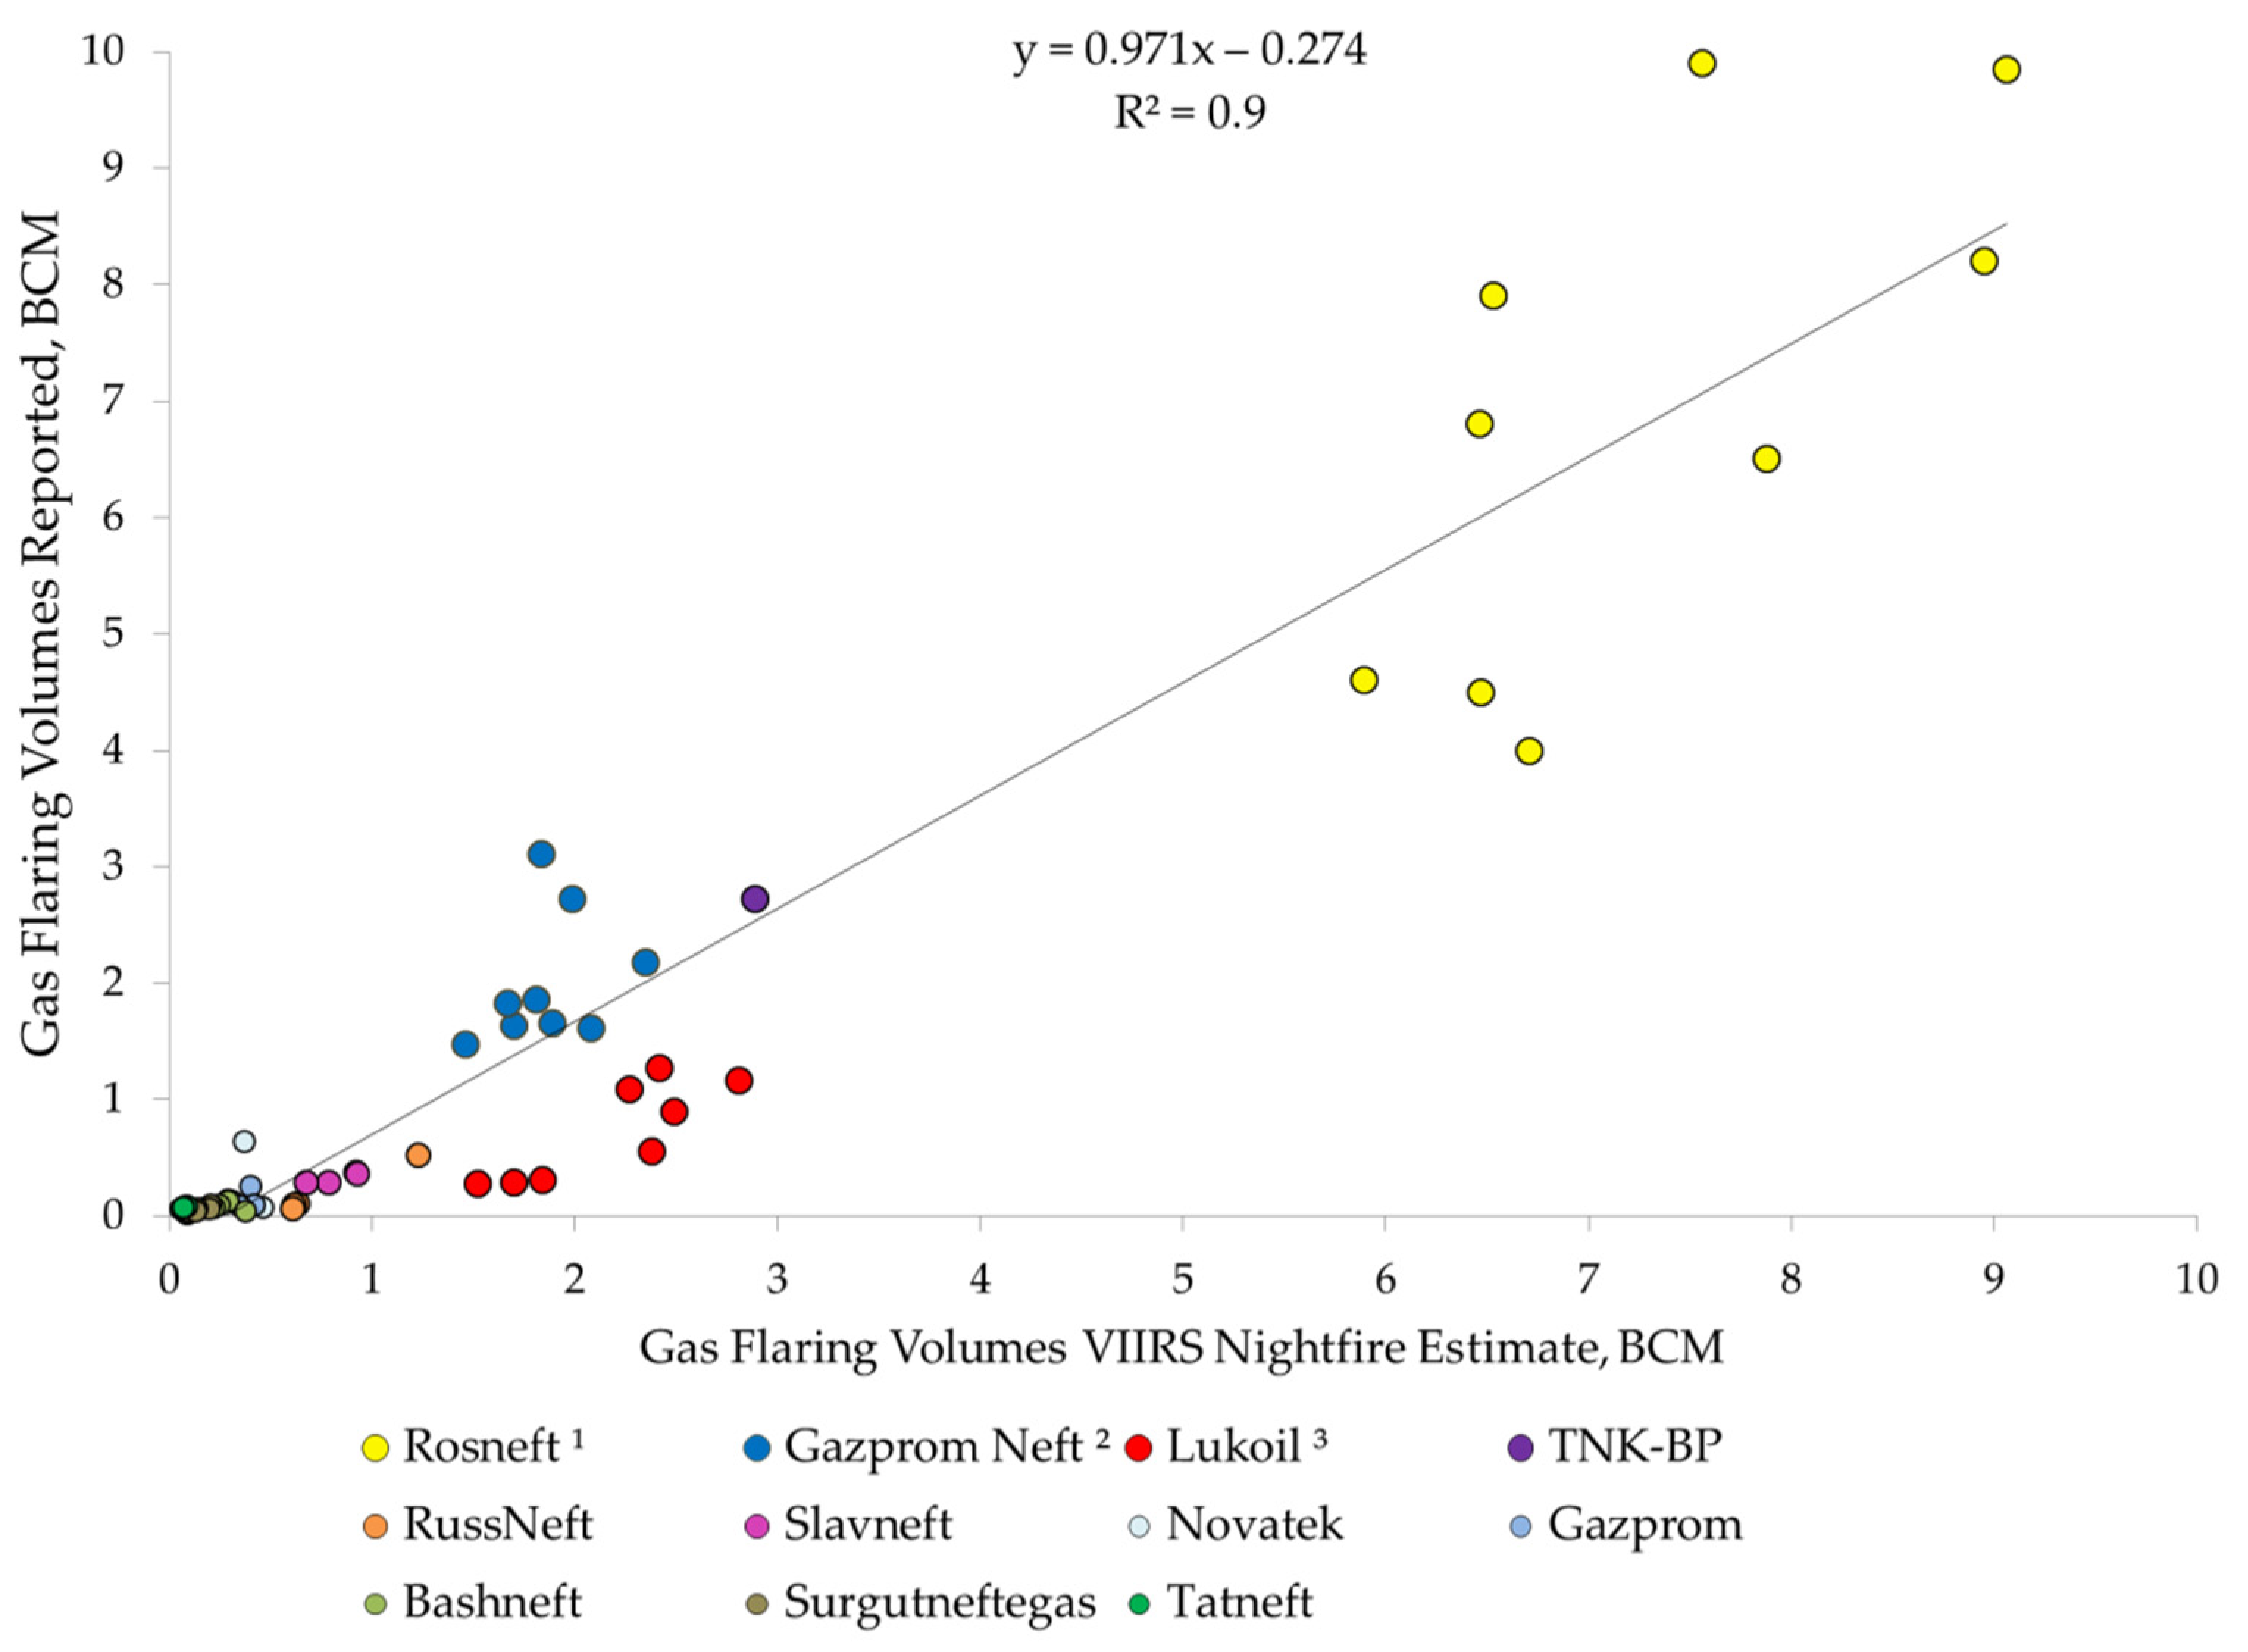
The correlation with publicly available gas flaring volume data reported by major oil and gas companies (in annual reports or reports on sustainable development) with respect to joint ventures in Russia is presented in Figure 8. Although the resulting correlation is strong and is in good agreement with the Cedigaz-based correlation coefficient used in radiant heat RH’ to BCM conversion (see Section 2.5) as regression slope is close to 1, there are evident biases observed for most companies, while major flaring companies such as Rosneft and Gazprom Neft experience significant scatter on the annual basis. It is worth noting that some of the largest gas flares observed with Nightfire in Russia are also operated by Gazprom Neft or Rosneft, and these companies tend to have their reported flaring higher than what the VIIRS Nightfire estimates suggest, while other companies and regions, such as Slavneft or Lukoil or Khanty-Mansi Autonomous Okrug data (which have their respective flaring volumes distributed among lesser flares), conversely, have their reported flaring volumes significantly lower than what the Nightfire estimates suggest. Khanty-Mansi Autonomous Okrug data are presented in Figure S4 and Table S4 in the Supplementary Materials text section.
4. Discussion
4.1. Accidental Flaring
Examining the discrepancy between Nightfire estimates and the reported data for the Khanty-Mansi Autonomous Okrug region in 2016 (see Figure S4 in the Supplementary Materials text section), we found a significant (c. 50%) increase in Lukoil regional subsidiary gas flaring volumes, with no increase of such scale observed for any other company in the region. According to the company’s annual report, no significant change in the production rates occurred this year [50]. However, according to the same report and major Russian news outlet [51], an emergency event (fire) took place at the major gas processing plant (GPP) of the company in the region in June 2016, resulting in complete facility shutdown for six months. According to the report, annual gas processing levels at the plant dropped from 1.94 to 0.95 BCM. This in turn should have resulted in an increase in on-site flaring at the dependent oil fields, as it is unlikely that the company could have brokered a temporary deal with the other refineries in the region.
While the incident is admitted to be the reason for decreased APG processing in the annual report, reported flaring volumes appear to be identical in 2015 and 2016 on the company scale [52] (p. 35), at approximately 0.95 BCM (i.e., as high as temporary shutdown processing capacities for that year). It is also plausible that flared volumes were not considered as over-limit, as according to the state regulations, the flaring could be accounted for as occurring during maintenance procedures (see Section 1.1).
Compared with the reported data (loss in APG processing volumes), the Nightfire-estimated spike in flaring volumes is slightly higher, at 1.2 BCM. On top of that, it is possible that some portion of excess APG could have been utilized locally on the on-site utilizing infrastructure if the latter was not used at its maximum or sent to the major company refineries in the European part of Russia, as, while examining the dashboards of the related oil fields, it has been observed that some had their flaring normalized before the re-commissioning of the GPP. Considering the observation described in Section 4.2, it is possible that Nightfire may tend to overestimate moderate-sized but persistent flares in Russia, which are common for Lukoil; this can also be one of the reasons for the significant discrepancy with Lukoil’s reported flaring data observed in Figure 8.
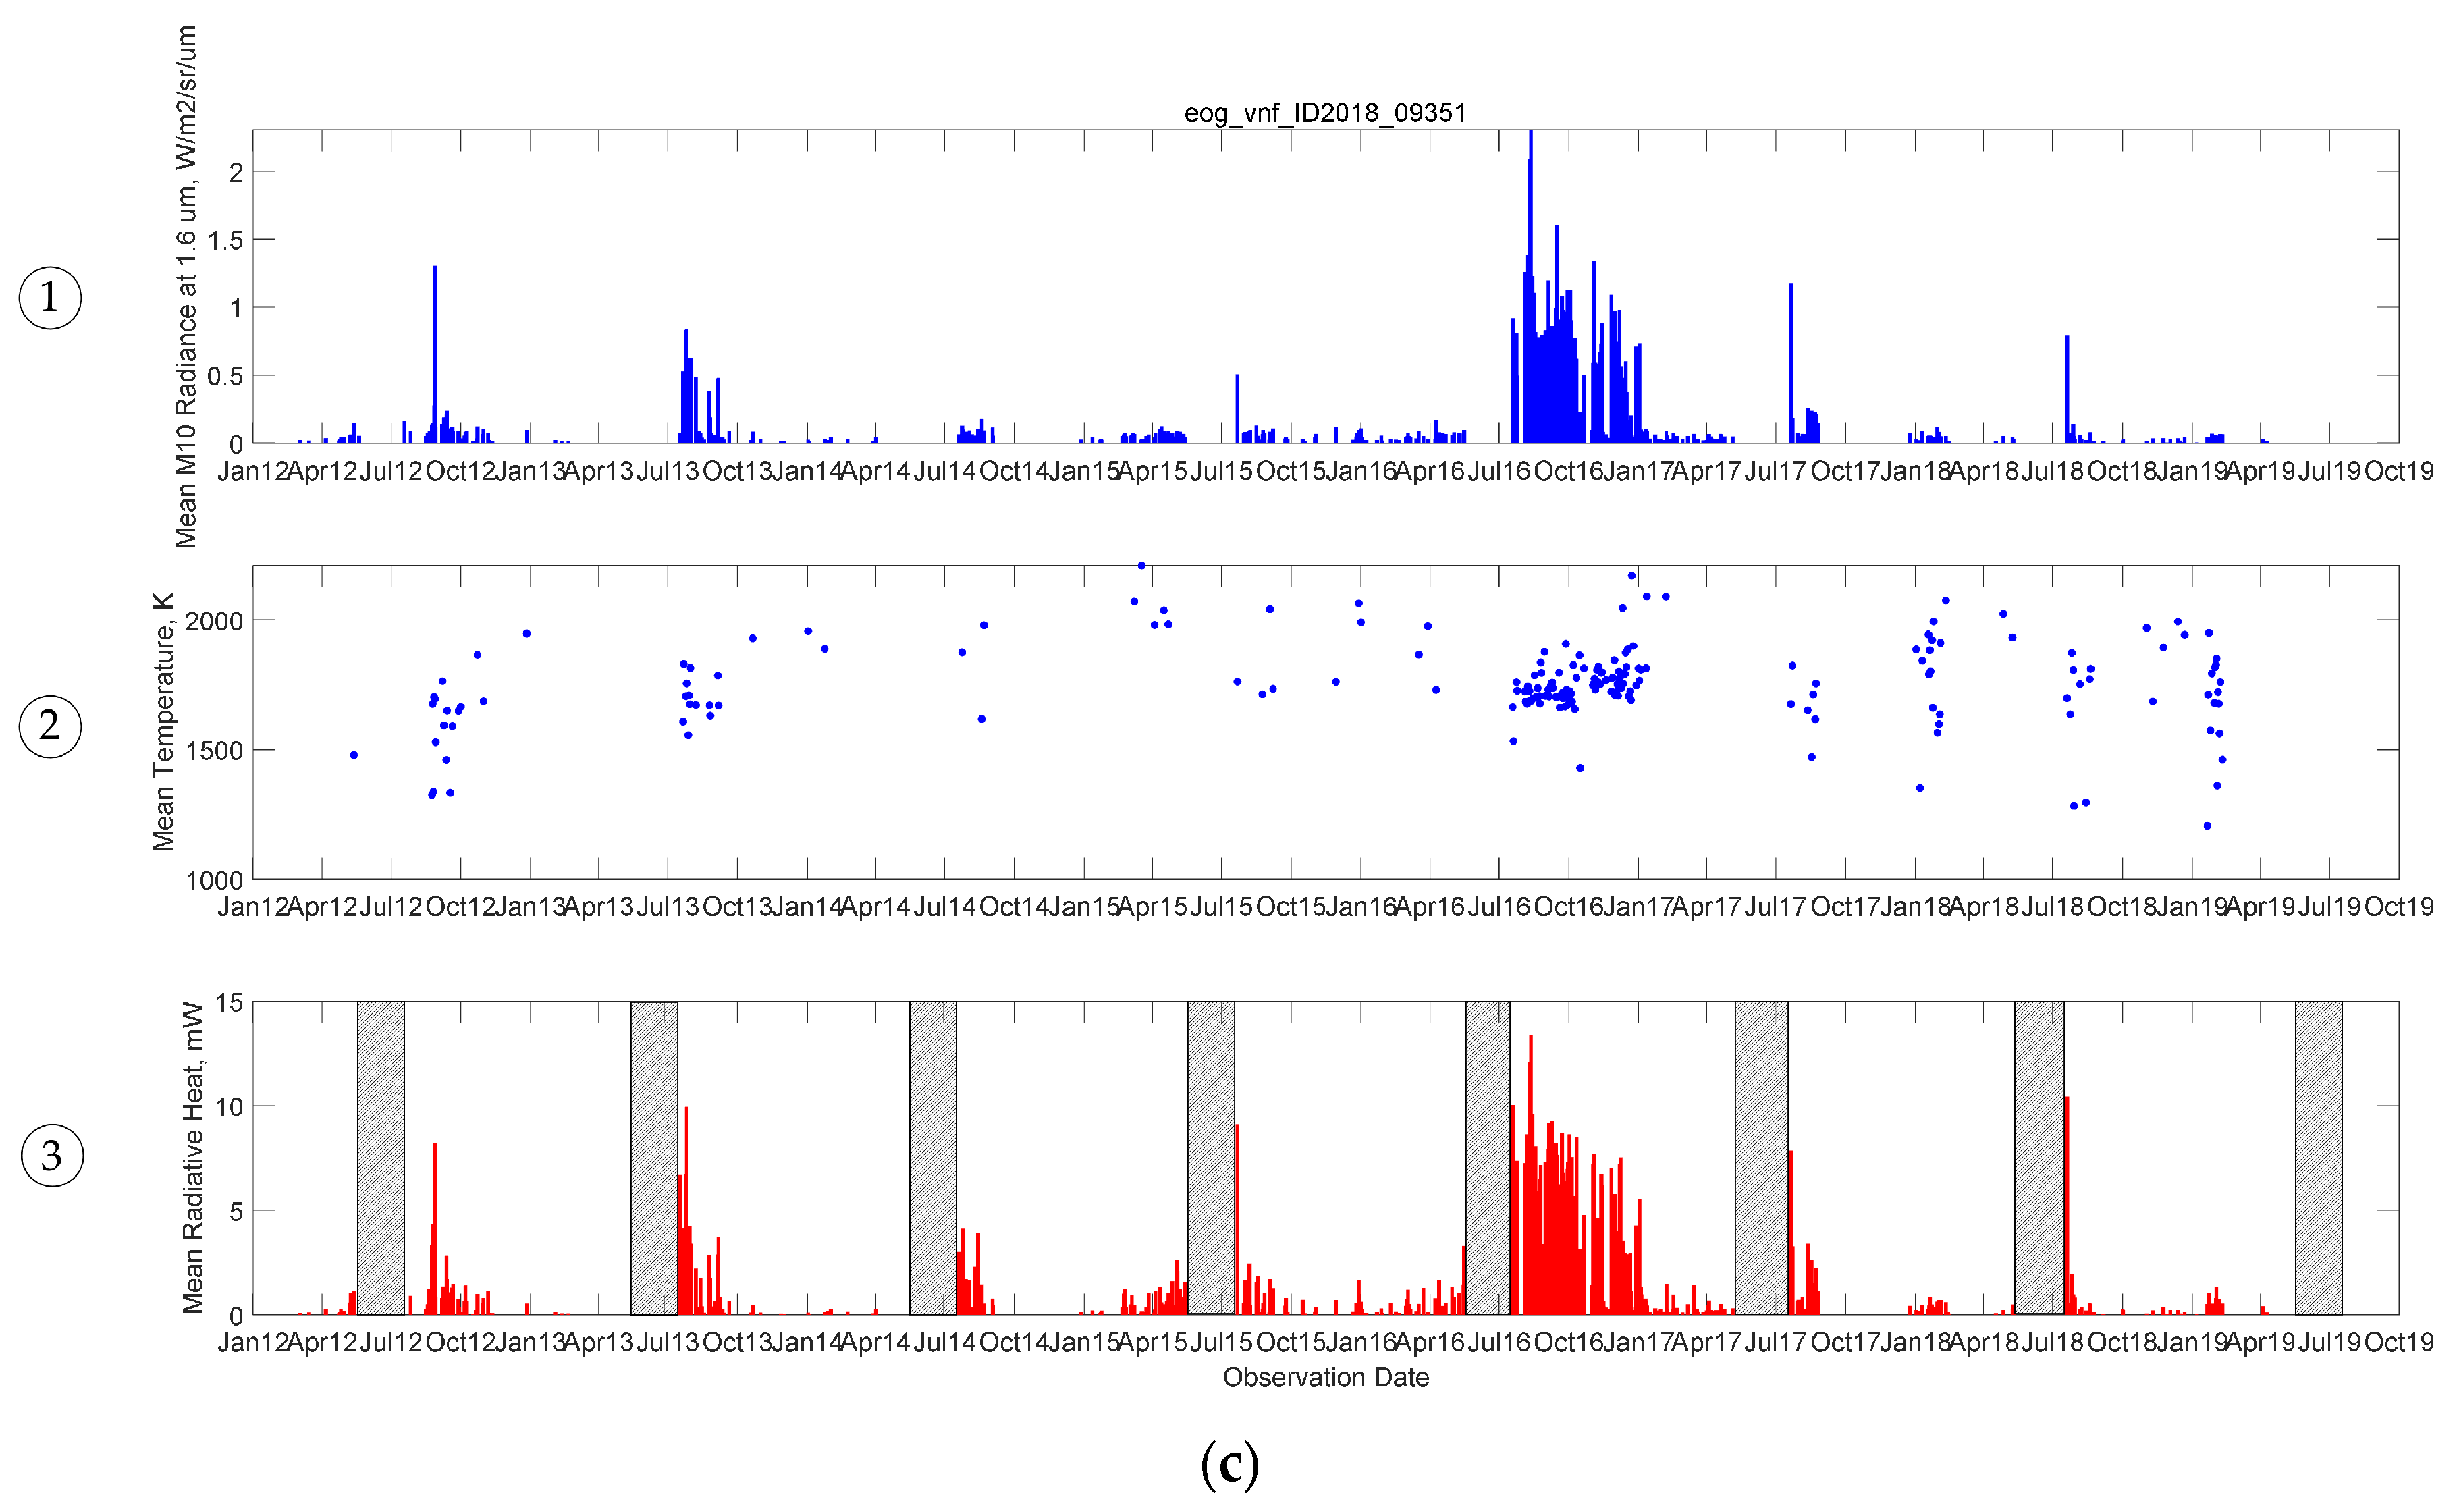
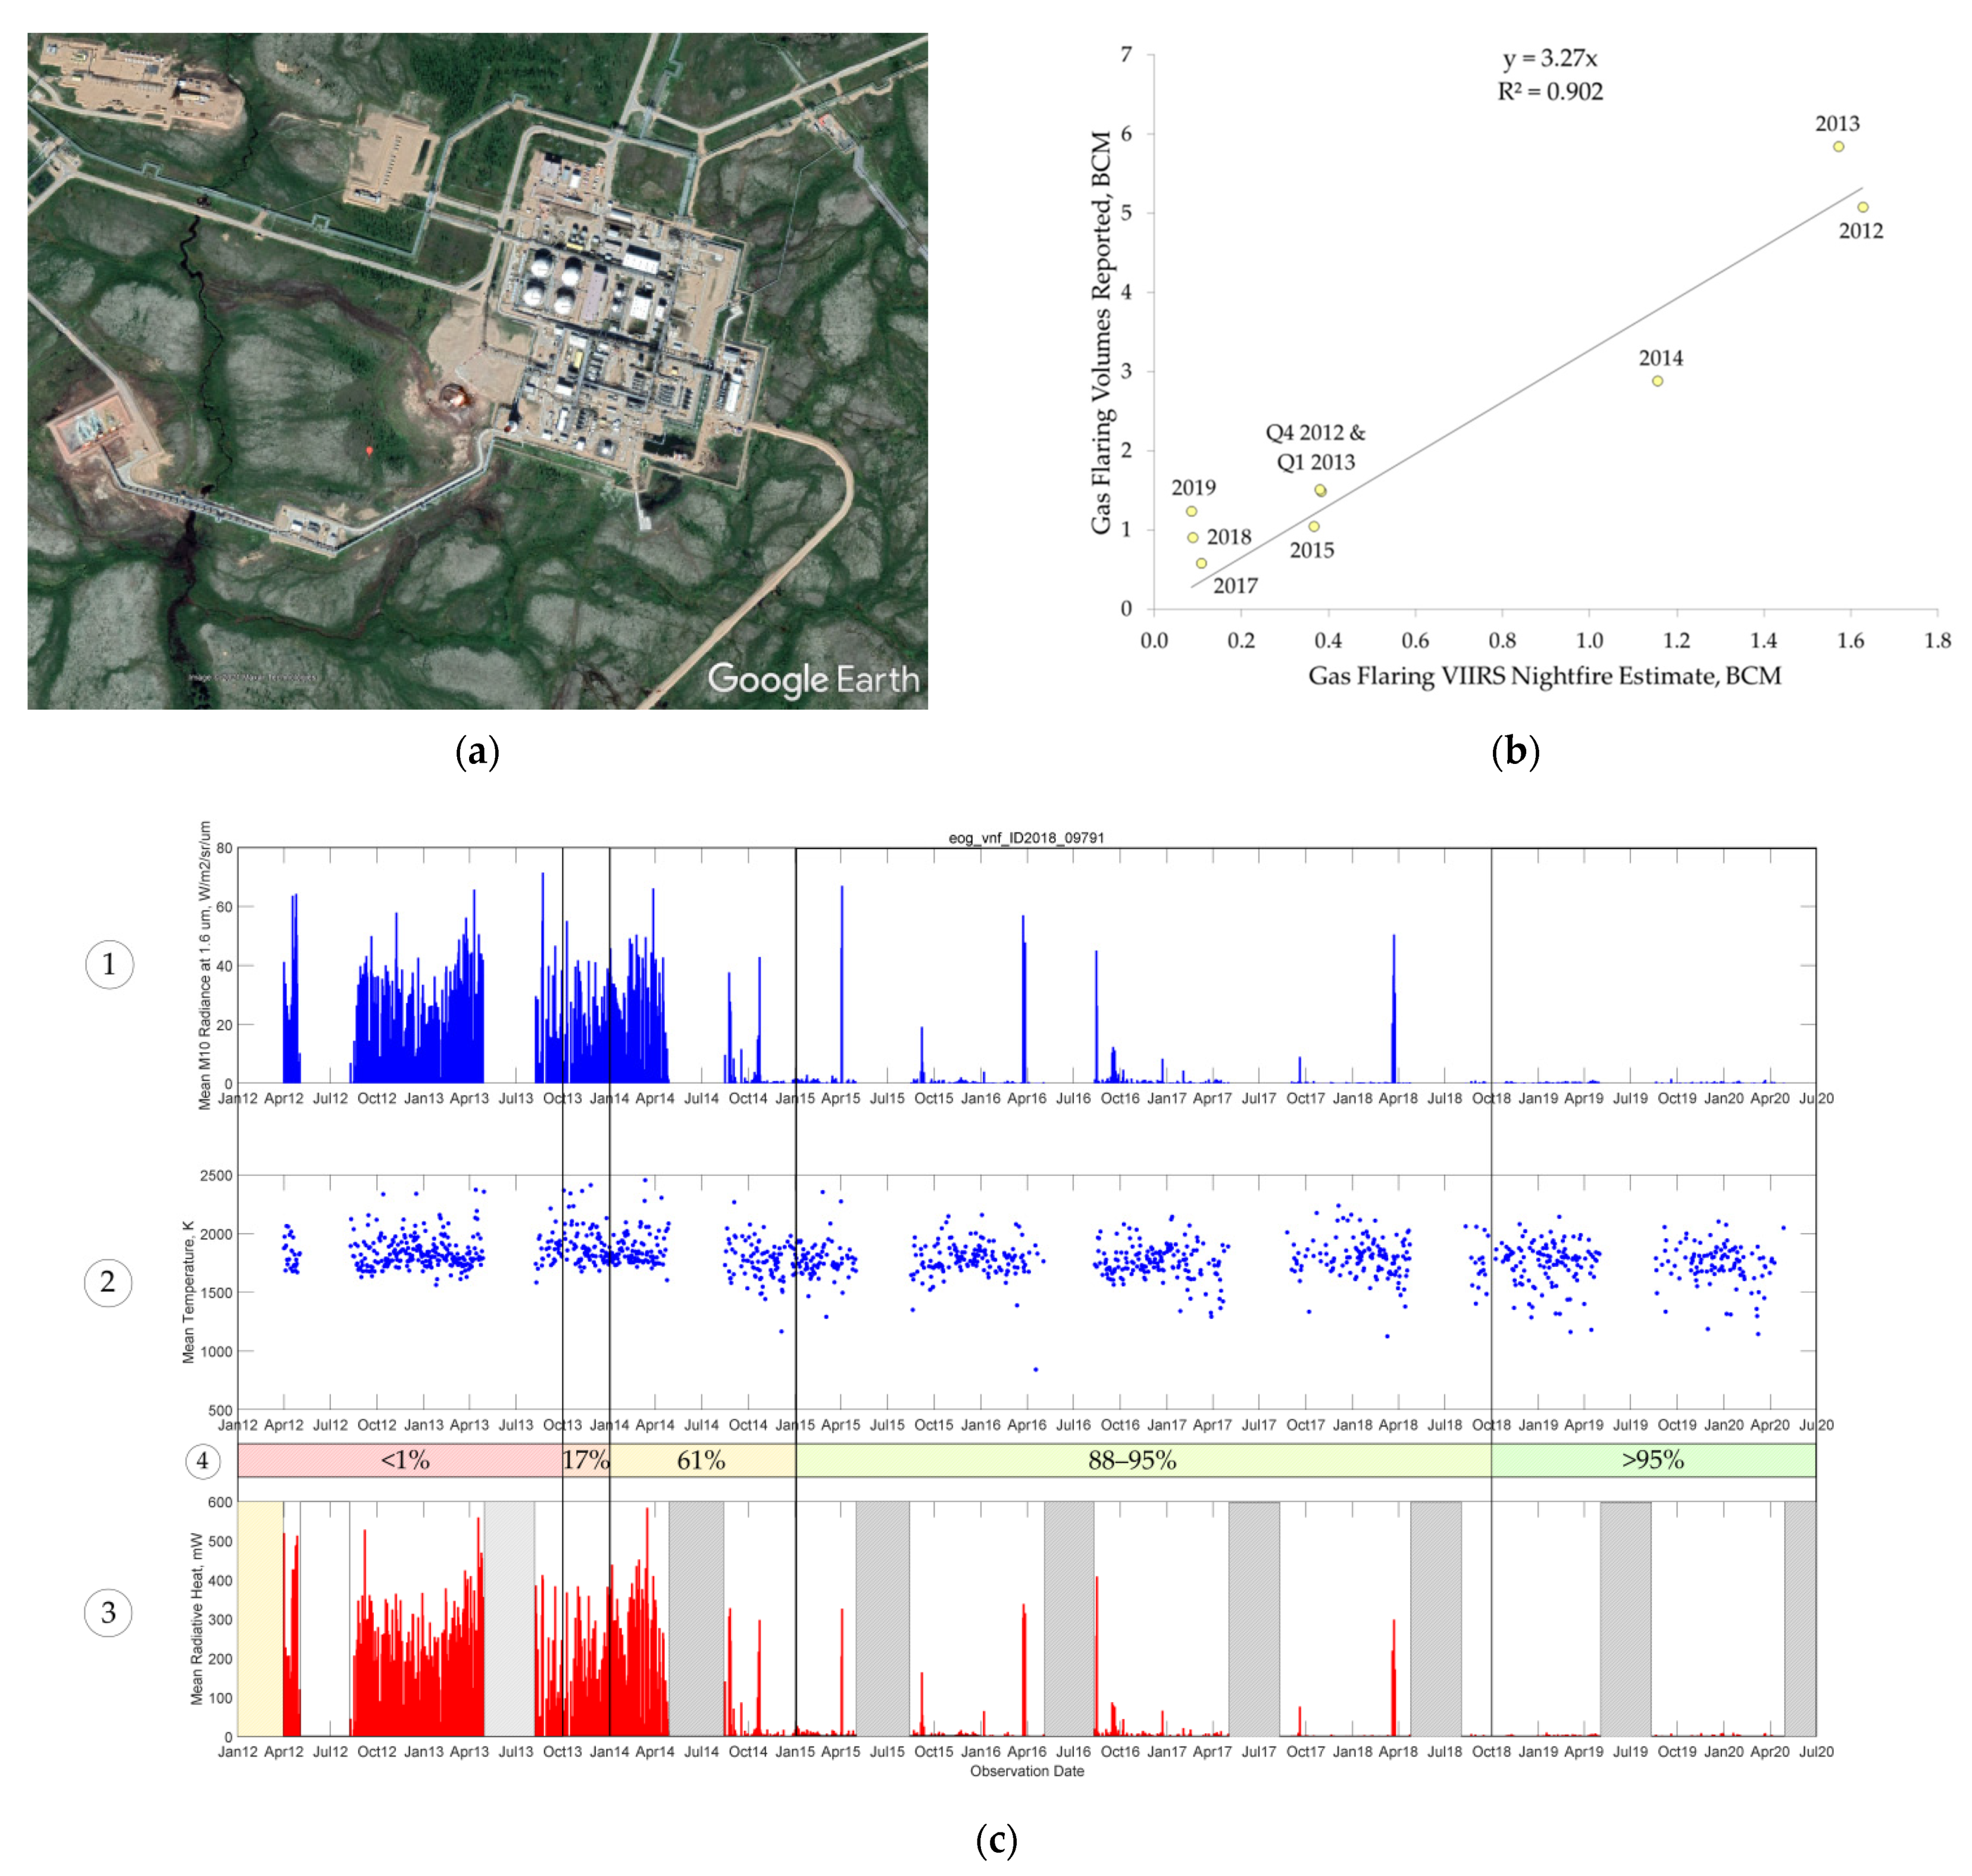
Figure 9c presents a dashboard for one of the company’s oil fields in the region (62.35°N 75.84°E), which is reported to be connected with the GPP [51]. On the dashboard, one can observe a significant increase in flaring activity in the second half of 2016, gaps in summer-time observations (shaded area in ③), and the sporadic nature of annual flaring, characterized by surges in ① and ③ occurring in July (which probably occur during maintenance at the GPP); the lack of Nightfire observations in summer-time for this particular flare could have led to underestimated flaring volumes.
4.2. Effect of Gas Processing
Vankor oilfield, located at 67°48′N 83°32′E in Krasnoyarskiy Krai and commissioned in 2009, has been one of the largest oil producing fields in Russia in recent years. In 2013, its annual oil production volumes reached 21.4 million metric tons [53], which is comparable to the Samotlor oil field (22 million tons) [31], the second largest oil producing field in Russia at the time. In 2018, Vankor remained the third largest oil producing field in Russia (16 mln tons per year) [45]. Yet, prior to October, 2013, the APG utilization rate at the field, according to “CDU TEK”, remained lower than 1% [54]. In 2013, the total gas extraction volumes of the Vankor field were reported to be 6.55 BCM [55], with only 0.62 BCM classified as natural gas [53]; i.e., APG production volume was approximately 6 BCM, which, due to low utilization, was mostly routed to be flared at the gas flaring facilities of the field. In late 2013, commissioning of the APG reinjection system resulted in a 17% APG utilization rate by December [53]. In April 2014, the field was connected with the Gazprom gas pipeline system, which resulted in a 61% annual APG utilization rate in 2014 and 88% utilization in 2015 [56]. The required 95% APG utilization rate at the field was reached in 2018, as 98% of extracted APG is reported to be utilized [57].
The dip in gas flaring since April–May of 2014 is evident from the Nightfire data as well, as can be observed in Figure 10c (note the gaps in observation caused by the midnight sun period of the subpolar regions). It presents a flaring dashboard for one of the two major gas flaring facilities at the Vankor field (ID 20212_20585 from the gas flaring catalog), which was estimated to be the largest flare in the world in 2012 according to Nightfire. If, prior to 2014, Vankor gas flaring facilities were detectable during any valid night-time VIIRS observation, ever since 2014, the detection frequency has dropped below 100%, and the average daily estimated flaring volumes have dropped by an order of magnitude. Persistent surges in flaring in April and May in the following years can be attributed to maintenance procedures.
Figure 10b presents the correlation of Nightfire-estimated flaring volumes from all detected gas flaring facilities at the Vankor field (major flaring facilities are oil treatment unit ID 2012_20585 (67°48′N 83°33′E) and oil dehydration and desalting unit ID 2012_20589 (67°43′N 83°30′E) from the gas flaring catalog) and reported data compiled from Rosneft annual reports (which present annual APG production levels and utilization rates for Vankor and surrounding oil fields, with the latter being commissioned since 2016, introducing the noise in the data), as well as the RUPEC report which presents “CDU TEK” reported quarterly gas flaring volumes in 2012 and 2013 [58]. It is evident that in 2012–2013, Nightfire estimates (1.5–1.6 BCM) are four to five times lower than the reported flaring volumes. However, controlled field experiments have shown good agreement between Nightfire estimates and flow meter measurements for a gas flare stack burning as high as an equivalent of approximately 0.4 BCM of natural gas per year (i.e., at least five times lower than the reported flaring at major oil treatment units of the Vankor field in 2012–2014) [25]. It is also worth noting that, due to the high APG over-limit flaring environmental fee multiplier in Russia described in Section 1.1, there is no practical reason for oil companies to overstate their flaring volumes, and Vankor oil field was commissioned in 2009 and thus have been subject to the increased environmental taxation since 2012.
The case of the Vankor field thus leads to an assumption that VIIRS Nightfire tends to significantly underestimate the largest observed gas flares. The reason for this is a matter for further research. Supposedly, it may be attributed to either the application of a logarithmic scale to the area of the observed flare (see Equation (4) in Section 2.5) in the Nightfire algorithm or to registering the local maximum spectral radiance only of the brightest SWIR channel pixel in a single observation, while in fact the largest flares may produce a considerable “halo” in surrounding VIIRS SWIR pixels or be frequently observed as split in neighboring pixels; the latter was also observed in a controlled field test environment [25]. In addition, underestimation of the largest flares may in turn lead to an overestimation of the smaller and persistent gas flares, as the Nightfire-estimated sum of RH’ is correlated linearly with Cedigaz’s estimated national-level flaring volumes for calibration, as described in Section 2.5.
As a grace period exists for newly commissioned oil fields (greenfields) in Russia (see Section 1.1), major fields in remote regions that have been coming into industrial operation in recent years, tend to follow the pattern of the Vankor oil field, with almost non-existent gas utilization in the first few years of commercial operation followed by the completion of the gas processing infrastructure by the end of the grace period, meeting 95% APG utilization requirements and showing moderate flaring levels afterwards. For reference, the Nightfire annual flaring estimate for the Vankor field dropped from 1.6 BCM in 2012–2013 to 0.1 BCM in 2017–2020.
4.3. Effect of Gas Composition and Combustion Efficiency
As mentioned in Section 3.1, approximately a third of detected gas flares in Russia are located at natural gas and gas condensate upstream facilities. In the case of natural gas facilities, it can be expected that the flaring characteristics will be different, as flaring is either a product of preliminary natural gas treatment to meet the gas transportation requirements or it occurs during maintenance or commissioning procedures. Gas condensate treatment implies liquid phase stabilization, which may produce associated gas products that cannot be transported or used on site and are thus flared instead.
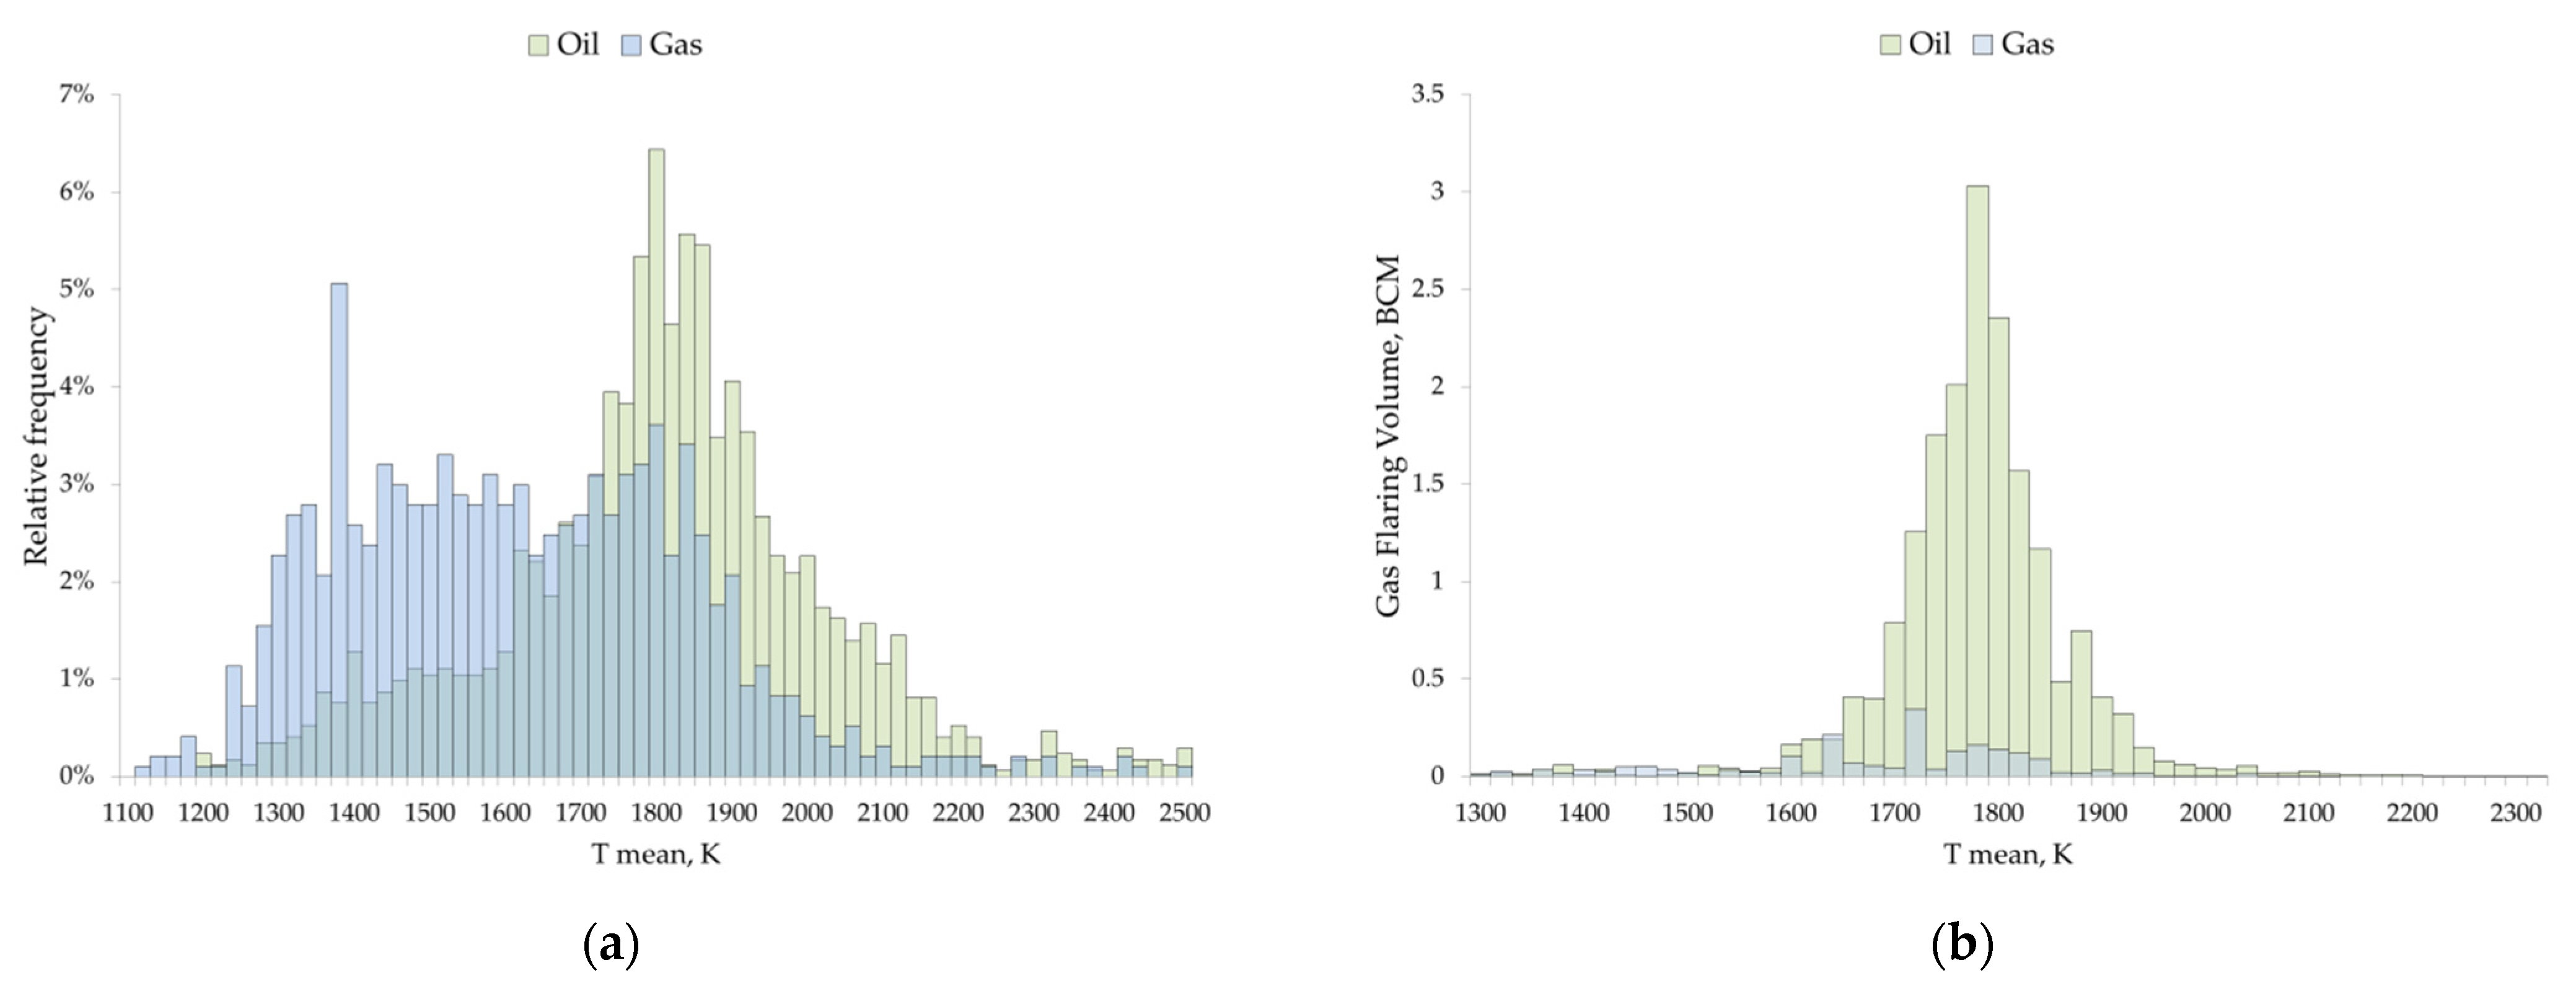
Figure 11a presents relative frequency of Nightfire estimated mean flare temperatures at oil and natural gas upstream facilities in Russia separately in 2019. It is evident that flaring at natural gas upstream facilities tends to be noticeably lower in temperature with a peak occurring at 1400 K; conversely, the peak mean temperature for the oil upstream facilities is 1800 K. This phenomenon cannot be explained by the difference in atmospheric conditions or a shift in gas composition as natural gas producing facilities are often located in the same regions as oil upstream. However, the vast majority of detected upstream natural gas flares are ground flares located at well clusters on the largest natural gas fields. Such flares are rarely detected (presumably active only during the commissioning or maintenance phase), their ground and oblique basing may result in partial loss of satellite retrievable heat or increased chance of smoking or sooting obscuring the flare, and their combustion efficiency may in general be lower. Figure 11b confirms the negligible role of infrequently detected low temperature natural gas upstream flares in terms of combined flaring volumes.
Figure S5 in the Supplementary Materials text section presents worldwide regional Nightfire temperature estimates distribution. Figure S6 is a scatterplot of Nightfire temperature estimates vs. heating value based on the reported gas composition for several oil and natural gas fields in Russia.
4.4. Seasonality in Observation and Effect of COVID-19 Pandemic on Gas Flaring
In Russia, approximately 65% of all detected gas flares are located north of 60°N latitude, while approximately 23% of them are situated to the north of the Arctic Circle (66.562°N), with major oil fields being commissioned in the higher latitudes in recent years. This fact makes the flaring situation in Russia unique, as other regions in the world with gas flaring occurring above the 60° latitude—such as the Norwegian Sea, northern parts of the Northern Sea and Alaska—are estimated to flare significantly lower volumes of gas and, excluding Alaska, are located to the south of the Arctic Circle.
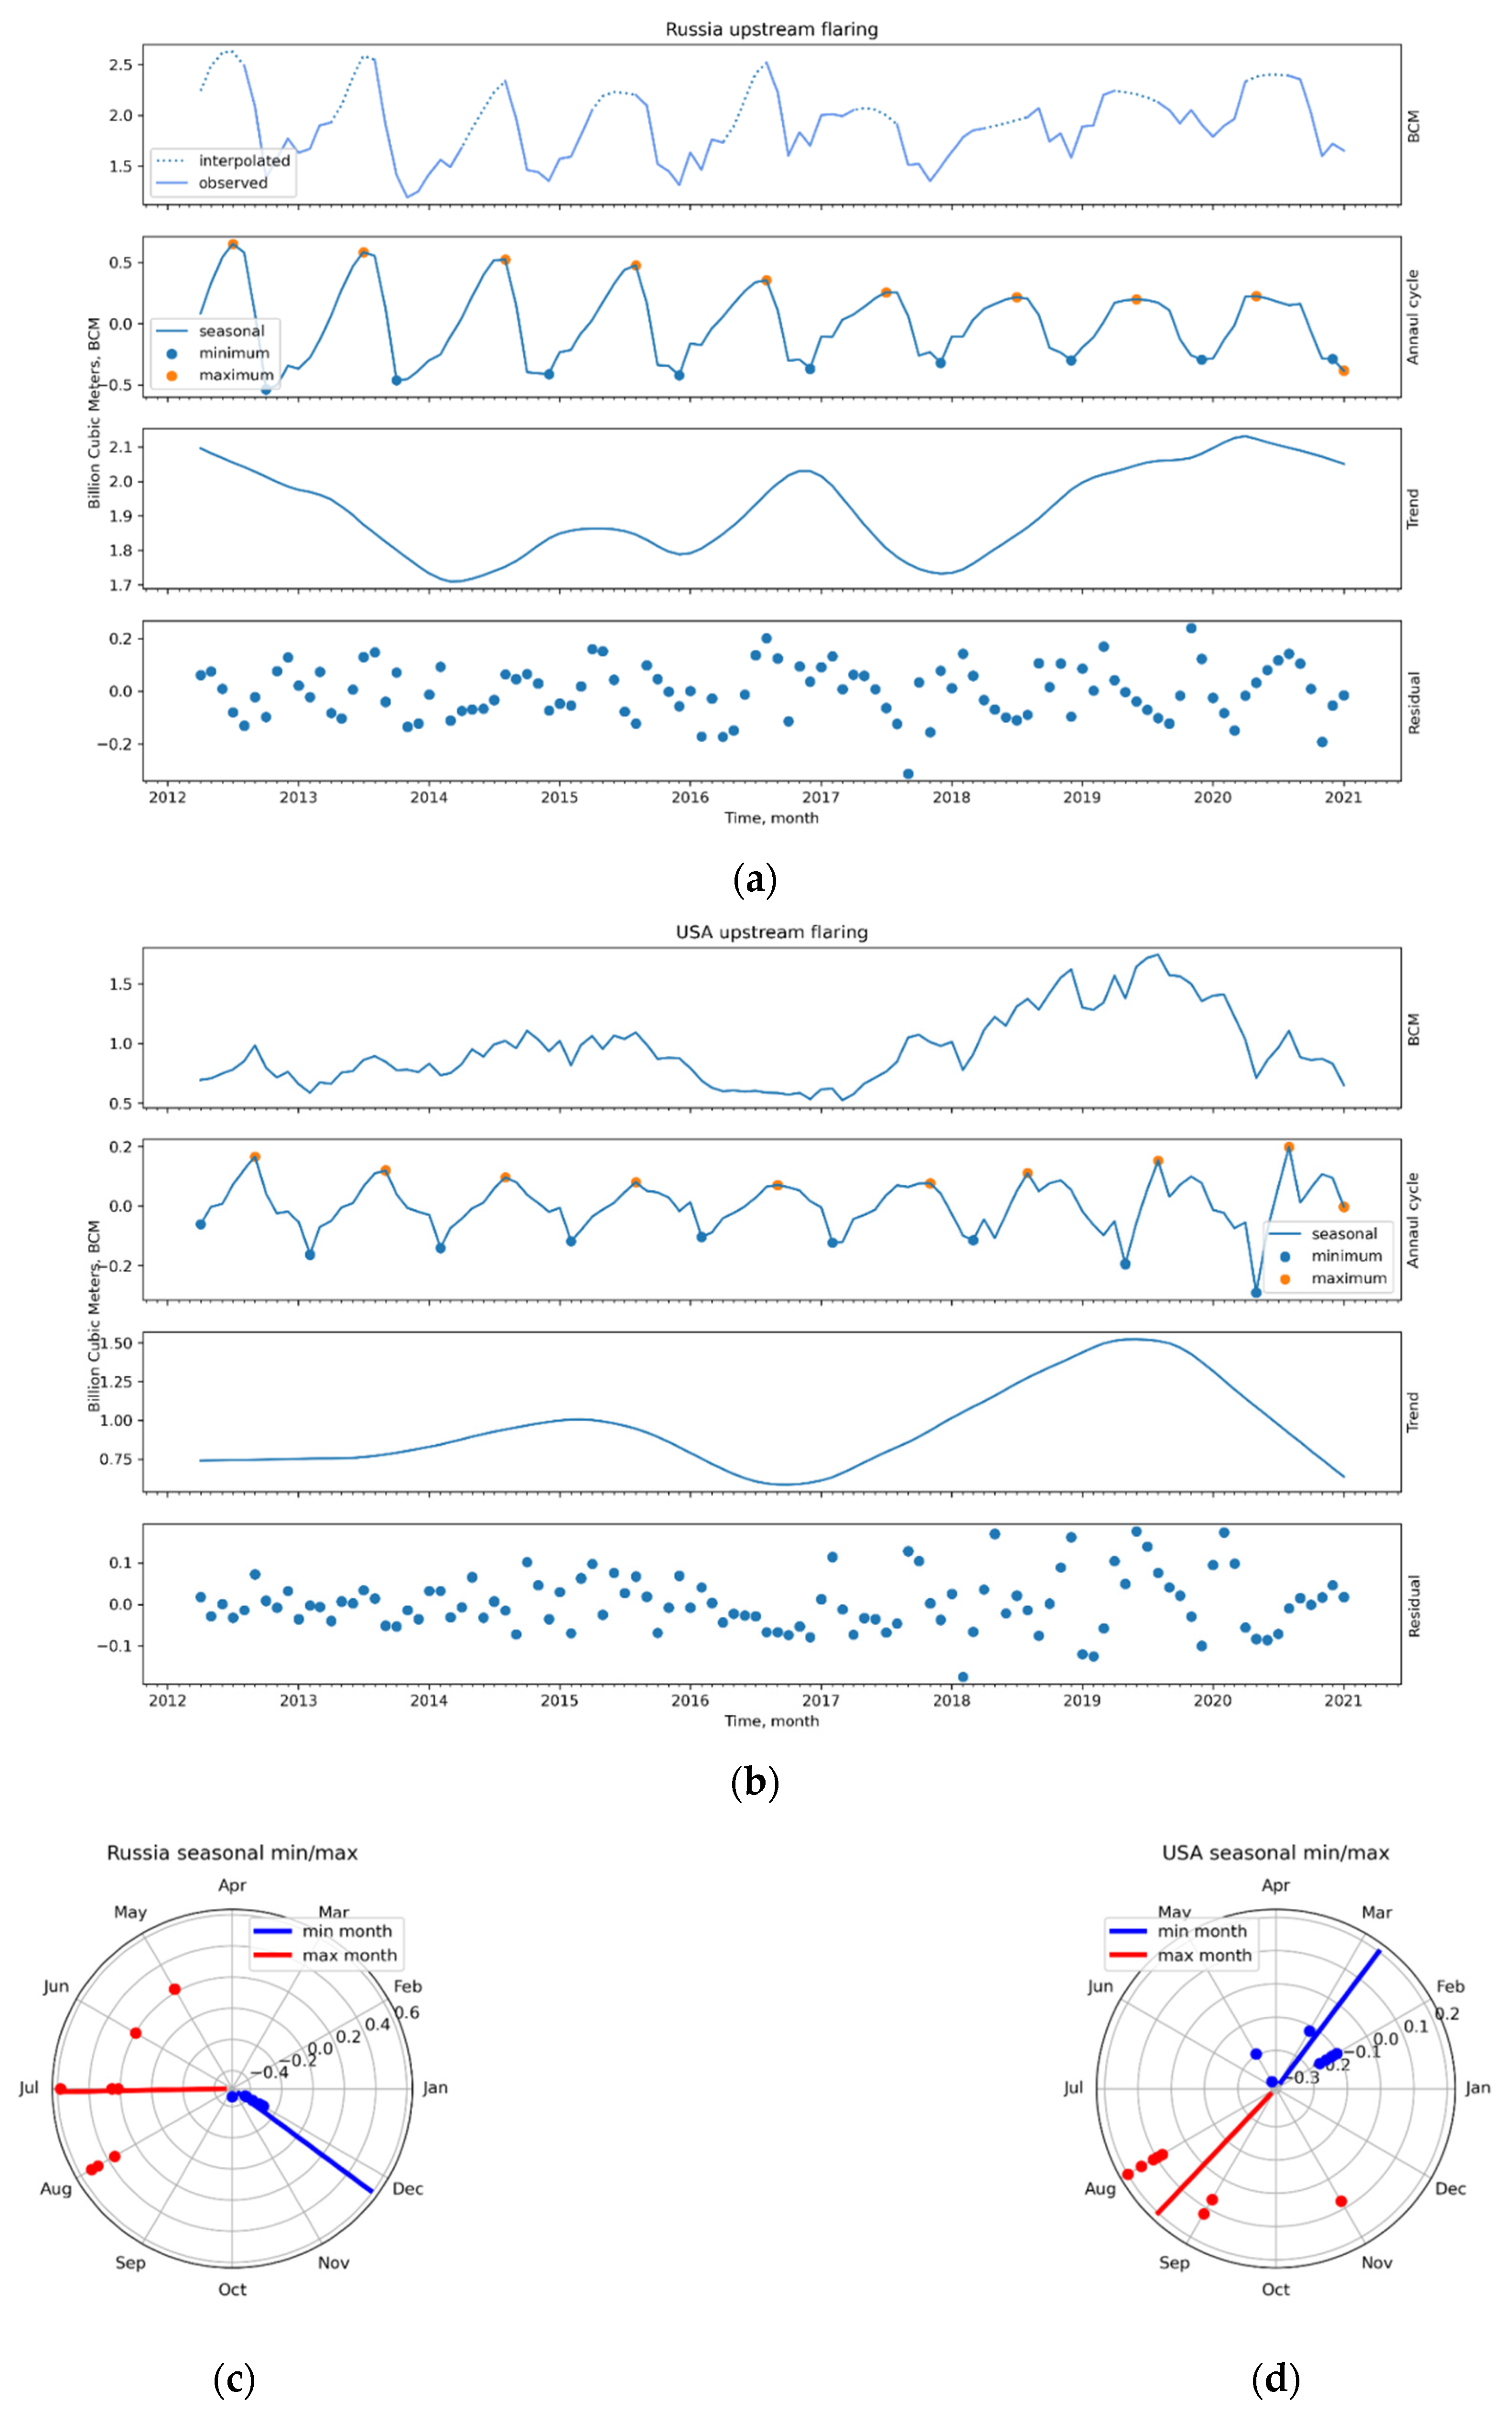
Our normalization approach to correct the annual mean RH’ for cloud-free observations is robust against the summer detection dropouts in northern Russia. However, the monthly flared gas volumes in Russia for the months May–July will be underestimated if they are based on night-time observations. For example, flares that remained detectable in June 2019 comprised 45% of the total flare count in Russia, with the northernmost detectable flares situated at 60.8°N. These flares accounted for 38% of the estimated flared BCM in January or December in 2019, i.e., the raw June BCM estimate of approximately 0.73 BCM should be recalculated to approximately 2.5 BCM based on December gas flare activity. In the seasonality analysis below, we interpolate the May–July volumes from other months using non-smoothing Akima splines [59]. Later in this section, we also discuss another possibility to fill the summer months with daytime observations using the Active Fire Product.
We decompose the monthly flaring time series into three components: trend, seasonal and residual. To extract smooth estimates of the three components, we utilize locally estimated scatterplot smoothing algorithm (LOESS) [60]. In Figure 12, we compare seasonal-trend decompositions for the national-level upstream monthly flared gas volumes for Russia and the US in 2012–2020. In Russia, we observe higher seasonal variations relative to the long-term trend. In both countries, the peak of the flaring season is observed in summer, and the lowest flaring is observed in winter. A possible interpretation of this phenomenon is that in winter, a large volume of gas is used for heating and increased power generation.
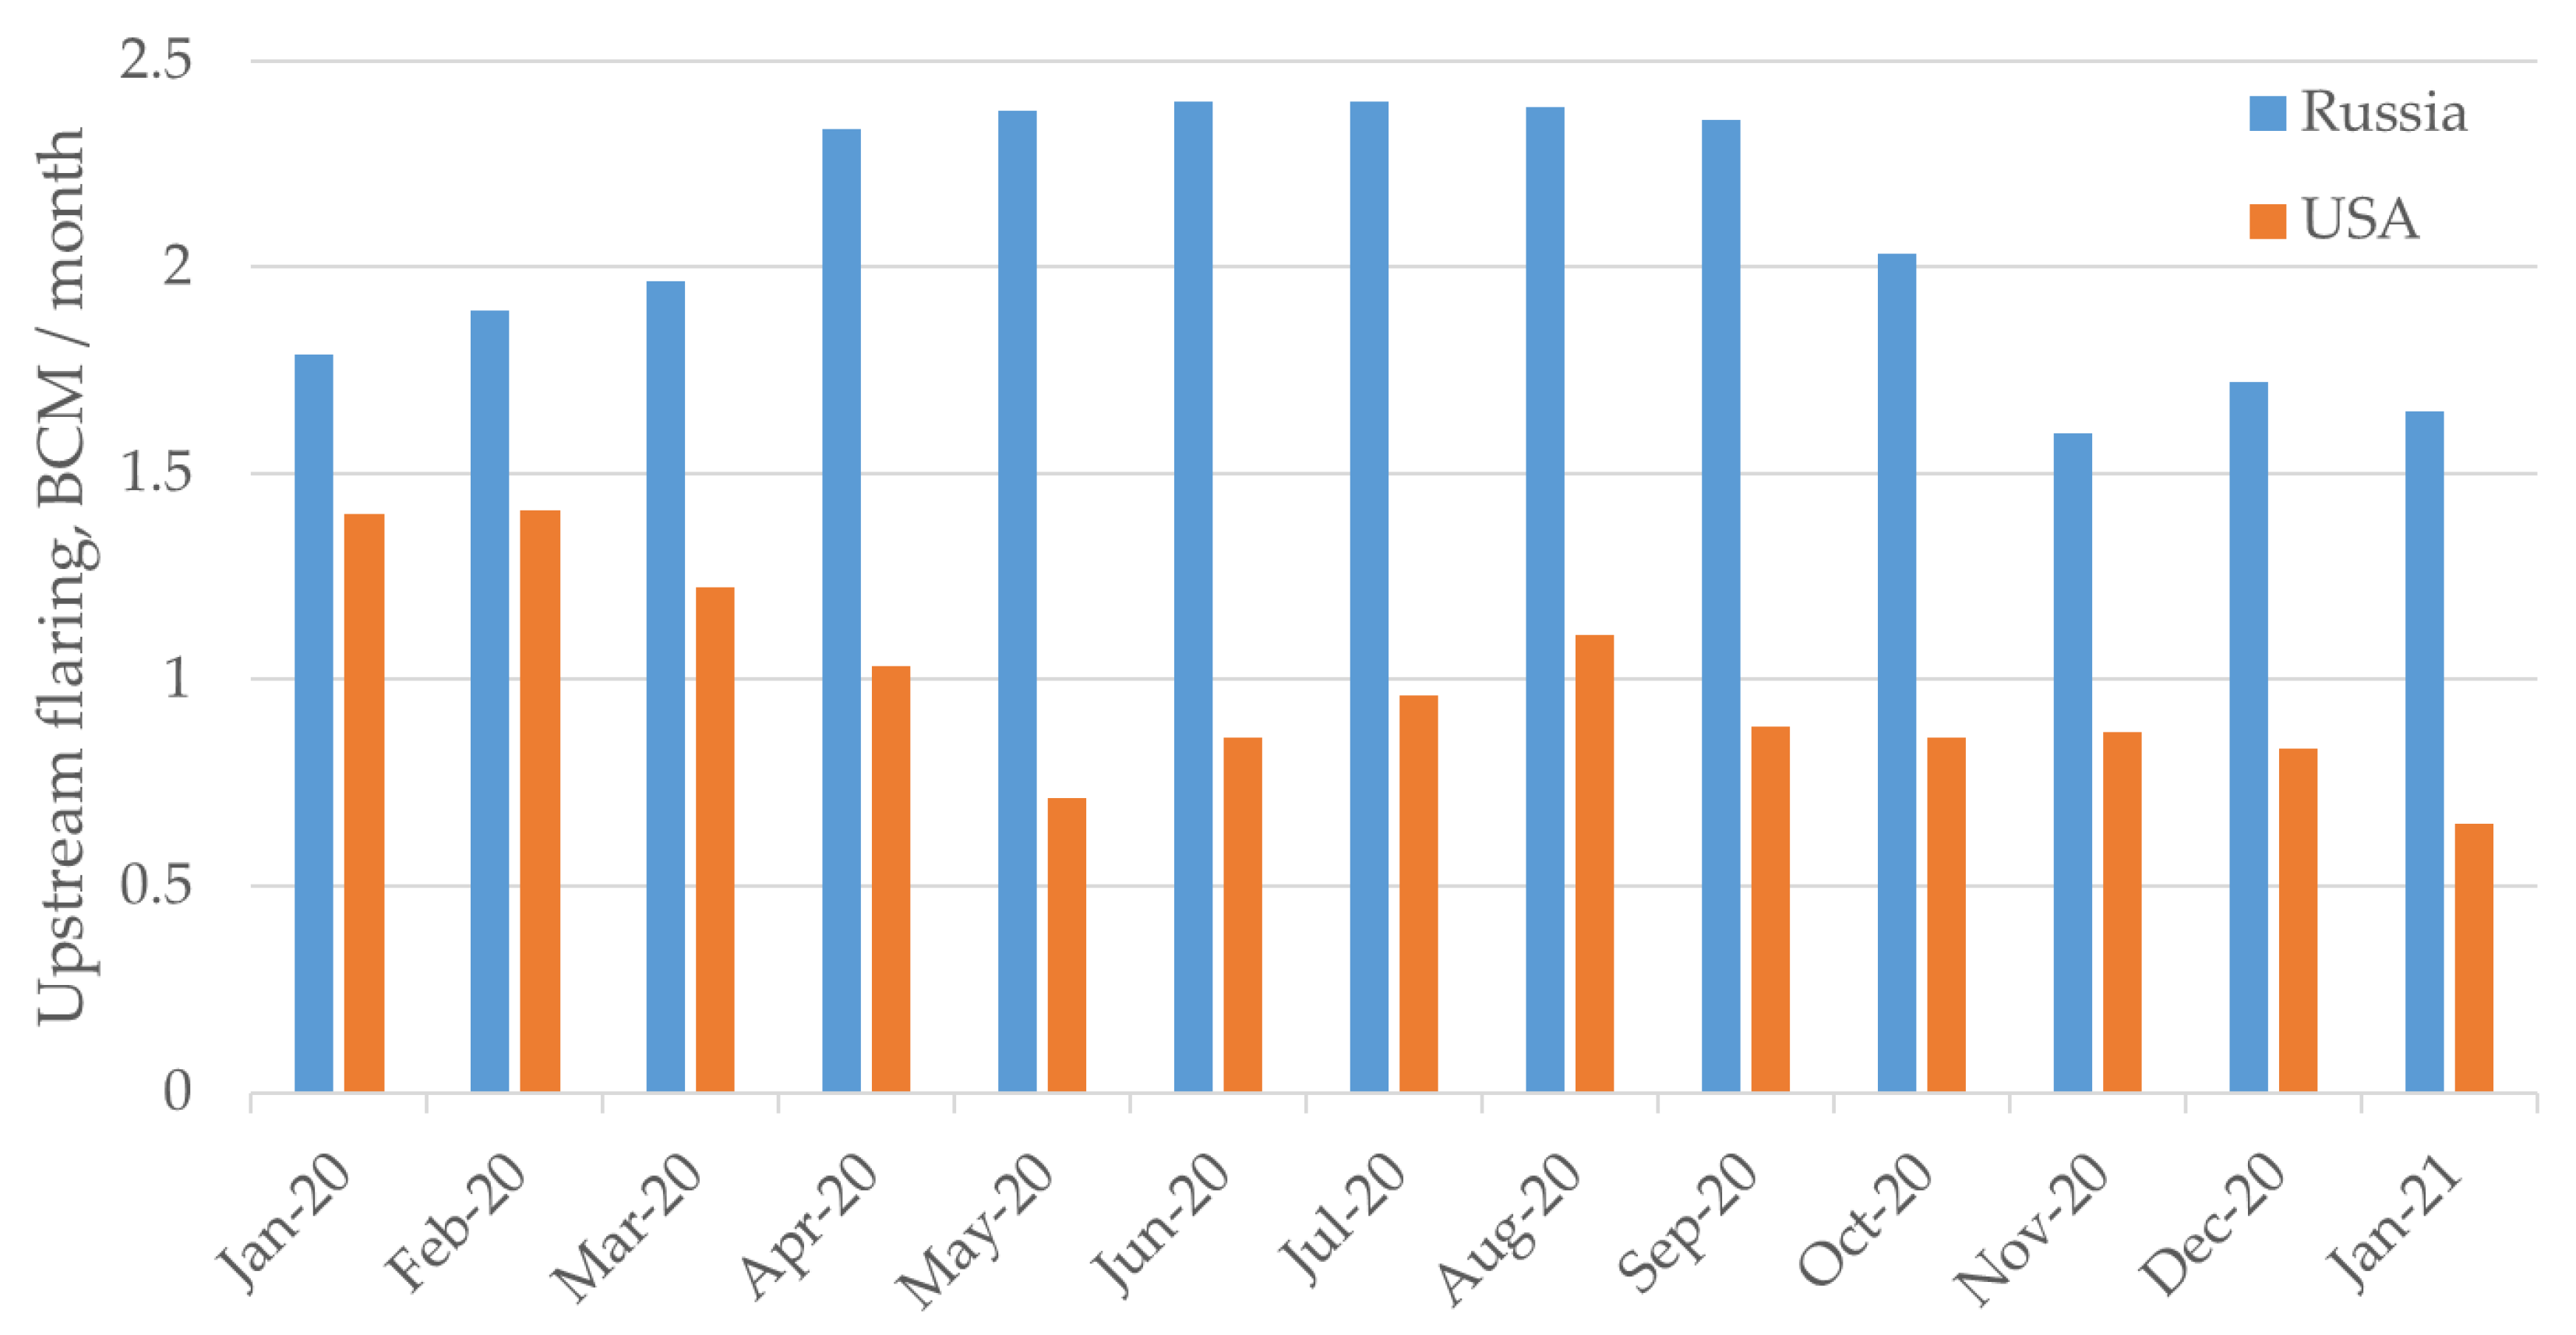
The COVID-19 pandemic has strong implications on the world oil and gas market. In Figure 13, we compare the monthly flared gas volumes in Russia and the US in 2020. We observe a significant drop in the US flaring starting from March, which is opposite to the seasonal variations in previous years. By contrast, in Russia, the 2020–2021 flaring season is not different from the past observations, with the peak of the long-term trend happening in summer 2020. Several oil fields in Russia have shown a decline in flaring (namely Priobskoye, the largest oil producing field in Russia in recent years [45]), while Odoptu field in Sakhalin was forced to completely shut down its production in July 2020 [61]. For the latter, the last flaring event was observed in November, with a major decrease in monthly flaring volumes in June 2020. However, flaring at the other fields in Russia has increased and thus compensated for the negative trend.
VIIRS Active Fire Products Data Applicability for Daytime Gas Flaring Observations
Compared with VIIRS Nightfire, wildfire detection algorithms such as the MODIS C6 or VIIRS Active Fire Detection algorithms [62,63] are significantly less sensitive in cases of gas flare detection [16], as they ignore SWIR band signals and use MWIR channels as their principal means of hotspot detection. It should be noted that the FRP assessment methodology has been recently adapted to VIIRS night-time SWIR observations for gas flare detection [64]. Unlike Nightfire, however, Active Fire Products’ daytime observations (which are also applicable to summer-time midnight sun conditions) remain relevant. Here, VIIRS Active Fire Product’s (VAFP) hotspot data (available at https://firms2.modaps.eosdis.nasa.gov/country/ (accessed on 27 July 2021)) were examined using the case of hotspot detection in Russia in 2019 within gas flare contours obtained with VIIRS Nightfire.
From the available dataset, 116,686 valid Active Fire Product detections (26,404 daytime and 90,281 night-time detections) fell within the VIIRS Nightfire gas flare contours. This number is exaggerated, however, as in some cases, lower spatial resolution M13 night-time estimates in VAFP are split equally between I4 pixels [65]; on top of that, large gas flares may be split between several pixels or produce a thermal “halo” around themselves (especially in higher spatial resolution I4 observations), resulting in multiple same-time VAFP detections within the same Nightfire contour ID. Thus, all detections within the same Nightfire ID with the time difference between them being less or equal to 1 s had their respective FRP estimates summed up into a single FRP estimate, resulting in 71,537 unique VAFP observations. Among the 1176 contours of gas flares detected with Nightfire in Russia in 2019, 927 (79%) have at least a single corresponding detection in VAFP with 718 having ≥4 unique VAFP detections. The largest gas flares missing in the Active Fire Product dataset had Nightfire-estimated 16 MCM flared volumes. Such flares have relatively high detection frequency (c. 60–70%) via Nightfire, indicating relatively small but persistent routinely operated flares which presumably fall outside the sensitivity range of VIIRS AFP.
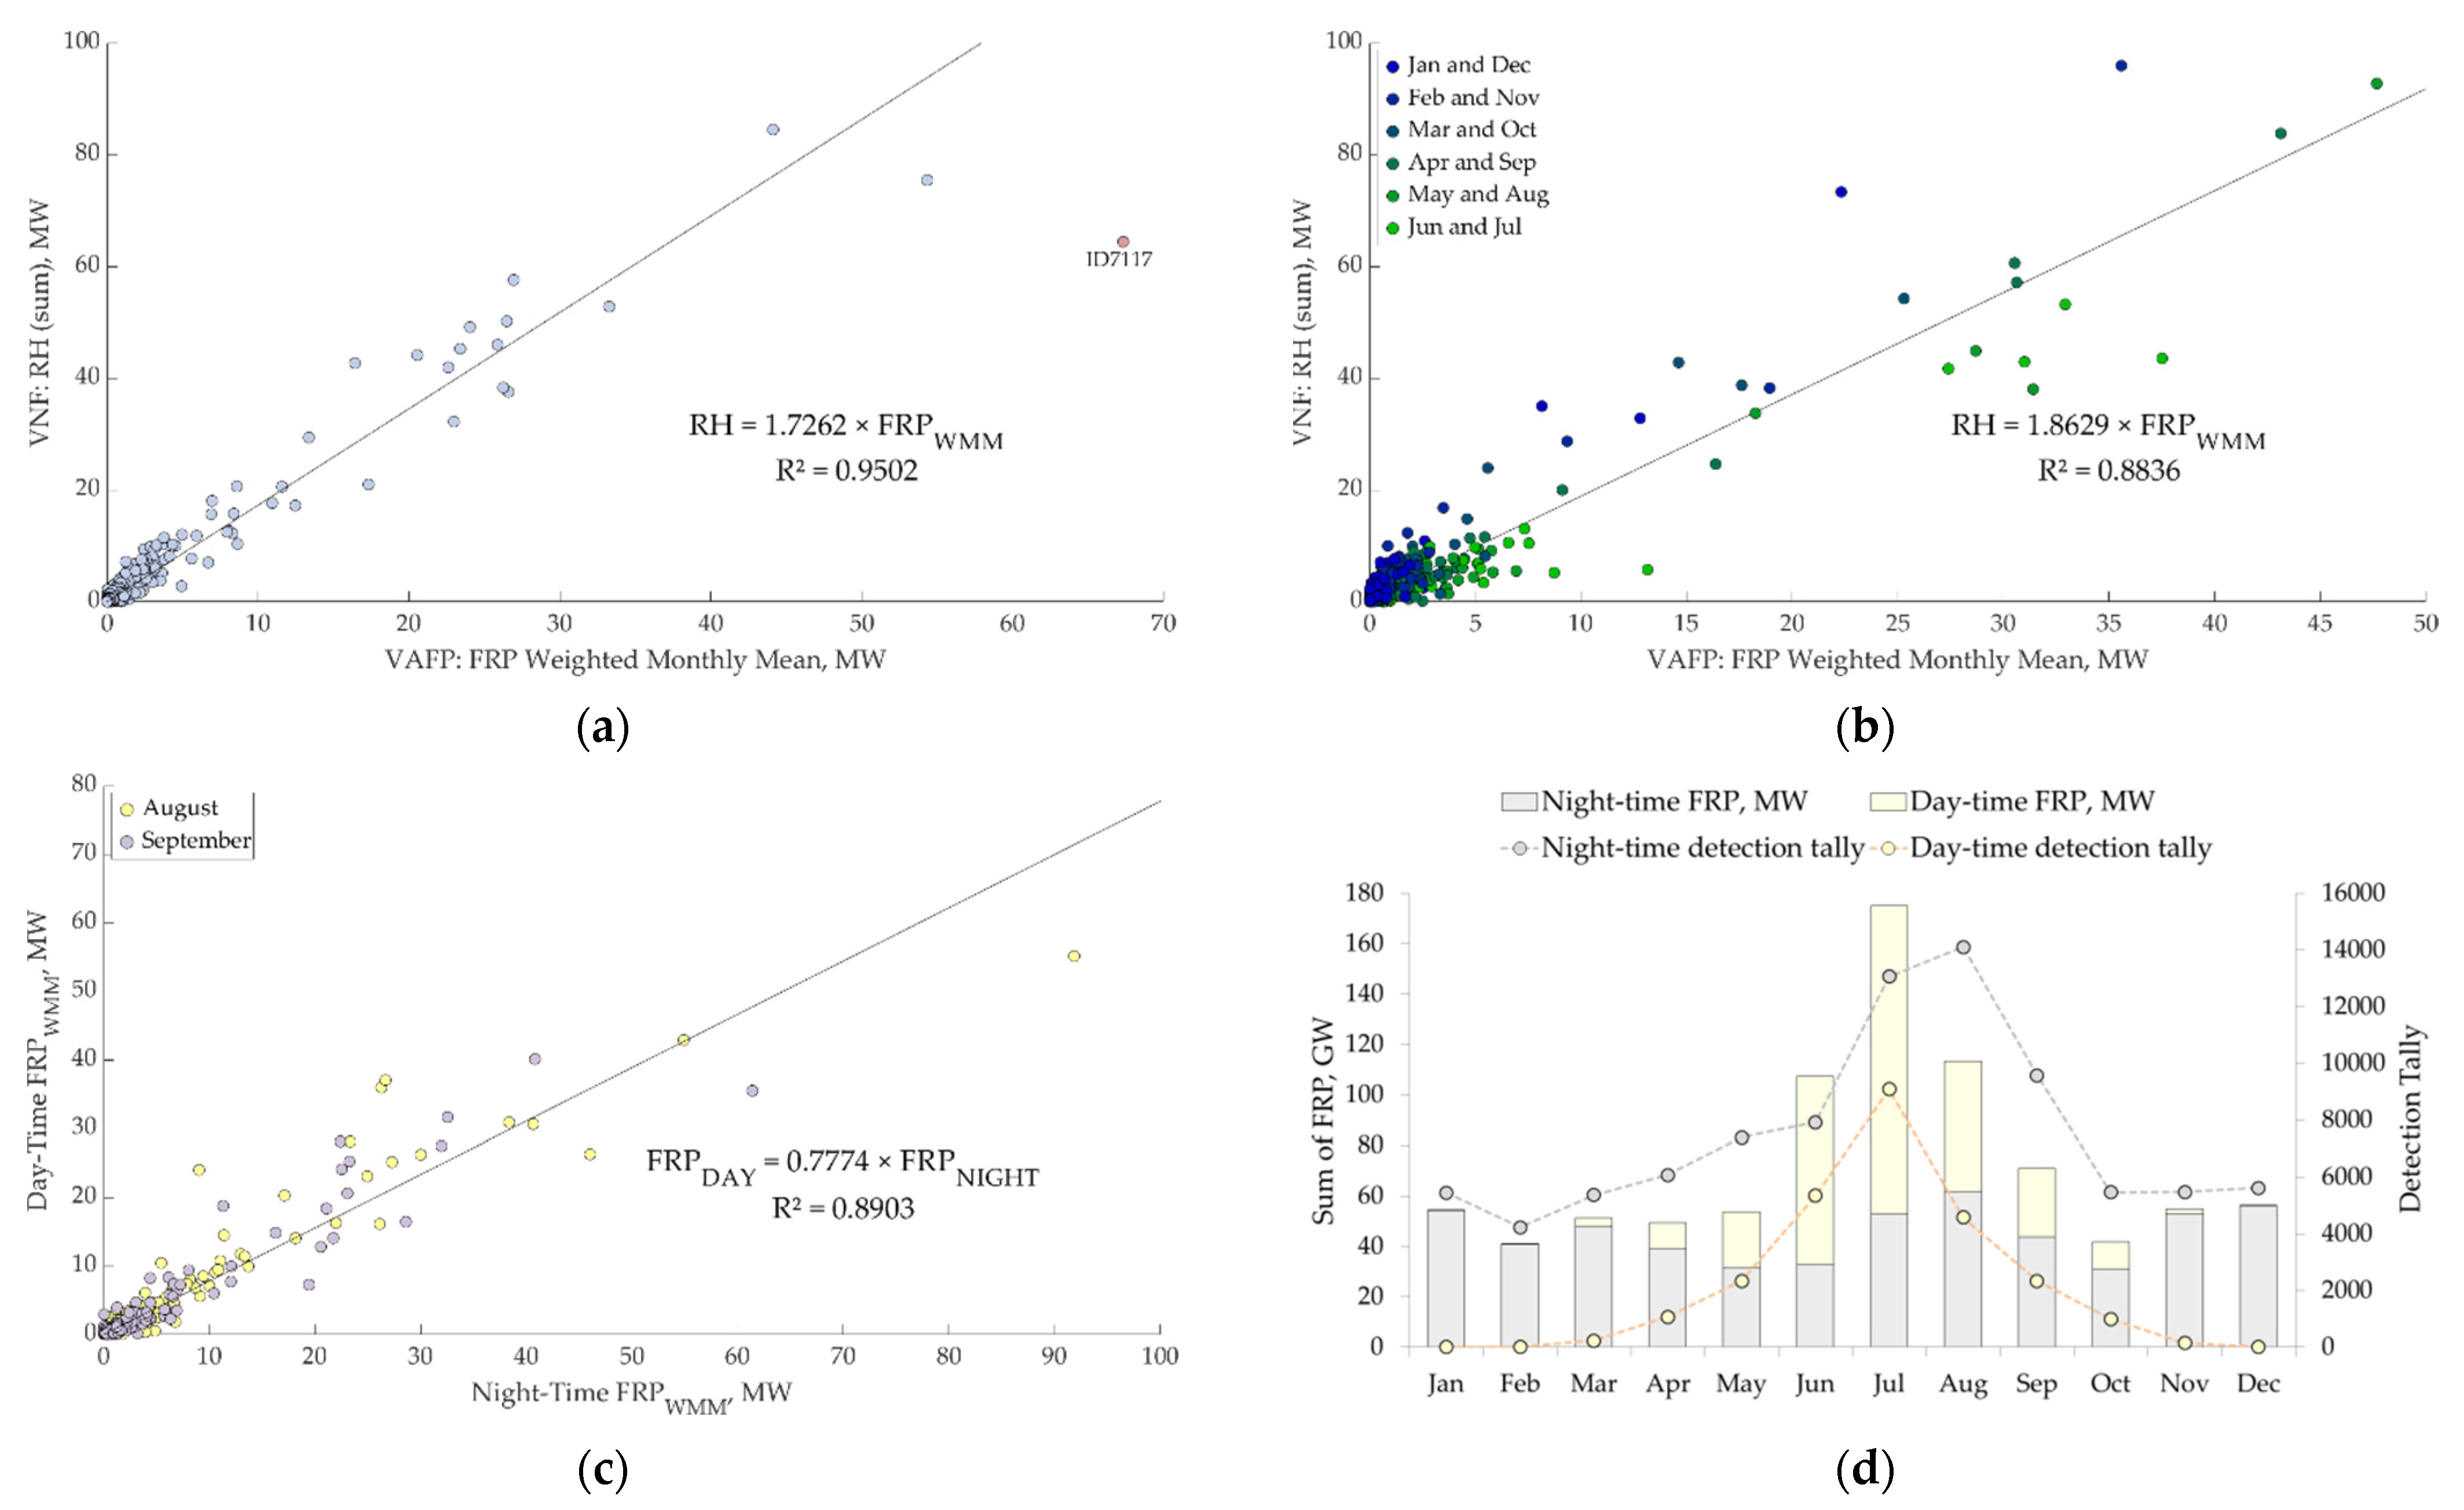
For the FRP estimates to be comparable with Nightfire RH estimates in MW, a monthly averaged daily FRP mean was later calculated (with daily FRP means accounting for multiple pixel VAFP footprint of single flares within the same scan or several detections occurring the same day) for the unique VAFP observations coinciding within the same Nightfire contour ID. RH’, due to the exponent applied to observed flare area, SD (see Equation (4) in Section 2.5), results in worse correlation with FRP estimates and was thus replaced with linear RH. As cloud cover data were not considered in this analysis, annual detection frequency was approximated as the number of days with observations divided by 365 (or the number of days in the month for monthly estimates). The resulting detection frequency was later multiplied by monthly mean FRP, resulting in weighted monthly mean FRP (FRPWMM) in MW. Figure 14a presents an annual correlation plot of FRPWMM with Nightfire RH estimates.
Initially, a strong correlation (R2 = 0.91) is observed; however, a single point, ID 7117 (67.81°N 72.53°E), appears to be a conspicuous outlier. It corresponds to a large four flaring stack facility on a recently commissioned Novoportovskoye oil field at high latitudes with no Nightfire observations available in the May–July period. As noted in Section 4.2, such large flaring facilities may be underestimated with Nightfire, while still being correctly estimated with FRP data; however, to our knowledge, no reported flaring volume data are publicly available for the field to affirm this speculation. With this observation excluded, a stronger correlation (R2 = 0.95) is observed.
For the purposes of filling the summertime gaps in Nightfire observations, monthly VAFP estimates are required instead. Initial unfiltered correlation is not as strong as the annual one (R2 = 0.73). This can be explained with the presence of increased summer daytime sensitivity of VAFP coinciding with gaps in Nightfire observations, rough estimate of detection frequency applied in FRPWMM, or the possible seasonal discrepancy in FRP estimates between summer and wintertime observations due to different background brightness and reflectance qualities. To remedy this, a smaller sample (171 Nightfire contours) of flares which remain confidently detectable with Nightfire in June (i.e., roughly with latitude < 55°N) was selected, which results in a strong correlation (R2 = 0.88), as shown in Figure 14b. It is worth noting, however, that most of these flares are relatively small compared with the flares in northern regions.
To observe the correlation between day and night-time observation, in Figure 14c, only August and September observations for all flares were selected. These months were chosen to represent the summer season (i.e., low chance of snow cover presence), while at the same time having Nightfire estimates available. Although the correlation is strong (R2 = 0.89), the non-1:1 ratio should be acknowledged.
There are other known and observed limitations characterizing the presented data:
- In Active Fire Detection algorithm, winter daytime pixels containing gas flares may be omitted based on the high reflectance of snow cover of the surrounding pixels combined with low background temperatures. This, combined with lower daylight length, can be the explanation for almost non-existent daytime FRP estimates in the winter season as seen in Figure 14d, which presents raw FRP data. Compared with Nightfire RH, overall FRPWMM estimates tend to be lower in winter (Figure 14b, blue markers), and, as is later seen in Figure 14d, despite a shorter night-time period, the tally of night-time detections is higher in summer while FRP estimates remain stable. As such, it is possible that winter season observations should be ignored, given that the aim of applying FRP estimates is to fill the summertime gaps in observations.
- As FRP itself is retrieved based on wildfire experimental characteristics [66], it may also underestimate the radiative power emitted by higher temperature gas flares.
- As Active Fire Products are more sensitive to lower-temperature hotspots, wildfire presence in the data cannot be excluded. Eastern Siberia is known for the frequent occurrence of wildfires which can coincide with places of human activity, such as remote oil fields. Most of the fields in the region are characterized by large gas flares at central processing units with lesser flares at well clusters and exploration sites, and it is the latter two which can have their FRP significantly overestimated if a wildfire occurs nearby. While a gas flare is a stable heat source which results in a circular pattern of AFP or Nightfire detections around the source, a wildfire can be characterized as sporadic, non-persistent, moving phenomenon, which can be used to filter it out.
- Another source of noise in the data can be other hotspots present near gas flares, especially at downstream facilities (refineries, gas processing plants). They tend to have lower temperatures and thus are more likely to be detected with AFP than with Nightfire.
Although complicated with known issues, initial analysis has shown that Active Fire Product data exhibit a strong correlation with Nightfire estimates, despite the presence of non-simultaneous observations and lack of detection frequency data. Indirectly, it also confirms an assumption that gas flares tend to have stable daily (or day-to-day) flaring pattern. With the application of cloud cover data and a wider dataset, it might be possible to use summer daytime VIIRS Active Fire Product observations to more accurately account for the existing gap in Nightfire observations.
5. Conclusions
The result of this paper is a digital catalog of the Russian gas flares observed with Suomi NPP satellite in the period of 2012–2020. For each flare, we report its geographical and economical metadata, including location, temperature, detection frequency, annual flared volume (in million cubic meters, MCM), type of facility (e.g., oil field or gas processing plant), and ownership.
We provide technical details on the updated method for flare detection and characterization, including watershed of the detection probability map to define flare contours, aggregation of the VNF time series within the flare contours by month or by year, normalization of these aggregates for the cloud-free observations, correction for flare geometry and satellite view angle, non-linear correction of the Stefan–Boltzmann law for flare radiative heat, and confidence levels in calibration for the survey of gas flaring using VNF data.
During the observation period of 2012–2020, 3220 unique gas flare annual detections in Russia were validated in this study. Annually, approximately 1350 gas flares have been detected on average, with a decrease in 2020 to 1241 detections. These detections correspond to 1063 unique objects–separate entities, such as oil and gas fields, exploration drillings, and midstream or downstream objects. Upstream flaring has been detected in 27 federal subjects of Russia, with downstream flaring occurring in 12 more regions. On the company level, 293 separate subsidiaries have been attributed at least one active gas flare.
In the global context, gas flaring volumes in Russia are estimated to average at 23 BCM annually (15% of global estimated flaring), with 19 BCM (c. 82% on national scale) corresponding to oil upstream facilities burning associated petroleum gas (APG), which has been subject to heavy government regulations since 2013. Although initially dropping, observed flaring volumes have been on the climb since 2018 and, despite the setbacks of 2020 and a subsequent reported drop in oil production in Russia by 9%, flaring volumes are estimated to have reached their peak (25.5 BCM) this year (21 BCM in oil upstream sector), although global flaring has dropped by 5%. VIIRS Nightfire estimates were in better agreement with the official data reported by the Ministry of Energy of the Russian Federation and Rosstat (Russian Federal State Statistics Service) in 2012–2013 and 2019, while in 2015–2016, its estimates exceeded reported data by c. 70%.
On a regional scale, Khanty-Mansi Autonomous Okrug, Yugra (KhMAO), as the major oil producing region in Russia, is estimated to remain the largest APG flaring region in the country, although Nightfire estimates exceed the reported data by a factor of 2.5. Flaring in the region has also dropped significantly in 2012–2017 and remains at the 4.5 BCM mark. In 2019–2020, combined upstream flaring (including natural gas and gas condensate facilities) in Yamal-Nenets Autonomous Okrug is estimated to have surpassed flaring in KhMAO (5 BCM), although approximately 50% of the flaring volume was categorized as “natural gas upstream” in this study. Other major flaring regions are Irkutsk Oblast (3.5 BCM in 2020), Krasnoyarsk Krai (3 BCM), and Orenburg Oblast (2.3 BCM).
On the company level, the largest oil producer, Rosneft, is also the largest flaring entity, comprising 38% of the national flaring levels (estimates include joint ventures). Approximately 14% and 12% of the flaring volume is related to Gazprom Neft and Lukoil facilities, respectively, although the latter reports significantly lower flaring volumes. The major oil producers Surgutneftegas and Tatneft flare less than 0.1 BCM of their APG annually, and are confirmed to have reached the 95% APG utilization goal. Although the correlation with company-reported flaring data (see Figure 8) is strong (R2 = 0.9), annual estimates for the largest companies experience significant scatter, while other companies tend to be overestimated with Nightfire.
On a site-level, we are able to monitor catastrophic events resulting in temporary increases in the flared volumes when the infrastructure fails to utilize the gas (Khanty-Mansi GPP, 2016), as well as to track and confirm the activities to reduce gas flaring (Vankor field, after 2014).
An effect of gas composition on the average temperature is reported for oil and gas fields in Russia: flares from oil fields appear larger and hotter compared to the natural gas fields. This may result not only from gas composition, but also from the technological differences in flare design, combustion efficiency and operation.
We compare national-level long-term trends and seasonal variations of the gas flaring in Russia and the US. For the summer months, night-time observations of sub-arctic oil and gas fields are not possible and need to be interpolated or filled in with an alternative daytime fire product. We observe similar summer–winter maxima and minima in the seasonal patterns for both countries. However, gas flaring’s response to the COVID-19 economic slowdown is different: in the US, it showed a 50% drop in spring 2020, while in Russia it followed the same pattern as in previous years.
Supplementary Materials
The following are available online at https://0-www-mdpi-com.brum.beds.ac.uk/article/10.3390/rs13163078/s1, (References [67,68,69,70,71,72,73,74,75,76] are cited in the supplementary materials). Textual supplementary data to this article contains more detailed description of the gas flare catalog and additional graphical and table materials. Digital supplementary data contains Catalog of gas flares in Russia in 2012–2020 as an MS Excel table and KML file for Google Earth.
Author Contributions
Conceptualization, M.Z. and C.E.; methodology, M.Z. and A.M.; software, M.Z.; validation, A.M., C.E. and M.H.; resources, F.-C.H.; da ta curation, T.G.; writing—original draft preparation, A.M. and M.Z.; visualization, A.M and M.Z. All authors have read and agreed to the published version of the manuscript.
Funding
This research received no external funding.
Data Availability Statement
Publicly available VIIRS Nightfire annual datasets were analyzed in this study. Annual Nightfire data are available at https://eogdata.mines.edu/download_global_flare.html (accessed on 27 July 2021; registration required).
Conflicts of Interest
The authors declare no conflict of interest.
References
- Ministry of Energy of Russian Federation. Functioning and Development of the Energy Sector in Russia—2019; Ministry of Energy of Russian Federation: Moscow, Russia, 2020; p. 75. Available online: https://minenergo.gov.ru/system/download-pdf/18288/120837/ (accessed on 26 April 2021). (In Russian)
- Ministry of Energy of Russian Federation. Functioning and Development of the Energy Sector in Russia—2020; Ministry of Energy of Russian Federation: Moscow, Russia, 2021; p. 73. Available online: https://minenergo.gov.ru/system/download-pdf/20322/154189 (accessed on 26 April 2021). (In Russian)
- Rosstat. Manufacturing of Main Types of Products. Unified Interdepartmental Information and Statistical System (UIISS). Rosstat (Russian Federal State Statistics Service). 2020. Available online: https://fedstat.ru/indicator/58636 (accessed on 26 April 2021).
- Cedigaz. National Flared Gas Volumes. Available online: http://www.cedigaz.org/products/natural-gas-database.aspx (accessed on 28 April 2021).
- Elvidge, C.D.; Zhizhin, M.; Hsu, F.-C.; Baugh, K.E. VIIRS NightFire: Satellite Pyrometry at Night. Remote Sens. Environ. 2013, 5, 4423–4449. [Google Scholar] [CrossRef] [Green Version]
- Elvidge, C.D.; Zhizhin, M.; Baugh, K.E.; Hsu, F.-C.; Ghosh, T. Methods for Global Survey of Natural Gas Flaring from Visible Infrared Imaging Radiometer Suite Data. Energies 2016, 9, 14. [Google Scholar] [CrossRef]
- Croft, T.A. Nighttime Images of the Earth from Space. Sci. Am. 1978, 239, 86–98. [Google Scholar] [CrossRef]
- Matson, M.; Dozier, J. Identification of subresolution high temperature sources using thermal IR sensor. Photogramm. Eng. Rem. Sens. 1981, 47, 1311–1318. [Google Scholar]
- Elvidge, C.D.; Ziskin, D.; Baugh, K.E.; Tuttle, B.T.; Ghosh, T.; Pack, D.W.; Erwin, E.H.; Zhizhin, M. A Fifteen Year Record of Global Natural Gas Flaring Derived from Satellite Data. Energies 2009, 2, 595–622. [Google Scholar] [CrossRef]
- Alsynbaev, K.; Bryksin, V.; Yevtyshkin, A.; Erokhin, G.; Kozlov, A. Power rating of flares power burning associated gas by processing satellite images MODIS. IKBFU’s Vestnik 2013, 10, 131–137. [Google Scholar]
- Casadio, S.; Arino, O.; Serpe, D. Gas flaring monitoring from space using the ATSR instrument series. Remote Sens. Environ. 2012, 116, 239–249. [Google Scholar] [CrossRef]
- Fisher, D.; Wooster, M.J. Multi-decade global gas flaring change inventoried using the ATSR-1, ATSR-2, AATSR and SLSTR data records. Remote Sens. Environ. 2019, 232, 111298. [Google Scholar] [CrossRef]
- Caseiro, A.; Gehrke, B.; Rücker, G.; Leimbach, D.; Kaiser, J.W. Gas flaring activity and black carbon emissions in 2017 derived from the Sentinel-3A Sea and Land Surface Temperature Radiometer. Earth Syst. Sci. Data 2020, 12, 2137–2155. [Google Scholar] [CrossRef]
- Anejionu, O.C.D. Rationale, historical developments and advances in remote sensing of gas flares. Int. J. Remote Sens. 2019, 40, 6700–6719. [Google Scholar] [CrossRef]
- Faruolo, M.; Caseiro, A.; Lacava, T.; Kaiser, J.W. Gas Flaring: A Review Focused on Its Analysis From Space. IEEE Geosci. Remote Sens. 2021, 9, 258–281. [Google Scholar] [CrossRef]
- Sharma, A.; Wang, J.; Lennartson, E.M. Intercomparison of MODIS and VIIRS Fire Products in Khanty-Mansiysk Russia: Implications for Characterizing Gas Flaring from Space. Atmosphere 2017, 8, 95. [Google Scholar] [CrossRef] [Green Version]
- Liu, Y.; Hu, C.; Zhan, W.; Sun, C.; Murch, B.; Ma, L. Identifying industrial heat sources using time-series of the VIIRS Nightfire product with an object-oriented approach. Remote Sens. Environ. 2018, 204, 347–365. [Google Scholar] [CrossRef]
- Hodgson, R. Generating a Scalable Calibration Equation that Can Be Applied to VIIRS NightFire (VNF) Radiant Heat Calculations to Estimate Gas Flaring Volumes in Nigeria. Master’s Thesis, Birkbeck College, University of London, London, UK, 2018. [Google Scholar]
- Zhang, X.; Scheving, B.; Shoghli, B.; Zygarlicke, C.; Wocken, C. Quantifying Gas Flaring CH4 Consumption Using VIIRS. Remote Sens. Environ. 2015, 7, 9529–9541. [Google Scholar] [CrossRef] [Green Version]
- Franklin, M.; Chau, K.; Cushing, L.J.; Johnston, J.E. Characterizing flaring from unconventional oil and gas operations in south Texas using satellite observations. Environ. Sci. Technol. 2019, 53, 2220–2228. [Google Scholar] [CrossRef] [PubMed]
- Willyard, K.A.; Schade, G.W. Flaring in two Texas shale areas: Comparison of bottom-up with top-down volume estimates for 2012 to 2015. Sci. Total Environ. 2019, 691, 243–251. [Google Scholar] [CrossRef] [PubMed]
- Lu, R.; Miskimins, J.L.; Zhizhin, M. Learning from Nighttime Observations of Gas Flaring in North Dakota for Better Decision and Policy Making. Remote Sens. Environ. 2021, 13, 941. [Google Scholar] [CrossRef]
- Elvidge, C.D.; Bazilian, M.D.; Zhizhin, M.; Ghosh, T.; Baugh, K.E.; Hsu, F.-C. The potential role of natural gas flaring in meeting greenhouse gas mitigation targets. Energy Strateg. Rev. 2018, 20, 156–162. [Google Scholar] [CrossRef]
- Elvidge, C.D.; Zhizhin, M.; Baugh, K.; Hsu, F.C.; Ghosh, T. Extending Nighttime Combustion Source Detection Limits with Short Wavelength VIIRS Data. Remote Sens. Environ. 2019, 11, 395. [Google Scholar] [CrossRef] [Green Version]
- Zhizhin, M.N.; Elvidge, C. Ground-truth calibration of VIIRS Nightfire detector for gas flares. In Proceedings of the AGU Fall Meeting Abstracts, Washington, DC, USA, 10–14 December 2018. [Google Scholar]
- Brandt, A.R. Accuracy of satellite-derived estimates of flaring volume for offshore oil and gas operations in nine countries. Environ. Res. Commun. 2020, 2, 051006. [Google Scholar] [CrossRef]
- Ernst & Young. Tax Code of the Russian Federation. Part II. Federal Law No. 117-FZ of 5 August 2000 (ed. 7 March 2011). (Unofficial Translation). Available online: https://www.nalog.gov.ru/html/sites/www.eng.nalog.ru/Tax_Code_Part_Two.pdf (accessed on 3 August 2021).
- Regulation of the Government of the Russian Federation of 8 November 2012 № 1148 (ed. 13 December 2019) On Particularities of Calculation of Fee for Emission of Pollutants in Course of Burning at Flare Facilities and (or) Deflation of Oil-Associated Gas. Available online: http://ivo.garant.ru/#/document/70257422/paragraph/701:0 (accessed on 3 August 2021). (In Russian).
- Knizhnikov, A.Y.; Ilyin, A.M. Challenges and Prospects of the Associated Petroleum Gas. Utilization in Russia—2017; WWF Russia: Moscow, Russia, 2017; 34p. (In Russian) [Google Scholar]
- Korppoo, A. Russian associated petroleum gas flaring limits: Interplay of formal and informal institutions. Energ. Policy 2018, 116, 232–241. [Google Scholar] [CrossRef]
- Department of Mineral Resources of Khanty-Mansi Autonomous Okrug—Yugra. Annual Results of the Industry. Available online: https://depnedra.admhmao.ru/deyatelnost/itogi-deyatelnosti-otrasli/ (accessed on 26 April 2021). (In Russian).
- Department of Supervision of Natural Resources of Khanty-Mansi Autonomous Okrug—Yugra. Annual Reports on the Environmental Situation in Khanty-Mansi AO—Yugra. Available online: https://prirodnadzor.admhmao.ru/doklady-i-otchyety/doklad-ob-ekologicheskoy-situatsii-v-khanty-mansiyskom-avtonomnom-okruge-yugre/ (accessed on 26 April 2021). (In Russian).
- Kopp, T.J.; Thomas, W.; Heidinger, A.K.; Botambekov, D.; Frey, R.A.; Hutchison, K.D.; Iisager, B.D.; Brueske, K.; Reed, B. The VIIRS Cloud Mask: Progress in the first year of S-NPP toward a common cloud detection scheme. J. Geophys. Res. Atmos. 2014, 119, 2441–2456. [Google Scholar] [CrossRef]
- NOAA. JPSS Visible Infrared Imaging Radiometer Suite (VIIRS) Algorithm. Theoretical Basis Document for Nighttime Cloud Optical Depth, Cloud Particle Size, Cloud Ice Water Path, and Cloud Liquid Water Path. 2015. Available online: https://www.star.nesdis.noaa.gov/jpss/documents/ATBD/ATBD_EPS_Cloud_NCOMP_v0.1.0.pdf (accessed on 28 April 2021).
- Serra, J. Image Analysis and Mathematical Morphology; Academic Press: Orlando, FL, USA, 1983; 621p. [Google Scholar]
- NOAA. Visible Infrared Imaging Radiometer Suite (VIIRS) Sensor Data Record (SDR) User’s Guide. 2017. Available online: https://ncc.nesdis.noaa.gov/documents/documentation/viirs-users-guide-tech-report-142a-v1.3.pdf (accessed on 26 April 2021).
- Rosgeolfond. Consolidated Registry of Subsoil Sectors and Licenses. 2021. Available online: https://rfgf.ru/catalog/temp_files/opendata/license/opendata.csv (accessed on 27 April 2021). (In Russian).
- Rosgeolfond. Registry of State Cadastre of Mineral Deposits. 2021. Available online: https://rfgf.ru/catalog/temp_files/opendata/gkm/opendata.csv (accessed on 27 April 2021). (In Russian).
- Map of Mineral Deposits. Research and Analytical Center “Mineral”. Available online: https://openmap.mineral.ru/Standard/?l=en (accessed on 27 April 2021).
- Ministry of Energy of Russian Federation. Registry of planned, under construction, and commissioned oil refineries in Russian Federation. 2020. Available online: https://minenergo.gov.ru/opendata/7705847529-reestrnpz/data-20201019T1840-structure-20190212T1700_0.csv (accessed on 27 April 2021). (In Russian)
- EnergyBase.ru. Processing Plants. Available online: https://energybase.ru/en/processing-plant (accessed on 27 April 2021).
- Wikimapia. Available online: https://wikimapia.org/#lang=en (accessed on 27 April 2021).
- Kutner, M.H.; Nachtsheim, C.; Neter, J. Applied Linear Regression Models, 4th ed.; McGraw-Hill/Irwin: New York, NY, USA, 2004; 701p. [Google Scholar]
- Eisenhauer, J.G. Regression through the Origin. Teach. Stat. 2003, 25, 76–80. [Google Scholar] [CrossRef]
- Analytical Center for the Government of the Russian Federation. Russian Energy—2019. Available online: https://ac.gov.ru/uploads/2-Publications/TEK_annual/TEK.2019.pdf (accessed on 26 April 2021). (In Russian)
- V.I. Shpilman Research and Analytical Centre. Information about Oil Production and Oil and Gas Field Development in Khanty-Mansi Autonomous Okrug—Yugra. 2021. Available online: http://www.crru.ru/eng_dobicha.html (accessed on 27 April 2021).
- Rosneft. Annual Report. 2019. Available online: https://www.rosneft.com/upload/site2/document_file/a_report_2019_eng.pdf (accessed on 27 April 2021).
- Knizhnikov, A.Y.; Kutepova, E.A. Challenges and Prospects of the Associated Petroleum Gas Utilization in Russia—2010; WWF Russia: Moscow, Russia, 2010; 42p. (In Russian) [Google Scholar]
- Ministry of Energy of Russian Federation. Statistics: Crude Oil. Available online: https://minenergo.gov.ru/en/activity/statistic (accessed on 26 April 2021).
- Lukoil. Annual Report. 2016. Available online: http://www.lukoil.com/FileSystem/9/289049.pdf?dl=1 (accessed on 26 April 2021).
- TASS. Four men were injured following a fire on a Lukoil’s GPP in KhMAO. 29 June 2016. Available online: https://tass.ru/proisshestviya/3415135 (accessed on 28 April 2021). (In Russian).
- Lukoil. Sustainability Report. 2017. Available online: http://www.lukoil.com/FileSystem/9/500386.pdf?dl=1 (accessed on 26 April 2021).
- Rosneft. Annual Report. 2013. Available online: https://www.rosneft.com/upload/site2/document_file/0x6IQABSaM.pdf (accessed on 26 April 2021).
- RUPEC. Rosneft commenced APG Utilization at Vankor Oilfield. 31 January 2014. Available online: https://rupec.ru/news/28971/ (accessed on 26 April 2021). (In Russian).
- Neftegaz.ru. Rosneft Produced 21 mln tons of Oil at Vankor Oil Field in 2013. Available online: https://neftegaz.ru/news/dobycha/248205-rosneft-dobyla-v-2013-g-na-vankorskom-ngkm-21-mln-t-nefti/ (accessed on 26 April 2021). (In Russian)..
- Rosneft. Overview of Production by Region of Operations. Rosneft Sustainability Report—2015. 2015. Available online: https://www.rosneft.ru/docs/report/2015/eng/3_3_eng.html (accessed on 26 April 2021).
- Rosneft. Annual Report. 2018. Available online: https://www.rosneft.com/upload/site2/document_file/a_report_2018_eng.pdf (accessed on 26 April 2021).
- RUPEC. Associated Petroleum Gas Production and Utilization in Russia in Q2, 2013. 2013. Available online: https://rupec.ru/analytics/27128/ (accessed on 26 April 2021).
- Akima, H. A new method of interpolation and smooth curve fitting based on local procedures. J. ACM 1970, 17, 589–602. [Google Scholar] [CrossRef]
- Cleveland, R.B.; Cleveland, W.S.; McRae, J.E.; Terpenning, I. STL: A Seasonal-Trend Decomposition Procedure Based on LOESS. J. Off. Stat. 1990, 6, 3–73. [Google Scholar]
- Interfax. Rosneft has Halted the Oil Production of RN-Sakhalinmorneftegaz. 3 August 2020. Available online: https://www.interfax.ru/business/720127 (accessed on 29 April 2021). (In Russian).
- Giglio, L.; Schroeder, W.; Justice, C.O. The collection 6 MODIS active fire detection algorithm and fire products. Remote Sens. Environ. 2016, 178, 31–41. [Google Scholar] [CrossRef] [Green Version]
- Schroeder, W.; Oliva, P.; Giglio, L.; Csiszar, I.A. The New VIIRS 375 m active fire detection data product: Algorithm description and initial assessment. Remote Sens. Environ. 2014, 143, 85–96. [Google Scholar] [CrossRef]
- Fisher, D.; Wooster, M.J. Shortwave IR Adaption of the Mid-Infrared Radiance Method of Fire Radiative Power (FRP) Retrieval for Assessing Industrial Gas Flaring Output. Remote Sens. 2018, 10, 305. [Google Scholar] [CrossRef] [Green Version]
- NASA. Visible Infrared Imaging Radiometer Suite (VIIRS) 375 m Active Fire Detection and Characterization Algorithm Theoretical Basis Document 1.0. 2016. Available online: https://viirsland.gsfc.nasa.gov/PDF/VIIRS_activefire_375m_ATBD.pdf (accessed on 26 April 2021).
- Wooster, M.J.; Roberts, G.; Perry, G.L.W.; Kaufman, Y.J. Retrieval of biomass combustion rates and totals from fire radiative power observations: FRP derivation and calibration relationships between biomass consumption and fire radiative energy release. J. Geophys. Res. Atmos. 2005, 110, 24311. [Google Scholar] [CrossRef]
- Nextgis. OpenStreetMap Polygon Dump [of Boundary Coordinates of Russian Federation Federal Subject and CIS Countries]. 2018. Available online: https://github.com/nextgis/osmdump_poly (accessed on 27 April 2021).
- OpenStreetMap. Available online: https://www.openstreetmap.org (accessed on 27 April 2021).
- Public Cadastral Map of Russia. Rosreestr (The Federal Service for State Registration, Cadastre and Cartography of Russian Federation). Available online: https://pkk.rosreestr.ru (accessed on 21 July 2021). (In Russian).
- RGRI. GIS Atlas “Subsoil of Russia”. 2020. Available online: http://atlaspacket.vsegei.ru/ (accessed on 26 April 2021). (In Russian).
- Andreikina, L.V. Composition, Properties and Processing of Associated Petroleum Gas of the Western Siberia Oil Fields (Abstract). Ph.D. Thesis, State scientific-Research Institute of Chemical Products “REACTIV”, Ufa, Russia, 2005. (In Russian). [Google Scholar]
- Medvedev, A.I. Gazprom in the Eastern Part of Russia, Accessing the Markets of the Asia-Pacific Region. 2008. Available online: https://www.gazpromvideo.ru/fileadmin/press/2008/files/presentation_24.06.2008.pdf (accessed on 26 April 2021). (In Russian).
- Burenina, I.V.; Mukhametyanova, G.Z. Problems and prospects for the use of associated petroleum gas in Russia. Oil Gas Bus. Electron. Sci. J. 2015, 3, 524–542. (In Russian) [Google Scholar] [CrossRef]
- Sheveleva, N.A. Management Optimization of Associated Petroleum Gas Utilization Projects. Ph.D. Thesis, Gubkin State University, Moscow, Russia, 2015. (In Russian). [Google Scholar]
- Yashchenko, I.G. Associated petroleum gas of Western Siberia. In Proceedings of the “Readings of A.I. Bulatov”, Krasnodar, Russia, 31 March 2018; pp. 255–261. (In Russian). [Google Scholar]
- Böttcher, K.; Paunu, V.-V.; Kupiainen, K.; Zhizhin, M.; Matveev, A.; Savolahti, M.; Klimont, Z.; Väätäinen, S.; Lamberg, H.; Karvosenoja, N. Black carbon emissions from flaring in Russia in the period 2012–2017. Atmos. Environ. 2021, 254, 118390. [Google Scholar] [CrossRef]
Figure 1.
Probability map of detections and watershed contours for a chain of large flares in Basra, Iraq, overlaid with daytime image from Google Earth.
Figure 1.
Probability map of detections and watershed contours for a chain of large flares in Basra, Iraq, overlaid with daytime image from Google Earth.

Figure 2.
Examples of high spatial resolution imagery available in Google Earth for hotspots detected with VIIRS Nightfire produced by oil and gas sector related gas flares (first row) and other anthropogenic and natural sources (second row).
Figure 2.
Examples of high spatial resolution imagery available in Google Earth for hotspots detected with VIIRS Nightfire produced by oil and gas sector related gas flares (first row) and other anthropogenic and natural sources (second row).

Figure 3.
Plot VIIRS Nightfire estimated annual sum of radiant heat (RH’, in MW) vs. Cedigaz reported gas flaring volumes (in BCM) on national level. Calibration from 2012 to 2017 (solid fill points) is extrapolated to available data for 2018–2019 (unfilled points). The dashed red lines indicate the positions of the 95% confidence intervals. Nightfire RH’ estimates for Russia are presented for the oil upstream sector only.

Figure 4.
Histogram VIIRS Nightfire-estimated top 20 upstream gas flaring countries in 2012–2020 as per (a) gas flaring volumes (in BCM) and (b) gas flare tally. Shaded area for Russia represents the natural gas upstream sector.
Figure 4.
Histogram VIIRS Nightfire-estimated top 20 upstream gas flaring countries in 2012–2020 as per (a) gas flaring volumes (in BCM) and (b) gas flare tally. Shaded area for Russia represents the natural gas upstream sector.

Figure 5.
Upstream gas flaring volumes in major (in BCM; regions with >1 mean annual BCM) flaring regions of Russia. Solid and shaded areas represent flaring at oil and natural gas/gas condensate upstream facilities, respectively.
Figure 5.
Upstream gas flaring volumes in major (in BCM; regions with >1 mean annual BCM) flaring regions of Russia. Solid and shaded areas represent flaring at oil and natural gas/gas condensate upstream facilities, respectively.

Figure 6.
Upstream gas flaring volumes (in BCM) per major oil and gas companies (including their share in joint ventures) with the highest flaring rates in Russia. Solid and shaded areas represent flaring at oil and natural gas/gas condensate upstream facilities, respectively. 1 SAFMAR is a financial group controlling several oil companies (major RussNeft) founded in 2015. On the diagram, all later associated assets are retrospectively accounted for as a single entity in 2012–2014. 2 Rosneft acquired major oil companies TNK-BP in 2013 and Bashneft in 2016. Here, their flaring volumes are accounted for starting from the year of acquisition (2013 and 2016, respectively).

Figure 7.
Reported and estimated annual APG (associated petroleum gas) flaring volumes (in BCM) in Russia, 2012–2020, according to official sources (Ministry of Energy, Rosstat), expert data (Cedigaz), and VIIRS Nightfire estimates. Histogram presents annual oil production levels in Russia published by the Ministry of Energy [49]. For Cedigaz, the dotted line represents estimates from 2018–2019 not applied in VIIRS Nightfire calibration. Exact numerical data are presented in Table 1.

Figure 8.
Scatterplot VIIRS Nightfire estimates (BCM) vs. reported gas flaring volumes (BCM) by the major oil and gas companies in Russia available in their annual reports or reports on sustainable development (directly or as a result of APG extraction volumes and gas utilization rate) in 2012–2020. Note that both Nightfire and reported data include only oil upstream facilities. 1 The Rosneft reported data and the VIIRS Nightfire data include TNK-BP and Slavneft assets starting in 2013 and Bashneft in 2016. The Rosneft data include shares in joint ventures. 2 The Gazprom Neft reported data and the VIIRS Nightfire data exclude shares in joint ventures. 3 Due to the event described in Section 4.1, Lukoil’s 2016 data are excluded from the graph.

Figure 9.
VIIRS Nightfire gas flaring data dashboard for the case study gas processing plant (GPP) in Khanty-Mansi Autonomous Okrug, Russian Federation (62.35°N 74.32°E). (a) High-resolution image of the GPP available in Google Earth. (b) Recording of fire at the GPP, available from the news outlet. (c) VIIRS Nightfire day-to-day dashboard for a field related to the GPP under consideration, including ① spectral radiance in M10 SWIR channel of VIIRS, ② mean estimated temperature of successful detections (in K), and ③ mean estimated radiant heat RH (in MW). Note the shaded area in ③, which corresponds to summer-time gaps in observations discussed in more detail in Section 4.4.


Figure 10.
VIIRS Nightfire gas flaring data dashboard for the southern oil dehydration and desalting unit of the Vankor oil field in Krasnoyarsk Krai, Russian Federation (67°43′N 83°30′E). (a) High-resolution image of the oil dehydration and desalting unit available in Google Earth. Note that three ground flare stacks and one vertical flare stack in close proximity are aggregated into a single Nightfire detection. (b) Plot Nightfire estimates (x-axis, BCM) with reported flaring data (y-axis, BCM) [47,53,54,55,56,57,58]. Nightfire estimates are a sum of all detected flaring volumes within the Vankor field. Note the difference in scale for the axes. (c) Daily flare dashboard of the flare stack cluster at Vankor southern oil dehydration and desalting unit as shown in (a), containing ① spectral radiance in M10 SWIR channel of VIIRS, ② mean estimated temperature (in K), ③ mean estimated radiant heat RH (in MW), and ④ reported APG utilization rate of the field.

Figure 11.
(a) VIIRS Nightfire gas flares’ mean temperature (in K) relative frequency distribution in Russia for gas flares located at oil and natural gas/gas condensate upstream facilities. Relative frequencies are calculated independently. (b) Gas flaring volume (in BCM) distribution by mean temperature (in K).

Figure 12.
Comparison of VIIRS Nightfire-estimated monthly fluctuations in gas flaring in Russia (a) and the USA (b). The charts present, from top to bottom, monthly variations in flaring volume (in BCM) and its decomposition into the seasonal component, trend, and residuals. Summer data for Russia are interpolated (dashed line). (c,d) show the highest and lowest monthly flaring rates observed in Russia and USA, respectively (dots correspond to annual data, with line being the average date).

Figure 13.
VIIRS Nightfire monthly estimated flaring volumes (in BCM) in Russia and USA in 2020.

Figure 14.
Preliminary analysis of VIIRS Active Fire Product (VAFP) [63] Fire Radiative Power (FRP) estimates for the hotspots detected within VIIRS Nightfire gas flare contours located in Russia in 2019. (a) Plot of VAFP annual weighted monthly mean FRP (FRPWMM; in MW) vs. VIIRS Nightfire annual Radiant Heat (RH; in MW) (N.b. RH from Equation (2) is used instead of RH’ from Equation (4).) Note that the point ID7117 is considered an outlier and is thus excluded from the resulting correlation. (b) Plot VAFP monthly FRPWMM (MW) vs. VIIRS Nightfire monthly RH (MW) for gas flares that remain confidently detectable with Nightfire in June (roughly latitudes < 55°N). (c) Plot night-time vs. daytime monthly VAFP FRPWMM (MW) in August and September. (d) Histogram monthly day and night-time distribution of raw (non-weighted) FRP (in GW) and graph VAFP detection tally within VIIRS Nightfire gas flare contours.

Publisher’s Note: MDPI stays neutral with regard to jurisdictional claims in published maps and institutional affiliations. |
© 2021 by the authors. Licensee MDPI, Basel, Switzerland. This article is an open access article distributed under the terms and conditions of the Creative Commons Attribution (CC BY) license (https://creativecommons.org/licenses/by/4.0/).
Share and Cite
MDPI and ACS Style
Zhizhin, M.; Matveev, A.; Ghosh, T.; Hsu, F.-C.; Howells, M.; Elvidge, C. Measuring Gas Flaring in Russia with Multispectral VIIRS Nightfire. Remote Sens. 2021, 13, 3078. https://0-doi-org.brum.beds.ac.uk/10.3390/rs13163078
AMA Style
Zhizhin M, Matveev A, Ghosh T, Hsu F-C, Howells M, Elvidge C. Measuring Gas Flaring in Russia with Multispectral VIIRS Nightfire. Remote Sensing. 2021; 13(16):3078. https://0-doi-org.brum.beds.ac.uk/10.3390/rs13163078
Chicago/Turabian StyleZhizhin, Mikhail, Alexey Matveev, Tilottama Ghosh, Feng-Chi Hsu, Martyn Howells, and Christopher Elvidge. 2021. "Measuring Gas Flaring in Russia with Multispectral VIIRS Nightfire" Remote Sensing 13, no. 16: 3078. https://0-doi-org.brum.beds.ac.uk/10.3390/rs13163078
Note that from the first issue of 2016, this journal uses article numbers instead of page numbers. See further details here.