Article

Retrieving Water Turbidity in Araucanian Lakes (South-Central Chile) Based on Multispectral Landsat Imagery

by
Lien Rodríguez-López
1,*,
Iongel Duran-Llacer
2,
Lisdelys González-Rodríguez
3,
Rolando Cardenas
4 and
Roberto Urrutia
2
1
Facultad de Ingeniería y Tecnología, Universidad San Sebastián, Lientur 1457, Concepción 4030000, Chile
2
Environmental Sciences Center (EULA), University of Concepcion, Concepcion 4030000, Chile
3
Faculty of Engineering, University of Concepcion, Concepcion 4030000, Chile
4
Facultad de Matemática-Física-Computación, Universidad Central Marta Abreu de las Villas, Santa Clara 50100, Villa Clara, Cuba
*
Author to whom correspondence should be addressed.
Remote Sens. 2021, 13(16), 3133; https://0-doi-org.brum.beds.ac.uk/10.3390/rs13163133
Submission received: 19 June 2021 / Revised: 1 August 2021 / Accepted: 2 August 2021 / Published: 7 August 2021
(This article belongs to the Special Issue Remote Sensing of Lake Properties and Dynamics)

Abstract

:
Remote sensing was used as an early alert tool for water clarity changes in five Araucanian Lakes in South-Central Chile. Turbidity records are scarce or unavailable over large and remote areas needed to fully understand the factors associated with turbidity, and their spatial-temporal representation remains a limitation. This work aimed to develop and validate empirical models to estimate values of turbidity from Landsat images and determine the spatial distribution of estimated turbidity in the selected Araucanian Lakes. Secchi disk depth measurements were linked with turbidity measurements to obtain a turbidity dataset. This in turn was used to develop and validate a set of empirical models to predict turbidity based on four single bands and 16 combination bands from 15 multispectral Landsat images. The best empirical models predicted turbidity over the range of 0.3–12.3 NTUs with RMSE values around 0.31–1.03 NTU, R2 (Index of Agreement IA) around 0.93–0.99 (0.85–0.97) and mean bias error (MBE) around (−0.36–0.44 NTU). Estimation maps to analyze the temporal-spatial turbidity variation in the lakes were constructed. Finally, it was found that the meteorological conditions may affect the variation of turbidity, mainly precipitation and wind speed. The data indicate that the turbidity has slightly increased in winter–spring. These models will be used in the future to reconstruct large datasets that allow analyzing transparency trends in those lakes.

1. Introduction

The characteristics of water regulate the metabolism of lakes; the modifications of the aquatic environment are produced as a response to climatic and geographical variations [1]. Water quality monitoring in continental aquatic ecosystems using satellite image processing is a tool that can be employed as an early alert system for changes in lakes [2]. One important characteristic in an aquatic environment is the water clarity. Generally, the clarity is quantified by the Secchi disk depth (SDD) or turbidity parameter and is mainly caused by increases/decreases in the concentration of suspended sediments, algae, and organic matter [3,4]. Reductions in water clarity can inhibit sunlight absorption in lakes, thereby slowing radiant heating of lakes, reducing light penetration, and primary productivity [5]. Halted or reduced primary productivity means a decrease in plant survival and dissolved oxygen output. Other impacts are the regrowth of pathogens [6], habitat quality [7], and water bodies’ recreational use [8]. In Landsat images, high concentrations of algae are associated with decreased radiance because of the chlorophyll absorption in this region [9].
Turbidity is an optical characteristic of water clarity [1] and is a measurement of the amount of light that is scattered by particles in the water column. When higher the intensity of scattered light, the higher the turbidity, it is reported in nephelometric turbidity units (NTU). Changes (increases or decreases) can negatively impact biological components of the system that may be adapted to specific light-penetrating conditions [9]. In general, in high transparency lakes, greater photoinhibition is expected than in less transparent lakes since, in the latter, suspended particles could interfere with the light transmission [10]. Therefore, turbidity is an indicator of water pollution and an important water quality parameter in oligotrophic lakes [11].
In situ measurements of the water irradiance profile for underwater light is typically costly and time-consuming, limiting its spatial and temporal representation over large and remote areas. Satellite image processing has made it possible to obtain an early warning system for water quality changes in aquatic ecosystems [5]. Several studies have been carried out to estimate water quality parameters such as chlorophyll a (Chl-a) and turbidity in various aquatic ecosystems using remote sensing reflectance [12,13,14]. The spatial distribution and dynamics of several water quality parameters in Chile were investigated by [15] in Lake Vichuquén lake, and Panguipulli lake by [16]. Recently, ref. [17] showed a simple accurate method for evaluation of the Chl-a level from the Normalized Difference Vegetation Index (NDVI) and Green Normalized Difference Vegetation Index (GNDVI) in Laja Lake. These studies demonstrated the use of remote sensing for the monitoring of water quality parameters in northern Patagonia lakes. This allows information of remote places to be obtained, then to perform repetitive monitoring to study dynamic processes and reduce the efforts and costs of field data collection, an area in which Chile most needs research effort.
Chile has several lake districts that play an important role as freshwater reservoirs and in the provision of multiple ecosystem services. Throughout the extensive Chilean territory, several lake systems can be distinguished from north to south, Nahuelbutan lake district [18]; Araucanian Lake district [19]; Chiloé lake district [20]; Torres del Paine or Patagonian lakes district [21]. Among these the most relevant in terms of magnitude, extension, beauty, economic and environmental importance are the “Araucanian lakes” so named by the Swedish psychologist and limnologist Kuno [19]. There is an insufficient effort to monitor the lakes in Chile due to the limitation in resources and research. According to Ref. [22], only 20 of the 375 lakes are monitored by the General Water Directorate of Chile (DGA). Working on this shortcoming, remote sensing has become an alternative for continuous monitoring in these invaluable water quality systems [16,17]. It is a field in which much remains to be explored.
To address this need, the aims of this paper are as follows: (1) analyze in situ limnology parameters in five lakes study within South-Central Chile, (2) develop and validate empirical models to estimate values of turbidity from Landsat satellite images and (3) evaluate the spatial distribution of estimated turbidity in these continental aquatic ecosystems. The establishment of simple models with high accuracy and known error will help the rapid, accurate and real-time assessment of water quality using in situ and remote-sensing techniques. The spatial distribution and seasonal dynamics of limnological parameters allow for generation of a knowledge base to decide on environmental protection actions in order to control the trophic state of the lakes and their sustainable use.

2. Materials and Methods
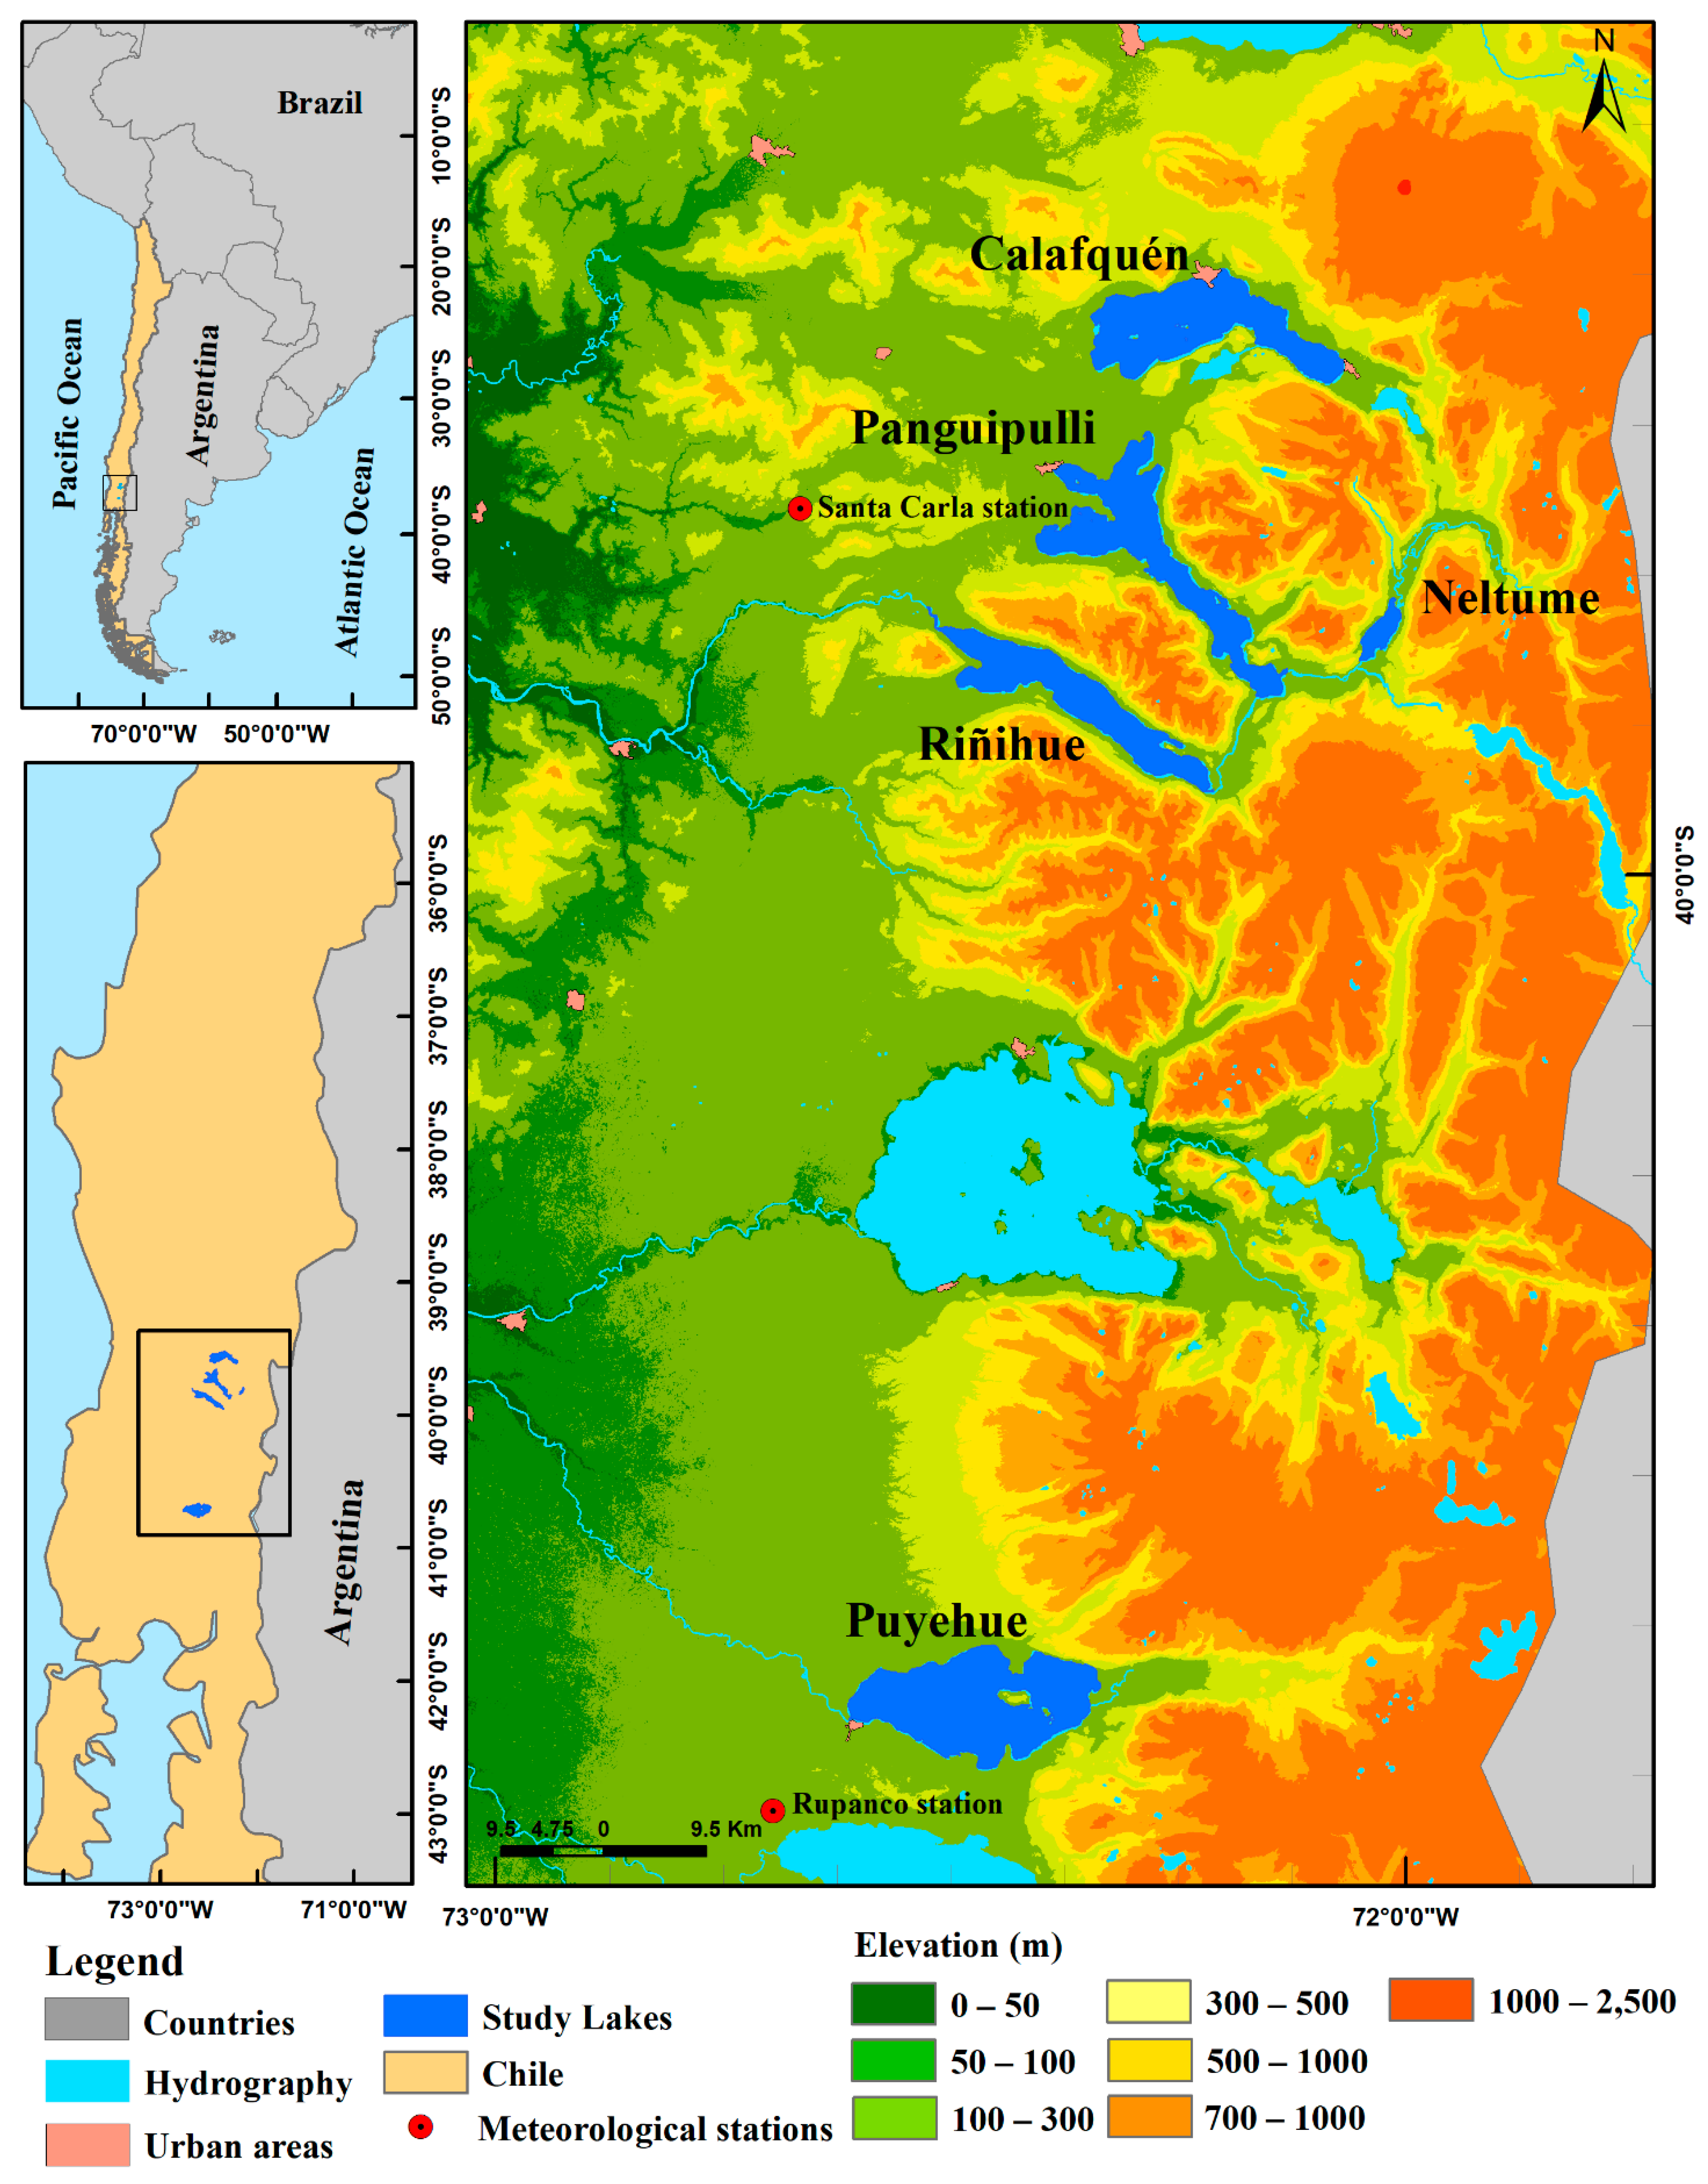
2.1. Study Area

Chilean Araucanian Lakes is a group of lakes of glacial origin dating to some 11,000 years ago [23]. They are located between 39–42°S and 71–72°W in the Los Rios Region with elevations between 117 and 203 m above sea level (m.a.s.l) (see Table 1). The lakes are characterized by oligotrophic conditions [24] and are notable for great depth (86–323 m). For this study, 5 lakes of the Araucanian district, order from the north to the south: Calafquén, Neltume, Riñihue, Panguipulli and Puyehue were selected, as shown in Figure 1. These lakes were selected due to the availability of data during the study period. The lakes are subject to a temperate monomictic thermal regime with winter circulation and a stratification period in late spring and summer. A strong thermocline separates an oxygen-supersaturated epilimnion from a large cold hypolimnion [25]. The thermal regime, the low concentration and the orthograde distribution of the chemical factors classify these lakes as monomictic and oligotrophic temperate. The transparency is high and the average SDD varies between 6.6 and 21 m. In general, the water is colorless (0 Pt units) and on the Forel scale occupies the range between 6 and 7 (blue-green). The regional climate is characterized by humid temperate conditions with Mediterranean influence. The average rainfall of 2000 mm/year and an average annual temperature that fluctuates between 6 and 9 °C, with maximums in January (20 °C) and minimums in July (2 °C) according to Dirección Meteorológica de Chile (DMC, http://www.meteochile.cl/, accessed on 1 March 2021).

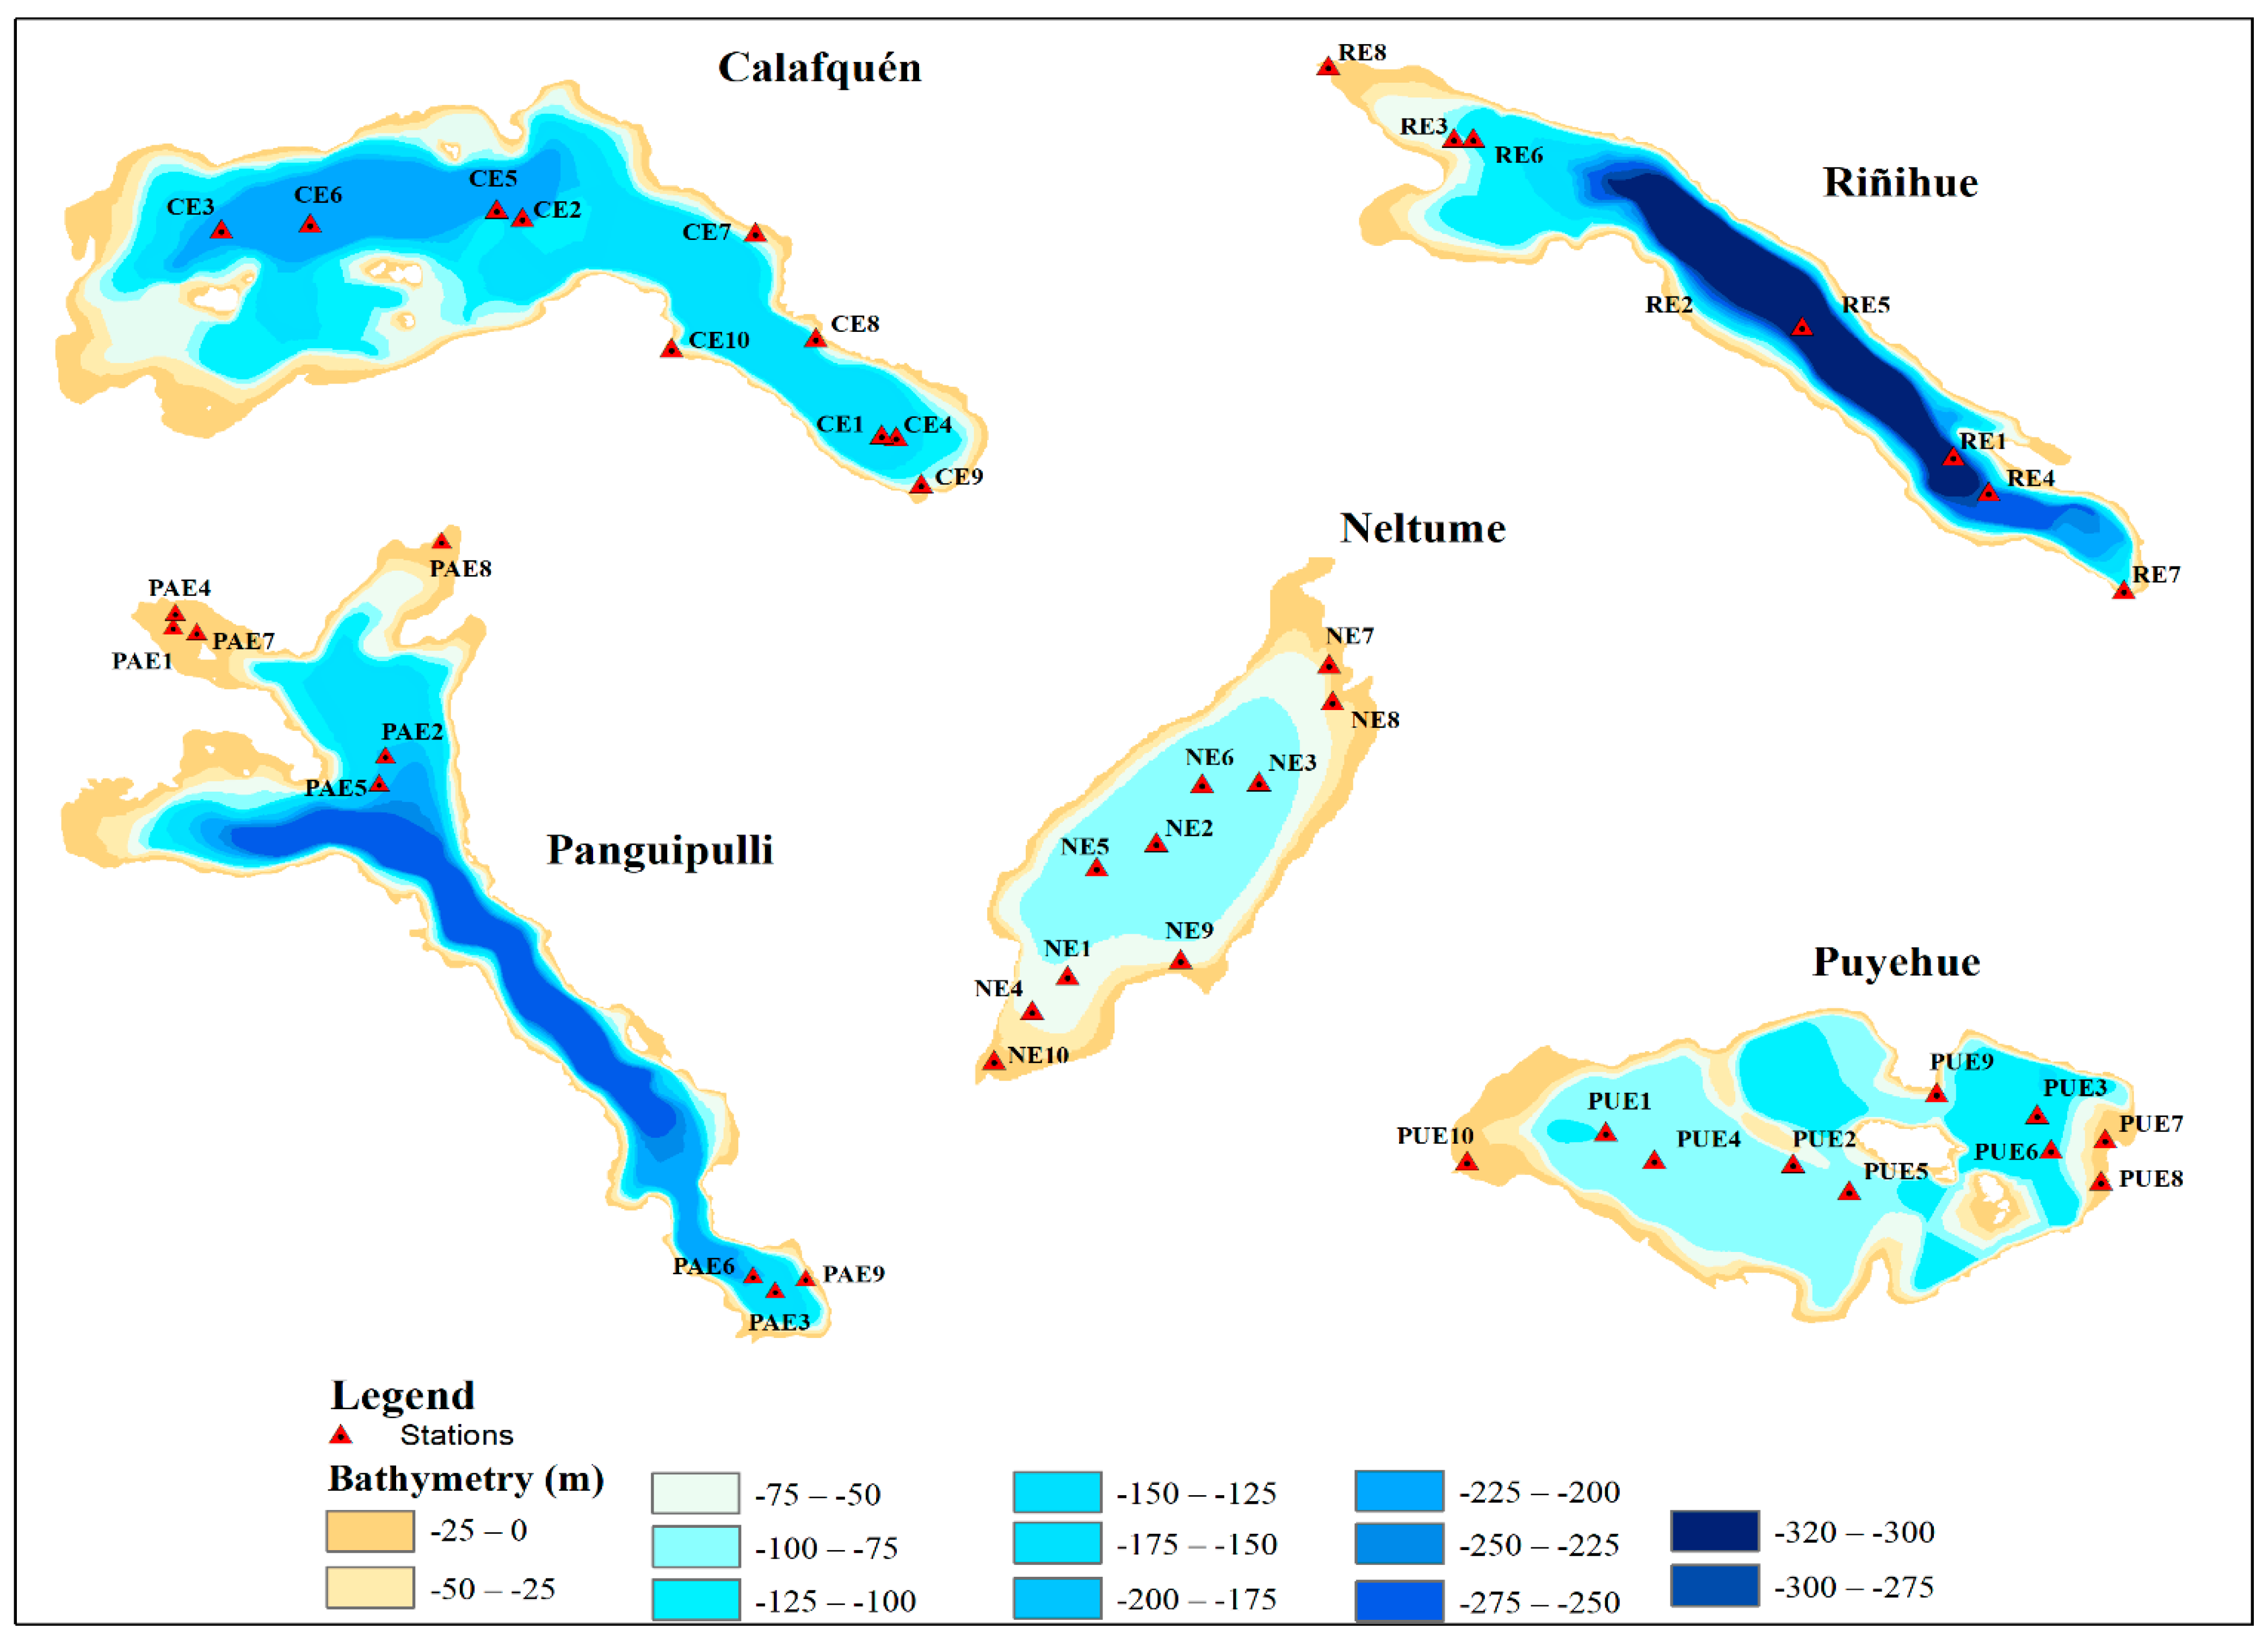
2.2. Sampling Measurements

Seven monitoring campaigns during the 2015 year were conducted by the EULA Center of the University of Concepcion. Therefore, all seasons were covered. The monitored parameters were surface temperature (2250 B standard methods 22 Ed. thermometry, method used as a reference for temperature analysis according to NCh 2313 compendium), surface Chl-a (fluorometric method), transparency (measured by SDD), profiles Chl-a and temperature, (Multiparametric Probe Seabird 19 Plus). Data were collected from different sampling stations for each lake in addition to stations in the respective tributaries (tributaries and effluents) according to the characteristics of these aquatic ecosystems showed in Figure 2. The locations were selected in the field considering the following criteria:
1.
Morphology of the lake.
2.
Presence of tributaries (away from their influence).
3.
Presence of industrial effluents or urban discharges.
4.
Depth.
At each of the lake stations, water samples were collected at 5 depths using a 5 L Niskin sampling bottle. The samples were stored and transported in thermally insulated boxes, duly refrigerated with ice at a temperature of approximately 5 °C for subsequent analysis. The chemical analyses were carried out in the chemistry laboratory of the EULA-Center Chile. This laboratory accredited by the National Institute of Normalization for the Chilean Norm NCh ISO 17.025 of 2005.

2.3. Image Acquisition and Processing

A total of 15 multispectral Landsat images, 13 by L8 OLI (Operational Land Imager) and 2 by L5 TM (Thematic Mapper) with a 30 × 30 m resolution, obtained from the official site of the United States Geological Survey (USGS) Earth-Explorer (https://earthexplorer.usgs.gov/) accessed on 20 December 2020 were used. The study area is covered by three scenes with the following path/row: 233/88, 233/87 and 232/88. The selected images were chosen according to quality, availability, a low percentage of cloud cover (0–12%) and proximity to the sampling date (within a ±14 days difference of satellite overpasses). To mask clouds, cirrus and shadows, the quality assessment (QA) bands were used and confirmed with a visual inspection. Only data that was outside of cloud cover were used. The lake’s edge was established using geospatial information from the DGA. Although the satellite images covered an area greater than the lake, only the water body was considered in the analysis.
Images preprocessing was carried out using ENVI 5.3 (Environment for Visualizing Images), ArcGIS (ESRI’s v. 10.8.1) software tools and began with geometric correction (reprojection to the UTM-WGS84 coordinates system, zone 19S) [26]. Radiometric calibration is a common pre-processing step that attempts to compensate for radiometric errors from sensor defects, variations in scan angle, and system noise to produce an image that represents the true spectral radiance at the sensor [27,28,29]. Therefore, radiometric calibration to L5 TM images was carried out in accord with [28,29] and to L8 OLI images, across the instructions proposed by the USGS [30] in Landsat 8 Data Users Handbook v.5, converting the original digital number (DN) of each band to radiance values and then transforming them to top-of-atmosphere (TOA) reflectance values, that include a correction for solar angle and use of the rescaling factors and parameters found in the MTL.txt file [30,31]. The atmospheric correction continued with the Dark Object Subtraction (DOS) technique [32]. This method is based on some pixels in the image being in complete shadow and their radiances received at the satellite are due entirely to atmospheric scattering. Therefore, this value is subtracted from each pixel value in the image [31]. DOS is widely used in research applied to the water quality of aquatic ecosystems with remote sensing, such as [31,33,34]. With the corrected bands the calculation of simple bands, spectral indices and band combination was selected according to a literature review [5,33,34,35]. Table 2 present the Landsat images selected and in situ measurements date.

2.4. Standardization of Existing Water Clarity Measurements

Field measurements of water clarity via SDD were acquired by the DGA between 2011 and 2012 (Calafquén, Panguipulli, Riñihue) and 2012–2013 (Puyehue, Neltume). Measurements of water clarity via SDD and NTU were acquired on 25 January 2011 (Calafquén, Panguipulli, Riñihue) (n = 28) and 8 January 2013 (Puyehue, Neltume) (n = 28). To standardize the different measures of water clarity, we developed a linear function between SDD and NTU measures using the samples collected in January corresponding to 2011 and 2013 following the methodology proposed by [5]. The resulting function was used to convert in situ SDD measurements into correlative NTU.

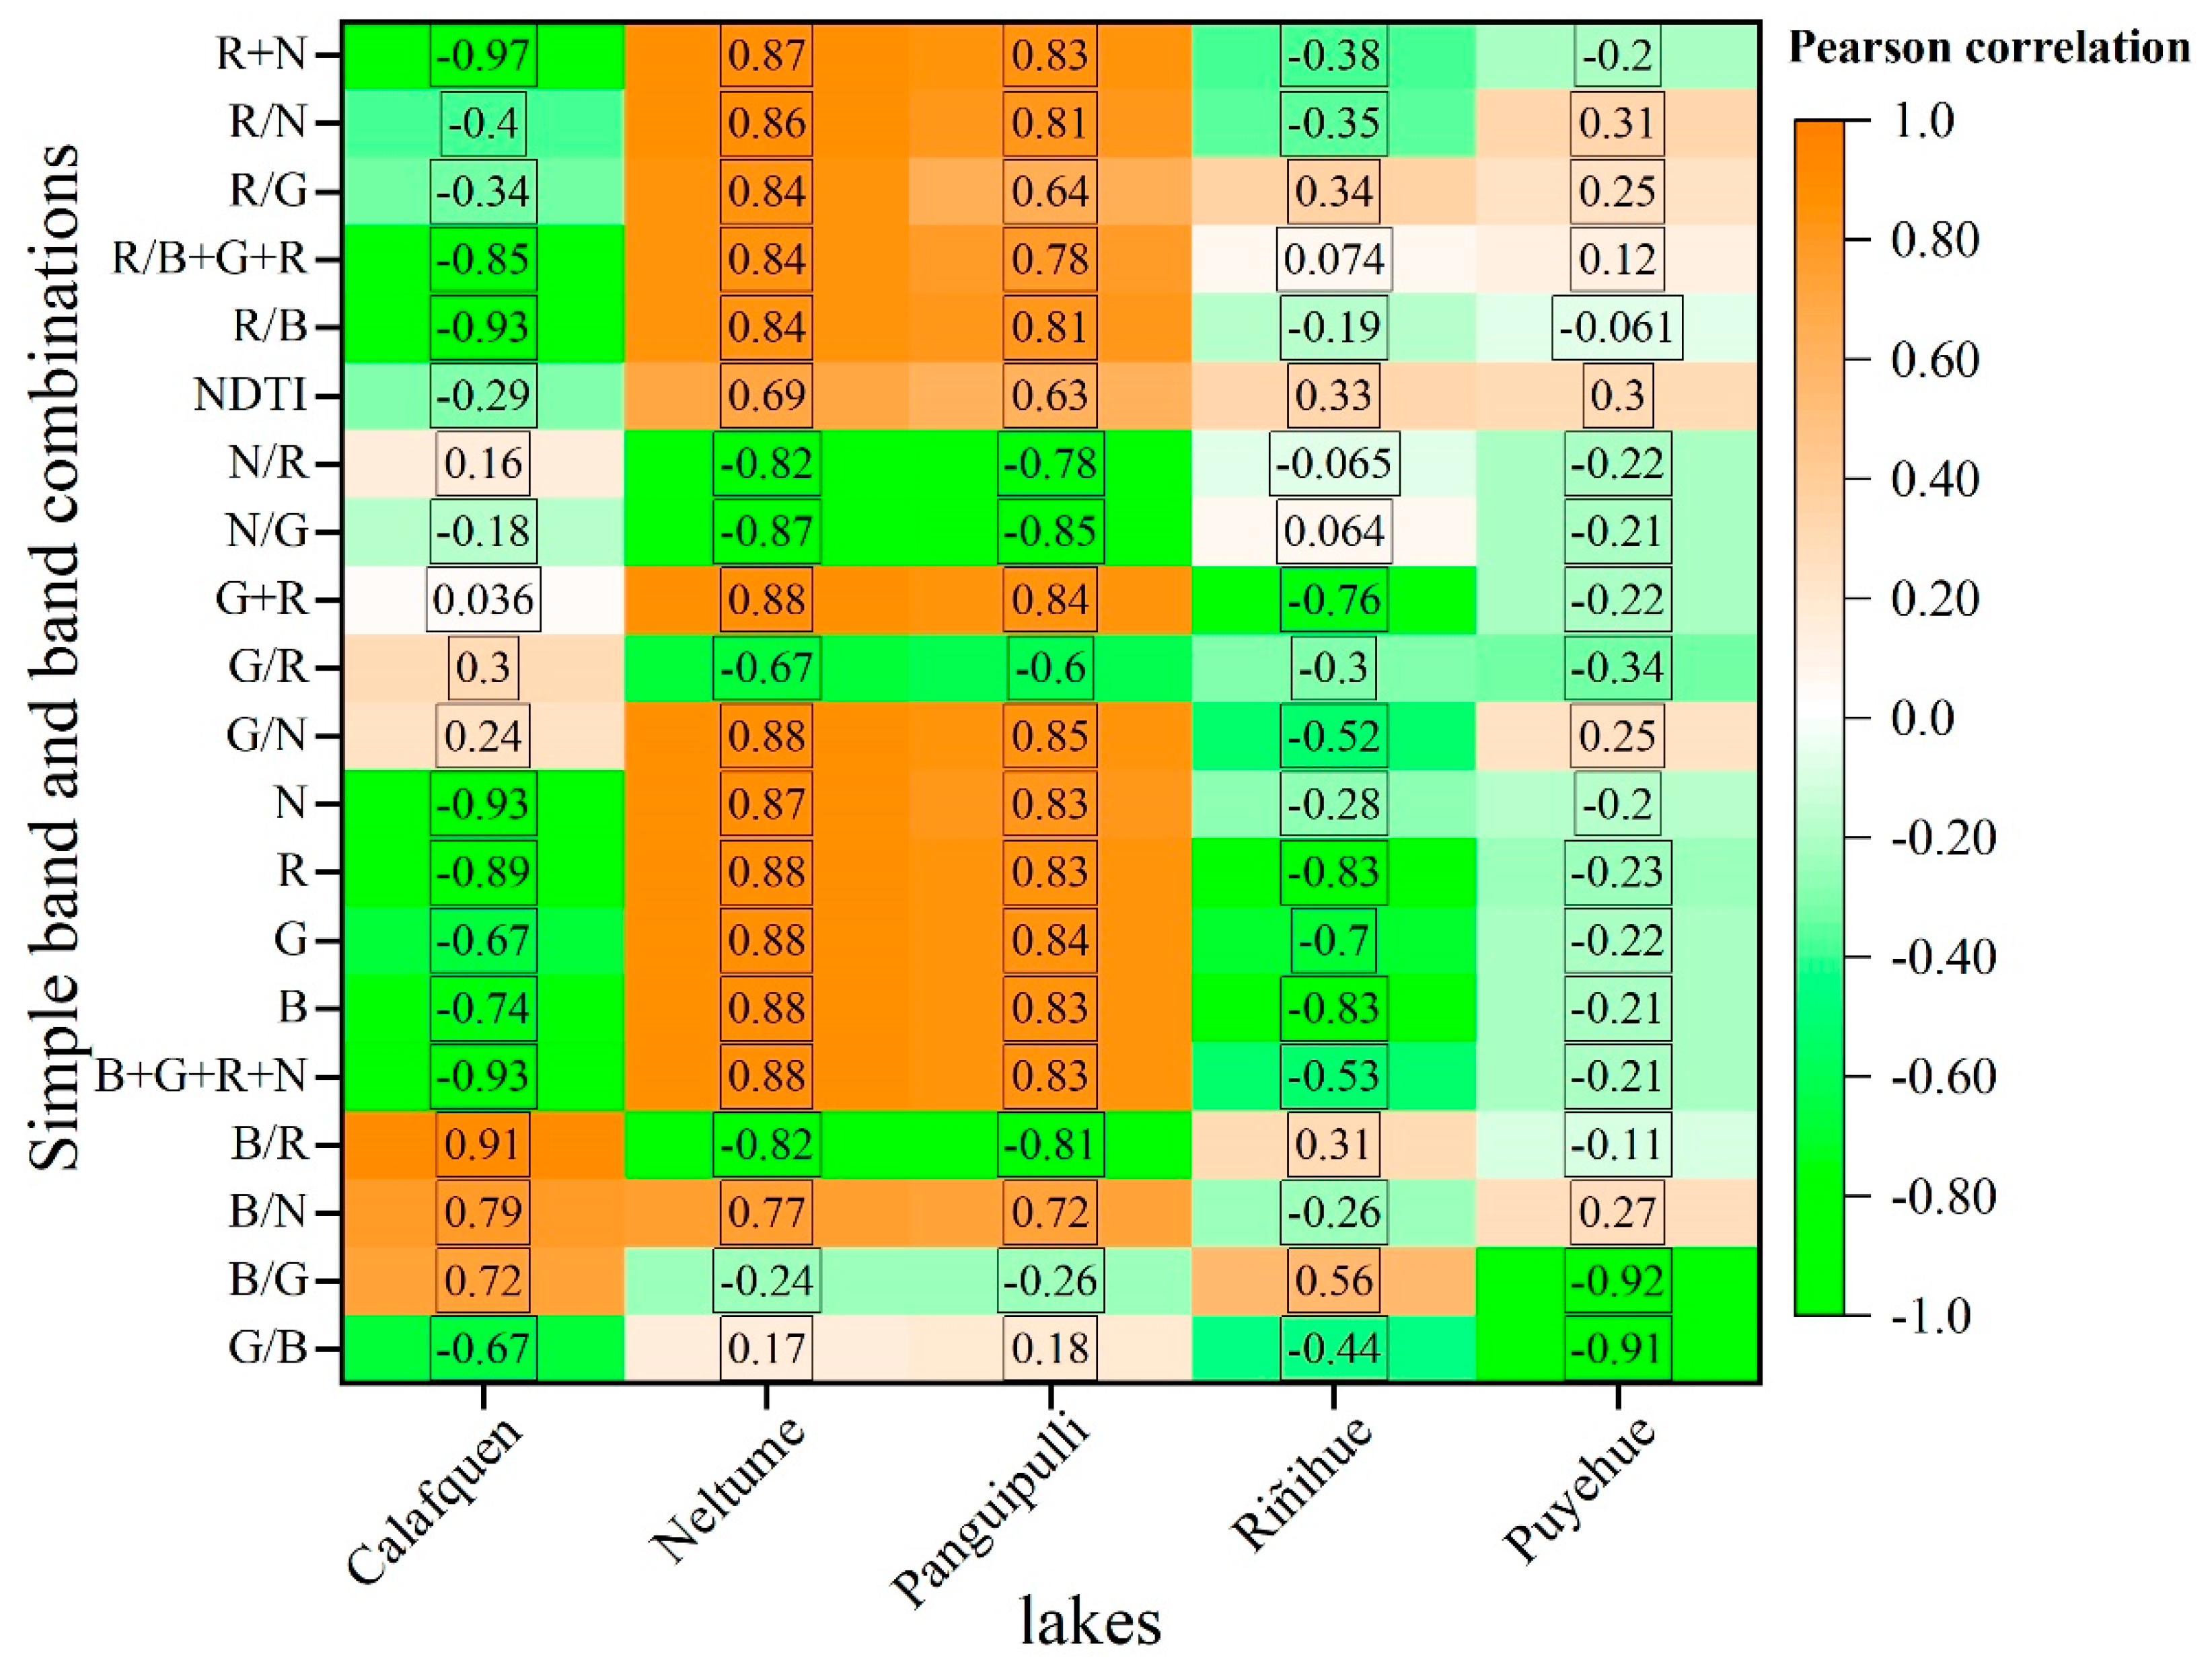
2.5. Band Combinations, and Turbidity Index

Correlative NTU values were correlated to the corresponding cell value of four (n = 4) independent bands (blue (B), green (G), red (R) and Near Infrared (N)) and sixteen (n = 16) different band combinations consisting of bands B to N, including the Normalized Difference Turbidity Index (NDTI) which is calculated as (R − G)/(R + G) [5]. A simple regression to develop a relation between in situ NTU measurements and space-based observations was used [33,36]. These bands and band combinations are regularly employed to detect turbidity in water bodies [4,5,37]. The Pearson correlation coefficient (r) was used to evaluate the correlation between NTU values and 20 independent bands, band combinations and NDTI.

2.6. Empirical Models and Validation

In situ datasets and the preprocessed Landsat 8 images (11) during the monitoring campaigns in 2015 were used to develop a set of empirical models for obtaining turbidity or NTU. To reduce the possible errors in geometric correction of Landsat images and the dynamics of water bodies, we used a sampling window with the 3 × 3 pixel mean to extract the surface reflectance of the bands, band combinations, and NDTI spectral index (i.e., the preprocessed Landsat data) according to [4]. The data selection for internal validation/training and external validation/prediction was conducted according to the methodology proposed by [38], which was the most useful of the several data selection strategies that were tested in this study. The resulting data set consisted of the NTU response variable (from the SDD) and best band or band combinations predictors for each lake of the 4 selected images (2011–2013), resulting in 4 × 3 matrices. The strategy consists of randomly selecting 70% of the data as the calibration series, with the remaining 30% serving as the validation series. The models were evaluated based on the coefficient of determination (R2), index of agreement (IA), mean bias error (MBE) and root mean square error (RMSE). The RMSE is frequently used to compare the forecasting errors of different NTU models [37,39,40]. In general, the RMSE quantifies the dispersion between simulated and measured data, where low RMSE values indicate better model performance. Negative (Positive) MBE indicates that the model results underestimate (super-estimate) measurements. An IA value close to 1 indicates a more efficient model [41]. All statistical analysis and figures in this study were realized in Origin Pro 2021 version 9.8.0.200 (Academic) software. Finally, estimated turbidity maps were obtained from the models, using ArcGIS 10.8.1 software.

2.7. Water Clarity and Meteorological Conditions

Seasonal meteorological factors such as wind speed (WS) and precipitation impact water turbidity [42], due to their ability to affect the movements of sediments. For example, in Lobo reservoir [43] it was observed that maximum particulate and organic matter resuspension is caused by turbulence on days of high wind speed. In reference [44] it is said that the turbidity of the surface layer is attributed to the decrease in incoming water caused by the decrease in rainfall, which, in turn, causes a decrease in the buoyancy of the hydrothermal plumes. In addition, it could cause a reduction in the supply of sediment from runoff. To analyze climatic factors influencing variations in estimated turbidity, meteorological data on precipitation and wind direction/speed were used. The meteorological data analyzed were obtained from Dirección Meteorológica de Chile (DMC, https://climatologia.meteochile.gob.cl/) accessed on 20 December 2020 and Instituto Nacional de Investigaciones Agrarias (INIA, https://agrometeorologia.cl/) accessed on 26 December 2020. The wind direction/speed and precipitation data (e.g., on the day, on the last 3 days when the satellite image was captured) were taken from stations close to study lakes, Santa Carla station (−39.67°S, 72.61°W, 264 m.a.s.l) representative to (Calafquén, Neltume, Panguipulli, and Riñihue lakes) and Rupanco or Rucatayo stations (−40.74°S, −72.66°W, 272 m.a.s.l) representative of the conditions of Puyehue lake (see Figure 1).

3. Results

3.1. Behavior In Situ Limnology Parameters at Sampling Stations in the Study Lakes

Table 3 shows the average of SDD, Chl-a, NTU and temperature values obtained in the monitoring campaigns during 2015. The behavior of temperature fluctuated between 14.9 ± 5.6–16.1 ± 4.4 °C with a maximum value of 25.9 °C in Neltume lake. Water clarity during all campaigns was measurement via SDD and indicate that the average fluctuated between 11.9 ± 5.8 m (Calafquén) to 6.8 ± 2.8 m (Puyehue) lakes. These aquatic ecosystems also presented the highest and lowest values of transparency (SDD) at 17.0 m and 2.5 m. The average Chl-a values fluctuated between 0.5–0.8 μg/L for Riñihue and Calafquén lakes. The NTU values during 2015 were estimated through the relationship between SDD and NTU. The average values of NTU ranged from 1.5 ± 1.0 NTU until 9.2 ± 1.6 NTU for Puyehue and Neltume lakes. Hence, the trophic state of the studied lakes can be classified as oligotrophic or ultra-oligotrophic, with low nutrient levels and productivity.

3.2. In Situ Secchi Disk Depth (SDD) Measurements into Correlative Nephelometric Turbidity Units (NTU)

A strong negative correlation (r > −0.92) was found between SDD measurements and simultaneous NTU measurements (see Table 4). This relation allowed us to derive NTU values for all SDD data collected during other sampling periods.

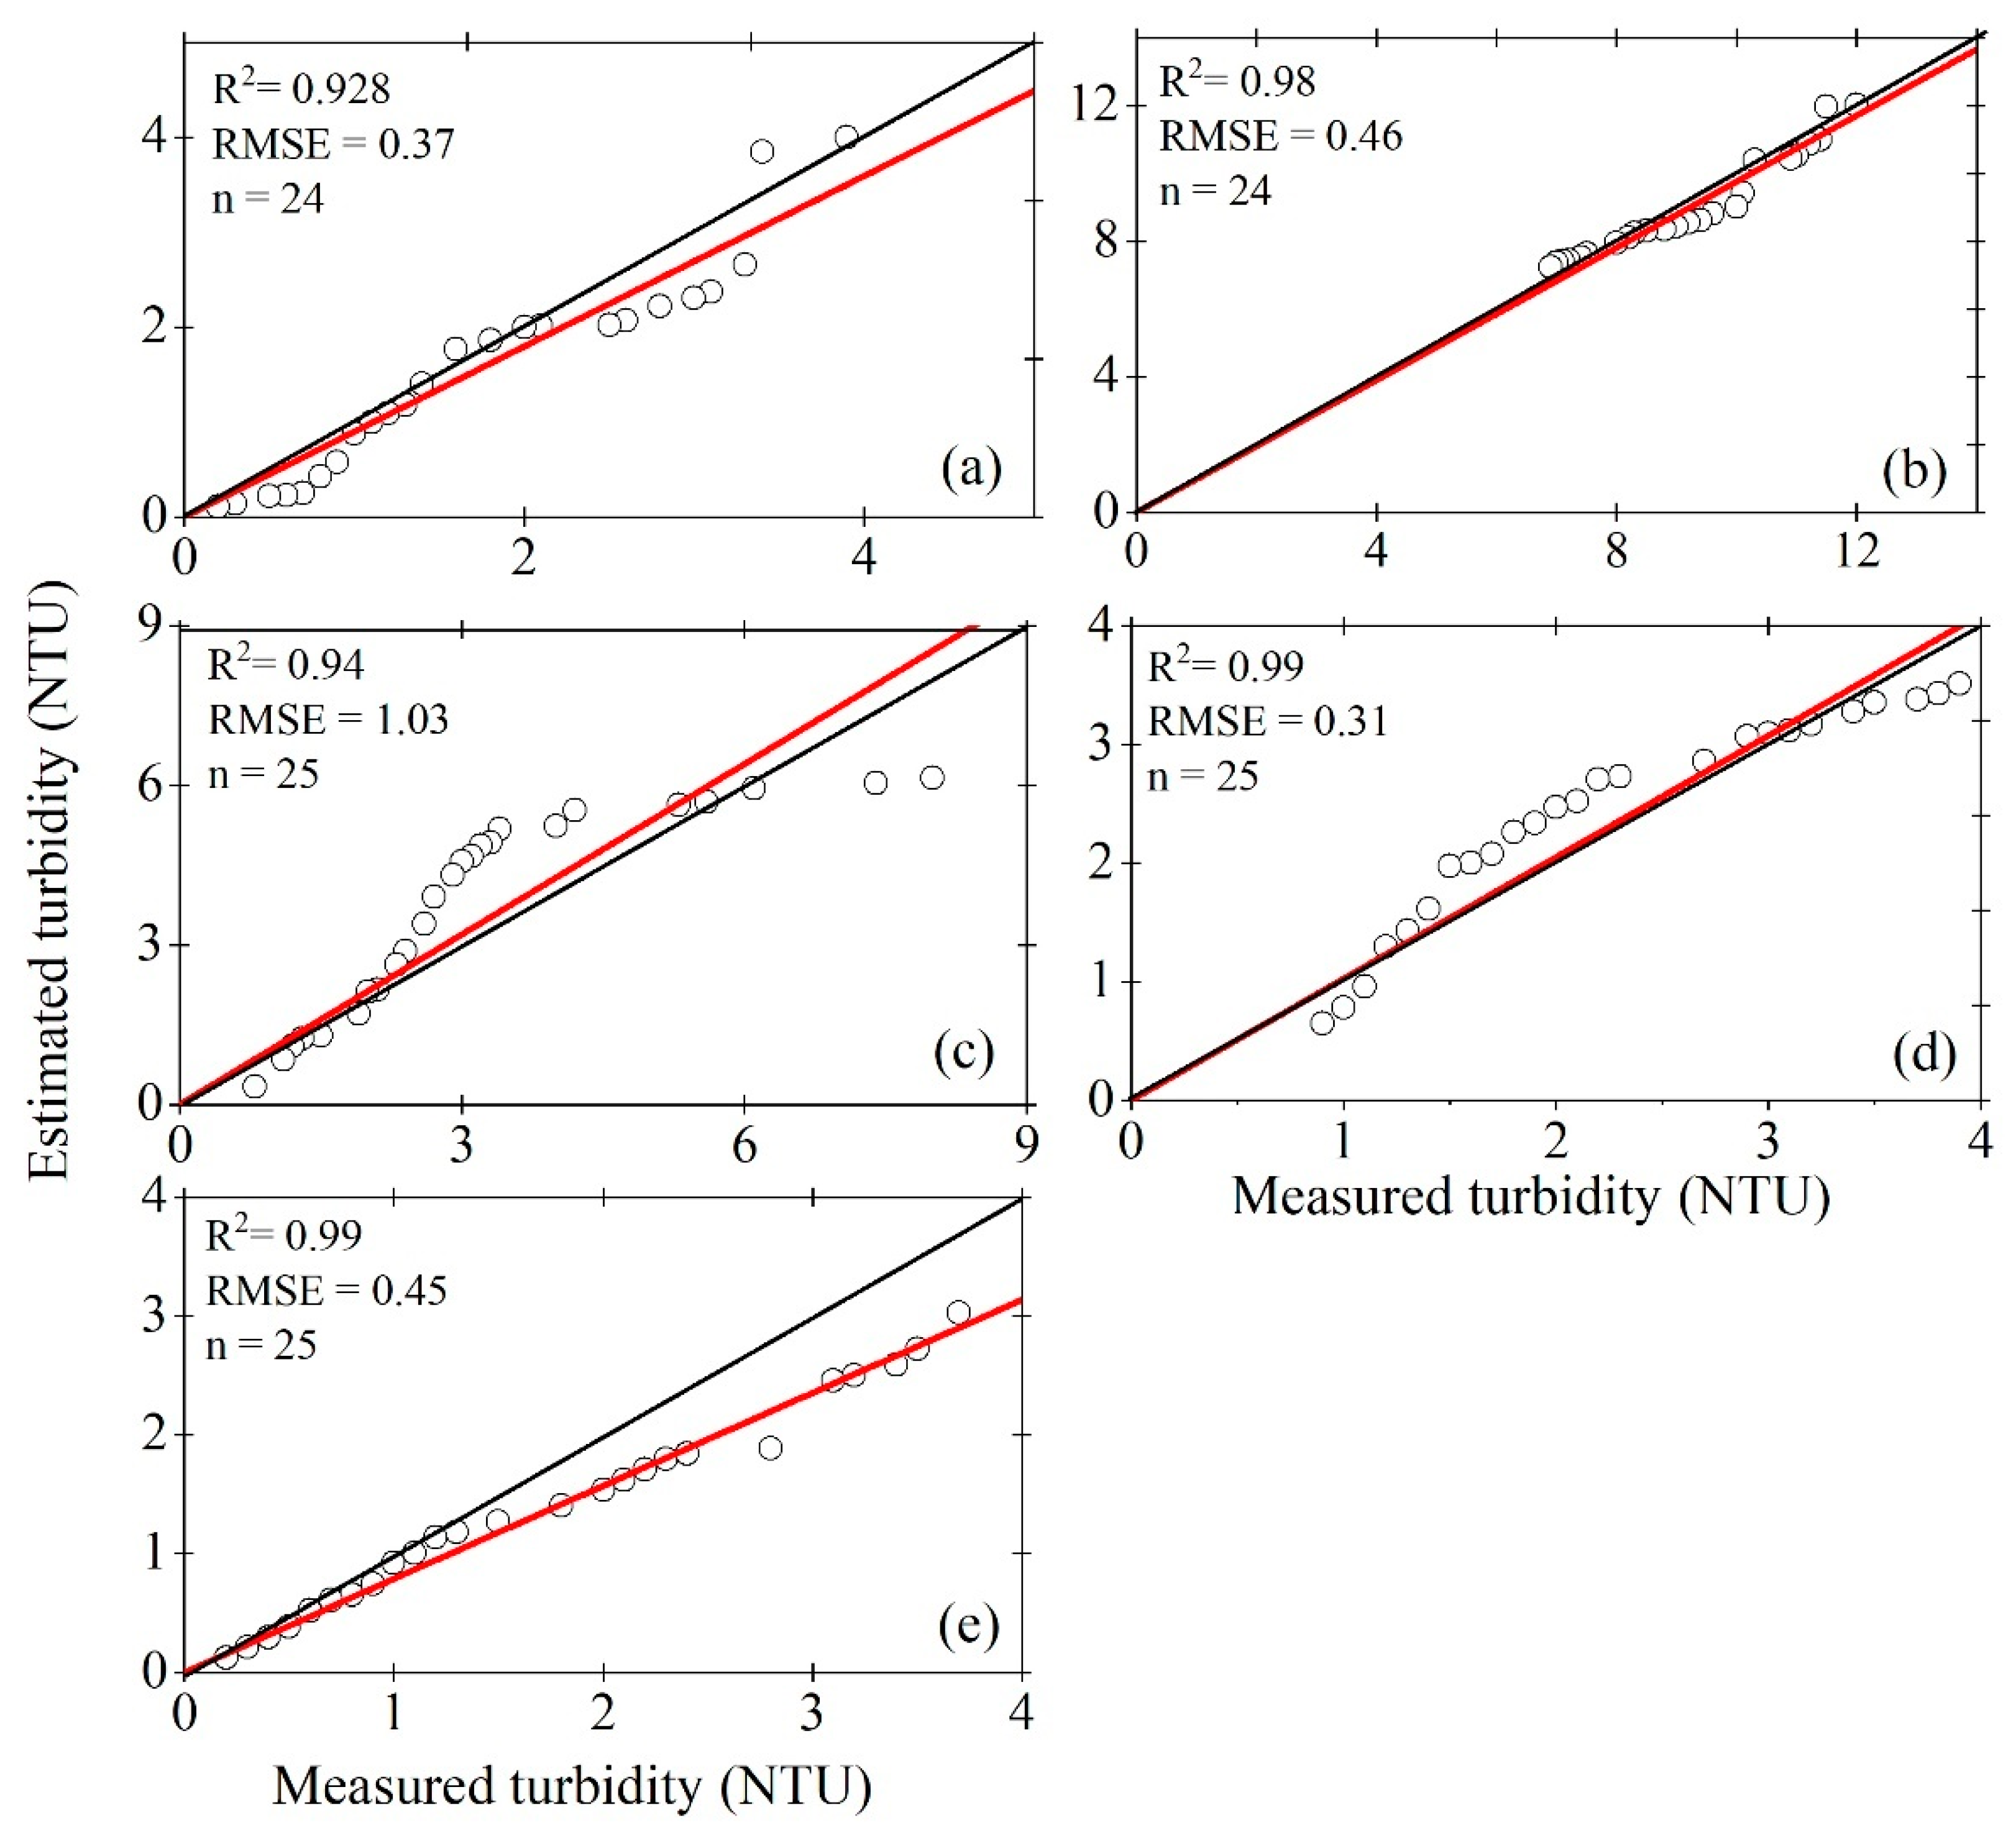
3.3. Empirical Models and Validation

Figure 3 shows the Pearson correlation between the turbidity variable and 4 band/16 band combinations/NDTI from the processing of the 11 satellite images. Significant band correlations included various combinations of the blue, green, red and near-infrared bands. For Calafquén lake, twelve significant turbidity relationships were ranging from −0.67 to 0.97 (p-value ≤ 0.001). Neltume and Panguipulli lakes had 16 significant correlations (p-value ≤ 0.001) and three (p-value ≤ 0.01) ranging from −0.67 to 0.88 and 0.60 to 0.85, respectively. Riñihue lake had four significant correlations with a significance level (p-value ≤ 0.001) ranging from −0.76 to −0.83 and three correlations of (p-value ≤ 0.01). Meanwhile the Puyehue lake only had two significant correlations r = −0.91 (p-value ≤ 0.001). For more detail on the significance level look at Figure S1.
The performance of the five best models was evaluated based on determination coefficient (R2), RMSE, IA and MBE as shown in Table 5. The empirical models showed highest R2 and IA values ranged between 0.93 to 0.99, and 0.85 to 0.97 respectively, which indicates a good score for all models. An inspection of Table 5 reveals that the model underestimates the NTU measurements at Calafquén, Neltume and Puyehue lakes and super-estimate in Panguipulli and Riñihue lakes. However, the MBE values were smallest. Similarly, the RMSE values were lowest ranged between 0.31 NTU to 1.03 NTU. Therefore, the estimated NTU values are close to the observed values.
Figure 4 presents the scatter plots comparing satellite-derived and in-situ measured turbidity. The values showed a high coefficient of determination (R2 > 0.93), suggesting that all models predict NTU values very well. Therefore, the models can be used as an early warning tool for changes in water clarity. Indeed, reached a better or similar R2 than other regression equations for the NTU models from Landsat-8 shown by [5,37,39].

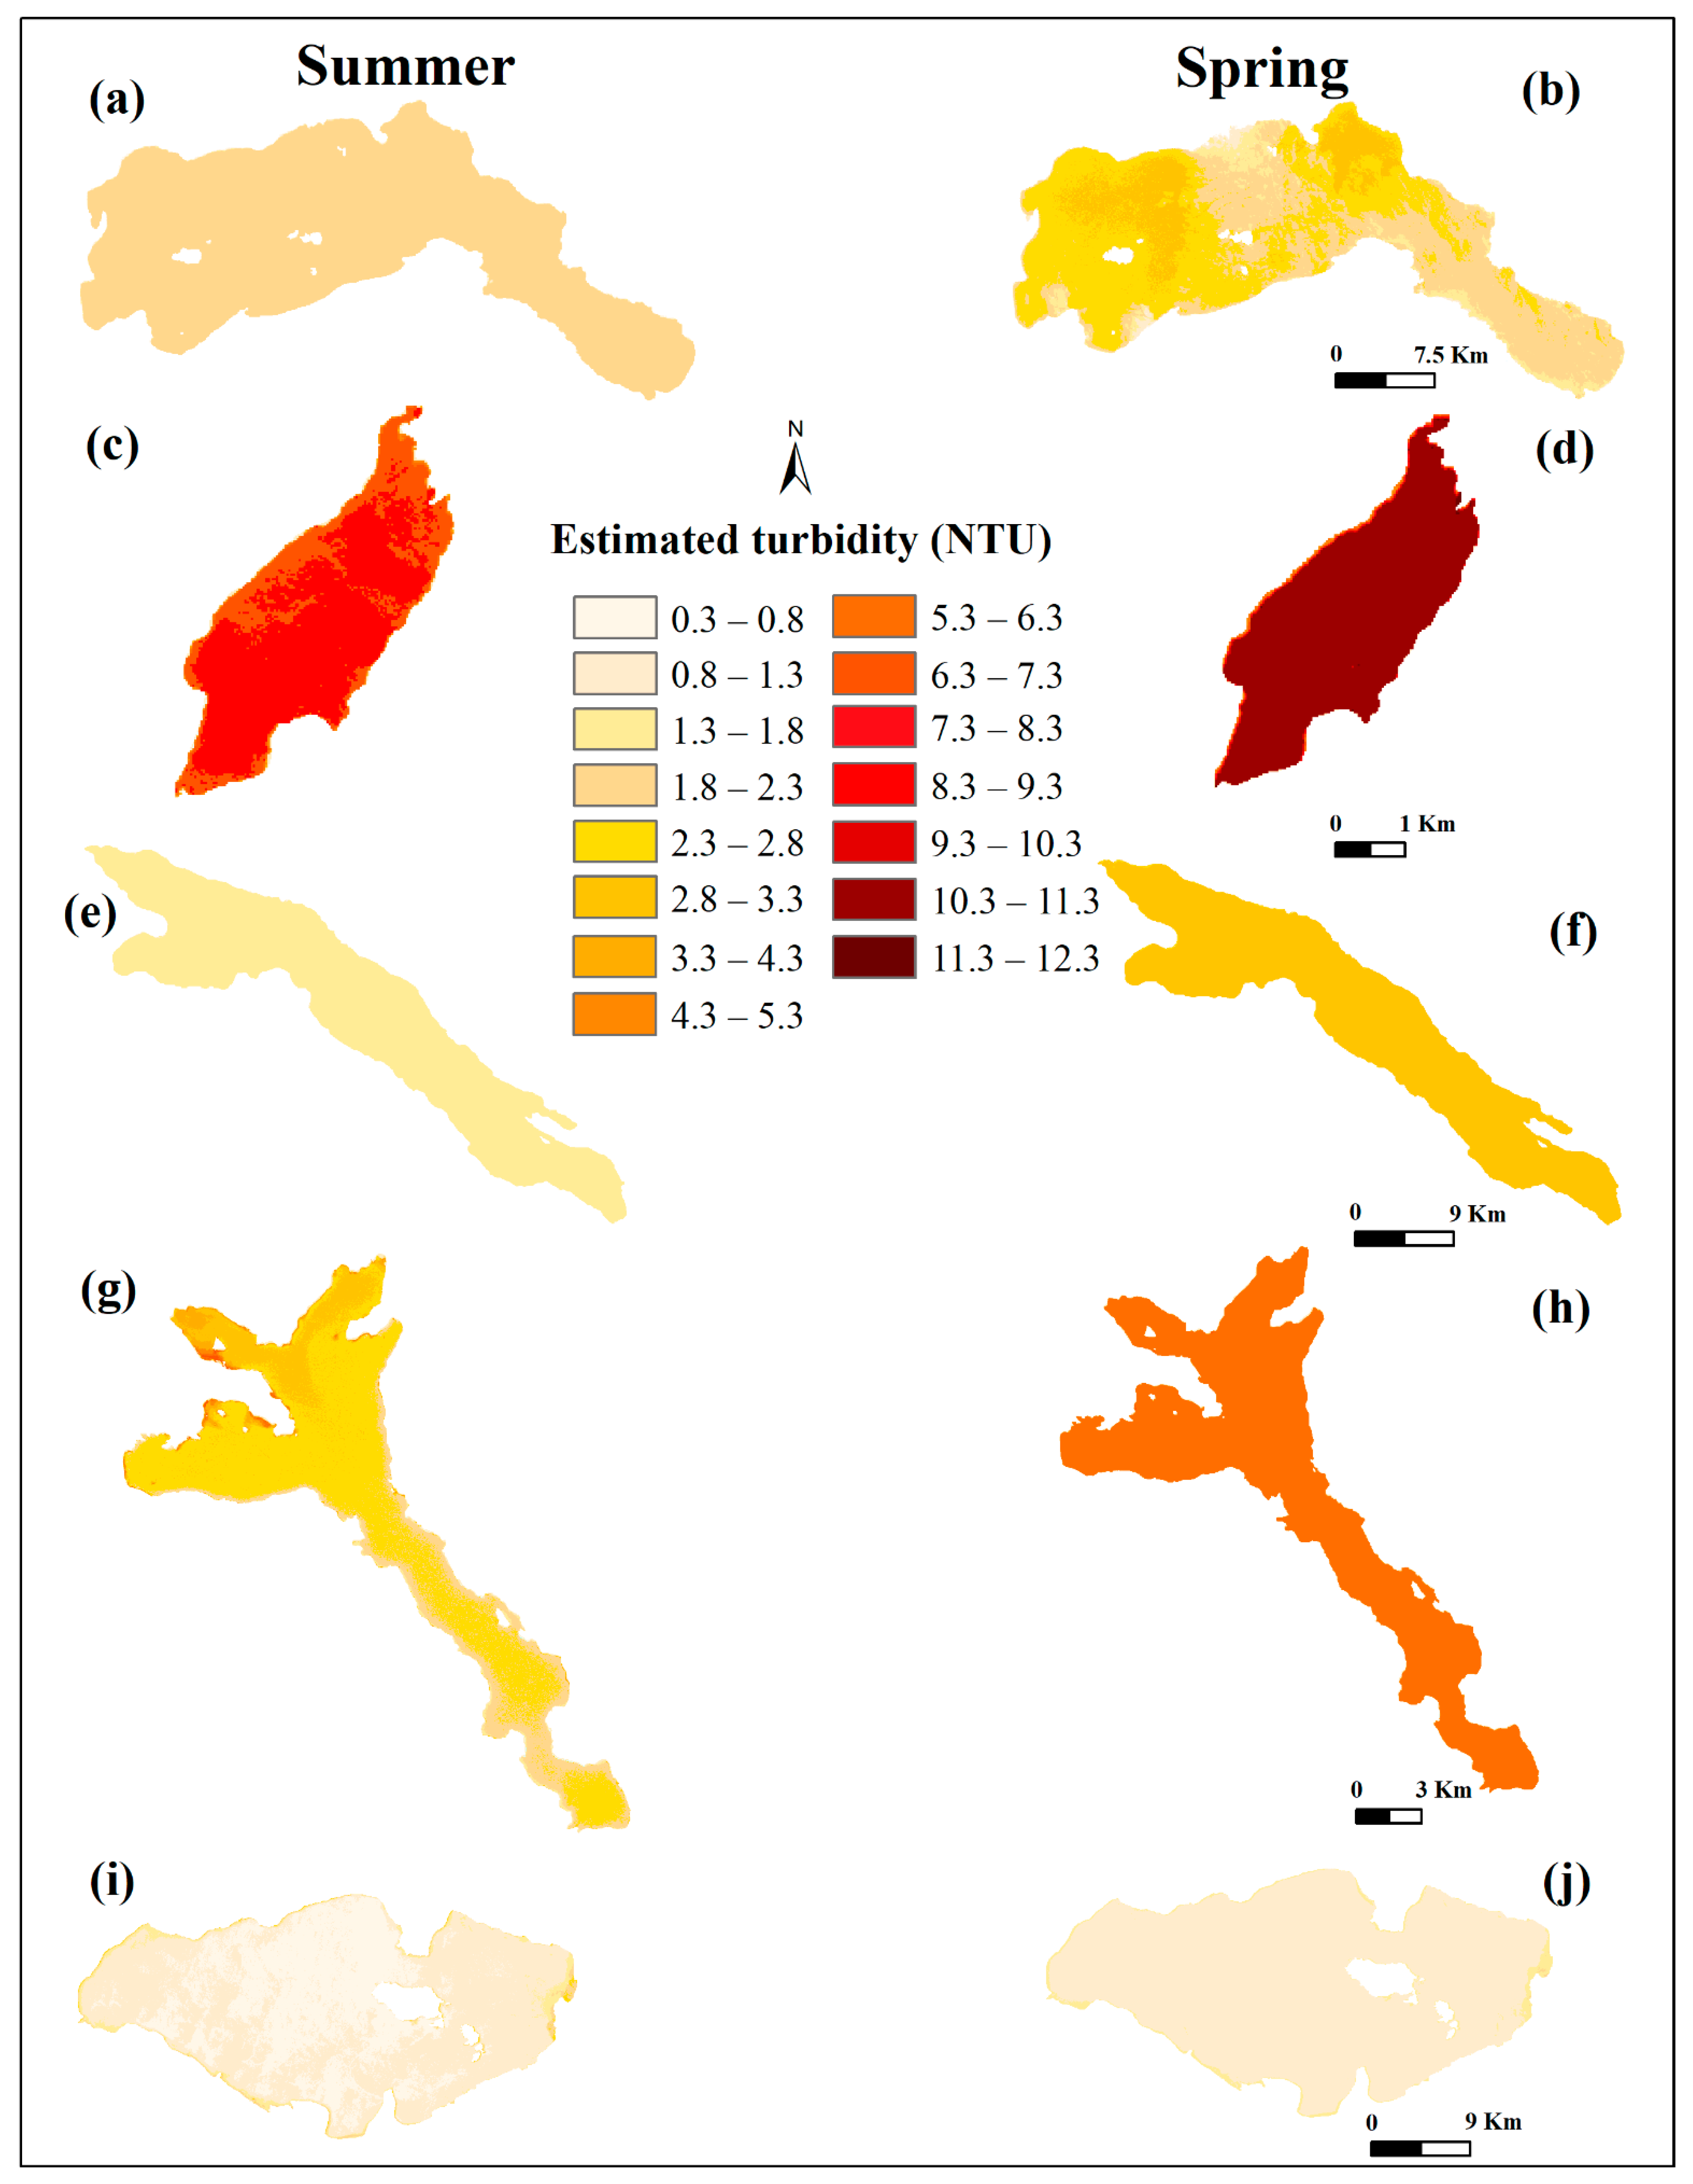
3.4. Spatial Distribution of Estimated Turbidity in Araucanian Lakes

Figure 5 indicates the spatial distribution of turbidity derived from Landsat 8, with NTU estimated by developed empirical models of each lake in two different seasons (summer and spring of Southern Hemisphere). The value of NTU is representative of the upper layer (euphotic zone, 90% of the incident radiation).
In general, turbidity levels are low, with an increase in the winter and spring seasons. In all lakes the turbidity increments were different (see Figure 5). It can note that the highest turbidity is reported in Neltume lake with values in the range of 10.3–12.3 NTU). This could be because it is the shallowest lake (86 m depth), with the smallest area (9.86 km2) and it has four tributaries that contribute sediment, increasing turbidity. While the lowest NTU values are reported for Puyehue lake (0.8–1.3 NTU).

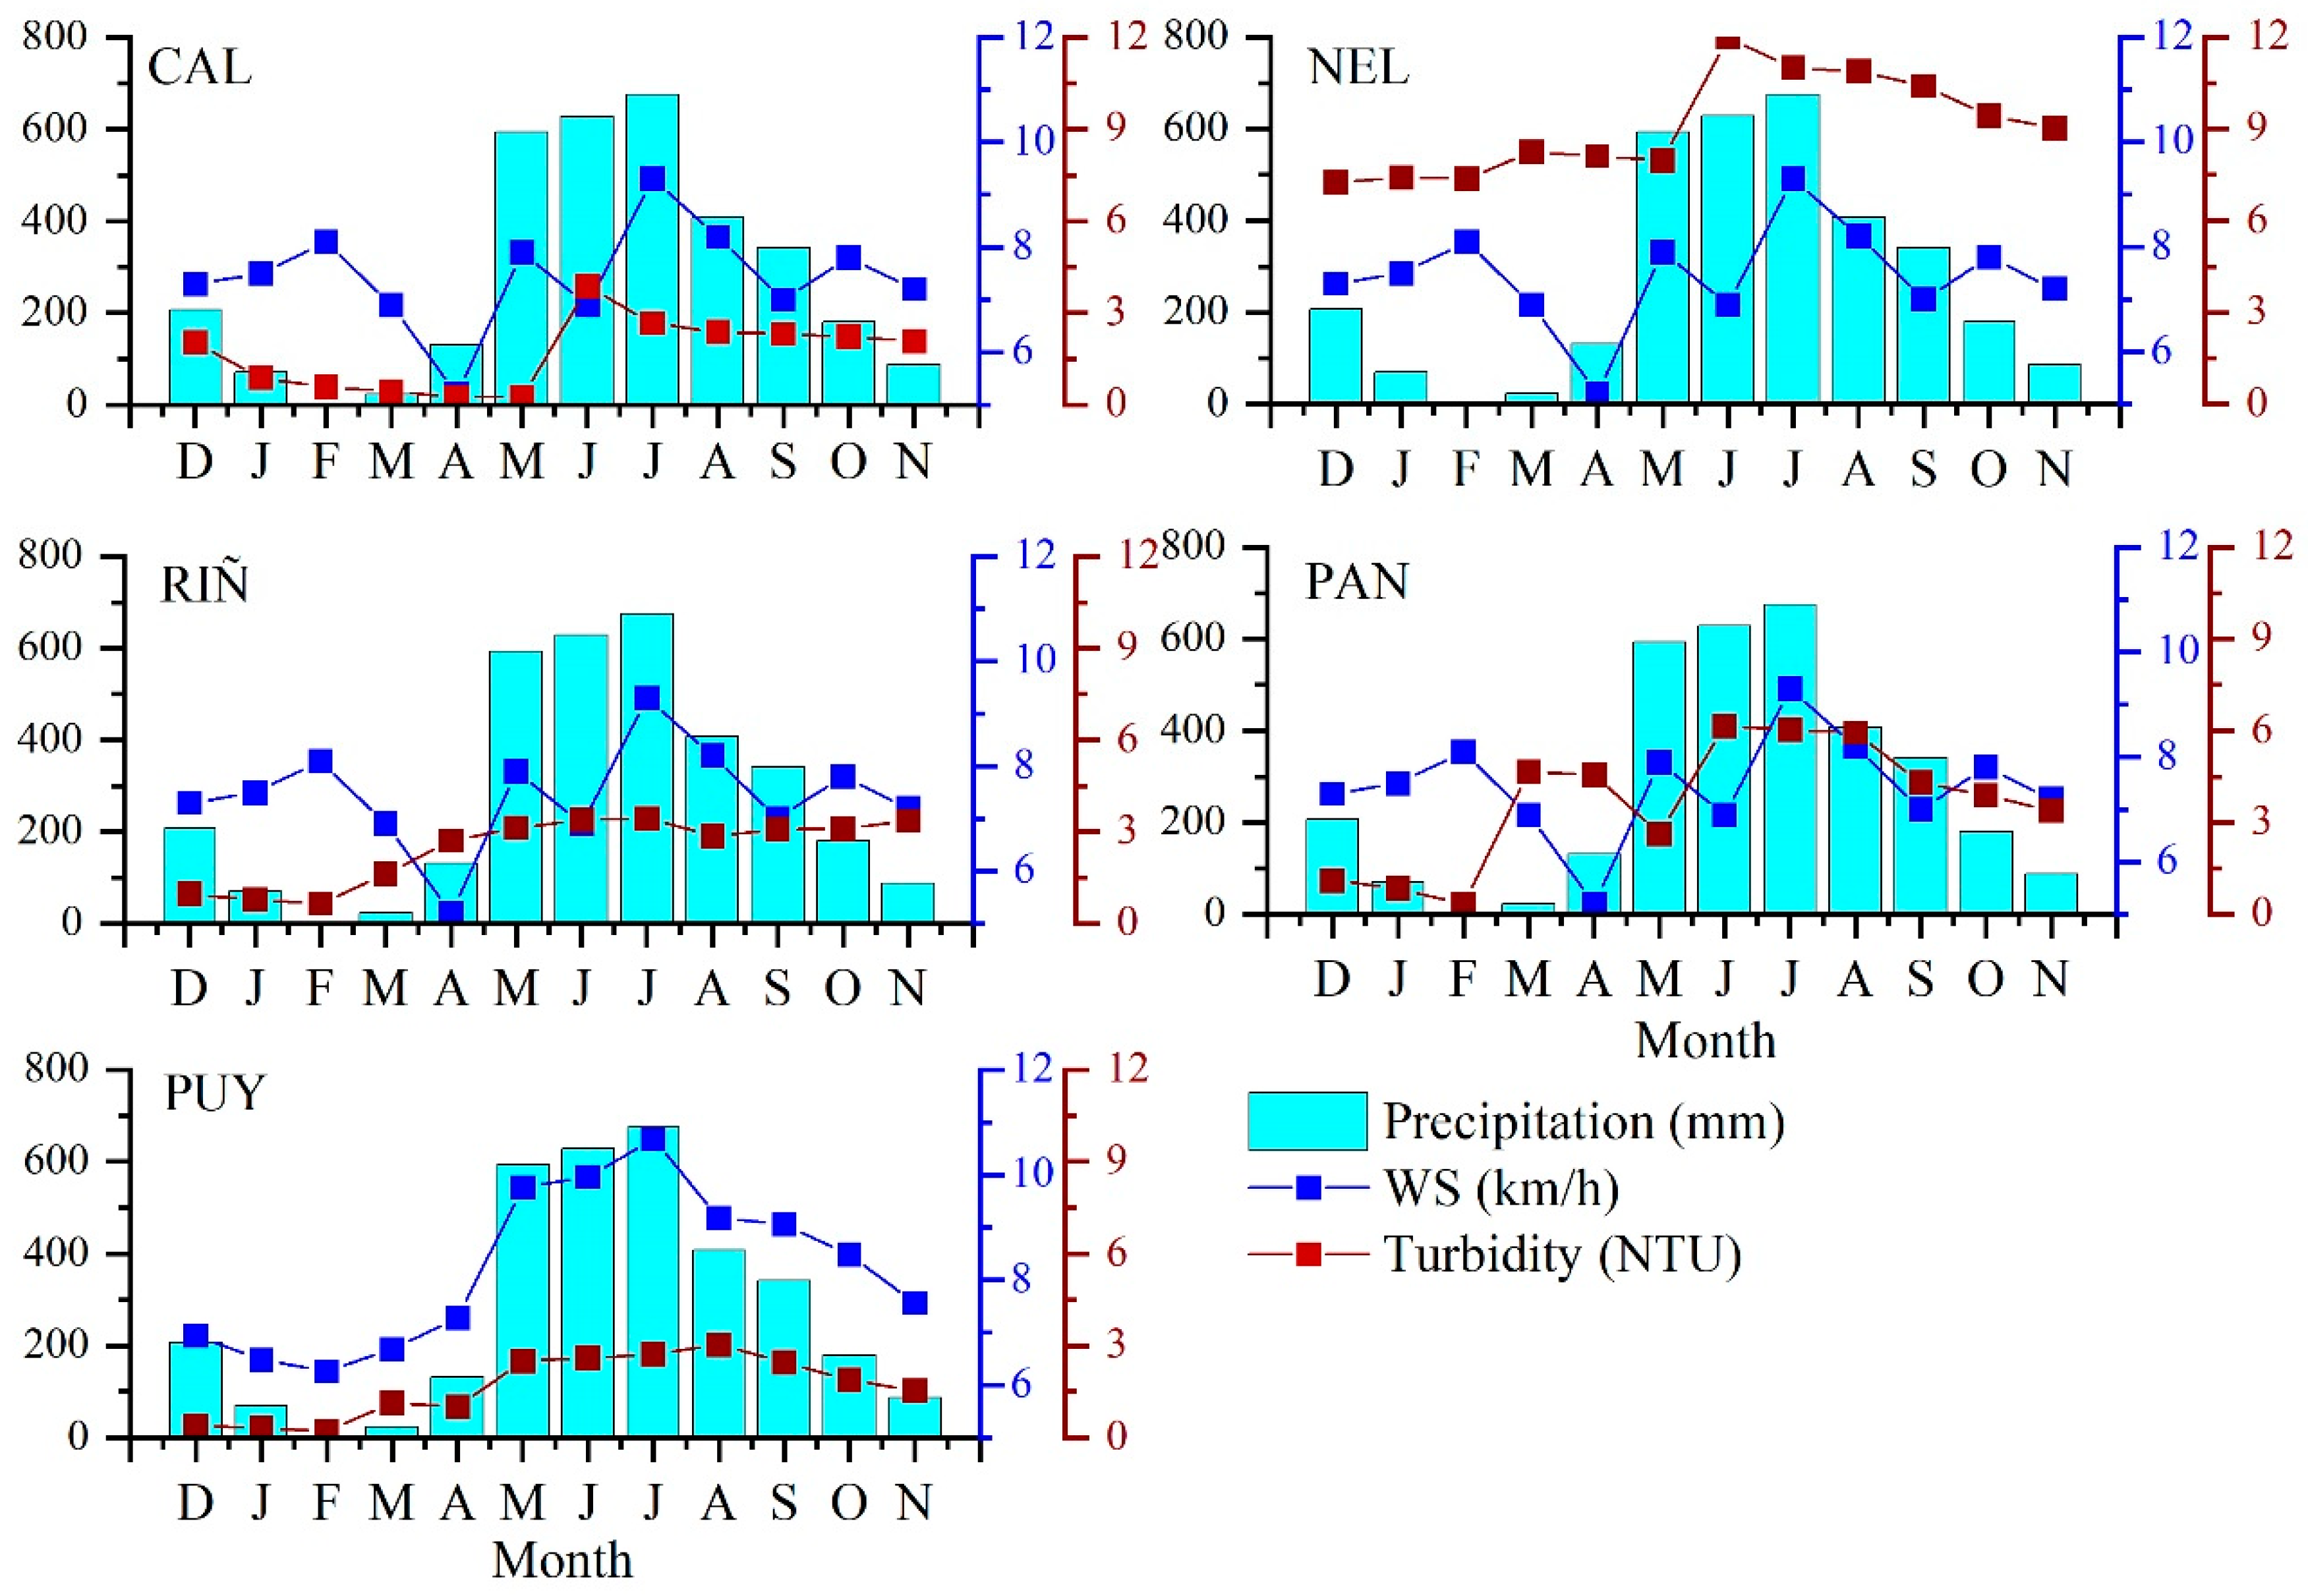
3.5. Influence of Meteorological Conditions in the Study Area

For a better analysis of physical forcing and their interplay in the distribution of turbidity at the local scale of the five lakes, we compared a short time series of turbidity, precipitation, WS and direction in the period covered by Landsat 8 imagery. The meteorological variables study was taken from stations Santa Carla representative to (Calafquén, Neltume, Panguipulliand Riñihue lakes) and Rupanco station representative of the conditions of Puyehue lake (see Figure 1).
Figure 6 shows the behavior of monthly values of accumulated precipitation during 2015. The maximum accumulation rate of precipitation occurs between the winter and spring months (rainy seasons), while the minimum accumulated precipitation values were obtained in the summer months (0 mm, dry season). The highest accumulated value (444.5 mm) during 2015 was reported in the month of July (see Figure S2) in the area. The highest turbidity values correspond to the rainy period (winter and spring seasons) and the lowest to the dry period (summer season). The precipitation variable is directly correlated (R2 = 0.91) with the turbidity reported in the study lakes (with p-value ≤ 0.001).
The wind forcing values were taken in a three-day window before the Landsat 8 acquisitions, and are represented in the four diagrams in Figure S3. The wind speed at the Santa Carla station was 6–8 km/h, while at the Rupanco station was 4–6 km/h. The Santa Carla wind rose (Figure S3) shows that the typical Puelche wind that blows from the N to the NE is the predominant wind characteristic of South-Central Chile, followed by winds from the NW sector in spring (Figure S3). Furthermore, the wind analyses for Rupanco (Figure S3) clearly show that the N winds for this season are the strongest and occur with the highest frequency during 80% of the time in the investigated period. The wind increase shows a bimodal distribution between the NE and NW winds except for Rupanco in the summer season. The diagrams are quite different, mainly due to the different capacities of each station to detect winds. This is essentially related to geographical factors. We do not find a good correlation between wind direction and estimated turbidity, but we obtain a good correlation with the WS (R2 = 0.75). Similar results were reported by [4] in Diefenbaker lake.

4. Discussion

Water clarity is an important aspect of the freshwater lake system. Increases or decreases in water clarity can negatively affect the biological component of the system which can be adapted to specific light penetration conditions [9]. Remote sensing was used as an early alert tool for water clarity changes in an inland aquatic ecosystem in South-Central Chile. Particularly in Chile, this study and methodology are relevant because there are not enough data to assess the state of water resources, mainly in lake systems https://snia.mop.gob.cl/ accessed on 20 January 2021. The monitoring lake network only covers 20 of the 375 lakes with areas larger than 3 km2 [22]. On the other hand, due to the climatic conditions of the south, the satellite images captured in the winter period present extensive cloud cover that makes it impossible to acquire specific data from the North Patagonian aquatic ecosystems. Hence the marked importance in developing empirical models for estimating parameters of water quality, applicable for any period of the year.
Water turbidity was modeled in five lakes in South-Central Chile through seven monitoring campaigns during 2015. From 15 multispectral Landsat images (13 L8 OLI, 2 L5 TM) with a resolution of 30 × 30 m, turbidity index values were predicted based on four simple bands (green, blue, red and infrared) and a combination of 16 bands. For modelling we used 100 records of NTU as response variable and 20 spectral band combinations as predictor variable. Linear regression models were constructed using the best correlation between NTU and band combination. The empirical models were evaluated using four statistical indicators (R2, RSME, IA and MBE) to select the best model per lake. The models present a good agreement between NTU modeled and in situ measurements with low RSME values. Indeed, they had higher coefficients of determination and IA compared to those used in other studies [17,42,45]. The reported MBE indicates a low bias for all models.
Thanks to the unprecedented spatial and radiometric resolution of the L8 sensor, we then mapped the turbidity estimated in 2015 to use as an early warning tool for changes in water clarity. Turbidity for the Araucanian lakes studied is low (range between 0.3–12.3 NTU), with marked seasonal differences of a slight increase in winter and spring. The lake with the highest turbidity was Neltume lake (12.3 NTU, spring season). This behavior could be influenced by the hydrodynamic condition of these lake systems, where they present a summer stratification, for which the euphotic surface layer is separated by a temperature gradient from the deeper or lower layer (aphotic), which prevents the circulation of the water column during this season of year. Also, in the summer months (higher surface temperature) the rainfall regime is lower than in the other seasons of the year. After the breakdown of the stratification, a gradual mixture of the water column would be generated in the autumn–winter and spring seasons, where a hydrodynamically mixed column of water is present, with the suspension of particles such as total or dissolved solids and other contributions of the basin, which allows a greater movement of the water column by internal circulation, and in these months greater contributions are evidenced due to a higher rainfall regime and increased surface runoff [42].
The maximum accumulation rate of precipitation occurs in the winter and spring months, coinciding with the highest values of NTU. In both meteorological stations, the precipitation is greater towards the first and last days of every month (all seasons), which coincides with the dates of the processed Landsat images; therefore, this shows the influence of the precipitation on the turbidity behavior. To know how meteorological conditions contribute to the variability of turbidity were correlated with precipitation, wind speed and wind direction. The precipitation and wind speed showed high correlation (R2 = 0.91 and 0.75) with the turbidity reported in each lake. Precipitation in conjunction with wind speed may have induced sediment resuspension during the rainy season which in turn contributed to turbidity in the upper reaches of lakes.
It is relevant to point out that the remote-sensing tool allows monitoring of representative limnological variables of the trophic state in the lakes and improves the spatial representativeness of the measurements [14,16,17]. In the planning and management of the water quality of the oligotrophic lakes studied here, it is important to consider the precautionary principle, that is, to have as an objective the monitoring of these lakes that have an oligotrophic water quality to prevent them from evolving irreversibly to a deteriorated water quality. Recently, there has been evidence that Panguipulli lake is showing the first signs of eutrophication [16], this being particularly noticeable in an increase of microalgae biomass in the lake bay, which coincides with a deterioration of water and sediment quality in this bay. Although the lakes have good water quality conditions, we recommend gradually reducing the pressure of anthropogenic activities around the basin and in the lake, to maintain what are still good water quality conditions. We suggest gradually reducing the pressure of anthropogenic activities, for example, land use change, considering scenarios of climate change and water deficit in this region [46,47]. Decreased precipitation and deforestation could mean a decrease in base flows in these lakes.
In situ turbidity measurements and monitoring campaigns are often costly and time-consuming, limiting their spatial and temporal representation in large and remote lakes. In this way, remote sensing processing and its relation to in situ measurements allows modeling to provide early information on water quality changes in aquatic ecosystems. The use of the models and maps developed in this work can be applied to obtain a real-time assessment of the turbidity parameter representative of water quality and provide information to assess water clarity for governmental decisions and environmental protection planning.

5. Conclusions

To our knowledge, this is the first time that a model to estimate turbidity in Araucanian lakes has been used incorporating in situ measurement Secchi disk depth, and Landsat images, rather than using single bands and a band combination. The lakes studied have maintained their oligotrophy, related to a high quality of the water bodies and a low productivity present in the in-situ measurements. The accuracy of the empirical models was generally high, with RMSE values ranging from 0.31 to 1.03 NTU values over the range of 0.3 to 12.3 NTU in the validation data not used for model development. Therefore, the models can be used as an early warning tool for changes in water clarity. Spatio-temporal variation shown in turbidity maps was low with a slight increase during spring months. The assembled meteorological data (precipitation and wind speed) had a direct influence on water turbidity, following a seasonal cycle. The results provide information to evaluate the water quality for governmental decisions and environmental protection planning. As well as reconstructing large turbidity datasets, this allows analyzing transparency trends in those lakes.

Supplementary Materials

The following are available online at https://0-www-mdpi-com.brum.beds.ac.uk/article/10.3390/rs13163133/s1, Figure S1: Relationships between our field measured turbidity (NTU) and band and band ratios from Landsat-8 OLI in (a) Calafquén, (b) Neltume, (c) Panguipulli, (d) Riñihue and (e) Puyehue lake, Figure S2: Contour plot for daily values of average precipitation during the 2015 year for (a) Santa Carla and (b) Rupanco station. Source: INIA, Figure S3: Wind roses in summer and spring months during the 2015 year for (a,b) Santa Carla and (c,d) Rupanco station. Source: INIA.

Author Contributions

Conceptualization, L.R.-L.; methodology, L.R.-L. and I.D.-L.; software, L.R.-L., I.D.-L. and L.G.-R.; validation, L.G.-R. and L.R.-L.; formal analysis, L.R.-L.; investigation, L.R.-L.; resources, R.U.; data curation, L.R.-L.; writing—original draft preparation, L.R.-L.; writing—review and editing, L.R.-L., I.D.-L., R.C. and L.G.-R.; visualization, L.G.-R.; supervision, L.R.-L., L.G.-R.; project administration, R.U.; funding acquisition, R.U. All authors have read and agreed to the published version of the manuscript.

Funding

This research was funded by CRHIAM Water Center (ANID/FONDAP/15130015).

Institutional Review Board Statement

Not applicable.

Informed Consent Statement

Not applicable.

Data Availability Statement

The data presented in this study are available on request from the corresponding author.

Acknowledgments

The authors thank the National Agency for Research and Development of Chilean Government (ANID), Chilean Water Directorate (DGA), L.G-R wishes to thank the Chilean National Development and Innovation Agency (ANID), Chile for the Ph. D. Grants (21170226) and CRHIAM Water Center (ANID/FONDAP/15130015).

Conflicts of Interest

The authors declare no conflict of interest.

References

  1. Wetzel, R. Limnology: Lake and river ecosystems; Press, A., Ed.; Elsevier: Amsterdam, The Netherlands, 2001. [Google Scholar]
  2. Ford, R.T.; Vodacek, A. Determining improvements in Landsat spectral sampling for inland water quality monitoring. Sci. Remote Sens. 2020, 1, 100005. [Google Scholar] [CrossRef]
  3. Lee, Z.P.; Shang, S.; Hu, C.; Du, K.; Weidemann, A.; Hou, W.; Lin, J.; Lin, G. Secchi disk depth: A new theory and mechanistic model for underwater visibility. Remote Sens. Environ. 2015, 169, 139–149. [Google Scholar] [CrossRef] [Green Version]
  4. Abirhire, O.; Davies, J.M.; Guo, X.; Hudson, J. Understanding the factors associated with long-term reconstructed turbidity in Lake Diefenbaker from Landsat-imagery. Sci. Total Environ. 2020, 724, 138222. [Google Scholar] [CrossRef]
  5. Baughman, C.A.; Jones, B.M.; Bartz, K.K.; Young, D.B.; Zimmerman, C.E. Reconstructing turbidity in a glacially influenced lake using the Landsat TM and ETM+ surface reflectance climate data record archive, Lake Clark, Alaska. Remote Sens. 2015, 7, 13692–13710. [Google Scholar] [CrossRef] [Green Version]
  6. Carmena, D.; Aguinagalde, X.; Zigorraga, C.; Fernández-Crespo, J.C.; Ocio, J.A. Presence of Giardia cysts and Cryptosporidium oocysts in drinking water supplies in northern Spain. J. Appl. Microbiol. 2007, 102, 619–629. [Google Scholar] [CrossRef] [PubMed]
  7. Frau, D.; Gutierrez, M.F.; Molina, F.R.; de Mello, F.T. Drivers assessment of zooplankton grazing on phytoplankton under different scenarios of fish predation and turbidity in an in situ mesocosm experiment. Hydrobiologia 2021, 848, 485–498. [Google Scholar] [CrossRef]
  8. Angradi, T.R.; Ringold, P.L.; Hall, K. Water clarity measures as indicators of recreational benefits provided by U.S. lakes: Swimming and aesthetics. Ecol. Indic. 2018, 93, 1005–1019. [Google Scholar] [CrossRef]
  9. Kirk, J.T.O. Light and Photosynthesis in Aquatic Ecosystems; Cambridge University Press: Cambridge, UK, 1994. [Google Scholar]
  10. Soto, D. Oligotrophic patterns in southern Chilean lakes: The relevance of nutrients and mixing depth. Rev. Chil. Hist. Nat. 2002, 75, 377–393. [Google Scholar] [CrossRef] [Green Version]
  11. Petus, C.; Chust, G.; Gohin, F.; Doxaran, D.; Froidefond, J.M.; Sagarminaga, Y. Estimating turbidity and total suspended matter in the Adour River plume (South Bay of Biscay) using MODIS 250-m imagery. Cont. Shelf Res. 2010, 30, 379–392. [Google Scholar] [CrossRef] [Green Version]
  12. Lee, Z.; Hu, C.; Shang, S.; Du, K.; Lewis, M.; Arnone, R.; Brewin, R. Penetration of UV-visible solar radiation in the global oceans: Insights from ocean color remote sensing. J. Geophys. Res. Ocean. 2013, 118, 4241–4255. [Google Scholar] [CrossRef] [Green Version]
  13. Liu, D.; Duan, H.; Loiselle, S.; Hu, C.; Zhang, G.; Li, J.; Yang, H.; Thompson, J.R.; Cao, Z.; Shen, M.; et al. Observations of water transparency in China’s lakes from space. Int. J. Appl. Earth Obs. Geoinf. 2020, 92, 102187. [Google Scholar] [CrossRef]
  14. Lei, S.; Xu, J.; Li, Y.; Lyu, H.; Liu, G.; Zheng, Z.; Xu, Y.; Du, C.; Zeng, S.; Wang, H.; et al. Temporal and spatial distribution of Kd(490) and its response to precipitation and wind in lake Hongze based on MODIS data. Ecol. Indic. 2020, 108, 105684. [Google Scholar] [CrossRef]
  15. Briceño, I.; Pérez, W.; San Miguel, D.; Ramos, S. Determinación de calidad de agua en el Lago Vichuquén, con imágenes de satélite Landsat 8, sensor OLI, año 2016, Chile. Rev. Teledetección 2018, 52, 67–78. [Google Scholar] [CrossRef] [Green Version]
  16. Huovinen, P.; Ramírez, J.; Caputo, L.; Gómez, I. Mapping of spatial and temporal variation of water characteristics through satellite remote sensing in Lake Panguipulli, Chile. Sci. Total Environ. 2019, 679, 196–208. [Google Scholar] [CrossRef]
  17. Rodríguez-López, L.; Duran-Llacer, I.; González-Rodríguez, L.; Abarca-del-Rio, R.; Cárdenas, R.; Parra, O.; Martínez-Retureta, R.; Urrutia, R. Spectral analysis using LANDSAT images to monitor the chlorophyll-a concentration in Lake Laja in Chile. Ecol. Inform. 2020, 60. [Google Scholar] [CrossRef]
  18. Parra, O.; Basualto, S.; Urrutia, R.; Valdovinos, C. Estudio comparativo de la diversidad fitoplanctónica de cinco lagos de diferentes niveles tróficos. Gayana 1999, 56, 25–40. [Google Scholar]
  19. Thomasson, K. Araucanian Lakes Plankton Studies in North Patagonia, Whit Notes on Terrestrial Vegetation; ACTA Phytogeographica Suecica: Uppsala, Sweden, 1963. [Google Scholar]
  20. Campos, H. Presencia de Chirodon australe (pisces: Characidae) en lago tarahuin (isla grande de chiloe) y su significado zoogreografico. Medio Ambient. 1996, 13, 69–79. [Google Scholar]
  21. Soto, D.; Stockner, J. Oligotrophic lakes in southern Chile and in British Columbia: Basis for their resilience to present and future disturbances. High Latitude Rain Forest of the West Coast of the Americas. In Climate, Hydrology, Ecology and Conservation; Springer: New York, NY, USA, 1996; pp. 266–280. [Google Scholar]
  22. Dirección General de Aguas (DGA). Atlas del Agua. Atlas Agua Chile 2016, 1, 24. [Google Scholar]
  23. Brüggen, J. Fundamentos de la geología de Chile, 1st ed.; Militar, I.G., Ed.; Santiago de Chile: Santiago, Chile, 1950. [Google Scholar]
  24. López, L.R.; Cárdenas, R.; Parra, O.; Urrutia, R.; González, L.; Martínez, R. On the Subaquatic Light Fields in Lakes of Southern Chile and Their Photosynthetic Potential. In Proceedings of the 2nd International Conference on BioGeoSciences; Springer: Cham, Switzerland, 2019; pp. 95–110. ISBN 9783030042332. [Google Scholar]
  25. Dirección General de Aguas (DGA). Evaluación de la Condición Trófica de la Red de Control de Lagos de la DGA; Santiago de Chile: Santiago, Chile, 2014. [Google Scholar]
  26. Moiwo, J.P.; Tao, F. Evidence of Land-use Controlled Water Storage Depletion in Hai River Basin, North China. Water Resour. Manag. 2014, 28, 4733–4746. [Google Scholar] [CrossRef]
  27. Yang, X.; Lo, C.P. Relative radiometric normalization performance for change detection from multi-date satellite images. Photogramm. Eng. Remote Sens. 2000, 66, 967–980. [Google Scholar]
  28. Chander, G.; Markham, B.L.; Barsi, J.A. Revised Landsat 5 Thematic Mapper Radiometric Calibration Gyanesh. IIIE Geosci. Remote Sens. Lett. 2007, 4, 490–494. [Google Scholar] [CrossRef]
  29. Chander, G.; Markham, B.L.; Helder, D.L. Summary of current radiometric calibration coefficients for Landsat MSS, TM, ETM+, and EO-1 ALI sensors. Remote Sens. Environ. 2009, 113, 893–903. [Google Scholar] [CrossRef]
  30. Department of the Interior U.S. Geological Survey. Landsat 8 (L8) Data Users Handbook Version 5.0. Nasa 2019, 8, 97. [Google Scholar]
  31. Markogianni, V.; Kalvas, D.; Petropoulos, G.P.; Dimitriou, E. An appraisal of the potential of Landsat 8 in estimating chlorophyll-a, ammonium concentrations and other water quality indicators. Remote Sens. 2018, 10, 1018. [Google Scholar] [CrossRef] [Green Version]
  32. Chavez, P.S. An improved dark-object subtraction technique for atmospheric scattering correction of multispectral data. Remote Sens. Environ. 1988, 24, 459–479. [Google Scholar] [CrossRef]
  33. Quang, N.H.; Sasaki, J.; Higa, H.; Huan, N.H. Spatiotemporal variation of turbidity based on landsat 8 OLI in Cam Ranh Bay and Thuy Trieu Lagoon, Vietnam. Water 2017, 9, 570. [Google Scholar] [CrossRef] [Green Version]
  34. Setiawan, F.; Matsushita, B.; Hamzah, R.; Jiang, D.; Fukushima, T. Long-term change of the secchi disk depth in Lake Maninjau, Indonesia shown by landsat TM and ETM+ data. Remote Sens. 2019, 11, 2875. [Google Scholar] [CrossRef] [Green Version]
  35. Bustamante, J.; Pacios, F.; Díaz-Delgado, R.; Aragonés, D. Predictive models of turbidity and water depth in the Doñana marshes using Landsat TM and ETM+ images. J. Environ. Manag. 2009, 90, 2219–2225. [Google Scholar] [CrossRef]
  36. Pizani, F.M.C.; Maillard, P.; Ferreira, A.F.F.; De Amorim, C.C. Estimation of water quality in a reservoir from sentinel-2 msi and landsat-8 oli sensors. ISPRS Ann. Photogramm. Remote Sens. Spat. Inf. Sci. 2020, 5, 401–408. [Google Scholar] [CrossRef]
  37. Bohn, V.Y.; Carmona, F.; Rivas, R.; Lagomarsino, L.; Diovisalvi, N.; Zagarese, H.E. Development of an empirical model for chlorophyll-a and Secchi Disk Depth estimation for a Pampean shallow lake (Argentina). Egypt. J. Remote Sens. Sp. Sci. 2018, 21, 183–191. [Google Scholar] [CrossRef]
  38. Dogliotti, A.I.; Ruddick, K.G.; Nechad, B.; Doxaran, D.; Knaeps, E. A single algorithm to retrieve turbidity from remotely-sensed data in all coastal and estuarine waters. Remote Sens. Environ. 2015, 156, 157–168. [Google Scholar] [CrossRef] [Green Version]
  39. Robert, E.; Kergoat, L.; Soumaguel, N.; Merlet, S.; Martinez, J.M.; Diawara, M.; Grippa, M. Analysis of suspended particulate matter and its drivers in Sahelian Ponds and Lakes by remote sensing (landsat and MODIS): Gourma Region, Mali. Remote Sens. 2017, 9, 1272. [Google Scholar] [CrossRef] [Green Version]
  40. Ouma, Y.O.; Noor, K.; Herbert, K. Modelling Reservoir Chlorophyll- a, TSS, and Turbidity Using Sentinel-2A MSI and Landsat-8 OLI Satellite Sensors with Empirical Multivariate Regression. J. Sens. 2020, 2020, 8858408. [Google Scholar] [CrossRef]
  41. Willmott, C.J.; Robeson, S.M.; Matsuura, K. A refined index of model performance. Int. J. Climatol. 2012, 32, 2088–2094. [Google Scholar] [CrossRef]
  42. Du, Y.; Song, K.; Liu, G.; Wen, Z.; Fang, C.; Shang, Y.; Zhao, F.; Wang, Q.; Du, J.; Zhang, B. Quantifying total suspended matter (TSM) in waters using Landsat images during 1984–2018 across the Songnen Plain, Northeast China. J. Environ. Manag. 2020, 262, 110334. [Google Scholar] [CrossRef]
  43. Chalar, G.; Tundisi, J.G. Main processes in the water column determined by wind and rainfall at Lobo (Broa) Reservoir. Implications for phosphorus cycling. In Theoretical Reservoir Ecology and Its Applications; São Carlos, B., Ed.; Backhuys Publishers: São Carlos, Brazil, 1999; pp. 53–65. [Google Scholar]
  44. Serra, T.; Pascual, J.; Brunet, R.; Colomer, J. The mixing regime and turbidity of Lake Banyoles (NE Spain): Response to climate change. Water 2020, 12, 1621. [Google Scholar] [CrossRef]
  45. Liu, L.W.; Wang, Y.M. Modelling reservoir turbidity using Landsat 8 satellite imagery by gene expression programming. Water 2019, 11, 1479. [Google Scholar] [CrossRef] [Green Version]
  46. Boisier, J.P.; Alvarez-Garreton, C.; Cordero, R.R.; Damiani, A.; Gallardo, L.; Garreaud, R.D.; Lambert, F.; Ramallo, C.; Rojas, M.; Rondanelli, R. Anthropogenic drying in central-southern Chile evidenced by long-term observations and climate model simulations. Elementa 2018, 6, 74. [Google Scholar] [CrossRef]
  47. Alvarez-Garreton, C.; Pablo Boisier, J.; Garreaud, R.; Seibert, J.; Vis, M. Progressive water deficits during multiyear droughts in basins with long hydrological memory in Chile. Hydrol. Earth Syst. Sci. 2021, 25, 429–446. [Google Scholar] [CrossRef]
Figure 1. Study area. Lakes under study, in order from the north to south: Calafquén, Neltume, Riñihue, Panguipulli and Puyehue.
Remotesensing 13 03133 g001
Figure 2. Locations of the sampling station (red triangle) and bathymetry in the study lakes.
Remotesensing 13 03133 g002
Figure 3. Pearson’s r correlation between turbidity, individual bands, band combinations, and Normalized Difference Turbidity Index (NDTI) for each lake.
Remotesensing 13 03133 g003
Figure 4. Estimated and measured turbidity for each lake, (a) Calafquén, (b) Neltume (c) Panguipulli, (d) Riñihue (e) Puyehue lake. The red and the solid black line represent the regression line and the 1:1 line, respectively.
Remotesensing 13 03133 g004
Figure 5. Spatial distribution of estimated turbidity in summer and spring season during the 2015 year for (a,b) Calafquén lake, (c,d) Neltume lake, Riñihue lake, (e,f), Panguipulli lake (g,h), and (i,j) Puyehue lake.
Remotesensing 13 03133 g005
Figure 6. Accumulation monthly rate of precipitation, average monthly wind speed, and temperature in all study lakes and estimated turbidity.
Remotesensing 13 03133 g006
Table 1. Morphometric parameters in each study lake.
ParametersUnitCalafquénNeltumeRiñihuePanguipulliPuyehue
Latitude° ′S39.3239.4739.5039.4340.40
Longitude° ′W72.0971.5872.2072.1372.28
Altitudem.a.s.l.203186117140184
Long maximumkm25.106.302728.3023.50
Maximum widthkm7.802.4059.7011.30
Medium widthkm4.701.502.904.107.10
Superficial area (A)km2120.609.8077.50116.90165.40
Maximum depthm21286323268123.
Medium depthm1155816212676.30
Volumekm319.100.6012.6014.7012.60
Hydrographic basin area (Ad)km27337634.2901.511.53
Ad/A 6.1077.9055.3532.609.10
Renovation timeyears2.900.201.401.404.50
Table 2. Landsat image characteristics and in situ measurements.
LakeImage IDPath/RowYearIn Situ DateImage DateDays Differences
CalafquénLC82330872015028LGN01233/87201522 January28 January±6
LC82320882015053LGN01232/88201527 February22 February±5
LC82320882015085LGN01232/88201518 March26 March±8
LC82330872015300LGN01233/87201523 October27 October±5
LC82330872015332LGN01233/8720153 December28 November±5
LT52330872011081COA00233/87201122 March22 March±0
NeltumeLC82320882015021LGN01232/88201520 January21 January±1
LC82320882015053LGN01232/8820151 March22 February±7
LC82320882015085LGN01232/88201519 March26 March±7
LC82330882015300LGN01233/88201521 October27 October±6
LC82330872015332LGN01233/8720152 December28 November±4
LC82330882013278LGN01233/88201317 October5 October±12
RiñihueLC82330882015028LGN01233/88201518 January28 January±10
LC82330882015044LGN01233/88201525 February13 February±12
LC82320882015069LGN01232/88201517 March10 March±7
LC82330882015300LGN01233/88201519 October27 October±8
LC82330882015332LGN01233/88201530 November28 November±2
LT52330882011081COA00233/88201123 March22 March±1
PanguipulliLC82320882015021LGN01232/88201519 January21 January±3
LC82320882015053LGN01232/88201526 February22 February±4
LC82320882015085LGN01232/88201518 March26 March±8
LC82330872015284LGN01233/87201520 October11 October±9
LC82330872015332LGN01233/8720151 December28 November±3
LT52330882011081COA00233/88201122 March22 March±0
PuyehueLC82330882015028LGN01233/88201524 January28 January±4
LC82320882015069LGN01232/88201524 January10 March±14
LC82320882015085LGN01232/88201521 March26 March±5
LC82330882015300LGN01233/88201525 October27 October±2
LC82330882015332LGN01233/8820155 December28 November±7
LC82330882013134LGN02233/8820139 May14 May±5
LC82330882013278LGN01233/88201315 October5 October±10
Table 3. Descriptive statistic from lake Calafquén (CAL), lake Neltume (NEL), lake Riñihue (RIÑ), lake Panguipulli (PAN) and lake Puyehue (PUY).
ParametersStatistical IndicatorsCALNELRIÑPANPUY
SDDmin–max (m)8.0–17.02.3–14.56.5–15.05.2–16.02.5–10.4
Average ± σ11.9 ± 5.88.2 ± 3.810.5 ± 2.79.4 ± 3.76.8 ± 2.8
CV (%)48.845.626.039.740.9
n4343424243
Chl-amin–max (μg/L)0.1–2.60.1–0.70.1–1.10.1–1.40.1–2.7
Average ± σ0.8 ± 0.60.3 ± 0.10.5 ± 0.20.5 ± 0.30.5 ± 0.2
CV (%)89.254.376.680.043.0
n4242424243
Turbiditymin-max (NTU)0.2–3.96.9–12.01.0–3.91.1–8.00.3–3.7
Average ± σ1.8 ± 1.19.2 ± 1.62.3 ± 0.93.4 ± 1.91.5 ± 1.0
CV (%)62.317.539.856.260.5
n2525252525
Tempmin–max (°T)10.0–21.77.1–25.98,6–20.77.3–24.69.4–22.5
Average ± σ15.7 ± 0.714.9 ± 5.615.4 ± 4.116.1 ± 4.414.9 ± 4.6
CV (%)4.337.526.627.530.7
n4343424243
CV—coefficient of variation, n—data number, and σ—standard deviation
Table 4. Correlation between SDD and NTU measurements.
LakeRelationsrR2
CalafquénNTU = −0.30 SDD + 5.15−0.990.98
NeltumeNTU = −0.39 SDD + 12.96−0.970.94
PanguipulliNTU = −0.51 SDD + 9.00−0.920.85
RiñihueNTU = −0.26 SDD + 5.19−0.950.91
PuyehueNTU = −0.44 SDD + 4.79−0.990.98
Table 5. The models of turbidity estimation and statistical indicator for each lake.
LakeBest ModelR2RMSE (NTU)IAMBE (NTU)
CalafquénNTU = −107.06 (R + N) + 5.420.930.370.85−0.22
NeltumeNTU = 7.34 (G/N) + 2.160.980.460.96−0.21
PanguipulliNTU = 6.98 (G/N) − 2.690.941.030.920.44
RiñihueNTU = −10.78 (R) + 3.210.990.310.970.12
PuyehueNTU= −2.70 (B/G) + 4.430.990.450.95−0.36
Publisher’s Note: MDPI stays neutral with regard to jurisdictional claims in published maps and institutional affiliations.

