Technical Note

Retrieving High-Resolution Aerosol Optical Depth from GF-4 PMS Imagery in Eastern China

1
College of Geomatics, Shandong University of Science and Technology, Qingdao 266590, China
2
Information Technology Research Center, Beijing Academy of Agriculture and Forestry Sciences, Beijing 100097, China
3
Department of Chemical and Biochemical Engineering, Iowa Technology Institute, Center for Global and Regional Environmental Research, University of Iowa, Iowa City, IA 52242, USA
*
Author to whom correspondence should be addressed.
Both authors contributed equally to this work and should be considered co-first authors.
Remote Sens. 2021, 13(18), 3752; https://0-doi-org.brum.beds.ac.uk/10.3390/rs13183752
Submission received: 1 August 2021 / Revised: 6 September 2021 / Accepted: 15 September 2021 / Published: 18 September 2021
(This article belongs to the Special Issue Artificial Intelligence in Remote Sensing of Atmospheric Environment)

Abstract

:
Gaofen 4 (GF-4) is a geostationary satellite, with a panchromatic and multispectral sensor (PMS) onboard, and has great potential in observing atmospheric aerosols. In this study, we developed an aerosol optical depth (AOD) retrieval algorithm for the GF-4 satellite. AOD retrieval was realized based on the pre-calculated surface reflectance database and 6S radiative transfer model. We customized the unique aerosol type according to the long time series aerosol parameters provided by the Aerosol Robotic Network (AERONET) site. The solar zenith angle, relative azimuth angle, and satellite zenith angle of the GF-4 panchromatic multispectral sensor image were calculated pixel-by-pixel. Our 1 km AOD retrievals were validated against AERONET Version 3 measurements and compared with MOD04 C6 AOD products at different resolutions. The results showed that our GF-4 AOD algorithm had a good robustness in both bright urban areas and dark rural areas. A total of 71.33% of the AOD retrievals fell within the expected errors of ±(0.05% + 20%); root-mean-square error (RMSE) and mean absolute error (MAE) were 0.922 and 0.122, respectively. The accuracy of GF-4 AOD in rural areas was slightly higher than that in urban areas. In comparison with MOD04 products, the accuracy of GF-4 AOD was much higher than that of MOD04 3 km and 10 km dark target AOD, but slightly worse than that of MOD04 10 km deep blue AOD. For different values of land surface reflectance (LSR), the accuracy of GF-4 AOD gradually deteriorated with an increase in the LSR. These results have theoretical and practical significance for aerosol research and can improve retrieval algorithms using the GF-4 satellite.

Graphical Abstract

1. Introduction

Atmospheric aerosols are dispersed particles suspended in air, and include primary aerosols (emitted into the atmosphere directly in the form of particles) and secondary aerosols (converted from primary pollutants in the atmosphere). They include suspended liquid droplets, dust, PM10, and PM2.5, with particle sizes ranging from 0.001 to 100 μm [1,2,3]. Atmospheric aerosols can be from either natural or anthropogenic sources, and their composition can affect air quality, human health, productivity, and transportation [1,3,4]. Aerosol particles affect the transmission of solar radiation through the scattering and absorption of electromagnetic waves, thus impacting the energy balance of environments on all scales; they are an influential factor in climate change as well [1,3,4,5]. Aerosol optical depth (AOD) is an important parameter used to quantitatively describe aerosols, represented by the integral of the extinction in solar radiation over a transport path due to aerosol absorption and scattering [6]. The traditional method for monitoring AOD uses a sun photometer. Here, the AOD of various bands in different aerosol environments can be monitored over time by comparing the solar constant with the radiation energy reaching the ground, in combination with the Beer–Lambert law. The limited distribution and number of monitoring sites make it difficult to monitor AOD on a large spatial scale; thus, continuous aerosol spatial distribution characteristics remain elusive. With the continuous development of satellite remote sensing technology, particularly the application of panchromatic multispectral sensors (PMS), wide-field-of-view sensors and other wide-width cameras on stationary satellites, AOD retrieval in multi-temporal and large-scale geographic space can compensate for the deficiency of onsite monitoring.
The earliest aerosol retrieval method is the dark target (DT) algorithm proposed by Kaufman 1988 [7], but it is only applicable to dense vegetation and dark soil areas with low land surface reflectance (LSR) values. At the same time, the LSR of the near infrared (NIR, 2.12 μm), red (0.66 μm), and blue wavelengths (0.47 μm) have constant linear relationships in densely vegetated regions. Thus, the LSR of red (0.66 μm) and blue (0.47 μm) bands can be estimated by 2.12-μm bands, which are less affected by the atmosphere, and the radiative transfer equation can be employed to estimate AOD [8,9,10]. This preliminary algorithm was introduced into the MOD04 C4 product. However, there is still some contribution to the radiance by aerosols in the 2.12 μm band, and the precise relationship between the red, blue, and NIR bands is affected by the observation angle and surface vegetation coverage, all of which can decrease the accuracy of the DT preliminary algorithm [11]. MOD04 C5 [11] was improved to solve the above problems. The normalized difference vegetation index (NDVI), shortwave infrared radiation (SWIR), and observation angle were introduced as parameters affecting the empirical relationship between LSR2.12μm, LSR0.66μm, and LSR0.47μm in densely vegetated areas and significantly improved the accuracy of the DT algorithm [11]. Regional differences in aerosol type greatly affect the radiation transmission process; thus, the classification of aerosol types is another important source of error. After a more detailed classification of global-scale aerosol types and an improvement of the cloud mask algorithm [12], the improved algorithm was introduced into the MOD04C6 product, and the DT algorithm achieved a more reliable accuracy; however, this algorithm is still only applicable to dark regions, and thus, is not useful in deserts, high reflection areas of cities, or other high-LSR regions. An alternative that addresses these limitations is the Deep Blue (DB) algorithm, proposed by Hsu et al. [13]. Because the LSR of the deep blue band of a bright surface is relatively low, the radiation entering the sensor contains more aerosol information. LSR information is therefore obtained by establishing a database of deep blue bands, and the radiation transmission process of these bands is simulated to obtain the AOD of the bright surface, which was introduced into the MOD04 C5 product. In the improved MOD04 C6 product, the improved algorithm introduces land use type and establishes a dynamic LSR database, particularly useful in areas with rapidly changing surfaces. In urban areas, the bidirectional reflectance distribution function (BRDF) was considered, and the LSR database was established in urban areas in combination with the BRDF model [14,15,16]. The varying sources and composition of aerosols across different regions is the main source of uncertainty in AOD retrieval [17]. Comparatively, the DB algorithm is more adaptable to the underlying surface type, but requires the support of an accurate LSR database in the target area. Although the DT algorithm does not require database support, the spatial continuity of the retrieval results is poor.
The spatial resolution of MOD04 C5 is 10 km, and that of MOD04 C6 is 10 and 3 km [18]. Although MOD04 C6 has a good global accuracy, the retrieval of pollutants in small-and medium-sized areas is limited due to the coarse spatial resolution. Therefore, an increasing number of studies have been carried out focusing on aerosol retrieval with high spatial resolution and precision. Lyapustin et al. [19,20] proposed a multiangle implementation of the atmospheric correction (MAIAC) algorithm to retrieve AOD over land with a resolution of 1 km, which has become a new operational MODIS retrieval algorithm. Wong et al. [21] developed a new aerosol retrieval algorithm based on MODIS apparent reflectance images and using the minimum reflectance technique. AOD values with a resolution of 500 m were subsequently retrieved over Hong Kong and the Pearl River Delta. Recently, a high-spatial-resolution aerosol retrieval algorithm based on the a priori Land Surface Reflectance Database (HARLS) was developed for use in MODIS images over bright urban land surfaces [22] and then further improved for global land surfaces (I-HARLS) [23].
Gaofen 4 (GF-4) is the first Chinese high-resolution geostationary satellite. As the first synchronous high-resolution satellite, it requires 75 s to produce a panchromatic multispectral image with good temporal resolution that allows for rapidly updating AOD estimates in certain regions. The spatial resolution (50 m) can reflect the spatial distribution law of AOD in sufficient detail, and the image width (400 km) is capable of large-scale AOD retrieval. This study aimed to develop a robust regional aerosol retrieval algorithm capable of generating a 1 km spatial resolution AOD from GF-4 PMS images for aerosol studies at small and medium-range scales. There are differences between the GF-4 and MODIS satellites, and the existing AOD retrieval methods cannot be directly applied to the GF-4 satellite for two main aspects: first, there are large differences in spectral channels between MODIS and GF-4 satellites, and we transformed the surface reflectance of used channels between MODIS and GF-4 satellites using the spectral convolution method to improve the surface reflectance estimation. Second, the existing AOD retrieval methods used several global aerosol types determined by experience, which are too rough to be used in local areas. To overcome this issue, we define finer regional seasonal aerosol types based on historical AERONET ground-based observations using the time series analysis method to improve the aerosol type assumption. In this study, we considered and resolved the following issues:
(1)
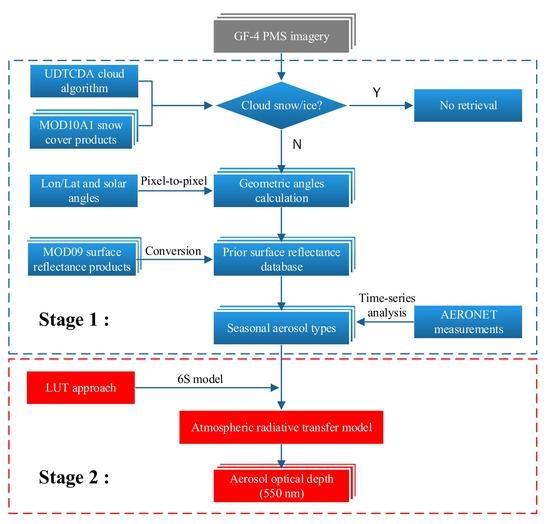
Since band 10 in MOD09 has the highest coincidence degree with band 2 in GF-4, MOD09 band 10 was used supporting AOD retrieval. However, there are still differences between MODIS band 10 and GF-4 band 2. Conversion was performed to resolve the difference in the central wavelength, bandwidth, and absorption peaks between the MODIS and PMS blue band. The aerosol types were determined by analyzing the aerosol optical properties in a long time series [24].
(2)
Because pixel-by-pixel geometric information of the GF-4 PMS image was not available, we calculated the observed zenith angle, relative azimuth angle, and solar zenith angle of each pixel in the PMS image.
(3)
In terms of removing useless pixels, we use the universal dynamic threshold cloud detection algorithm(UDTCDA) [25] to reconstruct the dynamic threshold pixel by pixel and remove the cloud pixels. MOD10A1 data were used to mask snow pixels.
(4)
The 6S [19] radiation transfer model was used to establish quantitative relationship between the relative position of the sun and the satellite, LSR, AOD, and the apparent reflectance in the blue wave bands. The AOD can be calculated by comparing the satellite apparent reflectance with that simulated from the 6S model for pixels meeting the retrieval conditions (no cloud and snow, LSR(0.483–0.493μm) < 0.15) [26].
On this basis, a high spatial resolution aerosol retrieval algorithm suitable for GF-4 PMS was developed. Its accuracy was verified using six Aerosol Robotic Network (AERONET) sites, and its applicability was verified under different values of surface reflectance. The primary difficulty of this research lied in the spatiotemporal matching and application of multisource data as it required the support of multiple data sources and pixel-by-pixel matching.

2. Materials and Methods

2.1. Data Introduction

2.1.1. GF-4 PMS Data

The parameters of the GF-4 satellite are shown in Table 1. GF-4 data were obtained from the China Centre for Resources Satellite Data and Application website (http://www.cresda.com/CN/(accessed on 1 January 2021).The GF-4 PMS image has a high spatial resolution of 50 m in the visible to near-infrared channels, and of 400 m for the mid-infrared channel, with a temporal resolution of 1 day, thus having significant advantages in AOD retrieval. However, the blue wavelength of the GF-4 satellite is 0.45–0.52 μm, larger than the LSR “deep blue” band, thus limiting the application of the DB algorithm to GF-4 data. In addition, because there were some calibration issues in GF-4 images after the satellite had been launched into space, we modified the orthographic image correction to correct the displacement of pixel points caused by the topographic relief and sensor errors and improved the image quality. In this study, 156 cloudless GF-4 PMS images from 2017 to 2018 were used for AOD retrieval and verification.

2.1.2. AERONET AOD Measurements

The Aerosol Robotic NETwork (AERONET) is a global, ground-based, aerosol observation network set up by NASA (USA) and the Centre National de la Recherche Scientifique (CNRS, France). As of October 2020, it has more than 1065 observation sites. The sun photometer used in each monitoring station obtains data every 3 min. The network system provides AOD, Ångström exponent, precipitation data, and other products in 8 bands across 340–1640 nm [27]. For the latest AERONET Version 3 data, unlike Level 1.0 (unscreened), Level 1.5 (cloud-screened and quality controlled) measurements have also been subjected to strict quality controls including raw data checks (sensor temperature, digital counts, clock shift, etc.), collimator consistency checks, AOD diurnal dependence checks, AOD spectral dependence checks, and solar eclipse screening. They have been reported to be highly consistent with Level 2.0 (quality-assured) in most cases [28,29].
Considering that there are only a few ground-based AERONET stations in eastern China, and some stations do not even provide Level 2.0 measurements, if we only use the Level 2.0 data, the validation samples will be significantly reduced by about 76%. Such a small data sample will affect the accuracy evaluation of aerosol retrievals. Therefore, in the current study, we give priority to using Level 2.0 data, and if it is not available, Level 1.5 data will be used. This method has also been widely adopted in previous related studies [30,31,32,33,34,35]. Here, we collected data from 2017 to 2018 across six AERONET sites distributed across both urban and rural locations: Beijing_PKU (39.992°N, 116.310° E), Beijing-CAMS (39.933°N, 116.317°E), Beijing_RADI (40.005°N, 116.379°E), Beijing (39.977°N, 116.381°E), XiangHe (39.754°N, 116.962°E), Xu-Zhou (34.217°N, 117.142°E).

2.2. AOD Retrieval for GF-4 PMS Imagery

The energy received by the satellite sensor in the visible to NIR wavelengths is shown in Equation (1) [36,37]:
  ρ TOA τ , θ s , θ v , φ   = ρ a τ , θ s , θ v , φ + T θ s T θ v ρ s θ s , θ v , φ 1 ρ s θ s , θ v , φ S
where ρ TOA τ , θ s , θ v , φ is the apparent reflectance; ρ a τ , θ s , θ v , φ is the atmospheric path radiation, which refers to the radiation that does not reach the ground but is directly received by satellite sensors due to atmospheric reflection and scattering; θ s , θ v , φ are the solar zenith angle, satellite zenith angle, and relative azimuth angle, respectively; T θ s T θ v are the atmospheric downward and upward transmittance, respectively; ρ s θ s , θ v , φ is the land surface reflectance; S is the atmospheric hemisphere reflectivity; and τ is the atmospheric optical depth. Among them, only τ and ρ s ρ_s are unknown quantities. Therefore, the unknowns will be ρ blue ,   ρ red , and τ. However, there are still fewer equations than the number of unknowns, and thus, they cannot be solved. The principle of the DT algorithm is that the apparent reflectivity at 2.1 μm is used to approximate LSR to determine ρ s , but aerosol information at 2.1 μm is limited. This problem is addressed by using the multiple relations between ρ s 0.66 μ m , ρ s 0.47 μ m ,   and ρ s 2.1 μ m in dense vegetation areas; thus, the equation only has one, solvable unknown. However, in high-LSR regions, no stable linear relationship exists among the bands, and the influence of aerosols in the coupling of the earth and atmosphere is decreased. The DB algorithm addresses this problem by taking advantage of the low reflectivity of most ground objects in the blue band and directly determines ρ blue for the blue wavelength through the constructed blue band LSR database, pixel-by-pixel. After ρ blue has been determined, τ can be solved directly. The GF-4 AOD algorithm developed by us adopted an idea similar to the DB algorithm to ensure an effective calculation of AOD values in as many areas as possible.

2.2.1. Surface Reflectance Estimation

MOD09 is the global land surface reflectance product of MODIS, obtained through atmospheric correction based on the MODIS 1B radiation data product. In the correction process, the aerosol optical properties of different regions are considered, cloud mask algorithm is improved, and quality control is applied [38]. Since Band 10 of MOD09 is most similar to the blue band peak of GF-4, and the band range is similar (Table 1), the retrieval supported LSR database was selected, with a spatial resolution of 1000 m.
Urban areas have higher blue band LSR than marine and densely vegetated areas, and the AOD in the visible band is generally < 0.25 [7], making it difficult to separate aerosol information from apparent reflectance. For every unit increase in LSR error, the corresponding AOD error will increase by 10 [39]. Therefore, an accurate LSR database should first be obtained. When LSR values are low, apparent reflectance values primarily stem from clouds and the atmosphere. Assuming that the surface objects have remained relatively stable across the two-year examination period [40], if images of the same Julian calendar date have different values, this indicates the influence of atmospheric and cloud effects, and smaller values should be taken as the true LSR. Therefore, the blue band of MOD09 data was synthesized into monthly surface reflectance data using this minimum reflectivity technique [26], which was further used as the LSR database to support the AOD calculations. Figure 1 shows the blue band LSR data for different months in 2017–2018.
The central wavelength, bandwidth, and absorption peak of the MODIS blue band are greatly different from PMS, so that they needed to be transformed. The specific method for this was as follows: 58 types of ground object spectra were found in the United States Geological Survey (USGS) spectral library, and Equation (2) was used to calculate the spectrum of each ground object. In the equation, R λ represents the ground object spectrum and f λ represents the spectral response function of MODIS or PMS. After calculation, the conversion relationship between GF-4 PMS Band 2 ( ρ GF 4 ) and MODIS Band 10 ( ρ MODIS ) reflectance can be established with a correlation coefficient (r) reaching 0.998.
ρ = λ min λ max R λ f λ d λ λ min λ max f λ   d λ
ρ GF 4 = 0.989 ρ MODIS + 0.004 , R = 0.998

2.2.2. Calculation of Pixel-By-Pixel Imaging via the Geometric Angle

The field of view of the GF-4 PMS camera is 0.8°, but the official data only provide the imaging geometric angle of the center pixel. With an increase in the side swing angle, the zenith angle of the satellite gradually increases. To accurately simulate the radiation transmission process of sunlight, it is necessary to determine the solar zenith angle by pixel and observe the zenith angle and relative azimuth angle. The calculation method is shown in Equations (4)–(9) [41].
cos   SOZ   = cos   Lat   cos δ cos ω + sin   Lat   sin δ  
r sin   SAZ = d sin   arccos   cos   Lat cos   SatLon Lon
cos   SOA   = sin δ cos Lat cos δ sin   Lat cos ω cos   0.5 π SAZ
In Equations (4)–(6), SOZ is the solar zenith angle, Lat is the pixel latitude, δ is the solar declination angle, and ω is the solar hour angle. SAZ is the satellite zenith angle, r is the distance from the satellite to the center of the earth, d is the distance from the satellite to the ground pixel, SatLon is the longitude of the satellite’s sub-satellite point, Lon is the longitude of the pixel, and SOA is the solar azimuth.
cos β = cot γ tan   Lat
Lon SatLon 0 , Lat SatLat < 0 , SAA = β Lon SatLon < 0 , Lat SatLat 0 , SAA = π β Lon SatLon 0 , Lat SatLat > 0 , SAA = π + β Lon SatLon > 0 , Lat SatLat 0 , SAA = 2 π β
REA =   SOA SAA
The relative azimuth of the geostationary satellite can be calculated through Equations (7)–(9), where β represents the intermediate variable, SSA represents the satellite azimuth, and REA is the relative azimuth. Please note that if REA > π, REA = 2π − REA.

2.2.3. Aerosol Type Assumption

Every type of aerosol possesses unique optical properties, such as complex refractive index, extinction efficiency factors, scattering phase functions, and single scattering albedos, all influencing the solar radiation transmission process [23]. Therefore, accurately determining regional aerosol types is an essential step in calculating AOD. We used the custom results by Wei et al. [2] for aerosol types near Beijing. Aerosol types changed slightly over this short period, and the dominant factors that determined the aerosol types at each station showed a strong seasonal influence [11,12,42,43,44]. In the surrounding areas of Xuzhou, using the method of Wei et al. [2] as a reference, the aerosol parameters of different seasons at AERONET during 2017–2018 were averaged, and the aerosol types of each sea-son were customized. The statistical results are shown in Table 2.

2.2.4. Cloud and Snow Screening

In this study, we selected our proposed Universal Dynamic Threshold Cloud Detection Algorithm (UDTCDA) to identify and mask the cloud pixels in GF-4 images here [45]. UDTCDA is performed based on the pre-calculated surface reflectance database, which can significantly reduce the influence of mixed pixels and improve the detection accuracy of thin and broken clouds. Here, we simulated and reconstructed the dynamic threshold models of visible to near infrared channels for the GF-4 satellite:
ρ b * ' = 0.8077     ρ b + 0.03673     cos θ s cos θ v + 0.1355
ρ g * ' = 0.7991     ρ g + 0.0239     cos θ s cos θ v + 0.08047
ρ r * ' = 0.8419     ρ r + 0.01666     cos θ s cos θ v + 0.04654
ρ NIR * ' = 0.8495     ρ NIR + 0.01065     cos θ s cos θ v + 0.02873
C i = ρ i * > ρ i * '   and   F =   C b C g C r C NIR
where ρ i * ' represents the dynamic cloud thresholds at the blue ( ρ b * ' ), green ( ρ g * ' ), red ( ρ r * ' ), and NIR ( ρ NIR * ' ) channels. C i represents the channel-dependent cloud result and F represents the final cloud mask. ρ i represents the MODIS surface reflectance.
Since GF-4 lacks the key bands for calculating the normalized difference snow index (NDSI), we employed the MOD10A1 daily snow cover products to screen snow/ice pixels.

2.3. Validation Method

For the ground-based observation data of AERONET, we took all observation values of AERONET stations within 30 min before and after the transit time of the satellite, removed problematic observations with large fluctuations that exceed the average value by plus or minus three times the standard deviation, and then used the average value as the actual observation value of the respective point.
On the spectral scale, the AOD at 550 nm was obtained by satellite retrieval, while AERONET does not have aerosol observation data at this wavelength. Therefore, to achieve the matching between the AOD values, the Ångström equation was used to convert the AOD of AERONET to 550 nm. In the process of spatial matching, the corresponding latitude and longitude of the nine AERONET sites were converted into row and column values on the image. A square five-pixel radius surrounding the measurement site was selected as the verification area, and the values of effective AOD retrievals were averaged and compared with AERONET data using common evaluation metrics including correlation coefficient (r), root mean square error (RMSE), mean absolute error (MAE), mean relative error (MRE), relative mean bias (RMB), and the MODIS Expert Error over land [46], calculated according to Equation (15):
EE = ± 0.05 + 0.2 × AOD AERONET
where AOD AERONET represents AERONET values, and EE represents the expected allowable margin of error.

3. Results and Discussion

3.1. Validation against AERONET Ground Measurements

We compared the GF-4 AOD retrieval results with the monitoring results of six AERONET stations in eastern China during 2017–2018. The AERONET data were selected at Level 2.0 and Level 1.5, and the accuracy of the verification results are shown in Table 3. Among them, Beijing, Beijing_PKU, Beijing-CAMS, and Beijing_RADI were located in urban areas, while XiangHe and XuZhou were located in rural areas. In total, 429 validation data points were obtained. In general, in our GF-4 AOD algorithm, 71.33% of the points were within EE, 17.88% of the sample points were higher than the EE boundary, and RMB = 1.05. r reached 0.922, whereas RMSE and MAE were 0.122 and 0.089, respectively. The retrieval results were consistent with the AERONET monitoring results. Furthermore, the results show that the new algorithm works well in both rural areas and bright urban areas, but the overall accuracy in urban areas (e.g., r = 0.895, RMSE = 0.143, and within EE = 69.01%) is slightly worse than that in rural areas (e.g., r = 0.943, RMSE = 0.097, and within EE = 73.84%).

3.2. Comparison with Operational MOD04 AOD Products

It is fair to compare different methods using the satellites with the similar resolutions. However, most of the operational aerosol products are generated from satellites with medium and low resolutions; among them, MODIS is the most popular one, and has been widely used for comparison in previous studies because of its various mature aerosol retrieval algorithms (e.g., DT and DB) at different spatial resolutions (e.g., 3 km and 10 km). For the other satellites, limited by the aerosol retrieval algorithms, their spatial resolution and overall accuracy are overall lower than those of MODIS products. Of course, many scholars have developed their own algorithms to retrieve AODs from different high-resolution satellites [47,48,49,50,51,52], but these generated data are not public, making it impossible to perform a comparison. Considering these, MODIS DT and DB AOD products at different resolutions are selected for comparison in the current study.
Figure 2 shows the AOD results obtained by our GF-4 AOD algorithms in the Beijing and Xuzhou, regions. The aerosol conditions selected by us existed in both the high and low AOD regions. From the perspective of aerosol spatial distribution, the acquired GF-4 AOD data were consistent with those of MODIS C6 products. In Beijing, AOD was lower in the southeast and higher in the northwest. In the mountainous area of northwest Beijing, GF-4 AOD was slightly higher than MODIS AOD. Near Xuzhou City, MODIS AOD and GF-4 AOD were higher in the eastern region and lower in the western region. In the southern region, the GF-4 AOD was significantly higher than MODIS AOD. Different algorithms have different cloud elimination and aerosol retrieval schemes; therefore, AOD includes different spatial ranges. Due to algorithm limitations, MOD04 DT AOD presented many missing values, and could not operate in some urban areas, but it provided a good spatial resolution. GF-4 AOD used a similar scheme for the DB algorithm to retrieve AOD in bright urban areas, thus providing finer aerosol information while ensuring spatial continuity.
GF-4 images covering the AERONET sites in 2017–2018 were selected as the data source, and the sites included urban and rural areas. The AOD values obtained by our GF-4 AOD algorithm were compared with the corresponding spatiotemporal AERONET data. MOD04 product results for the corresponding time were also added, and correlation analyses were calculated (the results are shown in Figure 3). The solid lines on either side of X = Y represent the upper and lower boundaries.
We compared the accuracy of the GF-4 AOD with that of the MOD04C6 product from 2017 to 2018. Among the three MOD04 products selected, the performance of the MOD04 3 km DT product was poor, with only 52.8% of the retrieved values falling within the EE range, with an average MAE of 0.138 and an RMSE of 0.204 (Figure 3b). A large overestimation of AOD values could be observed with more than 38% of the matched retrievals fell above the EE expectation line. The accuracy of the MOD04 10km DB product was obviously better than that of the MOD04 3 km DT product. Under the same verification data, 75.69% of the retrievals fell within the EE range, MAE and RMSE were lower (0.085 and 0.117, respectively), and the overestimation by the DB algorithm was greatly reduced. The cause for the overestimation by the DT algorithm is that this algorithm seriously underestimates the surface reflectance, especially in urban areas [23], while the DB algorithm effectively avoids this problem, using a more accurate surface reflectance database. In eastern China, compared to the MOD04 DT 3 km product, the MOD04 DT 10 km product had higher accuracy. This is mainly related to the smaller number of discardable radiance pixels within the AOD super pixel, i.e., the pixels used in the 3 km retrieval box may be discarded in the 10 km retrieval box [18,22]. However, our GF-4 AOD retrievals can effectively avoid such issue by applying the pixel-to-pixel aerosol retrieval scheme.
Our 1 km GF-4 AOD was slightly less accurate than the MOD04 10 km DB product, with higher RMSE and MAE values (0.122, 0.089, respectively) and a lower EE value (71.33%). However, compared with MOD04 3K product, our GF-4 AOD 1 km data were more accurate. The use of GF-4 can provide an AOD retrieval with a higher spatial and temporal resolution and a better accuracy, which is an advantage.
Judging from the above overall accuracy verification results, our GF-4 AOD has a decent overall accuracy and incomparable advantages in time and space resolution. To verify the adaptability of our GF-4 AOD algorithms in different regions, according to the Deep Blue surface reflectance database, LSRblue was subsequently divided into different intervals, and the sources of error were analyzed.

3.3. Retrieval Uncertainty Related to LSR Variations

Surface reflectance is a key factor affecting aerosol retrieval. Here, we discuss the accuracy and uncertainty of aerosol retrieval results under different LSRs. To verify the relationship between AOD retrieval accuracy and LSR, and to determine for which LSR interval our GF-4 AOD algorithm presents advantages, LSR was divided into four classes, and accuracy assessments of our GF-4 AOD algorithm were conducted for each class. The scatter plot and verification (Figure 4) show that when the LSR was 0–0.03, 76.39% of the points fell within the EE range; additionally, the RMSE was 0.116 and the error was lower than the average error of the verified data. Furthermore, when LSR > 0.05, 69.7% of the points fell within the EE range and the accuracy was the worst among all the LSR intervals. In general, the overall accuracy of the algorithm decreased with increasing LSR (as indicated by the increasing RMSE, MAE, and MRE, as well as the decreasing proportion of points within EE. However, despite the error being relatively small when 0.05 < LSR, this was limited by the relatively small sample number).
To investigate the impact of varying LSR on AOD retrieval, we simulated the relationships between apparent reflectance and surface reflectance of the blue channel under a custom-defined observation and atmospheric conditions using the 6S model. This showed that the apparent reflectance becomes less sensitive to AOD with increasing LSR because there is difficulty in performing the separation due to increased multiple scattering when the surface albedo is high; in addition, the AOD contribution to the radiance decreases as LSR increases [32,53]. Thus, the AOD estimates would be less accurate.

4. Conclusions

As a geosynchronous satellite, GF-4 has great advantages for the monitoring of aerosol changes with high temporal and spatial resolutions, but this potential has not been fully exploited yet. In this study, on the basis of the 6S radiation transfer model, we customized special aerosol types according to the aerosol environment in China in recent years, and to determine the geometric angle of each pixel in GF-4 images. After a series of optimization measures, we obtained the 1 km GF-4 AOD. Our GF-4 AOD was compared with the AERONET V3 2.0 AOD measurements and the MOD04 3 km and 10 km products.
In the 429 selected sets of validation data, our GF-4 AOD was strongly correlated with AERONET AOD, our GF-4 AOD retrievals were highly correlated with AERONET AODs (r = 0.922) and 71.33% of them fell within the EE range. On verifying the accuracy of bright urban areas and rural areas, our GF-4 AOD algorithm showed good adaptability, with a slightly lower accuracy in urban areas than in rural areas. Compared with the MOD04C6 version, our GF-4 1 km AOD showed better spatial continuity and higher spatial resolution, and the calculated high-AOD and low-AOD distribution areas were similar to those acquired from the corresponding MOD04. The accuracy of GF-4 AOD improved significantly compared with that of the 3 km DT AOD, but it was slightly lower than that of the 10 km DB AOD. The main reason for this is that although there was a good consistency, the converted surface reflectance from MODIS to GF-4 can result in some uncertainties. In addition, we did not consider the effects of BRDF on aerosol retrievals, which may have an impact on the highly heterogeneous surfaces. Theoretically, with an increase in the LSR, the accuracy of the AOD retrieval should continue to decline. The actual verification results were consistent with this theoretical assumption. The accuracy of our GF-4 AOD algorithm decreased with an increase in the LSR, with the highest accuracy observed at LSR < 0.03.
Our work is of great significance for aerosol retrieval on a small scale. These results have theoretical and practical significance for aerosol research and can lead to improvements in the use of retrieval algorithms with GF-4 satellite data. GF-4 is a new high-resolution geostationary satellite and was officially put into use on 13 June 2016, with most of the field of view of GF-4 images covering the domain area of China. Therefore, due to limited data access, we only collected the GF-4 images in eastern China after 2017 for the current experiment. Of course, this study only provides a new idea of AOD retrieval from the GF satellite, which can be extended to other regions with different time periods. In addition, in a future study, we will generate ahigh-resolution AOD dataset for China since the launch of the GF-4 satellite.

Author Contributions

Conceptualization, Z.S. and J.W.; methodology, L.S. and J.W.; software, Z.S.; validation, Z.S.; formal analysis, Z.S.; investigation, Z.S.; writing—original draft preparation, Z.S.; writing—review and editing, J.W and L.S.; supervision, L.S. and J.W.; data curation, N.Z., Y.H., Y.S., X.L. and H.Y.; project administration, L.S.; funding acquisition, L.S. All authors have read and agreed to the published version of the manuscript.

Funding

This research was funded by the National Key Research and Development Program (2019YFE0126700) and the Shandong Provincial Natural Science Foundation (ZR2020MD051).

Data Availability Statement

The data presented in this study are available on request from the co-first authors.

Conflicts of Interest

The authors declare no conflict of interest.

References

  1. Wei, J.; Li, Z.; Lyapustin, A.; Sun, L.; Peng, Y.; Xue, W.; Su, T.; Cribb, M. Reconstructing 1-km-resolution high-quality PM2.5 data records from 2000 to 2018 in China: Spatiotemporal variations and policy implications. Remote Sens. Environ. 2021, 252, 112–136. [Google Scholar]
  2. Wei, J.; Li, Z.; Peng, Y.; Sun, L.; Yan, X. A regionally robust high-spatial-resolution aerosol retrieval algorithm for MODIS images over Eastern China. IEEE Trans. Geosci. Remote. Sens. 2019, 57, 4748–4757. [Google Scholar] [CrossRef]
  3. Wei, J.; Li, Z.; Xue, W.; Sun, L.; Fan, T.; Liu, L.; Su, T.; Cribb, M. The ChinaHighPM10 dataset: Generation, validation, and spatiotemporal variations from 2015 to 2019 across China. Environ. Int. 2021, 146, 106290. [Google Scholar] [CrossRef]
  4. Wei, J.; Li, Z.; Pinker, R.T.; Wang, J.; Sun, L.; Xue, W.; Li, R.; Cribb, M. Himawari-8-derived diurnal variations in ground-level PM 2.5 pollution across China using the fast space-time Light Gradient Boosting Machine (LightGBM). Atmos. Chem. Phys. 2021, 21, 7863–7880. [Google Scholar]
  5. Colvile, R.; Hutchinson, E.J.; Mindell, J.; Warren, R. The transport sector as a source of air pollution. Atmos. Environ. 2001, 35, 1537–1565. [Google Scholar] [CrossRef] [Green Version]
  6. Clarke, A.; Collins, W.; Rasch, P.; Kapustin, V.; Moore, K.; Howell, S.; Fuelberg, H. Dust and pollution transport on global scales: Aerosol measurements and model predictions. J. Geophys. Res. Atmos. 2001, 106, 32555–32569. [Google Scholar] [CrossRef]
  7. Kaufman, Y.J.; Sendra, C. Algorithm for automatic atmospheric corrections to visible and near-IR satellite imagery. Int. J. Remote Sens. 1988, 9, 1357–1381. [Google Scholar] [CrossRef]
  8. Levy, R.; Remer, L.; Kleidman, R.; Mattoo, S.; Ichoku, C.; Kahn, R.; Eck, T. Global evaluation of the Collection 5 MODIS dark-target aerosol products over land. Atmos. Chem. Phys. 2010, 10, 10399–10420. [Google Scholar] [CrossRef] [Green Version]
  9. Sun, L.; Sun, C.; Liu, Q.; Zhong, B. Aerosol optical depth retrieval by HJ-1/CCD supported by MODIS surface reflectance data. Sci. China Earth Sci. 2010, 53, 74–80. [Google Scholar] [CrossRef]
  10. Tian, X.-p.; Sun, L. Retrieval of aerosol optical depth over arid areas from MODIS data. Atmos 2016, 7, 134. [Google Scholar] [CrossRef] [Green Version]
  11. Levy, R.C.; Remer, L.A.; Tanreé, D.; Mattoo, S.; Kaufman, Y.J. Algorithm for Remote Sensing of Tropospheric Aerosol over Dark Targets from MODIS: Collections 005 and 051: Revision 2; February 2009. MODIS Algorithm Theoretical Basis Document, 2009. Available online: https://atmosphere-imager.gsfc.nasa.gov/sites/default/files/ModAtmo/ATBD_MOD04_C005_rev2_0.pdf (accessed on 17 September 2021).
  12. Levy, R.C.; Remer, L.A.; Mattoo, S.; Vermote, E.F.; Kaufman, Y.J. Second-generation operational algorithm: Retrieval of aerosol properties over land from retrieval of Moderate Resolution Imaging Spectroradiometer spectral reflectance. J. Geophys. Res. Atmos. 2007, 112, D13211. [Google Scholar] [CrossRef] [Green Version]
  13. Hsu, N.C.; Tsay, S.-C.; King, M.D.; Herman, J.R. Deep blue retrievals of Asian aerosol properties during ACE-Asia. IEEE Trans. Geosci. Remote. Sens. 2006, 44, 3180–3195. [Google Scholar] [CrossRef]
  14. Hsu, N.; Jeong, M.J.; Bettenhausen, C.; Sayer, A.; Hansell, R.; Seftor, C.; Huang, J.; Tsay, S.C. Enhanced Deep Blue aerosol retrieval algorithm: The second generation. J. Geophys. Res. Atmos. 2013, 118, 9296–9315. [Google Scholar] [CrossRef]
  15. Munchak, L.; Levy, R.; Mattoo, S.; Remer, L.; Holben, B.; Schafer, J.; Hostetler, C.; Ferrare, R. MODIS 3 km aerosol product: Applications over land in an urban/suburban region. Atmos. Meas. Tech. 2013, 6, 1747–1759. [Google Scholar] [CrossRef] [Green Version]
  16. Wei, J.; Li, Z.; Peng, Y.; Sun, L. MODIS Collection 6.1 aerosol optical depth products over land and ocean: Validation and comparison. Atmos. Environ. 2019, 201, 428–440. [Google Scholar] [CrossRef]
  17. Solomon, S. The physical science basis: Contribution of Working Group I to the fourth assessment report of the Intergovernmental Panel on Climate Change. Intergov. Panel Clim. Chang. Clim. Chang. 2007, 2007, 996. [Google Scholar]
  18. Remer, L.; Mattoo, S.; Levy, R.; Munchak, L. MODIS 3 km aerosol product: Algorithm and global perspective. Atmos. Meas. Tech. 2013, 6, 1829–1844. [Google Scholar] [CrossRef] [Green Version]
  19. Lyapustin, A.; Wang, Y.; Korkin, S.; Huang, D. MODIS collection 6 MAIAC algorithm. Atmos. Meas. Tech. 2018, 11, 5741–5765. [Google Scholar] [CrossRef] [Green Version]
  20. Lyapustin, A.; Wang, Y.; Laszlo, I.; Kahn, R.; Korkin, S.; Remer, L.; Levy, R.; Reid, J.S. Multiangle implementation of atmospheric correction (MAIAC): 2. Aerosol algorithm. J. Geophys. Res. Atmos. 2011, 116. [Google Scholar] [CrossRef]
  21. Man, S.; Nichol, J.; Lee, K. Retrieval of Aerosol Optical Thickness Using MODIS 500 × 500 m, a study in Hong Kong and Pearl River Delta Region. IEEE Trans. Geosci. Remote Sens. 2010, 48, 3318–3327. [Google Scholar]
  22. Wei, J.; Sun, L. Comparison and evaluation of different MODIS aerosol optical depth products over the Beijing-Tianjin-Hebei region in China. IEEE J. Sel. Top. Appl. Earth Obs. Remote Sens. 2016, 10, 835–844. [Google Scholar] [CrossRef]
  23. Wei, J.; Sun, L.; Peng, Y.; Wang, L.; Zhang, Z.; Bilal, M.; Ma, Y. An improved high-spatial-resolution aerosol retrieval algorithm for MODIS images over land. J. Geophys. Res. Atmos. 2018, 123, 12291–12307. [Google Scholar] [CrossRef]
  24. Kotchenova, S.Y.; Vermote, E.F. Validation of a vector version of the 6S radiative transfer code for atmospheric correction of satellite data. Part II. Homogeneous Lambertian and anisotropic surfaces. Appl. Opt. 2007, 46, 4455–4464. [Google Scholar] [CrossRef] [Green Version]
  25. Sun, L.; Wei, J.; Wang, J.; Mi, X.; Guo, Y.; Lv, Y.; Yang, Y.; Gan, P.; Zhou, X.; Jia, C. A universal dynamic threshold cloud detection algorithm (UDTCDA) supported by a prior surface reflectance database. J. Geophys. Res. Atmos. 2016, 121, 7172–7196. [Google Scholar] [CrossRef]
  26. Sun, L.; Wei, J.; Bilal, M.; Tian, X.; Jia, C.; Guo, Y.; Mi, X. Aerosol optical depth retrieval over bright areas using Landsat 8 OLI images. Remote Sens. 2016, 8, 23. [Google Scholar] [CrossRef] [Green Version]
  27. Bilal, M.; Nichol, J.E. Evaluation of MODIS aerosol retrieval algorithms over the Beijing-Tianjin-Hebei region during low to very high pollution events. J. Geophys. Res. Atmos. 2015, 120, 7941–7957. [Google Scholar] [CrossRef] [Green Version]
  28. Giles, D.M.; Holben, B.N.; Eck, T.F.; Smirnov, A.; Sinyuk, A.; Schafer, J.; Sorokin, M.G.; Slutsker, I. Aerosol robotic network (AERONET) version 3 aerosol optical depth and retrieval products. In Proceedings of the American Geophysical Union (AGU) Fall Meeting, New Orleans, LA, USA, 11–15 December 2017. [Google Scholar]
  29. Giles, D.M.; Sinyuk, A.; Sorokin, M.G.; Schafer, J.S.; Smirnov, A.; Slutsker, I.; Eck, T.F.; Holben, B.N.; Lewis, J.R.; Campbell, J.R. Advancements in the Aerosol Robotic Network (AERONET) Version 3 database–automated near-real-time quality control algorithm with improved cloud screening for Sun photometer aerosol optical depth (AOD) measurements. Atmos. Meas. Tech. 2019, 12, 169–209. [Google Scholar] [CrossRef] [Green Version]
  30. Jin, S.; Zhang, M.; Ma, Y.; Gong, W.; Chen, C.; Yang, L.; Hu, X.; Liu, B.; Chen, N.; Du, B.; et al. Adapting the Dark Target Algorithm to Advanced MERSI Sensor on the FengYun-3-D Satellite: Retrieval and Validation of Aerosol Optical Depth Over Land. IEEE Trans. Geosci. Remote Sens. 2021, 3021021, 1–17. [Google Scholar]
  31. Ge, B.; Li, Z.; Liu, L.; Yang, L.; Chen, X.; Hou, W.; Zhang, Y.; Li, D.; Li, L.; Qie, L. A Dark Target Method for Himawari-8/AHI Aerosol Retrieval: Application and Validation. IEEE Trans. Geosci. Remote Sens. 2019, 57, 381–394. [Google Scholar] [CrossRef]
  32. Wei, J.; Li, Z.; Sun, L.; Yang, Y.; Zhao, C.; Cai, Z. Enhanced Aerosol Estimations From Suomi-NPP VIIRS Images over Heterogeneous Surfaces. IEEE Trans. Geosci. Remote Sens. 2019, 57, 9534–9543. [Google Scholar] [CrossRef]
  33. Su, T.; Laszlo, I.; Li, Z.; Wei, J.; Kalluri, S. Refining aerosol optical depth retrievals over land by constructing the relationship of spectral surface reflectances through deep learning: Application to Himawari-8. Remote Sens. Environ. 2020, 251, 112093. [Google Scholar] [CrossRef]
  34. Xie, Y.; Xue, Y.; Guang, J.; Mei, L.; She, L.; Li, Y.; Che, Y.; Fan, C. Deriving a Global and Hourly Data Set of Aerosol Optical Depth Over Land Using Data From Four Geostationary Satellites: GOES-16, MSG-1, MSG-4, and Himawari-8. IEEE Trans. Geosci. Remote Sens. 2020, 58, 1538–1549. [Google Scholar] [CrossRef]
  35. Tian, X.; Liu, Q.; Gao, Z.; Wang, Y.; Li, X.; Wei, J. Improving MODIS Aerosol Estimates Over Land with the Surface BRDF Reflectances Using the 3-D Discrete Cosine Transform and RossThick-LiSparse Models. IEEE Trans. Geosci. Remote Sens. 2021, 12, 1–10. [Google Scholar] [CrossRef]
  36. Tanré, D.; Herman, M.; Deschamps, P.; De Leffe, A. Atmospheric modeling for space measurements of ground reflectances, including bidirectional properties. Appl. Opt. 1979, 18, 3587–3594. [Google Scholar] [CrossRef]
  37. Vermote, E.F.; Tanré, D.; Deuze, J.L.; Herman, M.; Morcette, J.-J. Second simulation of the satellite signal in the solar spectrum, 6S: An overview. IEEE Trans. Geosci. Remote. Sens. 1997, 35, 675–686. [Google Scholar] [CrossRef] [Green Version]
  38. Vermote, E. MODIS Surface Reflectance User’s Guide (Collection 6). 2020. Available online: https://modis-land.gsfc.nasa.gov/pdf/MOD09_C61_UserGuide_v1.5.pdf (accessed on 17 September 2021).
  39. Kaufman, Y.J.; Wald, A.E.; Remer, L.A.; Bo-Cai, G.; Rong-Rong, L.; Flynn, L. The MODIS 2.1-/spl mu/m channel-correlation with visible reflectance for use in remote sensing of aerosol. IEEE Trans. Geosci. Remote. Sens. 1997, 35, 1286–1298. [Google Scholar] [CrossRef]
  40. Li, S.; Chen, L.; Tao, J.; Han, D.; Wang, Z.; Su, L.; Fan, M.; Yu, C. Retrieval of aerosol optical depth over bright targets in the urban areas of North China during winter. Sci. China Earth Sci. 2012, 55, 1545–1553. [Google Scholar] [CrossRef]
  41. Soler, T.; Eisemann, D.W. Determination of look angles to geostationary communication satellites. J. Surv. Eng. 1994, 120, 115–127. [Google Scholar] [CrossRef] [Green Version]
  42. Dumka, U.; Kaskaoutis, D.; Mihalopoulos, N.; Sheoran, R. Identification of key aerosol types and mixing states in the central Indian Himalayas during the GVAX campaign: The role of particle size in aerosol classification. Sci. Total Environ. 2021, 761, 143188. [Google Scholar] [CrossRef] [PubMed]
  43. Hamill, P.; Giordano, M.; Ward, C.; Giles, D.; Holben, B. An AERONET-based aerosol classification using the Mahalanobis distance. Atmos. Environ. 2016, 140, 213–233. [Google Scholar] [CrossRef]
  44. Korras-Carraca, M.; Hatzianastassiou, N.; Matsoukas, C.; Gkikas, A.; Papadimas, C. The regime of aerosol asymmetry parameter over Europe, the Mediterranean and the Middle East based on MODIS satellite data: Evaluation against surface AERONET measurements. Atmos. Chem. Phys. 2015, 15, 13113–13132. [Google Scholar] [CrossRef] [Green Version]
  45. Quan, W.; Lin, S.; Jing, W. Improvement of universal dynamic threshold cloud detection algorithm and its application in high resolution satellite. AcOpS 2018, 38, 376–385. [Google Scholar]
  46. Xue, Y.; He, X.; de Leeuw, G.; Mei, L.; Che, Y.; Rippin, W.; Guang, J.; Hu, Y. Long-time series aerosol optical depth retrieval from AVHRR data over land in North China and Central Europe. Remote Sens. Environ. 2017, 198, 471–489. [Google Scholar] [CrossRef]
  47. Chen, X.; Ding, J.; Wang, J.; Ge, X.; Raxidin, M.; Liang, J.; Chen, X.; Zhang, Z.; Cao, X.; Ding, Y. Retrieval of fine-resolution aerosol optical depth (AOD) in semiarid urban areas using Landsat data: A case study in Urumqi, NW China. Remote Sens. 2020, 12, 467. [Google Scholar] [CrossRef] [Green Version]
  48. Jin, Y.; Hao, Z.; Chen, J.; He, D.; Tian, Q.; Mao, Z.; Pan, D. Retrieval of Urban Aerosol Optical Depth from Landsat 8 OLI in Nanjing, China. Remote Sens. 2021, 13, 415. [Google Scholar] [CrossRef]
  49. Omari, K.; Abuelgasim, A.; Alhebsi, K. Aerosol optical depth retrieval over the city of Abu Dhabi, United Arab Emirates (UAE) using Landsat-8 OLI images. Atmos. Pollut. Res. 2019, 10, 1075–1083. [Google Scholar] [CrossRef]
  50. Ou, Y.; Chen, F.; Zhao, W.; Yan, X.; Zhang, Q. Landsat 8-based retrieval methods for aerosol optical depths in the Beijing area. Atmos. Pollut. Res. 2017, 8, 267–274. [Google Scholar] [CrossRef]
  51. Wang, X.Q.; Wang, F.; Jia, L.L.; Ding, Y. Retrieval and validation of aerosol optical depth using GF-1 WFV cameras data—ScienceDirect. AdSpR 2020, 65, 997–1007. [Google Scholar]
  52. Zhang, Z.; Fan, M.; Wu, W.; Wang, Z.; Tao, M.; Wei, J.; Wang, Q. A simplified aerosol retrieval algorithm for Himawari-8 Advanced Himawari Imager over Beijing. Atmos. Environ. 2019, 199, 127–135. [Google Scholar] [CrossRef]
  53. Wei, J.; Sun, L.; Huang, B.; Bilal, M.; Zhang, Z.; Wang, L. Verification, improvement and application of aerosol optical depths in China Part 1: Inter-comparison of NPP-VIIRS and Aqua-MODIS. Atmos. Environ. 2018, 175, 221–233. [Google Scholar] [CrossRef]
Figure 1. Monthly composite land surface reflectance images (1 km) for eastern China in the blue band (0.477–0.495 µm); (al) represent January–December, respectively.
Remotesensing 13 03752 g001
Figure 2. (a) Standard false color images, and spatial distributions of (b) MOD04C6.1 DB (10 km), (c) DT (10 km), (d) DT (3 km), and (e) our new (1 km) AOD data sets for (i) on 4 October 2018 over Beijing, and (ii) on 8 September 2018 over Xuzhou.
Remotesensing 13 03752 g002
Figure 3. Comparison of our 1 km AOD retrievals (red dots) matched with (a) MOD04 10 km DB, (b) 3 km DT, (c) 10 km DT retrievals as a function of AERONET AOD measurements at all sites in Eastern China from 2017 to 2018.
Remotesensing 13 03752 g003
Figure 4. Validation and uncertainty analysis of GF-4 AOD retrievals compared to AERONET AOD under different LSR conditions.
Remotesensing 13 03752 g004
Table 1. Technical specifications of the GF-4 satellite and MODIS.
BandWavelength (μm)DescriptionSpatial Resolution (m)Width (km)
GF-4123450.45–0.90
0.45–0.52
0.52–0.60
0.63–0.69
0.76–0.90
Visible to NIR
Blue
Green
Red
NIR
50400
63.5–4.1Mid-IR400
MODIS100.483–0.493Blue
Table 2. Optical properties for customized seasonal aerosol models used in the AOD retrieval.
Model ω gRP-CRIIP-CRI
(470/550/660 nm)(470/550/660 nm)(470/550/660 nm)(470/550/660 nm)
BeijingSpring0.920/0.925/0.9320.710/0.684/0.6621.521/1.529/1.5360.008/0.007/0.006
Summer0.947/0.948/0.9490.720/0.693/0.6691.478/1.479/1.4800.007/0.006/0.006
Autumn0.910/0.912/0.9130.709/0.683/0.6601.520/1.522/1.5240.013/0.011/0.011
Winter0.889/0.893/0.8960.704/0.677/0.6541.533/1.539/1.5450.016/0.014/0.013
XuzhouSpring0.930/0.940/0.9490.728/0.698/0.6721.463/1.478/1.4930.006/0.005/0.004
Summer0.959/0.958/0.9560.738/0.698/0.6621.398/1.409/1.4190.007/0.006/0.005
Autumn0.937/0.941/0.9450.728/0.700/0.6761.467/1.473/1.4780.007/0.006/0.005
Winter0.907/0.912/0.9160.705/0.670/0.6391.483/1.499/1.5130.010/0.009/0.008
Note: ω, g, RP-CPI, and IP-CPI stand for the single scattering albedo, the asymmetry factor, and the real and imaginary part of the refractive index.
Table 3. Comparison of accuracy between GF-4 AOD and AERONETAOD in different regions.
SitesNrRMSEMAERMBwithin EE (%)Above EE (%)Below EE (%)
Beijing1040.8970.1260.091.08270.3118.5411.15
Beijing_PKU700.9190.1390.1050.96468.216.8714.93
Beijing-CAMS560.8740.1480.0930.97169.2416.3214.44
Beijing_RADI410.8930.1550.0911.0267.8717.5814.55
XiangHe840.9450.1130.0810.97574.6916.978.34
XuZhou740.9420.080.0951.04472.8716.4410.69
urban areas2710.8950.1430.0961.01169.0117.513.49
rural areas1580.9430.0970.0881.00973.8416.729.44
All sites4290.9220.1220.0891.0571.3317.8810.79
Publisher’s Note: MDPI stays neutral with regard to jurisdictional claims in published maps and institutional affiliations.

