
Detection of Bark Beetle Disturbance at Tree Level Using UAS Multispectral Imagery and Deep Learning


Department of Physical Geography and Geoecology, Faculty of Science, Charles University, Albertov 6, 128 43 Prague 2, Czech Republic
*
Author to whom correspondence should be addressed.
Remote Sens. 2021, 13(23), 4768; https://0-doi-org.brum.beds.ac.uk/10.3390/rs13234768
Submission received: 13 October 2021
/
Revised: 18 November 2021
/
Accepted: 22 November 2021
/
Published: 24 November 2021
(This article belongs to the Special Issue Forest Monitoring in a Multi-Sensor Approach)
Abstract
:This study aimed to examine the potential of convolutional neural networks (CNNs) for the detection of individual trees infested by bark beetles in a multispectral high-resolution dataset acquired by an unmanned aerial system (UAS). We compared the performance of three CNN architectures and the random forest (RF) model to classify the trees into four categories: pines, sbbd (longer infested trees when needles turn yellow), sbbg (trees under green attack) and non-infested trees (sh). The best performance was achieved by the Nez4c3b CNN (kappa 0.80) and Safaugu4c3b CNN (kappa 0.76) using only RGB bands. The main misclassifications were between sbbd and sbbg because of the similar spectral responses. Merging sbbd and sbbg into a more general class of infested trees made the selection of model type less important. All tested model types, including RF, were able to detect infested trees with an F-score of the class over 0.90. Nevertheless, the best overall metrics were achieved again by the Safaugu3c3b model (kappa 0.92) and Nez3cb model (kappa 0.87) using only RGB bands. The performance of both models is comparable, but the Nez model has a higher learning rate for this task. Based on our findings, we conclude that the Nez and Safaugu CNN models are superior to the RF models and transfer learning models for the identification of infested trees and for distinguishing between different infestation stages. Therefore, these models can be used not only for basic identification of infested trees but also for monitoring the development of bark beetle disturbance.
1. Introduction
Pest insect disturbances are a natural part of the structural development process of temperate and boreal forests [1,2]. However, ongoing climate change has increased the frequency and severity of pest insect outbreaks in these biomes worldwide, including Europe [3,4,5]. In Central Europe, recent outbreaks of bark beetles, especially Ips typographus (Linnaeus, 1758), have contributed significantly to the doubling in canopy mortality, generating serious concerns about the effects on the environment, timber markets and human wellbeing [6,7,8]. Although bark beetle outbreaks have been intensifying in Central Europe for the last three decades [6], the most recent outbreaks in Czechia since 2015 exceeded the frequency and severity of outbreaks observed in the last two decades [9]. Moreover, the predictions expect the increase of bark beetle disturbances seven times more up to 2030 compared to the period 1971–1980 in Europe [6]. Therefore, the relatively fast, inexpensive and (if possible) automated methodology for the detection of single infested trees would help to reduce damage in a timely manner.
A terrestrial survey of discoloration symptoms has traditionally been used to detect Ips typographus (Linnaeus, 1758) (hereafter bark beetle) infestation on a single tree level [10,11]. However, the terrestrial method is time-consuming and therefore suitable only at the plot scale. Nevertheless, discoloration symptoms can be detected relatively easily from a bird’s-eye perspective over a large area. Consequently, conventional optical remote sensing and area-based (pixel-based) classification approaches have been used for pest insect disturbance detection at regional, national and global scales [12,13,14,15,16,17]. However, for the detection of individual infested trees and their timely sanitation, an individual tree-based classification (ITBC) approach is essential [18,19]. The area-based approach is not suitable because the mapping unit is not a single crown, but one pixel whose size reflects the spatial resolution of the data [20], often resulting in a few (spaceborne sensors) or too many pixels (airborne or drone-borne sensors) forming a crown that enters a classification. The spatial resolution of freely available satellite data from Sentinel-2 and Landsat missions (>10 m) is too coarse for the detection of single infested trees [16]. Although the ultrahigh resolution (in cm) may seem beneficial, the artificial mapping unit (the pixel) is much smaller than a crown, making the interpretation of the classified map more complicated and limiting its usage for in situ forest management decision making. Therefore, recent studies classifying bark beetle disturbance at the single tree level from ultrahigh-resolution images (airborne or drone-borne data) employed ITBC.
Previous work can be separated into a few groups according to the process of crown delineation. The basic approach is a time consuming manual delineation and labeling of the crowns followed by classification of the crowns [21,22,23]. These authors apply generalized linear models [21], maximum entropy [21], or random forest classifiers [21,22,23] to multispectral images. However, manual delineation and labeling are time-consuming and impractical for forest management. Other studies apply classic object-based classification to multispectral images [24,25,26]. However, this approach still does not delineate crowns but only segments based on spectral and spatial contextual information. Therefore, the most advanced approach combines automatic delineation of individual tree crowns with a subsequent classification of the crowns. Nevertheless, this approach is uncommon, and only a few studies have been published. Näsi et al. [19,27] detected individual spruce trees infested by the bark beetle in an urban forest classifying spectral features of identified treetops into three classes (healthy, infested and dead). Treetops were automatically detected as dead according to the highest brightness value. They used a support vector machine classifier, and the resulting kappa coefficient value was 0.61. Klouček et al. [28] identified individual infested, healthy and dead trees in a natural spruce monoculture combining local maxima filtering for tree identification and a maximum likelihood classifier, with a kappa coefficient of 0.78.
All of the abovementioned studies implemented statistical or machine learning algorithms. These algorithms usually require heuristic selection of appropriate transformations and hand-crafted latent variables such as vegetation indices [29] and texture metrics [30] calculated from the data prior to modeling [31,32]. Therefore, the selection of the best predictors demands user knowledge about interactions between biochemical and structural tree properties and electromagnetic signals detected by the sensor [32]. This requirement is a potential drawback for forest management applications. However, the drawback is addressed by deep learning, especially convolutional neural networks (CNNs), for image analysis [33,34]. CNNs are superior to the previous parametric and machine learning algorithms used in remote sensing, including vegetation and forest applications, because they can learn the best data transformations (convolutions) on different spatial scales (pooling) by iterative optimization of layers during training with no addition of handcrafted feature layers [32,34,35,36].
This advantage is documented by current forestry studies on forestry using CNNs for image analysis at the single tree level from ultrahigh-resolution RGB images. CNNs have been used for individual tree crown delineation in a tropical forest (synthetic dataset) [37] or in a temperate forest [38]. Much effort has been devoted to developing CNNs for tree species classification using manually delineated crowns [39,40], automatically delineated crowns [41,42], or CNN architectures, including crown segmentation [43,44]. However, studies detecting pest insect infestation are not still common. Safonova et al. [31] detected infested clusters (no single trees) of Abies sibirica Ledeb. in boreal forests using CNN and RGB images. Nguyen et al. [45] identified individual sick Abies mariesii Mast. by means of RGB images and deep learning trained on a large dataset. Little research has also been conducted on classification or segmentation of multi-/hyperspectral images due to the lower resolution of the images. Only Miyoshi et al. [46] and Nezami et al. [47] classified tree species using drone hyperspectral images. Therefore, previous research raised the question of when it is possible to perform the successful detection of individual infested trees by applying CNN on a small multispectral dataset.
The aim of this study is to examine the potential of CNNs for the detection of individual trees infested by bark beetles on a dataset from multispectral images acquired by an unmanned aircraft system (UAS) with very high spatial resolution. We compare the classification accuracy of the different CNN architectures with the well-established random forest (RF) classifier. The research questions addressed in the study are as follows: (1) Is it possible to reach acceptable accuracy of the model trained from scratch? (2) Does transfer learning improve the detection of infested trees? (3) What CNN architecture performs for the identification of infested trees? (4) Are CNNs superior to machine learning algorithms for the classification of bark beetle disturbances on small multispectral datasets? In a broader context, the study aims to design a relatively simple, semiautomated and efficient workflow for the detection of infested individual trees that can be adopted by forest management in the country.
2. Materials and Methods
2.1. Study Site and Remote Sensing Data
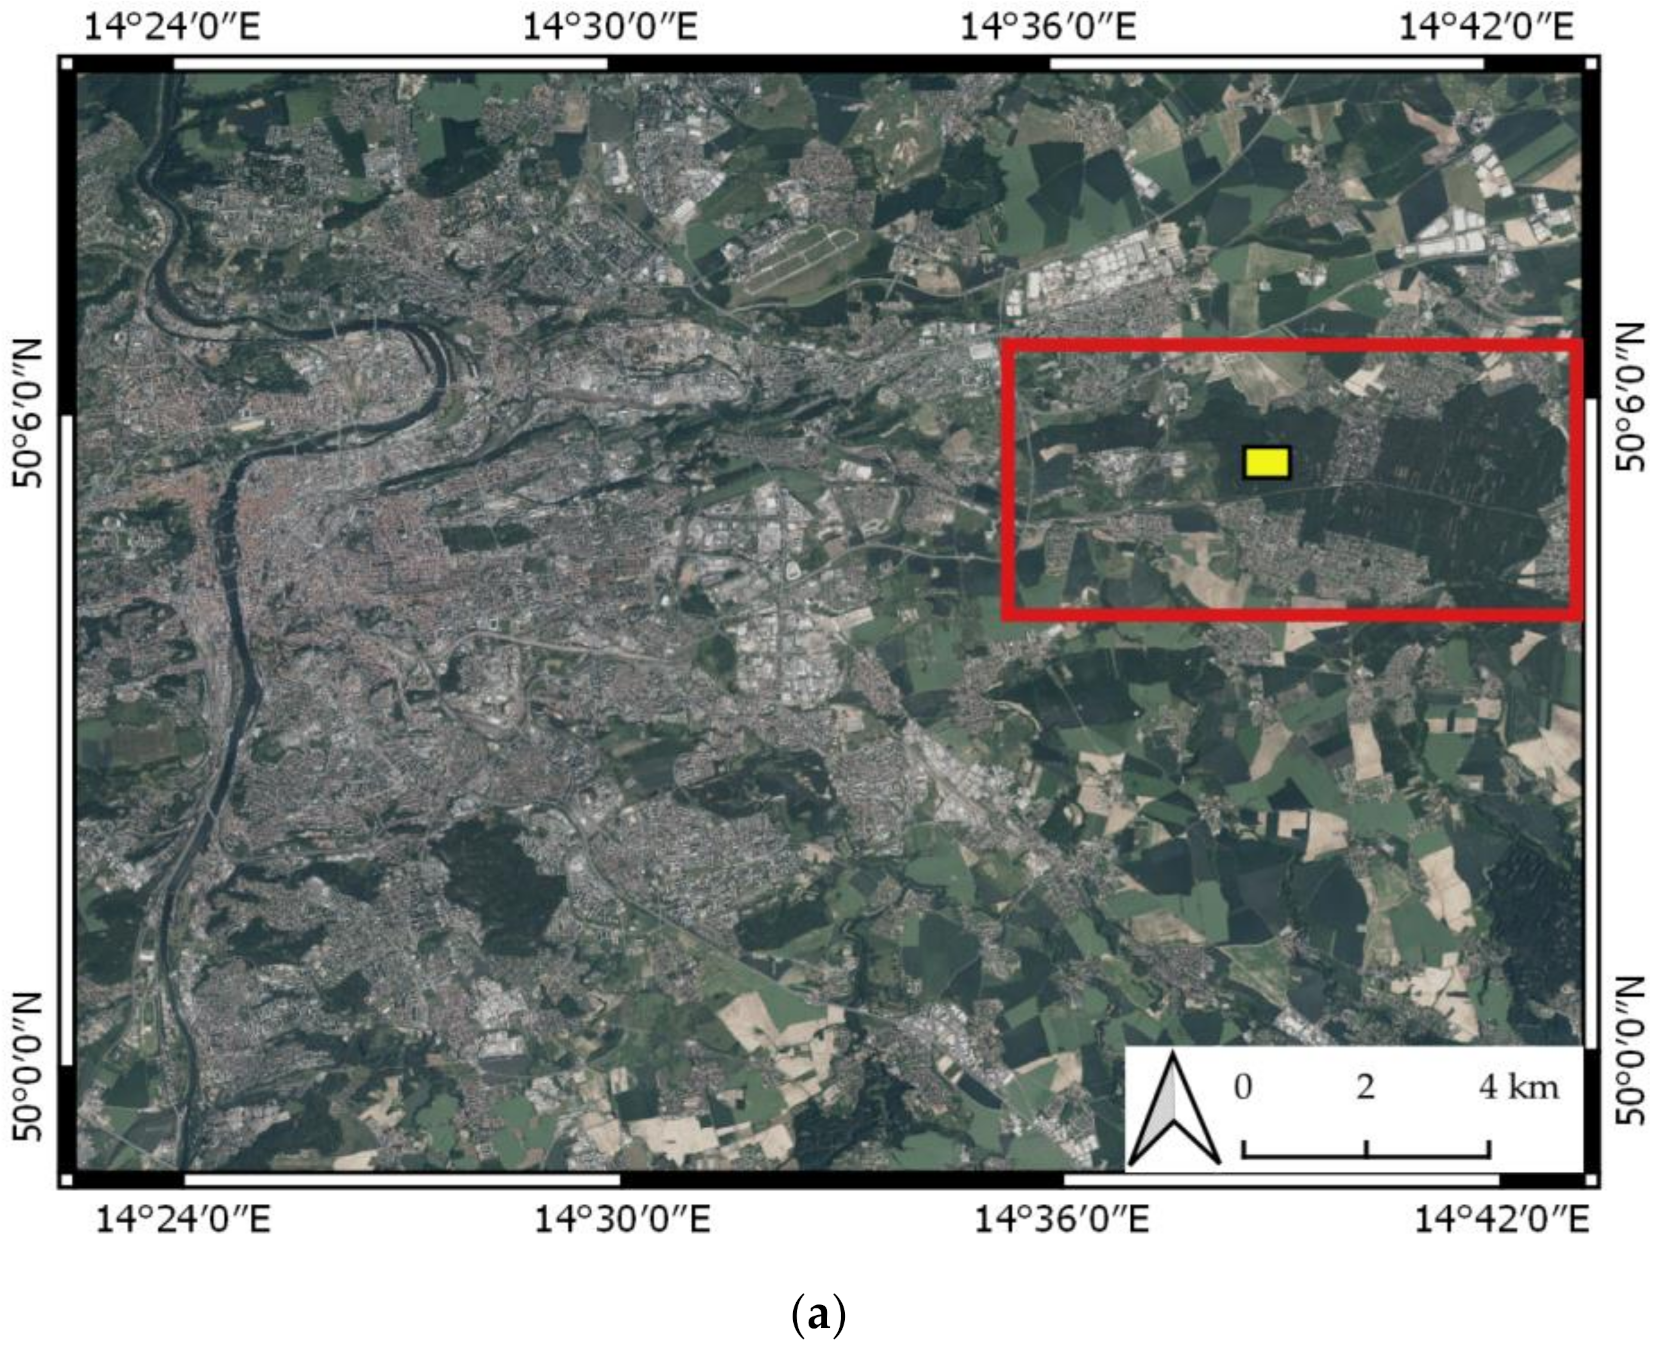
The study site (approximately 50.090°N and 14.650°E) is in Klánovice Forest. Klánovice Forest is a typical suburban temperate forest located in the Prague metropolitan area, Czechia. Klánovice Forest has suffered from massive bark beetle outbreaks since 2015 (up to four generations per year) due to urban heat islands [48]. The dominant tree species are Norway spruce, pine, oak and birch at the study site (Figure 1).
UAS imaging was conducted on 4 September 2020 using a DJI Matrice 210 RTK featuring a MicaSense RedEdge-M multispectral camera. The weather conditions were sunny, and flight was performed at approximately noon to minimize shadows. We set the flight altitude to 100 m above ground, frontlap 90% and sidelap 80% to be identical to previous flights conducted at the study site. The calibrating images of the reflectance panel were taken prior to and after flight to be used for radiometric calibration of images during photogrammetric processing.
Photogrammetric processing was performed in Agisoft Metashape Professional 1.6.2. using the standard procedure for multispectral images, including reflectance calibration [49]. Onboard real-time kinematics (RTK) global navigation satellite system (GNSS) data were used for image alignment using high accuracy settings. After the alignment, the dense cloud was generated using high-quality and aggressive depth filtering. Based on dense clouds, the digital surface model (DSM) was computed and projected into WGS84/UTM zone 33N. A multispectral mosaic was orthorectified based on images and DSM with a spatial resolution of 6 cm/pixel. The dense cloud was decimated to preserve only the highest point in each cell (0.2 m) of the grid that was virtually placed over the dense cloud. For a detailed description of the Klánovice forest, camera parameters and photogrammetric processing, we refer to Minařík et al. [50].
2.2. Ground Truth Data
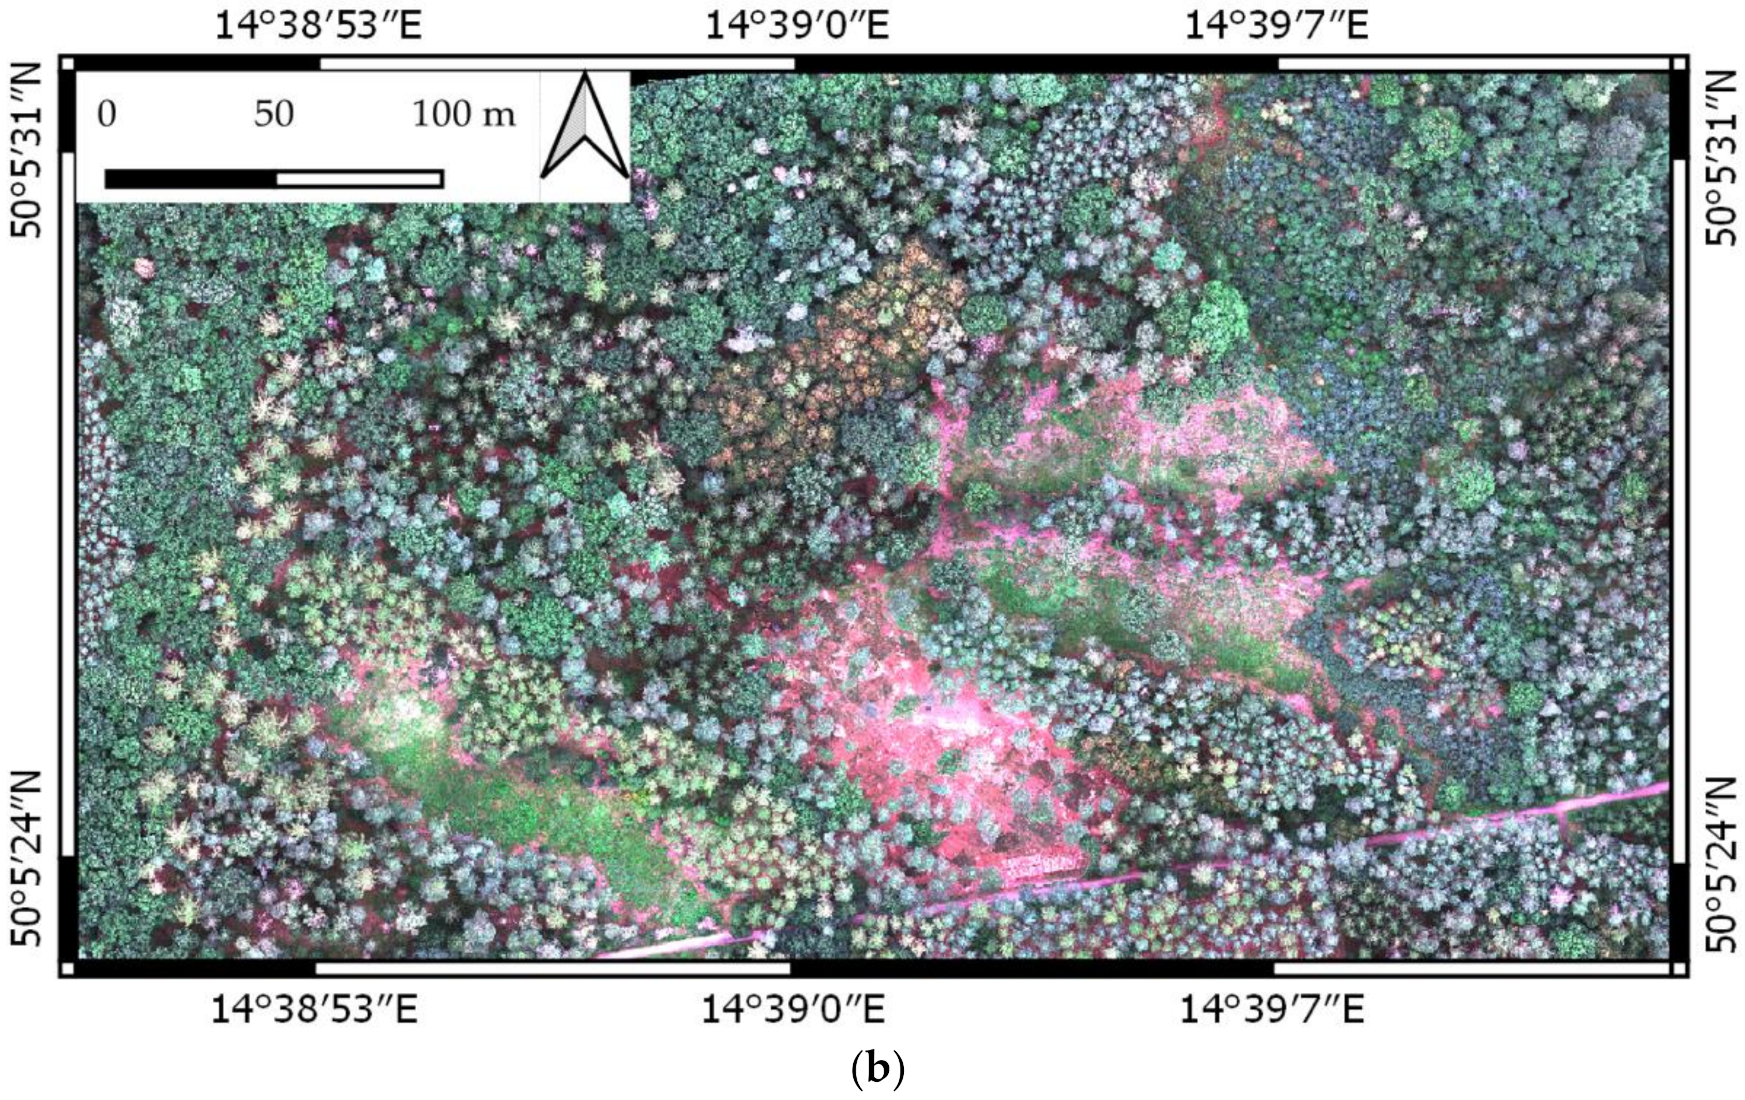
A terrestrial survey of the health status of Picea abies (L.) H. Karst. (hereafter, Norway spruce or spruce) was conducted one day prior to the flight. The health status of mature Norway spruces was assessed relative to each other based on foliage discoloration, defoliation and trunk symptoms (resin ducts) that are typical for bark infestation [51]. The spruce trees were classified into three groups: live and not infested (sh), green attack (sbbg) and longer infested trees when needles turned yellow (sbbd) (Figure 2). Among spruce trees, pines (Pinus sylvestris L.) were also mapped because their spectral response is similar to the spectral response of infested trees.
The survey of the infestation symptoms extended the previous one carried out in March 2020 using the same methodology [50]. We checked the previously mapped trees and reclassified them if necessary. Some of the trees had already been cut down. Moreover, we located and classified new trees. The ground truth dataset was extended from 122 mature spruce trees to 429 by the survey. The position of each tree was measured by the total station due to the multipath GNSS signal. The number of pines in the ground truth dataset was increased from 23 to 243 using visual interpretation from the orthomosaic.
2.3. Tree Crown Segmentation and Spectral Separability Analysis
Even if we located the position of every tree as a point during the field survey or visual interpretation, and tree crowns could be extracted manually, we decided to perform a simple automatic tree crown delineation to be consistent with the objectives of the study concerning the semiautomated ITBC workflow design. The crown delineation methodology was partially based on the delineation workflow designed in a previous study [50]. We describe here only the basic principle and methods.
We applied the identical excess green index vegetation mask calculated in a previous study [50] to separate the conifers from the surface and broadleaves. Therefore, only targeted spruces and pines were considered in the tree delineation routine. Then, treetops were identified from the normalized dense point cloud using a local maxima filter with the adaptive circular moving window size according to the tree height function f1 [50].
f1 = tree height × 0.07 + 1
Around each identified treetop, a square bounding box (buffer) was automatically constructed. The size of the buffer was set according to the height distribution of identified treetops. The trees under the median height received bounding boxes (BBs) of 2 m size, those lower than quantile 0.75 received 3.2 m BB, and those higher than quantile 0.75 received 4 m BB centered on the treetops. The bounding box sizes were selected to cover at least the upper 50% of the crown where bark beetle infestation was the most significant [28].
We applied no spectral transformation of the original bands, such as vegetation index calculations, because previous studies stated that the original data were already sufficient [39,52]. Moreover, we analyzed the spectral separability of disturbance classes to reduce the dimensionality of inputs.
The spectral separability of disturbance classes was investigated using all spectral bands of the multispectral camera. MicaSense RedEdge-M is sensible to Blue (475 nm), Green (560 nm), Red (668 nm) Red-edge, (717 nm) and near infrared (NIR) (840 nm) parts of the spectrum [50]. Central wavelengths are in brackets. The bounding boxes were used for extracting the reflectance values of tree crowns of individual disturbance classes. We used a Kruskal–Wallis test with the following nonparametric post hoc comparison after Siegel and Castellan [53] to test the spectral separability of the disturbance classes. Only bands with high separability of disturbance classes were used for classification.
The bounding boxes were primarily used for cutting the individual tree crowns from the original orthomosaic. Every tree was represented by a small multispectral image of 33/53/66 × 33/53/66 × 4(3) pixels of size stored on the hard drive (see Figure 2). According to the results of spectral separability analysis, we tested two band subsets consisting of Red, Green, Blue bands and Red, Green, Blue and Red-edge bands for classification. The reflectance values were multiplied by 200 and stored as integers. Data preprocessing was performed in R [54].
2.4. Classification Models
2.4.1. Convolutional Neural Networks
In this study, we tested three types of CNN architectures applicable to tree classification using a small dataset selected based on a literature search. We decided to test a fairly simple and fast network trained from scratch with no data augmentation, CNN designed directly for pest insect detection with data augmentation trained from scratch and pretrained CNN using transfer learning.
As a fairly simple network, we modified the CNN published in [47] (hereafter, Nez), which quickly reduced dimensionality and ultimately performed the classification of the tree species (Table 1). For a quick decrease in the loss function, we applied batch size 1 for this network as theoretically recommended by Chollet and Allaire [55].
Second, we were inspired by the CNN previously published in [31] that was superior to state-of-art pretrained CNN in the classification of damaged firs from RGB data. However, we designed our own architecture with respect to the spatial resolution of our data (Table 2). We trained the network in two instances, without (Saf) or with (SafAugu) data augmentation.
Moreover, we applied transfer learning (specifically feature extraction) because of the small data problem. We selected DenseNet169 [56] because it showed good performance in previous studies [31,57]. The network weights were pretrained on the ImageNet dataset. We adopted the whole convolutional base, and we only wrote and trained the classifier on the top (Table 3). DenseNet169 was trained only with data augmentation.
2.4.2. Random Forest
RF is a well-established machine learning algorithm [58]. Several benchmark studies consider the algorithm to be one of the best data-driven algorithms currently available [59,60,61]. RF is a robust algorithm because the classification is made an ensemble estimate from a high number of decision trees based on bagging and random selection of covariates. The final classification is a majority vote of all predicted classes over trees [58]. We applied the implementation from the caret [62] package in R. The algorithm was applied only to the basic training dataset using original spectral bands and no data augmentation. We applied no feature engineering because of comparison to CNNs.
2.5. Training and Validation
The original dataset consisting of 672 tree crowns was split randomly into training, validation, and test folders at a rate of 70:10:20. The relative frequency of elements in the classes was preserved in data splitting. Each model was trained using the same 70% of the tree crows.
The tree crown images were read as a multidimensional tensor (arrays) from the hard drive. Every image was converted back to reflectance values, and crowns were resampled to 32 × 32 × i using the nearest neighborhood prior to training. The weights of the CNN models were randomly set at the beginning. The weights were optimized iteratively to minimize the loss function. We used a categorical cross-entropy loss function for all CNN models because we had a typical multiclass classification problem. We selected the adaptive moment estimation optimizer (Adam) [63].
For the RF, the median reflectance values of each crown were extracted from the orthomosaic in R to perform tree-based classification (one tree, one object). Therefore, each tree was represented by one row in the attribute table of buffer polygons with median reflectance values of all bands. Buffer polygons were used for the classification. The default number of decision trees (500) suggested in the original paper was preserved.
The validation dataset was used during training to detect overfitting of the models. For CNN models, the validation dataset was used to empirically set the appropriate batch size, number of epochs and steps per epoch to prevent overfitting using trial and error methods (Table 4). For RF, we used a validation dataset to check the overfitting of the models for the selected number of decision trees.
All code was written in R v. 4.0.5 using the packages keras, tensorflow and caret [55,62]. We used the R interface to Keras with the TensorFlow backend ver. 2.4.0 for computation. Nez, Saf and Safaugu CNNs were written in R by the authors according to the description in the original articles using the Keras package. DenseNet convolution was already available in the keras package. The models were trained on CUDA-compatible NVIDIA GeForce MX250 graphic card with 2 GB RAM installed in a notebook.
2.6. Accuracy Assesment
The test dataset was used to assess the performance of the classification models. The test dataset had no contact with the test samples during training and validation; therefore, the results showed unbiased model effectiveness [64]. The confusion matrix was calculated based on comparing the predicted disturbance classes of the test dataset to ground truth classes. From the confusion matrix, several indices of agreement were calculated for each model and for each disturbance class. For the between-class comparison, we calculated precision (p), recall (r) and F-score [32]. These metrics were also applied to the accuracy assessment of automatic tree identification.
The general performance of the model was assessed using the mean F-score of the model and Cohen´s kappa index. The kappa index is objective because it gives the agreement to the true class considering the random chance of correct classification [65].
3. Results
3.1. Tree Indentification
Tree identification was assessed compared to ground truth in terms of true-positive (TP), false-negative (FN, omission error), and false-positive (FP, commission error) trees. The results of automatic tree identification are presented in Table 5. The recall was lower than the precision, showing that the algorithm had a problem identifying smaller and lower crowns in dense forests that were partially shaded by larger trees, especially pines. Therefore, the adaptive moving window included more than one tree and identified only the highest tree. In contrast, the very high precision score shows that the algorithm detected almost no multiple treetops. The wrongly identified or unidentified trees were corrected according to the ground truth dataset prior to ITBC.
3.2. Spectral Separability of Disturbance Classes
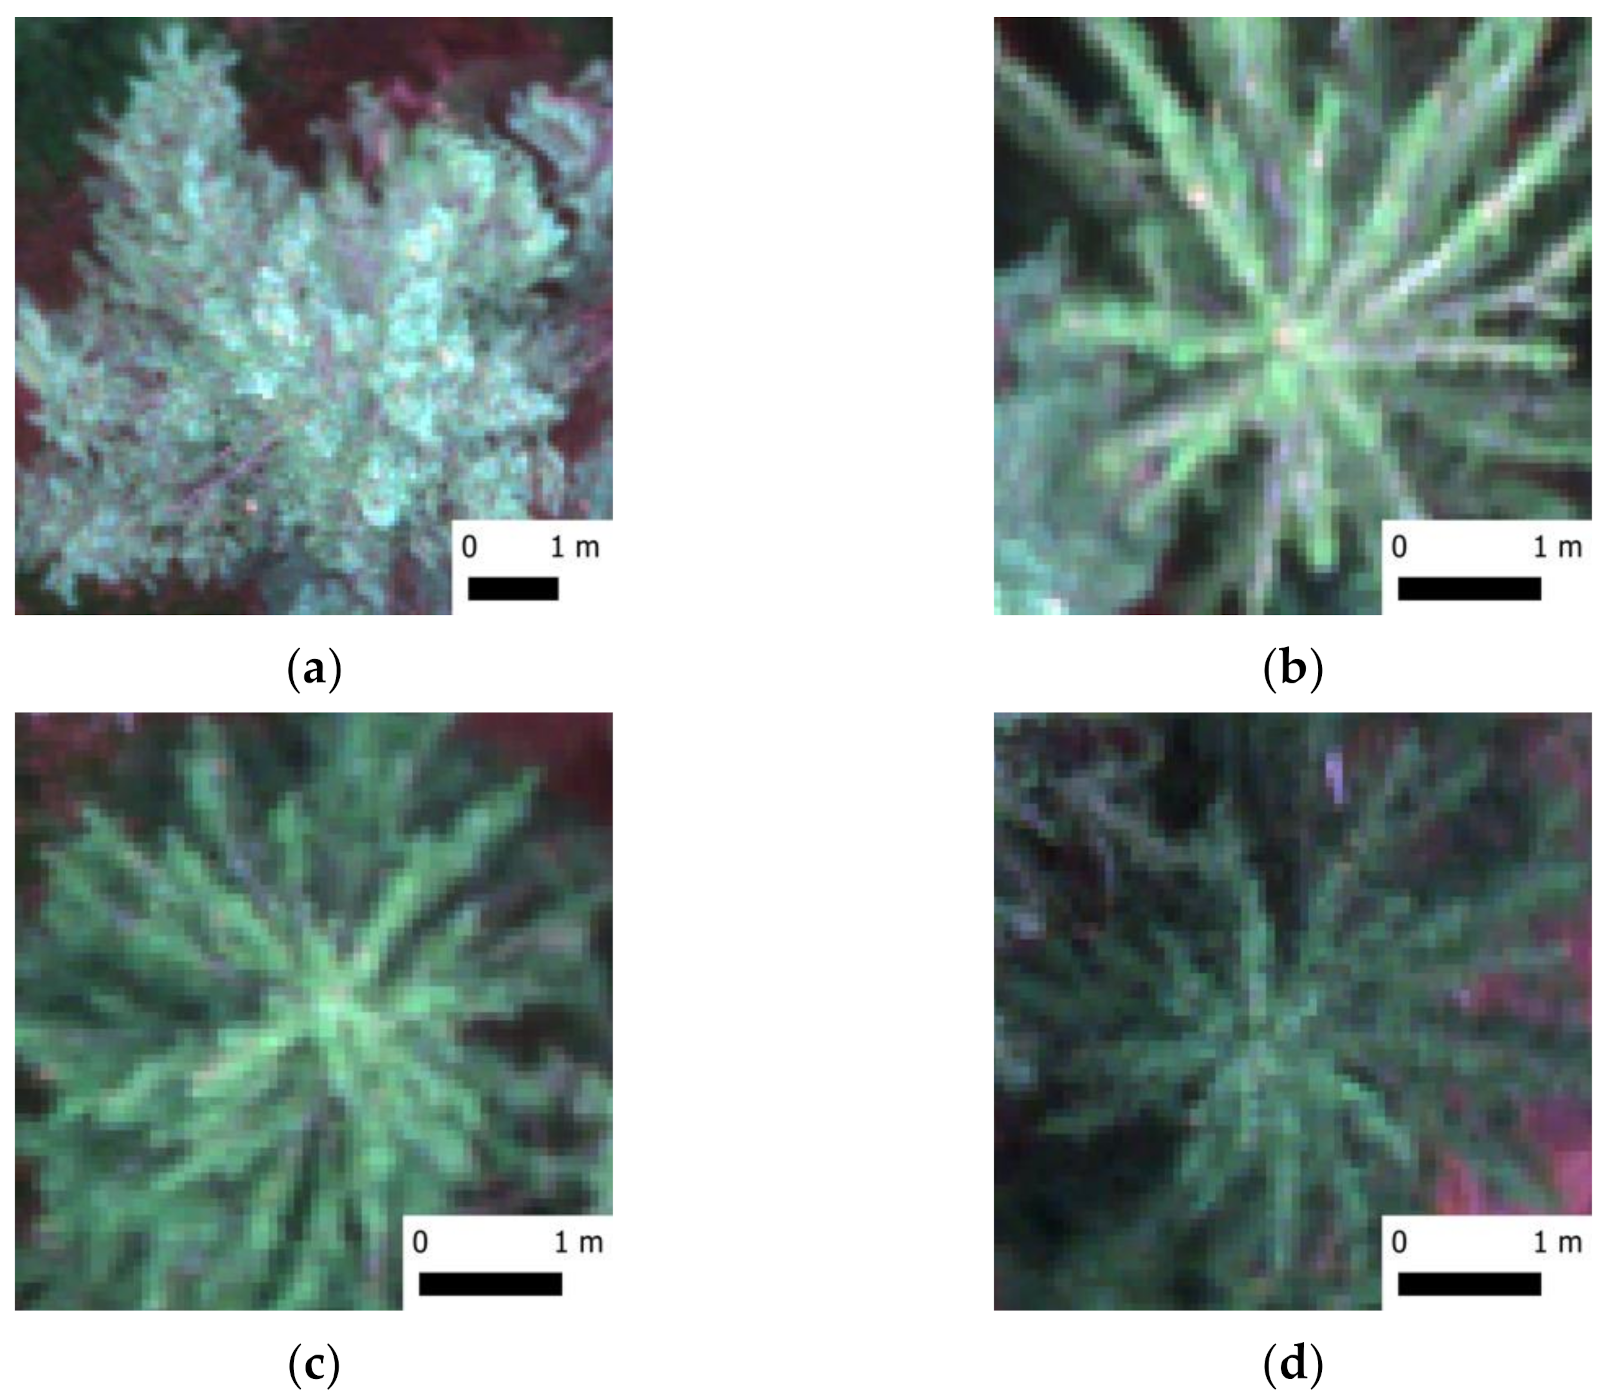
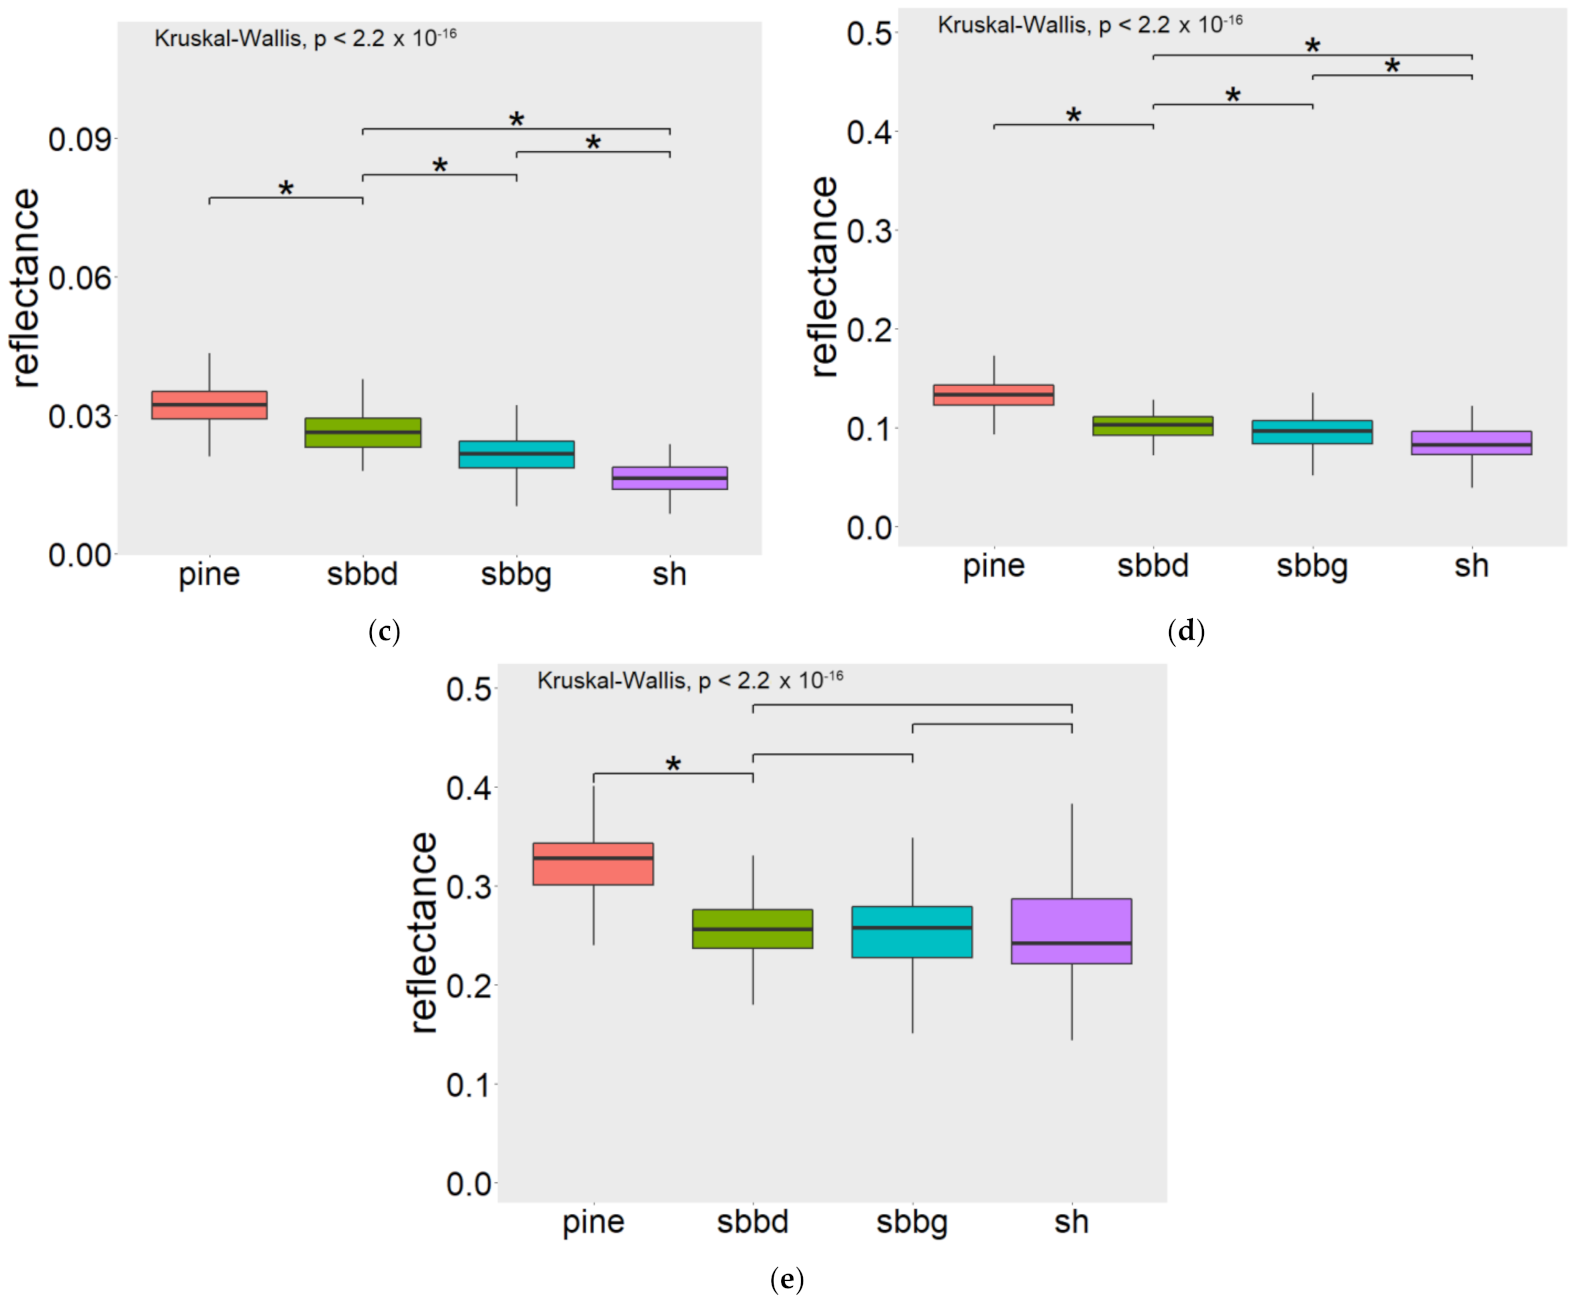
The results of spectral separability analysis are presented in Figure 3. The null hypothesis of no spectral separability of disturbance classes was rejected for all bands because there were significant reflectance differences between pines and spruces. However, the following multiple comparisons showed some separability issues between disturbance categories of spruce trees that were the most important. The best spectral separability of spruce disturbance classes was in the blue and red bands (Figure 4a,c). The interquartile range of sbbd, sbbg and sh revealed only small overlap between sbbd and sbbg categories, and the multiple comparison test showed significant differences among reflectance values. These disturbance classes were also separable in the green- and red-edge parts of the spectrum. The results showed increased overlap among sbbd and sbbg trees within these two bands, but there were still significant differences. However, the sbbd, sbbg and sh categories were not spectrally separable in the NIR band, and the boxplots highly overlapped with each other. Therefore, the NIR band was skipped for the ITBC. Based on the results, we decided to perform classification with two datasets composed of bands 1–4 (4b) and 1–3 (3b) and to investigate the effect of band selection on the classification results.
3.3. Classification Results
The ITBC results employing different models and model types are presented in Table 5. Basically, each model classified the trees using the four (model version 4c4b) or three (model version 4c3b) most informative bands (Section 3.2) into all four disturbance classes. The comparison of class-specific F-scores showed the strong connection to spectral separability of the disturbance classes. The highest mean F-score was obtained for pines (0.93) regardless of the model version because of their spectral and textural responses that were different from spruces. However, the more important spruce disturbance classes reached lower mean F-Scores of 0.68, 0.65 and 0.72 for sbbd, sbbg and sh, respectively, because of their more similar spectral and textural responses, resulting in misclassifications of the trees of these classes (Figure 4, left column). Nevertheless, previous studies used coarser classification for infested/healthy (not infested) categories. Therefore, we decided to experimentally merge the sbbd and sbbg classes into a more general class of infested trees (sbb) and train the classification models for three output categories using the four (model version 3c4b) or three (model version 3c3b) most informative spectral bands (Figure 4, right column). Finally, each model was trained and assessed in four versions (Table 6).

Table 6.
Evaluation metrics of bark beetle disturbance classification at the tree level. For the pair of models of the same architecture and the same number of output classes but the different number of input bands, the more accurate model is highlighted in bold. For each model, the most accurate model version is highlighted in green. The model showing the general poorest performance is highlighted in orange.
| Model | Model Version | F-Score by Class | Mean F-Score | Model’s Kappa | Mean Kappa | |||||||
|---|---|---|---|---|---|---|---|---|---|---|---|---|
| pine | sbbd | sbbg | sh | |||||||||
| Nez | 4c4b | 0.93 | 0.72 | 0.77 | 0.80 | 0.80 | 0.74 | 0.81 | ||||
| 4c3b | 0.95 | 0.79 | 0.83 | 0.78 | 0.84 | 0.80 | ||||||
| 3c4b | 0.93 | 0.91 | 0.81 | 0.88 | 0.84 | |||||||
| 3c3b | 0.92 | 0.94 | 0.86 | 0.91 | 0.87 | |||||||
| Saf | 4c4b | 0.91 | 0.71 | 0.68 | 0.69 | 0.75 | 0.69 | 0.79 | ||||
| 4c3b | 0.96 | 0.78 | 0.77 | 0.75 | 0.82 | 0.77 | ||||||
| 3c4b | 0.95 | 0.90 | 0.73 | 0.86 | 0.82 | |||||||
| 3c3b | 0.95 | 0.93 | 0.78 | 0.89 | 0.86 | |||||||
| Safaugu | 4c4b | 0.95 | 0.69 | 0.72 | 0.79 | 0.79 | 0.72 | 0.81 | ||||
| 4c3b | 0.93 | 0.80 | 0.77 | 0.75 | 0.81 | 0.76 | ||||||
| 3c4b | 0.95 | 0.93 | 0.73 | 0.87 | 0.85 | |||||||
| 3c3b | 0.98 | 0.96 | 0.83 | 0.92 | 0.92 | |||||||
| Dense169 | 4c4b | 0.94 | 0.65 | 0.60 | 0.67 | 0.72 | 0.64 | 0.77 | ||||
| 4c3b | 0.93 | 0.68 | 0.72 | 0.73 | 0.77 | 0.70 | ||||||
| 3c4b | 0.95 | 0.95 | 0.76 | 0.89 | 0.87 | |||||||
| 3c3b | 0.93 | 0.94 | 0.73 | 0.87 | 0.85 | |||||||
| RF | 4c4b | 0.93 | 0.49 | 0.63 | 0.76 | 0.70 | 0.60 | 0.69 | ||||
| 4c3b | 0.92 | 0.50 | 0.60 | 0.45 | 0.62 | 0.55 | ||||||
| 3c4b | 0.94 | 0.92 | 0.76 | 0.87 | 0.85 | |||||||
| 3c3b | 0.94 | 0.88 | 0.45 | 0.76 | 0.75 | |||||||
| Class’s F-score | 4c | 0.93 | 0.68 | 0.65 | 0.72 | - | - | - | ||||
| 3c | 0.94 | 0.92 | 0.74 | - | - | |||||||
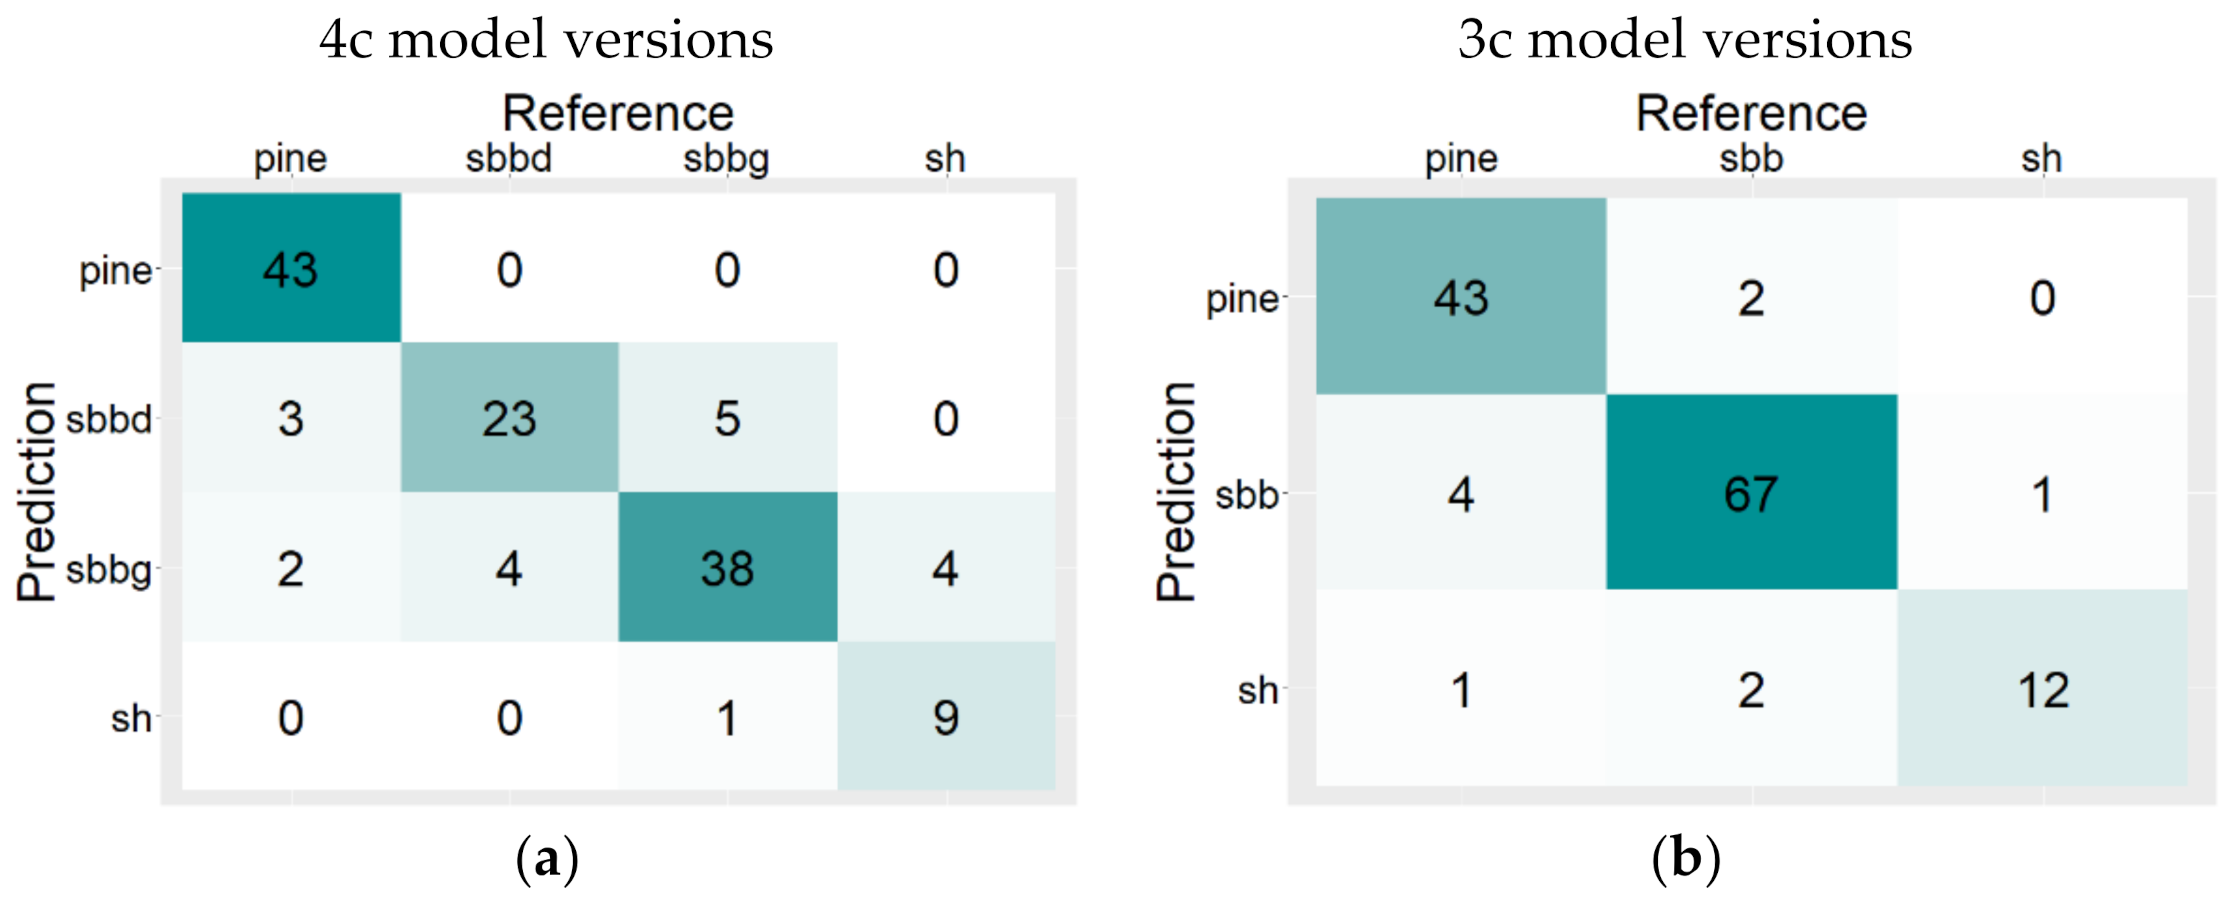
Figure 4.
Confusion matrices of the best performing models classifying trees into four classes (left column) or three classes (right column) according to Table 5: (a) Nez 4c3b; (b) Nez 3c3b; (c) Saf 4c3b; (d) Saf 3c3b; (e) Safaugu 4c3b; (f) Safaugu 3c3b; (g) Dense169 4c3b; (h) Dense 3c4b; (i) RF 4c4b; (j) RF 3c4b.


The results showed that the model types using only the three most informative RGB bands (4c3b) were superior to the 4c4b types of CNNs. The best classification performance was reached using Nez4c3b, showing only a few misclassifications between the sbbd and sbbg categories (Figure 4a). The second-best classification performance was achieved by Saf4c3b/Safaugu4c3b. However, the model misclassified the largest number of sbbg trees (13%) to sh, which could be a problem despite the highest number of correctly classified sh trees (Figure 4c). Nevertheless, featuring data augmentation in the Saf4c3b model reduced the misclassifications of sbbg trees to sh class (Figure 4e), even if the overall accuracy metrics remained similar. All three CNNs were trained from scratch. The relatively lower overall performance among CNN classifiers was achieved using the adapted Dense169 4c3b model. The Dense169 4c3b model misclassified 30% of sbbg trees into the sbbd category (Figure 4g). All 4c CNN classifiers achieved higher mean F-scores and kappa metrics than the 4c RF models. The confusion matrices of RF models revealed the issue of distinguishing sbbd from sbbg, resulting in misclassification of 37% of sbbd trees to sbbg and 34% of sbbg trees to sbbd (Figure 4i). Nevertheless, 4c RF models reached F-scores comparable to the F-scores of CNNs for pines and sh classes.
Merging two related classes of the infested trees (sbbg and sbbd) prior to classification resulted in an increase in classification accuracy (Figure 4, right column). The mean F-scores increased by 7–17%, and kappa increased by 7–25% comparing the best 3c models to their 4c versions. The lowest increase was for Nez and Saf models. The highest increase was for the Safaugu, Dense169 and RF models. However, the classification accuracy of pine sh trees was similar regardless of the number of input classes. The evaluation metrics of the models increased only by merging the classes.
The 3c3b model versions were mostly superior to the 3c4b versions of the models again. Only the RF3c4b model reached 10% higher evaluation metrics than the 3c3b version. The best classification accuracy was obtained using Safaugu3c3b, achieving a mean F-score of 0.92 and kappa. Nevertheless, the accuracy metrics were comparable for all 3c3c CNN models and even for RF3c4b. The rest of the models achieved a mean F-score of 0.86–0.91 and kappa of 0.82–0.87.
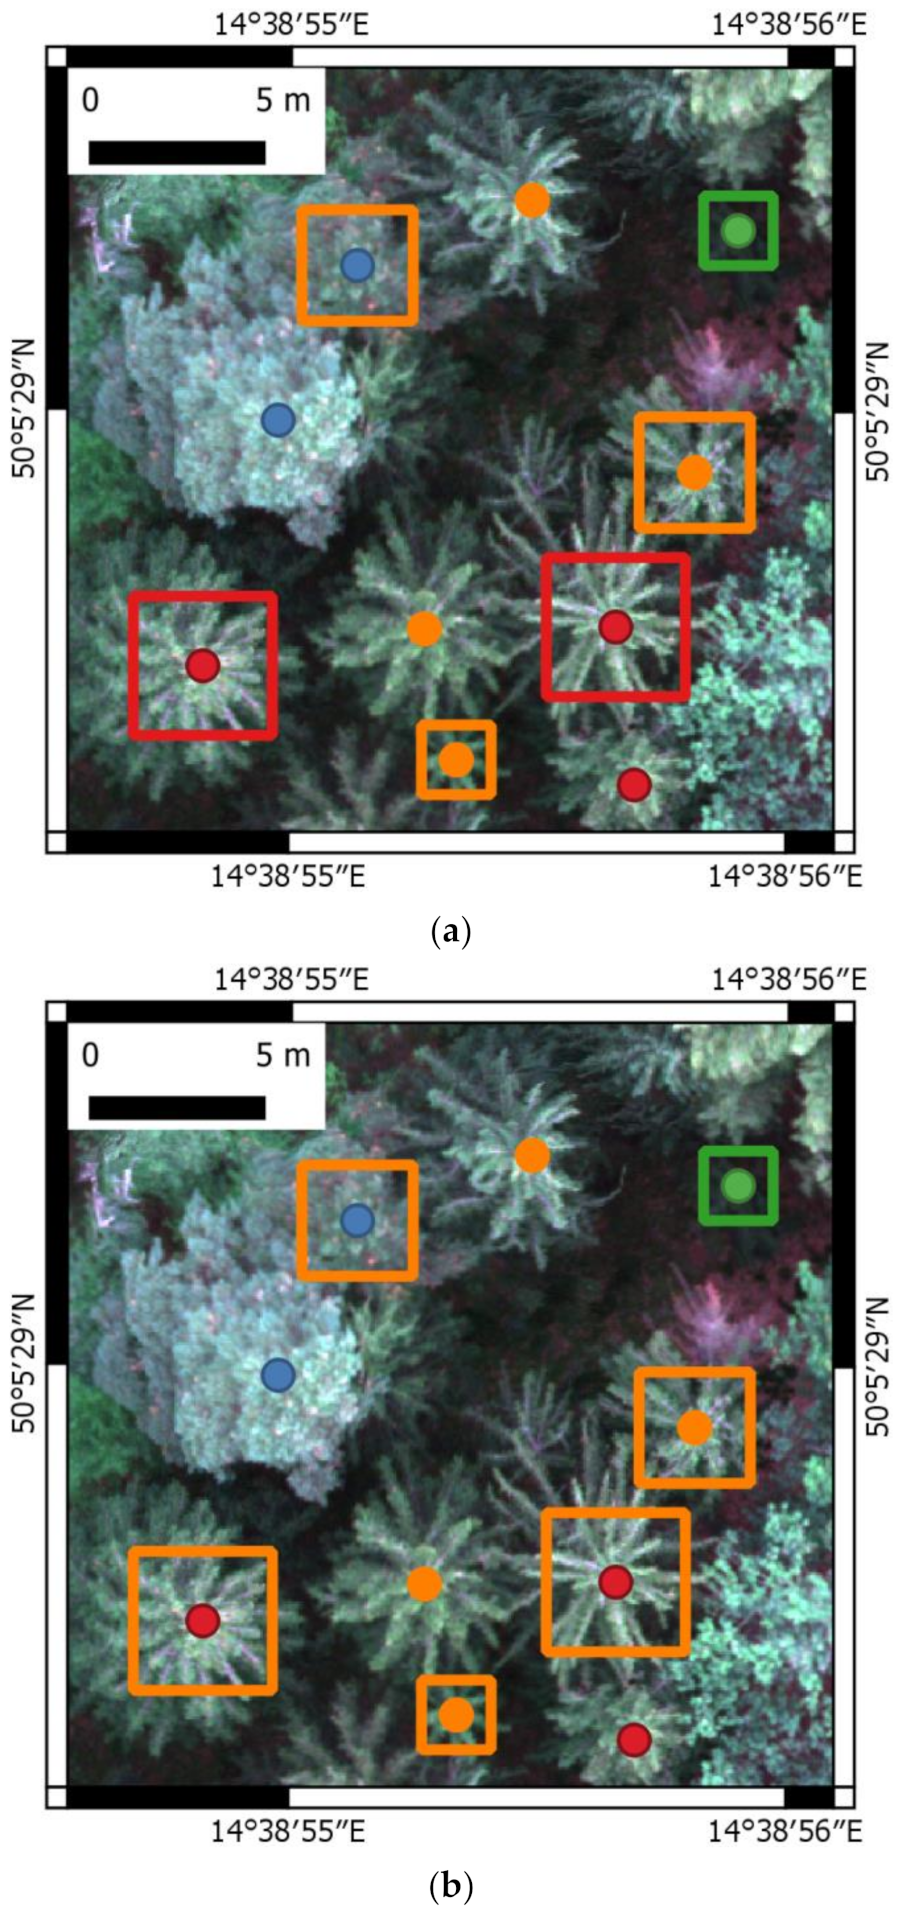
Based on the experimental results of this subsection, several conclusions were drawn concerning the identification of infested trees from the small multispectral dataset. The more important is the selection of representative features with high separability of disturbance classes than the number of features for the classification using CNNs. To distinguish between newly infested trees (sbbg), non-infested trees (sh) and longer infested trees (sbbd), the CNN classifiers developed for forest applications (Nez and Saf/Safaugu) (Figure 5a) are more accurate than RF (Figure 5b) and pretrained DenseNet169. Data augmentation has a positive effect on the classification accuracy of the deeper Saf model, but the number of epochs must be increased. However, misclassifications between the sbbd and sbbg classes up to 20% can occur because of spectral overlaps. Therefore, it should be considered when the classification results serve decision making. If the complexity of the problem decreases by merging the related information classes (sbbd and sbbg) to a more general infested tree (sbb) category, the selection of model type is less important. All tested model types, including RF, were able to detect the most important class of infested trees with an F-score of the class over 0.90.
4. Discussion
4.1. Tree Delineation
The accuracy of individual tree detection is comparable or superior to other studies focused on the identification of conifers in an uneven-aged mixed forest using local maxima filtering [66,67]. Although the recall score (0.87) of automatic tree identification points to the omission of small trees in the dense part of the mixed forest, the method is more efficient and less time-consuming than the manual identification of all trees because only the unidentified trees must be detected manually by visual interpretation. The recall of treetop identification is lower than that recall in a previous study [50] using the same methodology because the previous study focused only on mature spruce trees over 60 years that are primarily infested by the bark beetle [13]. In this study, conifer trees over 5 m were considered.
The issue of small tree omissions could be reduced using another algorithm of treetop detection, e.g., a deep-learning method based on 2D confidence map estimation from hyperspectral data [46]. The authors reached F-score, precision and recall values of 0.959, 0.973 and 0.945, respectively. Another option is to apply instance segmentation. However, this approach requires very sophisticated reference data, including both the identification of individuals and delineation of their explicit spatial extent [32,44]. Therefore, the approach was tested only on synthetic data [37,68]. Moreover, the approach requires very high computational power (workstation, server or cloud computing) [68] that can limit the usage in a common practice. For these reasons, we segmented the trees prior to classification using the simple representation of the crown by bounding box instead of more advanced tree crown delineations. This practice is common because CNNs require basically rectangular inputs, and it has been verified by previous studies [31,42,47,57]. In this study, we did not investigate the other algorithms because they are beyond the scope of the study.
4.2. The Effect of Feature Layer Selection on Classification Results
We applied no spectral transformation of the original bands, such as vegetation index calculations, because according to previous studies, the addition of spectral transformations may even introduce information loss and decrease the model accuracy [47,69,70]. Concerning the addition of elevation features such as the canopy height model, the results of previous studies focused on three species classifications revealed no significant improvement in CNN models [47,69,70]. Therefore, we decided to test only a basic pipeline with the original bands to preserve high automation and easy reproducibility of the workflow.
Spectral separability analysis can be understood in a broader context as feature layer selection for classification. Feature layer selection is not investigated much for CNNs because CNNs provide end-to-end learning, including feature extraction, and CNNs are mostly applied only to RGB images [32]. The basic principle is to select all bands of multi-/hyperspectral images or select combinations and retrospectively verify the effect on the accuracy of classification of the trees [47,69]. However, this approach requires running the classification multiple times, which is counterproductive if the goal is to reduce the dimensionality of the inputs to save computation time. One way to overcome this issue is to analyze the spectral differences between disturbance classes using descriptive statistics and statistical inference prior to classification, as suggested in this study. We found that CNN models using only RGB bands (Xc3b) were superior to models using red edges (Xc4b) because the red-edge band had higher spectral overlaps of spruce disturbance classes, which resulted in lower classification accuracy metrics. The results are consistent with a previous study focused on conifer tree species classification using hyperspectral data [47]. The best results of the study were achieved using only RGB bands. However, the explanation remains unclear because separability analysis was not performed. Moreover, Miyoshi et al. [46] implemented a band selection module in a CNN classifier, resulting in the reduction of 25 original bands into a linear combination of 5 bands, including RGB. Therefore, there is no evidence to date that adding more bands into the CNN model improves the classification of conifer species or the infestation status compared to the RGB-based model. In contrast, the higher accuracy of RF models was reached by Xc4b versions, and the poorest performance was achieved using the 4c3b RF model because the RF algorithm generally benefits from more feature layers [32,71].
4.3. Considerations about Bark-Beetle Disturbance Classification Using CNN
The differences between model performances were higher when the trees were classified into four categories (pine, sbbd, sbbg, sh). The best performance was achieved by the Nez4c3b model and Safaugu 4c3b model. The overall scores of Nez4c3b had a mean F-score of 0.84 and kappa of 0.80. The F-scores of the sbbd, sbbg and sh classes were 0.79, 0.83 and 0.78, respectively. The overall scores of Safaugu 4c3b had a mean F-score of 0.81 and kappa of 0.76. The F-scores of the sbbd, sbbg and sh classes were 0.80, 0.77 and 0.75, respectively. Nez4c3b reached the highest learning rate and high accuracy for our task within 40 epochs because of batch size 1 and model architecture. Nez CNN was originally designed to quickly decrease the dimensionality of the hyperspectral inputs with similar spatial resolution and ultimately perform classification tasks [47]. The small batch size intensified the learning process. Data augmentation had a positive effect on the classification metrics of the Saf model, consistent with the original paper [31]. In the original paper, the F-scores increased by 0.24 and 0.15 for two infested classes of firs corresponding to our mixed sh + sbbg class and sbbd class after data augmentation. In our study, the data augmentation resulted in almost no improvement of F-scores, but it reduced the dangerous misclassification of sbbg trees to sh class. Nevertheless, both CNNs achieved performance superior to pretrained convnets and transfer learning in the original papers, similar to our results [31,47]. Moreover, both 4c CNN models outperformed the 4c RF models for the detection of bark beetle disturbance at the tree level, which is consistent with previous findings of Sothe et al. [69,70]. This result reflects the main advantage of deep learning methods. CNNs perform effective automatic feature extraction learning of hierarchical features during training from the original images [72,73]. Therefore, they can learn hidden features from the original spectral bands, resulting in better classification accuracy compared to RF.
The main classification problem was to separate the transitional category of sbbg (trees under green attack) from sbbd (longer infested trees when needles turn yellow) and marginally sh because of the similar spectral responses. However, the most important aspect of forest management is the identification and destruction of infested trees before the new generation of bark beetles starts swarming [74]. The first (spring) swarming occurs in the green attack stage [75]. Nevertheless, cutting trees at the beginning of yellow stage prevents summer swarming [74,76]. Moreover, previous studies used coarser classification into infested (up to red needles) and healthy (not infested) categories. For this reason, we decided to merge the sbbd and sbbg classes into the infested tree class (sbb) and performed the classification with three classes (pine, sbb, sh).
The decreasing complexity of the problem caused by merging sbbd and sbbg classes made the selection of model type less important. The best classification metrics were achieved by the Safaugu3c3b model (mean F-score 0.92, kappa 0.92) followed by the Nez3cb classifier (mean F-score 0.91, kappa 0.87). The F-scores of pines, sbb and sh classes reached 0.95, 0.93 and 0.78 for Safaugu3c3b and 0.92, 0.94 and 0.86 for Nez3cb. However, all tested model types, including 3c RF, were able to detect the most important class of infested trees with an F-score of the class over 0.90. The evaluation metrics of pine and sh classes remained the same. Merging affected only the concerned classes.
The evaluation metrics of the best performing 3c models were higher or comparable to previous studies focused on the detection of individual not infested/infested (up to red needles, including green attack) trees. Ortiz et al. [21] and Kampen et al. [23] reached kappa coefficients of classification of 0.74 and 0.73, respectively, using machine learning classifiers. Brovkina et al. [26] reached a kappa of 0.75 using object-oriented image analysis in eCognition software. Dash et al. [22] reached kappa 0.69 using a machine learning algorithm and time-series analysis. Nguyen et al. [45] reached a kappa of 0.73, and Qin et al. [77] achieved a mean F-score of 0.88 for infested trees using a deep learning algorithm but using a large dataset of approximately 5000 samples. In contrast, we reached higher or comparable evaluation metrics of models using ten times fewer samples. Safonova et al. [31] achieved F-scores over approximately 0.90 for infested tree categories.
The more detailed classification of infested trees to different stages of infestation, such as sbbg and sbbd, is rare and less accurate (published only by [17,31]), because it is challenging to separate trees under green attack. The common approach is to detect green attack retrospectively from time series of multispectral imagery [17,22,28]. This approach requires repeated flights during season, and the infestation is detected retrospectively, which could be a drawback for rapid calamity mapping. Moreover, these studies classified the trees only into infested/not infested categories for simplification of classification task. In our study, we propose the workflow that detect the green attack and provide information about disturbance dynamics by classifying to different stages of infestation at once based on precise timing and CNN. We conducted the imaging after summer swarming in the study, because vegetation stress caused by bark beetle is detectable from multispectral images after 14 days since infestation [22,78]. Therefore, it is possible to detect and eliminate infested trees early after infestation using timed UAS imaging. However, it demands the knowledge of approximate dates of swarming in the area during season. This is the potential limitation of our approach. To overcome the limitation, it is possible to use terrestrial methods of swarming detection like pheromone slit traps [74]. Nevertheless, the proposed workflow can be used to automatically monitor bark beetle disturbance development, because the performance of the Nez4c3b and Safaugu4c3b models is comparable or superior to previous work employing machine learning focused on green attack phase detection even if they used coarser classification and time series [17,19,21,22,28,79].
Another challenge of our workflow is to collect more training samples for classification. We hypothesize that using more training samples would improve the distinction between categories of infestation status (sbbd and sbbg) similarly to distinction between tree species that was documented by Natesan [41]. In addition to increasing the number of experimental sites, another possibility is to extract more training samples from repeated imaging of multiple swarming within one season or from different seasons. It could improve the generalization of disturbance class-specific patterns found by CNN classifier thanks to slightly different spectral response of the trees resulting in possible accuracy improvement. For now, high generalization of class-specific patterns is guaranteed by CNN architecture itself that iteratively optimize the transformations of feature space during training process [32,55]. We plan to combine our classification methodology with time-series analysis for monitoring bark beetle disturbance, detecting hotspots and predicting infestation spreading in our future work.
5. Conclusions
This study examined the potential of CNN for the detection of individual trees infested by the bark beetle on a very high-resolution dataset from multispectral images. We compared the performance of three CNN architectures and the random forest (RF) model to classify the trees into four categories: pines, sbbd (longer infested trees when needles turn yellow), sbbg (trees under green attack) and non-infested trees (sh).
The best performance was achieved by the Nez4c3b model (mean F-score 0.84, kappa 0.80) and Safaugu 4c3b model (mean F-score 0.81, kappa 0.76) using only RGB bands. The main misclassifications were between sbbd and sbbg because of the similar spectral responses. We decided to merge sbbd and sbbg into a more general class of infested trees because both classes described the relatively early infestation stage. Merging sbbd and sbbg made the selection of model type less important. All tested model types, including RF, were able to detect the most important class of infested trees with an F-score of the class over 0.90. Nevertheless, the best classification metrics were achieved by the Safaugu3c3b model (mean F-score 0.92, kappa 0.92) followed by the Nez3cb classifier (mean F-score 0.91, kappa 0.87) using only RGB bands.
Better performance was achieved by the RGB models because the best spectral separability of these classes was in the blue and red bands. Therefore, the usage of the raw RGB spectral band is sufficient for the basic identification of infested trees using these CNNs, which makes data preprocessing more straightforward. We found no evidence that adding more bands into the CNN model improves the detection of infested trees.
Based on our findings, we conclude that the Nez and Safaugu models are superior to the RF models and transfer learning models for the identification of infested trees and for distinguishing between different infestation stages. The performance of both models is comparable, but the Nez model has a higher learning rate for this task. The performance of the Nez and Safaugu models is comparable to previous work employing machine learning classifiers and some deep learning studies classifying trees into healthy/infested categories, even if the finer classification of tree infestation status is used. Therefore, CNNs are suitable for the automated identification of infested individual trees, as well as for monitoring bark beetle disturbance dynamics.
We see the potential application of the proposed workflow in combination with multitemporal analysis for monitoring bark beetle disturbance, detecting hotspots and predicting infestation spreading. Getting more training samples from appropriately timed repeated imaging could also improve the generalization of disturbance class-specific patterns found by CNN classifier and distinction between infestation stages thanks to variable spectral response of the disturbed trees under different seasonal conditions.
Author Contributions
Conceptualization, R.M. and J.L.; methodology, R.M.; software, R.M.; validation, R.M.; formal analysis, R.M.; investigation, R.M., J.L. and T.L.; resources, R.M. and J.L.; data curation, R.M.; writing—original draft preparation, R.M.; writing—review and editing, R.M., J.L. and T.L.; visualization, R.M.; supervision, J.L.; project administration, J.L. and R.M.; funding acquisition, J.L. and R.M. All authors have read and agreed to the published version of the manuscript.
Funding
This research was supported by the COST Action CA16219, project “Harmonization of UAS techniques for agricultural and natural ecosystems monitoring”, by the Prague Environment grant; project MHMP 54/12/013649 “Monitoring of bark beetle spread in Prague forests”, by the Charles University; project GA UK No. 824217 “Analysis of disturbance and regeneration of forest vegetation using UAV multispectral photogrammetry”; and by the Czech Science Foundation project 19-05011S.
Institutional Review Board Statement
Not applicable.
Informed Consent Statement
Not applicable.
Data Availability Statement
Data available on request from the authors.
Conflicts of Interest
The authors declare no conflict of interest. The funders had no role in the design of the study; in the collection, analyses, or interpretation of data; in the writing of the manuscript, or in the decision to publish the results.
References
- Franklin, J.F.; Spies, T.A.; Van Pelt, R.; Carey, A.B.; Thornburgh, D.A.; Berg, D.R.; Lindenmayer, D.B.; Harmon, M.E.; Keeton, W.S.; Shaw, D.C.; et al. Disturbances and structural development of natural forest ecosystems with silvicultural implications, using Douglas-fir forests as an example. For. Ecol. Manag. 2002, 155, 399–423. [Google Scholar] [CrossRef]
- Senf, C.; Pflugmacher, D.; Wulder, M.A.; Hostert, P. Characterizing spectral–temporal patterns of defoliator and bark beetle disturbances using Landsat time series. Remote Sens. Environ. 2015, 170, 166–177. [Google Scholar] [CrossRef]
- Paritsis, J.; Veblen, T.T. Dendroecological analysis of defoliator outbreaks on Nothofagus pumilio and their relation to climate variability in the Patagonian Andes. Glob. Change Biol. 2011, 17, 239–253. [Google Scholar] [CrossRef]
- Kautz, M.; Meddens, A.J.H.; Hall, R.J.; Arneth, A. Biotic disturbances in Northern Hemisphere forests—A synthesis of recent data, uncertainties and implications for forest monitoring and modelling. Glob. Ecol. Biogeogr. 2017, 26, 533–552. [Google Scholar] [CrossRef]
- Seidl, R.; Thom, D.; Kautz, M.; Martin-Benito, D.; Peltoniemi, M.; Vacchiano, G.; Wild, J.; Ascoli, D.; Petr, M.; Honkaniemi, J.; et al. Forest disturbances under climate change. Nat. Clim. Change 2017, 7, 395–402. [Google Scholar] [CrossRef] [Green Version]
- Seidl, R.; Schelhaas, M.-J.; Rammer, W.; Verkerk, P.J. Increasing forest disturbances in Europe and their impact on carbon storage. Nat. Clim. Change 2014, 4, 806–810. [Google Scholar] [CrossRef] [Green Version]
- Senf, C.; Pflugmacher, D.; Zhiqiang, Y.; Sebald, J.; Knorn, J.; Neumann, M.; Hostert, P.; Seidl, R. Canopy mortality has doubled in Europe’s temperate forests over the last three decades. Nat. Commun. 2018, 9, 1–8. [Google Scholar] [CrossRef]
- Morris, J.L.; Cottrell, S.; Fettig, C.J.; Hansen, W.D.; Sherriff, R.L.; Carter, V.A.; Clear, J.L.; Clement, J.; Derose, R.J.; Hicke, J.A.; et al. Managing bark beetle impacts on ecosystems and society: Priority questions to motivate future research. J. Appl. Ecol. 2017, 54, 750–760. [Google Scholar] [CrossRef]
- Hlásny, T.; Zimová, S.; Merganičová, K.; Štěpánek, P.; Modlinger, R.; Turčáni, M. Devastating outbreak of bark beetles in the Czech Republic: Drivers, impacts, and management implications. For. Ecol. Manag. 2021, 490, 119075. [Google Scholar] [CrossRef]
- Göthlin, E.; Schroeder, L.M.; Lindelöw, A. Attacks by Ips typographus and Pityogenes chalcographus on Windthrown Spruces (Picea abies) During the Two Years Following a Storm Felling. Scand. J. For. Res. 2000, 15, 542–549. [Google Scholar] [CrossRef]
- Lausch, A.; Heurich, M.; Gordalla, D.; Dobner, H.-J.; Gwillym-Margianto, S.; Salbach, C. Forecasting potential bark beetle outbreaks based on spruce forest vitality using hyperspectral remote-sensing techniques at different scales. For. Ecol. Manag. 2013, 308, 76–89. [Google Scholar] [CrossRef]
- Wulder, M.A.; Dymond, C.C.; White, J.C.; Leckie, D.G.; Carroll, A.L. Surveying mountain pine beetle damage of forests: A review of remote sensing opportunities. For. Ecol. Manag. 2006, 221, 27–41. [Google Scholar] [CrossRef]
- Hais, M.; Wild, J.; Berec, L.; Brůna, J.; Kennedy, R.; Braaten, J.; Brož, Z. Landsat Imagery Spectral Trajectories—Important Variables for Spatially Predicting the Risks of Bark Beetle Disturbance. Remote Sens. 2016, 8, 687. [Google Scholar] [CrossRef] [Green Version]
- Hall, R.J.; Castilla, G.; White, J.C.; Cooke, B.J.; Skakun, R.S. Remote sensing of forest pest damage: A review and lessons learned from a Canadian perspective. Can. Èntomol. 2016, 148, S296–S356. [Google Scholar] [CrossRef]
- Foster, A.C.; Walter, J.A.; Shugart, H.H.; Sibold, J.; Negron, J. Spectral evidence of early-stage spruce beetle infestation in Engelmann spruce. For. Ecol. Manag. 2017, 384, 347–357. [Google Scholar] [CrossRef] [Green Version]
- Senf, C.; Seidl, R.; Hostert, P. Remote sensing of forest insect disturbances: Current state and future directions. Int. J. Appl. Earth Obs. Geoinf. 2017, 60, 49–60. [Google Scholar] [CrossRef] [Green Version]
- Bárta, V.; Lukeš, P.; Homolová, L. Early detection of bark beetle infestation in Norway spruce forests of Central Europe using Sentinel-2. Int. J. Appl. Earth Obs. Geoinf. 2021, 100, 102335. [Google Scholar] [CrossRef]
- Bater, C.W.; Wulder, M.A.; White, J.C.; Coops, N.C. Integration of LIDAR and Digital Aerial Imagery for Detailed Estimates of Lodgepole Pine (Pinus contorta) Volume Killed by Mountain Pine Beetle (Dendroctonus ponderosae). J. For. 2010, 108, 111–119. [Google Scholar]
- Näsi, R.; Honkavaara, E.; Blomqvist, M.; Lyytikäinen-Saarenmaa, P.; Hakala, T.; Viljanen, N.; Kantola, T.; Holopainen, M. Remote sensing of bark beetle damage in urban forests at individual tree level using a novel hyperspectral camera from UAV and aircraft. Urban For. Urban Green. 2018, 30, 72–83. [Google Scholar] [CrossRef]
- Wulder, M.A.; White, J.C.; Ortlepp, S.M.; Mora, B.; Coggins, S.; Coops, N.C.; Heath, J. Digital high spatial resolution aerial imagery to support forest health monitoring: The mountain pine beetle context. J. Appl. Remote Sens. 2012, 6, 062527. [Google Scholar] [CrossRef] [Green Version]
- Ortiz, S.M.; Breidenbach, J.; Kändler, G. Early Detection of Bark Beetle Green Attack Using TerraSAR-X and RapidEye Data. Remote Sens. 2013, 5, 1912–1931. [Google Scholar] [CrossRef] [Green Version]
- Dash, J.P.; Watt, M.S.; Pearse, G.D.; Heaphy, M.; Dungey, H.S. Assessing very high resolution UAV imagery for monitoring forest health during a simulated disease outbreak. ISPRS J. Photogramm. Remote Sens. 2017, 131, 1–14. [Google Scholar] [CrossRef]
- Kampen, M.; Ledebauer, S.; Mund, J.-P.; Immitzer, M. UAV-Based Multispectral Data for Tree Species Classification and Tree Vitality UAV-Based Multispectral Data for Tree Species Classification and Tree Vitality Analysis. In Proceedings of the Dreilandertagung der DGPF, der OVG und der SGPF, Vienna, Austria, 20–22 February 2019; pp. 623–639. [Google Scholar]
- Heurich, M.; Ochs, T.; Andresen, T.; Schneider, T. Object-orientated image analysis for the semi-automatic detection of dead trees following a spruce bark beetle (Ips typographus) outbreak. Eur. J. For. Res. 2010, 129, 313–324. [Google Scholar] [CrossRef]
- Adamczyk, J.; Osberger, A. Red-edge vegetation indices for detecting and assessing disturbances in Norway spruce dominated mountain forests. Int. J. Appl. Earth Obs. Geoinf. 2015, 37, 90–99. [Google Scholar] [CrossRef]
- Brovkina, O.; Cienciala, E.; Surový, P.; Janata, P. Unmanned aerial vehicles (UAV) for assessment of qualitative classification of Norway spruce in temperate forest stands. Geo-Spat. Inf. Sci. 2018, 21, 12–20. [Google Scholar] [CrossRef] [Green Version]
- Näsi, R.; Honkavaara, E.; Lyytikäinen-Saarenmaa, P.; Blomqvist, M.; Litkey, P.; Hakala, T.; Viljanen, N.; Kantola, T.; Tanhuanpää, T.; Holopainen, M. Using UAV-Based Photogrammetry and Hyperspectral Imaging for Mapping Bark Beetle Damage at Tree-Level. Remote Sens. 2015, 7, 15467–15493. [Google Scholar] [CrossRef] [Green Version]
- Klouček, T.; Komárek, J.; Surový, P.; Hrach, K.; Janata, P.; Vašíček, B. The Use of UAV Mounted Sensors for Precise Detection of Bark Beetle Infestation. Remote Sens. 2019, 11, 1561. [Google Scholar] [CrossRef] [Green Version]
- Guimarães, N.; Pádua, L.; Marques, P.; Silva, N.; Peres, E.; Sousa, J.J. Forestry Remote Sensing from Unmanned Aerial Vehicles: A Review Focusing on the Data, Processing and Potentialities. Remote Sens. 2020, 12, 1046. [Google Scholar] [CrossRef] [Green Version]
- Haralick, R.M. Statistical and structural approaches to texture. Proc. IEEE 1979, 67, 786–804. [Google Scholar] [CrossRef]
- Safonova, A.; Tabik, S.; Alcaraz-Segura, D.; Rubtsov, A.; Maglinets, Y.; Herrera, F. Detection of Fir Trees (Abies sibirica) Damaged by the Bark Beetle in Unmanned Aerial Vehicle Images with Deep Learning. Remote Sens. 2019, 11, 643. [Google Scholar] [CrossRef] [Green Version]
- Kattenborn, T.; Leitloff, J.; Schiefer, F.; Hinz, S. Review on Convolutional Neural Networks (CNN) in vegetation remote sensing. ISPRS J. Photogramm. Remote Sens. 2021, 173, 24–49. [Google Scholar] [CrossRef]
- Chollet, F. Xception: Deep Learning with Depthwise Separable Convolutions. In Proceedings of the 30th IEEE Conference on Computer Vision and Pattern Recognition (CVPR), Honolulu, HI, USA, 21–26 July 2017; pp. 1800–1807. [Google Scholar] [CrossRef] [Green Version]
- Zhu, X.X.; Tuia, D.; Mou, L.; Xia, G.-S.; Zhang, L.; Xu, F.; Fraundorfer, F. Deep Learning in Remote Sensing: A Comprehensive Review and List of Resources. IEEE Geosci. Remote Sens. Mag. 2017, 5, 8–36. [Google Scholar] [CrossRef] [Green Version]
- Reichstein, M.; Camps-Valls, G.; Stevens, B.; Jung, M.; Denzler, J.; Carvalhais, N.; Prabhat. Deep learning and process understanding for data-driven Earth system science. Nature 2019, 566, 195–204. [Google Scholar] [CrossRef] [PubMed]
- Hoeser, T.; Kuenzer, C. Object Detection and Image Segmentation with Deep Learning on Earth Observation Data: A Review-Part I: Evolution and Recent Trends. Remote Sens. 2020, 12, 1667. [Google Scholar] [CrossRef]
- Braga, J.R.G.; Peripato, V.; Dalagnol, R.; Ferreira, M.P.; Tarabalka, Y.; Aragão, L.E.O.C.; Velho, H.F.D.C.; Shiguemori, E.H.; Wagner, F.H. Tree Crown Delineation Algorithm Based on a Convolutional Neural Network. Remote Sens. 2020, 12, 1288. [Google Scholar] [CrossRef] [Green Version]
- Weinstein, B.G.; Marconi, S.; Bohlman, S.; Zare, A.; White, E. Individual Tree-Crown Detection in RGB Imagery Using Semi-Supervised Deep Learning Neural Networks. Remote Sens. 2019, 11, 1309. [Google Scholar] [CrossRef] [Green Version]
- Hartling, S.; Sagan, V.; Sidike, P.; Maimaitijiang, M.; Carron, J. Urban Tree Species Classification Using a WorldView-2/3 and LiDAR Data Fusion Approach and Deep Learning. Sensors 2019, 19, 1284. [Google Scholar] [CrossRef] [Green Version]
- Dos Santos, A.A.; Marcato Junior, J.; Araújo, M.S.; Di Martini, D.R.; Tetila, E.C.; Siqueira, H.L.; Aoki, C.; Eltner, A.; Matsubara, E.T.; Pistori, H.; et al. Assessment of CNN-Based Methods for Individual Tree Detection on Images Captured by RGB Cameras Attached to UAVs. Sensors 2019, 19, 3595. [Google Scholar] [CrossRef] [Green Version]
- Natesan, S.; Armenakis, C.; Vepakomma, U. Resnet-Based Tree Species Classification Using UAV Images. Int. Arch. Photogramm. Remote Sens. Spat. Inf. Sci. 2019, 42, 475–481. [Google Scholar] [CrossRef] [Green Version]
- Onishi, M.; Ise, T. Explainable identification and mapping of trees using UAV RGB image and deep learning. Sci. Rep. 2021, 11, 1–15. [Google Scholar] [CrossRef]
- Lobo Torres, D.; Queiroz Feitosa, R.; Nigri Happ, P.; Elena Cue La Rosa, L.; Marcato Junior, J.; Martins, J.; Ola Bressan, P.; Gonçalves, W.N.; Liesenberg, V. Applying Fully Convolutional Architectures for Semantic Segmentation of a Single Tree Species in Urban Environment on High Resolution UAV Optical Imagery. Sensors 2020, 20, 563. [Google Scholar] [CrossRef] [Green Version]
- Schiefer, F.; Kattenborn, T.; Frick, A.; Frey, J.; Schall, P.; Koch, B.; Schmidtlein, S. Mapping forest tree species in high resolution UAV-based RGB-imagery by means of convolutional neural networks. ISPRS J. Photogramm. Remote Sens. 2020, 170, 205–215. [Google Scholar] [CrossRef]
- Nguyen, H.T.; Caceres, M.L.L.; Moritake, K.; Kentsch, S.; Shu, H.; Diez, Y. Individual Sick Fir Tree (Abies mariesii) Identification in Insect Infested Forests by Means of UAV Images and Deep Learning. Remote Sens. 2021, 13, 260. [Google Scholar] [CrossRef]
- Miyoshi, G.T.; Arruda, M.d.S.; Osco, L.P.; Marcato Junior, J.; Gonçalves, D.N.; Imai, N.N.; Tommaselli, A.M.G.; Honkavaara, E.; Gonçalves, W.N. A Novel Deep Learning Method to Identify Single Tree Species in UAV-Based Hyperspectral Images. Remote Sens. 2020, 12, 1294. [Google Scholar] [CrossRef] [Green Version]
- Nezami, S.; Khoramshahi, E.; Nevalainen, O.; Pölönen, I.; Honkavaara, E. Tree Species Classification of Drone Hyperspectral and RGB Imagery with Deep Learning Convolutional Neural Networks. Remote Sens. 2020, 12, 1070. [Google Scholar] [CrossRef] [Green Version]
- Hlásny, T.; Krokene, P.; Liebhold, A.; Montagné-Huck, C.; Müller, J.; Qin, H.; Raffa, K.; Schelhaas, M.; Seidl, R.; Svoboda, M.; et al. Living with Bark Beetles: Impacts, Outlook and Management Options; European Forest Institute: Joensuu, Finland, 2019. [Google Scholar]
- Agisoft LLC. MicaSense RedEdge MX Processing Workflow (Including Reflectance Calibration) in Agisoft Metashape Professional. Available online: https://agisoft.freshdesk.com/support/solutions/articles/31000148780-micasense-rededge-mx-processing-workflow-including-reflectance-calibration-in-agisoft-metashape-pro (accessed on 5 September 2020).
- Minařík, R.; Langhammer, J.; Lendzioch, T. Automatic Tree Crown Extraction from UAS Multispectral Imagery for the Detection of Bark Beetle Disturbance in Mixed Forests. Remote Sens. 2020, 12, 4081. [Google Scholar] [CrossRef]
- Coulson, R.N.; Amman, G.D.; Dahlsten, D.L.; DeMars, C.J., Jr.; Stephen, F.M. Forest-Bark Beetle Interactions: Bark Beetle Population Dynamics; Integrated Pest Management in Pine-Bark Beetle Ecosystem; John Wiley & Sons: New York, NY, USA, 1985; pp. 61–80. [Google Scholar]
- Geng, J.; Wang, H.; Fan, J.; Ma, X. Deep Supervised and Contractive Neural Network for SAR Image Classification. IEEE Trans. Geosci. Remote Sens. 2017, 55, 2442–2459. [Google Scholar] [CrossRef]
- Siegel, S.; Castellan, N.J.J. Non-Parametric Statistics for the Behavioural Sciences; McGraw-Hill: New York, NY, USA, 1988. [Google Scholar]
- R Core Team. R: A Language and Environment for Statistical Computing; R Foundation for Statistical Computing: Vienna, Austria, 2020; Available online: https://www.R-project.org/ (accessed on 26 May 2021).
- Chollet, F.; Allaire, J.J. Deep Learning with R; Simon and Schuster: New York, NY, USA, 2018; ISBN 9781617295546. [Google Scholar]
- Huang, G.; Liu, Z.; Van Der Maaten, L.; Weinberger, K.Q. Densely connected convolutional networks. In Proceedings of the 30th IEEE Conference on Computer Vision and Pattern Recognition (CVPR), Honolulu, HI, USA, 21–26 July 2017; pp. 2261–2269. [Google Scholar]
- Natesan, S.; Armenakis, C.; Vepakomma, U. Individual tree species identification using Dense Convolutional Network (DenseNet) on multitemporal RGB images from UAV. J. Unmanned Veh. Syst. 2020, 8, 310–333. [Google Scholar] [CrossRef]
- Breiman, L. Random forests. Mach. Learn. 2001, 45, 5–32. [Google Scholar] [CrossRef] [Green Version]
- Cutler, D.R.; Edwards, T.C., Jr.; Beard, K.H.; Cutler, A.; Hess, K.T.; Gibson, J.; Lawler, J.J. Random Forests for Classification in Ecology. Ecology 2007, 88, 2783–2792. [Google Scholar] [CrossRef]
- Boulesteix, A.-L.; Janitza, S.; Kruppa, J.; König, I.R. Overview of random forest methodology and practical guidance with emphasis on computational biology and bioinformatics. Wiley Interdiscip. Rev. Data Min. Knowl. Discov. 2012, 2, 493–507. [Google Scholar] [CrossRef] [Green Version]
- Olson, R.S.; La Cava, W.; Mustahsan, Z.; Varik, A.; Moore, J.H. Data-driven advice for applying machine learning to bioinformatics problems. Pac. Symp. Biocomput. 2018, 23, 192–203. [Google Scholar] [CrossRef] [Green Version]
- Kuhn, M. Building Predictive Models in R Using the caret Package. J. Stat. Softw. 2008, 28, 1–26. [Google Scholar] [CrossRef] [Green Version]
- Kingma, D.P.; Ba, J. Adam: A Method for Stochastic Optimization. In Proceedings of the 3rd International Conference on Learning Representations, ICLR 2015, San Diego, CA, USA, 7–9 May 2015. [Google Scholar]
- Russell, S.; Norvig, P. Artificial Intelligence: A Modern Approach, 3rd ed.; Pearson: New York, NY, USA, 2010; ISBN 9780136042594. [Google Scholar]
- Cohen, J. A Coefficient of Agreement for Nominal Scales. Educ. Psychol. Meas. 1960, 20, 37–46. [Google Scholar] [CrossRef]
- Hastings, J.H.; Ollinger, S.V.; Ouimette, A.P.; Sanders-DeMott, R.; Palace, M.W.; Ducey, M.J.; Sullivan, F.B.; Basler, D.; Orwig, D.A. Tree Species Traits Determine the Success of LiDAR-Based Crown Mapping in a Mixed Temperate Forest. Remote Sens. 2020, 12, 309. [Google Scholar] [CrossRef] [Green Version]
- Windrim, L.; Carnegie, A.J.; Webster, M.; Bryson, M. Tree Detection and Health Monitoring in Multispectral Aerial Imagery and Photogrammetric Pointclouds Using Machine Learning. IEEE J. Sel. Top. Appl. Earth Obs. Remote Sens. 2020, 13, 2554–2572. [Google Scholar] [CrossRef]
- Chiang, C.-Y.; Barnes, C.; Angelov, P.; Jiang, R. Deep Learning-Based Automated Forest Health Diagnosis from Aerial Images. IEEE Access 2020, 8, 144064–144076. [Google Scholar] [CrossRef]
- Sothe, C.; De Almeida, C.M.; Schimalski, M.B.; La Rosa, L.E.C.; Castro, J.D.B.; Feitosa, R.Q.; Dalponte, M.; Lima, C.L.; Liesenberg, V.; Miyoshi, G.T.; et al. Comparative performance of convolutional neural network, weighted and conventional support vector machine and random forest for classifying tree species using hyperspectral and photogrammetric data. GISci. Remote Sens. 2020, 57, 369–394. [Google Scholar] [CrossRef]
- Sothe, C.; Almeida, C.; Schimalski, M.B.; Liesenberg, V.; La Rosa, L.E.C.; Castro, J.D.B.; Feitosa, R.Q. A comparison of machine and deep-learning algorithms applied to multisource data for a subtropical forest area classification. Int. J. Remote Sens. 2020, 41, 1943–1969. [Google Scholar] [CrossRef]
- Kuhn, M.; Johnson, K. Applied Predictive Modeling; Springer: New York, NY, USA, 2013; Volume 26, pp. 419–443. ISBN 978-1-4614-6848-6. [Google Scholar]
- Gao, Q.; Lim, S.; Jia, X. Hyperspectral Image Classification Using Convolutional Neural Networks and Multiple Feature Learning. Remote Sens. 2018, 10, 299. [Google Scholar] [CrossRef] [Green Version]
- Li, Y.; Zhang, H.; Shen, Q. Spectral–Spatial Classification of Hyperspectral Imagery with 3D Convolutional Neural Network. Remote Sens. 2017, 9, 67. [Google Scholar] [CrossRef] [Green Version]
- Wermelinger, B. Ecology and management of the spruce bark beetle Ips typographus—A review of recent research. For. Ecol. Manag. 2004, 202, 67–82. [Google Scholar] [CrossRef]
- Fahse, L.; Heurich, M. Simulation and analysis of outbreaks of bark beetle infestations and their management at the stand level. Ecol. Model. 2011, 222, 1833–1846. [Google Scholar] [CrossRef]
- Wulder, M.A.; White, J.C.; Carroll, A.L.; Coops, N.C. Challenges for the operational detection of mountain pine beetle green attack with remote sensing. For. Chron. 2009, 85, 32–38. [Google Scholar] [CrossRef] [Green Version]
- Qin, J.; Wang, B.; Wu, Y.; Lu, Q.; Zhu, H. Identifying Pine Wood Nematode Disease Using UAV Images and Deep Learning Algorithms. Remote Sens. 2021, 13, 162. [Google Scholar] [CrossRef]
- Eitel, J.U.H.; Vierling, L.A.; Litvak, M.E.; Long, D.S.; Schulthess, U.; Ager, A.A.; Krofcheck, D.J.; Stoscheck, L. Broadband, red-edge information from satellites improves early stress detection in a New Mexico conifer woodland. Remote Sens. Environ. 2011, 115, 3640–3646. [Google Scholar] [CrossRef]
- Immitzer, M.; Atzberger, C. Early Detection of Bark Beetle Infestation in Norway Spruce (Picea abies, L.) using WorldView-2 Data. Photogramm. Fernerkund. Geoinf. 2014, 5, 351–367. [Google Scholar] [CrossRef]
Figure 1.
RGB imagery of the study site: (a) Klánovice forest (red rectangle) and study site (yellow rectangle) located near Prague; (b) RGB orthomosaic of the study site.
Figure 1.
RGB imagery of the study site: (a) Klánovice forest (red rectangle) and study site (yellow rectangle) located near Prague; (b) RGB orthomosaic of the study site.


Figure 2.
Disturbance classes used in the study: (a) pine; (b) sbbd—damaged spruce tree (longer infested spruce tree when needles turn to yellow, light green needles dropped, bark flaked away by woodpeckers); (c) sbbg—spruce tree under green attack (needles green or light green, resin ducts present); (d) sh—live and not infested spruce tree (needles green).

Figure 3.
Spectral separability of disturbance classes: (a) Band 1—Blue, 475 nm; (b) Band 2—Green 560 nm; (c) Band 3—Red, 668 nm; (d) Band 4—Red-edge, 717 nm; (e) Band 5—NIR, 840nm. * Marks the significant spectral differences (the significance level α = 0.05) among disturbance classes. The results of multiple comparisons are presented only for the most important disturbance classes reflecting the bark beetle infestation.


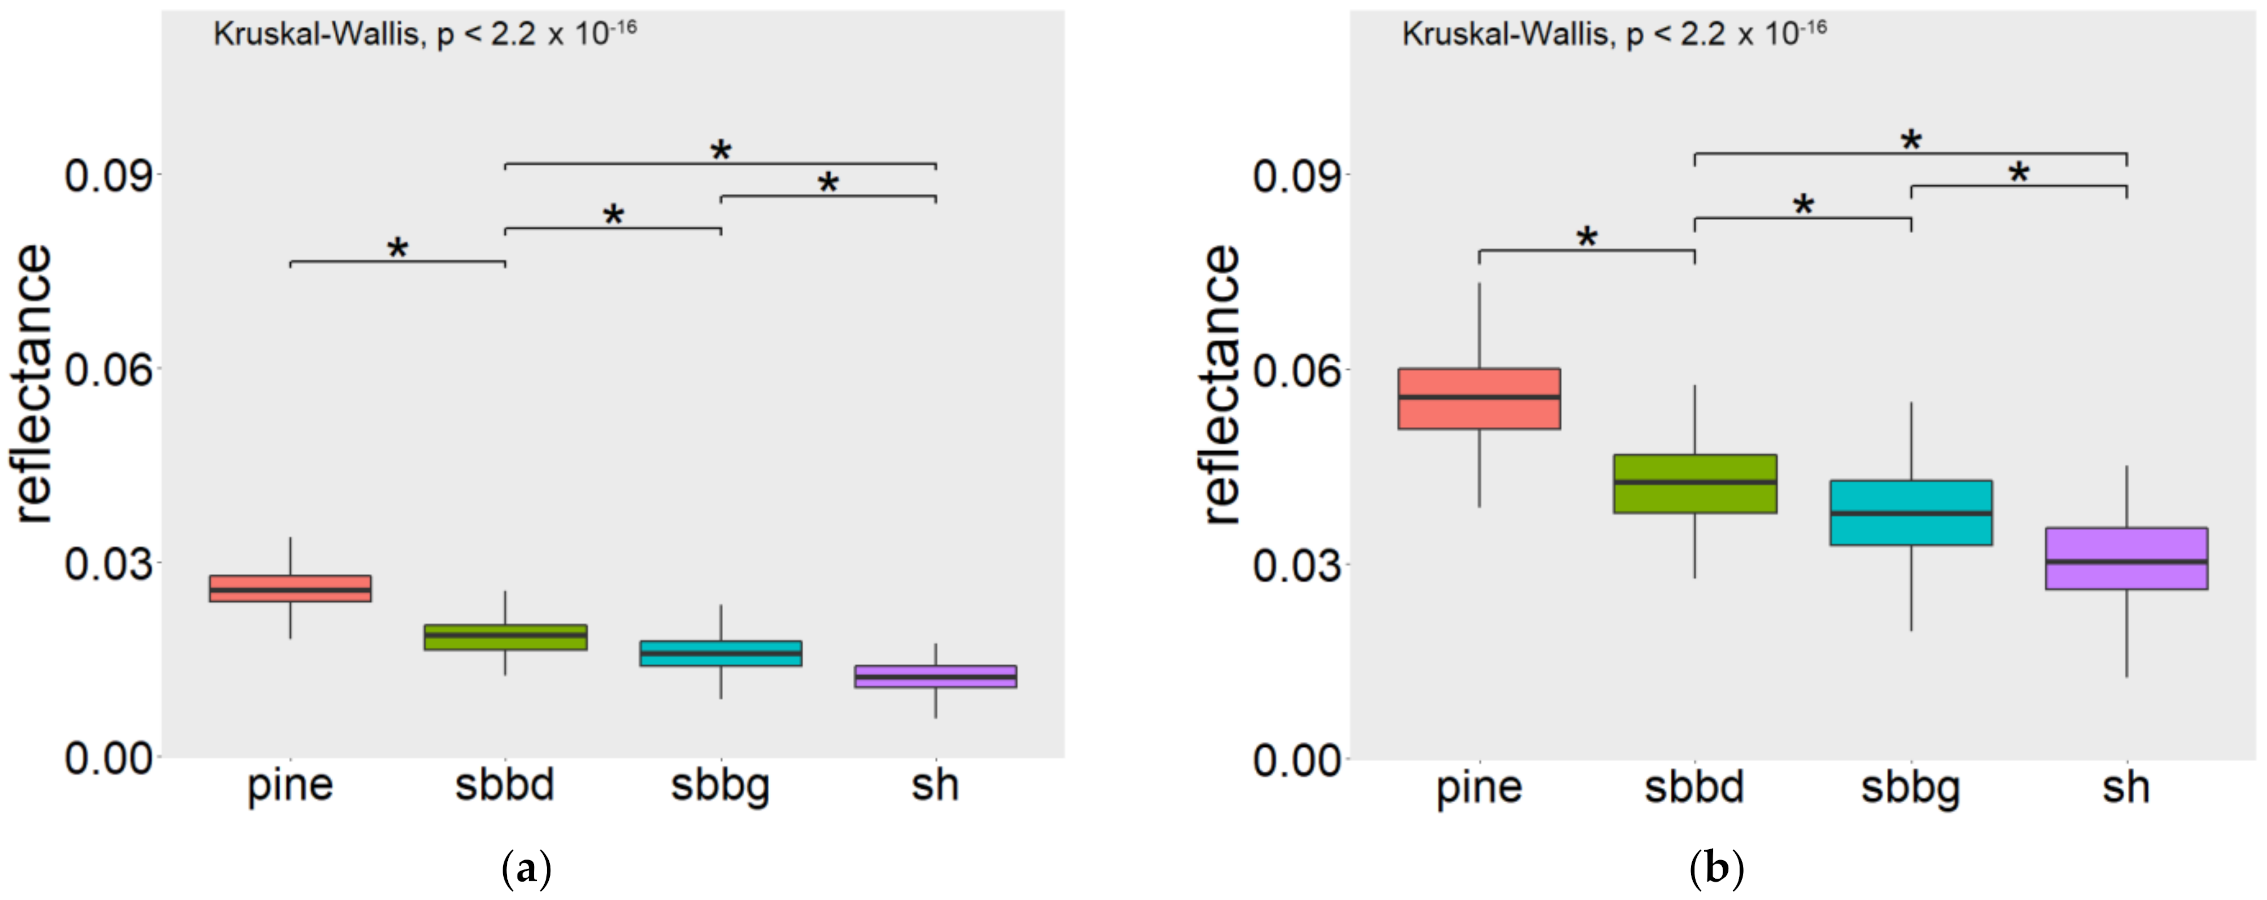
Figure 5.
Illustration of classification results using test dataset: (a) Safaugu 4c3b; (b) RF 4c3b. Ground truth data are represented by points. Model predictions are represented by squares. Pines are highlighted in blue. Sbbd spruces are highlighted in red. Sbbg spruces are highlighted in orange. Sh spruces are highlighted in green.

Table 1.
Configuration of Nez CNN model. (i) is the number of input bands. We classified into 4 or 3 disturbance classes.
Table 1.
Configuration of Nez CNN model. (i) is the number of input bands. We classified into 4 or 3 disturbance classes.
| Layer | Kernel Size | Kernel Number | Stride | Output Size |
|---|---|---|---|---|
| Input | - | - | 32 × 32 × (i) | |
| Conv1 | 5 × 5 | 4 | 1 | 28 × 28 × 4 |
| Maxpool1 | 3 × 3 | 1 | 3 | 9 × 9 × 4 |
| Conv2 | 5 × 5 | 16 | 1 | 5 × 5 × 16 |
| Maxpool1 | 3 × 3 | 1 | 3 | 1 × 1 × 16 |
| ReLU | - | - | ||
| Conv3 | 1 × 1 | 4 | 1 | 1 × 1 × 4 |
| Dense (softmax) | - | - | 4 (3) |
Table 2.
Configuration of Saf/Safaugu CNN model. (i) is the number of input bands. We classified into 4 or 3 disturbance classes.
Table 2.
Configuration of Saf/Safaugu CNN model. (i) is the number of input bands. We classified into 4 or 3 disturbance classes.
| Layer | Kernel Size | Kernel Number | Stride | Output Size |
|---|---|---|---|---|
| Input | - | - | 32 × 32 × (i) | |
| Conv1 | 3 × 3 | 8 | 1 | 32 × 32 × 8 |
| Max Pool1 | 2 × 2 | 1 | 2 | 16 × 16 × 8 |
| Conv2 | 5 × 5 | 16 | 1 | 16 × 16 × 16 |
| Conv3 | 3 × 3 | 16 | 1 | 16 × 16 × 16 |
| Max Pool2 | 2 × 2 | 1 | 2 | 8 × 8 × 16 |
| Conv4 | 3 × 3 | 16 | 1 | 8 × 8 × 16 |
| Conv5 | 5 × 5 | 16 | 1 | 8 × 8 × 16 |
| Dropout1 | - | - | 0.15 | |
| Conv6 | 5 × 5 | 64 | - | 8 × 8 × 64 |
| Glob Avg Pool | - | - | 64 | |
| Dense1 (ReLU) | - | - | 64 | |
| Dropout2 | - | - | 0.25 | |
| Dense2 (ReLU) | - | - | 16 | |
| Dense3 (softmax) | - | - | 4 (3) |
Table 3.
Configuration of Dense169 CNN model. (i) is the number of input bands. We classified into 4 or 3 disturbance classes.
Table 3.
Configuration of Dense169 CNN model. (i) is the number of input bands. We classified into 4 or 3 disturbance classes.
| Layer | Output Size |
|---|---|
| Input | 32 × 32 × (i) |
| DenseNet169 (convolutional base) | 1664 |
| Dense1 (ReLU) | 128 |
| Dense2 (ReLU) | 16 |
| Dense3 (softmax) | 4 (3) |
Table 4.
The overview of finally selected batch size, number of epochs and steps per epoch for every CNN model to prevent overfitting.
Table 4.
The overview of finally selected batch size, number of epochs and steps per epoch for every CNN model to prevent overfitting.
| Model | Batch Size T | Batch Size V | Epochs | Steps per Epoch T | Steps per Epoch V |
|---|---|---|---|---|---|
| Nez | 1 | 1 | 40 | - | - |
| Saf | 27 | 26 | 160 | 18 | 2 |
| SafAugu | 27 | 26 | 400 | 18 | 2 |
| DenseNet 169 | 27 | 26 | 160 | 18 | 2 |
T: training dataset; V: validation dataset.
Table 5.
The results of automatic tree identification.
| Point Density (points/m2) | TP | FP | FN | r | p | F-Score |
|---|---|---|---|---|---|---|
| 22 | 585 | 14 | 87 | 0.87 | 0.98 | 0.92 |
TP: true positive, FP: false positive; FN: false negative; r: recall; p: precision.
Publisher’s Note: MDPI stays neutral with regard to jurisdictional claims in published maps and institutional affiliations. |
© 2021 by the authors. Licensee MDPI, Basel, Switzerland. This article is an open access article distributed under the terms and conditions of the Creative Commons Attribution (CC BY) license (https://creativecommons.org/licenses/by/4.0/).
Share and Cite
MDPI and ACS Style
Minařík, R.; Langhammer, J.; Lendzioch, T. Detection of Bark Beetle Disturbance at Tree Level Using UAS Multispectral Imagery and Deep Learning. Remote Sens. 2021, 13, 4768. https://0-doi-org.brum.beds.ac.uk/10.3390/rs13234768
AMA Style
Minařík R, Langhammer J, Lendzioch T. Detection of Bark Beetle Disturbance at Tree Level Using UAS Multispectral Imagery and Deep Learning. Remote Sensing. 2021; 13(23):4768. https://0-doi-org.brum.beds.ac.uk/10.3390/rs13234768
Chicago/Turabian StyleMinařík, Robert, Jakub Langhammer, and Theodora Lendzioch. 2021. "Detection of Bark Beetle Disturbance at Tree Level Using UAS Multispectral Imagery and Deep Learning" Remote Sensing 13, no. 23: 4768. https://0-doi-org.brum.beds.ac.uk/10.3390/rs13234768
Note that from the first issue of 2016, this journal uses article numbers instead of page numbers. See further details here.