Article

Evaluation and Analysis of Poverty-Stricken Counties under the Framework of the UN Sustainable Development Goals: A Case Study of Hunan Province, China

1
Hunan Provincial Key Laboratory of Geo-Information Engineering in Surveying, Mapping and Remote Sensing, Hunan University of Science and Technology, Xiangtan 411201, China
2
National-Local Joint Engineering Laboratory of Geo-Spatial Information Technology, Hunan University of Science and Technology, Xiangtan 411201, China
3
School of Earth Sciences and Geospatial Information Engineering, Hunan University of Science and Technology, Xiangtan 411201, China
4
Department of Geography and Resource Management, The Chinese University of Hong Kong, Shatin, Hong Kong 999077, China
*
Author to whom correspondence should be addressed.
Remote Sens. 2021, 13(23), 4778; https://0-doi-org.brum.beds.ac.uk/10.3390/rs13234778
Submission received: 29 September 2021 / Revised: 9 November 2021 / Accepted: 23 November 2021 / Published: 25 November 2021

Abstract

:
Eliminating all forms of poverty in the world is the first United Nations Sustainable Development Goal (SDG). Developing a scientific and feasible method for monitoring and evaluating local poverty is important for the implementation of the SDG agenda. Based on the 2030 United Nations SDGs, in this paper, a quantitative evaluation model is built and applied to all poverty-stricken counties in Hunan Province. First, based on the SDG global index framework and local index system of China, a local SDG index system for poverty-related goals is designed, and the weights of the indexes are derived using an entropy method. The scores obtained for counties and districts with data available are then taken as the true value for the poverty assessment. Second, using National Polar-orbiting Visible Infrared Imaging Radiometer Suite (NPP-VIIRS) nighttime light images and land use and digital elevation model data, six factors, including socioeconomic, land cover, terrain and traffic factors, are extracted. Third, we then construct multiple linear evaluation models of poverty targets defined by the SDGs and machine learning evaluation models, including regression trees, support vector machines, Gaussian process regressions and ensemble trees. Last, combined with statistical data of poverty-stricken counties in Hunan Province, model validation and accuracy evaluation are carried out. The results show that the R2 and relative error of the localized, multiple linear evaluation model, including all six factors, are 0.76 and 19.12%, respectively. The poverty-stricken counties in Hunan Province were spatially aggregated and distributed mainly in the southeastern and northwestern regions. The proposed method for regional poverty assessment based on multisource geographic data provides an effective poverty monitoring reference scheme for the implementation of the poverty eradication goals in the 2030 agenda.

1. Introduction

Poverty poses a complex and substantial challenge to the sustainable development of human society. Poverty reduction and poverty alleviation are sustainable development goals (SDGs) that all countries in the world are committed to achieving [1]. To coordinate social development, economic development and environmental protection, on 25 September 2015, the United Nations Sustainable Development Summit adopted the “Change Our World: 2030 Agenda for Sustainable Development” and established 17 SDGs [2,3,4,5,6,7], the first of which is to eradicate all forms of poverty worldwide (SDG 1). It was also pointed out at this summit that poverty eradication must be achieved with poverty assessment and monitoring and the evaluation of progress. S. Rowntree clearly put forward the concept of absolute poverty for the first time in his book, Poverty: A Study of Town Life. He believes that a family is in poverty because the income it has is not enough to maintain the minimum needs of its physiological functions. Goal 1.1 of the 2030 Agenda for Sustainable Development states that the measure of absolute poverty is less than US$1.25 per person per day. The Chinese government stipulates that an annual income of less than 4000 RMB means absolute poverty. China has been striving to eliminate absolute poverty. On 25 February 2021, the Chinese government announced that it had achieved the poverty reduction goal of the United Nations 2030 Agenda for Sustainable Development 10 years ahead of schedule at the National Poverty Alleviation Summary and Commendation Conference. Hunan Province is located in central China, a typical representative province with unbalanced regional development in the Chinese mainland and is selected as a case study. Therefore, this article uses multisource geographic data to monitor the progress of China’s Hunan Province in achieving the poverty reduction goal and provides a reference for subsequent, regional, balanced development.
To accelerate the implementation of the global sustainable development agenda, the United Nations adopted a global indicator framework with 232 indicators, of which SDG 1 had 13 in 2017 [3]. The global SDG indicator framework clarifies the technology and methods needed for target evaluation, which is universal and comprehensive, and provides a unified indicator system for countries to carry out SDG evaluation and monitoring [8]. However, considering the different stages of development and degree of data mastery in various countries or regions [9,10], how to effectively select and monitor SGD indicators based on actual social development is the most difficult task in the evaluation of SDGs [7]. Therefore, it is necessary to establish a scientific and feasible national or regional SDG indicator system as soon as possible to enable more comprehensive monitoring and evaluation of the SDG process [11,12,13,14,15] and provide a better reference for regional, mid- and long-term, sustainable development planning. A wealth of results has been obtained regarding the construction of a poverty index assessment system [16,17,18,19,20,21]. Scholars suggest that poverty has multidimensional attributes. Some previous studies have applied physical geographic factors to represent poverty attributes and included factors such as average slope and nighttime light intensity in poverty index evaluation systems [16,21]. Other studies have selected only socioeconomic poverty attributes, such as lifestyle, education, medical care and development [17,20]. However, physical and geographic factors affect poverty rather than reflecting poverty. Social and economic indicators are determined mostly artificially based on experience or statistical data, and there is a lack of district- and county-level poverty indicator systems based on the global SDG indicator framework. It is still difficult to evaluate SDG 1 at the county level and to implement rural revitalization strategies. The elimination of absolute poverty and the strategy of rural revitalization are in order. The strategy of rural revitalization is to further improve the living standards of rural people on the basis of eliminating absolute poverty. Recent research regarding the monitoring and evaluation of SDGs is based mainly on the analysis of economic and social data or multisource geographic data [22,23,24,25,26,27,28]. Antoniades [22] established a multidimensional poverty framework based on statistical data and analyzed the impact of the financial crisis on the SDGs related to poverty eradication. Hossain et al. [23] employed statistics on the four dimensions of health, material, safety, freedom, and social relations. Data can reflect levels of human well-being. Liu et al. [24] suggested that China should monitor poverty in terms of income, education, health, housing and living standards. These measures cannot involve poverty rights and lack a specific indicator system. However, the domestic, statistical data standards of districts and counties are inconsistent; data integrity and geographic attributes are difficult to guarantee; and there are difficulties in monitoring and evaluating SDG 1 at the district and county levels. Multisource geographic data can be applied to detect various geographic objects and phenomena in nature and society on a large scale, thus reflecting the spatial characteristics of human social activities to a certain extent, and are often applied in spatialization research and to estimate economic and social parameters. In recent years, multisource geographic data have been utilized to determine the progress of SDGs [29,30,31,32,33,34,35,36,37,38,39,40,41,42,43,44]. Liu et al. [29] proposed that geography should become a key discipline in integrating many disciplines involved in sustainable development studies and that a series of geographic data in the future, such as remote sensing images, can serve as monitoring data for sustainable development. Holloway et al. [30] also suggested that with the development of remote sensing technology, remote sensing data have become increasingly accessible, and remote sensing images are increasingly applied for sustainable development monitoring. Future work will likely include more ensemble methods and new approaches to performing these remote sensing analyses. Chen et al. [39] integrated geographic and statistical data, measured the progress of China’s Deqing County in achieving sustainable development, and provided an example reference for the application of geographic data to sustainable development monitoring.
Related research has achieved results in the evaluation and monitoring of SDGs, such as poverty [45,46,47,48,49,50,51], agricultural development [52], urban development [53] and land planning [54]. For example, Zhao et al. [45] used National Polar-orbiting Visible Infrared Imaging Radiometer Suite (NPP-VIIRS) nighttime light data, land surface coverage data, remote sensing images and road networks and other geographic data to monitor the poverty-stricken areas of Bangladesh in 2015. Vaziri et al. [46], who considered poverty a spatial function (e.g., spatial analysis and mapping can be used to explain and reveal the spatio-temporal evolution of poverty), used spatial analysis tools to clarify the spatial distribution characteristics of poverty in Malaysia and discussed the main factors affecting the spatial pattern of poverty. Yu et al. [47] employed NPP-VIIRS nighttime light data to obtain an average light index, which was used to evaluate China’s county-level poverty. Li et al. [48] applied Defense Meteorological Program Operational Linescan System (DMSP/OLS) nighttime light data to identify poverty-stricken counties in China from 1992 to 2013. Niu et al. [49] used Landsat 8 images, NPP-VIIRS nighttime light data, point-of-interest (POI) data and housing rent data to measure Guangzhou urban poverty. Steele et al. [50] also employed geographic data related to human welfare, including nighttime light data, vegetation index, and road data, to monitor poverty. However, the selection of multisource geographic data, extraction of factors, and methods for evaluating SDG 1 require further exploration.
Therefore, in view of the applicability of a localized indicator system, multisource geographic data, and a quantitative model for monitoring and evaluating SDG 1, which is the United Nations SDG related to eliminating poverty, the Hunan Province districts and counties are selected as examples to design and propose models. The localized evaluation method for SDG 1, combined with statistical data to verify the model results, was applied to explore the characteristics of the spatial distribution pattern of poverty-stricken areas and counties.

2. Materials and Methods
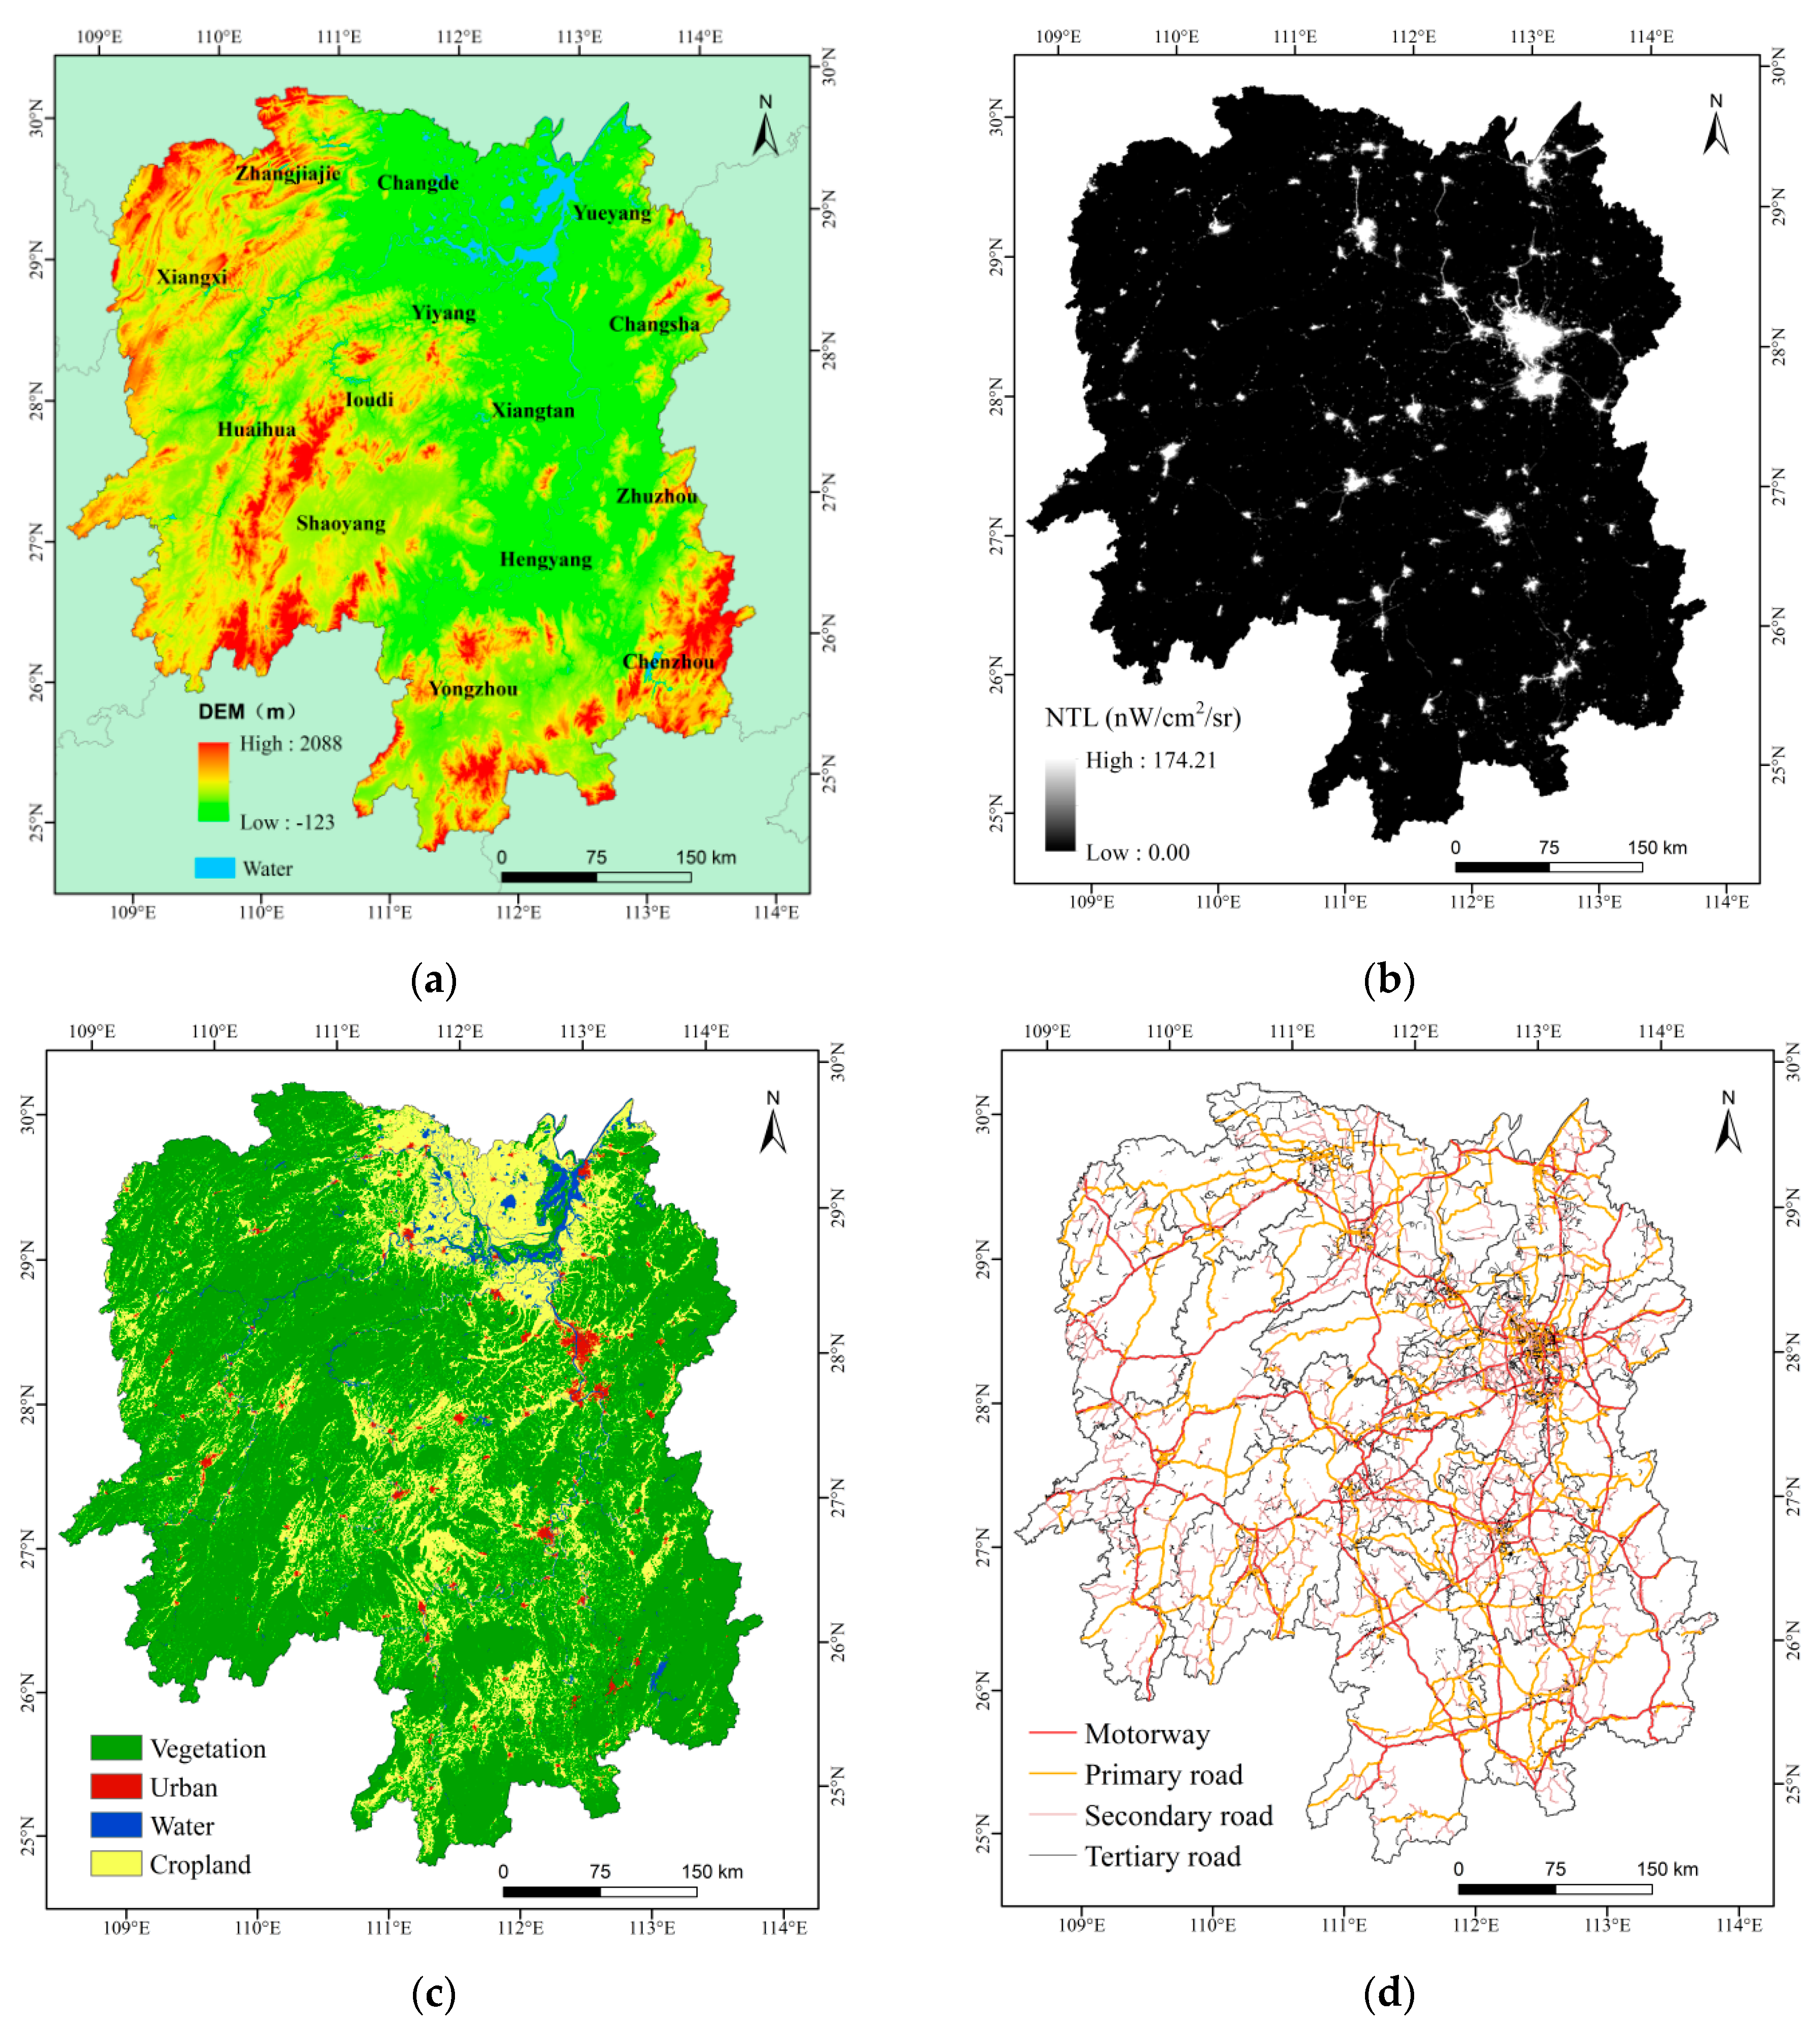
2.1. Research Area

The study area is Hunan Province, China, with a total area of 21,800 square kilometers, including 14 prefecture-level administrative regions and a total of 122 county-level administrative divisions. Hunan Province is located in central China, between the relatively poor western China and the relatively wealthy eastern China and has a relatively developed economy. However, there are obvious regional development imbalances in Hunan Province [55]. In 2018, the difference between the county with the highest per capita GDP in Hunan Province and the county with the lowest per capita GDP was 14.75 times. The gap between the rich and the poor is obvious. The balanced development of Hunan Province is the key to the pursuit of human well-being in Hunan Province. The internal economic development level of Hunan Province also appears to be relatively rich in the east and poor in the west. The temporal and spatial evolution of poverty in Hunan Province can better represent China’s poverty eradication process. According to the data collected and its completeness, this article analyzes a method for evaluating poverty-stricken areas and counties in Hunan Province based on the data of 2014, 2016 and 2018.

2.2. Data Sources

The experimental data in this article include Shuttle Radar Topography Mission (SRTM) digital elevation model (DEM) data, NPP-VIIRS nighttime light images, land use data, open street map (OSM) road data and socioeconomic statistics.
(1) SRTM DEM data
The DEM data of the experimental area are derived from the US SRTM data set, which is based on the most recent acquisition (SRTM V4.1) and created by collating and splicing DEM data with a resolution of 90 m (Figure 1a). Topography is an important natural factor that affects socioeconomic development and that is somewhat related to the spatial distribution of poverty [56,57] because the natural topography can directly affect the construction of transportation networks, logistics trade, survival conditions and so on, which are closely related to poverty.
(2) NPP-VIIRS nighttime light image
NPP-VIIRS nighttime light images are obtained from the Earth Observation Group (EOG). EOG produced a new consistently processed time series of annual, global, VIIRS nighttime lights from monthly, cloud-free, average radiance grids spanning 2012 to 2020 (Figure 1b). EOG’s processing of NPP-VIIRS nighttime light images eliminates the effects of sunlight, moonlight, clouds, biomass burning, aurora and background noise. The lighting conditions on the ground have been effectively monitored with the help of NPP-VIIRS nighttime light images. [58]. We applied the annual NPP-VIIRS nighttime light images of 2014, 2016 and 2018. The spatial resolution of the NPP-VIIRS nighttime light image is 500 m. Nighttime light can reflect the level of economic development of the region and is widely transported to the inversion of socioeconomic parameters [59,60].
(3) Land use data
The land use data are obtained from the European Space Agency (ESA) Climate Change Initiative (CCI) project. The land use data include data on 22 types of land, including urban land, water bodies and grassland, with a resolution of 300 m. We integrated land cover types into four categories: urban, cropland, vegetation, and water (Figure 1c). This research uses mainly urban land area to represent construction land. Land use data can reflect the direction and intensity of land use in a region, and different land use structures can reflect different landscape compositions [61,62].
(4) OSM road data
The road traffic network data of the experimental area in 2014, 2016 and 2018 are derived from the OSM website. We choose motorways, primary roads, secondary roads and tertiary roads in the OSM road data as road data (Figure 1d). The road network is an important infrastructure and a key channel for economic exchanges, which can effectively promote regional economic development [63].
(5) Socioeconomic statistics
The social and economic statistics of the experimental area are derived from the 2014, 2016 and 2018 Statistical Yearbooks of Prefecture-level Cities in Hunan Province, China, and The National Economic and Social Development Statistical Communiqués of Districts and Counties. These statistics mainly include the incidence of poverty, the number of urban and rural residents with minimum living allowances, disposable income of urban and rural residents, and number of registered populations. Due to the difficulty of obtaining social and economic statistics in some districts and counties, 30 districts and counties with complete data for model construction and accuracy verification are selected for this research.

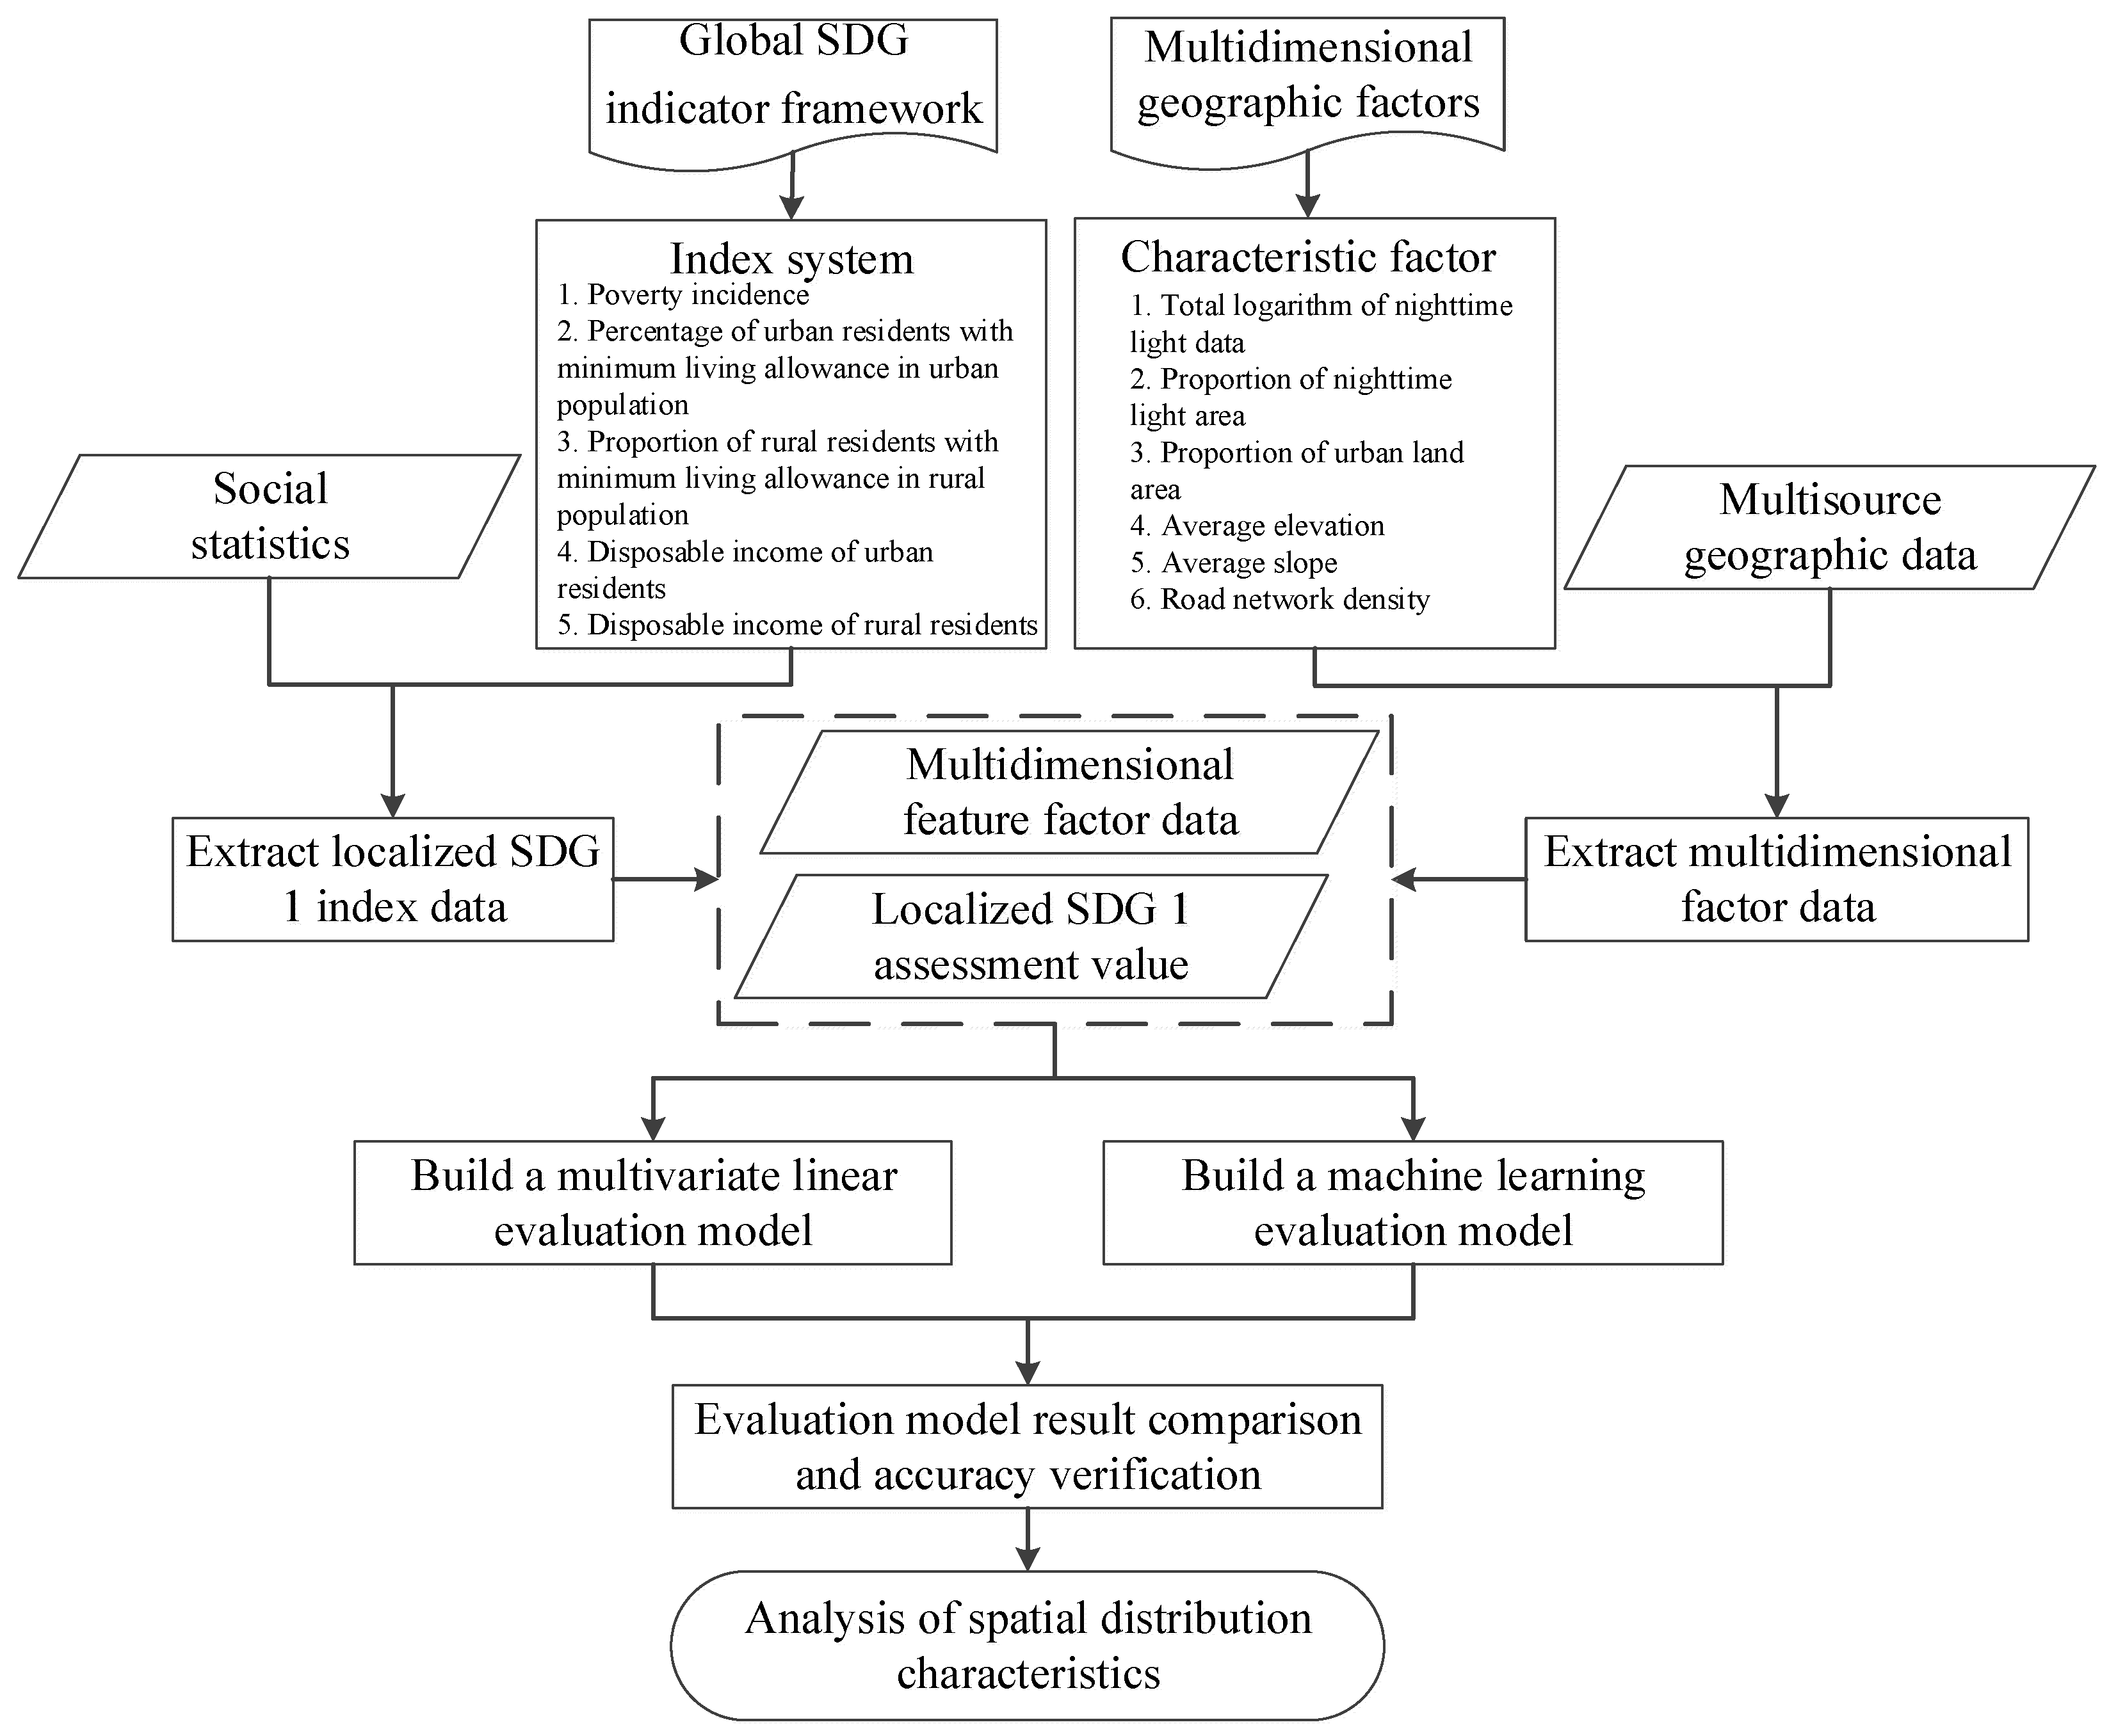
2.3. Research Methods

This paper establishes a localized SDG 1 indicator system for districts and counties within the global SDG indicator framework and combines multisource geographic data to calculate and analyze the local evaluation value and spatial distribution characteristics of SDG 1 in Hunan Province. The specific process is shown in Figure 2.

2.3.1. Localized SDG 1 Index System for Districts and Counties

To promote the SDG agenda and integrate China’s social development, the “2018 China SDG Index Construction and Progress Evaluation Report” proposes a statistical data-based indicator system for the evaluation of SDG 1 in China. Considering the lack of completeness of China’s localized SDG 1 indicators, combined with the available statistical data for the district and county levels in Hunan Province, in this research a district/county-level, SDG 1 indicator system composed of five indicators is developed (Table 1).
Among the indicators included in the system, localized, SDG 1 indicator 1 corresponds to indicators 1 and 2 in the global SDG framework, and localized indicators 2 and 3 correspond to indicators 3 and 4 in the global SDG 1 framework. Due to the nature of the SDG 1 indicators in the global SDG framework, it is difficult to obtain data relevant to indicators 5, 6, and 7 for districts and counties in Hunan Province in 2014, 2016 and 2018. Therefore, the disposable incomes of urban and rural residents are added to reflect their living standards. The localized SDG 1 indicators for the districts and counties included in this article are based on the global SDG indicator framework and the completeness of Hunan Province’s district and county data. Compared with the global SDG indicators, the localized indicators more comprehensively reflect the level of regional socioeconomic development and better reflect the SDGs focused on eliminating all forms of poverty. Local indicator data are also more readily available.
To determine the localized SDG 1 indicators of the districts and counties in this study, the selected indicators undergo dimensionless processing and weighting. In view of the uncertain range of localized SDG 1 index values in districts and counties, the z-score standardization method is selected to perform dimensionless processing of the indexes. The methods for determining the weight of indicators are divided into three categories: subjective, objective, and a combination of subjective and objective. In the case of a known SDG 1 evaluation value, methods such as Shapley additive explanations can be employed to determine the index weight [64]. However, there is no actual SDG 1 evaluation value in Hunan Province, because the subjective component may deviate from the development reality of Hunan Province; it is impossible to more accurately describe poverty. The entropy method is an objective weighting method, which determines the weights of the indicators based on their own values. The entropy method can use the information entropy to calculate the weight according to the change degree of each indicator value. The greater the degree of change, the greater the weight of the indicator. To more objectively evaluate the importance of each index, the entropy method is employed to assign weights to the indexes, and the weight value of each index is obtained (Table 2). Therefore, the values of the localized SDG 1 indexes for some districts and counties in Hunan Province are calculated by Formula (1), resulting in the true value of the localized SDG 1 evaluation. In this evaluation, the larger the value is, the richer the district and county; in contrast, the smaller the value is, the poorer the district and county.
S D G 1 r = i = 1 5 W i × X i
In Formula (1), S D G 1 r is the true value of the localized SDG 1 evaluation based on the district- and county-level SDG 1 index system and statistical data, W i is the weight value of the i-th index, and X i is the i-th index value after dimensionless processing.
In 2014, the Chinese government announced a list of China’s national poverty counties (NPCs). The socioeconomic statistics data on 32 counties were collected in Hunan Province, in 2014. There were 18 NPCs and 14 non-NPCs among these counties. The SDG 1 evaluation values of these 32 districts and counties were calculated by our proposed Localized SDG 1 indicators for districts and counties and were ranked from high to low in Figure 3. It could be determined whether these counties were national poverty counties by comparing with the data announced by the Chinese government. The results show that the SDG 1 evaluation values of 12 non-NPCs rank in the forefront, indicating that the calculated SDG 1 evaluation values by our method can better reflect the poverty level of Chinese districts and counties. Therefore, the SDG 1 evaluation values calculated by Localized SDG 1 indicators for districts and counties are feasible as the actual SDG 1 evaluation values in this study.

2.3.2. Localized SDG 1 Evaluation Model for Districts and Counties Based on Multiple Linear Regression

Poverty is a complex social phenomenon affected by multiple factors that requires multidimensional analysis. This paper analyzes poverty from the four dimensions of social economy, land cover, topography, and traffic network. The social economy can reflect the active degree of economic exchanges in a region. The more developed the economy is, the stronger the ability to drive employment. Land cover can reflect the surface landscape composed of different land cover types, and the specific number of different land cover types describes the degree of land development and utilization. Topography is one of the important natural factors that causes regional poverty. The complex topography and geomorphology conditions make it difficult to develop the region. The traffic network describes the degree of perfection of the regional roads, and perfect road facilities in China have a role in promoting regional development [21,45].
Nighttime light images effectively reflect the intensity of human activities, provide robust spatial details of human society, and allow time-series monitoring of the temporal and spatial dynamics of human social activities. Socioeconomic factors can be extracted from nighttime light images; land use data, from which features can be extracted, reflect the current use direction and development degree of the land surface; DEM data reflect the terrain surface with a certain accuracy curve, and other landform characteristics and topographic and landform features can be extracted from the DEM; and roads, which bear most of the traffic volume, can be used to extract traffic network data; thus, a total of six factors are obtained (Table 3). The six characteristic factors of the four abovementioned data types are used as independent variables, and the true value from the district/county-level SDG 1 evaluation is used to construct an evaluation model. Twenty-two districts and counties are randomly selected to construct the evaluation models, and the remaining 8 districts and counties are used to verify the model accuracy.
The impact of combinations of factors on the evaluation model needs to be considered. In this study, a multiple linear regression model is chosen to construct evaluation models of the localized SDG 1 indicators in Hunan Province. To analyze the degree of model influence of the factors, the following models were constructed: Model I consisted of socioeconomic, surface coverage, topographic and transportation network data; Model II consisted of socioeconomic, surface coverage and topographic data; Model III consisted of socioeconomic, surface coverage and transportation network data; Model IV consisted of socioeconomic, topographic and transportation network data; and Model V consisted of land surface coverage, topography and transportation network data. The five evaluation models for the district- and county-level SDG 1 indicators are detailed in Formulas (2)–(6).
S D G 1 s = β 0 + β 1 V 1 + β 2 V 2 + β 3 V 3 + β 4 V 4 + β 5 V 5 + β 6 V 6
S D G 1 s = β 0 + β 1 V 1 + β 2 V 2 + β 3 V 3 + β 4 V 4 + β 5 V 5
S D G 1 s = β 0 + β 1 V 1 + β 2 V 2 + β 3 V 3 + β 6 V 6
S D G 1 s = β 0 + β 1 V 1 + β 2 V 2 + β 4 V 4 + β 5 V 5 + β 6 V 6
S D G 1 s = β 0 + β 3 V 3 + β 4 V 4 + β 5 V 5 + β 6 V 6
In Formulas (2)–(6), β 0 is a constant term; β 1 , β 2 , β 3 , β 4 , β 5 , and β 6 are regression coefficients; and S D G s 1 s is the estimated value of the localized SDG 1 evaluation based on the model.

2.3.3. Localized Evaluation Model for District- and County-Level SDG 1 Indicators Based on a Machine Learning Algorithm

In the absence of a determination and estimation method for the evaluation of localized SDG 1 indicators in districts and counties, machine learning algorithms can be applied to analyze and extract key feature information from available data sets, identify complex correlations between input data, and perform repeated training and verification of many samples for accurate simulation and prediction. Based on the actual value of the evaluation of localized SDG 1 indicators in 92 districts and counties of Hunan Province in 2014, 2016 and 2018 and data from six factors, four machine learning algorithms, which are referred to as evaluation Model VI, Model VII, Model VIII, and Model IX, are constructed based on regression trees, support vector machines, Gaussian process regression, and ensemble trees.
Multiple iterations of 5-fold cross-validation were performed for the four evaluation models of localized SDG 1 indicators based on machine learning algorithms and sample data from 30 districts and counties, and the results with higher goodness of fit were selected to determine the important parameters of the models (Table 4). In the procedure of model training and parameters determination, almost the whole set of possible options of parameters were tried in the multiple times of experiments. By comparing the estimation results of different parameters for each model, the more suitable parameters of these machine learning models are presented in Table 4. The parameters of the regression tree in Model VI and ensemble tree in Model IX are the minimum leaf size, with values of 12 and 8, respectively. The parameters of the support vector machine in Model VII and Gaussian process regression in Model VIII are determined by the linear kernel function and Matern kernel function, respectively.

3. Results

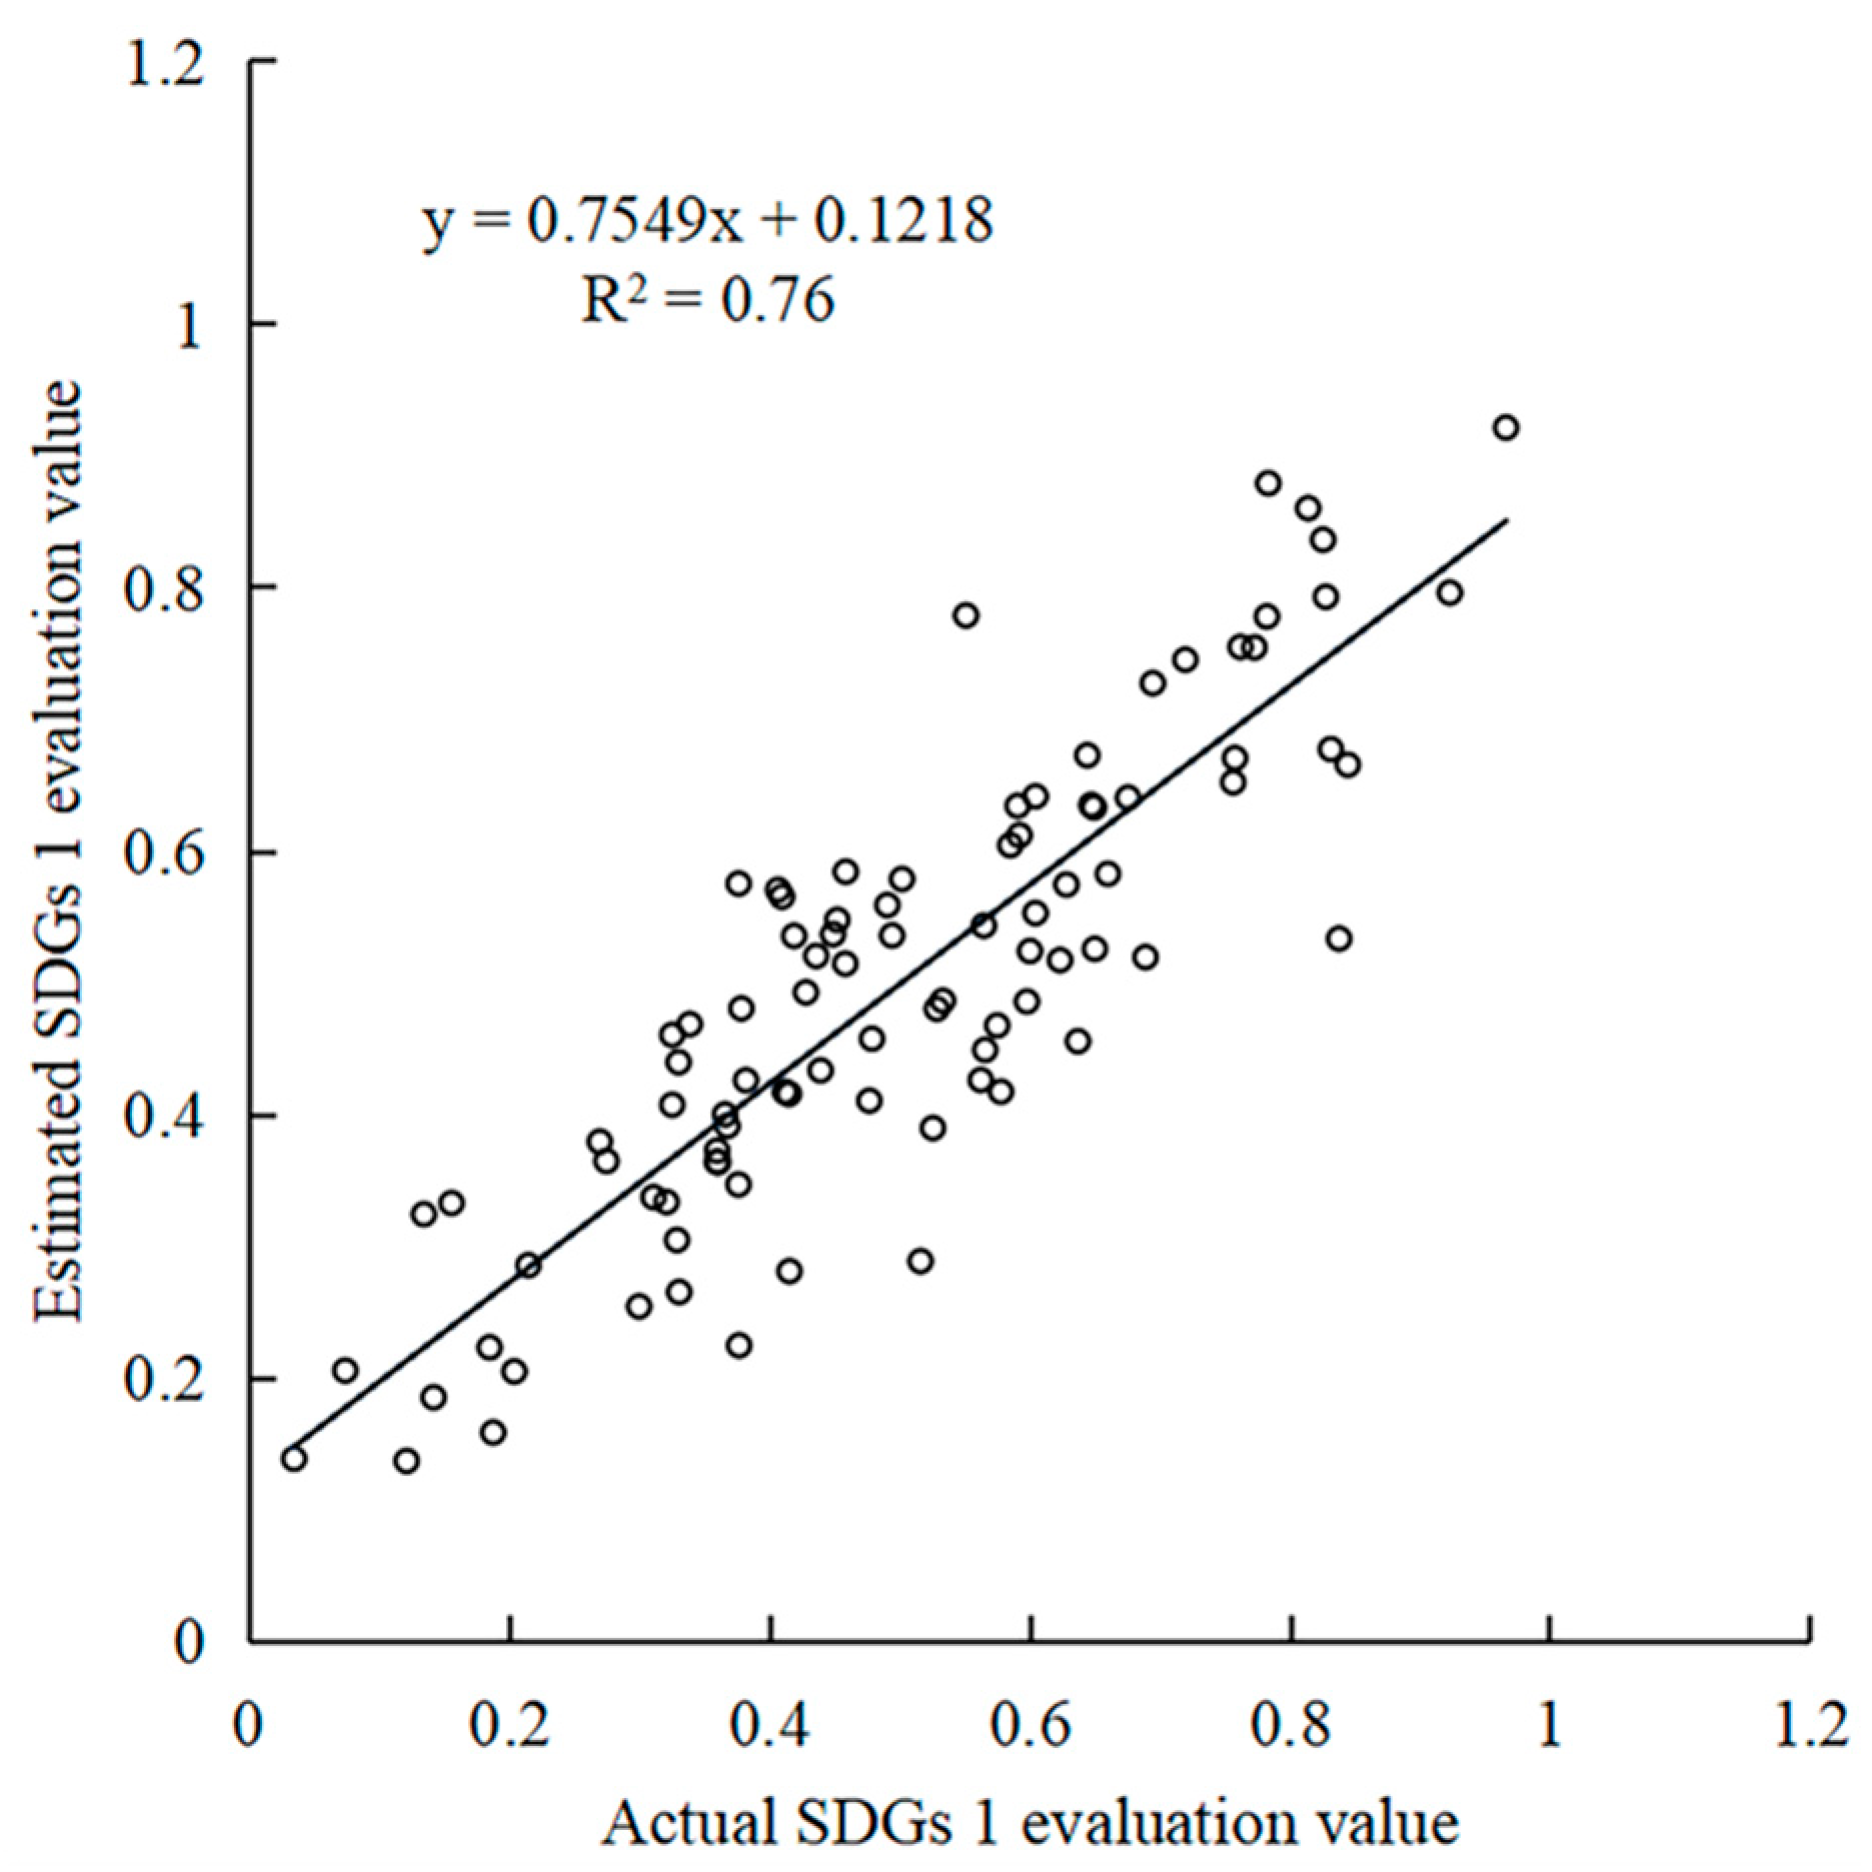
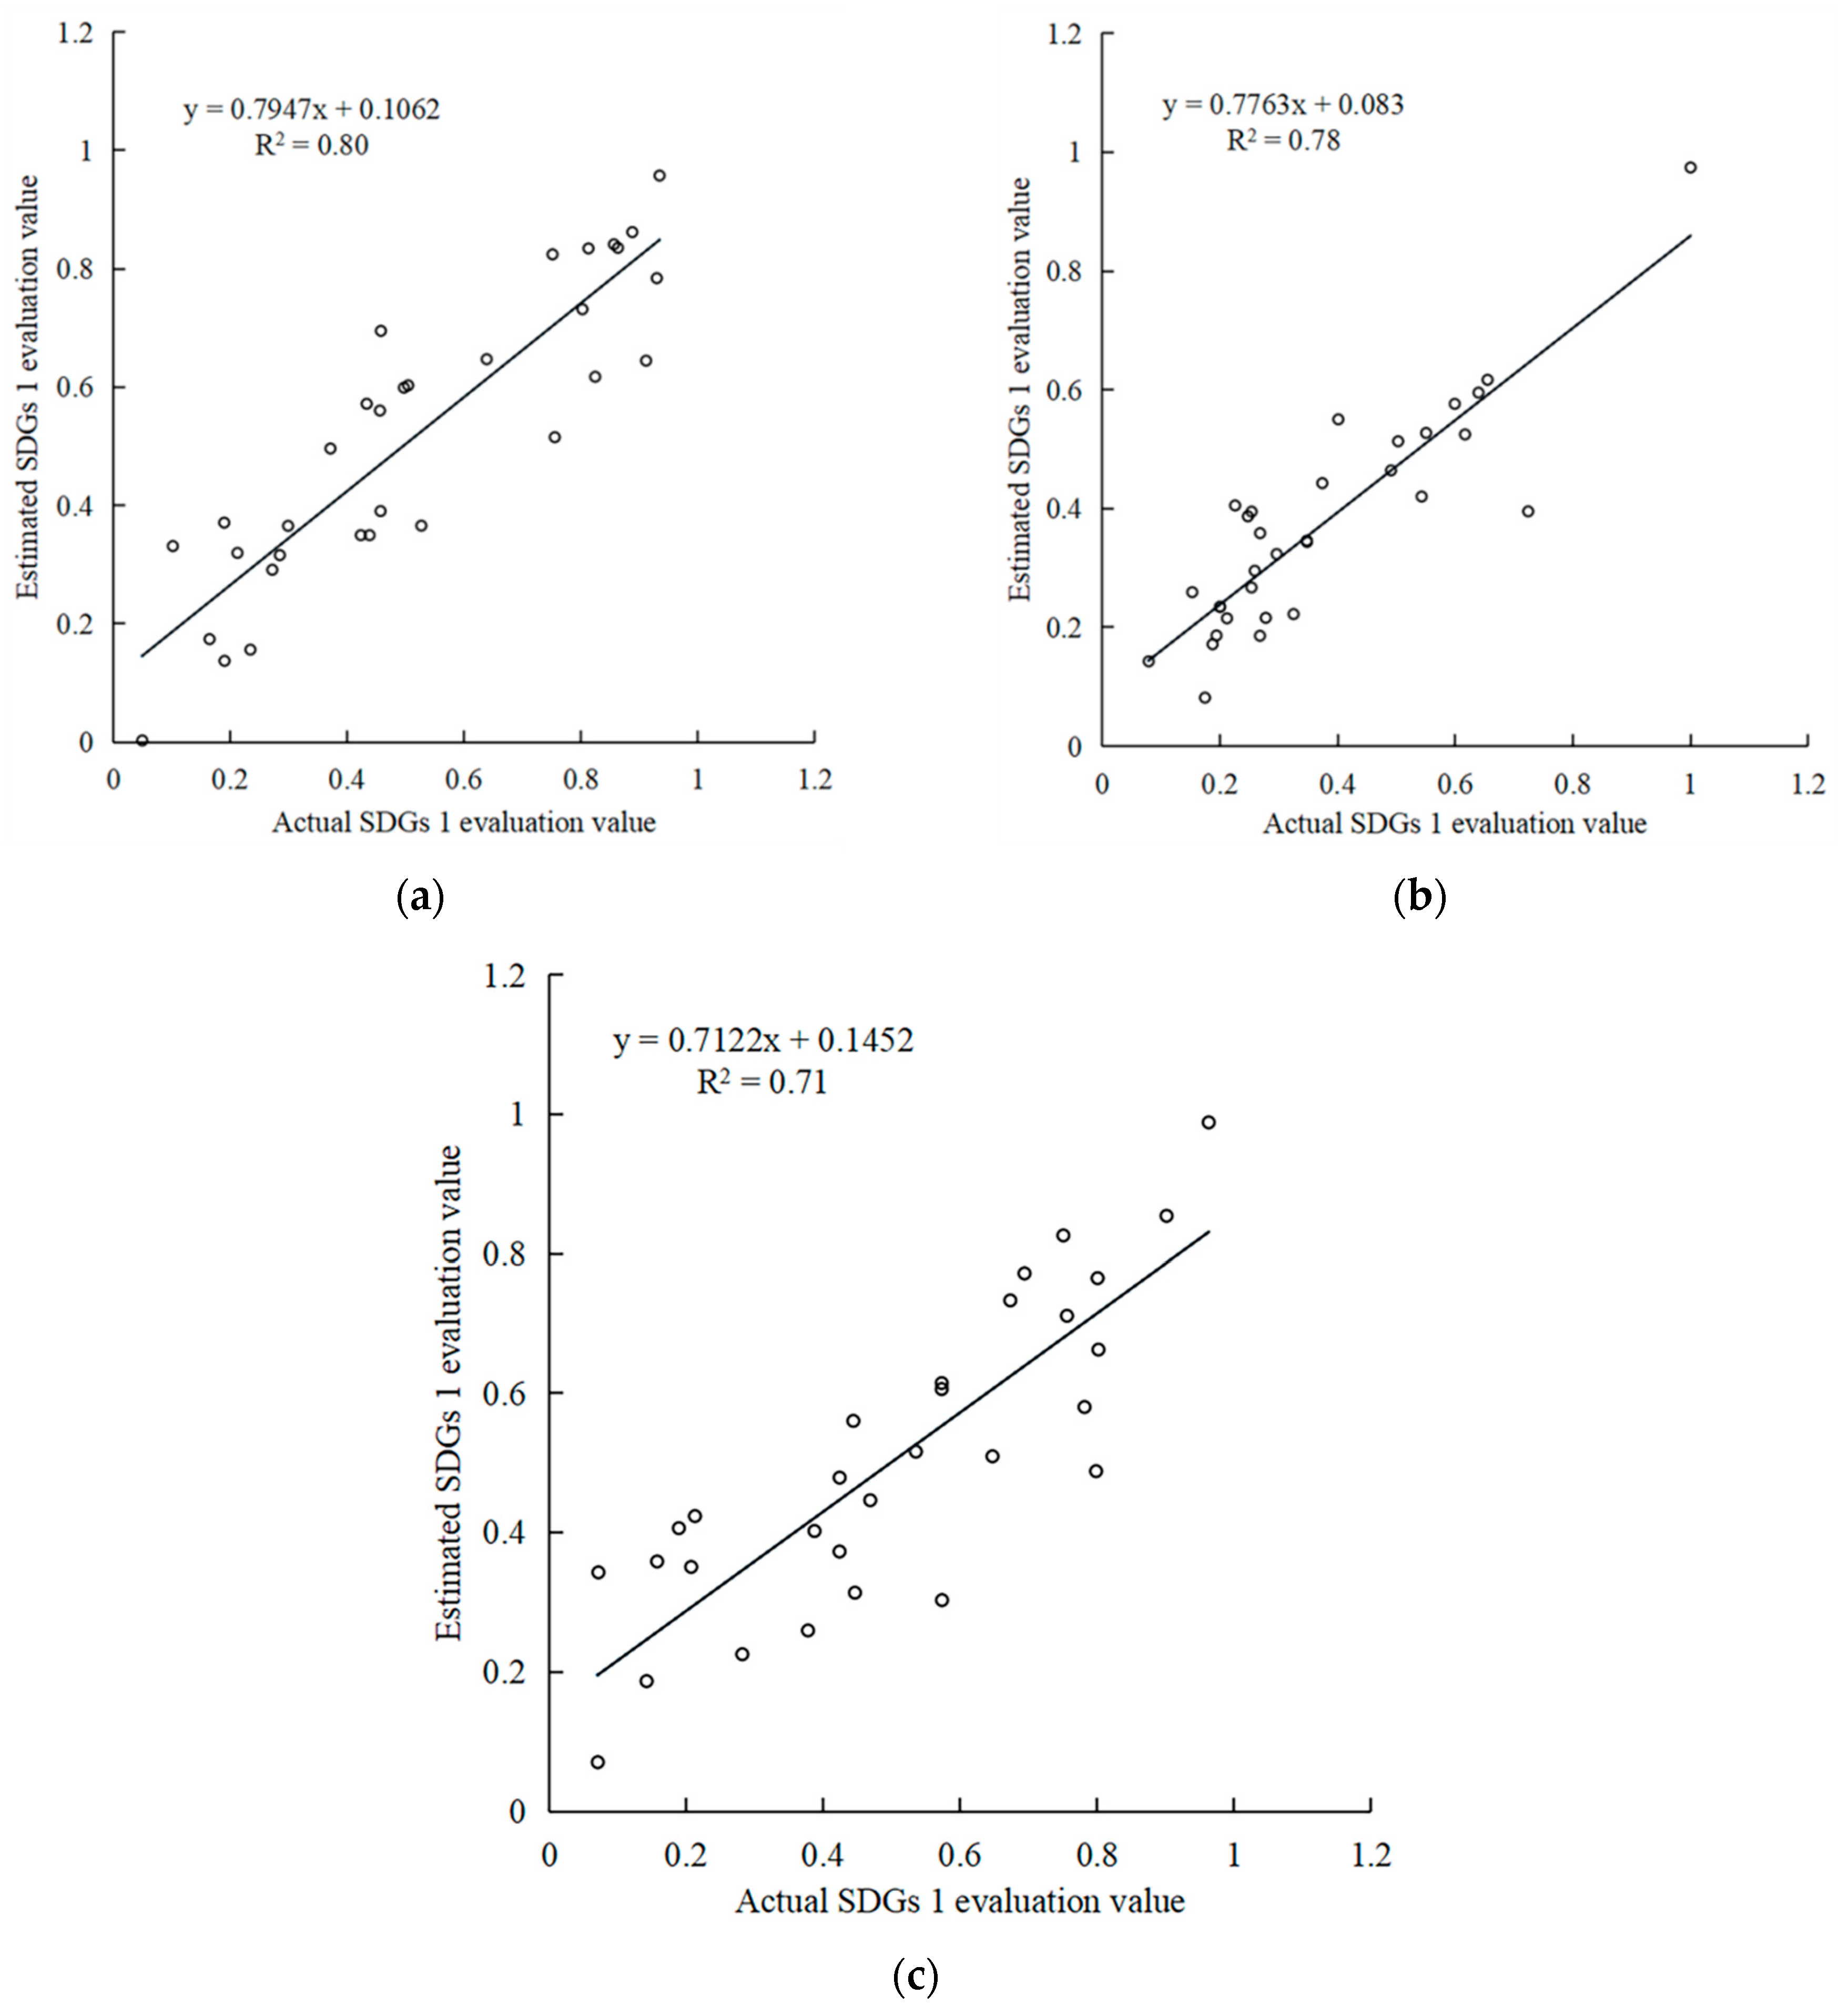
3.1. Results and Accuracy Verification of the Evaluation Model of Localized SDG 1 Indicators in Districts and Counties

This experiment was carried out based on the abovementioned multiple linear regression model and machine learning model. These models were combined with evaluation data for localized SDG 1 indicators in 92 districts and counties in Hunan Province in 2014, 2016 and 2018. The results are shown in Table 5. The estimated results of model I are the best: the goodness of fit R2 is 0.76; the root mean square error (RMSE) is 0.10; and the p value is less than 1%, which passes the 1% significance test.
The Chinese government announced the list of NPCs, among which there were 40 NPCs in Hunan Province in 2014. To evaluate these nine models, the real 40 NPCs and the respective estimated values of SDG 1 in Hunan Province in 2014 are shown in Figure 4. The results show that the lowest value areas of Model I and Model II both include 39 NPCs, the most of real 40 NPCs. The Model I and Model II could achieve more accurate estimation results than other models. Moreover, the lowest value areas of Model I and Model II are 55 and 58 districts and counties, respectively. Therefore, the estimated values of SDG 1 also verify that Model I is the best among these nine models.
Due to the better estimation effect of Model I, Model I was selected to invert the evaluation value of SDG 1 in Hunan Province. The results of Model I are shown in Formula (7).
S D G 1 s = 0.362 + 0.047 V 1 + 0.103 V 2 + 6.382 V 3 + 0.00002 V 4 0.022 V 5 + 0.0001 V 6
Comparing the estimated SDG 1 evaluation values of Model I to the actual SDG 1 evaluation values in 2014, 2016 and 2018 (as shown in Figure 5), the result exhibits a good linear relationship. Model I constructed in this paper achieves high accuracy and can be applied to estimate the SDG 1 evaluation values in Hunan Province.
To test the reliability and generalizability of evaluation Model I for localized SDG 1 indicators for the selected districts and counties, the actual value and characteristic factor data of the localized SDG 1 evaluation of 20 districts and counties were employed to verify the model, and the average relative error was utilized to reflect the accuracy of the model. The relative error is calculated by Formula (8):
A R E = ( i = 1 20 | ( S D G s 1 r S D G s 1 s ) × 100 % | S D G s 1 r ) ÷ 20
In Formula (8), ARE is the average relative error, S D G s 1 r is the actual evaluation value of the localized SDG 1 based on the localized index system and statistical data of districts and counties, and S D G s 1 s is the estimated evaluation value of the localized SDG 1 estimated by Model I.
The results show that the average relative error of evaluation Model I for the localized SDG 1 indicators is 19.12%, and the model has high estimation accuracy; therefore, it can be used to estimate localized SDG 1 evaluation values for Hunan Province in 2014, 2016 and 2018.

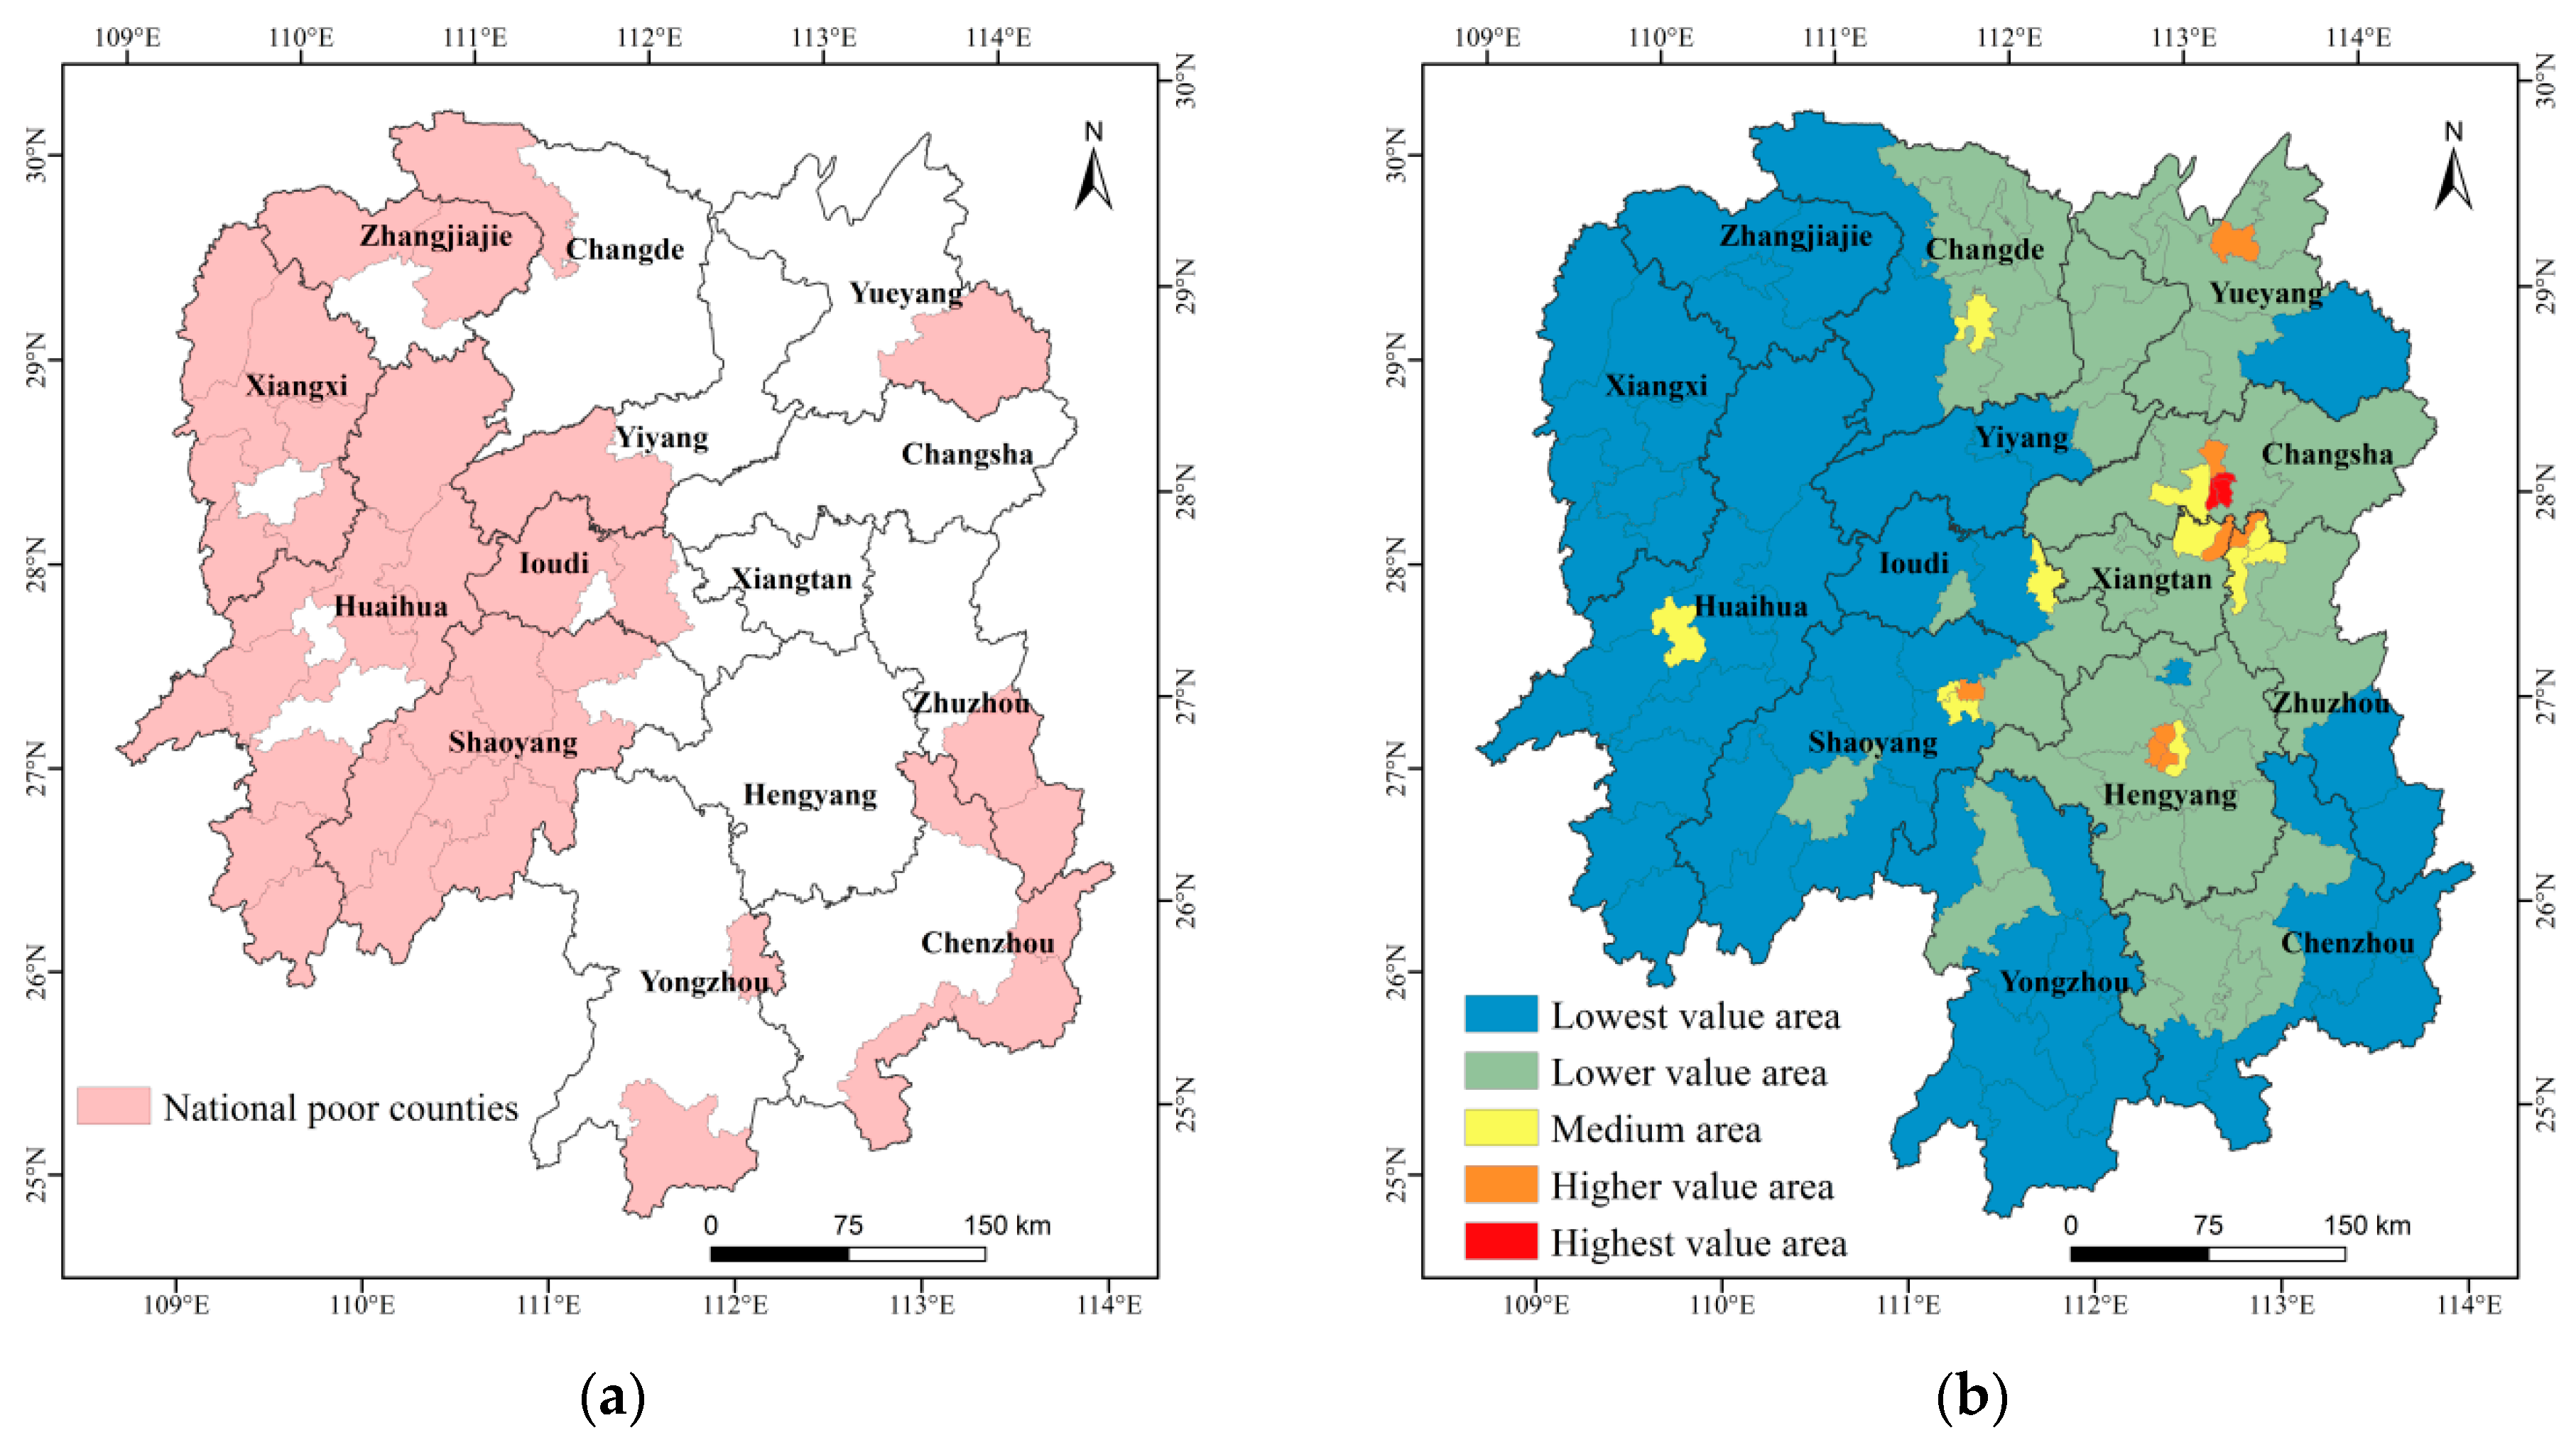
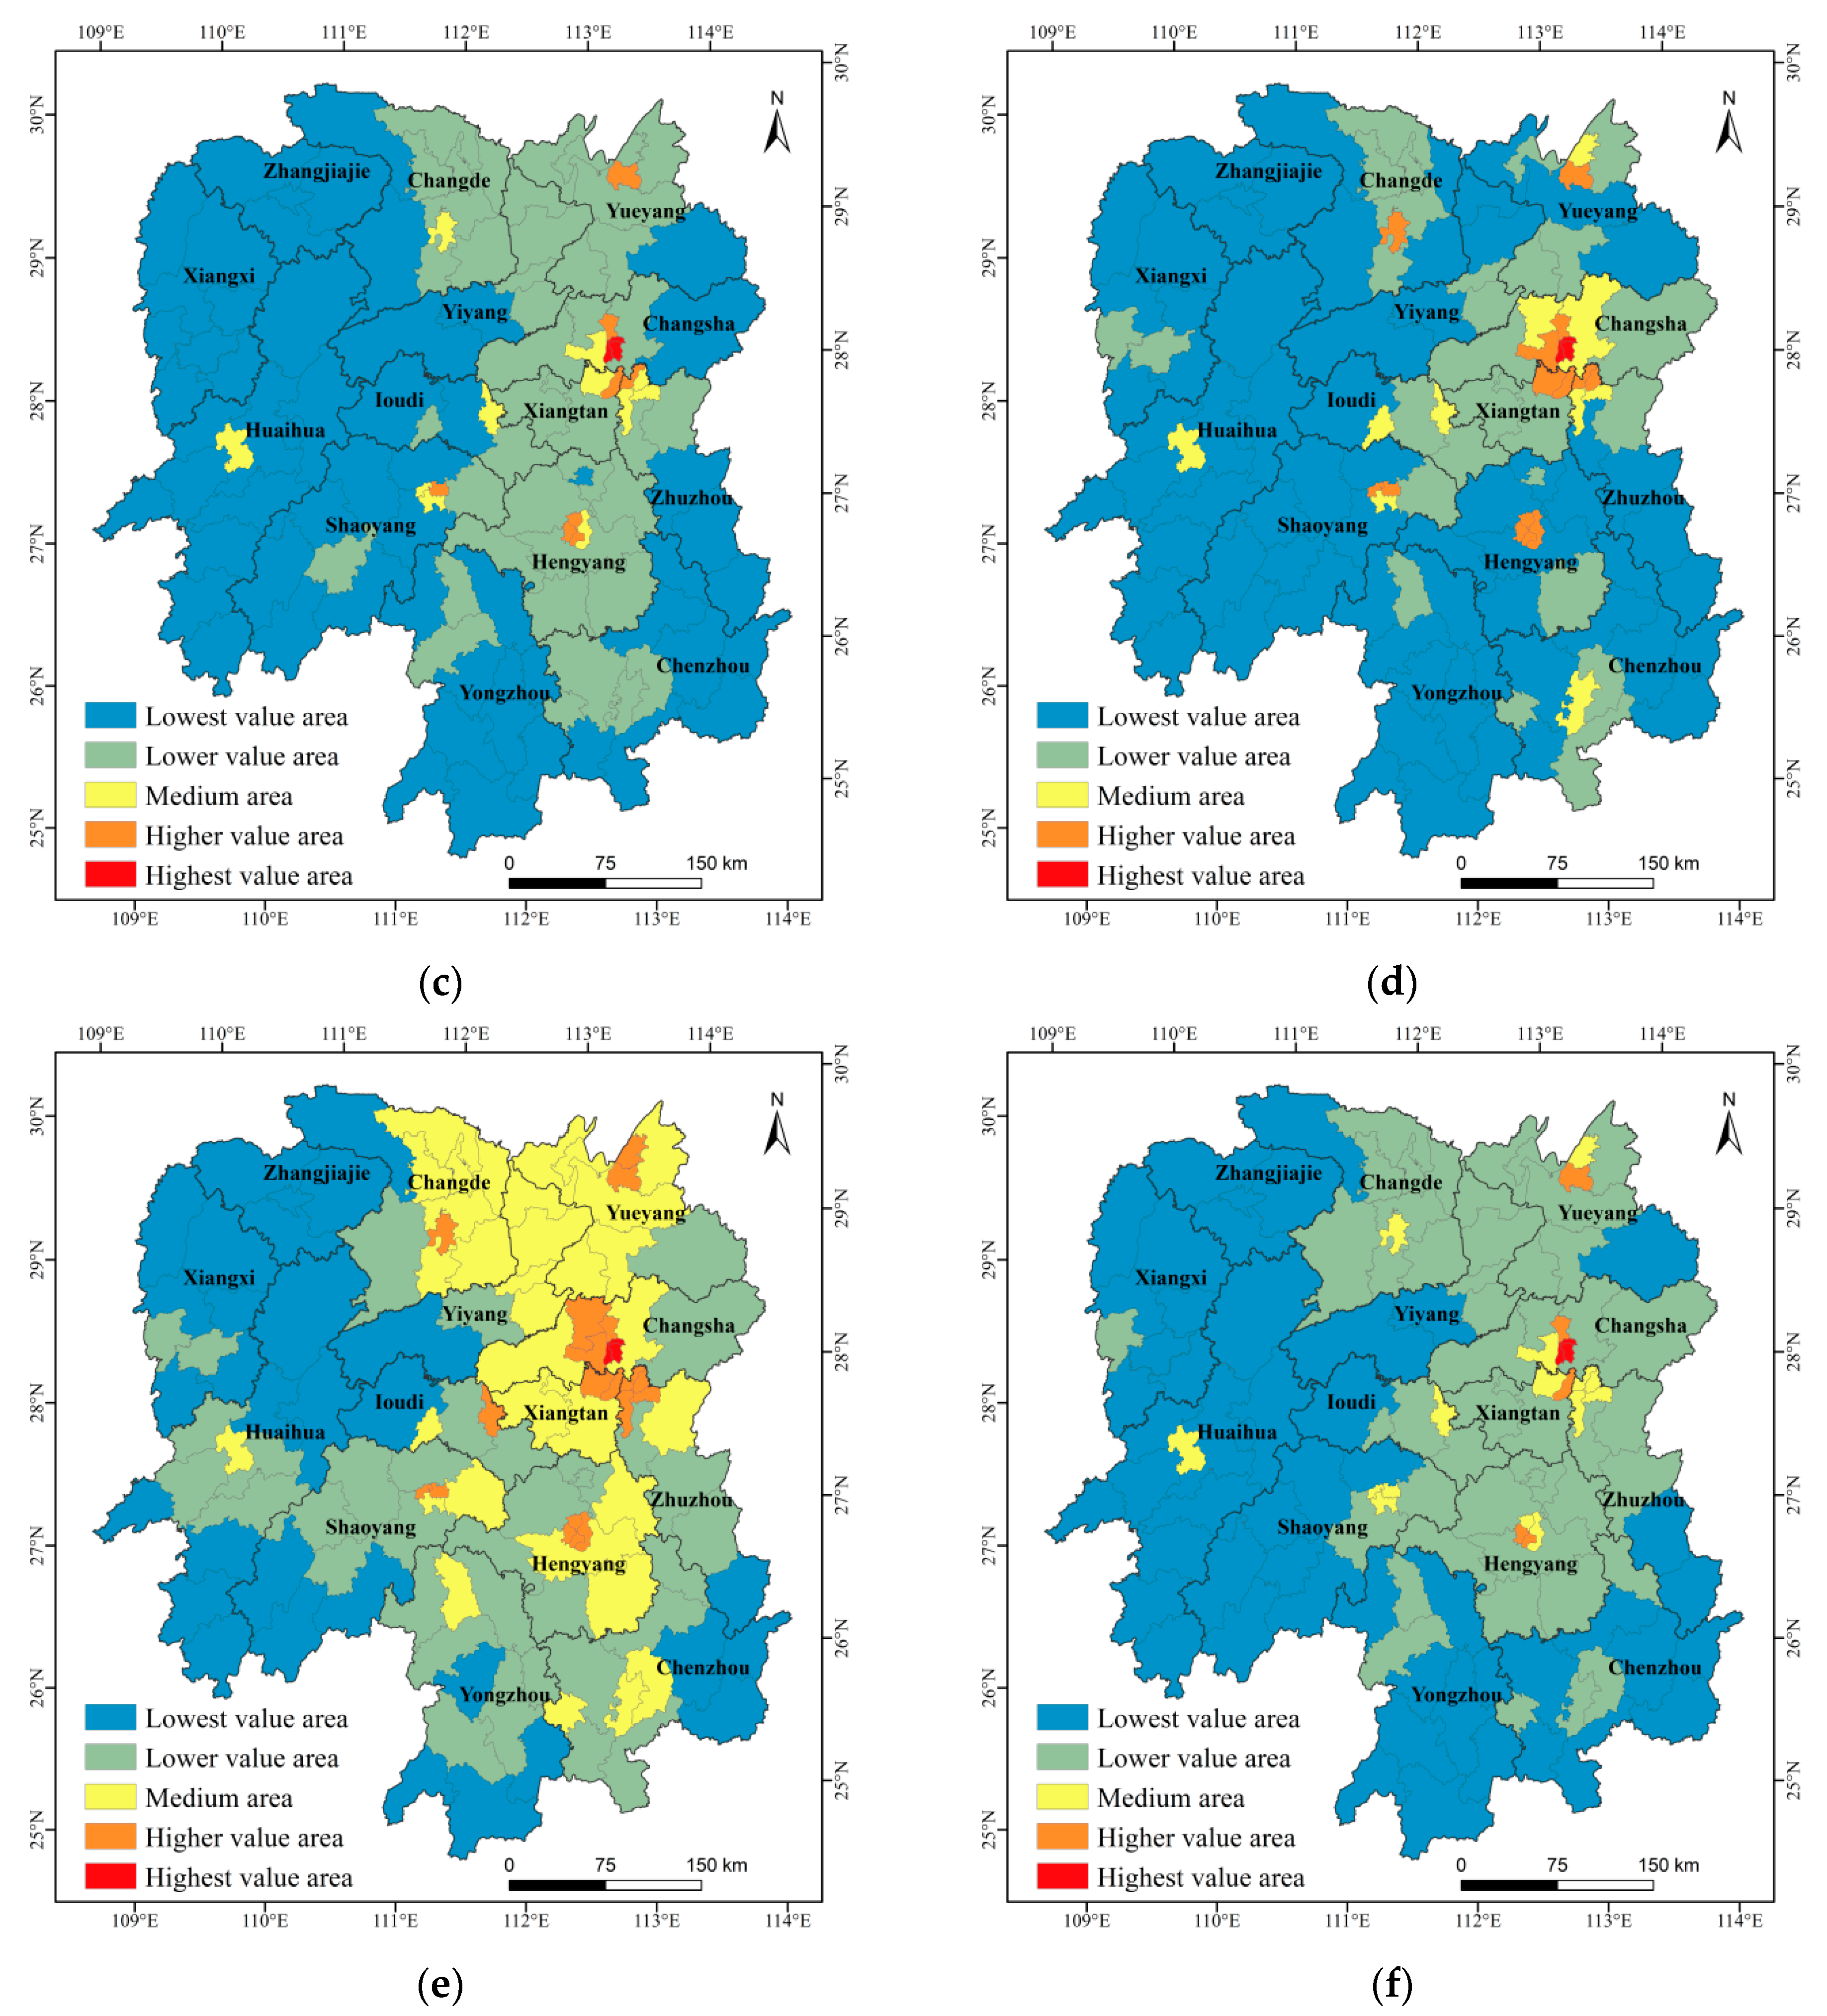
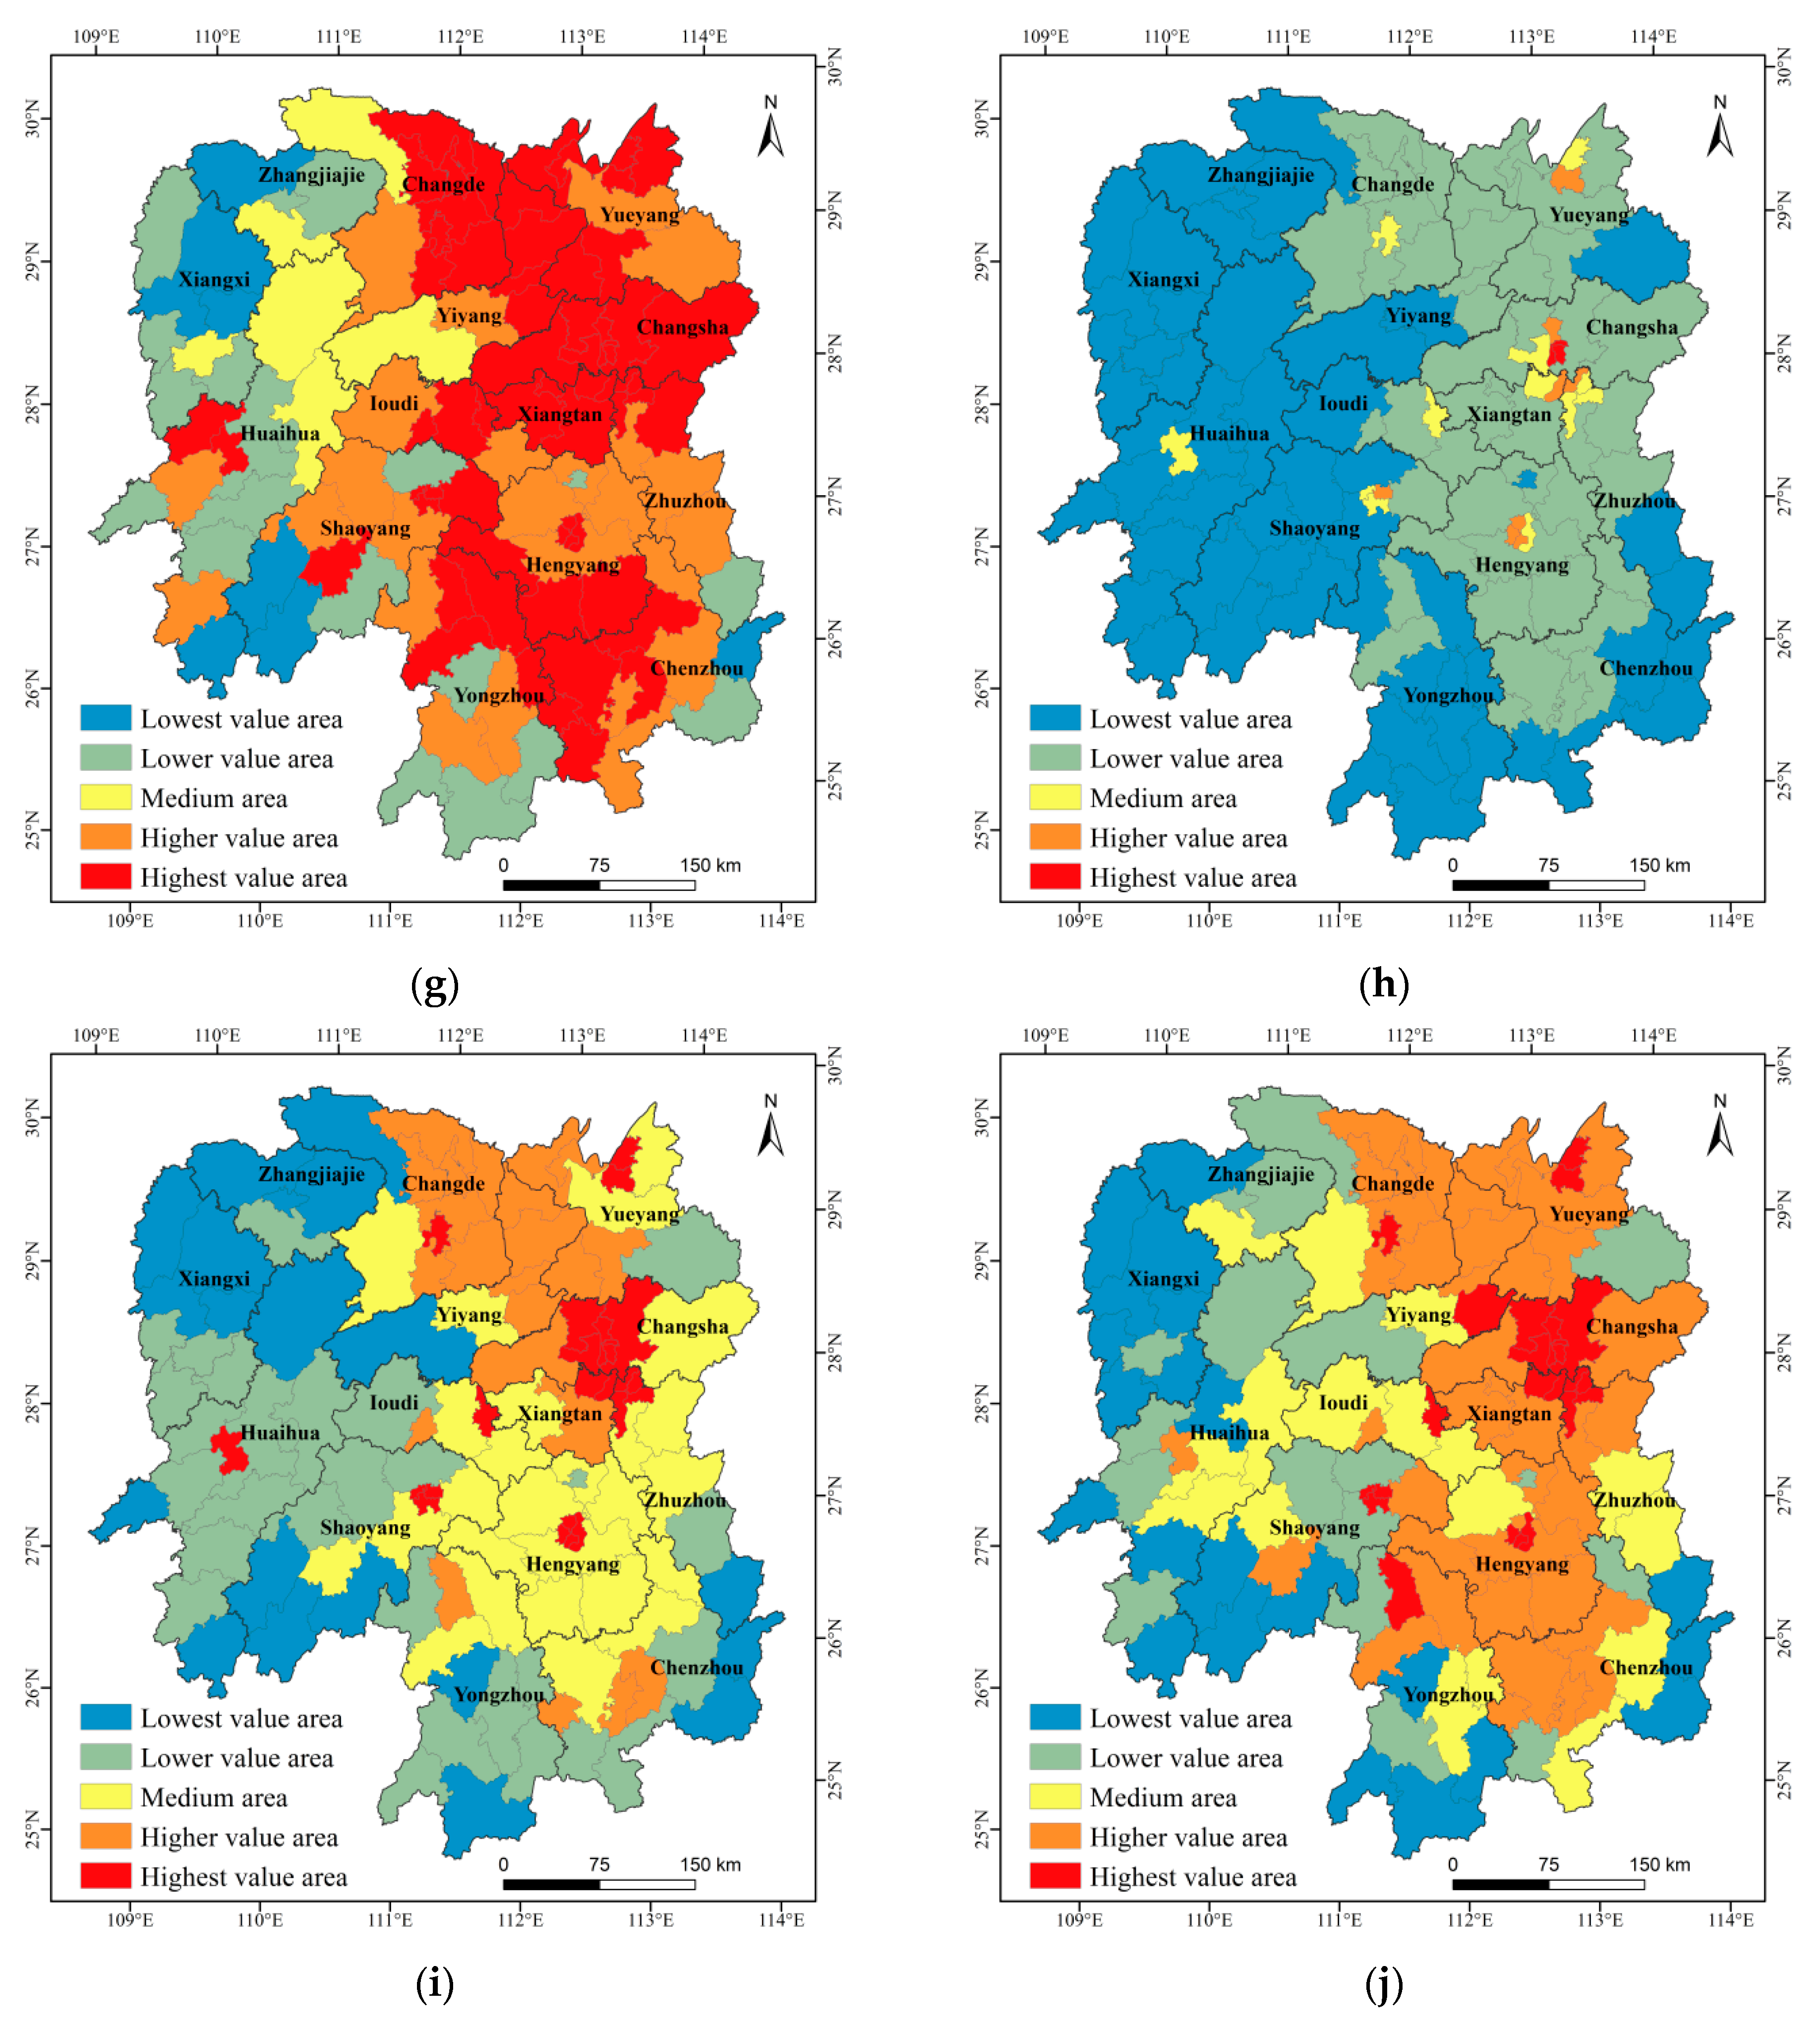
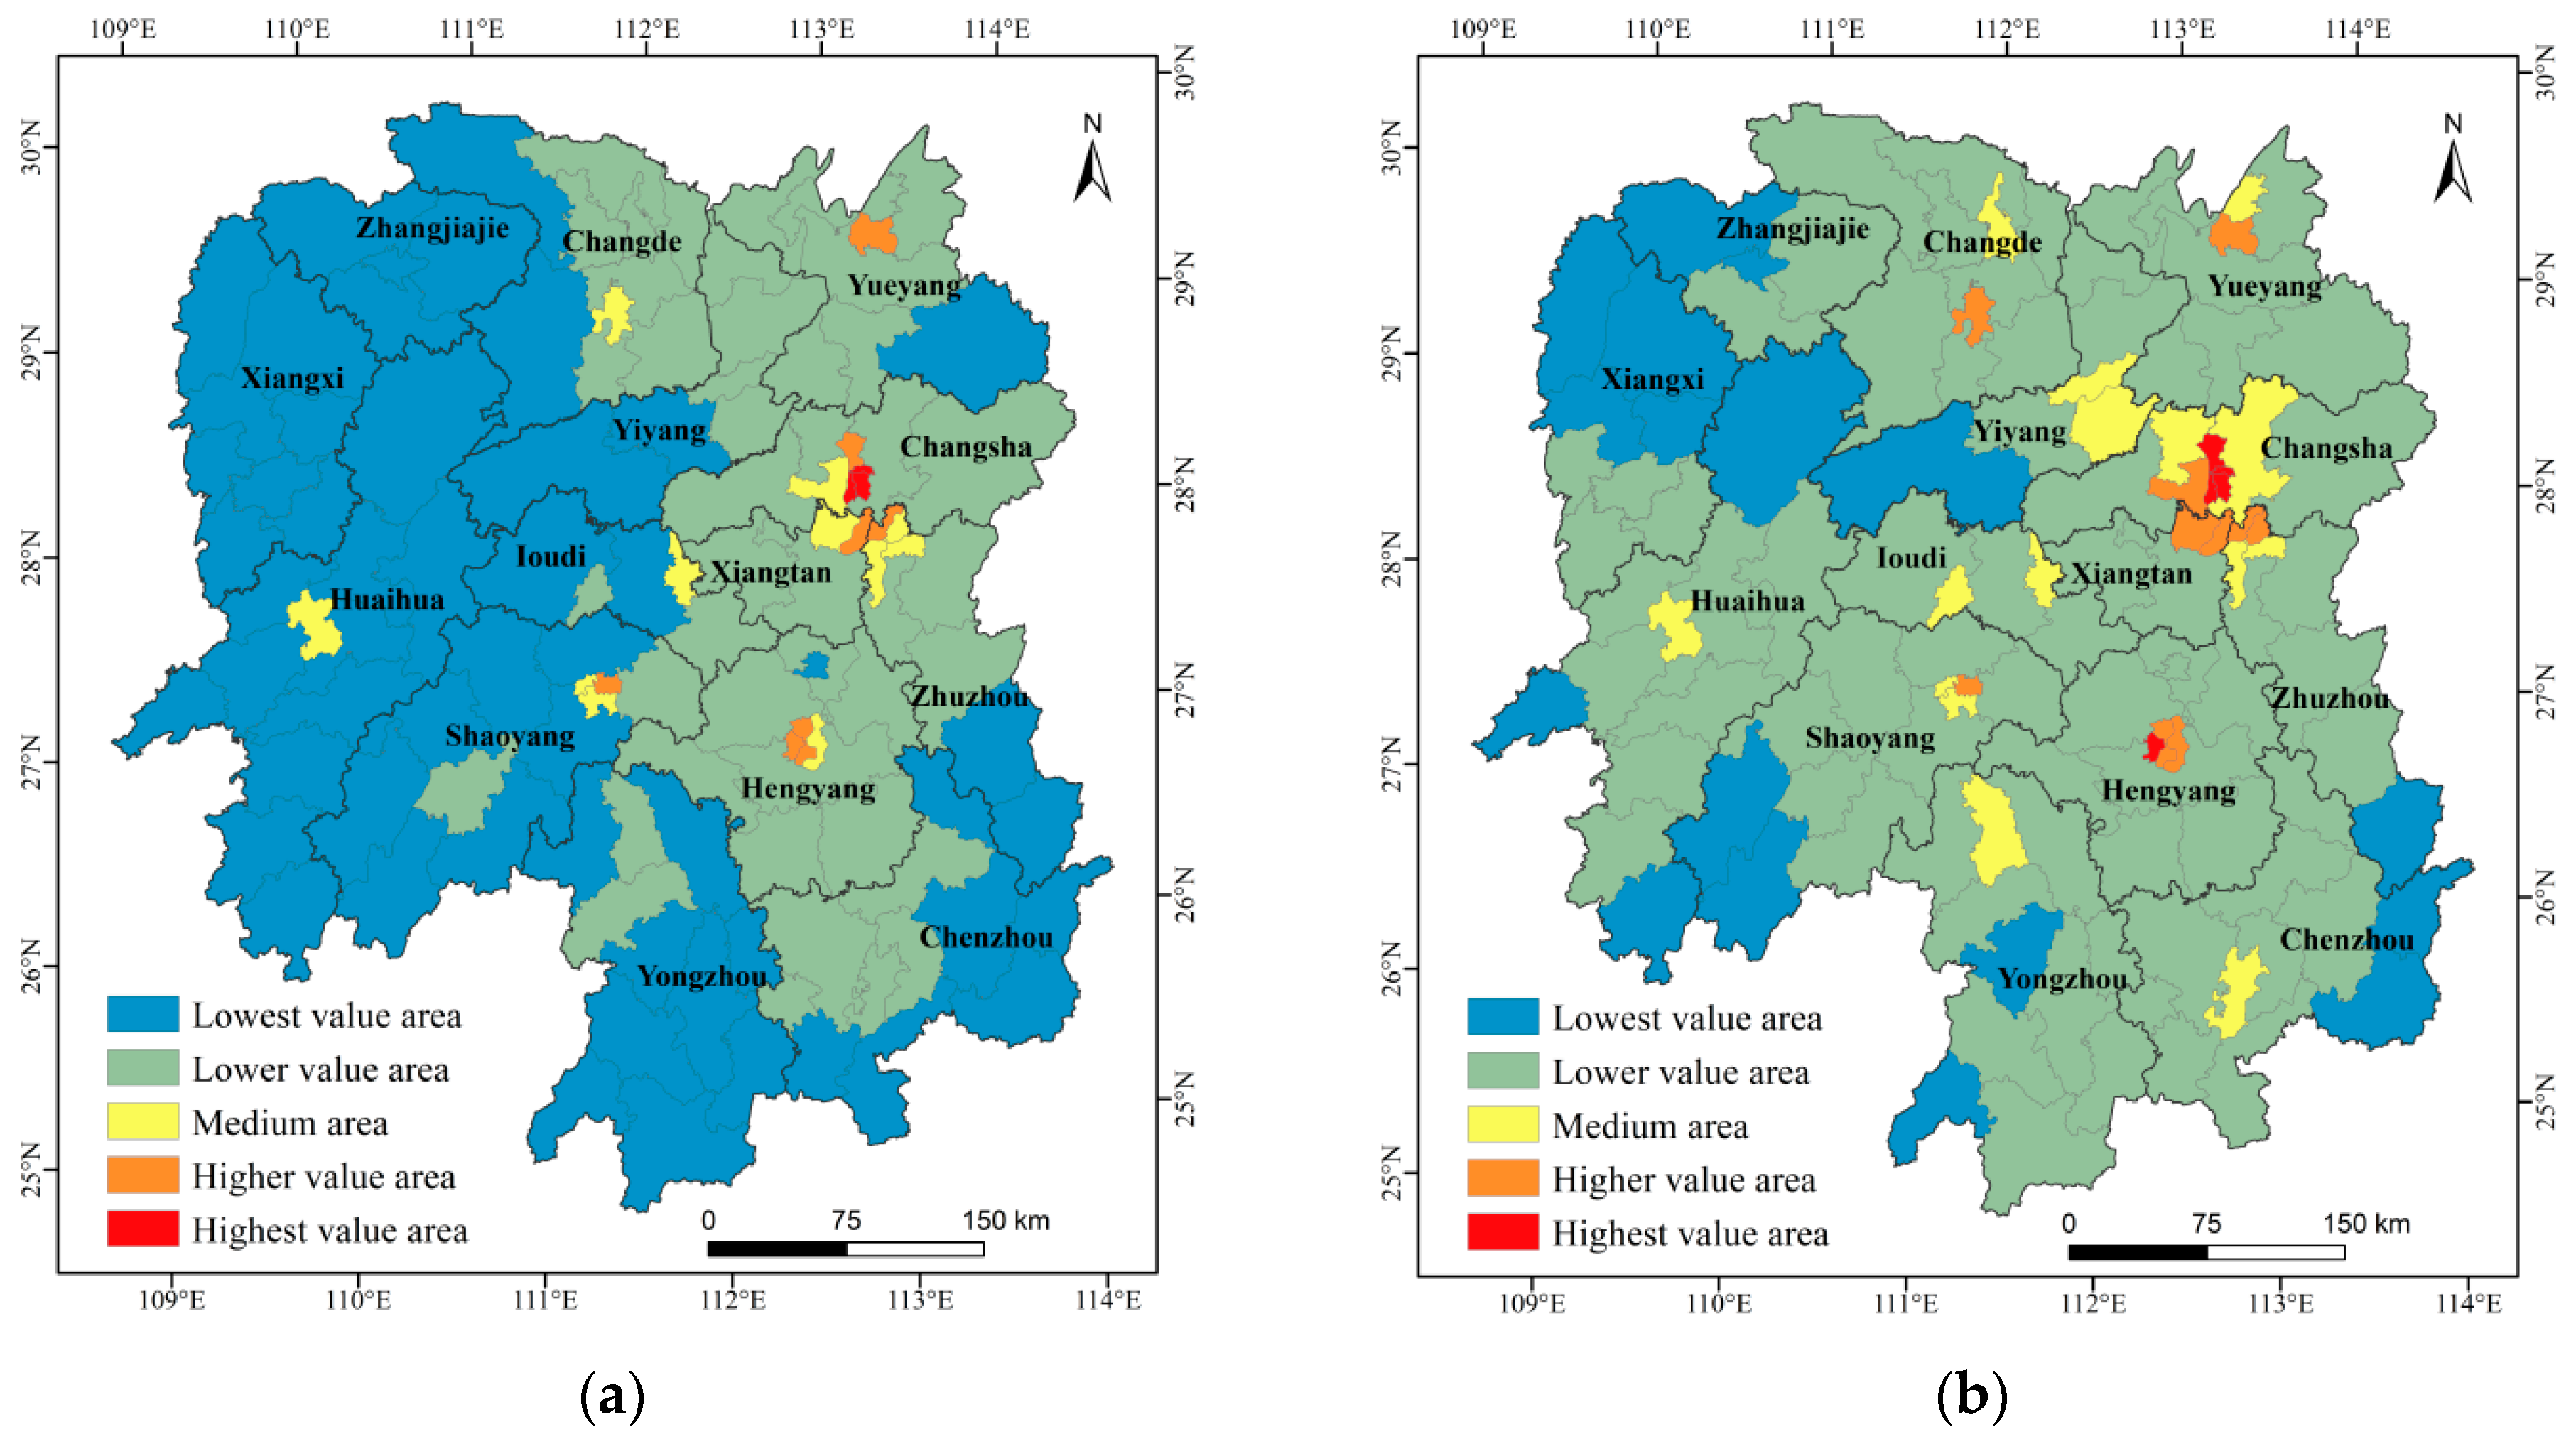
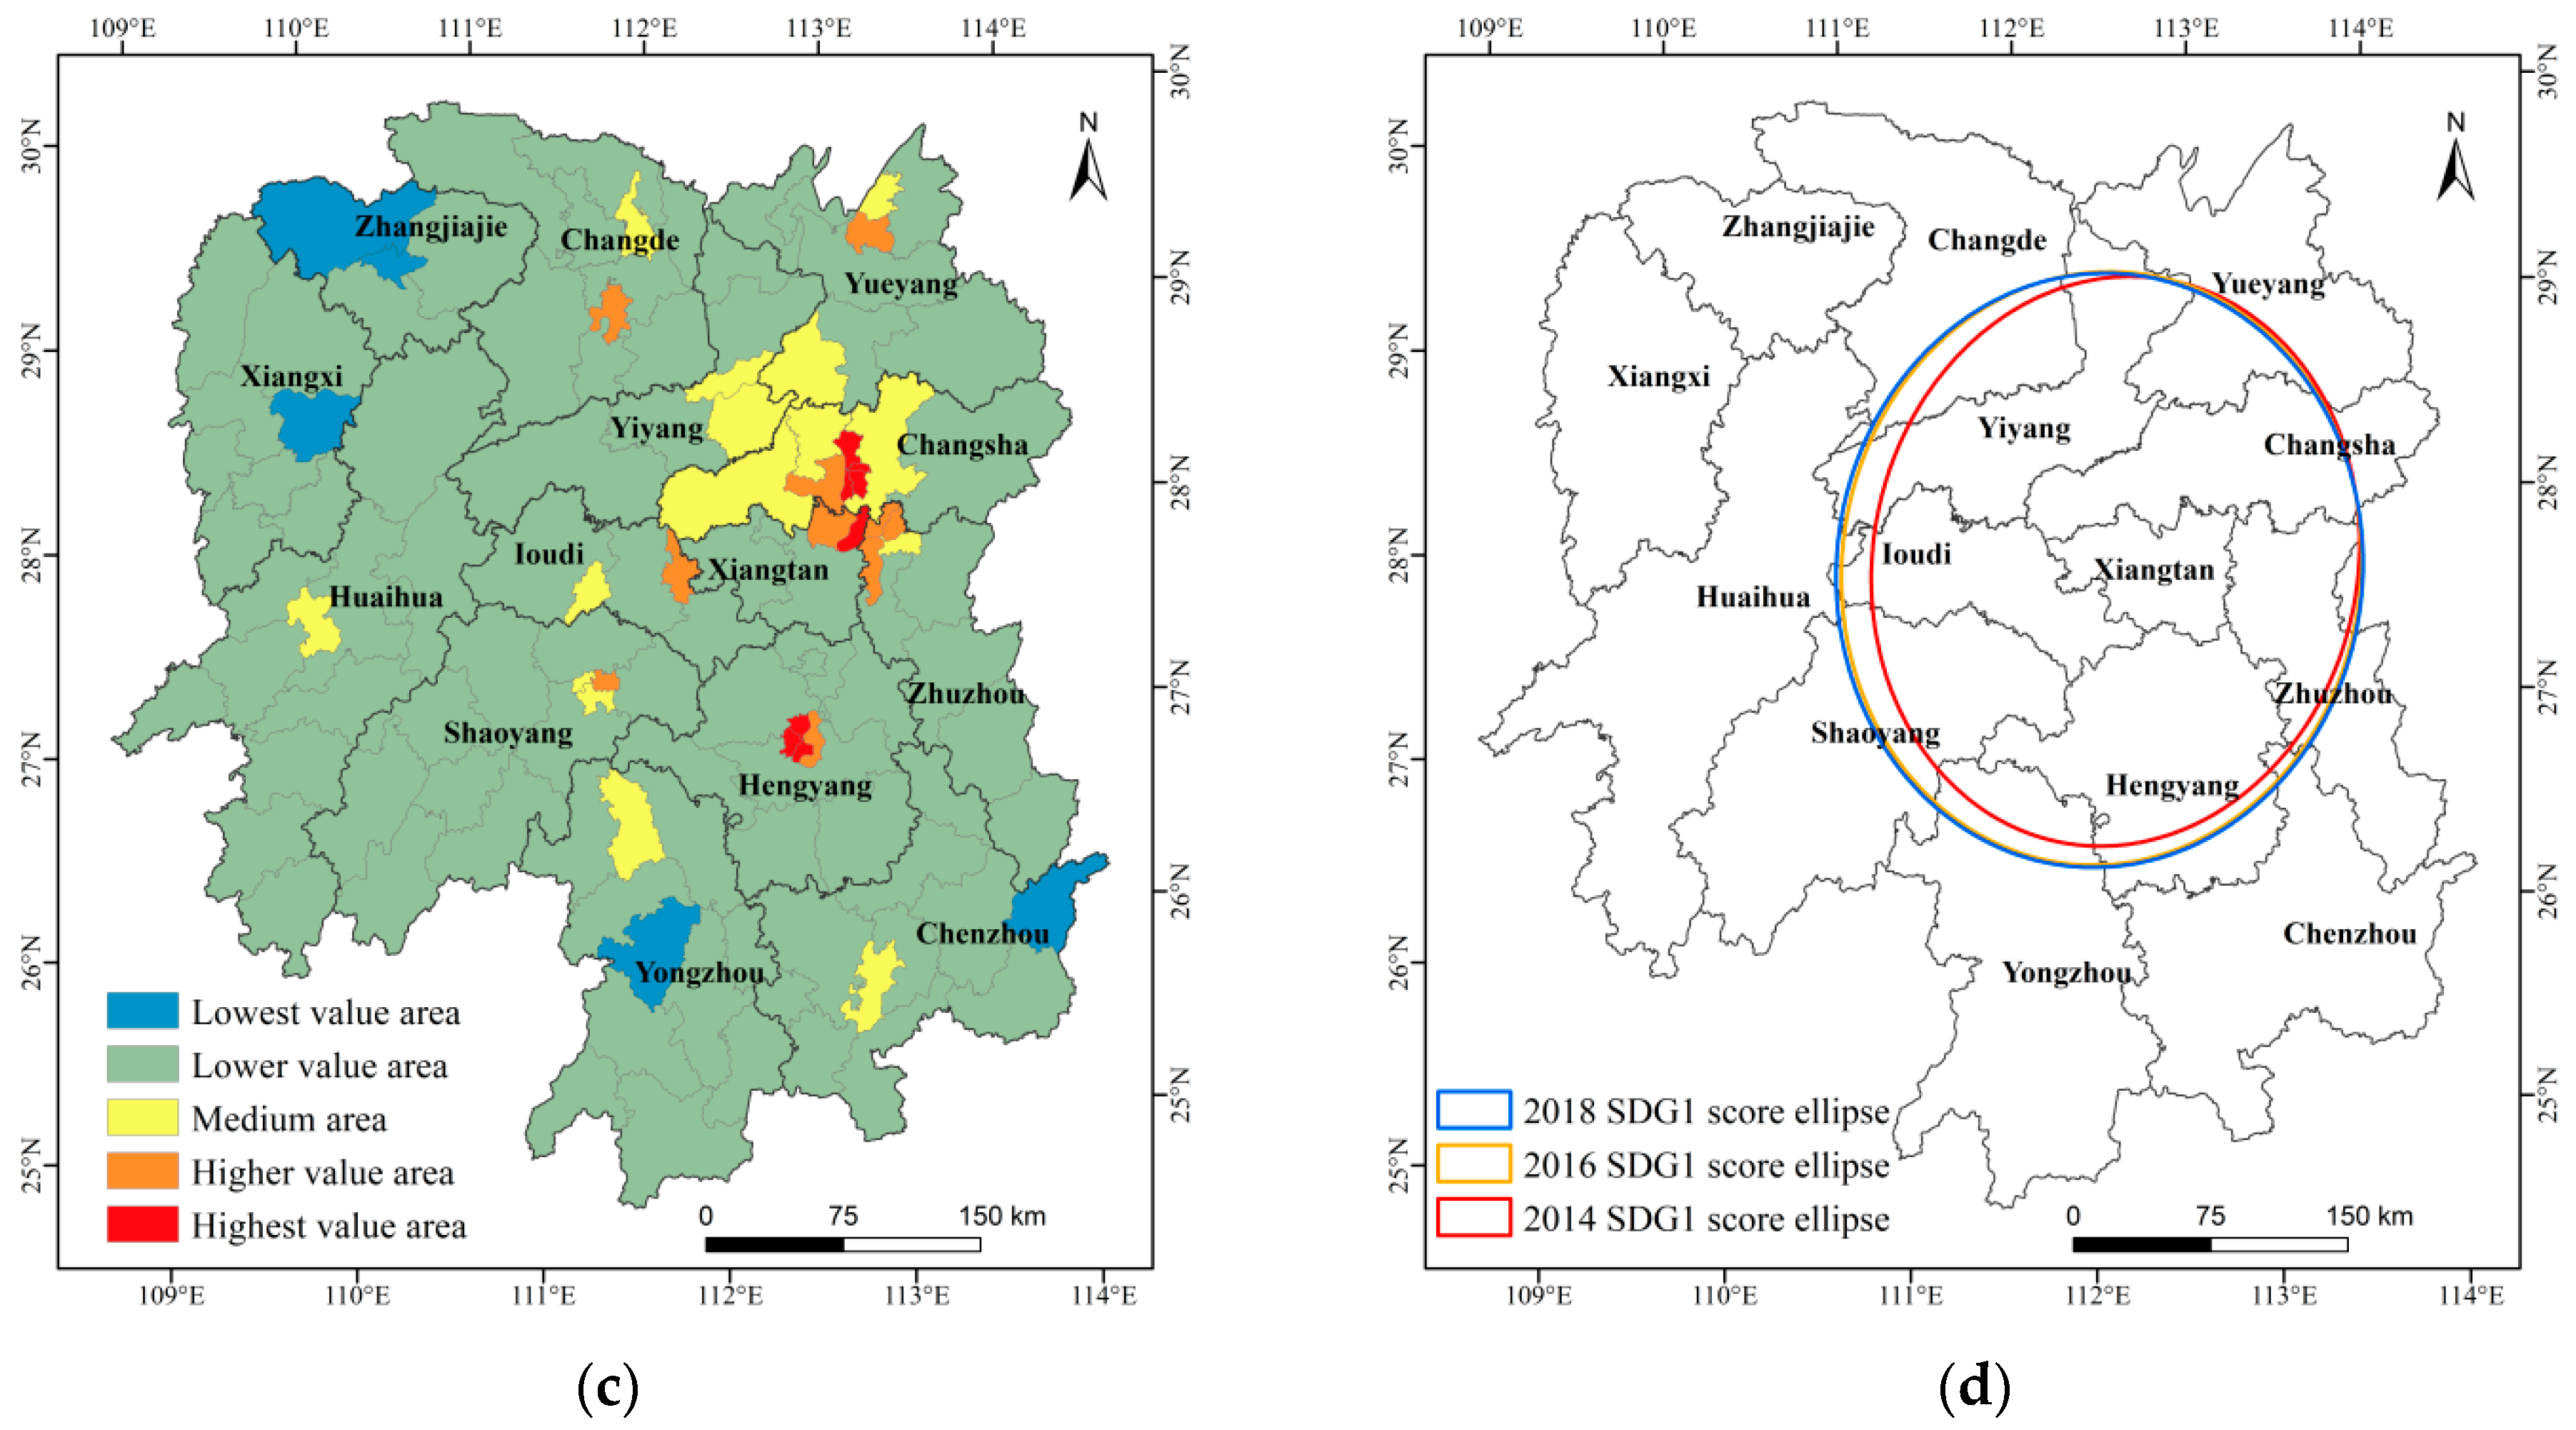
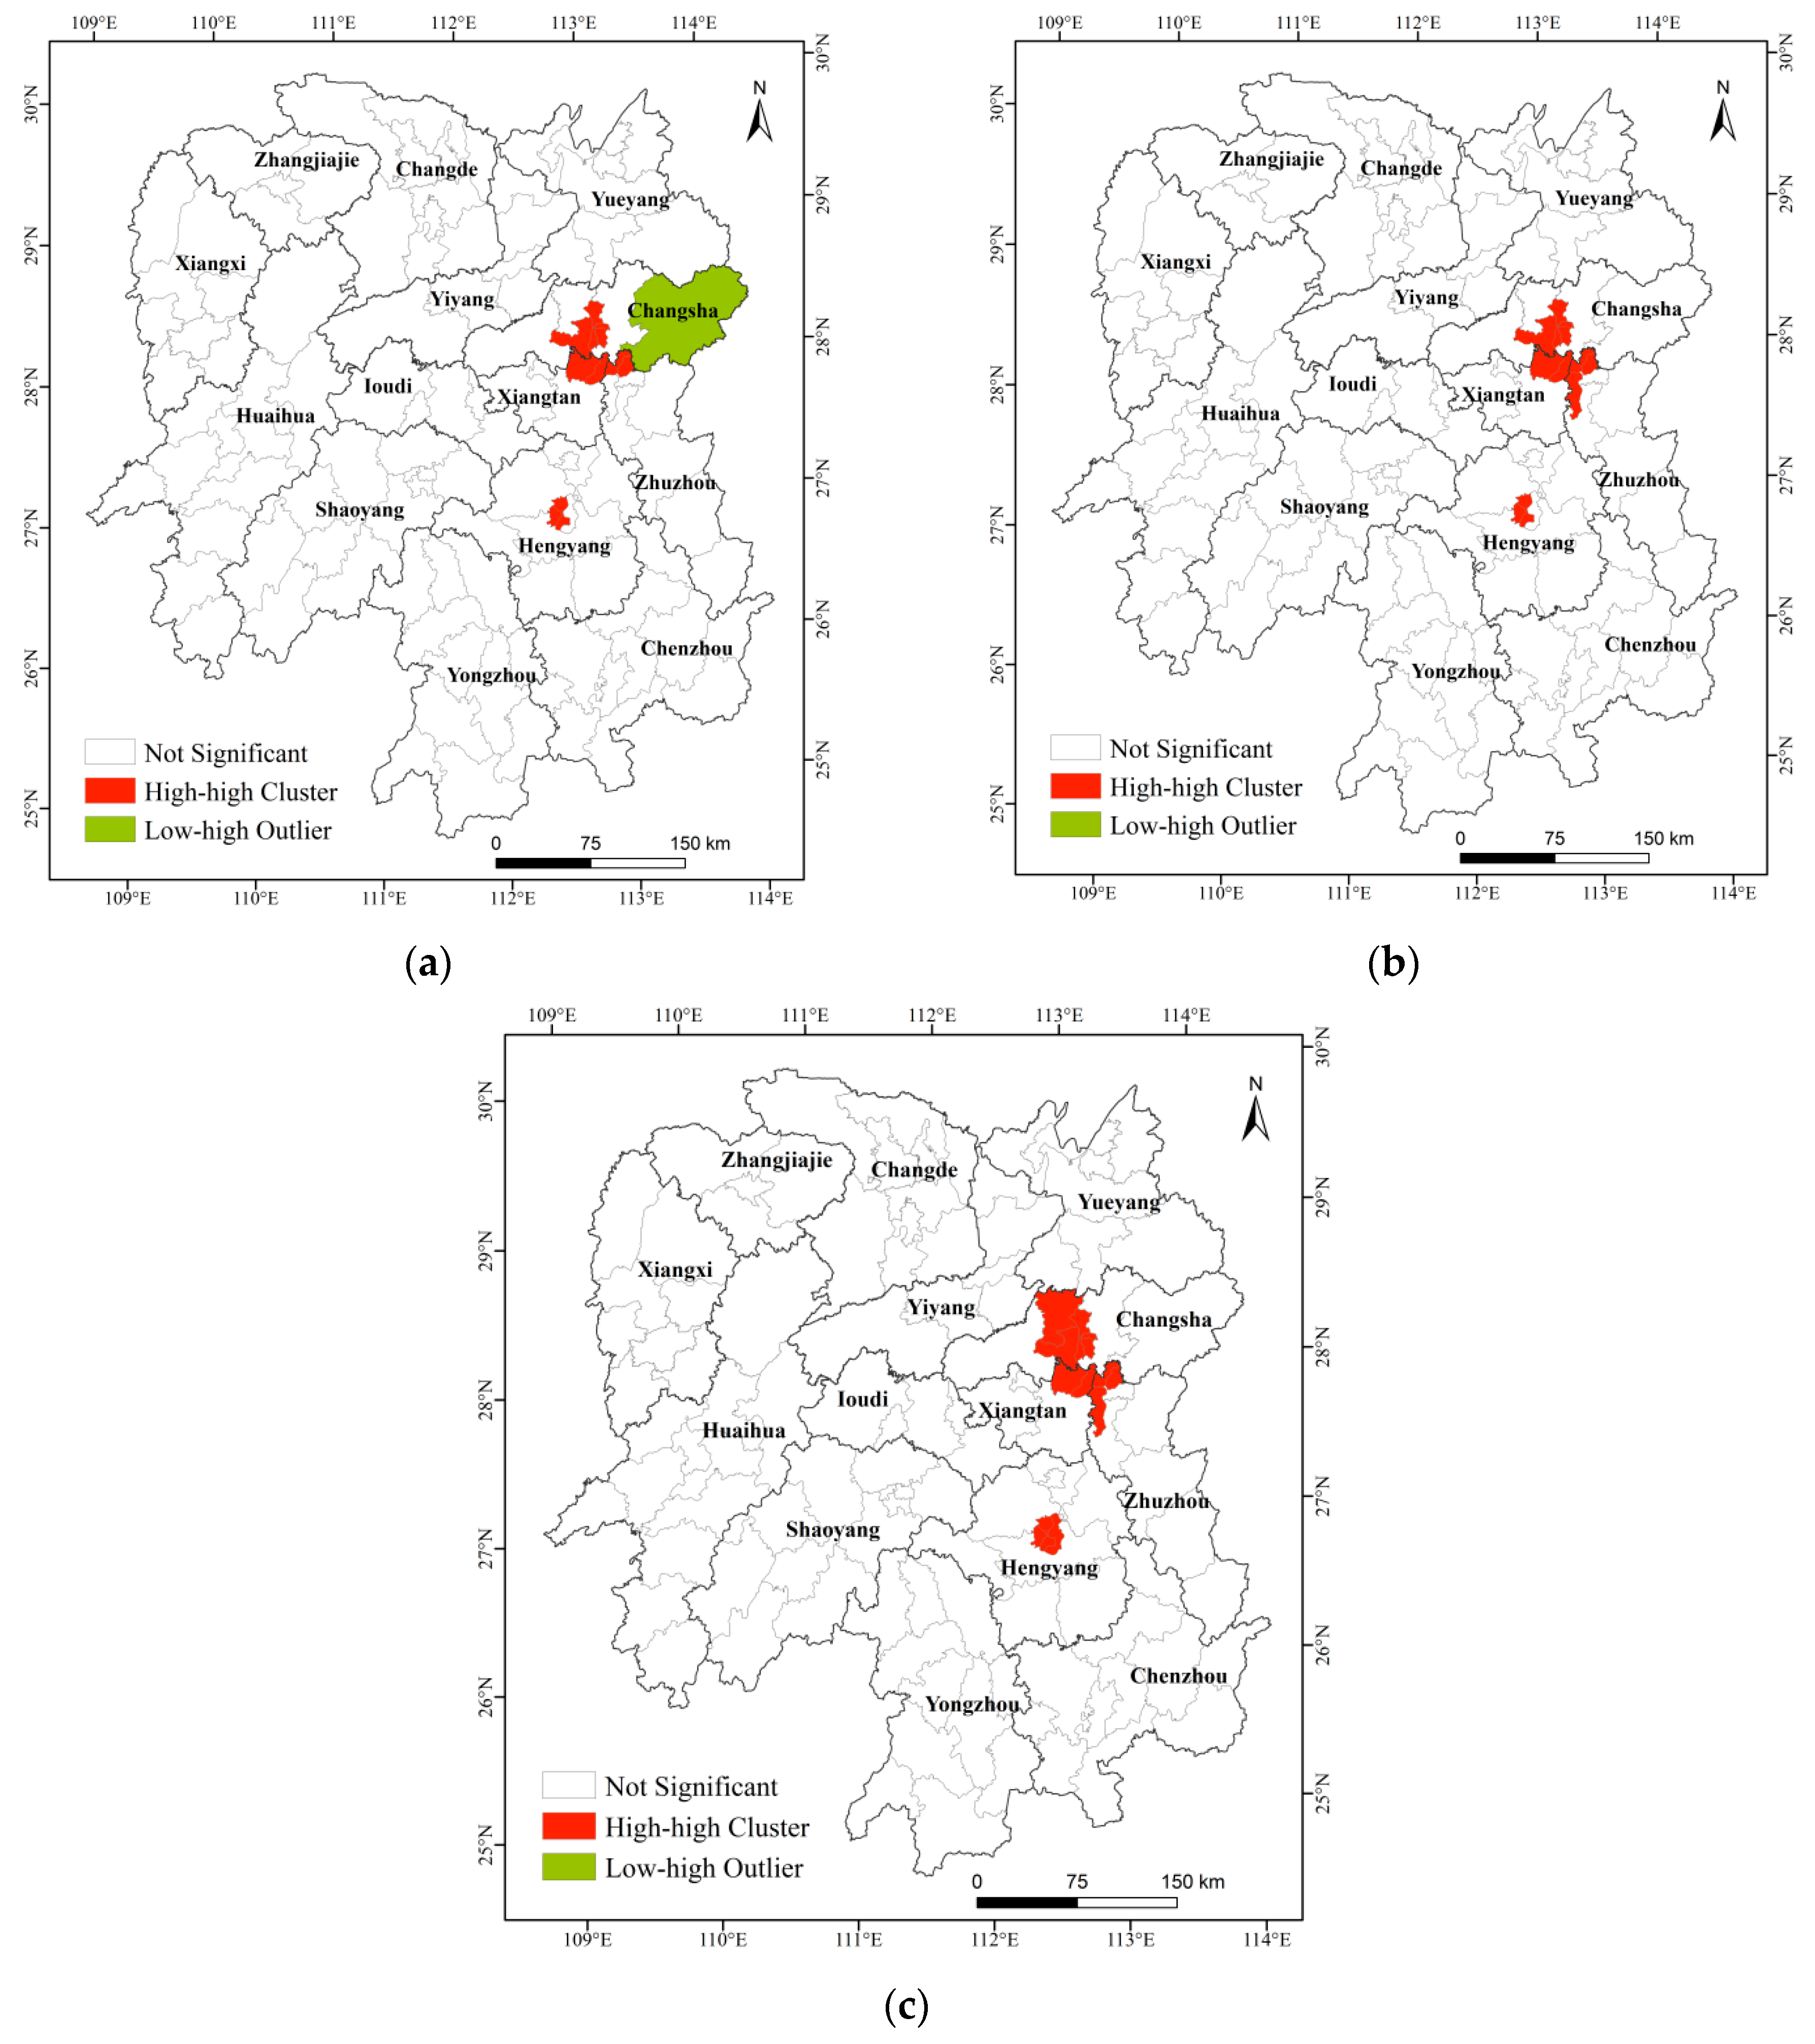
3.2. Spatial Distribution Pattern of Localized SDG 1 Evaluation Values in Districts and Counties

Based on evaluation Model 1 of the localized SDG 1 indicators and combined with the characteristic factor data of the selected districts and counties of Hunan Province, the evaluation values of the localized SDG 1 indicators of the districts and counties in Hunan Province in 2014, 2016 and 2018 are obtained. The lower the value is, the more severe the poverty problem in a district or county. Using the natural discontinuity point classification method, the districts and counties in Hunan Province are divided into five levels: highest-value area, higher-value area, medium-value area, lower-value area, and lowest-value area. These classifications are shown in a spatial distribution map, where the colors indicate the classes (Figure 6). The results show that the SDG 1 scores of Hunan Province in 2014, 2016 and 2018 have obvious differences in temporal and spatial distribution. Hunan Province has 3, 5 and 8 high-value areas in 2014, 2016 and 2018, respectively. The high-value areas in 2014 and 2016 were mainly located in Changsha, which is the capital of Hunan Province, and the high-value areas in 2018 were mainly located in the Chang Zhu Tan urban agglomeration and Hengyang city. In 2014, 2016 and 2018, Hunan Province had 8, 11 and 10 high-value districts, respectively, and the high-value districts of Hunan Province in these three years were also mainly distributed in the Chang Zhu Tan urban agglomeration and Hengyang. In 2014, 2016 and 2018, Hunan Province had 10, 15 and 15 median areas, respectively. Except for a few median areas concentrated in the Chang Zhu Tan urban agglomeration, the remainder were scattered. In 2014, 2016 and 2018, Hunan Province had 46, 74, and 84 lower value areas, respectively. In 2014, these areas were mainly distributed in the northeastern region of Hunan Province. In 2016 and 2018, these areas became the most important regions in Hunan Province. Hunan Province had 55, 17 and 5 low-value areas in 2014, 2016 and 2018, respectively. The low-value areas in 2014 were mainly distributed in the northwest and southeast regions of Hunan Province. In 2016, the low-value areas in Hunan Province decreased sharply. The distribution is relatively scattered, and the low-value areas in 2018 are further reduced, distributed in only four cities in Hunan Province.
The average SDG 1 scores of Hunan Province in 2014, 2016, and 2018 were 0.72, 0.92, and 1.04, respectively. The most important change was that low-value areas were transformed into high-value areas, indicating that the poverty problem in Hunan Province from 2014 to 2018 was resolved to a certain extent. The first-level standard deviation ellipse analysis was performed within the SDG 1 evaluation values in 2014, 2016 and 2018, and the number of districts and counties within the first-level standard deviation ellipse accounted for approximately 68% of the total. The results showed that the ellipses of these three years were not very different, indicating that the spatial distribution of the high-value districts and counties in Hunan Province had not substantially changed. Although the poverty problem in Hunan Province was alleviated, the subsequent development of the region still needs further effort.
The global spatial autocorrelation analysis shows that the global Moran’s I of the localized SDG 1 evaluation data for Hunan Province in 2014, 2016 and 2018 are 0.54, 0.56 and 0.56, respectively; that the Z score is greater than 2.56; and that the p value is 0.00. The results allow the original hypothesis to be rejected at a significance level of 1% and show that there is a spatial clustering effect in the localized evaluation value of SDG 1 in Hunan Province in 2014, 2016 and 2018.
A local spatial autocorrelation analysis of the localized SDG 1 evaluation values of the districts and counties in Hunan Province was carried out on the basis of the global autocorrelation analysis. The results (Figure 7) showed that in 2014, 2016 and 2018, Hunan Province mainly had high-high aggregation types, among which the numbers of high-high aggregation districts and counties were 11, 12, and 14, respectively, indicating that the aggregation effect of global autocorrelation was mainly caused by high-value aggregation. The spatial distribution of high-high-gathering areas in these three years is similar to that of high-value areas and high-value areas. These areas are mainly distributed in the Chang Zhu Tan urban agglomeration and Hengyang city. This distribution phenomenon corresponds to the level of social and economic development. There were no significant spatial aggregations or discrete spatial patterns in the remaining districts and counties.

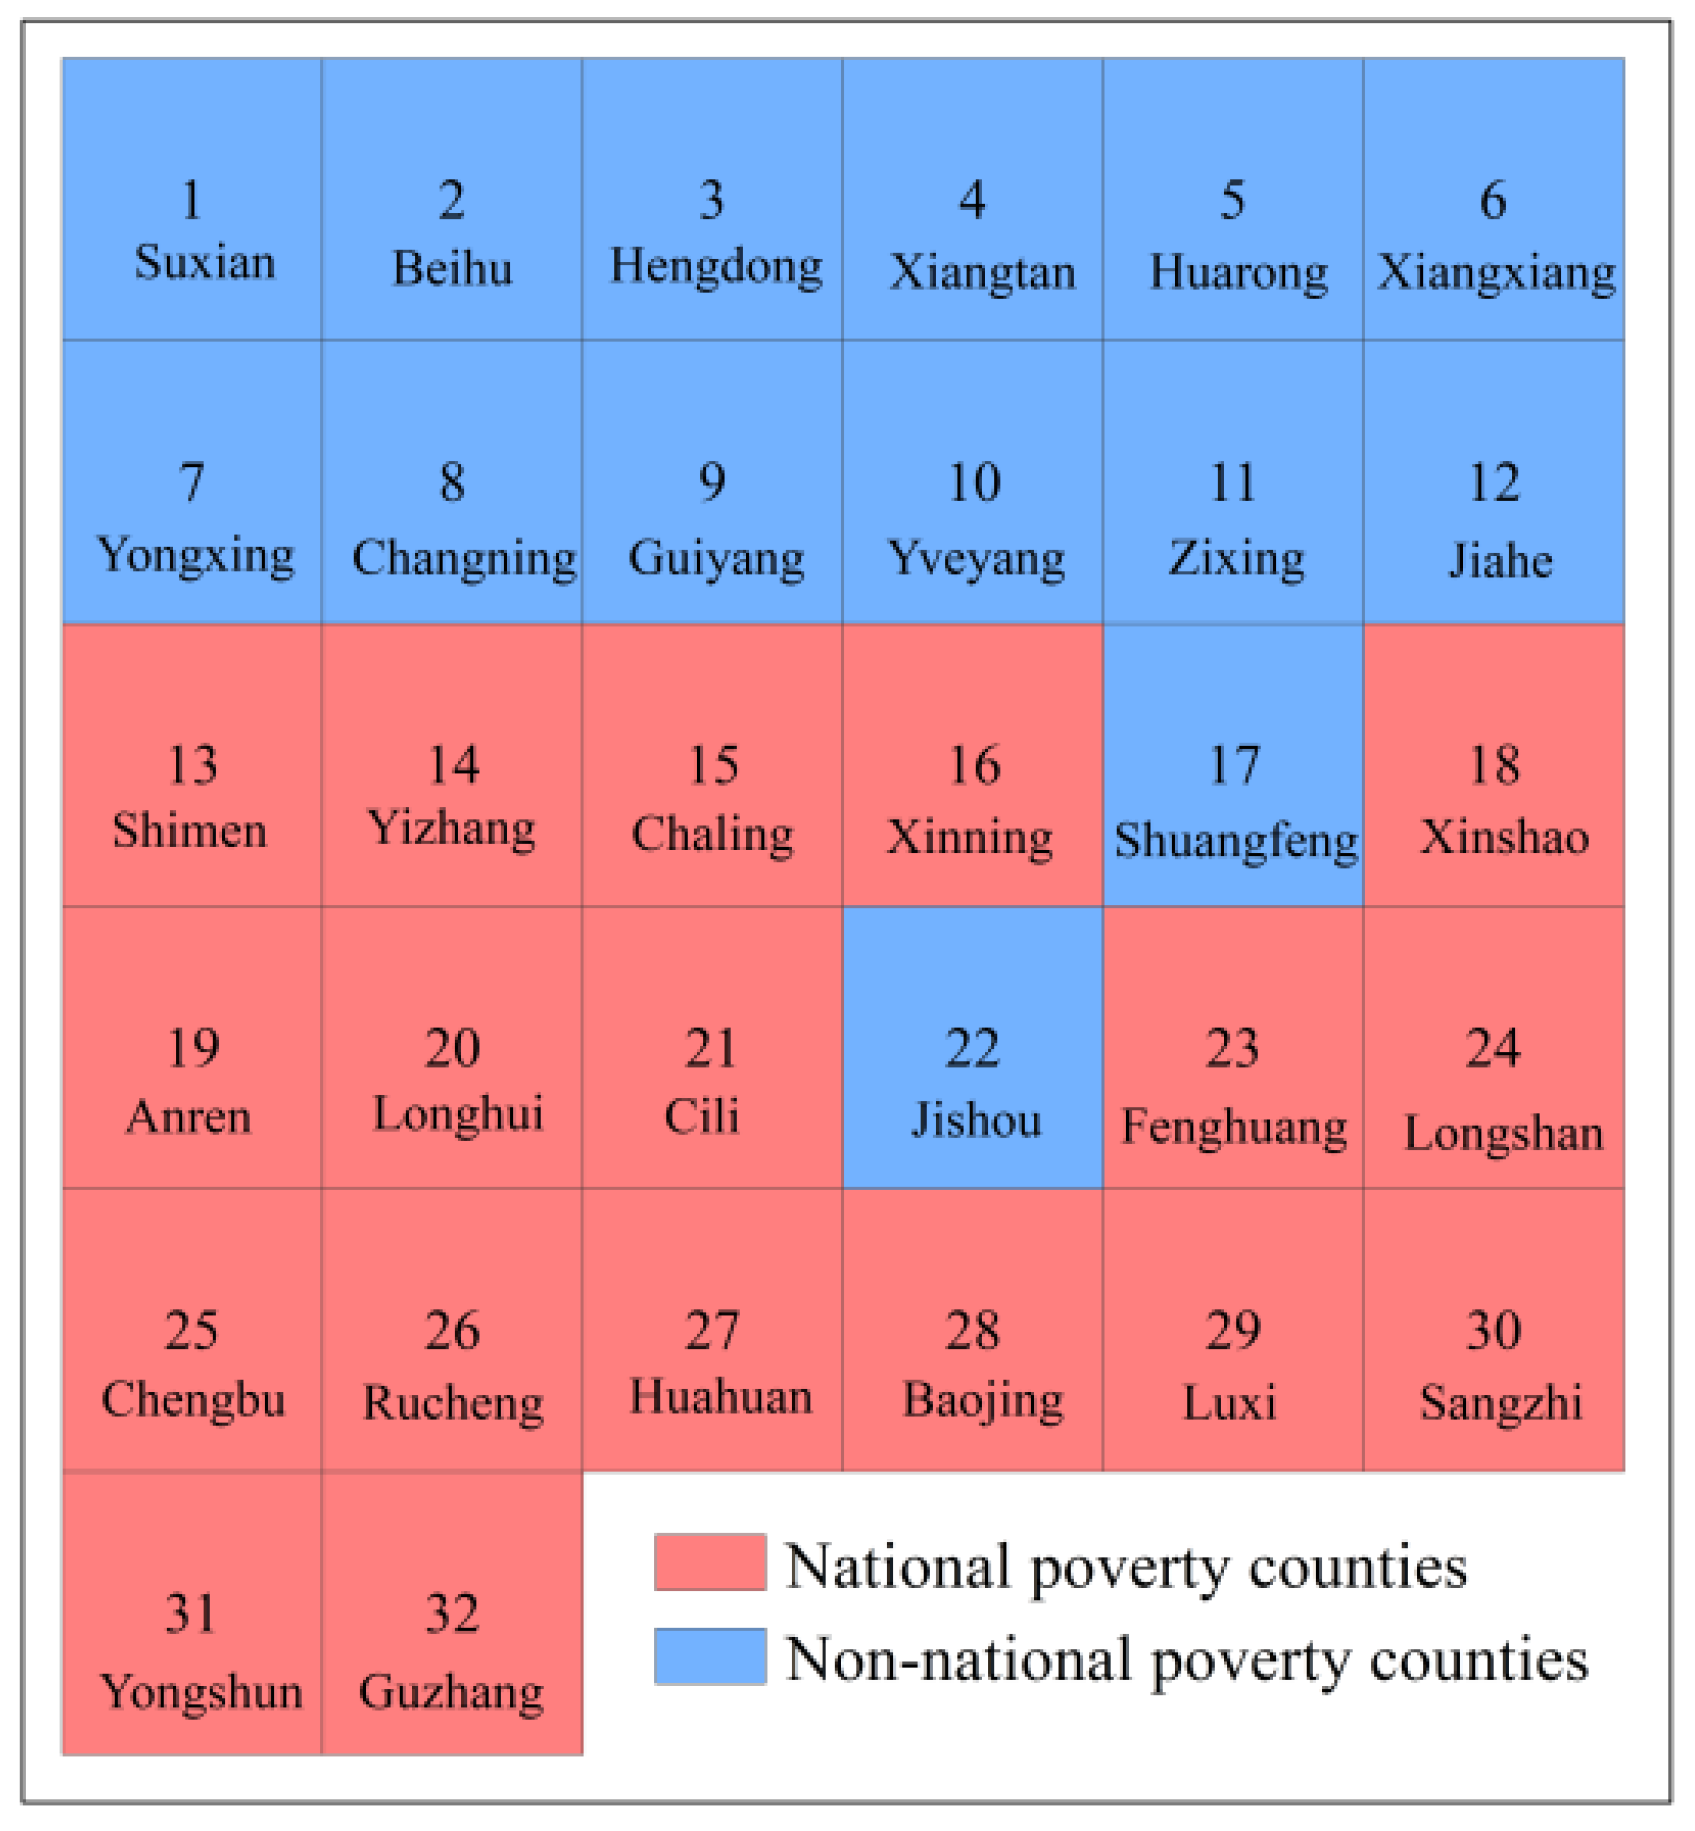
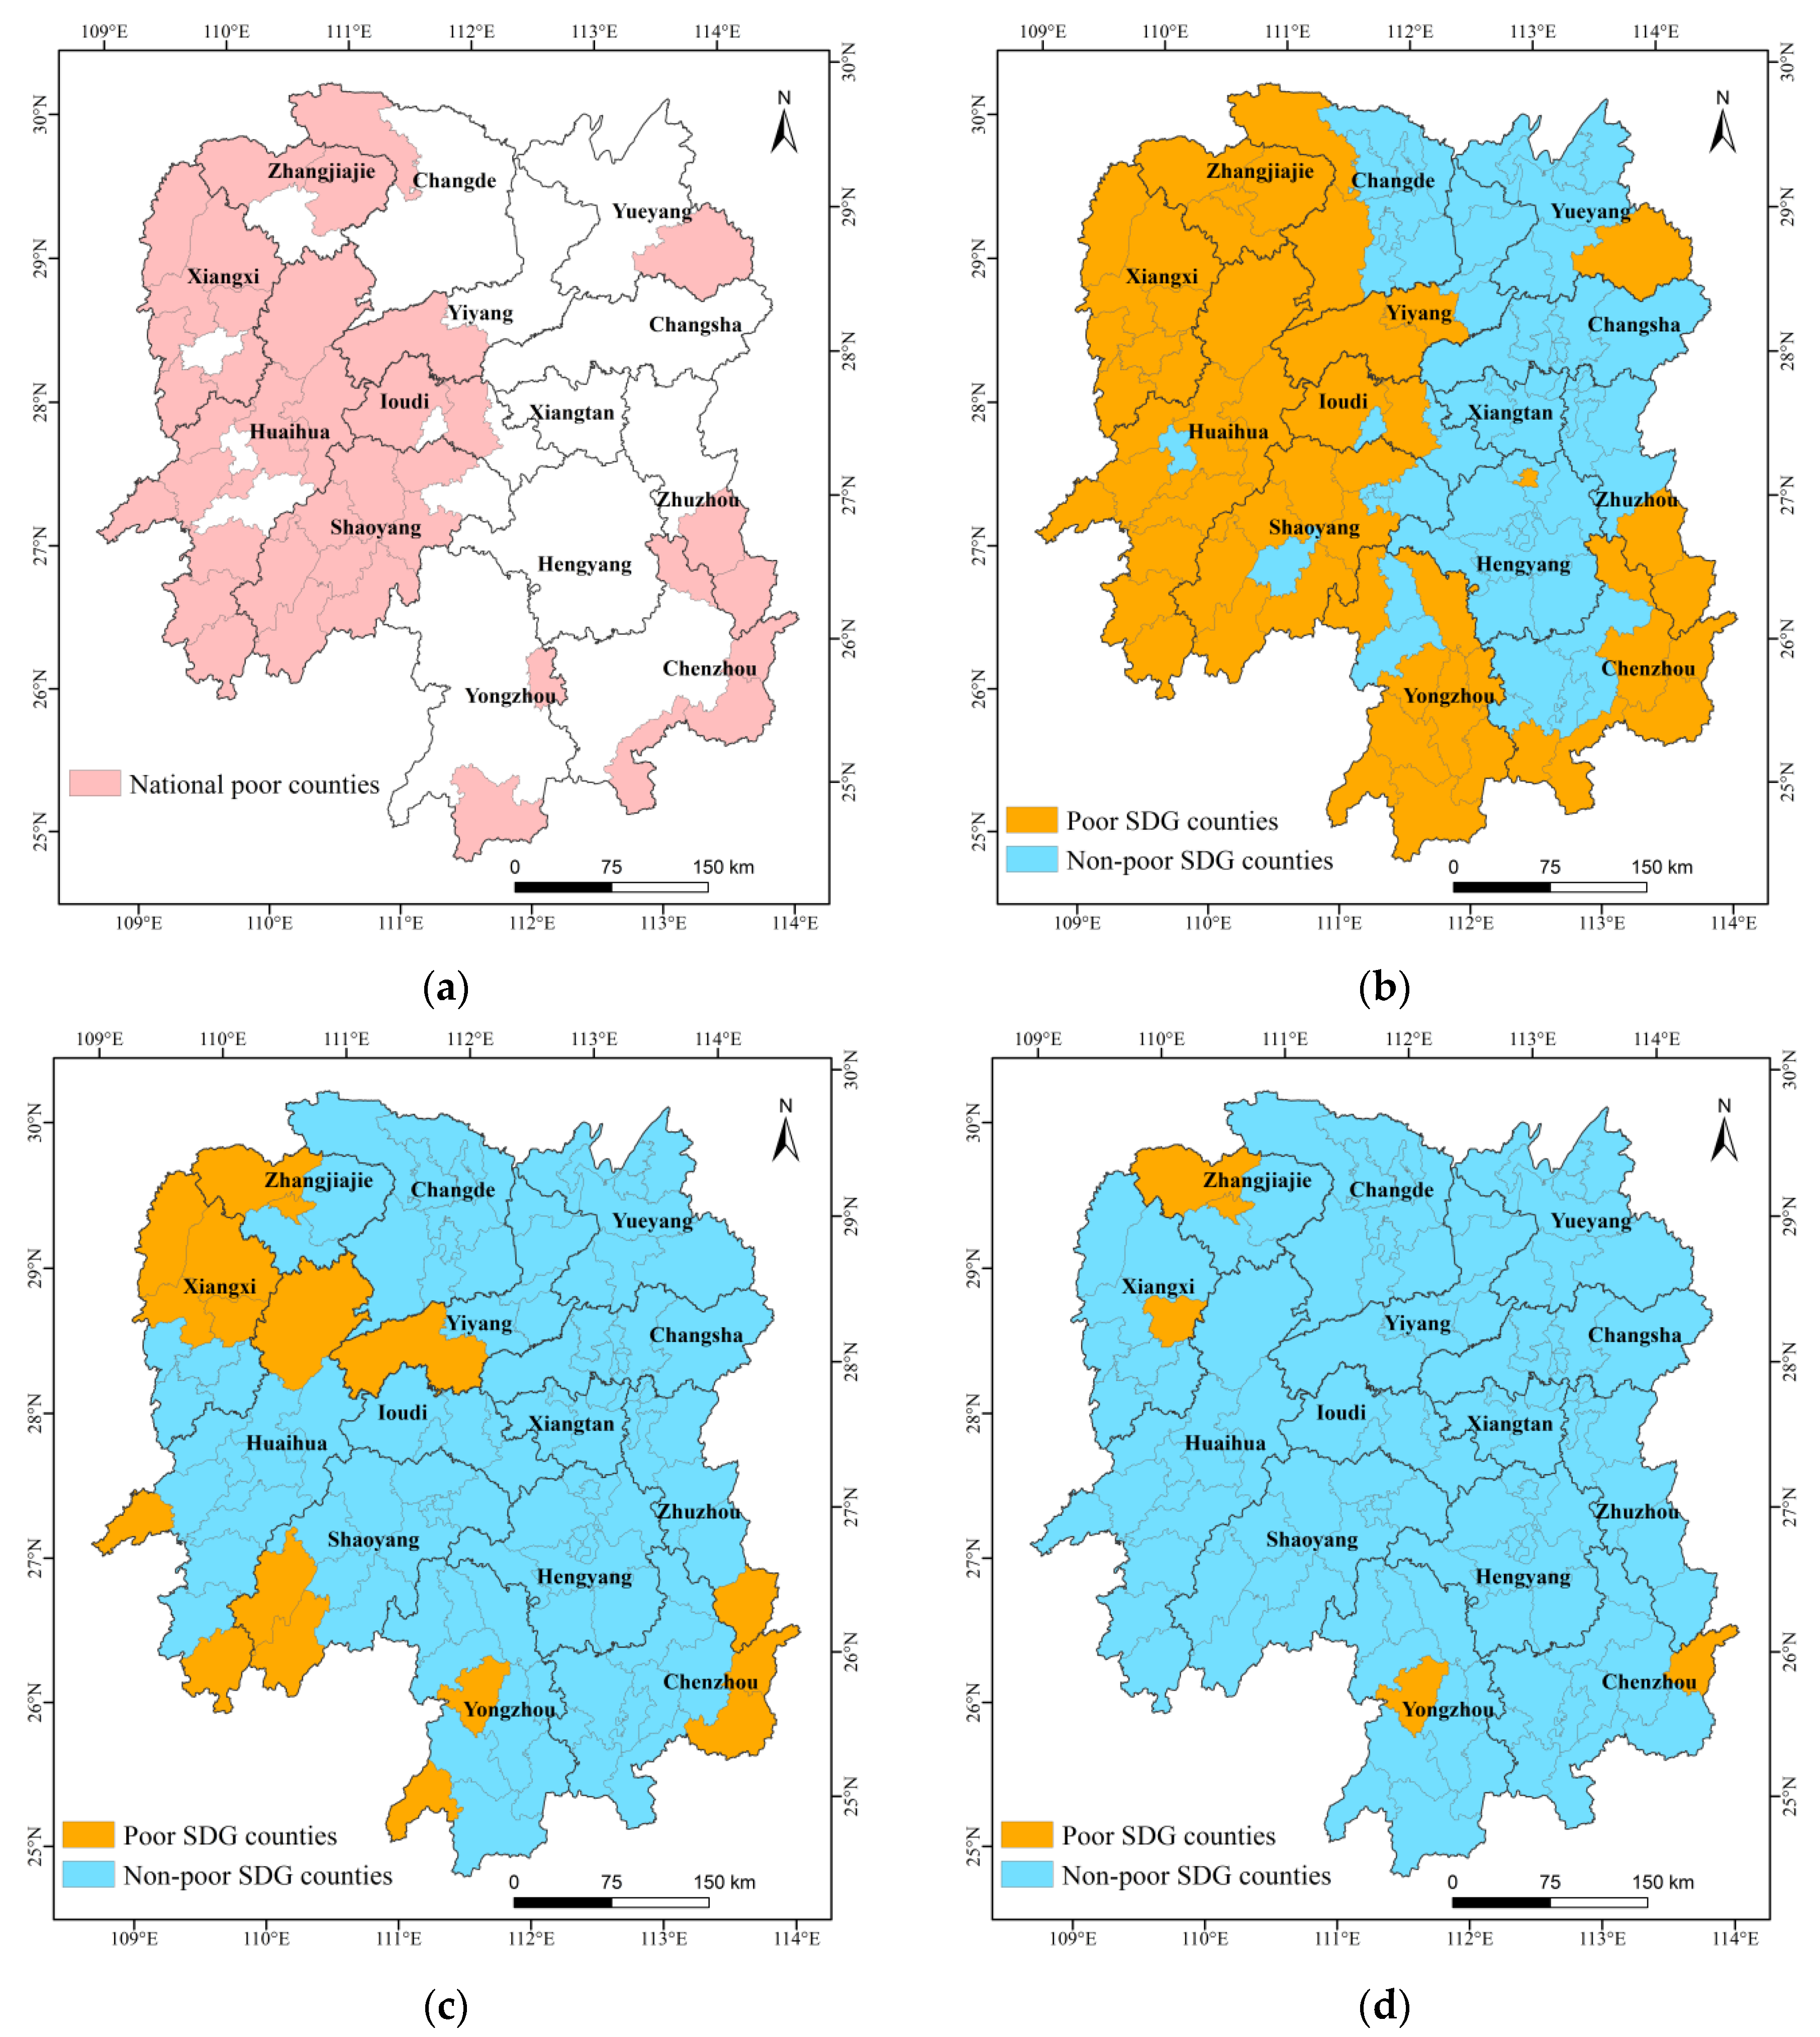
3.3. Spatial Distribution Pattern of SDGs in Poverty-Stricken Counties in Hunan Province

In this paper, the districts and counties with low values in the localized SDG 1 evaluation are identified as poor SDGs. In 2014, there were 55 poor SDG counties in Hunan Province, of which 39 were NPCs. The number of NPCs in Hunan Province is 40, almost all of which are identified. The results (Figure 8) show that the number of poverty-stricken counties decreased significantly from 2014 to 2016. This trend continued from 2016 to 2018, resulting in a further decrease in impoverished counties. China has been making efforts to eradicate poverty and promised to eradicate absolute poverty in 2020. On December 3, 2020, China officially announced the eradication of absolute poverty. In the context of China’s elimination of absolute poverty in 2020, a large number of poverty-stricken counties in Hunan Province eliminated poverty from 2014 to 2018.

4. Discussion

The primary issue in poverty monitoring is defining poverty, and the concept of poverty is not static. Most beginners consider poverty from only the perspective of income, which is referred to as absolute poverty [65,66,67]. Amartya Sen subsequently proposed the concept of ability poverty, which he explained as follows: “A person can make different combinations of choices related to various functional activities. Therefore, ability is a kind of freedom to make a combination of choices related to various functional activities”. Recently, the concept of ability poverty has been widely employed in the measurement of poverty. Amartya Sen describes the concept of poverty of rights in the book Poverty and Famine: Analysis of Poverty from the Perspective of Rights and Deprivation. The rights he discusses in this book refer to the use of various legal channels and the collection of alternative commodity bundles [68,69]. These concepts do not have a substitute relationship but a complementary relationship. The definition of poverty in the SDGs includes the three abovementioned poverty concepts. However, the statistical data required for poverty evaluation in the global, SDG indicator framework are difficult to obtain, especially those related to poverty evaluation work at the district and county levels, and differ among countries. Different stages of development produce different perceptions of poverty. Therefore, it is necessary to construct a localized evaluation system for district- and county-level SDG 1 indicators according to the status quo of regional development.
This study is oriented to the UN SDGs framework and the status quo of China’s social development, and established a Chinese localized SDG 1 indicator system that can better reflect quantitatively the poverty level of China’s districts and counties. Considering the difficulty of collecting statistical data at the district and county level and the different statistical standards, this study extracted geographic data information from the socio-economic, topography, land cover and transportation network to estimate the SDG 1 evaluation values of Hunan Province in 2014, 2016 and 2018. It can provide a reference scheme for scientific and rapid monitoring of regional poverty, and has a certain contribution to the implementation of SDG 1 in China’s districts and counties.
Multisource geographic data have been widely employed in poverty monitoring. The data used include nighttime light images, DEM data, road data, surface coverage data and the normalized difference vegetation index (NDVI). These data can reflect the intensity of human activities and can be utilized for long-term poverty monitoring. Effectively reducing costs and determining how to extract useful information from these data are also key steps. The estimated value of SDG 1 obtained in this paper based on geographic data has a high correlation with the actual value, and their R2 is 0.76. Other related poverty monitoring studies have high estimation accuracy (refer to Table 6). For example, Zhao et al. [45] employed geographic data to obtain an estimated household wealth index (WI) value, and the R2 between it and the actual value was 0.70. Yu et al. [47] found that the average light index is related to the integrated poverty index (IPI) and has a strong correlation, and their R2 is 0.86. Steele et al. [50] used mobile phone and remote sensing data to obtain an estimated WI, which also had a high correlation with the actual WI, with a maximum R2 of 0.76. Xu et al. [51] extracted five variables from nighttime light images, DEM and land cover data. They used the XGBoost model to estimate the IPI and obtained a maximum model R2 of 0.68.
This paper explores localized SDG 1 monitoring and evaluation methods for districts and counties based on multisource geographic data and analyzes localized SDG 1 evaluation values for the districts and counties in Hunan Province and the spatial distribution characteristics of poverty-stricken counties. The following conclusions can be drawn.
(1) The model verification results show that the multiple linear regression evaluation model performed better than the other models, with a maximum R2 of 0.76 and a relative error of 19.12%.
(2) The localized SDG 1 evaluation value for Hunan Province in 2014, 2016 and 2018 has a spatial clustering effect; the global Moran’s I values of these three years were 0.54, 0.56 and 0.56, respectively. The results of the local spatial autocorrelation analysis showed that the districts and counties with aggregations of high-high clusters were mainly distributed in economically developed areas, such as the Chang Zhu Tan urban agglomeration and Hengyang city.
(3) There were 55 poverty-stricken counties in Hunan Province in 2014 according to the SDGs. These counties are relatively scattered, occurring mainly in the northwestern and southeastern regions of Hunan Province. In 2016 and 2018, the poverty-stricken counties of SDGs in Hunan Province decreased significantly.
This article separately constructed the 2014, 2016 and 2018 SDG 1 localization evaluation models. The results show that the model goodness of fit R2 in 2014, 2016, and 2018 is relatively high—0.80, 0.78, and 0.71, respectively (Figure 9). We find that the model goodness of fit R2 in 2014, 2016 and 2018 has a decreasing trend. To a certain extent, this finding shows that the ability of multisource geographic data to retrieve the poverty of SDGs has weakened. The night light image, road network data, and land use data reflect the completeness of the regional infrastructure and the degree of development of the surface. This finding may be related to China’s goal of achieving poverty eradication by 2020. China has increased investment in poverty eradication, but the improvement of infrastructure and the development of land use are lagging behind.
However, for long-term poverty monitoring and evaluation, rural revitalization, sustainable development monitoring and other aspects need to be further investigated. In 2020, China’s long-standing absolute poverty came to a historic end. In the new era following this period, poverty alleviation will depend more on relative poverty issues, such as uneven regional development. According to the spatial distribution pattern of poverty-stricken counties in Hunan Province in 2014, 2016 and 2018 and the characteristics of poverty alleviation in the new era, future poverty alleviation work in Hunan Province should be shifted to prevent a return to poverty and promote balanced development of the region, providing policy support for the social development of northwestern and southeastern Hunan Province to help achieve the SDGs in this region.

5. Conclusions

This study is focused on the first United Nations SDG—eliminating all forms of poverty in the world. Taking Hunan Province as an example, this study designs and proposes a localized SDG 1 indicator system for districts and counties based on multisource geographic data. Multiple linear regressions and multiple machine learning evaluation models were constructed for poverty-stricken areas and counties, and the aggregation patterns and spatial distribution patterns of the SDG indicators in the poverty-stricken counties in southeastern and northwestern Hunan Province were revealed. The proposed method for regional poverty assessment based on multisource geographic data provides an effective poverty monitoring reference scheme for the implementation of the poverty eradication goals in the 2030 agenda. Furthermore, this quantitative evaluation approach can also support long-term sustainable development monitoring and evaluation, rural revitalization and other related aspects.

Author Contributions

Conceptualization, Y.W., M.W. and B.H.; methodology, Y.W., M.W. and B.H.; software, Y.W. and M.W.; validation, Y.W. and M.W.; formal analysis, Y.W. and M.W.; investigation, Y.W., M.W. and B.H.; resources, Y.W., M.W. and B.H.; data curation, S.L. and Y.L.; writing—original draft preparation, Y.W. and M.W.; writing—review and editing, Y.W. and B.H.; visualization, M.W.; supervision, Y.W. and B.H.; project administration, Y.W. All authors have read and agreed to the published version of the manuscript.

Funding

This research was funded by the Foundation for Innovative Research Groups of the Natural Science Foundation of Hunan Province (No. 2020JJ1003), the National Natural Science Foundation of China (Nos. 41971423, 31972951 and 41771462), the Natural Science Foundation of Hunan Province (No. 2020JJ3020), the Science and Technology Planning Project of Hunan Province (Nos. 2019RS2043 and 2019GK2132), the Outstanding Youth Project of Education Department of Hunan Province (No. 18B224) and the Postgraduate Scientific Research Innovation Project of Hunan Province (No. CX20210991).

Institutional Review Board Statement

Not applicable.

Informed Consent Statement

Not applicable.

Data Availability Statement

No new data were created or analyzed in this study. Data sharing is not applicable to this article.

Conflicts of Interest

The authors declare no conflict of interest.

References

  1. Guo, Y.; Zhou, Y.; Liu, Y. Targeted poverty alleviation and its practices in rural China: A case study of Fuping county, Hebei Province. J. Rural Stud. 2019. [Google Scholar] [CrossRef]
  2. Reid, A.J.; Brooks, J.L.; Dolgova, L.; Laurich, B.; Sullivan, B.G.; Szekeres, P.; Wood, S.L.; Bennett, J.; Cooke, S. Post-2015 Sustainable Development Goals still neglecting their environmental roots in the Anthropocene. Environ. Sci. Policy 2017, 77, 179–184. [Google Scholar] [CrossRef]
  3. Allen, C.; Metternicht, G.; Wiedmann, T. Initial progress in implementing the Sustainable Development Goals (SDGs): A review of evidence from countries. Sustain. Sci. 2018, 13, 1453–1467. [Google Scholar] [CrossRef]
  4. Pizzi, S.; Caputo, A.; Corvino, A.; Venturelli, A. Management research and the UN sustainable development goals (SDGs): A bibliometric investigation and systematic review. J. Clean. Prod. 2020, 276, 124033. [Google Scholar] [CrossRef]
  5. Menton, M.; Larrea, C.; Latorre, S.; Martinez-Alier, J.; Peck, M.; Temper, L.; Walter, M. Environmental justice and the SDGs: From synergies to gaps and contradictions. Sustain. Sci. 2020, 15, 1621–1636. [Google Scholar] [CrossRef] [Green Version]
  6. Rosati, F.; Faria, L.G.D. Addressing the SDGs in sustainability reports: The relationship with institutional factors. J. Clean. Prod. 2019, 215, 1312–1326. [Google Scholar] [CrossRef]
  7. Janoušková, S.; Hák, T.; Moldan, B. Global SDGs Assessments: Helping or Confusing Indicators? Sustainability 2018, 10, 1540. [Google Scholar] [CrossRef] [Green Version]
  8. Dizdaroglu, D. The Role of Indicator-Based Sustainability Assessment in Policy and the Decision-Making Process: A Review and Outlook. Sustainability 2017, 9, 1018. [Google Scholar] [CrossRef] [Green Version]
  9. Pires, S.M.; Fidélis, T.; Ramos, T. Measuring and comparing local sustainable development through common indicators: Constraints and achievements in practice. Cities 2014, 39, 1–9. [Google Scholar] [CrossRef]
  10. Giles-Corti, B.; Lowe, M.; Arundel, J. Achieving the SDGs: Evaluating indicators to be used to benchmark and monitor progress towards creating healthy and sustainable cities. Health Policy 2019, 124, 581–590. [Google Scholar] [CrossRef]
  11. Xu, X.; Kuang, Z.; Han, J.; Meng, Y.; Li, L.; Luan, H.; Xu, P.; Wang, J.; Luo, C.; Ding, H.; et al. Development and Characterization of a Fluorescent Probe for GLS1 and the Application for High-Throughput Screening of Allosteric Inhibitors. J. Med. Chem. 2019, 62, 9642–9657. [Google Scholar] [CrossRef]
  12. Dickens, C.; Smakhtin, V.; McCartney, M.; O’Brien, G.; Dahir, L. Defining and Quantifying National-Level Targets, Indicators and Benchmarks for Management of Natural Resources to Achieve the Sustainable Development Goals. Sustainability 2019, 11, 462. [Google Scholar] [CrossRef] [Green Version]
  13. Khalid, A.M.; Sharma, S.; Dubey, A.K. Developing an indicator set for measuring sustainable development in India. Nat. Resour. Forum 2018, 42, 185–200. [Google Scholar] [CrossRef]
  14. Mori, K.; Christodoulou, A. Review of sustainability indices and indicators: Towards a new City Sustainability Index (CSI). Environ. Impact Assess. Rev. 2012, 32, 94–106. [Google Scholar] [CrossRef]
  15. Fisher, A.; Fukuda-Parr, S. Introduction—Data, Knowledge, Politics and Localizing the SDGs. J. Hum. Dev. Capab. 2019, 20, 375–385. [Google Scholar] [CrossRef] [Green Version]
  16. Wang, W.; Cheng, H.; Zhang, L. Poverty assessment using DMSP/OLS night-time light satellite imagery at a provincial scale in China. Adv. Space Res. 2012, 49, 1253–1264. [Google Scholar] [CrossRef]
  17. Ma, L.; Che, X.; Zhang, J.; Fang, F.; Chen, M. Rural Poverty Identification and Comprehensive Poverty Assessment Based on Quality-of-Life: The Case of Gansu Province (China). Sustainability 2019, 11, 4547. [Google Scholar] [CrossRef] [Green Version]
  18. Cohen, A. The Multidimensional Poverty Assessment Tool: A new framework for measuring rural poverty. Dev. Pract. 2010, 20, 887–897. [Google Scholar] [CrossRef]
  19. Caizhen, L. Who is poor in China? A comparison of alternative approaches to poverty assessment in Rural Yunnan. J. Peasant Stud. 2010, 37, 407–428. [Google Scholar] [CrossRef]
  20. Khan, A.U.; Saboor, A.; Hussain, A.; Sadiq, S.; Mohsin, A.Q. Poverty assessment as a multidimensional socio-economic concept: The case of the Rawalpindi region in Pakistan. Asia Pac. J. Soc. Work. Dev. 2014, 24, 238–250. [Google Scholar] [CrossRef]
  21. Shi, K.; Chang, Z.; Chen, Z.; Wu, J.; Yu, B. Identifying and evaluating poverty using multisource remote sensing and point of interest (POI) data: A case study of Chongqing, China. J. Clean. Prod. 2020, 255, 120245. [Google Scholar] [CrossRef]
  22. Antoniades, A.; Widiarto, I.; Antonarakis, A.S. Financial crises and the attainment of the SDGs: An adjusted multidimensional poverty approach. Sustain. Sci. 2019, 15, 1683–1698. [Google Scholar] [CrossRef] [Green Version]
  23. Hossain, S.; Johnson, F.A.; Dearing, J.A.; Eigenbrod, F. Recent trends of human wellbeing in the Bangladesh delta. Environ. Dev. 2016, 17, 21–32. [Google Scholar] [CrossRef] [Green Version]
  24. Liu, Q.-Q.; Yu, M.; Wang, X.-L. Poverty reduction within the framework of SDGs and Post-2015 Development Agenda. Adv. Clim. Chang. Res. 2015, 6, 67–73. [Google Scholar] [CrossRef]
  25. Vanham, D.; Leip, A.; Galli, A.; Kastner, T.; Bruckner, M.; Uwizeye, A.; van Dijk, K.; Ercin, E.; Dalin, C.; Brandão, M.; et al. Environmental footprint family to address local to planetary sustainability and deliver on the SDGs. Sci. Total Environ. 2019, 693, 133642. [Google Scholar] [CrossRef]
  26. Echendu, A.J. The impact of flooding on Nigeria’s sustainable development goals (SDGs). Ecosyst. Health Sustain. 2020, 6. [Google Scholar] [CrossRef]
  27. Heimann, T. Bioeconomy and SDGs: Does the Bioeconomy Support the Achievement of the SDGs? Earths Futur. 2019, 7, 43–57. [Google Scholar] [CrossRef] [Green Version]
  28. Biggeri, M.; Clark, D.A.; Ferrannini, A.; Mauro, V. Tracking the SDGs in an ‘integrated’ manner: A proposal for a new index to capture synergies and trade-offs between and within goals. World Dev. 2019, 122, 628–647. [Google Scholar] [CrossRef]
  29. Liu, H.; Leng, S.; He, C.; Peng, J.; Piao, S.; Wang, X. China’s road towards sustainable development: Geography bridges science and solution. Prog. Phys. Geogr. Earth Environ. 2019, 43, 694–706. [Google Scholar] [CrossRef]
  30. Holloway, J.; Mengersen, K. Statistical Machine Learning Methods and Remote Sensing for Sustainable Development Goals: A Review. Remote Sens. 2018, 10, 1365. [Google Scholar] [CrossRef] [Green Version]
  31. Avtar, R.; Komolafe, A.A.; Kouser, A.; Singh, D.; Yunus, A.P.; Dou, J.; Kumar, P.; Das Gupta, R.; Johnson, B.A.; Minh, H.V.T.; et al. Assessing sustainable development prospects through remote sensing: A review. Remote Sens. Appl. Soc. Environ. 2020, 20, 100402. [Google Scholar] [CrossRef]
  32. Avtar, R.; Aggarwal, R.; Kharrazi, A.; Kumar, P.; Kurniawan, T.A. Utilizing geospatial information to implement SDGs and monitor their Progress. Environ. Monit. Assess. 2019, 192, 35. [Google Scholar] [CrossRef]
  33. Liverman, D.M. Geographic perspectives on development goals. Dialog Hum. Geogr. 2018, 8, 168–185. [Google Scholar] [CrossRef] [Green Version]
  34. Giuliani, G.; Mazzetti, P.; Santoro, M.; Nativi, S.; Van Bemmelen, J.; Colangeli, G.; Lehmann, A. Knowledge generation using satellite earth observations to support sustainable development goals (SDG): A use case on Land degradation. Int. J. Appl. Earth Obs. Geoinf. 2020, 88, 102068. [Google Scholar] [CrossRef]
  35. Im, J. Earth observations and geographic information science for sustainable development goals. GIScience Remote Sens. 2020, 57, 591–592. [Google Scholar] [CrossRef]
  36. Geng, W.; Chen, J.; Zhang, H.P.; Xu, K. Task and progress of IAEG-SDGS: WGGI in monitoring SDGS through a ‘geographic location’ lens. ISPRS Int. Arch. Photogramm. Remote Sens. Spat. Inf. Sci. 2018, XLII-3, 385–390. [Google Scholar] [CrossRef] [Green Version]
  37. Ghosh, T.; Coscieme, L.; Anderson, S.J.; Sutton, P.C. Building Volume Per Capita (BVPC): A Spatially Explicit Measure of Inequality Relevant to the SDGs. Front. Sustain. Cities 2020, 2. [Google Scholar] [CrossRef]
  38. Wu, B.; Tian, F.; Zhang, M.; Zeng, H.; Zeng, Y. Cloud services with big data provide a solution for monitoring and tracking sustainable development goals. Geogr. Sustain. 2020, 1, 25–32. [Google Scholar] [CrossRef]
  39. Chen, J.; Peng, S.; Chen, H.; Zhao, X.; Ge, Y.; Li, Z. A Comprehensive Measurement of Progress toward Local SDGs with Geospatial Information: Methodology and Lessons Learned. ISPRS Int. J. Geo-Inf. 2020, 9, 522. [Google Scholar] [CrossRef]
  40. Liu, S.; Bai, J.; Chen, J. Measuring SDG 15 at the County Scale: Localization and Practice of SDGs Indicators Based on Geospatial Information. ISPRS Int. J. Geo-Inf. 2019, 8, 515. [Google Scholar] [CrossRef] [Green Version]
  41. Nagabhatla, N.; Brahmbhatt, R. Geospatial Assessment of Water-Migration Scenarios in the Context of Sustainable Development Goals (SDGs) 6, 11, and 16. Remote Sens. 2020, 12, 1376. [Google Scholar] [CrossRef]
  42. Solís, P.; McCusker, B.; Menkiti, N.; Cowan, N.; Blevins, C. Engaging global youth in participatory spatial data creation for the UN sustainable development goals: The case of open mapping for malaria prevention. Appl. Geogr. 2018, 98, 143–155. [Google Scholar] [CrossRef]
  43. Lucas, B.; Francu, R.E.; Goulding, J.; Harvey, J.; Nica-Avram, G.; Perrat, B. A Note on Data-driven Actor-differentiation and SDGs 2 and 12: Insights from a Food-sharing App. Res. Policy 2021, 50, 104266. [Google Scholar] [CrossRef]
  44. Molla, Y.B.; Rawlins, B.; Makanga, P.T.; Cunningham, M.; Ávila, J.E.H.; Ruktanonchai, C.W.; Singh, K.; Alford, S.; Thompson, M.; Dwivedi, V.; et al. Geographic information system for improving maternal and newborn health: Recommendations for policy and programs. BMC Pregnancy Childbirth 2017, 17, 26. [Google Scholar] [CrossRef] [Green Version]
  45. Zhao, X.; Yu, B.; Liu, Y.; Chen, Z.; Li, Q.; Wang, C.; Wu, J. Estimation of Poverty Using Random Forest Regression with Multi-Source Data: A Case Study in Bangladesh. Remote Sens. 2019, 11, 375. [Google Scholar] [CrossRef] [Green Version]
  46. Vaziri, M.; Acheampong, M.; Downs, J.; Majid, M.R. Poverty as a function of space: Understanding the spatial configuration of poverty in Malaysia for Sustainable Development Goal number one. GeoJournal 2018, 84, 1317–1336. [Google Scholar] [CrossRef]
  47. Yu, B.; Shi, K.; Hu, Y.; Huang, C.; Chen, Z.; Wu, J. Poverty Evaluation Using NPP-VIIRS Nighttime Light Composite Data at the County Level in China. IEEE J. Sel. Top. Appl. Earth Obs. Remote Sens. 2015, 8, 1217–1229. [Google Scholar] [CrossRef]
  48. Li, G.; Chang, L.; Liu, X.; Su, S.; Cai, Z.; Huang, X.; Li, B. Monitoring the spatiotemporal dynamics of poor counties in China: Implications for global sustainable development goals. J. Clean. Prod. 2019, 227, 392–404. [Google Scholar] [CrossRef]
  49. Niu, T.; Chen, Y.; Yuan, Y. Measuring urban poverty using multi-source data and a random forest algorithm: A case study in Guangzhou. Sustain. Cities Soc. 2020, 54, 102014. [Google Scholar] [CrossRef]
  50. Steele, J.E.; Sundsøy, P.R.; Pezzulo, C.; Alegana, V.A.; Bird, T.J.; Blumenstock, J.; Bjelland, J.; Engø-Monsen, K.; De Montjoye, Y.-A.; Iqbal, A.M.; et al. Mapping poverty using mobile phone and satellite data. J. R. Soc. Interface 2017, 14, 20160690. [Google Scholar] [CrossRef]
  51. Xu, Y.; Mo, Y.; Zhu, S. Poverty Mapping in the Dian-Gui-Qian Contiguous Extremely Poor Area of Southwest China Based on Multi-Source Geospatial Data. Sustainability 2021, 13, 8717. [Google Scholar] [CrossRef]
  52. Niu, S.; Lyu, X.; Gu, G.; Zhou, X.; Peng, W. Sustainable Intensification of Cultivated Land Use and Its Influencing Factors at the Farming Household Scale: A Case Study of Shandong Province, China. Chin. Geogr. Sci. 2021, 31, 109–125. [Google Scholar] [CrossRef]
  53. Ghasemkhani, N.; Vayghan, S.S.; Abdollahi, A.; Pradhan, B.; Alamri, A. Urban Development Modeling Using Integrated Fuzzy Systems, Ordered Weighted Averaging (OWA), and Geospatial Techniques. Sustainability 2020, 12, 809. [Google Scholar] [CrossRef] [Green Version]
  54. Chen, M.; Liang, L.; Wang, Z.; Zhang, W.; Yu, J.; Liang, Y. Geographical thoughts on the relationship between ‘Beautiful China’ and land spatial planning. J. Geogr. Sci. 2020, 30, 705–723. [Google Scholar] [CrossRef]
  55. Han, Z.; Jiao, S.; Zhang, X.; Xie, F.; Ran, J.; Jin, R.; Xu, S. Seeking sustainable development policies at the municipal level based on the triad of city, economy and environment: Evidence from Hunan province, China. J. Environ. Manag. 2021, 290, 112554. [Google Scholar] [CrossRef]
  56. Zhou, L.; Xiong, L.-Y. Natural topographic controls on the spatial distribution of poverty-stricken counties in China. Appl. Geogr. 2017, 90, 282–292. [Google Scholar] [CrossRef]
  57. Tian, Y.; Wang, Z.; Zhao, J.; Jiang, X.; Guo, R. A Geographical Analysis of the Poverty Causes in China’s Contiguous Destitute Areas. Sustainability 2018, 10, 1895. [Google Scholar] [CrossRef] [Green Version]
  58. Elvidge, C.; Zhizhin, M.; Ghosh, T.; Hsu, F.-C.; Taneja, J. Annual Time Series of Global VIIRS Nighttime Lights Derived from Monthly Averages: 2012 to 2019. Remote Sens. 2021, 13, 922. [Google Scholar] [CrossRef]
  59. Lopez-Ruiz, H.G.; Blazquez, J.; Hasanov, F. Estimating the Saudi Arabian Regional GDP Using Satellite Nighttime Light Images. SSRN Electron. J. 2018. [Google Scholar] [CrossRef]
  60. Lin, Z.; Xu, H. Anthropogenic Heat Flux Estimation Based on Luojia 1-01 New Nighttime Light Data: A Case Study of Jiangsu Province, China. Remote Sens. 2020, 12, 3707. [Google Scholar] [CrossRef]
  61. Arowolo, A.O.; Deng, X. Land use/land cover change and statistical modelling of cultivated land change drivers in Nigeria. Reg. Environ. Chang. 2017, 18, 247–259. [Google Scholar] [CrossRef]
  62. Simwanda, M.; Murayama, Y. Spatiotemporal patterns of urban land use change in the rapidly growing city of Lusaka, Zambia: Implications for sustainable urban development. Sustain. Cities Soc. 2018, 39, 262–274. [Google Scholar] [CrossRef]
  63. Maparu, T.S.; Mazumder, T.N. Transport infrastructure, economic development and urbanization in India (1990–2011): Is there any causal relationship? Transp. Res. Part A Policy Pract. 2017, 100, 319–336. [Google Scholar] [CrossRef]
  64. Abdollahi, A.; Pradhan, B. Urban Vegetation Mapping from Aerial Imagery Using Explainable AI (XAI). Sensors 2021, 21, 4738. [Google Scholar] [CrossRef] [PubMed]
  65. Kingdon, G.G.; Knight, J. Subjective well-being povertyvs. Income poverty and capabilities poverty? J. Dev. Stud. 2006, 42, 1199–1224. [Google Scholar] [CrossRef]
  66. Rojas, M. Experienced Poverty and Income Poverty in Mexico: A Subjective Well-Being Approach. World Dev. 2008, 36, 1078–1093. [Google Scholar] [CrossRef]
  67. Whelan, C.T.; Layte, R.; Maître, B. Understanding the Mismatch between Income Poverty and Deprivation: A Dynamic Comparative Analysis. Eur. Sociol. Rev. 2004, 20, 287–302. [Google Scholar] [CrossRef]
  68. Gordon, E.; Henao, S.R.; Duque, A.Z.; Dolan-Evans, E. Power, poverty and peacebuilding: The violence that sustains inequalities and undermines peace in Colombia. Confl. Secur. Dev. 2020, 20, 697–721. [Google Scholar] [CrossRef]
  69. Benatar, S. Politics, Power, Poverty and Global Health: Systems and Frames. Int. J. Health Policy Manag. 2016, 5, 599–604. [Google Scholar] [CrossRef] [Green Version]
Figure 1. Datasets used in this study. (a) SRTM DEM data, (b) NPP-VIIRS nighttime light images, (c) land use data, and (d) OSM road data.
Remotesensing 13 04778 g001
Figure 2. Flow chart for the evaluation and analysis of poverty-stricken counties in Hunan Province.
Remotesensing 13 04778 g002
Figure 3. The SDG 1 evaluation value ranking of some districts and counties in Hunan Province, in 2014. For example, Guzhang, ranking 32, was the poorest county and had the lowest SDG 1 evaluation value among these 32 counties of Hunan Province, in 2014.
Remotesensing 13 04778 g003
Figure 4. (a) Distribution of NPCs in Hunan Province in 2014, (bj) are the inversion results of the SDG 1 evaluation values of Model I, Model Ⅱ, Model Ⅲ, Model Ⅳ, Model Ⅴ, Model Ⅵ, Model Ⅶ, Model Ⅷ, Model Ⅸ, respectively.
Remotesensing 13 04778 g004aRemotesensing 13 04778 g004bRemotesensing 13 04778 g004c
Figure 5. Scatter plot of the estimated and actual SDG 1 evaluation values.
Remotesensing 13 04778 g005
Figure 6. (ac) are the grading maps of the SDG 1 evaluation value of Hunan Province in 2014, 2016 and 2018, respectively, (d) SDG 1 evaluation value of Hunan Province’s ellipse distribution.
Remotesensing 13 04778 g006aRemotesensing 13 04778 g006b
Figure 7. (ac) are the local spatial autocorrelation results of the SDG 1 evaluation value in Hunan Province in 2014, 2016 and 2018, respectively.
Remotesensing 13 04778 g007
Figure 8. (a) Distribution of NPCs in China; (bd) are the spatial distributions of poor SDG counties in Hunan Province in 2014, 2016 and 2018, respectively.
Remotesensing 13 04778 g008
Figure 9. (ac) are the scatter plots of the estimated and actual SDG 1 evaluation values in Hunan Province in 2014, 2016 and 2018, respectively.
Remotesensing 13 04778 g009
Table 1. Localized, SDG 1 index system for districts and counties.
Global SDG 1 Indicator FrameworkLocalized SDG 1 Index for ChinaLocalized SDG 1 Indicators for Districts and Counties
1. Proportion of the population living below the international poverty line by sex, age, employment status and geographic location (urban/rural)1. Incidence of poverty1. Incidence of poverty
2. Proportion of population living below the national poverty line by sex and age
3. Proportion of men, women and children of all ages living in poverty in all its dimensions according to national definitions2. Percentage of urban residents with minimum living allowance in urban populations
3. Proportion of rural residents with minimum living security in rural populations
4. Proportion of urban and rural persons with disabilities included in the minimum living allowance in the total population
2. Percentage of urban residents with minimum living allowance in urban populations
3. Proportion of rural residents with minimum living security in rural populations
4. Proportion of population covered by social protection floors/systems by sex, distinguishing children, unemployed persons, older persons, persons with disabilities, pregnant women, newborns, work-based injury victims and persons who are poor and vulnerable
5. Number of deaths, missing persons and persons directly affected by disasters per 100,000 persons5. Proportion of the population affected by natural disasters to the total population4. Disposable income of urban residents
5. Disposable income of rural residents
6. Direct economic loss attributed to disasters in relation to global gross domestic product (GDP)
7. Proportion of total government spending on essential services (education, health and social protection)
Table 2. Localized, SDG 1 index weight for districts and counties.
Localized SDG 1 Indicators for Districts and CountiesWeightIndicator Attributes
1. Incidence of poverty0.1379
2. Percentage of urban residents with minimum living allowance in urban populations0.1138
3. Proportion of rural residents with minimum living security in rural populations0.1895
4. Disposable income of urban residents0.1624+
5. Disposable income of rural residents0.3964+
Table 3. Multidimensional factors based on geographic data.
Influencing FactorDataCharacteristic Factor
Social economyNPP-VIIRS Nighttime light imageTotal logarithm of nighttime lights ( V 1 )
Percentage of nighttime light area at night ( V 2 )
Land coverLand use dataProportion of urban land area ( V 3 )
TopographySRTM DEM dataMean elevation ( V 4 )
Average slope ( V 5 )
Traffic networkOSM road dataRoad network density ( V 6 )
Table 4. Important parameters of the machine learning model.
Machine Learning ModelParameter TypeParameter Value
Regression tree; Model VIMinimum leaf size12
Support vector machine; Model VIIKernel functionLinear function
Gaussian process regression; Model VIIIKernel functionMatern 5/2 function
Integrated tree; Model IXMinimum leaf size8
Table 5. Results of the evaluation models of localized SDG 1 indicators in Hunan Province.
Evaluation ModelR2RMSE
Model I0.760.10
Model II0.750.10
Model III0.570.13
Model IV0.740.11
Model V0.640.12
Model VI0.500.14
Model VII0.720.11
Model VIII0.730.11
Model IX0.680.12
Table 6. Estimated results of related poverty monitoring.
Poverty Indicator SystemR2Literature Source
1Localized SDG 1 indicators for districts and counties0.76Our study
2Household wealth index0.70Zhao et al. [45]
3Integrated poverty index0.86Yu et al. [47]
4Household wealth index0.76Steele et al. [50]
5Integrated poverty index0.68Xu et al. [51]
Publisher’s Note: MDPI stays neutral with regard to jurisdictional claims in published maps and institutional affiliations.

