
Trajectory Determination of Chang’E-5 during Landing and Ascending
by
 ,
,
Peng Yang
1,2,3, 
Yong Huang
1,2,3,4,*,
Peijia Li
1,2,
Siyu Liu
1,2,3,
Quan Shan
1,2,3 and
Weimin Zheng
1 1
Shanghai Astronomical Observatory, Chinese Academy of Sciences, Shanghai 200030, China
2
Key Laboratory of Planetary Sciences, Shanghai Astronomical Observatory, Chinese Academy of Sciences, Shanghai 200030, China
3
University of Chinese Academy of Sciences, Beijing 100049, China
4
Shanghai Key Laboratory of Space Navigation and Positioning Techniques, Shanghai Astronomical Observatory, Chinese Academy of Sciences, Shanghai 200030, China
*
Author to whom correspondence should be addressed.
Remote Sens. 2021, 13(23), 4837; https://0-doi-org.brum.beds.ac.uk/10.3390/rs13234837
Submission received: 7 October 2021
/
Revised: 16 November 2021
/
Accepted: 24 November 2021
/
Published: 28 November 2021
(This article belongs to the Special Issue Methods of Precise Orbit Determination and Autonomous Navigation for Interplanetary Space Probes)
Abstract
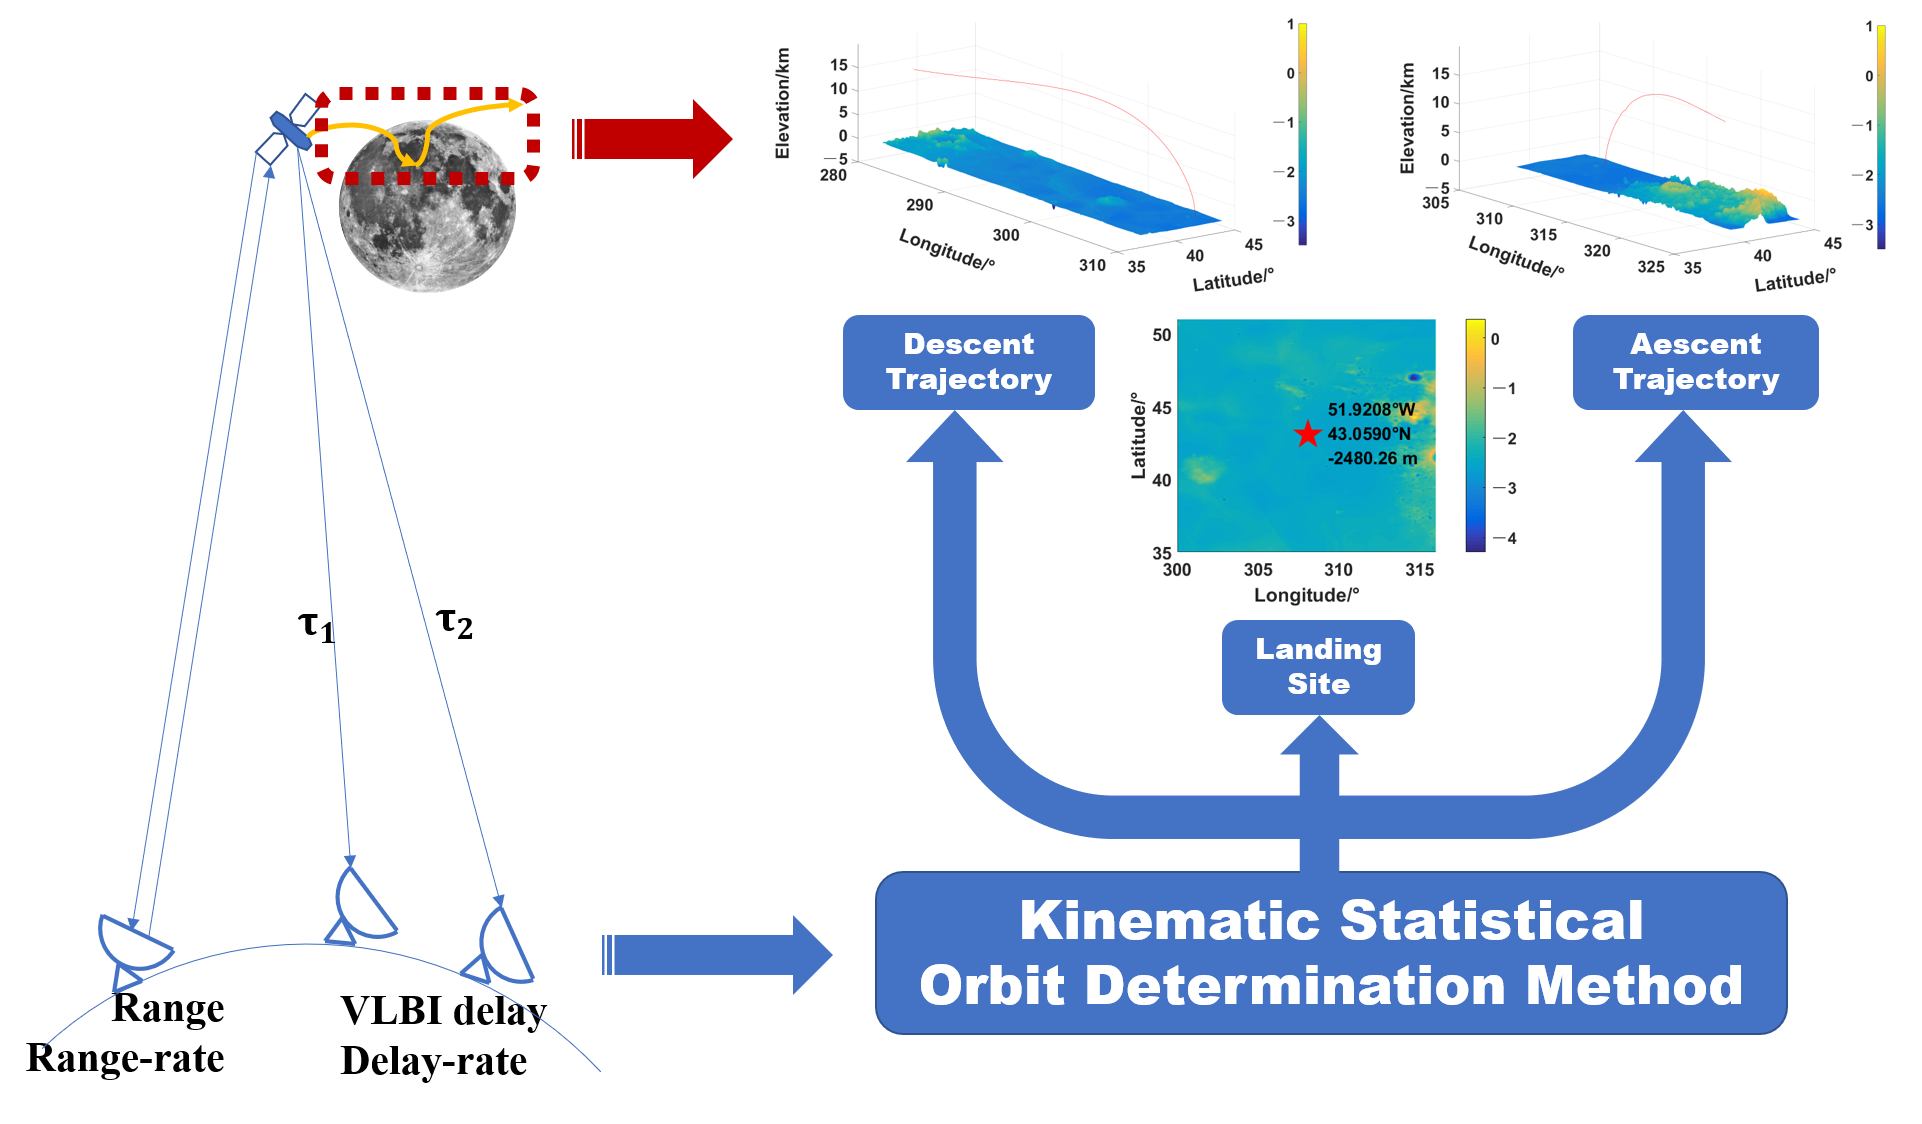
:Chang’E-5 (CE-5) is China’s first lunar sample return mission. This paper focuses on the trajectory determination of the CE-5 lander and ascender during the landing and ascending phases, and the positioning of the CE-5 lander on the Moon. Based on the kinematic statistical orbit determination method using B-spline and polynomial functions, the descent and ascent trajectories of the lander and ascender are determined by using ground-based radiometric ranging, Doppler and interferometry data. The results show that a B-spline function is suitable for a trajectory with complex maneuvers. For a smooth trajectory, B-spline and polynomial functions can reach almost the same solutions. The positioning of the CE-5 lander on the Moon is also investigated here. Using the kinematic statistical positioning method, the landing site of the lander is 43.0590°N, 51.9208°W with an elevation of −2480.26 m, which is less than 200 m different from the LRO (Lunar Reconnaissance Orbiter) image data.

1. Introduction
On 24 November 2020, China successfully launched the Chang’E-5 (CE-5) lunar probe by using the long March-5 heavy-lift carrier rocket. CE-5 is the third part of the Chinese Lunar Exploration Program [1], and it successfully realized the first sampling return of extraterrestrial objects in China.
On 14 December 2013, Chang’E-3 (CE-3), a follow-up to the Chang’E-1 (CE-1) and Chang’E-2 orbiters, successfully landed on Sinus Iridum, the northwest of Mare Imbrium on the lunar near side. It was the first time that China accomplished a soft landing on an extraterrestrial body, and the lunar rover, Yutu, was firstly deployed to operate on the Moon since 1973 [2,3]. Chang’E-4 (CE-4) was originally built as a backup of CE-3, and its configuration was adjusted to meet new scientific and performance objectives after CE-3 succeeded. Like its predecessor, CE-4 deployed a lander and a rover. However, the landing site was on the far side of the Moon. Before that, a communication relay satellite was launched into a halo orbit near the Earth–Moon L2 point for communication between lander/rover and ground stations [4]. As a sample return mission, CE-5 consists of four modules: lander, ascender, orbiter and returner. The orbiter/returner modules are responsible for the Earth–Moon transfer of the lunar sample. The lander, installed with a drill and a scooping device, is responsible for the soft landing with the ascender on top. After sampling, the ascender, with the samples in a container, was launched from the lunar surface and then operated in the lunar orbit until rendezvous and docking with the orbiter [5]. After transferring the samples to the orbiter, the ascender separated from it and fell down on the Moon to avoid becoming space debris.
The soft landing method adopted in the CE-5 mission is the same as that in CE-3 and CE-4. After Earth–Moon transfer, CE-5 was inserted into a circular orbit, and then the altitude of perilune was adjusted to 15 kilometers in order to prepare for landing. Compared with a few probes, which started landing directly after Earth–Moon transfer, the accuracy of the landing site and descent reliability are higher in CE-5 [6]. The soft landing process of CE-5 is mainly divided into five phases: the main deceleration phase, attitude adjusting phase, approaching phase, hovering and hazard avoidance phase, slow descent and landing phase [7,8]. In the hovering and hazard avoidance phase, the lander/ascender hovered at a height of about 100 meters, and the Landing Camera was used to find a safe site for landing. The process after launch from the lunar surface is mainly divided into four phases: the launch phase, vertical ascending phase, attitude adjustment phase and orbit insertion phase. Finally, the engine of the ascender was to shut down and prepare for docking with the orbiter.
Based on the successful experience of CE-3 and CE-4, the soft landing process of CE-5 went well by using an IMU (internal measurement unit) and a navigation camera. Launching from the lunar surface mainly depends on the initial position of the ascender, that is, the positioning result of the lander and ascender has a great influence on the launch phase [9,10].
Orbit determination (OD) is essential for a ground-based TT&C system in deep space exploration missions. In interplanetary transfer orbit or planets’ circular orbit, the force model of the spacecraft is relatively clear. Generally, the orbit determination is operated using the dynamic statistical orbit determination method. This dynamic method is also used in Mars EDL (entry, descent and landing) trajectory reconstruction [11,12,13]. During the process of power landing and lunar surface launching, the spacecraft performs a large number of orbital maneuvers in a short time, leading to a complex trajectory. It is hard to accurately model the forces generated by the maneuvers and solve the orbit by the dynamic method. The descent/ascent trajectory and landing site can be determined by the kinematic statistical orbit determination and the positioning method using B-spline or polynomial functions. Li et al. [14] used the kinematic orbit determination method to determine the trajectory of the free fall flight of CE-1. The position difference between the 5-degree polynomial orbit determination results and the dynamic orbit determination results is about 20 m, and the 9-minute prediction error of position is less than 150 m when the 9-minute OD arc was used. CE-1 performed a free fall impact on the Moon so that there was not a lot of maneuvers in the descent trajectory. The results show that the polynomial function can well describe CE-1’s free fall trajectory. Chang et al. [15] show that the method based on a B-spline function gives a higher precision result compared with that based on a polynomial function in the relatively smooth arc during the power descent trajectory of CE-3, and it is significantly better in the arc with frequent maneuvers. CE-4 is the first probe to make a soft landing on the far side of the Moon. Without ground-based radiometric data, Liu et al. [16] used the landing camera at the bottom of the lander and the navigation camera at the top of the rover to reconstruct the descent trajectory of CE-4. The difference between the lunar landing site and the LRO image data is about 415 m.
In this paper, the descent and ascent trajectories of CE-5 are determined by using ground-based radiometric data and the kinematic statistical orbit determination method. The trajectory determination method based on a B-spline function is mainly used to describe the soft landing and lunar launch process. The result of the lander positioning is also given, and it provided the key initial state for lunar surface launching.
2. Method and Model
2.1. Method
The kinematic statistical orbit determination method based on a B-spline function approximation describes the position of the probe at any time by a spline function. The expression of the B-spline function used in this paper is listed here, and the specific derivation process has been given by [17].
In Equation (1), is referenced in the lunar barycentric J2000 frame. is the parameter to be solved. is between 0 and the arc length. is the node between the data interval , and j belongs to (1, 2, 3, …, n). h, the step, is equal to , and P is the number of nodes, which is adjustable in the method. B represents a spline function. The form of B we adopted is listed in Equation (2).
In the process of orbit determination, the number of nodes, P, can be arbitrarily set. The larger the P selected, the more accurately the orbit can be reconstructed; however, more parameters need to be solved. In the case of limited observations, the correlation between the solving parameters makes a difference in the orbit solution.
The analysis of CE-3 shows that the orbit determination accuracy is the highest when 30 nodes are selected [15].
The kinematic statistical orbit determination method based on polynomial approximation is used to express the position of the probe at any time in a short arc with polynomial functions such as Equation (3).
The above formula can be derived from the power series solution of the equation of motion. indicates the initial position of the probe. and represent the initial velocity and acceleration, respectively. What is more, the coefficients of higher-order terms represent higher-order accelerations.
Whether the method is based on a B-spline function approximation or a polynomial approximation, the observation equation is in the form of Equation (4).
represents the observations and is the state of the probe. is the noise. After linearizing the observation equation, Equation (5) is used.
Here, . and represent the partial derivatives of position and velocity with respect to the estimated parameters . The forms of and are listed as follows:
Finally, the parameters can be estimated from Equation (5). The process is almost the same for a polynomial method, except for the function form.
The method based on a polynomial function is adoptable for a smoothly moving orbit with a short arc, such as the main deceleration phase during landing. For the whole descent and ascent process, it is more suitable to use the method based on a B-spline function, as it can achieve a better orbit accuracy on any shape curve of the orbit.
2.2. Measurement Model
In order to realize the real-time monitoring of the lander, the same three-way measurement system as CE-3 is adopted. That is, a ground station is used to transmit the uplink signal, which is transmitted coherently by the onboard transponder, and then the downlink signal is received by another station. At the same time, the Chinese very long baseline interferometry network (CVN) was also used to track CE-5. Time delay and delay rate are obtained by delta differential one-way ranging (ΔDOR) [18].
In the three-way measurement mode, the range and range rate between the probe and the station can be obtained by Equation (7).
and describe the propagation distance of uplink and downlink signals, respectively. They can be obtained from Equations (8) and (9).
and are the light time of uplink and downlink signals. represents the position vector of the probe at the time the signal is transmitting onboard. and represent the position vector of the station at the corresponding time. means error sources comprising of troposphere, ionosphere, relativity errors, etc. and describe the random noise.
The three-way range rate is obtained from Equation (10).
The above also means the apparent velocity of the probe. is the time differential variable, and represents the range between the probe and the station at the corresponding time.
The expressions of VLBI delay and delay rate are as follows.
The symbol c means light speed. and are the signal receiving time of the first and second stations, respectively. is the light time from the probe to the first station. and describe the probe’s position and velocity vectors, and represents that of the station.
All of the data types mentioned here can be expressed as the function of the probe’s state and can be processed with the method proposed in Section 2.1.
3. Results
After CE-5 was inserted into orbit around the Moon with an altitude of about 200 km, the lander and ascender modules were separated from the orbiter and returner modules. After that, the lander and ascender modules operated two-phase maneuvers to achieve the perilune of 15 km, where the start point of the descent trajectory was. At 14:57:18 (UTC) on 1 December 2020, the soft landing process began. About 14 min later, the lander/ascender successfully landed on the near side of the Moon in the northern Oceanus Procellarum, near Mons Rümker. After successfully sampling, the ascender lifted off at 15:10:21 (UTC) on 3 December 2020 and successfully arrived in lunar orbit about 7 min later.
3.1. Landing Trajectory Reconstruction
The landing trajectory of CE-5 is seriously crooked, especially in the approach phase and the hovering and obstacle avoidance phase. The kinematic statistical orbit determination method based on polynomial approximation is not suitable for the whole descent trajectory. In this section, the method based on a B-spline function approximation is adopted. For this purpose, 30, 40, 50, 60 and 70 nodes are selected, respectively. The residual RMSs of ranging, delay and delay rate after trajectory determination are shown in Table 1. It is obvious that the higher the number of nodes that are selected, the better the orbit can fit with the data. However, more parameters need to be solved. Sometimes, the correlation between the solving parameters will make orbit determination fail, which happened when the number of nodes was greater than 70.
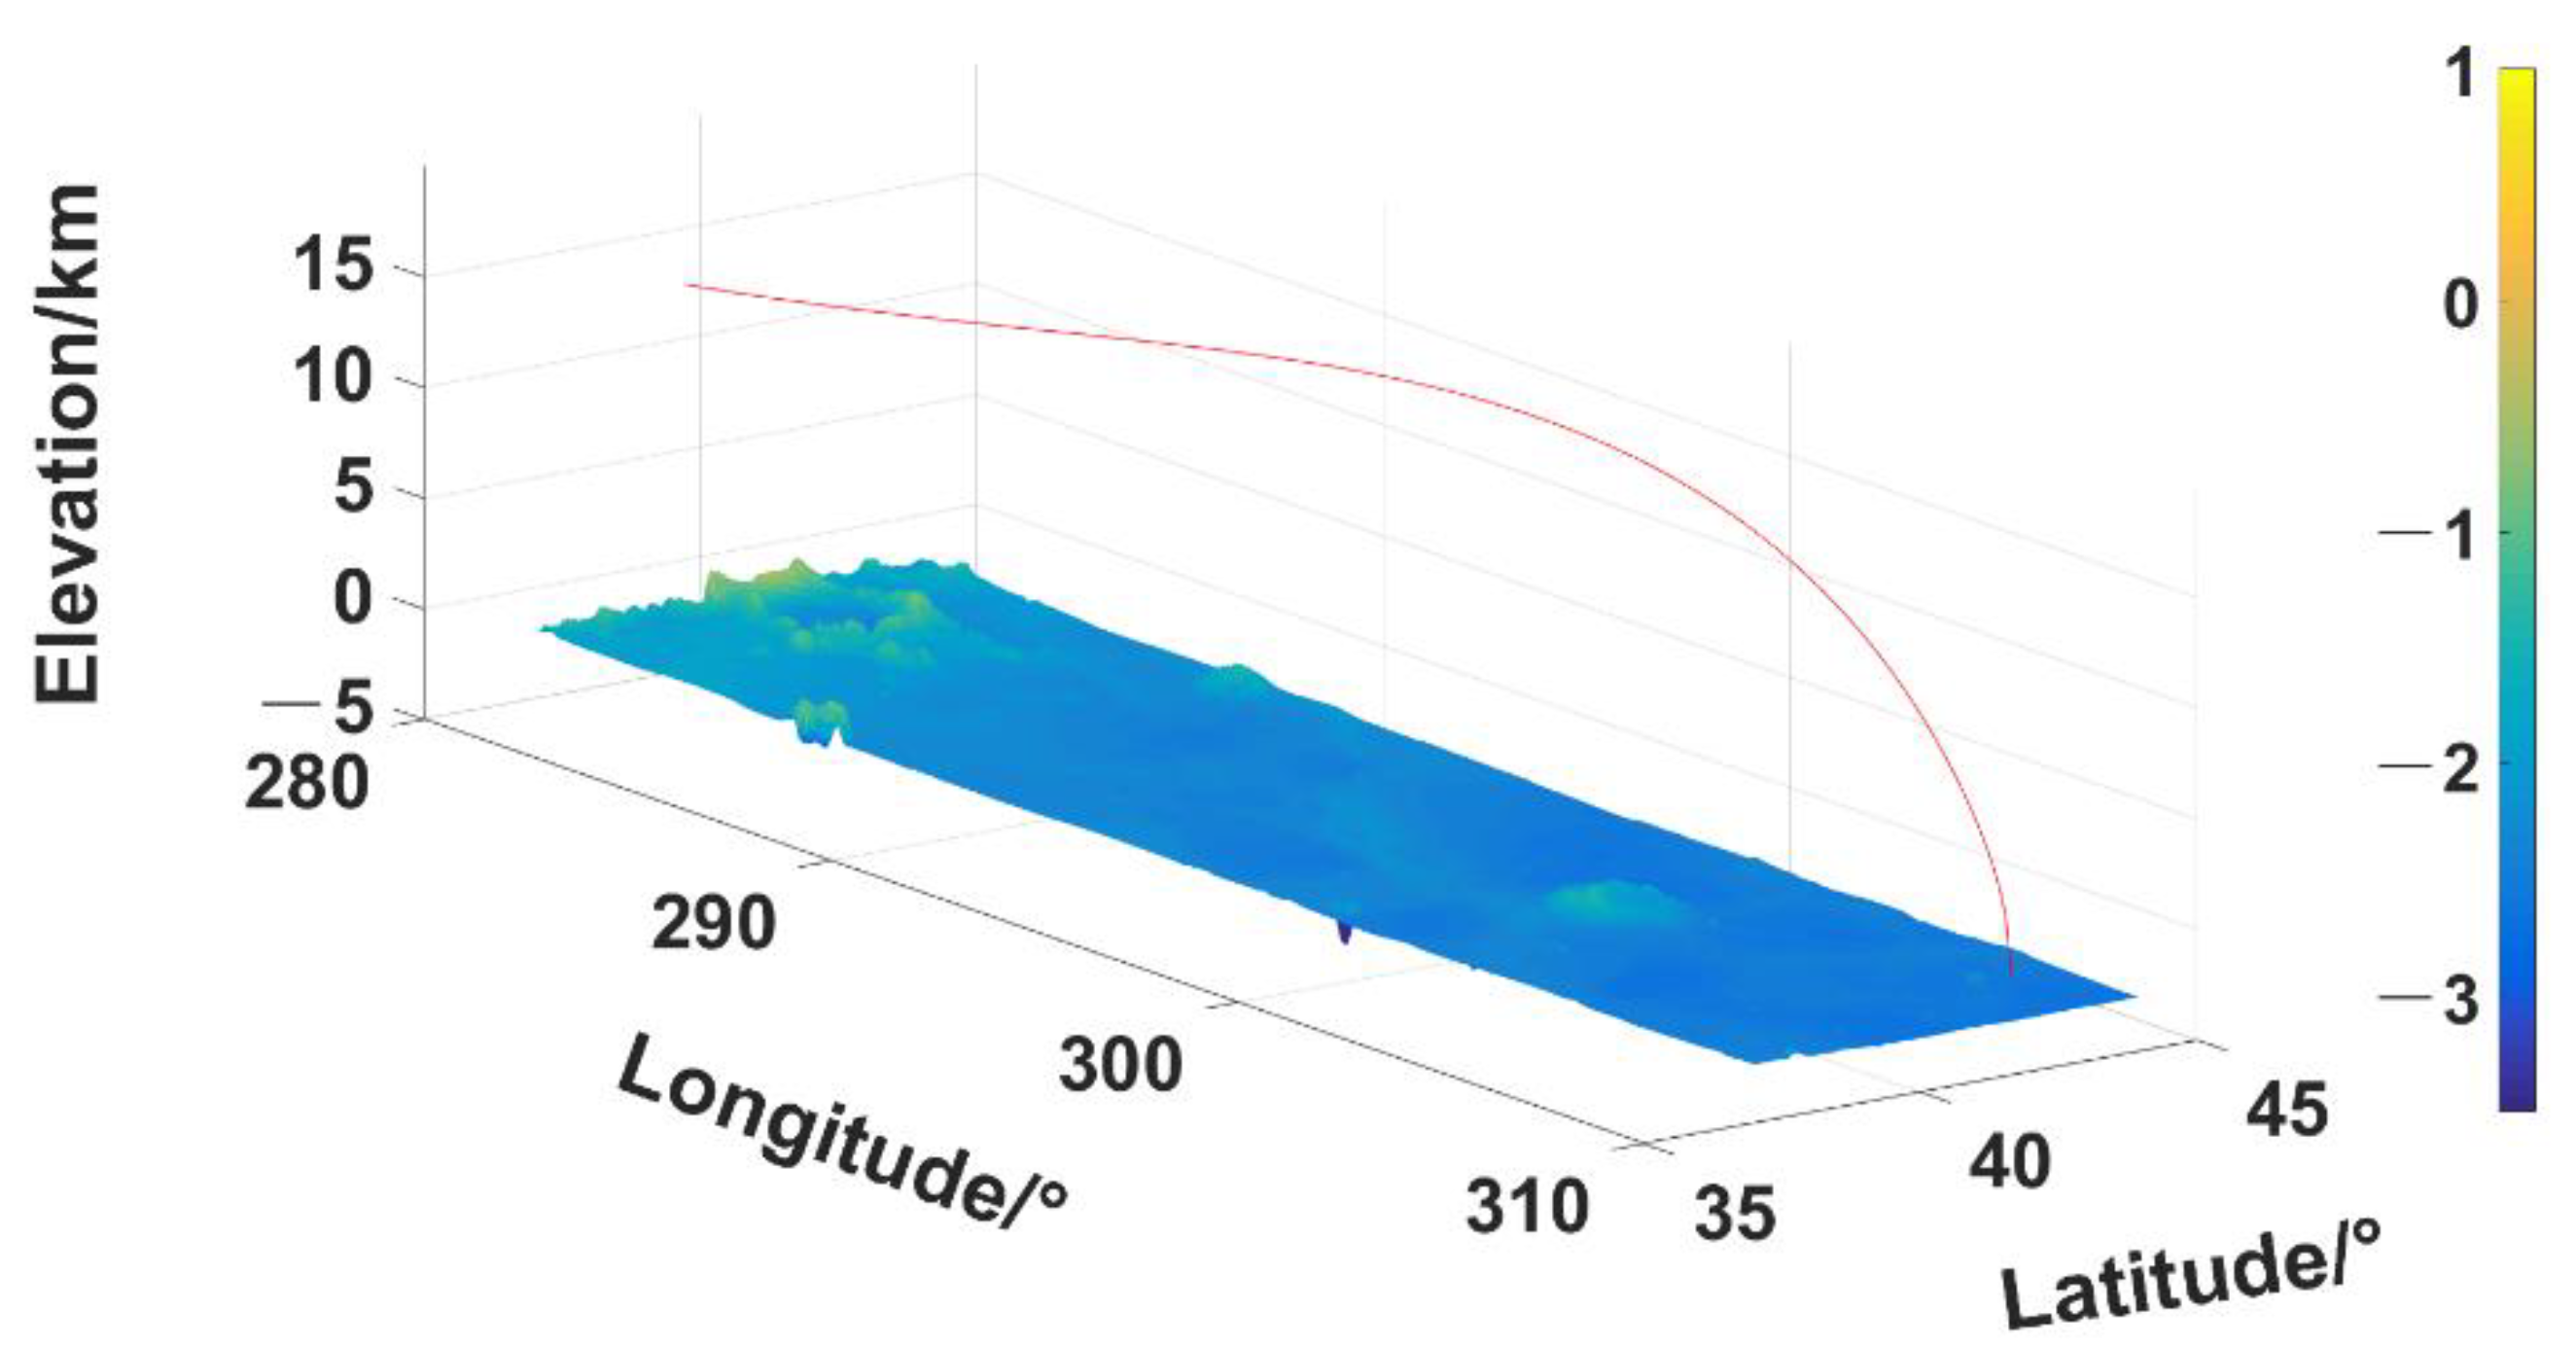
Figure 1 shows the residual plots under different node number settings. When the number of nodes is different, the residuals fluctuate between 15:07~15:09 and 15:10~15:11. The plot of ranging is particularly obvious. It can be inferred that the lander/ascender maneuvered frequently during these times, especially in the direction perpendicular to the line of sight because range data is not sensitive to the variation in that direction. In order to further confirm the conclusion, the trajectory solution under 60 nodes is visualized in Figure 2.
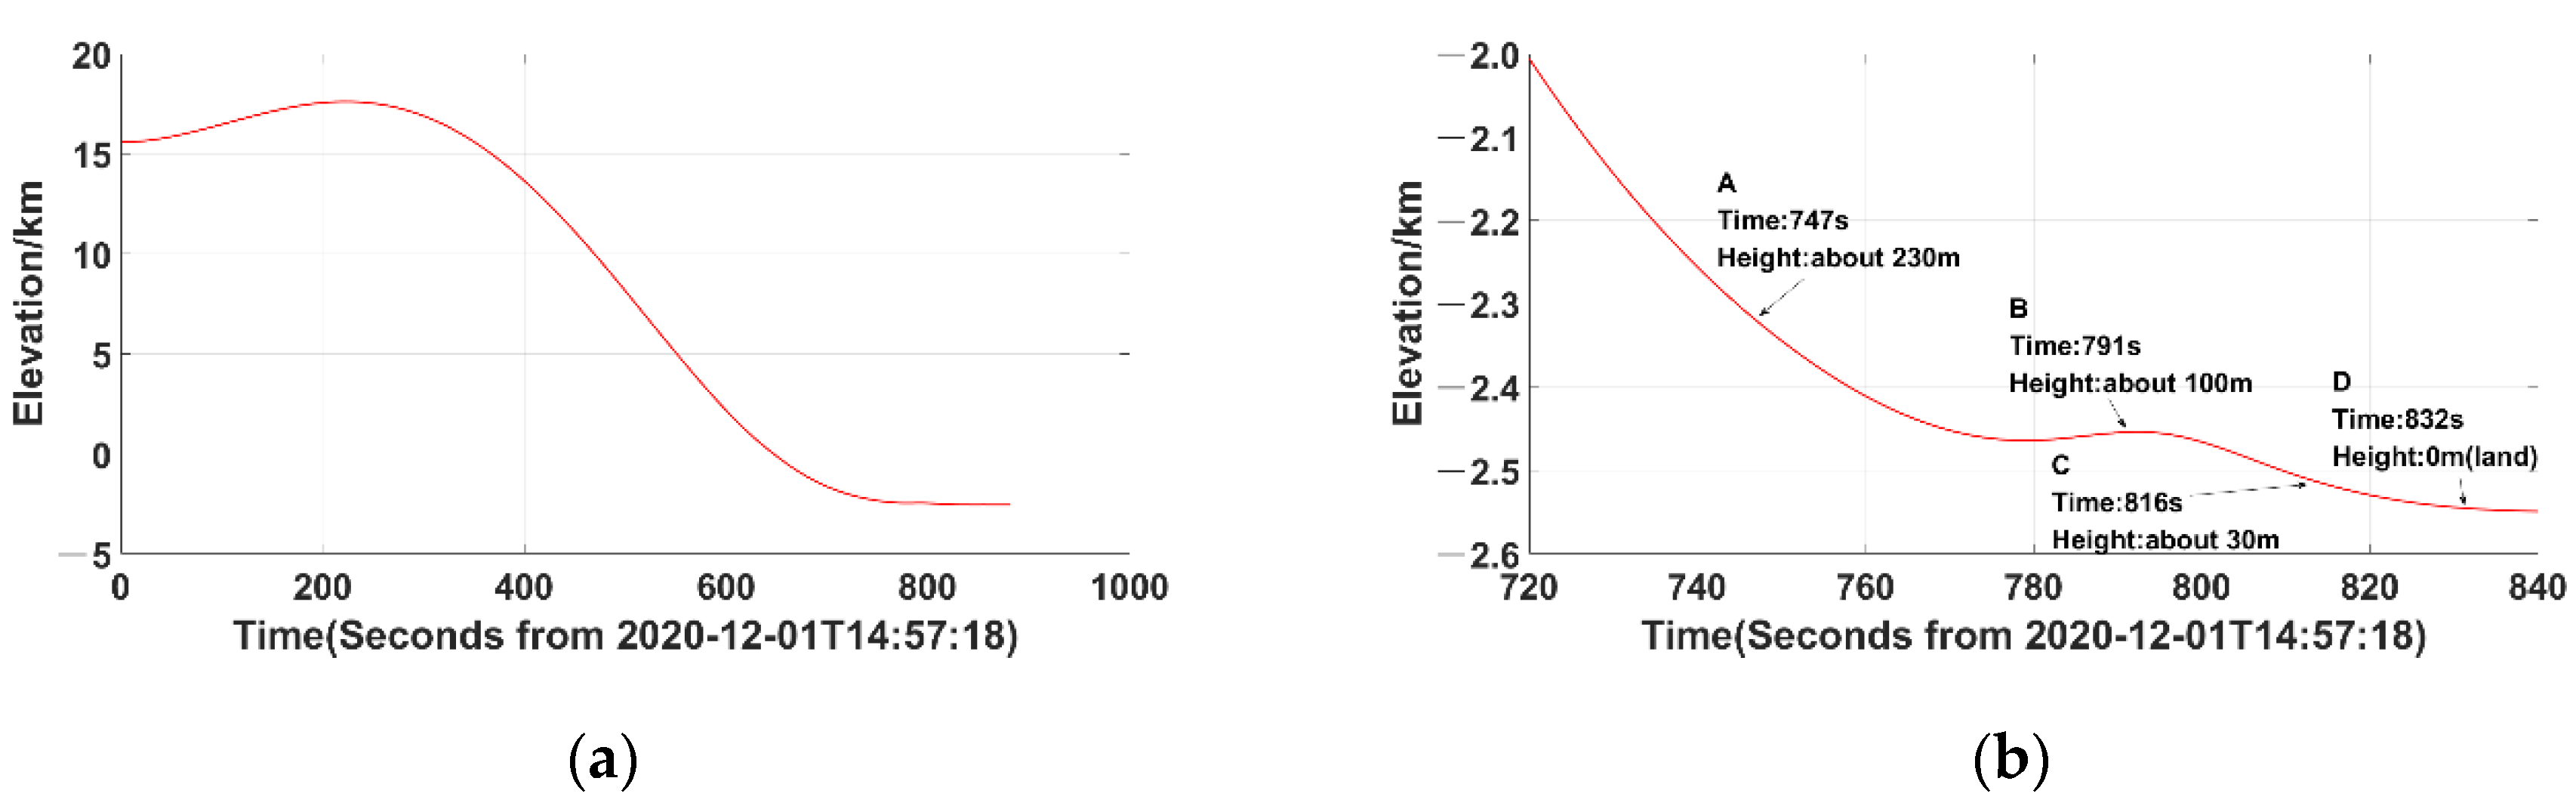
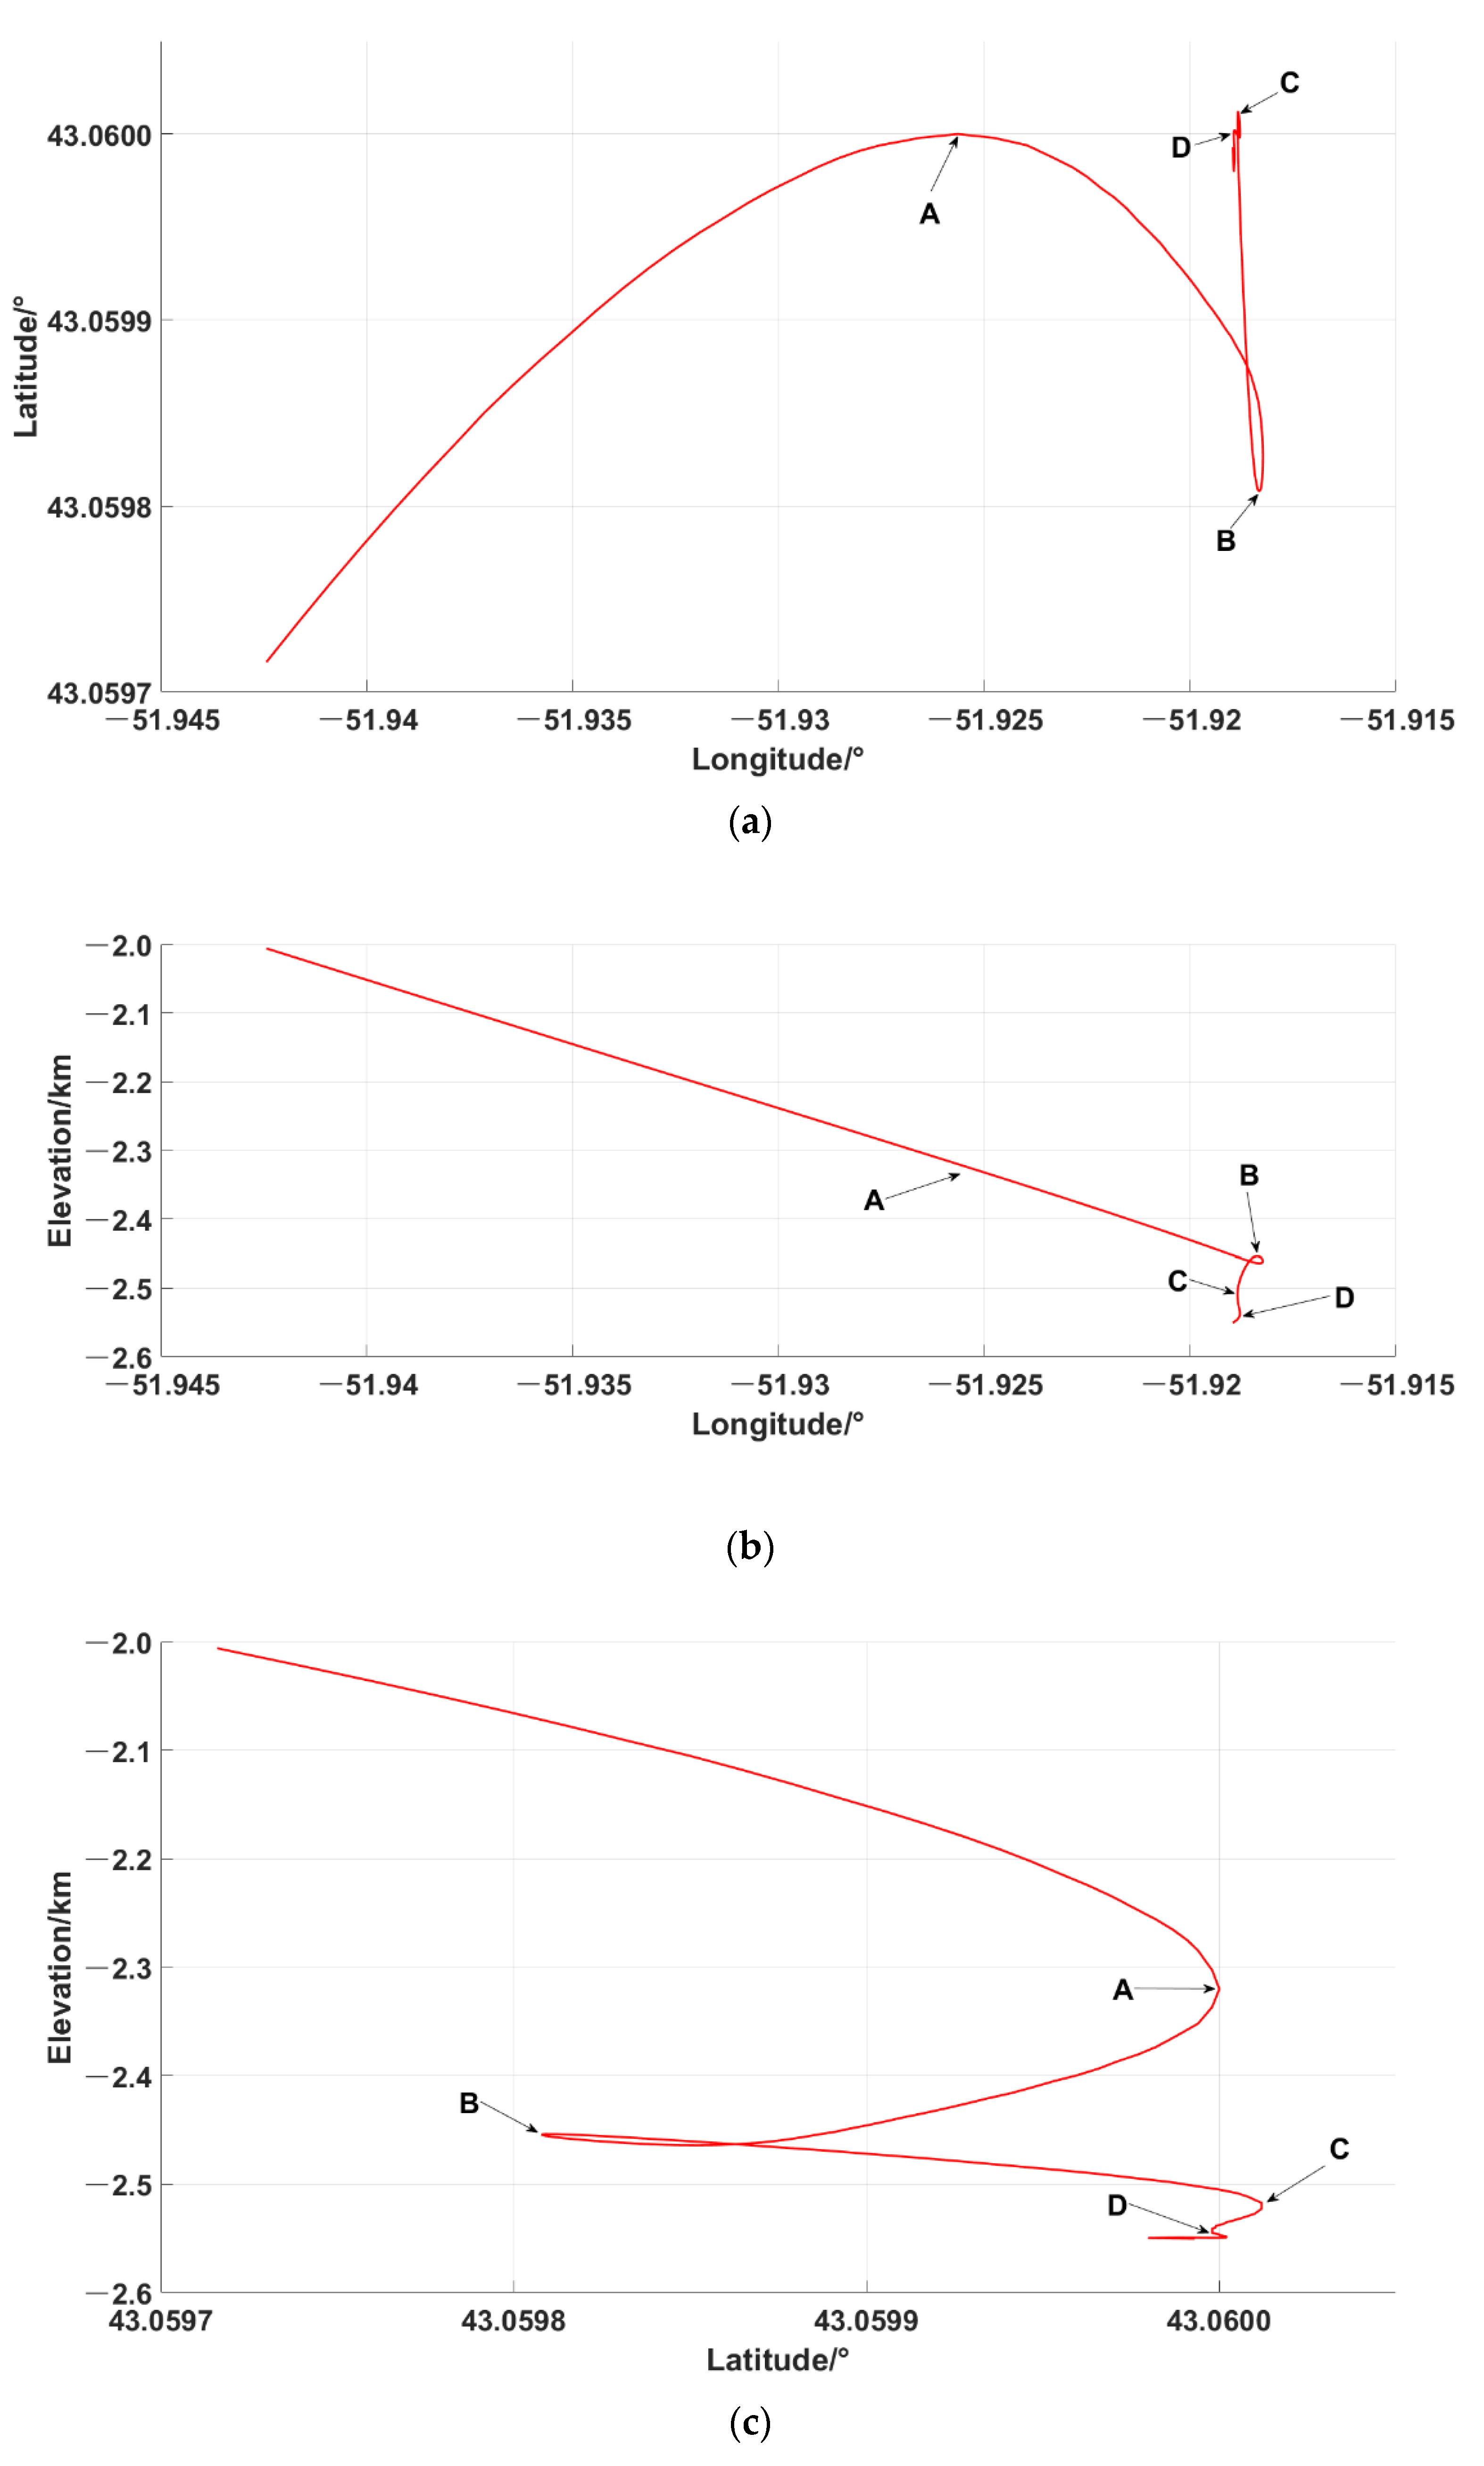
It can be seen that the overall terrain on the CE-5 flight path is relatively flat. In order to better display the trajectory of the approaching phase and the hovering and obstacle avoidance phase, the elevation–time plots are given in Figure 3 and the descent trajectory is projected onto three planes in Figure 4. The subplot (b) in Figure 3 apparently shows that the hovering and obstacle avoidance phase occurred at around point B, where the height of the lander/ascender was about 100 m. The descent trajectory of the lander/ascender with the elevation below −2 km is projected onto three planes in Figure 4. The subplots in Figure 4 show the descent trajectory projected onto the latitude–longitude plane, the elevation–longitude plane and the elevation–latitude plane, respectively. It is obvious that the lander/ascender descended to point A from west to east and then turned to descend to point B, which is to the southeast of point A. It also can be found that the hovering and obstacle avoidance phase occurred at around point B in Figure 4. Finally, the lander/ascender slowly descended from point C, where the height is about 30 m, to point D, which is on the lunar surface. The whole descent trajectory determined by the method adopted in this paper is consistent with the result that was revealed by photos taken by the landing camera.
In order to evaluate the applicability of the method based on a polynomial function, this function has also been adopted to determine the descent trajectory before point A, and the results are shown in Figure 3 and Figure 4. The difference of the results between the method based on a polynomial function and those based on a B-spline function (60 nodes) is shown in Table 2. The closer the lander/ascender is to the lunar surface, the rougher the trajectory is and the less accurate the result returned by the method based on polynomial functions. The position difference is of about 10 m and the velocity difference is less than 1 m/s in the first 640 s of descent trajectory between the methods based on a 5-degree polynomial and those based on a B-spline functions. However, the differences increased greatly if the arc length became longer in trajectory determination. The result based on a 6-degree polynomial function is less accurate than that of a 5-degree one because more parameters need to be solved in a 6-degree function, which means a stronger correlation exists.
We have also determined the real-time descent trajectory when the mission was taking place for data evaluating and probe tracking. The position and velocity differences between our real-time OD and post-processing OD are about 9 m and 0.28 m/s, respectively, as shown in Table 2.
3.2. Lander Positioning
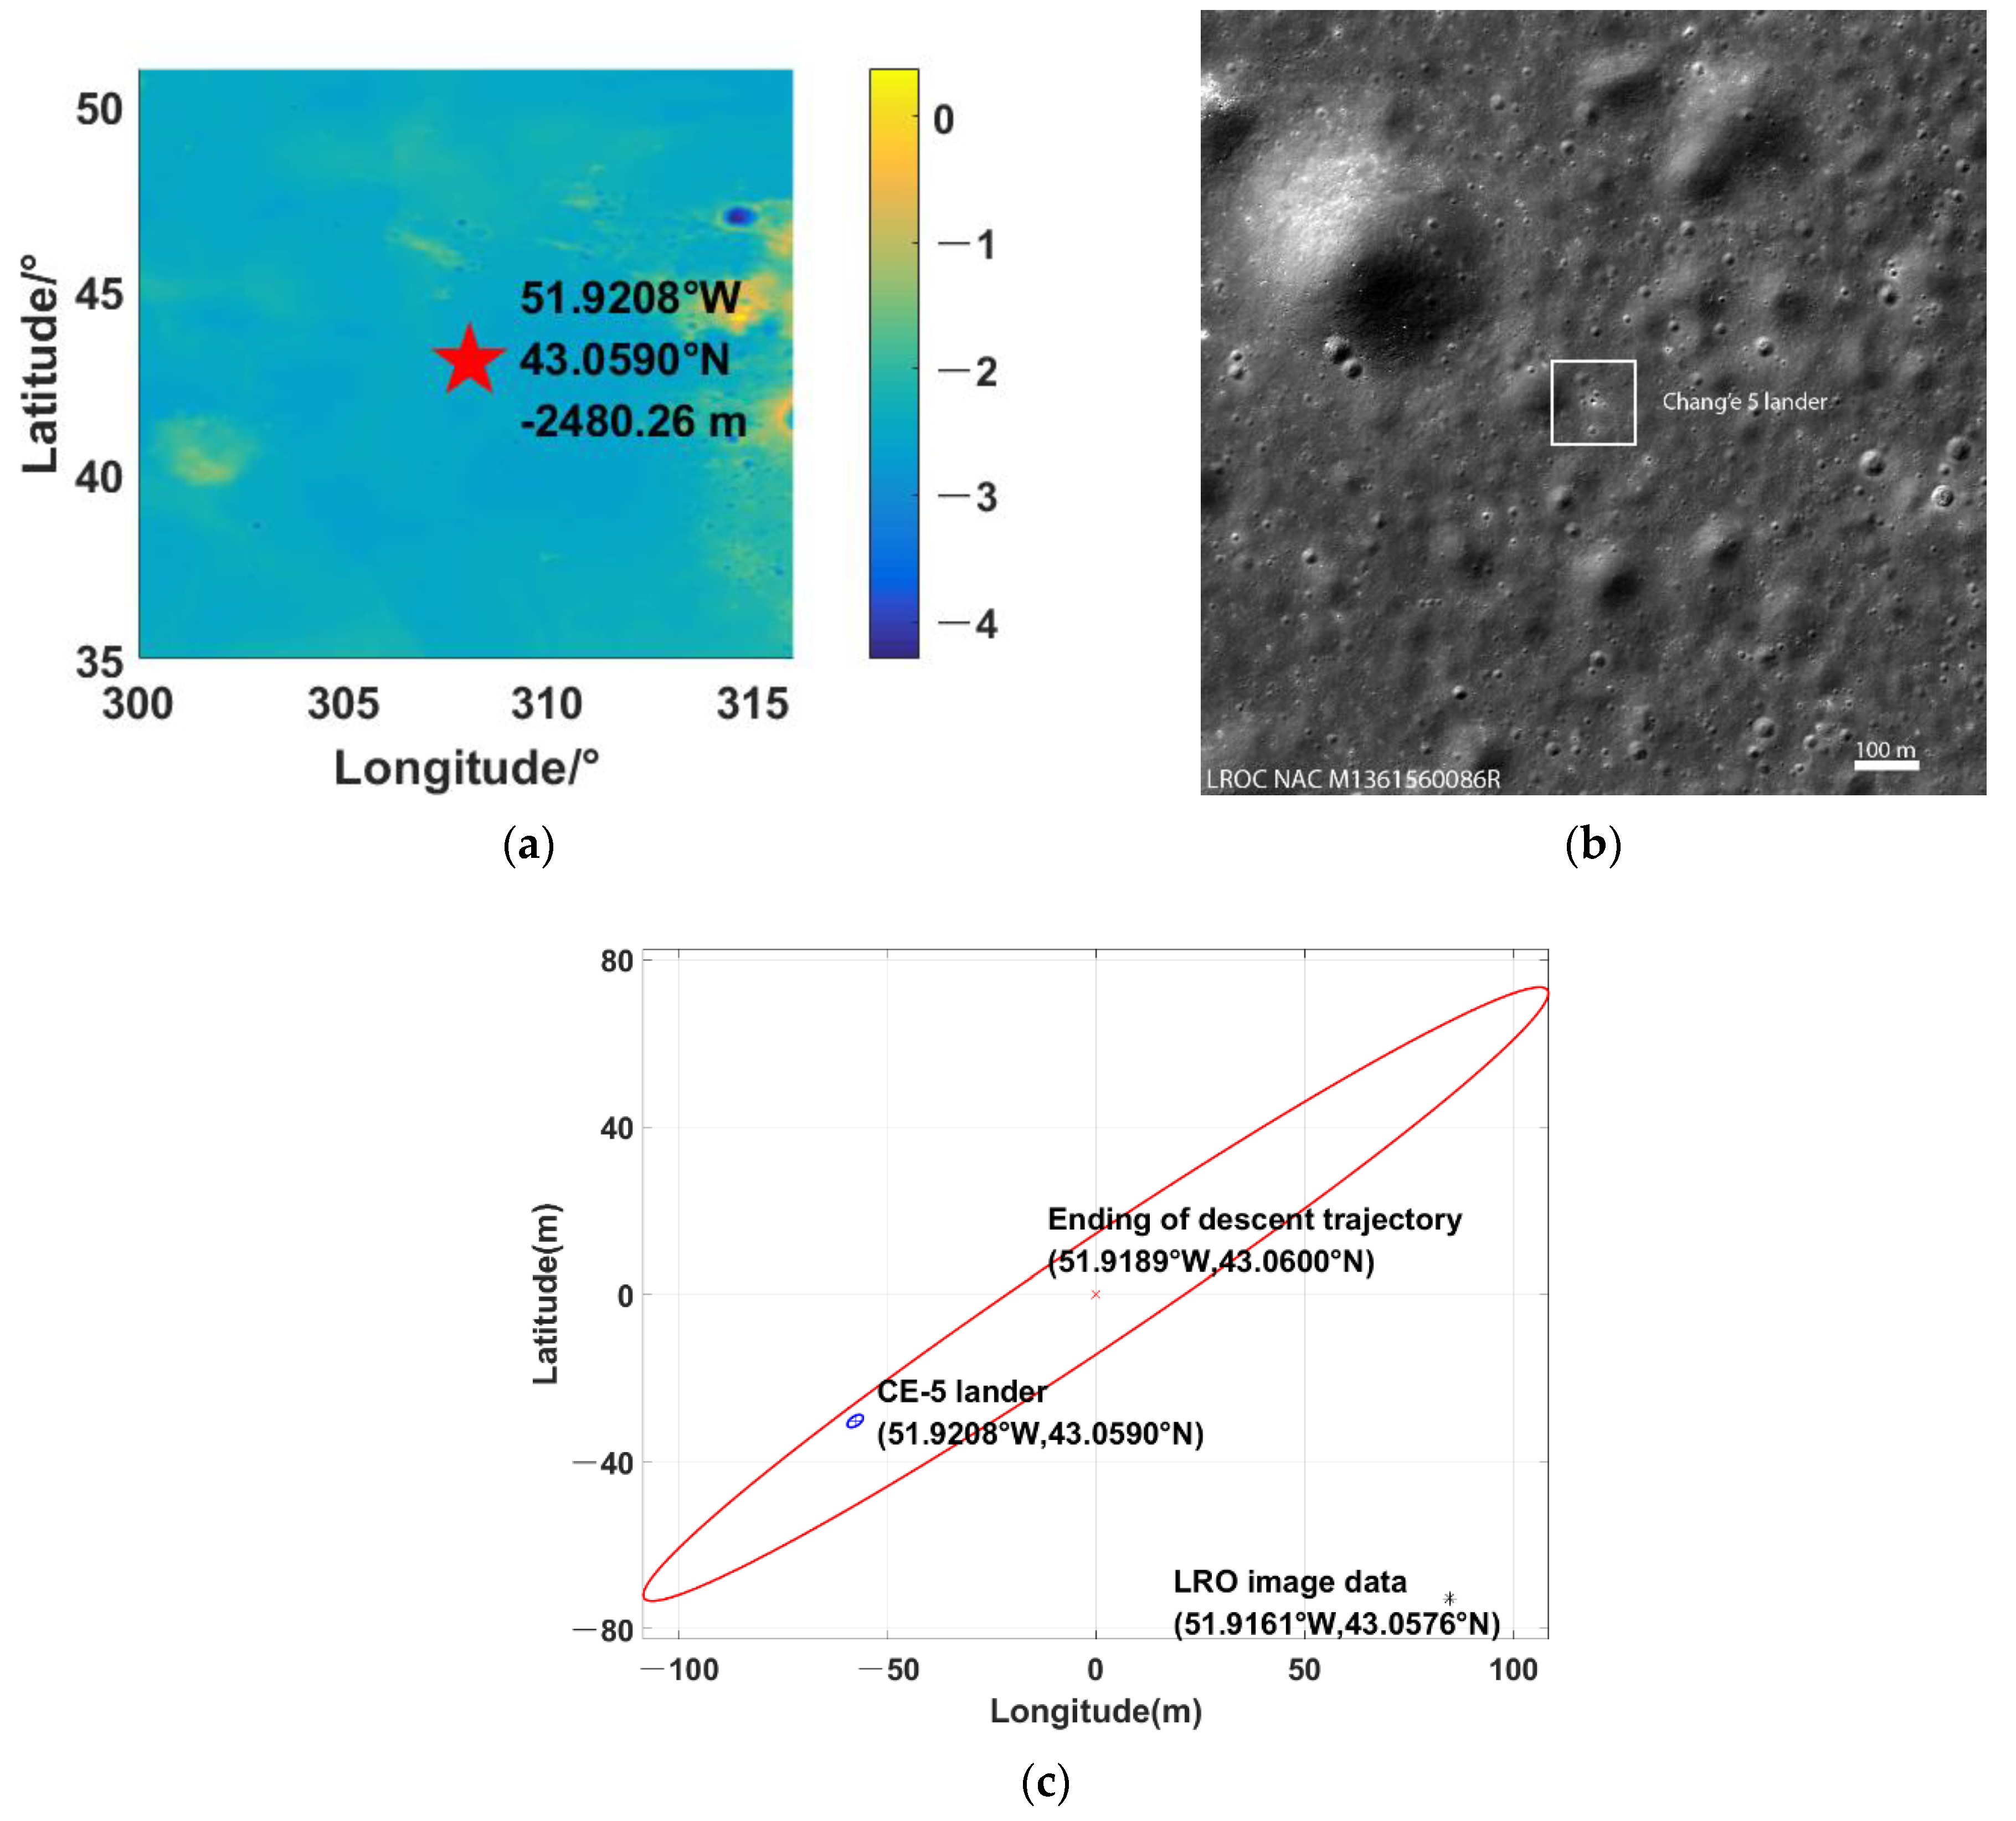
Reference [19] has investigated the application of the kinematic statistical positioning method in lunar lander positioning and it was successfully used to determine the position of the CE-3 lander. The difference between the positioning result and LRO image data is less than 50 meters [19,20]. We adopted this method to locate the CE-5 lander with radiometric data gained by ground stations. Image data can be also used to determine the position of the lander [16,21]. The data type includes two-way range, three-way range and VLBI delay and delay rate. The positioning results are shown in Figure 5 and Table 3, compared with LRO image data (http://lroc.sese.asu.edu/posts/1172,2020-12-04, accessed on 1 September 2021). Subplots (a) and (c) in Figure 5 show the lander positioning result and corresponding error ellipse. The error ellipse was derived from the covariance matrix, just taking account of the influence of orbit error. The actual landing site is 43.0590°N, 51.9208°W with an elevation of −2480.26 m. The uncertainties (1 sigma) are 2.14 m, 1.14 m and 2.55 m, respectively. The ending point in descent trajectory solved in Section 3.1 is 43.0600°N, 51.9189°W with an elevation of −2546.46 m, and the uncertainties (1 sigma) are 130.32 m, 11.97 m and 584.06 m, respectively. The difference between lander positioning and the photo result taken by LRO is about 173.69 m. The ending site of the descent trajectory determined in Section 3.1 is about 114.28 m apart from LRO image data, which verifies the validity of our result in descent trajectory determination.
3.3. Ascending Trajectory Reconstruction
The calculation results show that the method based on a polynomial function cannot fit the whole ascent trajectory. The method based on a B-spline function is also used in this section to determine the ascent trajectory of the CE-5 ascender. The ascending process took less time than the descending one. To determine the ascent trajectory, 25, 30, 35 and 40 nodes are selected, respectively. The residual RMSs of each data used are shown in Table 4. Due to the limited number of observations, there is a strong correlation between the parameters needing to be solved when more than 40 nodes are selected. Similar to Figure 2, Figure 6 shows the ascending trajectory of CE-5 under 30 nodes. Finally, the elevation achieved by the ascender is about 15 km (Lunar radius is 1737.4 km).
Similarly, a polynomial function is used to fit the smoother ascent trajectory, and the results are compared with those determined from the method based on a B-spline function under 30 nodes. The differences are shown in Table 5. In the first and final 60 s of the ascent trajectory, the position difference is only tens of meters, while it increases to hundreds of meters and even several kilometers as the arc length becomes longer in the polynomial method. The position and velocity differences between the post-processing OD and real-time OD (with 15 nodes selected) are also shown in Table 5, which are about 276 m and 18 m/s, respectively.
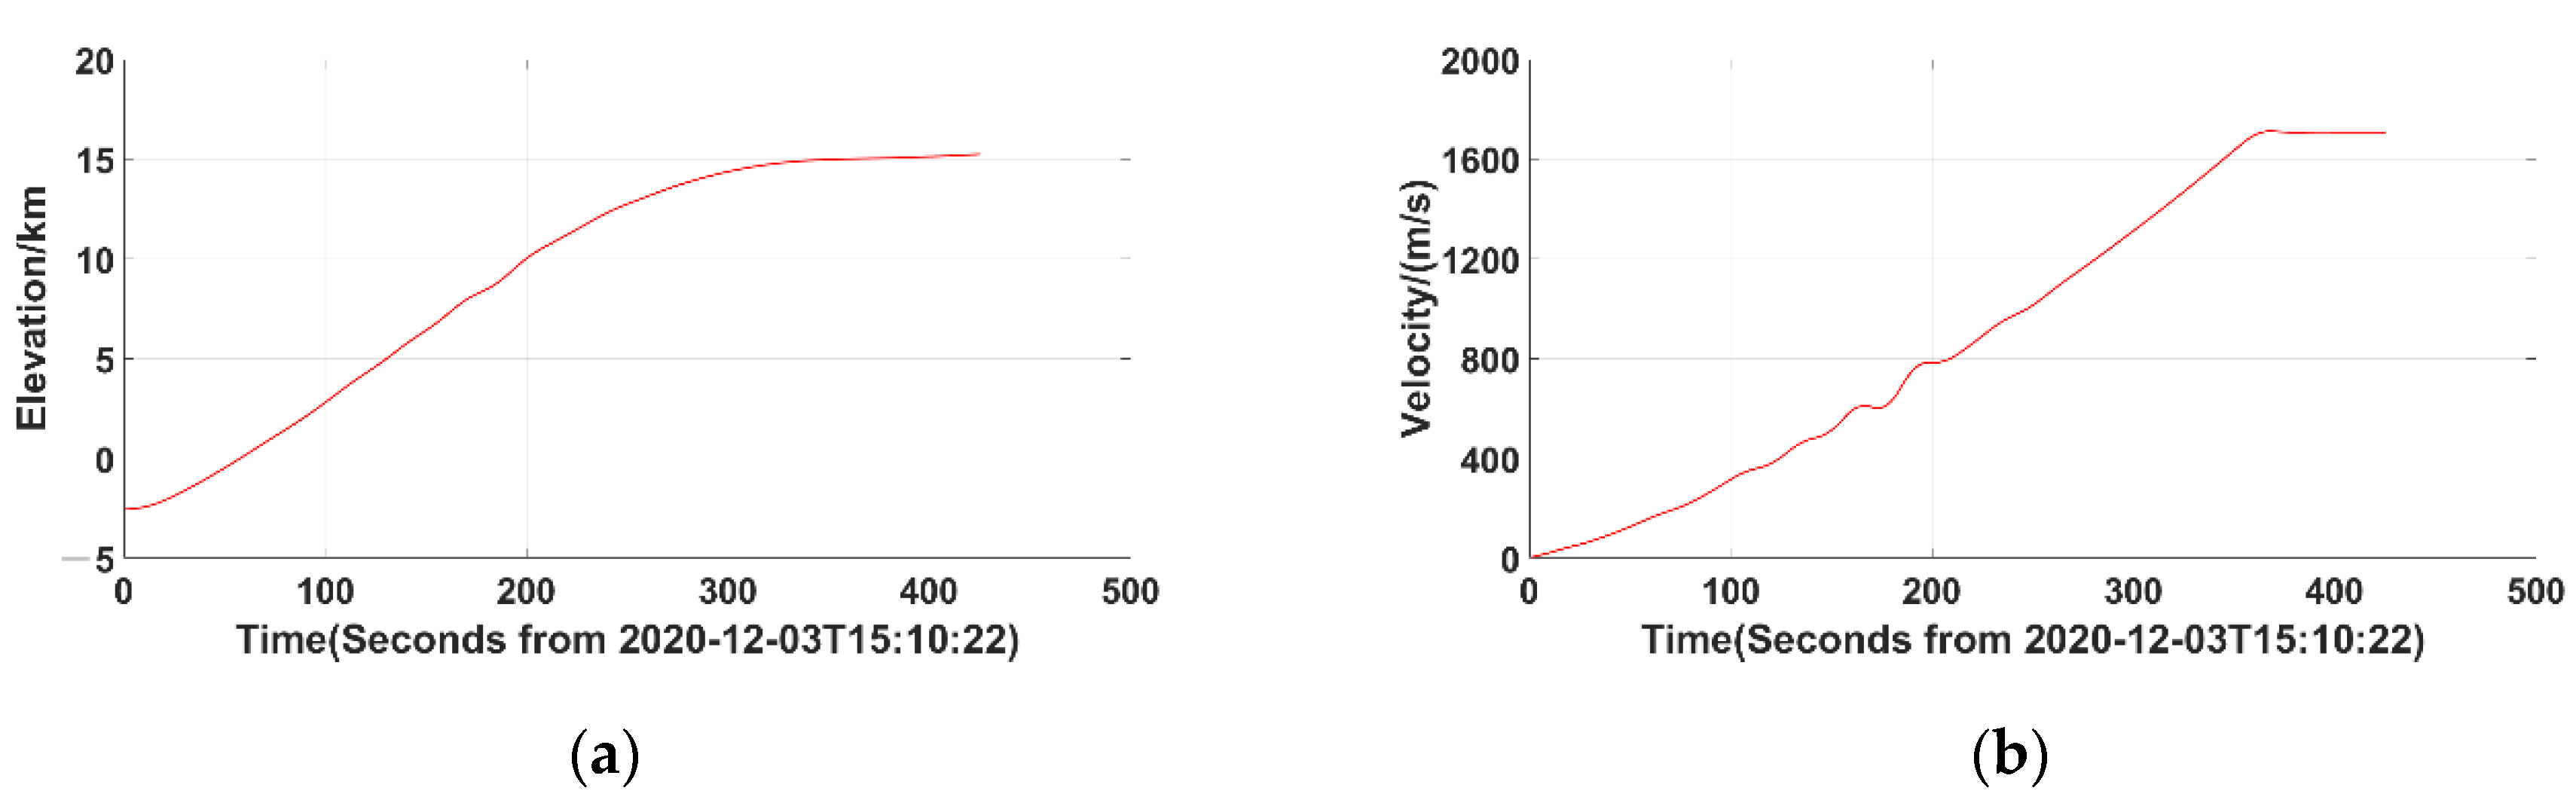
The elevation–time plots are given again in subplot (a) of Figure 7. Subplot (b) in Figure 7 illustrates the velocity of the ascender during the ascent trajectory. The velocity of the ascender fluctuated from 150 s to 200 s. This reveals that the ascender existed some maneuvers, such as attitude adjustment. Finally, the ascender’s velocity reached about 1700 m/s as the engine turned off. Reference [22] obtained the ascent trajectory using the data produced by the GNC (guidance, navigation and control) system onboard. Our result is consistent with that in reference [22].
4. Conclusions
Sampling and return of extraterrestrial objects are CE-5’s main task. Descent and ascent trajectory determination using radiometric data reveals the phases that the lander and ascender experienced. Lander positioning provides initial states for the autonomous control during the lunar launch phase, and the positioning accuracy has an important impact on the subsequent phases.
In this paper, the descent and ascent trajectories are determined by the method based on a B-spline function and a polynomial function. The results clearly reveal different phases during descent and ascent. The results show that the method based on a polynomial function is only suitable for the smooth trajectory sample with a short arc length. The method based on a B-spline function can be adopted when the trajectory is complex. The result of CE-5 lander positioning is 43.0590°N, 51.9280°W with an elevation of −2480.26 m. The lander position we obtained by the kinematic statistical positioning method is less than 200 m away from the result obtained from the photos taken by LRO.
Author Contributions
Conceptualization, Y.H. and P.Y.; methodology, Y.H., P.Y. and P.L.; software, Y.H.; validation, Y.H., P.Y., P.L., S.L. and Q.S.; formal analysis, P.Y.; investigation, P.Y. and Y.H.; data curation, Y.H. and W.Z.; writing—original draft preparation, P.Y.; writing—review and editing, P.Y., Y.H., P.L., S.L., Q.S. and W.Z. All authors have read and agreed to the published version of the manuscript.
Funding
This work was supported by the National Natural Science Foundation of China (Grant no. U1931119), the National Key R&D Program of China (Grant no. 2020YFC2200903), the National Key Laboratory of Aerospace Flight Dynamics and the Planetary Sciences Laboratory of Chinese Academy of Sciences.
Data Availability Statement
Not applicable.
Acknowledgments
The author would like to thank the Chinese VLBI Network and the Beijing Aerospace Flight Control Center for providing tracking data.
Conflicts of Interest
The authors declare no conflict of interest.
References
- Li, C.L.; Liu, J.J.; Zuo, W.; Sun, Y.; Ouyang, Z.Y. Progress of China’s Lunar Exploration (2011–2020). Chin. J. Space Sci. 2021, 41, 68–75. [Google Scholar] [CrossRef]
- Karachevtseva, I.P.; Kokhanov, A.A.; Kozlova, N.A.; Rodionova, Z.F. Cartography of the Soviet Lunokhods’ Routes on the Moon. In Planetary Cartography and GIS; Hargitai, H., Ed.; Springer: Cham, Switzerland, 2019; pp. 263–278. [Google Scholar] [CrossRef]
- Yu, P.; Zhang, H.H.; Li, J.; Guan, Y.F.; Wang, L.; Zhao, Y.; Chen, Y.; Yang, W.; Yu, J.; Wang, H.Q.; et al. Design and implementation of GNC system of lander and ascender module of Chang’e-5 spacecraft. Sci. Sin. Tech. 2021, 51, 763–777. [Google Scholar] [CrossRef]
- Qin, S.H.; Huang, Y.; Li, P.J.; Shan, Q.; Fan, M.; Hu, X.G.; Wang, G.L. Orbit and tracking data evaluation of Chang’E-4 relay satellite. Adv. Space Res. 2019, 64, 836–846. [Google Scholar] [CrossRef]
- Xu, Y.; Ma, L.; Liu, T.; Yu, D.; Hu, J.C.; Zheng, Y.J.; Li, Y.; Qiao, D.Z.; Wang, Y. Chang’e-5 guidance navigation and control system for rendezvous and docking in lunar orbit. Sci. Sin. Tech. 2021, 51, 788–798. [Google Scholar] [CrossRef]
- Sun, Z.Z.; Zhang, H.; Wu, X.Y.; Ma, J.N. Mission Analysis of a Lunar Soft Lander. Spacecr. Eng. 2021, 19, 12–16. [Google Scholar]
- Ren, D.P.; Li, Q.; Liu, Z.C.; Zhang, X.H. Research on the ground test technology of lunar landing and ascending. J. Deep Space Explor. 2018, 5, 281–285, 298. [Google Scholar]
- Klumpp, A.R. Apollo Lunar Descent Guidance. Automatica 1974, 10, 133–146. [Google Scholar] [CrossRef]
- Song, M.; Yuan, Y.B. Autonomous Integrated Navigation for Lunar Soft Landing. Geomat. Inf. Sci. Wuhan Univ. 2010, 35, 1013–1016. [Google Scholar]
- Li, M.D. Study the Guidance, Autonomous Navigation and Control of Lunar Soft Landing. Ph.D. Thesis, Harbin Institute of Technology, Harbin, China, 2011. [Google Scholar]
- Blanchard, R.C.; Desai, P.N. Mars Phoenix Entry, Descent, and Landing Trajectory and Atmosphere Reconstruction. J. Spacecr. Rocket. 2011, 48, 809–821. [Google Scholar] [CrossRef]
- Dutta, S.; Braun, R.D. Statistical Entry, Descent, and Landing Trajectory Reconstruction of the Mars Science Laboratory. J. Spacecr. Rocket. 2014, 51, 1048–1061. [Google Scholar] [CrossRef]
- Karlgaard, C.D.; Korzun, A.M.; Schoenenberger, M.; Bonfiglio, E.P.; Kass, D.M.; Grover, M.R. Mars Insight Entry, Descent, and Landing Trajectory and Atmosphere Reconstruction. J. Spacecr. Rocket. 2021, 58, 865–878. [Google Scholar] [CrossRef]
- Li, P.J.; Hu, X.G.; Huang, Y.; Cao, J.F. Kinematic Statistical Method Using in the Orbit Determination of CE-1. Prog. Astron. 2010, 28, 290–300. [Google Scholar]
- Chang, S.Q.; Huang, Y.; Song, Y.Z.; Li, P.J.; Hu, X.G. On trajectory determination strategy for soft landing of CE-3 on the moon. J. Spacecr. TTC Technol. 2014, 33, 236–243. [Google Scholar]
- Liu, J.J.; Ren, X.; Yan, W.; Li, C.L.; Zhang, H.; Jia, Y.; Zeng, X.G.; Chen, W.L.; Gao, X.Y.; Liu, D.W.; et al. Descent trajectory reconstruction and landing site positioning of Chang’E-4 on the lunar farside. Nat. Commun. 2019, 10, 4229–4238. [Google Scholar] [CrossRef] [PubMed] [Green Version]
- Song, Y.Z.; Huang, Y.; Hu, X.G.; Li, P.J.; Cao, J.F. Spacecraft Orbit Determination with B Spline Approximation method. Acta Astron. Sin. 2013, 54, 370–381. [Google Scholar]
- Wu, W.R.; Wang, G.L.; Jie, D.G.; Zhang, X.Z.; Jiang, D.R. High-accuracy VLBI technique using ∆DOR signals. Sci. Sin. Inform. 2013, 43, 185–196. [Google Scholar]
- Huang, Y.; Hu, X.G.; Li, P.J.; Gao, J.F.; Jiang, D.R.; Zheng, W.M.; Fan, M. Precise positioning of the Chang’E-3 lunar lander using a kinematic statistical method. Chin. Sci. Bull. 2012, 57, 4545–4551. [Google Scholar] [CrossRef] [Green Version]
- Huang, Y.; Chang, S.Q.; Li, P.J.; Hu, X.G.; Wang, G.L.; Liu, Q.H.; Zheng, W.M.; Fan, M. Orbit determination of Chang’E-3 and positioning of the lander and the rover. Chin. Sci. Bull. 2014, 59, 3858–3867. [Google Scholar] [CrossRef]
- Wan, W.; Yu, T.; Di, K.; Wang, J.; Liu, Z.; Li, L.; Liu, B.; Wang, Y.; Peng, M.; Bo, Z.; et al. Visual Localization of the Tianwen-1 Lander Using Orbital, Descent and Rover Images. Remote Sens. 2021, 13, 3439. [Google Scholar] [CrossRef]
- Zhang, H.H.; Li, J.; Yu, P.; Guan, Y.F.; Wang, L.; Wang, Z.W.; Zhang, X.W.; Yu, J.; Wang, H.Q.; Yang, W.; et al. Guidance navigation and control technology for the lunar ascent vehicle of the Chang’e-5 mission. Sci. Sin. Technol. 2021, 51, 921–937. [Google Scholar] [CrossRef]
Figure 1.
Residual plots by selecting different nodes in the method based on B-spline function during decent: (a) 30 nodes were selected; (b) 40 nodes were selected; (c) 50 nodes were selected; (d) 60 nodes were selected.
Figure 1.
Residual plots by selecting different nodes in the method based on B-spline function during decent: (a) 30 nodes were selected; (b) 40 nodes were selected; (c) 50 nodes were selected; (d) 60 nodes were selected.

Figure 2.
Descent trajectory of CE-5.

Figure 3.
Elevation–time plots in CE-5’s descent trajectory: (a) shows that in the whole descent trajectory; (b) shows that between 720 s to 840 s after descent has started.
Figure 3.
Elevation–time plots in CE-5’s descent trajectory: (a) shows that in the whole descent trajectory; (b) shows that between 720 s to 840 s after descent has started.

Figure 4.
Descent trajectory of CE-5 is projected to three planes when elevation is under −2 km: (a) shows the descent trajectory on latitude–longitude plane, (b) shows that on elevation–longitude plane; (c) shows that on elevation–latitude plane.
Figure 4.
Descent trajectory of CE-5 is projected to three planes when elevation is under −2 km: (a) shows the descent trajectory on latitude–longitude plane, (b) shows that on elevation–longitude plane; (c) shows that on elevation–latitude plane.

Figure 5.
Landing positioning results: (a) our landing positioning result; (b) CE-5 lander taken by LRO; (c) landing error ellipse and error ellipse of ending point in descent trajectory.
Figure 5.
Landing positioning results: (a) our landing positioning result; (b) CE-5 lander taken by LRO; (c) landing error ellipse and error ellipse of ending point in descent trajectory.

Figure 6.
Ascent trajectory of CE-5.

Figure 7.
Elevation–time and velocity–time plots in CE-5’s ascent trajectory: (a) shows elevation–time plot; (b) shows velocity–time plot.
Figure 7.
Elevation–time and velocity–time plots in CE-5’s ascent trajectory: (a) shows elevation–time plot; (b) shows velocity–time plot.


Table 1.
Residual RMSs of ranging, delay and delay rate by selecting different nodes in the method based on B-spline function during decent.
Table 1.
Residual RMSs of ranging, delay and delay rate by selecting different nodes in the method based on B-spline function during decent.
| Node Number | Residual RMSs | ||
|---|---|---|---|
| Three-Way Ranging (m) | Delay (ns) | Delay Rate (ps/s) | |
| 30 nodes | 0.34 | 0.31 | 0.40 |
| 40 nodes | 0.38 | 0.27 | 0.37 |
| 50 nodes | 0.35 | 0.28 | 0.30 |
| 60 nodes | 0.31 | 0.28 | 0.27 |
| 70 nodes | 0.34 | 0.31 | 0.40 |
Table 2.
Descent trajectory difference between the methods based on polynomial functions and B-spline function with 60 nodes.
Table 2.
Descent trajectory difference between the methods based on polynomial functions and B-spline function with 60 nodes.
| Item | Position Difference/m | Velocity Difference/(m/s) | |||||||
|---|---|---|---|---|---|---|---|---|---|
| R | T | N | Total | R | T | N | Total | ||
| Method based on polynomial functions | 5-degree (first 640 s) | 6.99 | 5.85 | 4.57 | 10.19 | 0.27 | 0.29 | 0.18 | 0.44 |
| 5-degree (first 720 s) | 245.42 | 559.84 | 194.83 | 641.57 | 2.49 | 27.39 | 4.43 | 27.86 | |
| 6-degree (first 720 s) | 583.46 | 567.42 | 419.76 | 915.74 | 10.77 | 16.36 | 6.76 | 20.72 | |
| Real-time OD (30 nodes) | 7.06 | 4.93 | 2.90 | 9.09 | 0.15 | 0.22 | 0.08 | 0.28 | |
Table 3.
Positioning result of CE-5 lander comparing with LRO and descent trajectory.
| Determined | Difference to the Result of LRO/m | ||||||
|---|---|---|---|---|---|---|---|
| Lon/deg | Lat/deg | Ele/m | Lon/m | Lat/m | Ele/m | Total/m | |
| LRO | −51.9161 | 43.0576 | −2570 | -- | -- | -- | -- |
| Lander positioning | −51.9208 | 43.0590 | −2480.26 | −142.52 | 42.45 | 89.74 | 173.69 |
| Ending site of descent trajectory | −51.9189 | 43.0600 | −2546.46 | −84.91 | 72.78 | 23.54 | 114.28 |
Table 4.
Residual RMSs of ranging, delay and delay rate by selecting different nodes in the method based on B-spline function during ascent.
Table 4.
Residual RMSs of ranging, delay and delay rate by selecting different nodes in the method based on B-spline function during ascent.
| Node Number | Residual RMSs | ||
|---|---|---|---|
| Two-Way Ranging (m) | Delay (ns) | Delay Rate (ps/s) | |
| 25 nodes | 1.92 | 0.46 | 0.33 |
| 30 nodes | 0.86 | 0.22 | 0.23 |
| 35 nodes | 0.59 | 0.15 | 0.20 |
| 40 nodes | 0.89 | 0.23 | 0.17 |
Table 5.
Ascent trajectory difference between the method based on polynomial functions and B-spline function with 30 nodes.
Table 5.
Ascent trajectory difference between the method based on polynomial functions and B-spline function with 30 nodes.
| Item | Position Difference/m | Velocity Difference/(m/s) | |||||||
|---|---|---|---|---|---|---|---|---|---|
| R | T | N | Total | R | T | N | Total | ||
| Method based on polynomial functions | 6-degree (first 60 s) | 2.03 | 4.10 | 8.10 | 9.31 | 0.61 | 0.76 | 0.16 | 0.99 |
| 6-degree (first 120 s) | 689.76 | 1269.40 | 314.09 | 1478.45 | 54.26 | 99.05 | 24.91 | 115.64 | |
| 6-degree (first 180 s) | 994.66 | 2422.22 | 692.04 | 2708.40 | 27.09 | 46.78 | 17.89 | 56.94 | |
| 6-degree (final 180 s) | 305.05 | 334.87 | 188.15 | 490.51 | 9.56 | 14.84 | 6.19 | 18.71 | |
| 6-degree (final 120 s) | 92.83 | 112.35 | 56.01 | 156.13 | 3.90 | 7.81 | 2.39 | 9.06 | |
| 6-degree (final 60 s) | 11.03 | 18.31 | 9.59 | 23.43 | 0.64 | 2.28 | 0.38 | 2.40 | |
| Real-time OD (15 nodes) | 133.26 | 220.70 | 100.59 | 276.74 | 8.44 | 11.24 | 11.06 | 17.89 | |
Publisher’s Note: MDPI stays neutral with regard to jurisdictional claims in published maps and institutional affiliations. |
© 2021 by the authors. Licensee MDPI, Basel, Switzerland. This article is an open access article distributed under the terms and conditions of the Creative Commons Attribution (CC BY) license (https://creativecommons.org/licenses/by/4.0/).
Share and Cite
MDPI and ACS Style
Yang, P.; Huang, Y.; Li, P.; Liu, S.; Shan, Q.; Zheng, W. Trajectory Determination of Chang’E-5 during Landing and Ascending. Remote Sens. 2021, 13, 4837. https://0-doi-org.brum.beds.ac.uk/10.3390/rs13234837
AMA Style
Yang P, Huang Y, Li P, Liu S, Shan Q, Zheng W. Trajectory Determination of Chang’E-5 during Landing and Ascending. Remote Sensing. 2021; 13(23):4837. https://0-doi-org.brum.beds.ac.uk/10.3390/rs13234837
Chicago/Turabian StyleYang, Peng, Yong Huang, Peijia Li, Siyu Liu, Quan Shan, and Weimin Zheng. 2021. "Trajectory Determination of Chang’E-5 during Landing and Ascending" Remote Sensing 13, no. 23: 4837. https://0-doi-org.brum.beds.ac.uk/10.3390/rs13234837
Note that from the first issue of 2016, this journal uses article numbers instead of page numbers. See further details here.