
A Pixel-Based Vegetation Greenness Trend Analysis over the Russian Tundra with All Available Landsat Data from 1984 to 2018


1
State Key Laboratory of Remote Sensing Science, Aerospace Information Research Institute, Chinese Academy of Sciences, Beijing 100101, China
2
School of Geospatial Engineering and Science, Sun Yat-sen University, Guangzhou 510275, China
3
Southern Marine Science and Engineering Guangdong Laboratory, Zhuhai 519082, China
4
School of Geography and Remote Sensing, Guangzhou University, Guangzhou 510006, China
*
Author to whom correspondence should be addressed.
Remote Sens. 2021, 13(23), 4933; https://0-doi-org.brum.beds.ac.uk/10.3390/rs13234933
Submission received: 14 October 2021
/
Revised: 30 November 2021
/
Accepted: 1 December 2021
/
Published: 4 December 2021
(This article belongs to the Special Issue Remote Sensing of Environmental Changes in Cold Regions Ⅱ)
Abstract
:As Arctic warming continues, its impact on vegetation greenness is complex, variable and inherently scale-dependent. Studies with multiple spatial resolution satellite observations, with 30 m resolution included, on tundra greenness have been implemented all over the North American tundra. However, finer resolution studies on the greenness trends in the Russian tundra have only been carried out at a limited local or regional scale and the spatial heterogeneity of the trend remains unclear. Here, we analyzed the fine spatial resolution dataset Landsat archive from 1984 to 2018 over the entire Russian tundra and produced pixel-by-pixel greenness trend maps with the support of Google Earth Engine (GEE). The entire Russian tundra was divided into six geographical regions based on World Wildlife Fund (WWF) ecoregions. A Theil–Sen regression (TSR) was used for the trend identification and the changed pixels with a significance level p < 0.05 were retained in the final results for a subsequent greening/browning trend analysis. Our results indicated that: (1) the number of valid Landsat observations was spatially varied. The Western and Eastern European Tundras (WET and EET) had denser observations than other regions, which enabled a trend analysis during the whole study period from 1984 to 2018; (2) the most significant greening occurred in the Yamal-Gydan tundra (WET), Bering tundra and Chukchi Peninsula tundra (CT) during 1984–2018. The EET had a greening trend of 2.3% and 6.6% and the WET of 3.4% and 18% during 1984–1999 and 2000–2018, respectively. The area of browning trend was relatively low when we first masked the surface water bodies out before the trend analysis; and (3) the Landsat-based greenness trend was broadly similar to the AVHRR-based trend over the entire region but AVHRR retrieved more browning areas due to spectral mixing adjacent effects. Higher resolution images and field measurement studies are strongly needed to understand the vegetation trend over the Russian tundra ecosystem.
1. Introduction
The Arctic is warming twice as fast as the global average [1]. Arctic warming has impacts on the tundra ecosystem function because of its interactions with the vegetation cover [2,3,4], wildlife [5,6] and human communities. Understanding the spatial distribution of Arctic greening and browning trends is important to evaluate the Arctic vegetation response to the changing climate or anthropogenic factors [7,8]. Satellite-derived vegetation indices have been used to quantify these changes over high northern latitudes during the past four decades [3,9,10,11,12] with coarse, moderate or high spatial resolution datasets. Increases in vegetation productivity have been completely observed by satellite observations over tundra ecosystems [13,14] and those changes have been linked to shrub expansion and an accelerated annual growth at locations throughout the Arctic [3,15,16,17]. However, the shrub expansion has been spatially uneven over the Arctic because of deer grazing [7,8]. Additionally, the appearance of highly productive herbaceous plant communities in the basins of drained thermokarst lakes can also have a significant effect on the greening of the tundra [18,19,20]. Thermokarst activities also play an important role in the Arctic greening over ice-rich permafrost where an abrupt thaw has taken place [21,22]. The thawing permafrost brings in soil fertility [18]; significant reserves of nutrients have been found in frozen bogs, which then enter floodplains and drained lakes during thawing as a result of increased biological productivity [23]. Ukraintseva et al. [24] also discovered that there was an increase in the growth of willow bushes on outcrops of more saline marine rocks.
The normalized difference vegetation index (NDVI) has been the most commonly used vegetation index to measure aboveground vegetation greenness and it highly correlates with vegetation productivity. The long term (more than 20 years) public access NDVI datasets have been produced from satellite-based sensors with different spatial and temporal resolutions. The three most commonly used datasets are from: (1) the Advanced Very-High-Resolution Radiometer (AVHRR; 1982–2013); (2) the Moderate Resolution Imaging Spectroradiometer (MODIS; 2000–present); and (3) USGS Landsat (1972–present). Due to the shorter observation period of MODIS, AVHRR and Landsat are the longest term NDVI providers at an annual scale for time series analyses. For AVHRR, the Global Inventory Modeling and Mapping Studies (GIMMS) NDVI developed at the NASA Goddard Space Flight Center was found to be the best for vegetation monitoring [25,26]. The most recent version of the GIMMS dataset is index-3rd generation. Although AVHRR is well-suited for a circumpolar-scale trend detection, the coarse spatial resolution AVHRR NDVI data (typically ~8 km) cannot meet the requirements for directly associating the sensor signal with an ecological change in heterogeneous tundra landscapes [2,10] and further limits the ability to conduct an attribution analysis on greenness trends, which include permafrost thaw, wildfires and human disturbances [2]. Thus, the trend results retrieved by AVHRR data are inconsistent with those of higher resolution datasets, i.e., MODIS, because of data processing issues [27].
The finer resolution Landsat is a good complement to AVHRR to evaluate the long term tundra greenness trends and identify the drivers of the changes. Both Landsat and AVHRR have almost the same observation period and the higher resolution of Landsat observations more closely matches the scale of field measurements and ecological changes than AVHRR observations [2]. Although higher resolution data lead to the problem of an increased data volume and high speed computing power, the cloud computing platform Google Earth Engine can help to facilitate scientific discoveries by providing researchers with free access to the Landsat archive. The Landsat satellites have been used for local [28,29] or even regional evaluations of tundra greenness trends [10,11]. To the best of our knowledge, most of these previous studies using the Landsat datasets focus on regional or continental scales in the North American Arctic; the entire Russian tundra is still poorly quantified in the English scientific literature.
The entire Russian tundra occupies more than half of the circumpolar tundra and has more than half of the shrub and tussock-shrub dominated tundra over the circumarctic area [30]. Shrub vegetation has been considered to expand in numerous tundra areas [3,31] and has the ability to mitigate greenhouse gas (GHG) emissions from thawing permafrost [32]. Additionally, after decades of disturbances due to a variety of drivers such as fires, thermokarst formation and coastal erosion, the Russian Arctic landscape has not previously been described at a fine spatial and temporal scale. The prior greenness trend studies on the Russian tundra with Landsat satellites mainly focused on local sites in northwestern Siberian [15], the Beringian Arctic [33], the Arctic Lena Delta [29] and the Yamal Peninsula [34,35]. There are no comprehensive studies on greenness trends over the entire Russian tundra with the Landsat dataset although Berner et al. [2] extracted all available summer Landsat data for 50,000 random sampling sites (where each site was 50 m in radius) in the Arctic and found that tundra greenness increased (greening) in ~37.3% of the sampling sites and browning increased in ~4.7% of the sampling sites from 1985 to 2016. They did not separate these trends for the Russian Arctic and the spatial distribution of these trends remains unknown. Therefore, it is of importance to understand how the Russian tundra is changing in space and time and how these changes have potential impacts on landscape processes, which can help us to improve the projections of future environmental change across the entire tundra [15].
In this study, we mapped the vegetation greenness trends for the entire Russian tundra across a ~1.9 million km2 continent based on a time series analysis of all available Landsat images from 1984 to 2018 with the support of GEE. In this way, we not only reveal the potential of the Landsat archive for detecting vegetation trends across the Russian tundra but we also provide the finest resolution spatially complete trend maps of the entire Russian tundra to date. In order to understand the spatial variability of the observed greening/browning trends, we compared the Landsat-based trends and the AVHRR-based trends after separating the whole study area into six geographical regions. Our objectives were: (1) to explore the potentialities of all available Landsat images for pixel-by-pixel vegetation greenness trends across the Russian tundra; (2) to produce fine resolution greenness trend maps from 1984 to 2018 and perform spatiotemporal analyses of the maps; and (3) to compare these fine results with coarse resolution greenness maps and calculate the discrepancies between them over the highly heterogeneous Russian tundra.
2. Materials and Methods
2.1. Study Geographical Regions
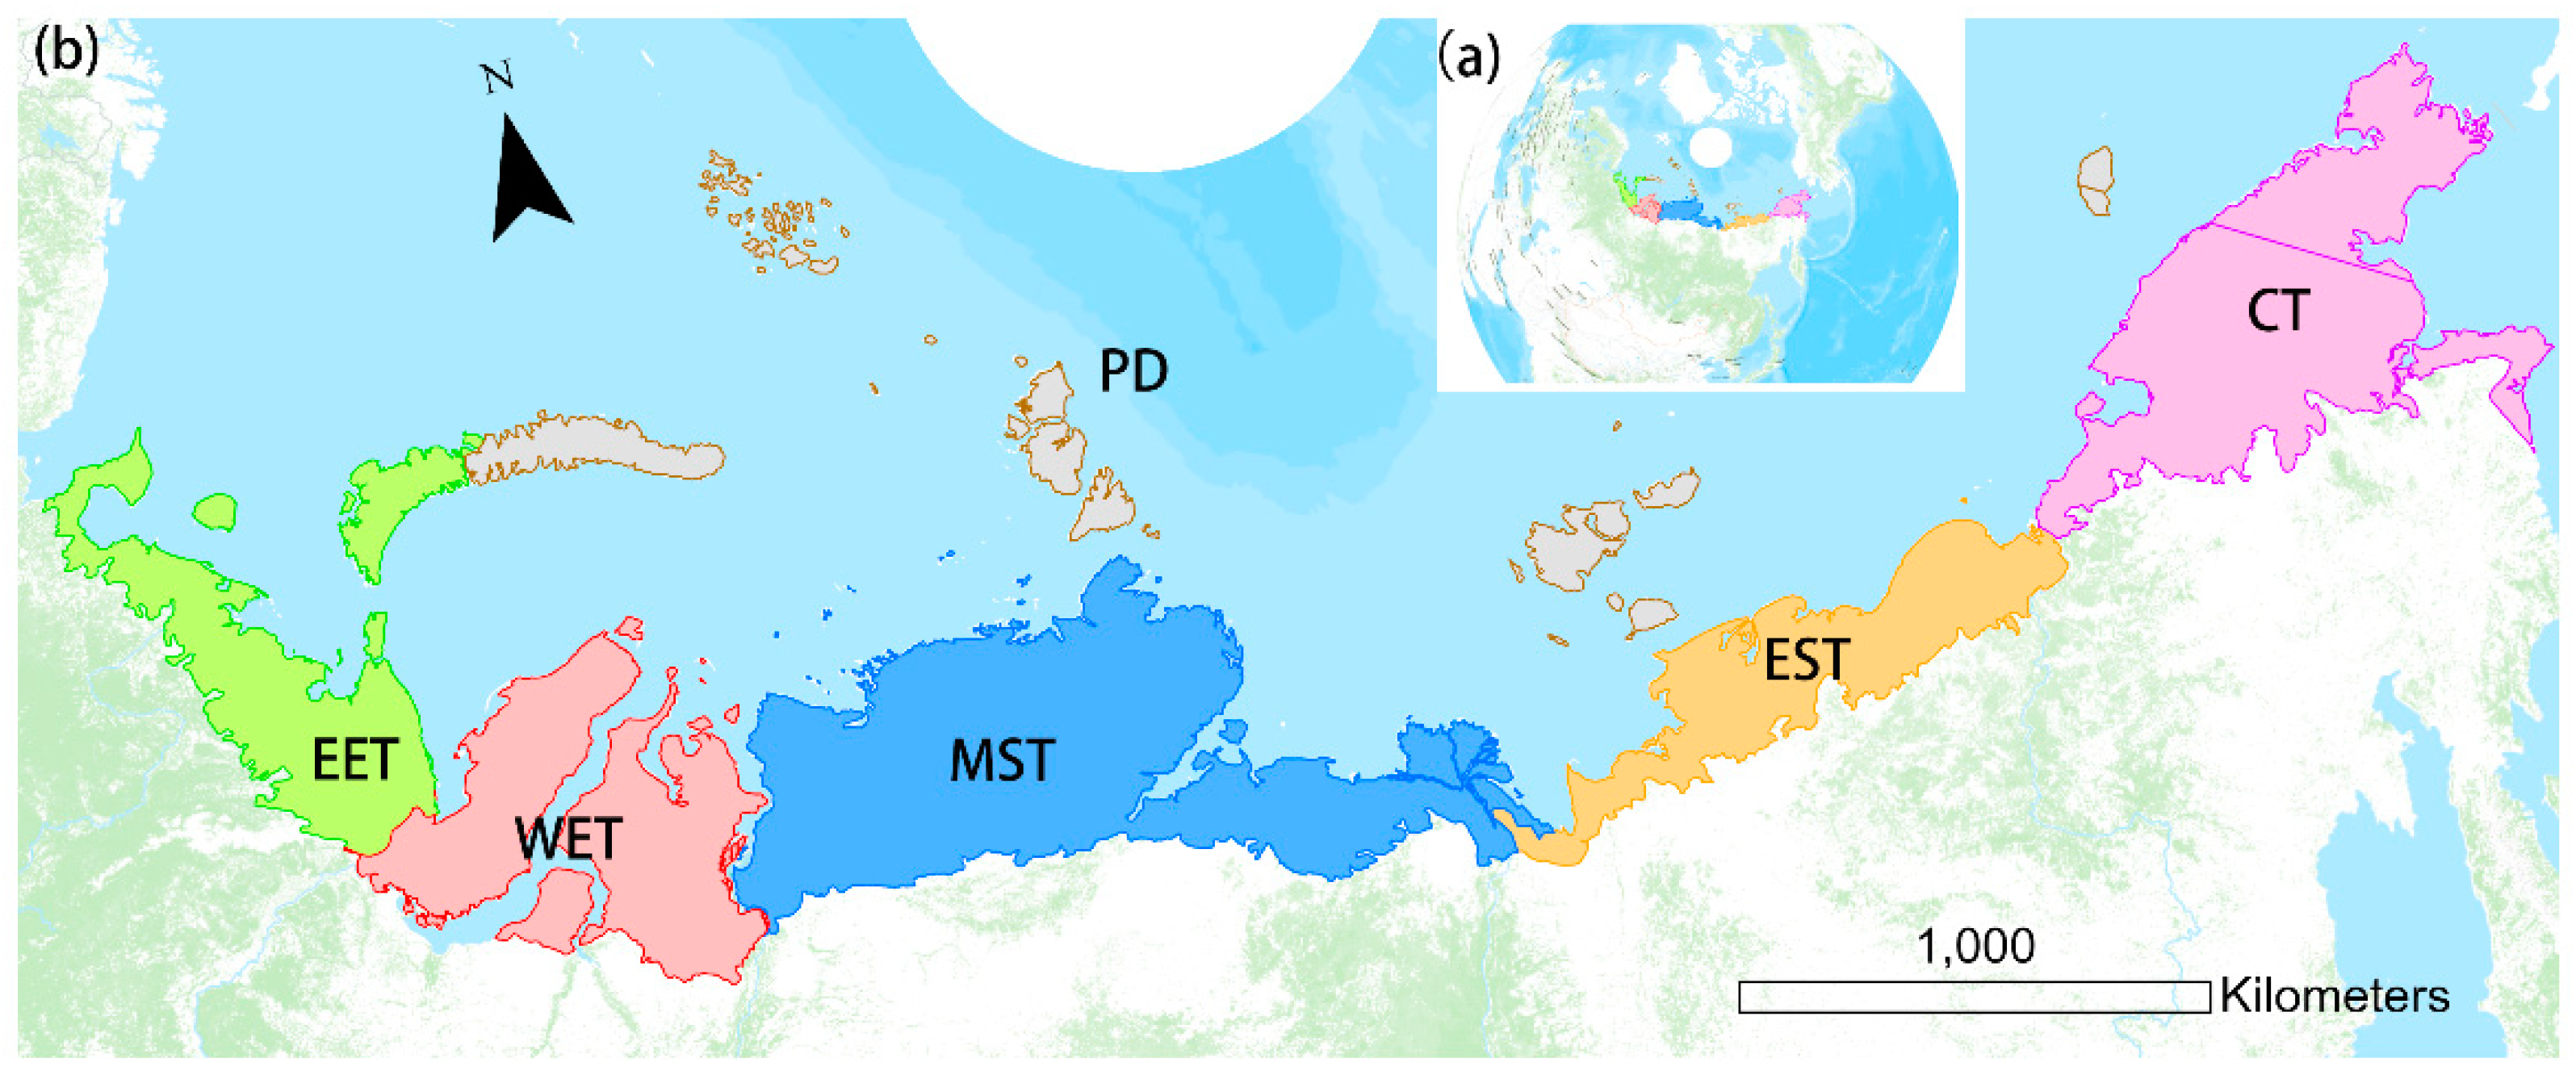
The entire study area contained polar desert and tundra zones. It was divided into six large geographic regions; one polar desert and five tundras (Figure 1). Our geographic regions mainly corresponded with the World Wildlife Fund (WWF) terrestrial ecoregions [36]. They differed only in the Novosibirskie Islands and Wrangel Island. These were originally separated in the WWF ecoregions and named the Novosibirsk Islands Arctic Desert and the Wrangel Island Arctic Desert; here, we included them both in one category as a polar desert. Another difference between the WWF ecoregions and ours is that we combined the Bering Tundra and the Chukchi Peninsula Tundra into one, labeled the Chukotka Tundra, because of their closeness (see Table 1). This zoning strategy was convenient in terms of a future comparison between the independent regional estimates found in the Russian literature. The total study area was ~1.9 million km2 with the MST subregion being the biggest geographical region (~0.6 million km2) and PD being the smallest region (~0.1 million km2).
2.2. Data and Methods
2.2.1. Landsat Imagery Collection and Pre-Processing
Orthorectified top-of-atmosphere (TOA) reflectance data (L1T) Tier 1 from Landsat 4/5 TM, 7 ETM+ and 8 OLI sensors were used in this study. The TOA data rather than the surface reflectance data were used because this was consistent with the existing studies on continental arctic greenness trends [10,11]. Landsat images have a 30 m spatial resolution and all the used images were acquired during the melt season (1 July to 30 August) from 1984 to 2018. Unlike other existing greenness trend studies in the arctic area [12,28], we used all the available Landsat archive images during the melt season from 1984 to 2018 in the study area, including scenes with image contaminations due to clouds, ice/snow, aerosols, shadows and ETM+ scan line corrector (SLC) errors. The use of contaminated images could increase the temporal resolution of the observations. The number of Landsat observations during 1984–2018 in the Russian Arctic is shown in Figure 2 and Figure 3. We observed that western Russia had denser observations during 1984–2018 (Figure 3a) because of denser observations across this area during 1984–1999 compared with eastern Russia (Figure 3b). After 2000, most areas of the western and eastern Russian Arctic had more than 60 observations during those 19 years, which indicated more than three observations each year (Figure 3c). All of the Landsat data were acquired and processed with the help of GEE. The SimpleCloudScore algorithm implemented in the GEE was used to evaluate the cloud cover in the TOA reflectance images. This algorithm has been widely used for Landsat TOA imagery cloud detection [37], in which a “simple cloud-like score” is calculated by the joint use of brightness, temperature and a Normalized Difference Snow Index (NDSI) [38]. We set the threshold score at 20 to exclude the high cloud cover images according to our visual interpretation because high cloud cover could lead to a decreased number of available ground control points and, therefore, the geolocation accuracy could decrease [10].
2.2.2. NDVI Trend Derivation
The NDVI time series data during melt seasons were used for each 30 m land pixel except for non-water or non-snow locations. The values from Landsat 4, 5, 7 and 8 were calibrated using equations from Roy et al. [39]. Valid time series were defined in that there were at least two observations in the study period or the NDVI trend was not calculated. This requirement led to a few data gaps in the trend maps, particularly in eastern Russia, because of the low data coverage as described above.
Linear trends were conducted for the NDVI time series with non-parametric Theil–Sen regression (TSR) models within GEE, which were better than an ordinary least square regression analysis because a TSR is sensitive to outliers with a breakdown point of approximately 29% [40]. Additionally, a TSR has been successfully applied to the trend analysis of a Landsat NDVI time series across Alaska [11], a Landsat Tasseled Cap (TC) time series in the Canadian North-West and the Arctic Lena Delta in Russia [29,41,42].
Each 30 m pixel was observed to determine the slope between every data pair and the median value was then calculated. This slope of regression was set as the annual NDVI trend. The TSR prediction precision could be improved when the number of valid observations increased. A Student’s t-test was used to evaluate the significance of the trend. Trends with p < 0.05 were determined to be significant and only the changed pixels were retained in the final results. As prior studies have defined [10,11], a greening trend has a significant positive slope and a browning trend has a significant but negative slope.
In order to compare spatial and trend differences, a GIMMS NDVI3g v3.1 time series (hereafter GIMMS) [25] was also used in this study. The GIMMS data are bi-monthly with a spatial resolution of 1/12 degrees (~8 km at the equator). A maximum NDVI composite for every year in July and August was derived and then used for the trend calculation. The same regression method, the TSR, was performed on this dataset over the same study period, 1984–2015.
3. Results
3.1. Landsat Data Availability
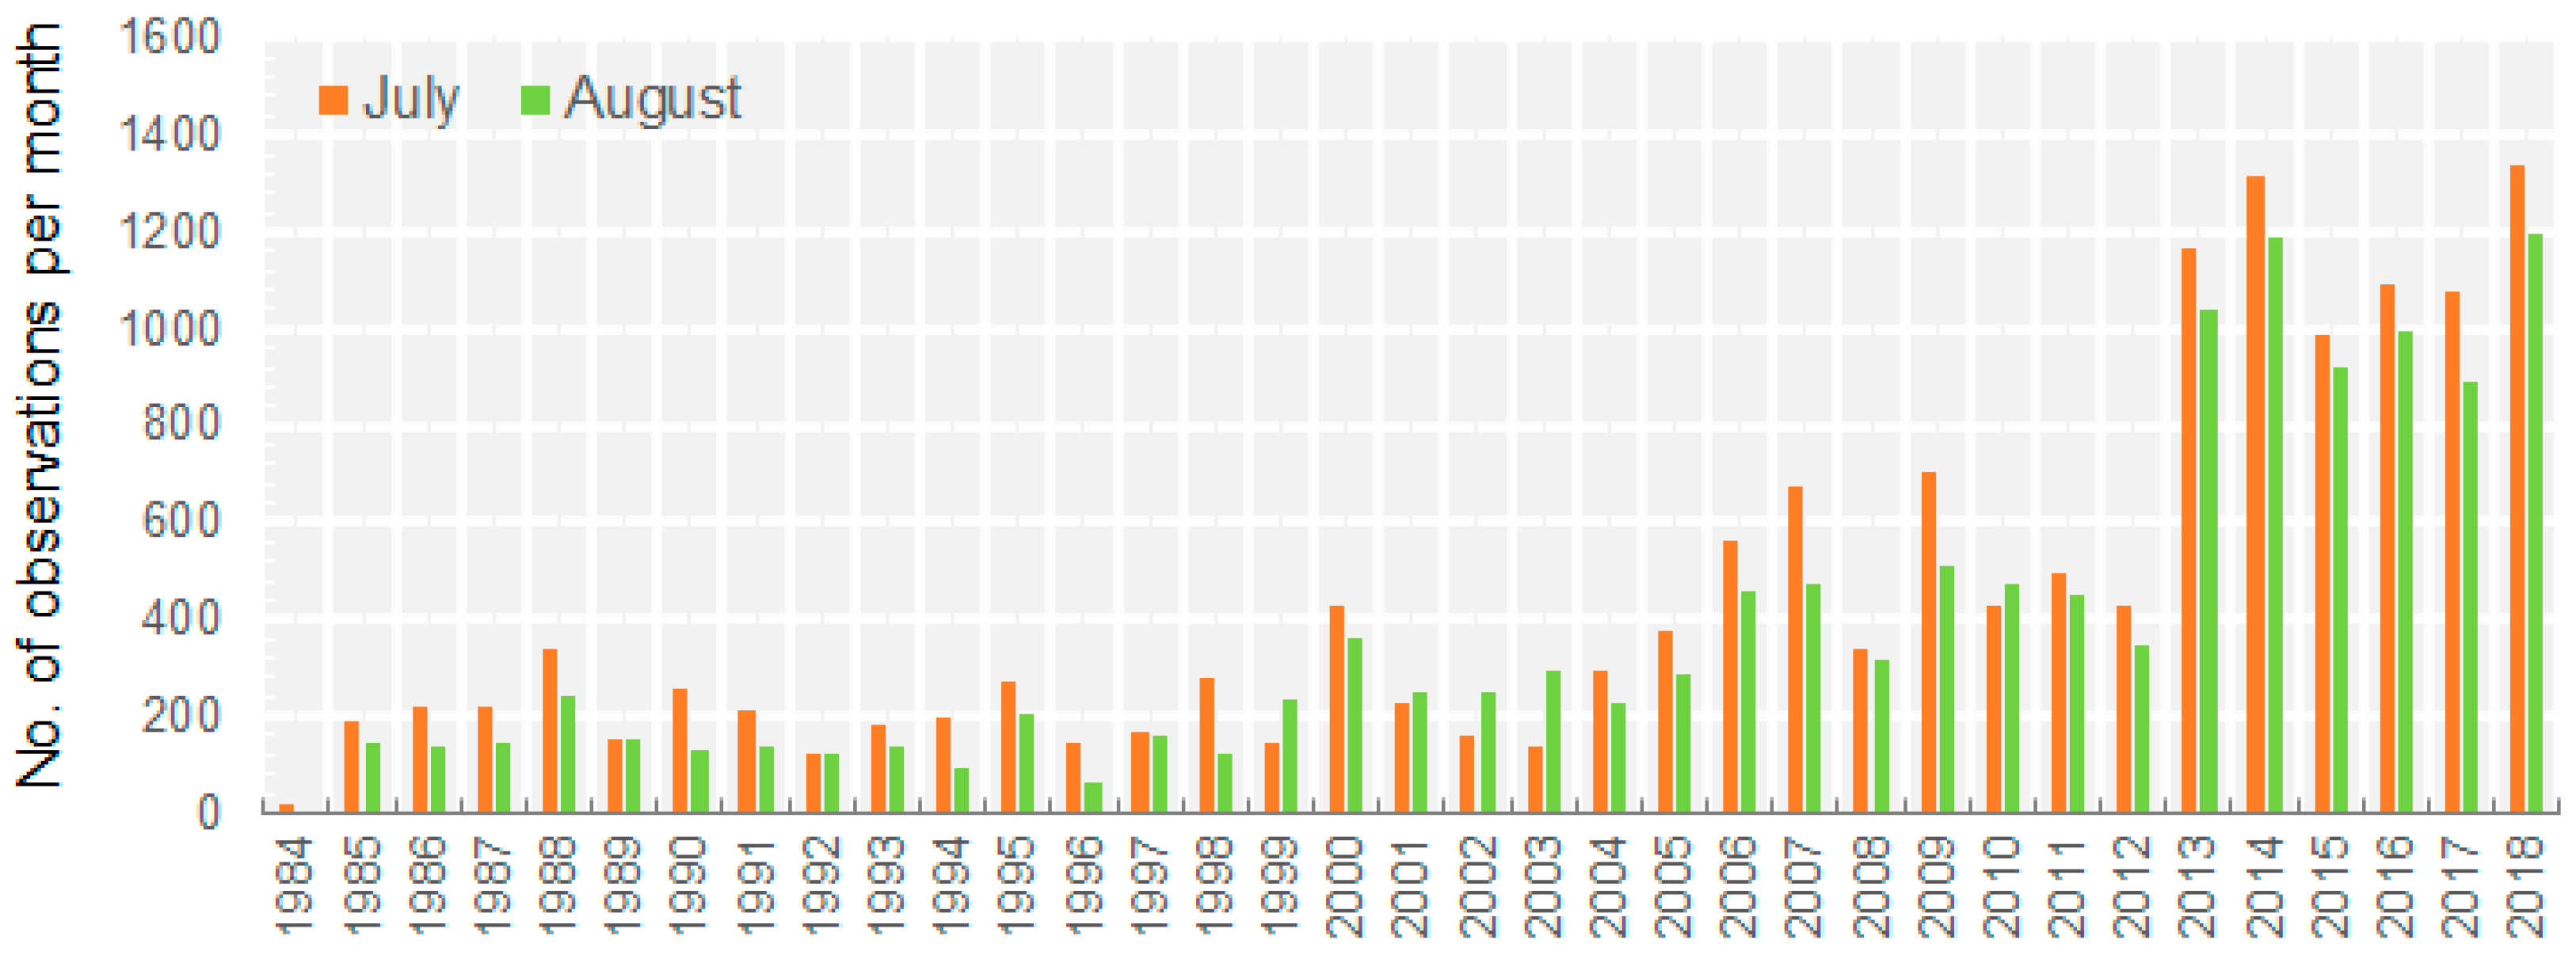
The more valid Landsat observations obtained, the better the robustness of the greenness trend achieved. There were 28,531 scenes (WRS-2) in total that met the screening criteria for the greenness trend analysis from 1984–2018 (Figure 2). The data availability over time was not consistent. The number of available scenes over the entire study area fluctuated between a minimum of 19 in 1984 and a maximum of 2534 in 2018 (Figure 2). Landsat 4 and 5 were the only data sources from 1984–1998 with around 350 scenes each year. After 2000, thanks to a combined data availability from Landsat 4, 5 and 7, the number of usable scenes nearly doubled (2000–2011). From 2013–2018, the number of usable scenes dramatically increased to around 2200 scenes each year due to the launch of Landsat 8 in 2013. It is noteworthy that there were more valid observations in July than in August in our study area.
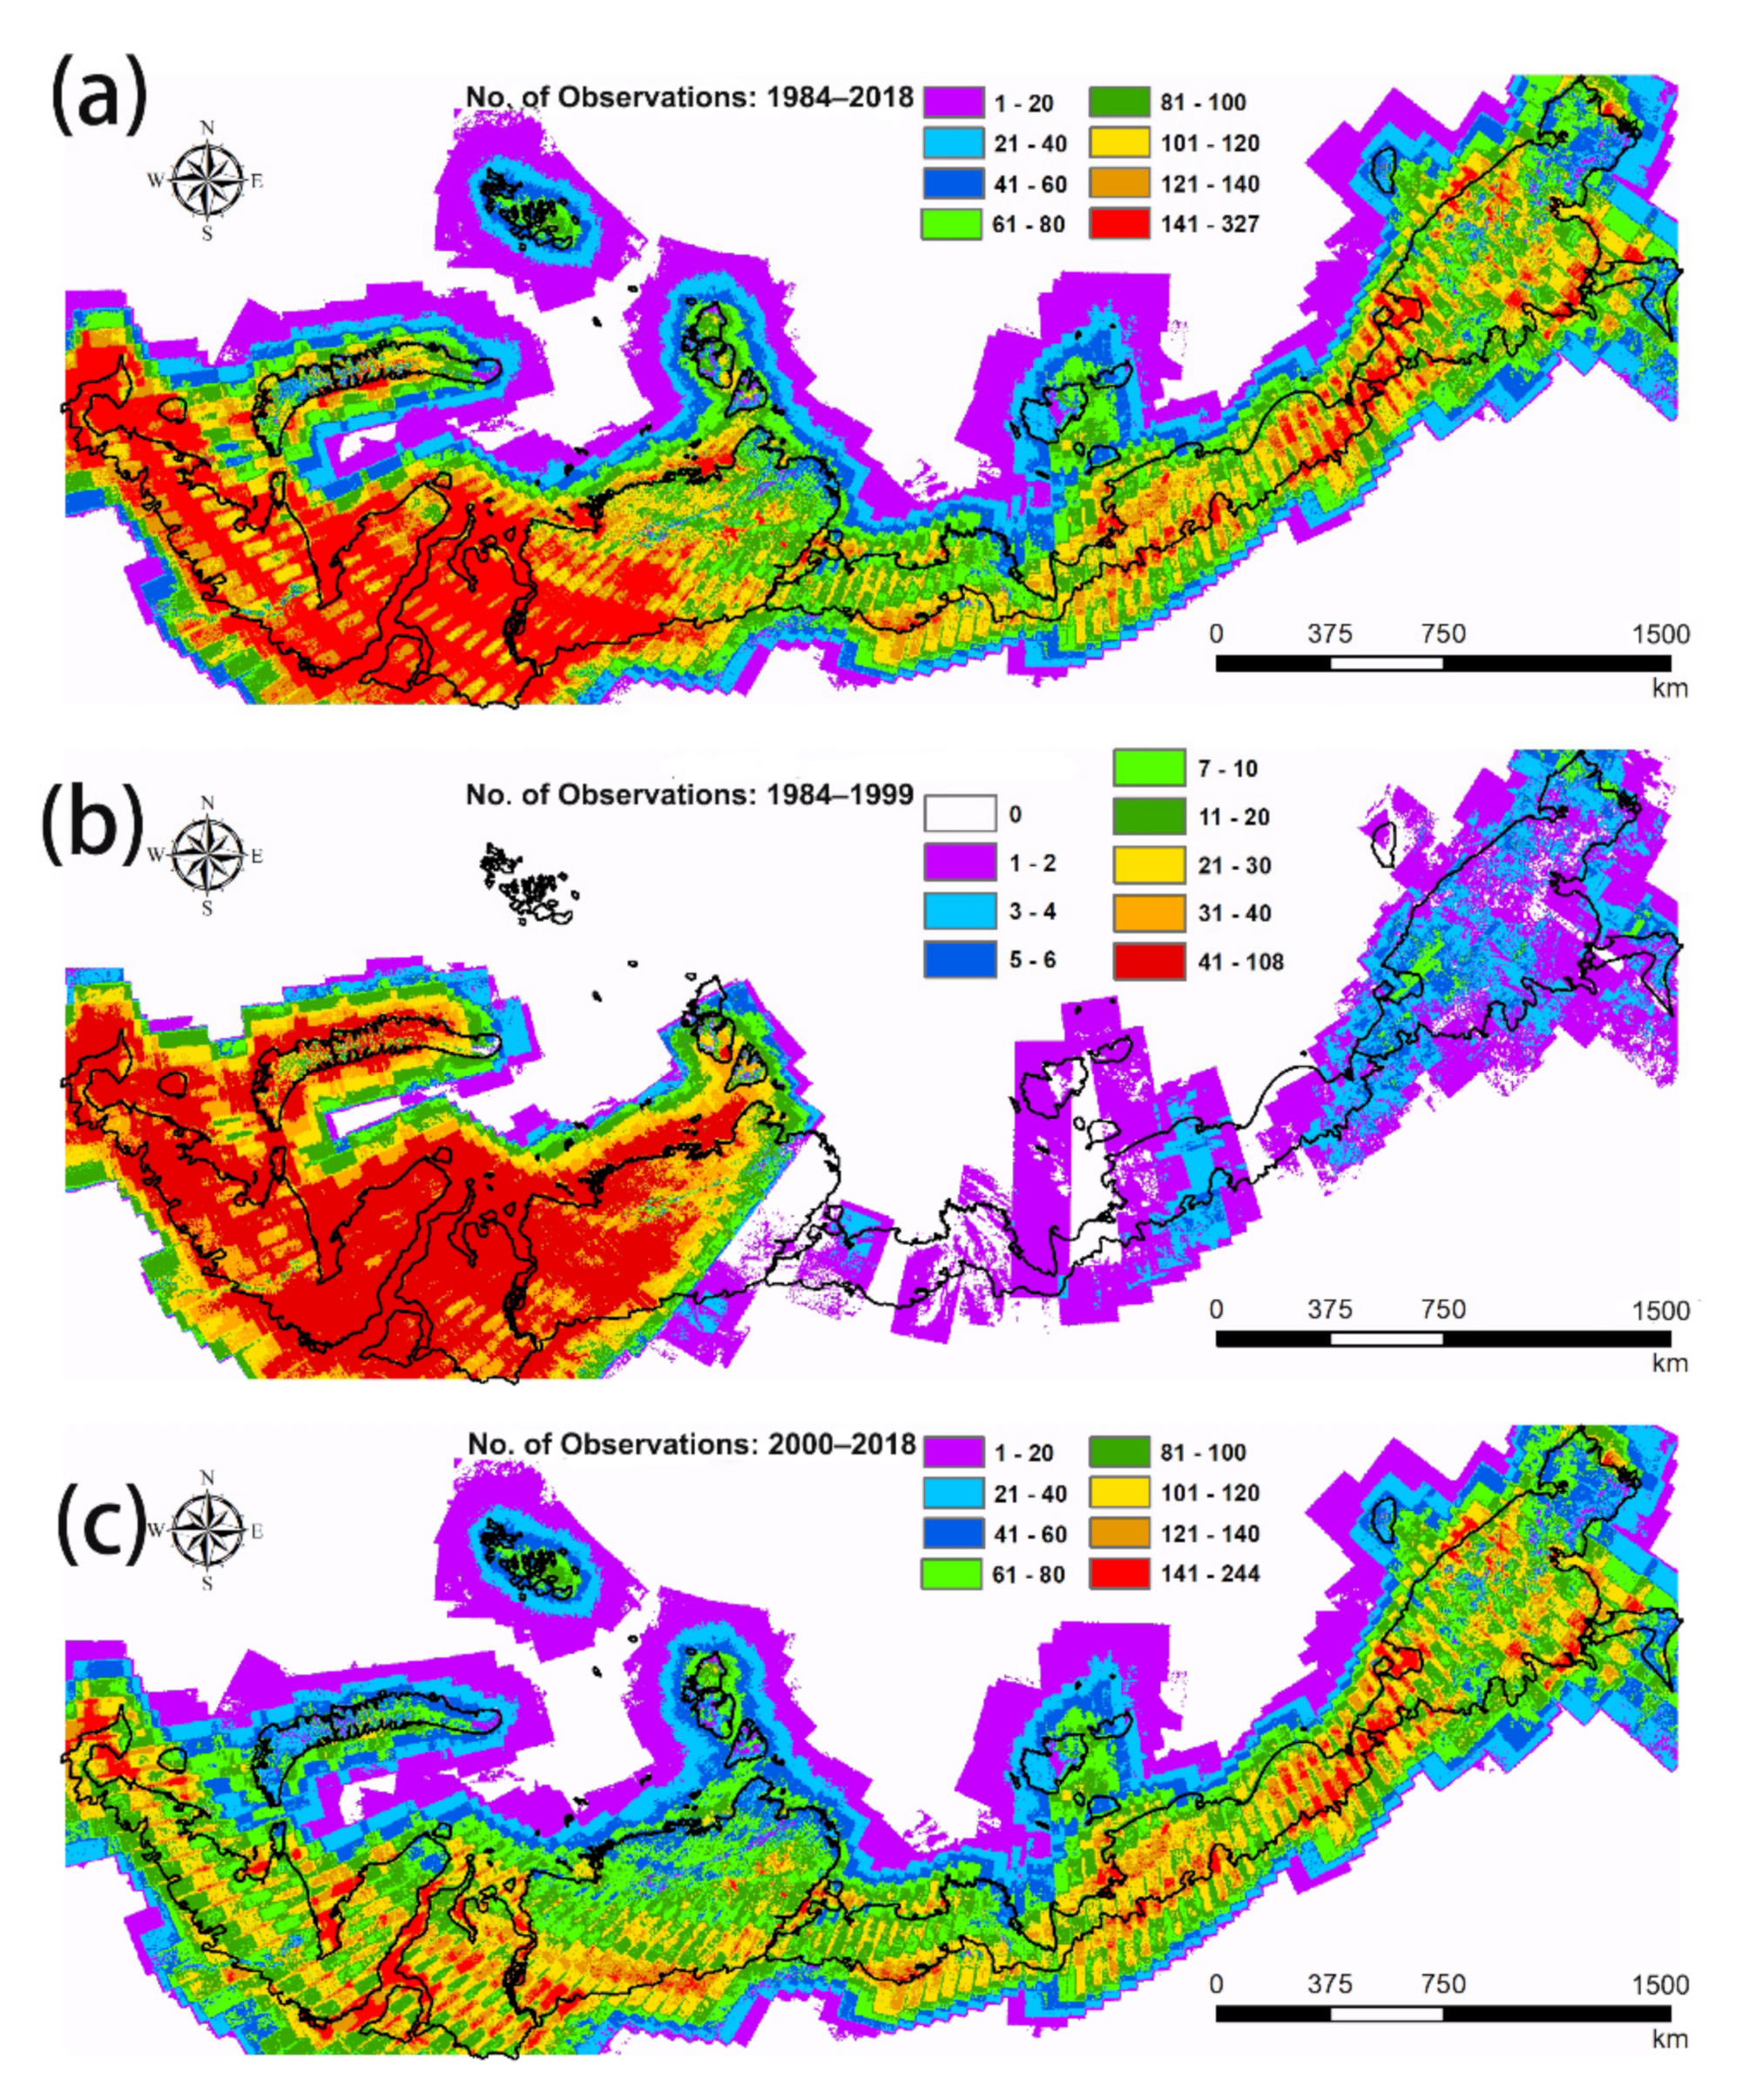
The number of valid observations was spatially varied. Figure 3 displays the number of valid Landsat observations during the entire study period (1984–2018) and two separated subperiods (1984–1999 and 2000–2018). The Middle Siberian Tundra, Eastern Siberian Tundra and Chukotka Tundra had a smaller number of valid observations due to data limitations when Landsat 4 and 5 were the only data sources and there were not enough ground stations acquiring the data (Figure 3a,b) [43]. However, the Western Siberian tundra still had high numbers of observations during 1984–1999 with up to 108 observations for several locations. Owing to the combined acquisition of Landsat 7 and 8, the amount of available data increased after 2000. The majority of the study area was captured by more than 100 observations during this period (Figure 3c). Only 2% of the area had fewer than 20 observations, located in the northeast of the Chukotka Tundra. The good coverage during this time can be attributed to the overlap between the neighboring path images increasing at high latitudes and the integration of two sensors, i.e., TM and ETM+ or ETM+ and OLI.
3.2. Landsat NDVI Trends over the Decades
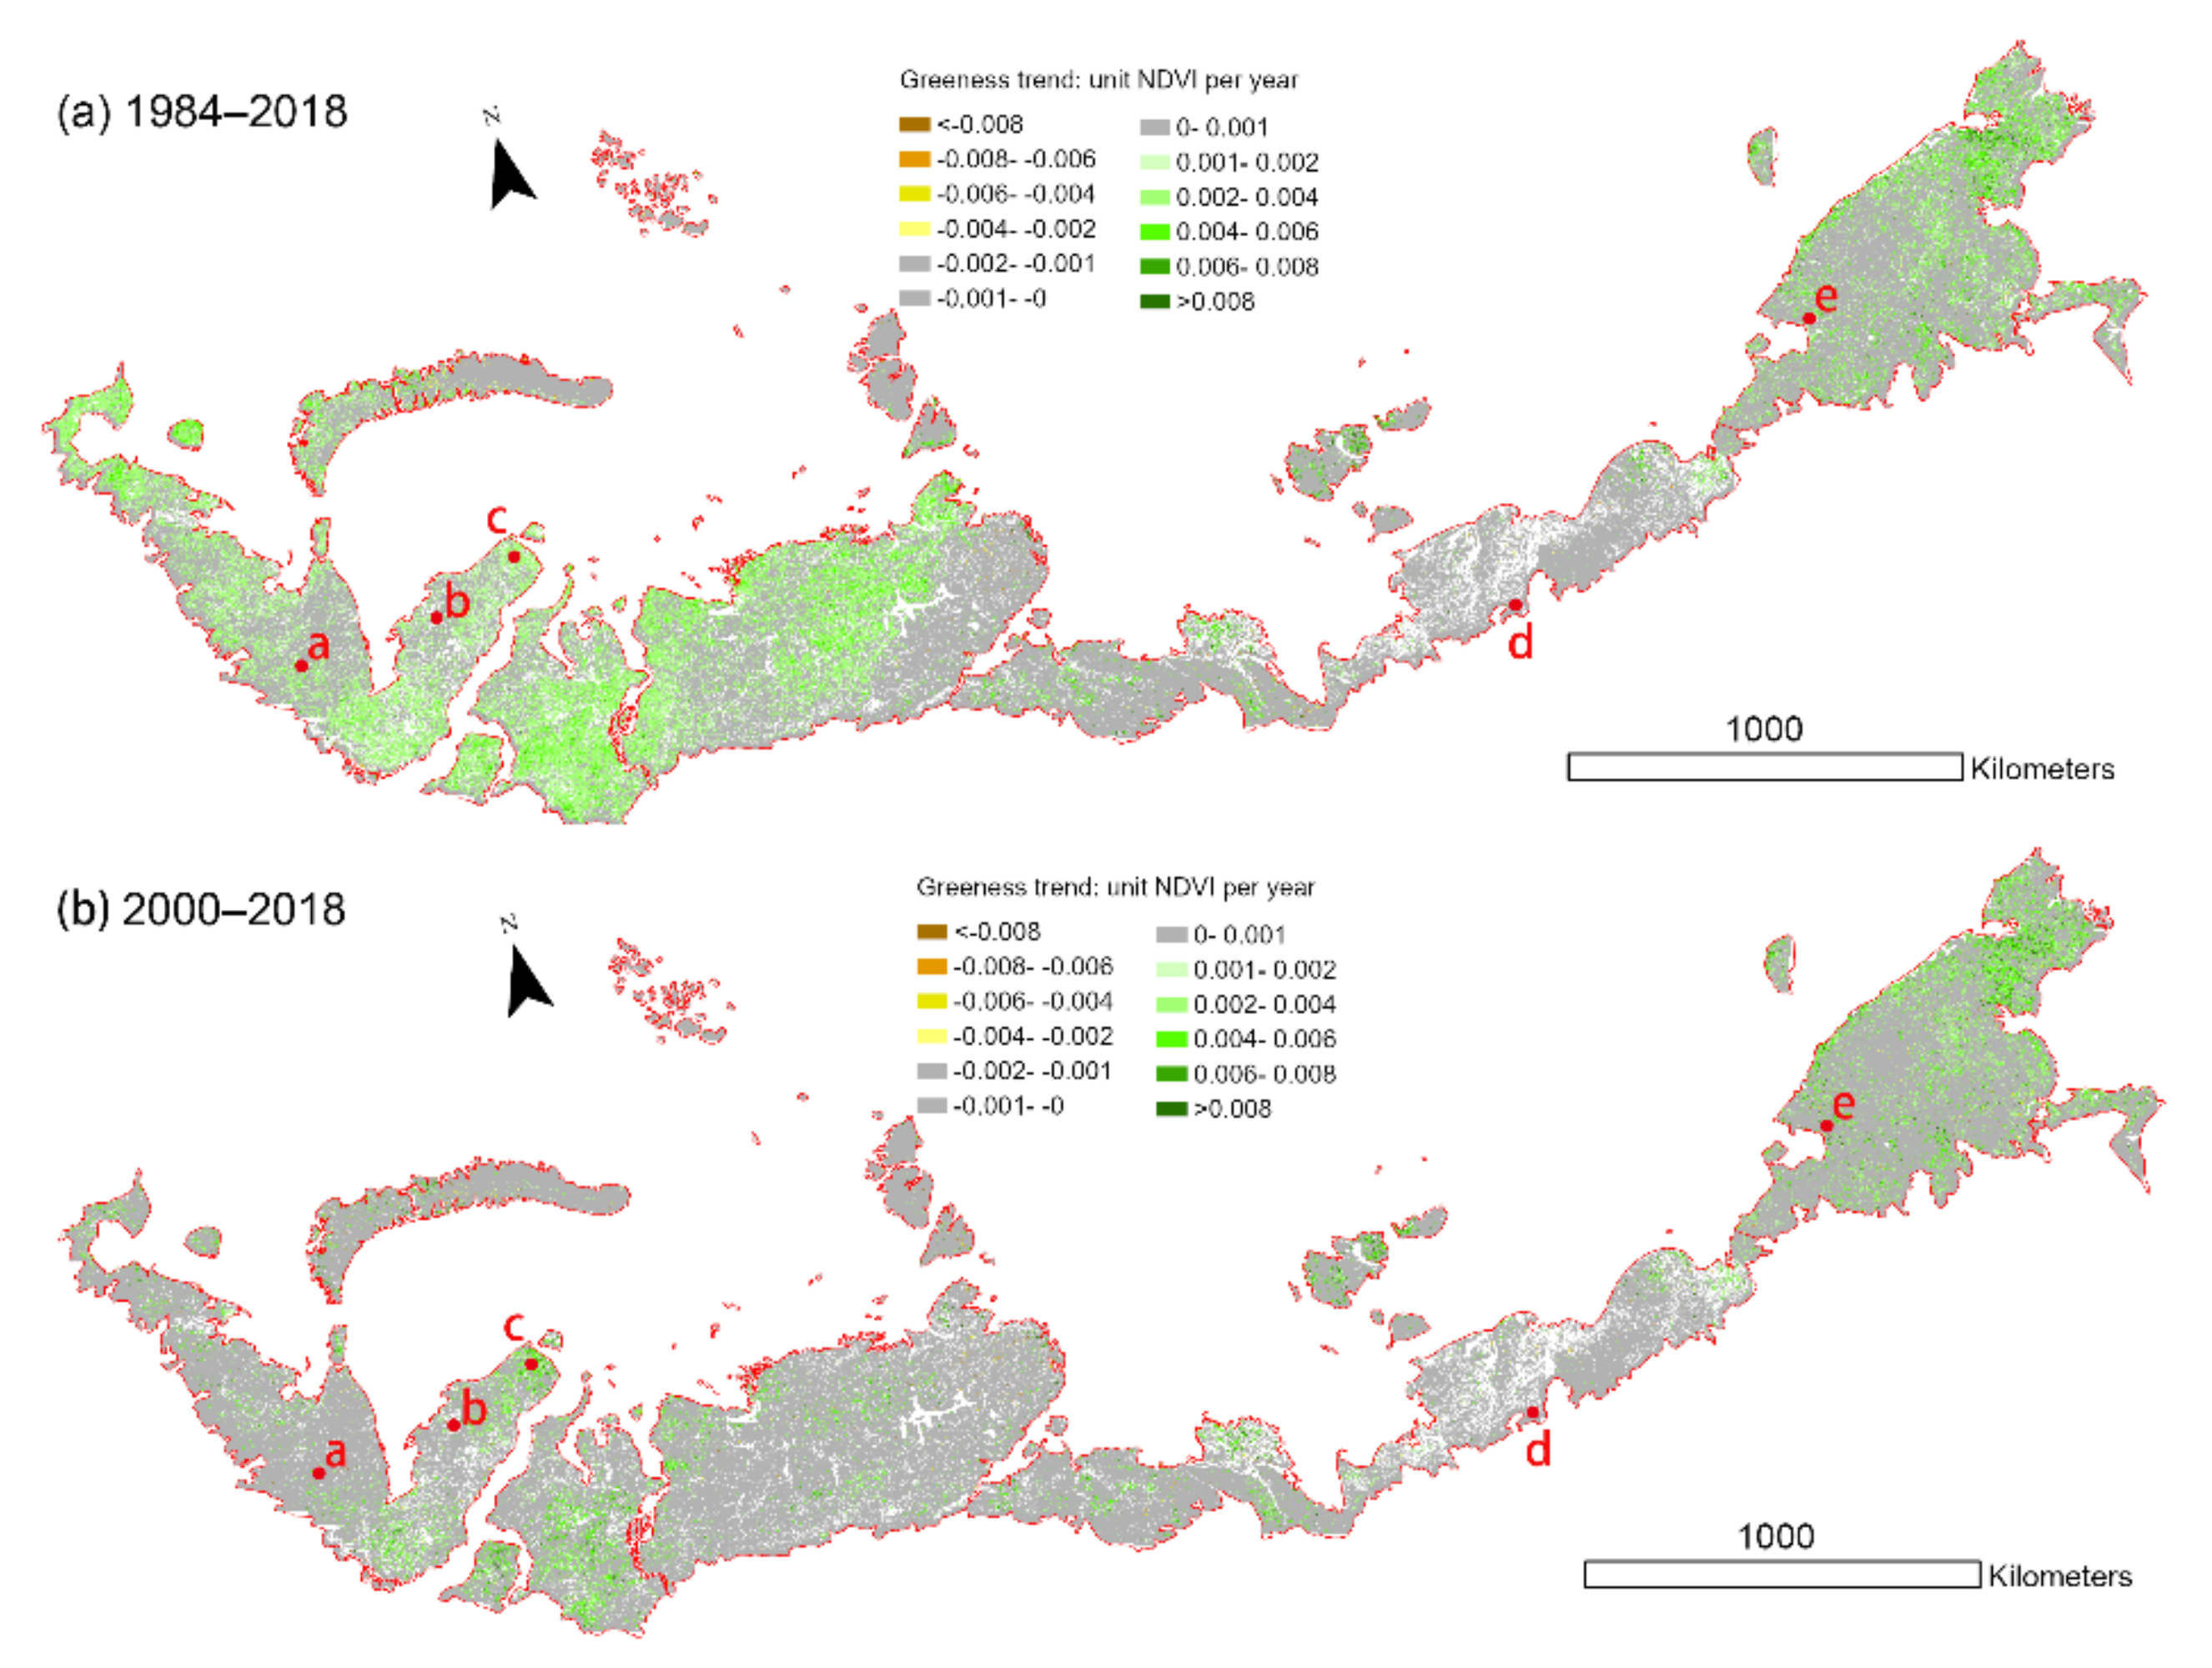
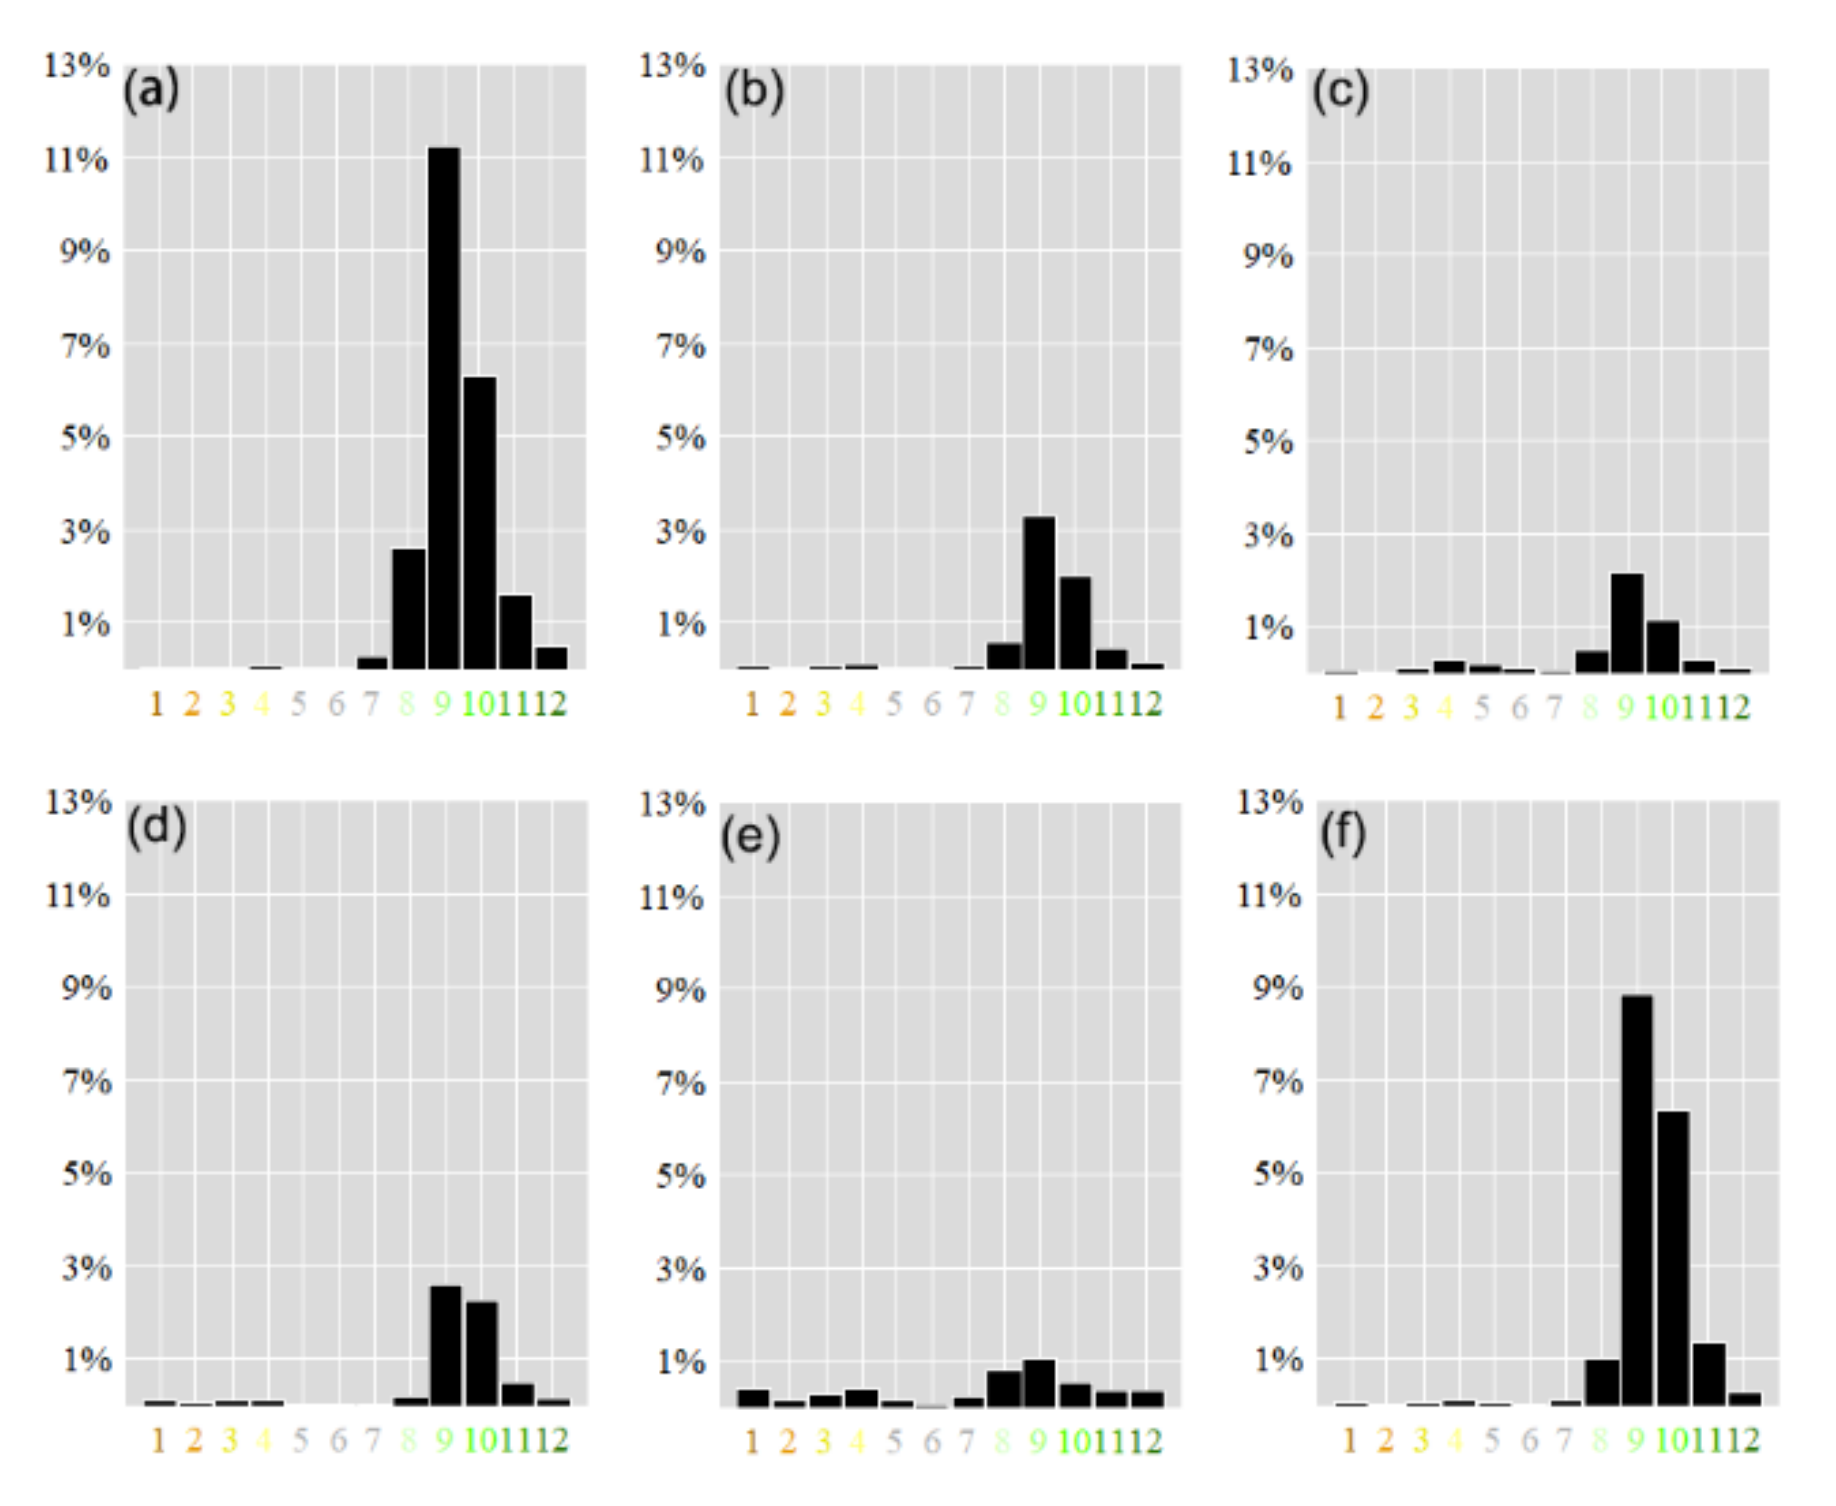
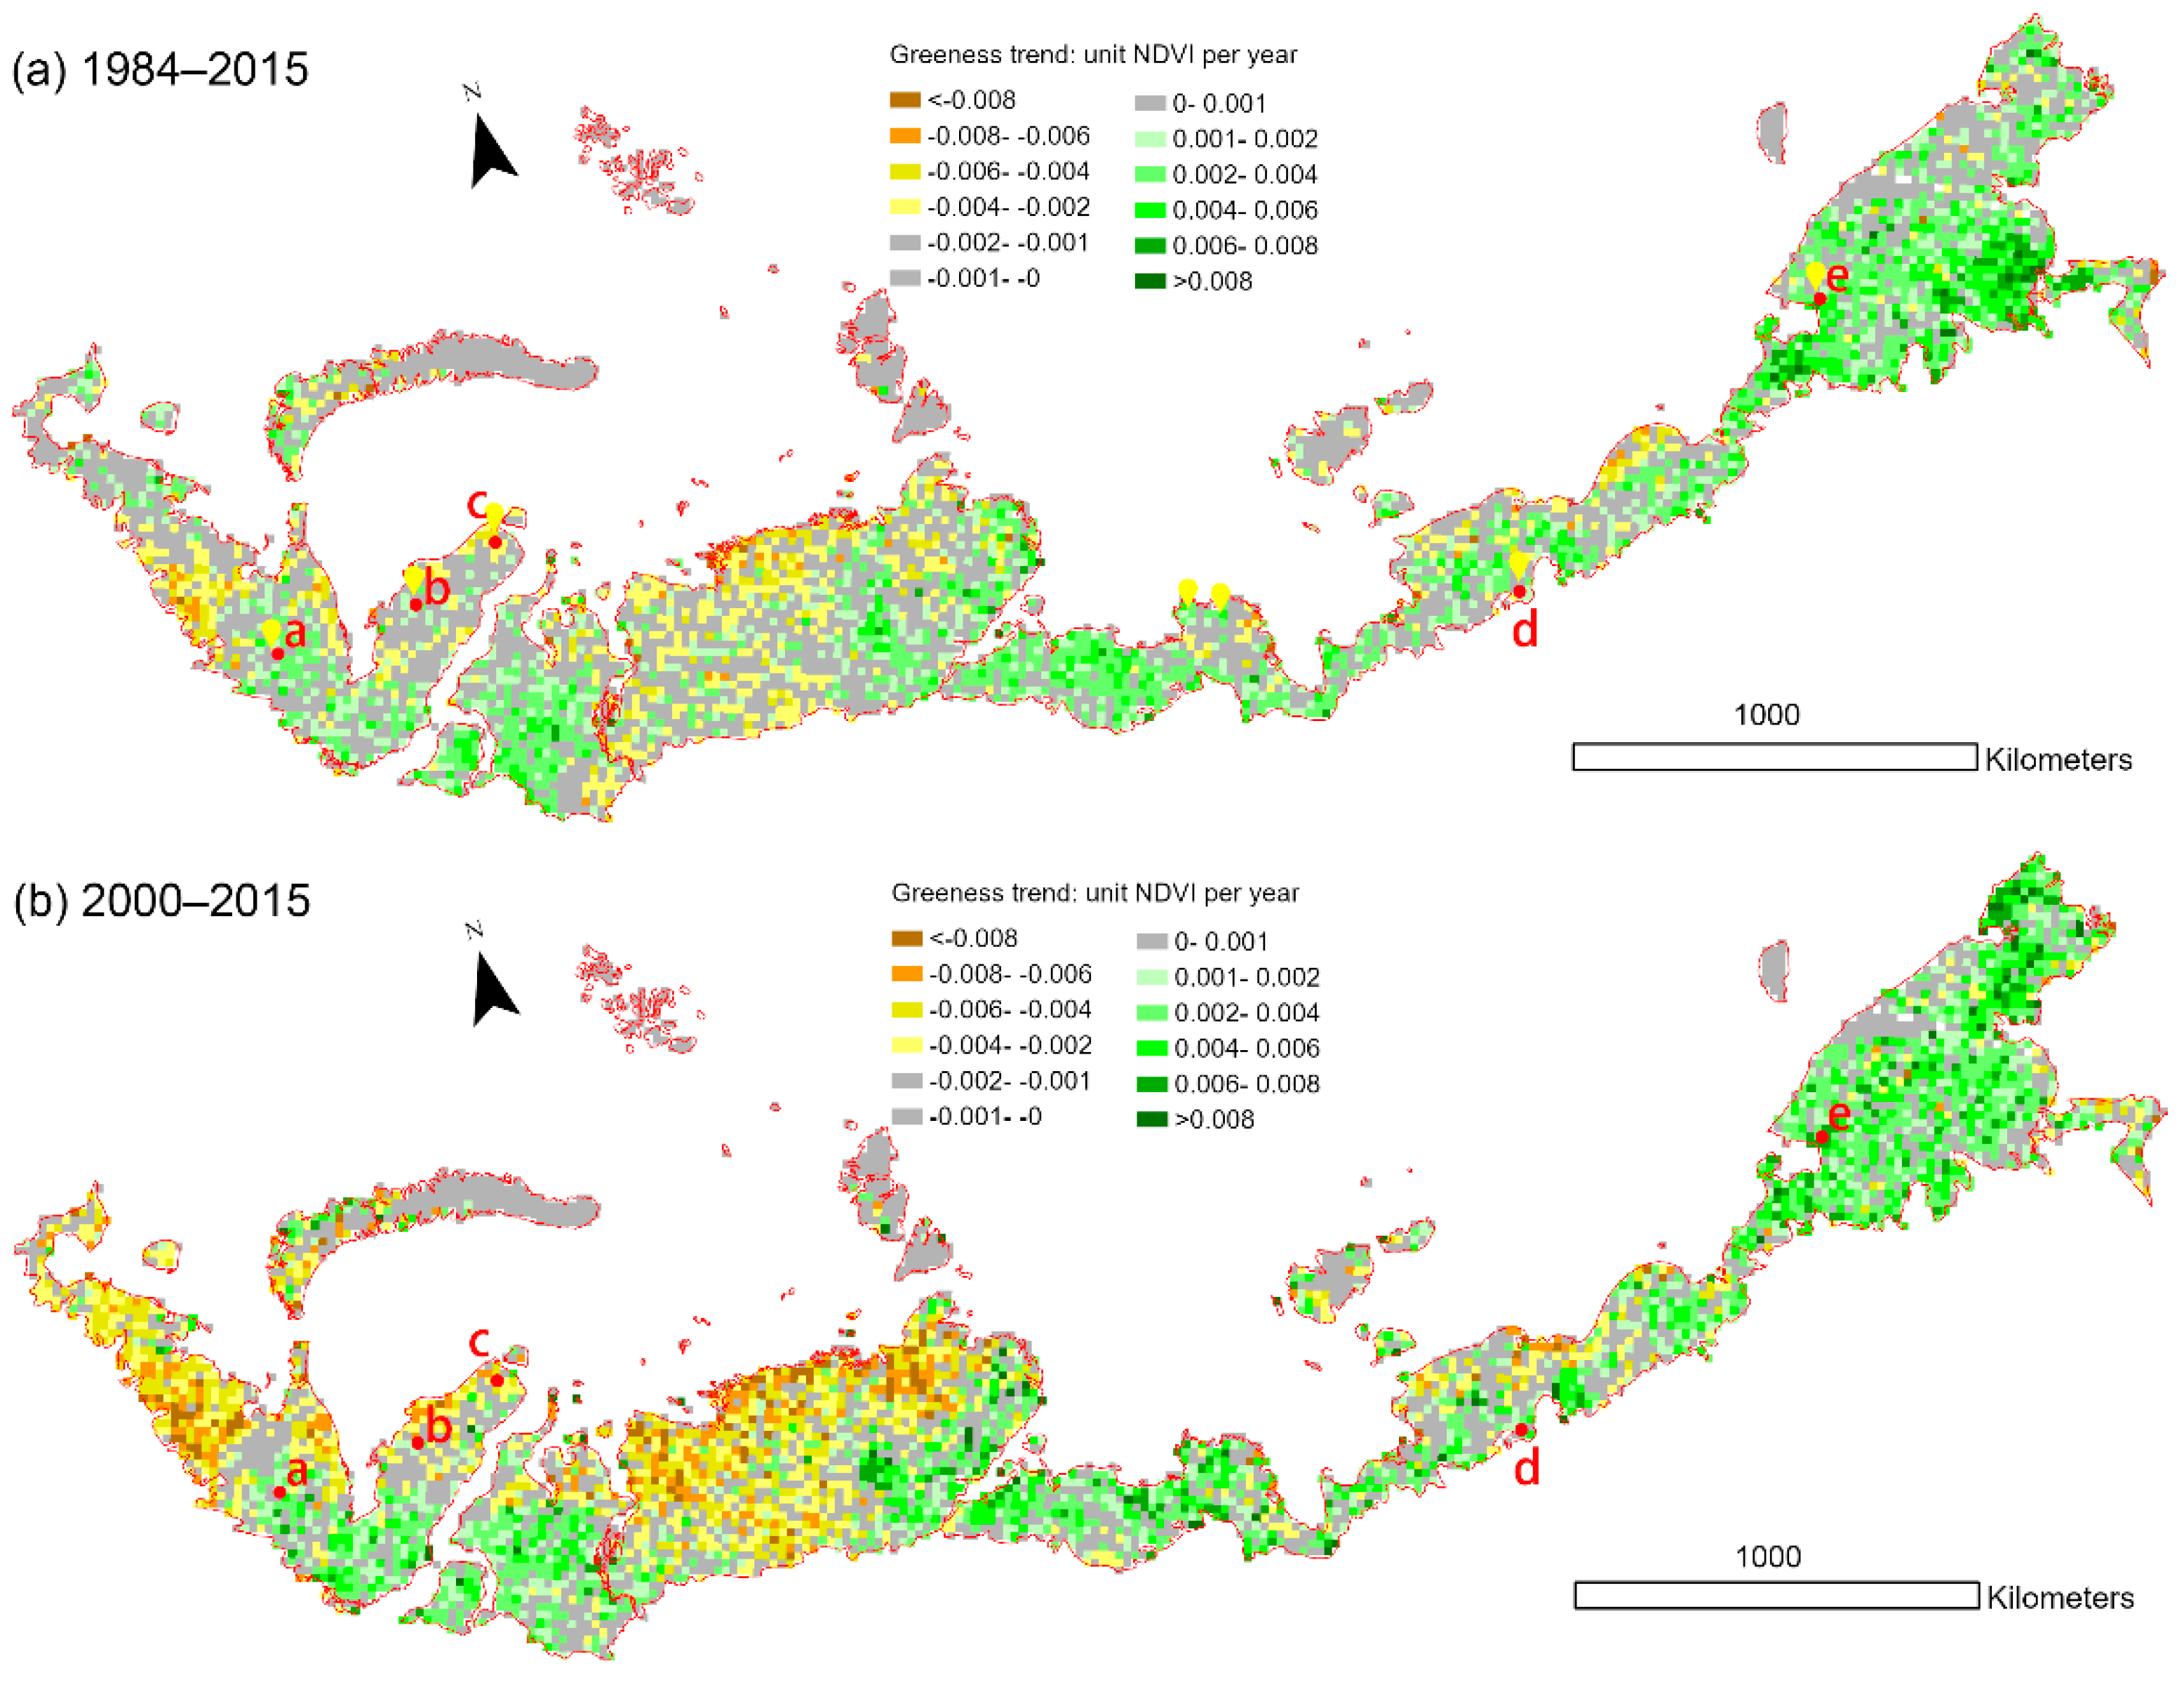
The greening trend was significant across the entire Russian tundra biome for the 1984–2018 period (Figure 4). The most significant greening occurred in the Yamal-Gydan tundra (WET), Bering tundra and Chukchi Peninsula tundra (CT). The greening trend value was mainly around 0.002–0.004 NDVI units per year. Several locations achieved as high as 0.008 (e.g., CT). In order to observe the detailed changes over the decades, two study phases were identified: 1984–1999 (Phase 1) and 2000–2018 (Phase 2). As several parts of the Russian tundra (e.g., MST, CT and EST) did not have enough satellite observations during 1984–1999, we only showed the trend analysis for 2000–2018. During 2000–2018, the greening trend area was lower compared with that during the whole study period (Figure 4b). Over 80% of the Russian tundra showed no systematic trend toward greening or browning. In 2000–2018, a significant greening trend occurred in the northern and southern Yamal Peninsula, the middle of the Gydan Peninsula and the northeast of the CT. However, EST, MST and PD had relatively stable conditions (Figure 5c–e). The EST and PD also had 0.9% and 1.5% browning trends during this period, respectively.
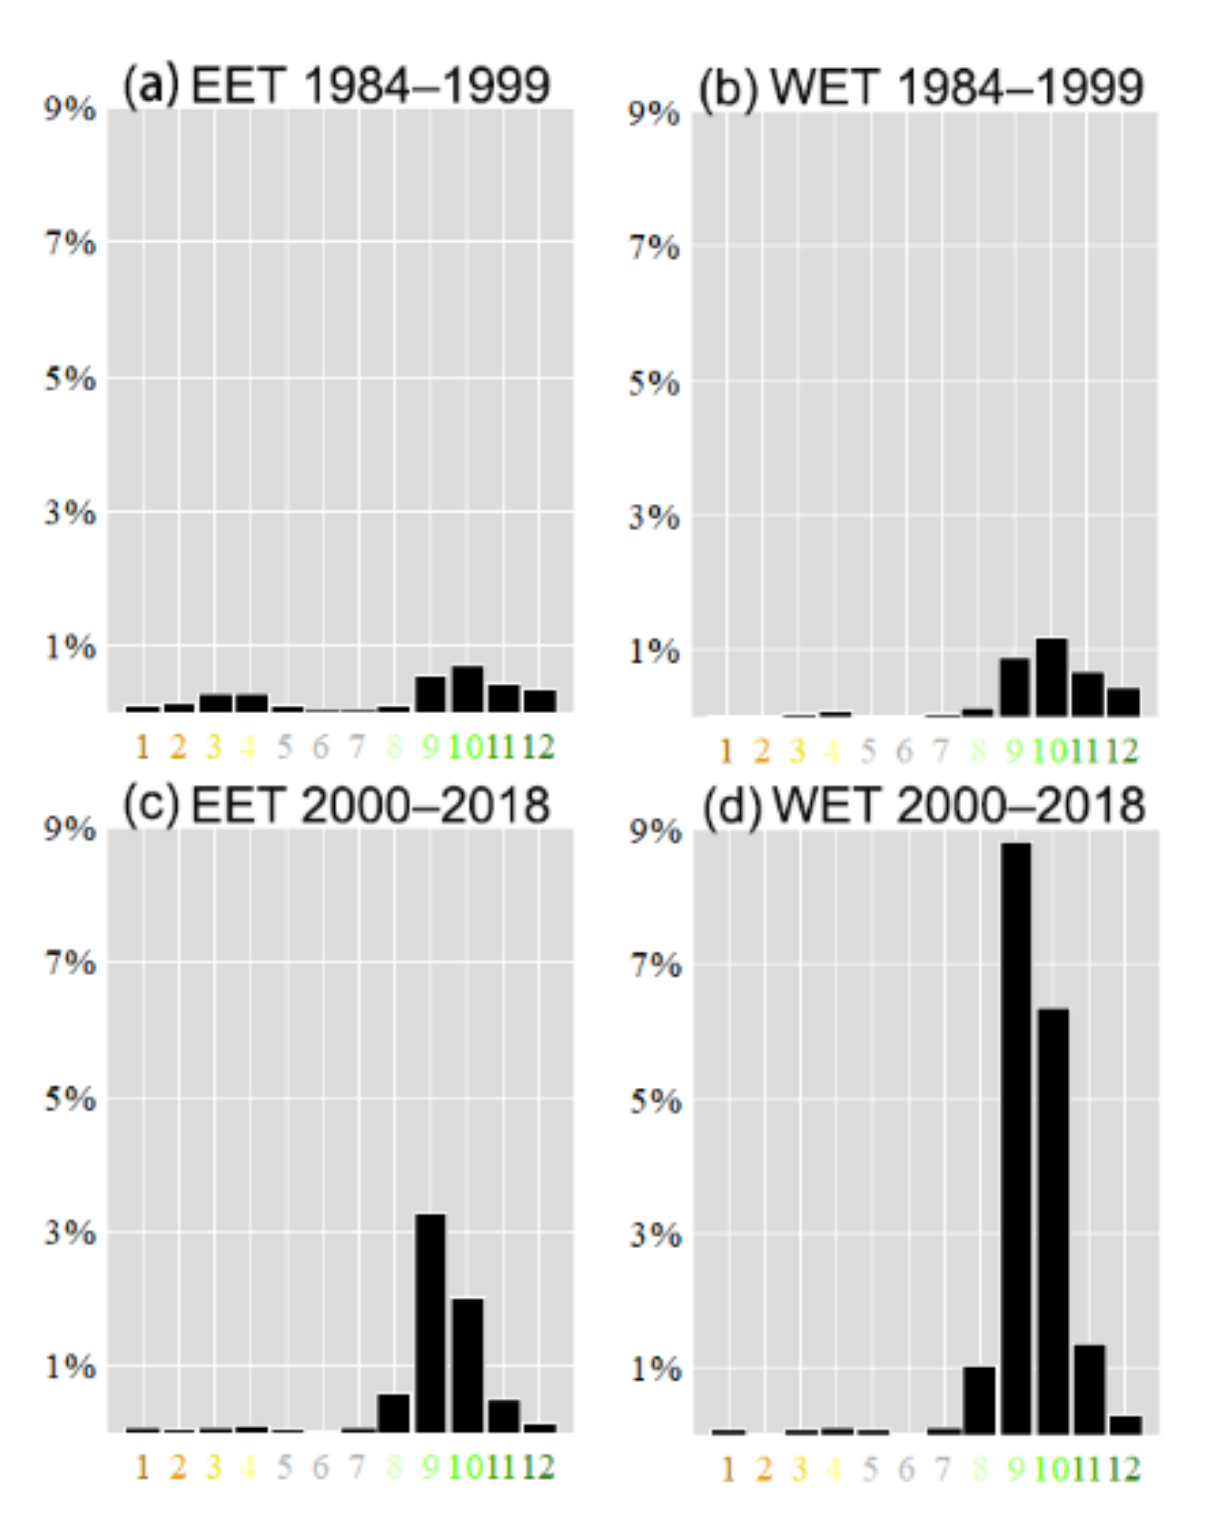
When different ecozones were evaluated separately, they showed different trend patterns in 1984–1999 and 2000–2018 (Table 2 and Figure 6). As full observations over the EET and WET were achieved during both periods, we could compare the greening results for them in 1984–1999 and 2000–2018. Although significant greening occurred both in the EET and WET from 1984 to 2018 (40.3% and 56.5%, respectively), these trend values were relatively low in 1984–1999 (2.3% and 3.4%, respectively). The WET experienced much higher greening trends in 2000–2018 of 18%. Additionally, the greening trend values were mostly around 0.002–0.004 and 0.004–0.006 NDVI units per year (see Figure 6d).
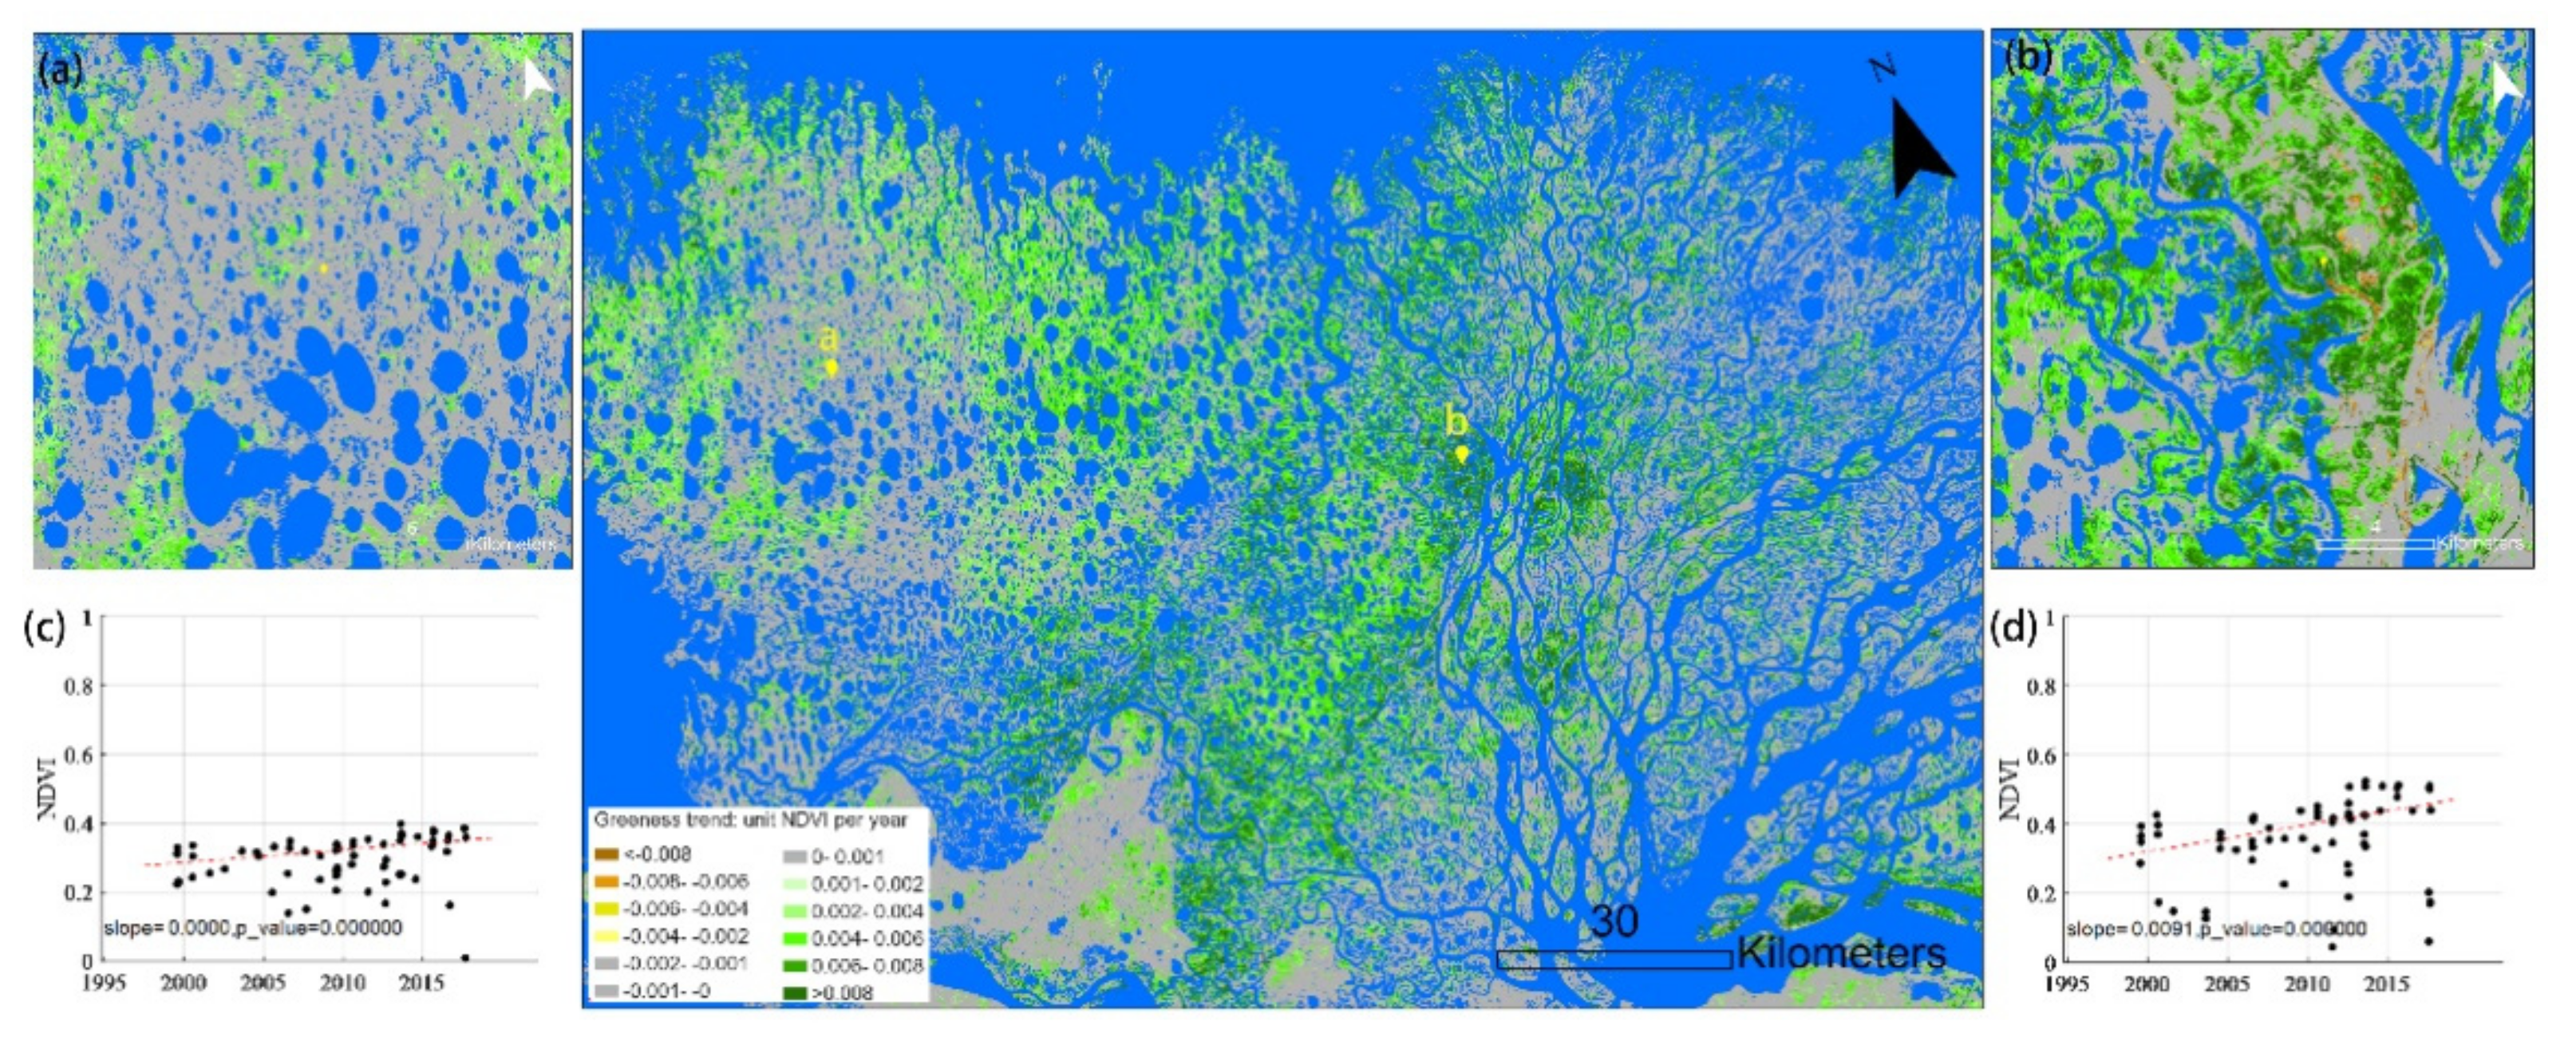
Before comparing our greenness trend results with those of AVHRR NDVI, it was helpful to see the spatial detail of the trend maps acquired from the Landsat data. Figure 7 is a good example of a 200 km × 100 km area on the Lena River delta. The Lena River delta has plenty of water bodies and very similar patterns to others in the Arctic tundra landscape. In this small area with little vegetated or exposed land [29], the Landsat data showed quite different greenness trends within a distance of ~100 km, as indicated by the relatively unchanged NDVI in location a and the increased NDVI in location b. The NDVI values in both sites showed a few outliers because of intra-annual variations or cloud mask omission errors. However, the TSR models were sensitive to these outliers and the trend was not biased, as the plots indicate in Figure 7c,d.
3.3. Landsat NDVI Trends and a Comparison with AVHRR
There were two concurrent periods between the Landsat and AVHRR data (1984–2015 and 2000–2015). From the view of the continental scale, the NDVI trends based on Landsat data were roughly similar to those derived from the GIMMS AVHRR NDVI3.1g dataset (Figure 4 and Figure 8) if the lack of Landsat observations before 2000 over the middle and eastern parts of the Russian tundra was ignored. Compared with AVHRR, the finer resolution Landsat observations acquired the greenness trend more precisely (Figure 9). Both the Landsat and AVHRR results showed an obvious greening trend over the southern Yamal Peninsula, the middle of the Gydan Peninsula and most parts of the CT (Figure 9a,c,e). The NDVI values of the Landsat time series for the selected locations were partially lower, as displayed in Figure 9. Although the Landsat 5 observations in the 1990s were occasionally sparse, as shown in the time series for the Gydan Peninsula site (Figure 9b), the overall browning trends were robust and coincident with the results from the AVHRR-based analysis.
There were also inconsistent geographic patterns of the NDVI trend between the two data sources for the Russian tundra. For the areas of the western EET and MST, the AVHRR analysis indicated extensive browning whereas in the Landsat analysis, many of these areas did not show any statistically significant trends (Figure 4 and Figure 8). Details can be seen in the 20 km × 20 km example in Figure 9c.
Both the AVHRR and Landsat NDVI trends indicated an overall greening of the Russian tundra. Landsat NDVI increased over 30.7% of the land area and decreased over 0.5% of the land area from 1984 to 2018 although it was stable across 68.8% of the land area. Similarly, greening occurred over 11.6% of the land area and browning over 0.5% of the land area from 2000 to 2018. Therefore, over the two periods of 1984–2000 and 2000–2018, greening was 56.7 times and 22.9 times more common than browning, respectively. AVHRR NDVI increased over 54.2% of the land area and decreased over 33.6% of the land area from 1984 to 2015 although it was stable over 12.1% of the land area. Additionally, greening occurred across 49.9% of the land area and browning across 39.9% of the land area from 2000 to 2015. Greening was thus 1.6 and 1.25 times more common than browning during the above two periods, respectively.
4. Discussion
4.1. Greenness Trend Analysis between the Landsat and Other Coarser Datasets
We provide here a pixel-by-pixel assessment of the greenness trend across the entire Russian tundra using fine resolution Landsat NDVI when Landsat datasets were available over 1984–2018. During 2000–2018, more than 100 valid observations for each pixel were used for the trend analysis except for a few areas with data gaps (2%). Greenness trends based on the Landsat data indicated that 30.7% and 0.5% of the Russian tundra experienced greening and browning, respectively, at a significance level of p < 0.05 when the water bodies were masked in the first step. The most significant greening occurred in the Yamal-Gydan tundra, Bering tundra and Chukchi Peninsula tundra (CT), which aligned with prior studies that analyzed coarse resolution datasets [44,45]. Greening trend values of NDVI/year aligned with others achieved elsewhere in the arctic regions [10,29,35,41,46].
The finer resolution Landsat observations have advantages for the evaluation of vegetation dynamics in heterogeneous tundra landscapes. Plant communities are highly reliant on micro- and macro-topographies in tundra areas and they are often interspersed with surface water, snow and bare land [2]. The places of greening and browning occurrence are relatively close and lead to divergent changes in coarse resolution images. In this case, small-scale browning/greening can be concealed by widespread unchanged areas or greening/browning when observed with coarse resolution sensors (Figure 9a,b). In a few cases, a mainly unchanged pixel could be detected as greening/browning at a coarse resolution if there was enough of a change in magnitude (Figure 9d). These examples show that the spatial scale of the Landsat data was much closer to the facts of ecological processes than AVHRR and could capture detailed changing patterns in the heterogeneous tundra areas.
Concerning browning, the AVHRR-based results had more browning areas than the Landsat-based results. According to our analysis, the coastal northwestern Yamal Peninsula and the northern MST tended to demonstrate browning more heavily according to the Landsat-based results. One possible explanation could be that GIMMS is more vulnerable to spectral mixing adjacent effects. This limitation is likely to happen in areas with a high cloud frequency, which frequently occurs also in coastal Alaska [47]. Additionally, as over a quarter of the lakes on Earth are located in northern high latitudes [48,49], it was important to mask the surface water layers before the vegetation trend analysis due to this adjacent effect. The surface water mask layer used in this study was based on the Landsat dataset from 2018 [50]. Although water area dynamics or lake shoreline changes can reflect, to an extent, the vegetation conditions, we did not pay attention to these small parts compared with the large area of tundra vegetation. With regard to the browning trends retrieved by AVHRR in the western EET, we knew that this was the greenest tundra in all of the Russian tundra [51] and that the vegetation cover was mainly erect dwarf shrubs or low shrubs [30]. From the field scale, the EET had a greening trend validated by an increasing shrub expansion [3]. Field experiments have shown that shrub canopies insulate tundra soils from the warmer air in summer, making soil temperatures 2 °C cooler than adjacent shrub-free areas [4,31,52,53]. Although cooler conditions could suppress the tundra plant growth and contribute to tundra browning [2], the overall greenness trend was unchanged from the space observations based on MODIS NDVI (250 m) [54], which was consistent with the result we attained using the Landsat NDVI time series during 2000–2018.
4.2. Comparison of the Identified Trends in Russia with Other Arctic Regions
Over the entire Russian tundra, NDVI had a mean decadal increase of 0.003 and 0.0035 NDVI units/year during 1984–2018 and 2000–2018, respectively. A similar greenness trend of 0.003 NDVI units/year was achieved for Alaska and Canada during 1984–2012 [10]; a 0.031 decadal NDVI increase was observed for the Arctic Mackenzie Delta during 1985–2018 [41], a 0.035 decadal NDVI increase was achieved for the Lena Delta during 1999–2014 [29] and a 0.031 decadal NDVI increase was observed for the Pechora catchment during 1985–2019 [46]. According to a recent tundra greenness report based on AVHRR NDVI datasets [45], the Chukotka Peninsula—one subregion of our study area in far eastern Russia—was reported to be one of the most significant greening tundra areas. This was in line with our analysis based on Landsat NDVI.
4.3. Limitations of Our Method on Greenness Trends over the Russian Arctic
Admittedly, a few slightly changed pixels could not be detected by our method in parts of the study area (e.g., southern Yamal tundra). A relatively stable condition with greening patches was achieved from 2000 to 2018 over the southern Yamal tundra in our study. However, as noted by Veselkin et al. [7], the average NDVI in the growing season over this area decreased by 0.036 ± 0.006 units/decade according to field data and the VEGA Science system [55] because of an increased number of domesticated reindeer. Several other studies have also indicated this zoogenic driver of a browning trend over this area [56,57]. Our underestimation of this browning trend may come from the global regression method (TSR) because several intra-annual NDVI differences were omitted. In future studies, the piecewise regression will be used and the breakpoints in the time series data will be detected with a time series analysis method, i.e., Breaks For Additive Seasonal and Trend (BFAST) [58,59,60], CCDC [61] or LandTrendr [62], which have been implemented into Google Earth Engine’s platform [63,64,65]. Widespread active layer detachments and retrogressive thaw slumps exist in the low arctic tundra zone of Yamal, West Siberia [35]. Vegetation cannot be fully regenerated after a landslide for ~30 years. It may take several more decades for regeneration to the original levels of composition, cover and productivity. This regeneration analysis also calls for more detailed time series analysis algorithms.
The total greenness trend over the entire Russian tundra was not validated by limited field measurements due to a lack of accessibility of the study area. However, we reported a 56.7:1 ratio of greening to browning from 1984 to 2018 and 22.9:1 from 2000 to 2018 based on the Landsat NDVI time series. In comparison with AVHRR, those ratios were partially consistent with the ratios shown in Berner et al. [2], who analyzed 50,000 sampling sites over the entire Arctic. Additionally, there have been a number of regional studies in the Russian tundra that have indicated a greening trend due to warming soil temperatures and shrub expansion, which were confirmed by very high resolution remotely sensed data [9] and dendrochronology data [3,16]. Although overall trend contradictions between the Landsat-based and AVHRR-based data exist in a few geographic regions owing to spatial scale issues [27,66], our Landsat-based results during 2000–2018 had a very similar pattern to a publication from Russian researchers who used MODIS NDVI (250 m) during 2000–2016 [54].In order to help us improve our understanding of vegetation greening in circumpolar areas of different vegetation types and geographic gradients, there is a high demand for higher spatial resolution observations in future research [66] as well as collecting field measurement data over focal scales and even the tundra biome scale [67,68,69].
5. Conclusions
In short, we provided continuous 30 m resolution greenness trend maps during the past three decades over the entire Russian tundra, which helped us to understand the response of arctic vegetation to climate change and anthropogenic disturbance. In contrast to coarse resolution trend maps (i.e., AVHRR), the pixel-by-pixel Landsat-based trend maps may contribute to a more detailed change driver attribution in the context of climate warming and oil gas exploitation activities in northern Siberia. With increasing computational capabilities and the launch of a variety of non-commercial satellites such as Sentinel-2 and Sentinel-1, we can enable a comparison of different sites over similar tundra landscapes and envision a circumpolar scale monitoring of rapidly changing permafrost regions with finer remotely sensed data. As prognostic research has indicated that there will be a gradual decrease in the temperature constrained over northern high latitudes in the 21st century [70], the comprehensive study of vegetation trends and the impact of other drivers on vegetation changes has become increasingly important. The datasets generated in this study are available on request from the corresponding author.
Author Contributions
Conceptualization, C.L. and H.H.; methodology, C.L.; formal analysis and data curation, C.L. and F.S.; writing—original draft preparation, C.L.; writing—review and editing, H.H. All authors have read and agreed to the published version of the manuscript.
Funding
The National Key Research and Development Program of China (2018YFC1407103).
Acknowledgments
This research was primarily supported by The National Key Research and Development Program of China (2018YFC1407103). We thank the USGS and Google Earth Engine for providing free access to data and analytical tools. Neal J. Pastick from USGS offered valuable suggestions on the trend analysis with the TSR model in GEE. We appreciate the three anonymous reviewers for their great work and thoughtful suggestions that helped us to improve this paper substantially.
Conflicts of Interest
The authors declare no conflict of interest.
References
- Post, E.; Alley, R.B.; Christensen, T.R.; Macias-Fauria, M.; Forbes, B.C.; Gooseff, M.N.; Iler, A.; Kerby, J.T.; Laidre, K.L.; Mann, M.E. The polar regions in a 2 C warmer world. Sci. Adv. 2019, 5, eaaw9883. [Google Scholar] [CrossRef] [PubMed] [Green Version]
- Berner, L.T.; Massey, R.; Jantz, P.; Forbes, B.C.; Macias-Fauria, M.; Myers-Smith, I.; Kumpula, T.; Gauthier, G.; Andreu-Hayles, L.; Gaglioti, B.V. Summer warming explains widespread but not uniform greening in the Arctic tundra biome. Nat. Commun. 2020, 11, 1–12. [Google Scholar] [CrossRef]
- Forbes, B.C.; Fauria, M.M.; Zetterberg, P. Russian Arctic warming and ‘greening’are closely tracked by tundra shrub willows. Glob. Chang. Biol. 2010, 16, 1542–1554. [Google Scholar] [CrossRef]
- Loranty, M.M.; Abbott, B.W.; Blok, D.; Douglas, T.A.; Epstein, H.E.; Forbes, B.C.; Jones, B.M.; Kholodov, A.L.; Kropp, H.; Malhotra, A. Reviews and syntheses: Changing ecosystem influences on soil thermal regimes in northern high-latitude permafrost regions. Biogeosciences 2018, 15, 5287–5313. [Google Scholar] [CrossRef] [Green Version]
- Wheeler, H.C.; Høye, T.T.; Svenning, J.C. Wildlife species benefitting from a greener Arctic are most sensitive to shrub cover at leading range edges. Glob. Chang. Biol. 2018, 24, 212–223. [Google Scholar] [CrossRef] [PubMed] [Green Version]
- Berteaux, D.; Gauthier, G.; Domine, F.; Ims, R.A.; Lamoureux, S.F.; Lévesque, E.; Yoccoz, N. Effects of changing permafrost and snow conditions on tundra wildlife: Critical places and times. Arct. Sci. 2016, 3, 65–90. [Google Scholar] [CrossRef] [Green Version]
- Veselkin, D.; Morozova, L.; Gorbunova, A. Decrease of NDVI values in the southern tundra of Yamal in 2001–2018 correlates with the size of domesticated reindeer population. Mod. Probl. Remote Sens. Earth Space 2021, 18, 143–155. [Google Scholar] [CrossRef]
- Verma, M.; to Bühne, H.S.; Lopes, M.; Ehrich, D.; Sokovnina, S.; Hofhuis, S.P.; Pettorelli, N. Can reindeer husbandry management slow down the shrubification of the Arctic? J. Environ. Manag. 2020, 267, 110636. [Google Scholar] [CrossRef]
- Arndt, K.A.; Santos, M.J.; Ustin, S.; Davidson, S.J.; Stow, D.; Oechel, W.C.; Tran, T.T.; Graybill, B.; Zona, D. Arctic greening associated with lengthening growing seasons in Northern Alaska. Environ. Res. Lett. 2019, 14, 125018. [Google Scholar] [CrossRef]
- Ju, J.; Masek, J.G. The vegetation greenness trend in Canada and US Alaska from 1984–2012 Landsat data. Remote Sens. Environ. 2016, 176, 1–16. [Google Scholar] [CrossRef]
- Pastick, N.J.; Jorgenson, M.T.; Goetz, S.J.; Jones, B.M.; Wylie, B.K.; Minsley, B.J.; Genet, H.; Knight, J.F.; Swanson, D.K.; Jorgenson, J.C. Spatiotemporal remote sensing of ecosystem change and causation across Alaska. Glob. Chang. Biol. 2019, 25, 1171–1189. [Google Scholar] [CrossRef]
- Raynolds, M.K.; Walker, D.A.; Verbyla, D.; Munger, C.A. Patterns of change within a tundra landscape: 22-year Landsat NDVI trends in an area of the northern foothills of the Brooks Range, Alaska. Arct. Antarct. Alp. Res. 2013, 45, 249–260. [Google Scholar] [CrossRef] [Green Version]
- Jia, G.J.; Epstein, H.E.; Walker, D.A. Greening of arctic Alaska, 1981–2001. Geophys. Res. Lett. 2003, 30, 2067. [Google Scholar] [CrossRef]
- Beck, P.S.; Goetz, S.J. Satellite observations of high northern latitude vegetation productivity changes between 1982 and 2008: Ecological variability and regional differences. Environ. Res. Lett. 2011, 6, 45501. [Google Scholar] [CrossRef]
- Frost, G.V.; Epstein, H.E.; Walker, D.A. Regional and landscape-scale variability of Landsat-observed vegetation dynamics in northwest Siberian tundra. Environ. Res. Lett. 2014, 9, 25004. [Google Scholar] [CrossRef] [Green Version]
- Macias-Fauria, M.; Forbes, B.C.; Zetterberg, P.; Kumpula, T. Eurasian Arctic greening reveals teleconnections and the potential for structurally novel ecosystems. Nat. Clim. Chang. 2012, 2, 613–618. [Google Scholar] [CrossRef] [Green Version]
- Frost, G.V.; Epstein, H.E. Tall shrub and tree expansion in Siberian tundra ecotones since the 1960s. Glob. Chang. Biol. 2014, 20, 1264–1277. [Google Scholar] [CrossRef]
- Loiko, S.; Klimova, N.; Kuzmina, D.; Pokrovsky, O. Lake Drainage in Permafrost Regions Produces Variable Plant Communities of High Biomass and Productivity. Plants 2020, 9, 867. [Google Scholar] [CrossRef] [PubMed]
- Chen, Y.; Liu, A.; Cheng, X. Vegetation grows more luxuriantly in Arctic permafrost drained lake basins. Glob. Chang. Biol. 2021, 27, 5865–5876. [Google Scholar] [CrossRef] [PubMed]
- Veremeeva, A.; Nitze, I.; Günther, F.; Grosse, G.; Rivkina, E. Geomorphological and Climatic Drivers of Thermokarst Lake Area Increase Trend (1999–2018) in the Kolyma Lowland Yedoma Region, North-Eastern Siberia. Remote Sens. 2021, 13, 178. [Google Scholar] [CrossRef]
- Zakharova, E.A.; Kouraev, A.V.; Stephane, G.; Franck, G.; Desyatkin, R.V.; Desyatkin, A.R. Recent dynamics of hydro-ecosystems in thermokarst depressions in Central Siberia from satellite and in situ observations: Importance for agriculture and human life. Sci. Total Environ. 2018, 615, 1290–1304. [Google Scholar] [CrossRef]
- Lashchinskiy, N.; Kartoziia, A.; Faguet, A. Permafrost degradation as a supporting factor for the biodiversity of tundra ecosystems. Contemp. Probl. Ecol. 2020, 13, 401–411. [Google Scholar] [CrossRef]
- Lim, A.G.; Loiko, S.V.; Kuzmina, D.M.; Krickov, I.V.; Shirokova, L.S.; Kulizhsky, S.P.; Vorobyev, S.N.; Pokrovsky, O.S. Dispersed ground ice of permafrost peatlands: Potential unaccounted carbon, nutrient and metal sources. Chemosphere 2021, 266, 128953. [Google Scholar] [CrossRef]
- Ukraintseva, N.; Leibman, M.; Streletskaya, I.; Mikhaylova, T. Geochemistry of plant-soil-permafrost system on landslide-affected slopes, Yamal, Russia as an indicator of landslide age. In Landslides in Cold Regions in the Context of Climate Change; Springer: New York, NY, USA, 2014; pp. 107–131. [Google Scholar]
- Pinzon, J.E.; Tucker, C.J. A non-stationary 1981–2012 AVHRR NDVI3g time series. Remote Sens. 2014, 6, 6929. [Google Scholar] [CrossRef] [Green Version]
- Tucker, C.J.; Pinzon, J.E.; Brown, M.E.; Slayback, D.A.; Pak, E.W.; Mahoney, R.; Vermote, E.F.; El Saleous, N. An extended AVHRR 8-km NDVI dataset compatible with MODIS and SPOT vegetation NDVI data. Int. J. Remote Sens. 2005, 26, 4485–4498. [Google Scholar] [CrossRef]
- Guay, K.C.; Beck, P.S.; Berner, L.T.; Goetz, S.J.; Baccini, A.; Buermann, W. Vegetation productivity patterns at high northern latitudes: A multi-sensor satellite data assessment. Glob. Chang. Biol. 2014, 20, 3147–3158. [Google Scholar] [CrossRef]
- Raynolds, M.K.; Walker, D.A. Increased wetness confounds Landsat-derived NDVI trends in the central Alaska North Slope region, 1985–2011. Environ. Res. Lett. 2016, 11, 85004. [Google Scholar] [CrossRef] [Green Version]
- Nitze, I.; Grosse, G. Detection of landscape dynamics in the Arctic Lena Delta with temporally dense Landsat time-series stacks. Remote Sens. Environ. 2016, 181, 27–41. [Google Scholar] [CrossRef]
- Raynolds, M.K.; Walker, D.A.; Balser, A.; Bay, C.; Campbell, M.; Cherosov, M.M.; Daniëls, F.J.; Eidesen, P.B.; Ermokhina, K.A.; Frost, G.V. A raster version of the Circumpolar Arctic Vegetation Map (CAVM). Remote Sens. Environ. 2019, 232, 111297. [Google Scholar] [CrossRef]
- Myers-Smith, I.H.; Hik, D.S. Shrub canopies influence soil temperatures but not nutrient dynamics: An experimental test of tundra snow–shrub interactions. Ecol. Evol. 2013, 3, 3683–3700. [Google Scholar] [CrossRef] [PubMed]
- Magnússon, R.Í.; Limpens, J.; Kleijn, D.; van Huissteden, K.; Maximov, T.C.; Lobry, S.; Heijmans, M.M. Shrub decline and expansion of wetland vegetation revealed by very high resolution land cover change detection in the Siberian lowland tundra. Sci. Total Environ. 2021, 782, 146877. [Google Scholar] [CrossRef]
- Lin, D.; Johnson, D.; Andresen, C.; Tweedie, C. High spatial resolution decade-time scale land cover change at multiple locations in the Beringian Arctic (1948–2000s). Environ. Res. Lett. 2012, 7, 25502. [Google Scholar] [CrossRef] [Green Version]
- Walker, D.; Epstein, H.; Raynolds, M.; Kuss, P.; Kopecky, M.; Frost, G.; Daniëls, F.; Leibman, M.; Moskalenko, N.; Matyshak, G. Environment, vegetation and greenness (NDVI) along the North America and Eurasia Arctic transects. Environ. Res. Lett. 2012, 7, 15504. [Google Scholar] [CrossRef] [Green Version]
- Verdonen, M.; Berner, L.T.; Forbes, B.C.; Kumpula, T. Periglacial vegetation dynamics in Arctic Russia: Decadal analysis of tundra regeneration on landslides with time series satellite imagery. Environ. Res. Lett. 2020, 15, 105020. [Google Scholar] [CrossRef]
- Olson, D.M.; Dinerstein, E.; Wikramanayake, E.D.; Burgess, N.D.; Powell, G.V.; Underwood, E.C.; D’amico, J.A.; Itoua, I.; Strand, H.E.; Morrison, J.C. Terrestrial Ecoregions of the World: A New Map of Life on Earth: A new global map of terrestrial ecoregions provides an innovative tool for conserving biodiversity. Bioscience 2001, 51, 933–938. [Google Scholar] [CrossRef]
- Huang, H.; Chen, Y.; Clinton, N.; Wang, J.; Wang, X.; Liu, C.; Gong, P.; Yang, J.; Bai, Y.; Zheng, Y. Mapping major land cover dynamics in Beijing using all Landsat images in Google Earth Engine. Remote Sens. Environ. 2017, 202, 166–176. [Google Scholar] [CrossRef]
- Gorelick, N.; Hancher, M.; Dixon, M.; Ilyushchenko, S.; Thau, D.; Moore, R. Google Earth Engine: Planetary-scale geospatial analysis for everyone. Remote Sens. Environ. 2017, 202, 18–27. [Google Scholar] [CrossRef]
- Roy, D.P.; Kovalskyy, V.; Zhang, H.; Vermote, E.F.; Yan, L.; Kumar, S.; Egorov, A. Characterization of Landsat-7 to Landsat-8 reflective wavelength and normalized difference vegetation index continuity. Remote Sens. Environ. 2016, 185, 57–70. [Google Scholar] [CrossRef] [Green Version]
- Fernandes, R.; Leblanc, S.G. Parametric (modified least squares) and non-parametric (Theil–Sen) linear regressions for predicting biophysical parameters in the presence of measurement errors. Remote Sens. Environ. 2005, 95, 303–316. [Google Scholar] [CrossRef]
- Fraser, R.H.; Olthof, I.; Kokelj, S.V.; Lantz, T.C.; Lacelle, D.; Brooker, A.; Wolfe, S.; Schwarz, S. Detecting landscape changes in high latitude environments using landsat trend analysis: 1. Visualization. Remote Sens. 2014, 6, 11533. [Google Scholar] [CrossRef] [Green Version]
- Olthof, I.; Fraser, R.H. Detecting landscape changes in high latitude environments using Landsat trend analysis: 2. Classification. Remote Sens. 2014, 6, 11558. [Google Scholar] [CrossRef] [Green Version]
- Goward, S.; Arvidson, T.; Williams, D.; Faundeen, J.; Irons, J.; Franks, S. Historical record of Landsat global coverage. Photogramm. Eng. Remote Sens. 2006, 72, 1155–1169. [Google Scholar] [CrossRef]
- Miles, V.V.; Esau, I. Spatial heterogeneity of greening and browning between and within bioclimatic zones in northern West Siberia. Environ. Res. Lett. 2016, 11, 115002. [Google Scholar] [CrossRef]
- Frost, G.; Bhatt, U.S.; Epstein, H.E.; Walker, D.A.; Raynolds, M.K.; Berner, L.; Bjerke, J.; Breen, A.L.; Forbes, B.C.; Goetz, S.J. Tundra Greenness. 2020. Available online: https://repository.library.noaa.gov/view/noaa/27903 (accessed on 3 October 2021).
- Cheţan, M.-A.; Dornik, A.; Ardelean, F.; Georgievski, G.; Hagemann, S.; Romanovsky, V.E.; Onaca, A.; Drozdov, D.S. 35 Years of Vegetation and Lake Dynamics in the Pechora Catchment, Russian European Arctic. Remote Sens. 2020, 12, 1863. [Google Scholar] [CrossRef]
- Frost, G.V.; Bhatt, U.S.; Macander, M.J.; Hendricks, A.S.; Jorgenson, M.T. Is Alaska’s Yukon–Kuskokwim Delta Greening or Browning? Resolving Mixed Signals of Tundra Vegetation Dynamics and Drivers in the Maritime Arctic. Earth Interact. 2021, 25, 76–93. [Google Scholar] [CrossRef]
- Lindgren, P.R.; Farquharson, L.M.; Romanovsky, V.E.; Grosse, G. Landsat-based lake distribution and changes in western Alaska permafrost regions between the 1970s and 2010s. Environ. Res. Lett. 2021, 16, 25006. [Google Scholar] [CrossRef]
- Lehner, B.; Döll, P. Development and validation of a global database of lakes, reservoirs and wetlands. J. Hydrol. 2004, 296, 1–22. [Google Scholar] [CrossRef]
- Pekel, J.-F.; Cottam, A.; Gorelick, N.; Belward, A.S. High-resolution mapping of global surface water and its long-term changes. Nature 2016, 540, 418. [Google Scholar] [CrossRef]
- Raynolds, M.; Walker, D.; Maier, H. NDVI patterns and phytomass distribution in the circumpolar Arctic. Remote Sens. Environ. 2006, 102, 271–281. [Google Scholar] [CrossRef]
- Blok, D.; Heijmans, M.M.; Schaepman-Strub, G.; Kononov, A.; Maximov, T.; Berendse, F. Shrub expansion may reduce summer permafrost thaw in Siberian tundra. Glob. Chang. Biol. 2010, 16, 1296–1305. [Google Scholar] [CrossRef]
- Nauta, A.L.; Heijmans, M.M.; Blok, D.; Limpens, J.; Elberling, B.; Gallagher, A.; Li, B.; Petrov, R.E.; Maximov, T.C.; Van Huissteden, J. Permafrost collapse after shrub removal shifts tundra ecosystem to a methane source. Nat. Clim. Chang. 2015, 5, 67–70. [Google Scholar] [CrossRef]
- Elsakov, V. Spatial and interannual heterogeneity of changes in the vegetation cover of Eurasian tundra: Analysis of 2000–2016 MODIS data. Curr. Probl. Remote Sens. Earth Space 2017, 14, 56–72. [Google Scholar] [CrossRef]
- Loupian, E.; Bartalev, S.; Tolpin, V.; Zharko, V.; Krasheninnikova Yu, S.; Oksyukevich, A.Y. VEGA satellite service applications in regional remote monitoring systems. J. Curr. Probl. Remote Sens. Earth Space 2014, 11, 215–232. [Google Scholar]
- Olofsson, J.; Stark, S.; Oksanen, L. Reindeer influence on ecosystem processes in the tundra. Oikos 2004, 105, 386–396. [Google Scholar] [CrossRef] [Green Version]
- Olofsson, J.; Oksanen, L.; Callaghan, T.; Hulme, P.E.; Oksanen, T.; Suominen, O. Herbivores inhibit climate-driven shrub expansion on the tundra. Glob. Chang. Biol. 2009, 15, 2681–2693. [Google Scholar] [CrossRef]
- Verbesselt, J.; Hyndman, R.; Newnham, G.; Culvenor, D. Detecting trend and seasonal changes in satellite image time series. Remote Sens. Environ. 2010, 114, 106–115. [Google Scholar] [CrossRef]
- Verbesselt, J.; Hyndman, R.; Zeileis, A.; Culvenor, D. Phenological change detection while accounting for abrupt and gradual trends in satellite image time series. Remote Sens. Environ. 2010, 114, 2970–2980. [Google Scholar] [CrossRef] [Green Version]
- Liu, C.; Melack, J.; Tian, Y.; Huang, H.; Jiang, J.; Fu, X.; Zhang, Z. Detecting Land Degradation in Eastern China Grasslands with Time Series Segmentation and Residual Trend analysis (TSS-RESTREND) and GIMMS NDVI3g Data. Remote Sens. 2019, 11, 1014. [Google Scholar] [CrossRef] [Green Version]
- Zhu, Z.; Woodcock, C.E. Continuous change detection and classification of land cover using all available Landsat data. Remote Sens. Environ. 2014, 144, 152–171. [Google Scholar] [CrossRef] [Green Version]
- Kennedy, R.E.; Yang, Z.; Cohen, W.B. Detecting trends in forest disturbance and recovery using yearly Landsat time series: 1. LandTrendr—Temporal segmentation algorithms. Remote Sens. Environ. 2010, 114, 2897–2910. [Google Scholar] [CrossRef]
- Arévalo, P.; Bullock, E.L.; Woodcock, C.E.; Olofsson, P. A suite of tools for continuous land change monitoring in google earth engine. Front. Clim 2020, 2, 576740. [Google Scholar] [CrossRef]
- Kennedy, R.; Yang, Z.; Gorelick, N.; Braaten, J.; Cavalcante, L.; Cohen, W.; Healey, S. Implementation of the LandTrendr Algorithm on Google Earth Engine. Remote Sens. 2018, 10, 691. [Google Scholar] [CrossRef] [Green Version]
- Hamunyela, E.; Rosca, S.; Mirt, A.; Engle, E.; Herold, M.; Gieseke, F.; Verbesselt, J. Implementation of BFASTmonitor algorithm on google earth engine to support large-area and sub-annual change monitoring using earth observation data. Remote Sens. 2020, 12, 2953. [Google Scholar] [CrossRef]
- Myers-Smith, I.H.; Kerby, J.T.; Phoenix, G.K.; Bjerke, J.W.; Epstein, H.E.; Assmann, J.J.; John, C.; Andreu-Hayles, L.; Angers-Blondin, S.; Beck, P.S. Complexity revealed in the greening of the Arctic. Nat. Clim. Chang. 2020, 10, 106–117. [Google Scholar] [CrossRef] [Green Version]
- Myers-Smith, I.H.; Grabowski, M.M.; Thomas, H.J.; Angers-Blondin, S.; Daskalova, G.N.; Bjorkman, A.D.; Cunliffe, A.M.; Assmann, J.J.; Boyle, J.S.; McLeod, E. Eighteen years of ecological monitoring reveals multiple lines of evidence for tundra vegetation change. Ecol. Monogr. 2019, 89, e01351. [Google Scholar] [CrossRef] [Green Version]
- Cunliffe, A.M.; Assmann, J.J.; Daskalova, G.N.; Kerby, J.T.; Myers-Smith, I.H. Aboveground biomass corresponds strongly with drone-derived canopy height but weakly with greenness (NDVI) in a shrub tundra landscape. Environ. Res. Lett. 2020, 15, 125004. [Google Scholar] [CrossRef]
- Shabanov, N.; Marshall, G.; Rees, G.; Bartalev, S.; Tutubalina, O.; Golubeva, E. Climate-driven phenological changes in the Russian Arctic derived from MODIS LAI time series 2000–2019. Environ. Res. Lett. 2021, 16, 84009. [Google Scholar] [CrossRef]
- Keenan, T.; Riley, W. Greening of the land surface in the world’s cold regions consistent with recent warming. Nat. Clim. Chang. 2018, 8, 825–828. [Google Scholar] [CrossRef]
Figure 1.
Location of the study area: (a) situation of the Russian tundra; (b) geographical regions of the tundra zone and the polar desert in Russia. Regions: EET: Eastern European Tundra; WET: Western European Tundra; MST: Middle Siberian Tundra; PD: Polar Desert; EST: Eastern Siberian Tundra; CT: Chukotka Tundra.

Figure 2.
Number of Landsat scenes using the selection criteria per month (July or August) over the entire study area during the observation period.
Figure 2.
Number of Landsat scenes using the selection criteria per month (July or August) over the entire study area during the observation period.

Figure 3.
Number of Landsat observations during three periods: (a) 1984–2018; (b) 1984–1999; (c) 2000–2018.
Figure 3.
Number of Landsat observations during three periods: (a) 1984–2018; (b) 1984–1999; (c) 2000–2018.

Figure 4.
The greenness trend maps based on Landsat data: (a) the greenness trend values from 1984 to 2018; (b) the greenness trend values from 2000 to 2018.
Figure 4.
The greenness trend maps based on Landsat data: (a) the greenness trend values from 1984 to 2018; (b) the greenness trend values from 2000 to 2018.

Figure 5.
NDVI trend in the period of 2000–2018 for the geographical regions: (a) CT; (b) EET; (c) EST; (d) MST; (e) PD; (f) WET. The color of the labels below the horizontal axis matches the legend in Figure 4.
Figure 5.
NDVI trend in the period of 2000–2018 for the geographical regions: (a) CT; (b) EET; (c) EST; (d) MST; (e) PD; (f) WET. The color of the labels below the horizontal axis matches the legend in Figure 4.

Figure 6.
NDVI trend for the EET and WET in the periods of 1984–1999 and 2000–2018. (a) NDVI trend over EET in 1984–1999; (b) NDVI trend over WET in 1984–1999; (c) NDVI trend over EET in 2000–2018; (d) NDVI trend over WET in 2000–2018. The color of the labels below the horizontal axis matches the legend in Figure 4.

Figure 7.
The NDVI trend details of a 200 km × 100 km area at the Lena River delta, Northern Yakutia, Russia, from 1984 to 2018: (a) NDVI stable site (73.503°N, 124.428°E); (b) greening site (73.074°N, 126.655°E); (c) the Landsat NDVI time series of location a; (d) the Landsat NDVI time series of location b.

Figure 8.
The greenness trend maps derived from AVHRR: (a) the greenness trend values from 1984 to 2015; (b) the greenness trend values from 2000 to 2015. The detailed trend results labeled a–e are displayed in Figure 9.
Figure 8.
The greenness trend maps derived from AVHRR: (a) the greenness trend values from 1984 to 2015; (b) the greenness trend values from 2000 to 2015. The detailed trend results labeled a–e are displayed in Figure 9.

Figure 9.
Each row shows a 20 km × 20 km site. From left to right: a 30 m Landsat false color image in an earlier year, a 30 m Landsat false color image in a recent year, a 30 m Landsat-based trend image, an AVHRR-based trend image, a Landsat NDVI time series (1984–2015) and an AVHRR NDVI time series (1984–2015) at the labeled pixel marked in Figure 4 and Figure 8, respectively. (a) Greening shrub tundra, centered at 67.544°N, 63.744°E, in the northeastern Komi Republic. (b) Browning trend due to natural resource development, centered at 70.417°N, 68.265°E, in the northern Yamal Peninsula. (c) Slightly greening graminoid tundra, centered at 72.582°N, 70.050°E, in the northern Yamal Peninsula. (d) Stable tussock sedge tundra, centered at 70.482°N, 145.857°E, in the northern Sakha Republic. (e) Greening tussock sedge tundra, centered at 69.141°N, 171.830°E, in northern Chukotka. The color code of the trend values is the same as in Figure 4 and Figure 8, respectively.


Table 1.
Geographic regions of the tundra zone and the polar desert and their corresponding ecozones in the WWF scheme.
Table 1.
Geographic regions of the tundra zone and the polar desert and their corresponding ecozones in the WWF scheme.
| Ecozone | Geographical Zone | Area (km2) 1 |
|---|---|---|
| Bering Tundra | Chukotka Tundra (CT) | 413,852.6 |
| Chukchi Peninsula Tundra | ||
| Northwest Siberian Coastal Tundra | Eastern European Tundra (EET) | 253,632 |
| Northeast Siberian Coastal Tundra | Eastern Siberian Tundra (EST) | 222,635 |
| Taimyr-Central Siberian Tundra | Middle Siberian Tundra (MST) | 593,717 |
| Novosibirsk Islands Arctic Desert | Polar Desert (PD) | 133,041.5 |
| Wrangel Island Arctic Desert | ||
| Arctic Desert | ||
| Yamal–Gydan Tundra | Western European Tundra (WET) | 308,689 |
1 Areas are calculated based on the projected coordinate system of the WGS 1984 EPSG Russia Polar Stereographic.
Table 2.
Area percent of the greenness trends in the selected geographical regions (EET and WET) during 1984–2018.
Table 2.
Area percent of the greenness trends in the selected geographical regions (EET and WET) during 1984–2018.
| Period | Region | Greening | Browning | Stable |
|---|---|---|---|---|
| 1984–2018 | EET | 40.3 | 0.3 | 59.4 |
| WET | 56.5 | 0.3 | 43.2 | |
| 1984–1999 (Phase 1) | EET | 2.3 | 1.0 | 96.7 |
| WET | 3.4 | 0.3 | 96.3 | |
| 2000–2018 (Phase 2) | EET | 6.6 | 0.4 | 93.0 |
| WET | 18 | 0.4 | 81.6 |
Publisher’s Note: MDPI stays neutral with regard to jurisdictional claims in published maps and institutional affiliations. |
© 2021 by the authors. Licensee MDPI, Basel, Switzerland. This article is an open access article distributed under the terms and conditions of the Creative Commons Attribution (CC BY) license (https://creativecommons.org/licenses/by/4.0/).
Share and Cite
MDPI and ACS Style
Liu, C.; Huang, H.; Sun, F. A Pixel-Based Vegetation Greenness Trend Analysis over the Russian Tundra with All Available Landsat Data from 1984 to 2018. Remote Sens. 2021, 13, 4933. https://0-doi-org.brum.beds.ac.uk/10.3390/rs13234933
AMA Style
Liu C, Huang H, Sun F. A Pixel-Based Vegetation Greenness Trend Analysis over the Russian Tundra with All Available Landsat Data from 1984 to 2018. Remote Sensing. 2021; 13(23):4933. https://0-doi-org.brum.beds.ac.uk/10.3390/rs13234933
Chicago/Turabian StyleLiu, Caixia, Huabing Huang, and Fangdi Sun. 2021. "A Pixel-Based Vegetation Greenness Trend Analysis over the Russian Tundra with All Available Landsat Data from 1984 to 2018" Remote Sensing 13, no. 23: 4933. https://0-doi-org.brum.beds.ac.uk/10.3390/rs13234933
Note that from the first issue of 2016, this journal uses article numbers instead of page numbers. See further details here.