
Susceptibility Assessment for Landslide Initiated along Power Transmission Lines
by
 , ,
, ,
Shuhao Liu
1,2, 
Kunlong Yin
1,2,
Chao Zhou
2,3,*,
Lei Gui
1,2,
Xin Liang
1,2, 
Wei Lin
1,2 and
Binbin Zhao
1,4 1
Faculty of Engineering, China University of Geosciences, Wuhan 430074, China
2
Research Center of Geohazard Monitoring and Warning in the Three Gorges Reservoir, Chongqing 404100, China
3
School of Geography and Information Engineering, China University of Geosciences, Wuhan 430078, China
4
Research Institute of Transmission and Transformation Projects, China Electric Power Research Institute Co., Ltd., State Grid Corporation of China, Beijing 100192, China
*
Author to whom correspondence should be addressed.
Remote Sens. 2021, 13(24), 5068; https://0-doi-org.brum.beds.ac.uk/10.3390/rs13245068
Submission received: 27 October 2021
/
Revised: 3 December 2021
/
Accepted: 7 December 2021
/
Published: 14 December 2021
(This article belongs to the Special Issue Remote Sensing in Development of Rapid Landslide Detection and Mapping Scenarios)
Abstract
:The power network has a long transmission span and passes through wide areas with complex topography setting and various human engineering activities. They lead to frequent landslide hazards, which cause serious threats to the safe operation of the power transmission system. Thus, it is of great significance to carry out landslide susceptibility assessment for disaster prevention and mitigation of power network. We, therefore, undertake an extensive analysis and comparison study between different data-driven methods using a case study from China. Several susceptibility mapping results were generated by applying a multivariate statistical method (logistic regression (LR)) and a machine learning technique (random forest (RF)) separately with two different mapping-units and predictor sets of differing configurations. The models’ accuracies, advantages and limitations are summarized and discussed using a range of evaluation criteria, including the confusion matrix, statistical indexes, and the estimation of the area under the receiver operating characteristic curve (AUROC). The outcome showed that machine learning method is well suitable for the landslide susceptibility assessment along transmission network over grid cell units, and the accuracy of susceptibility models is evolving rapidly from statistical-based models toward machine learning techniques. However, the multivariate statistical logistic regression methods perform better when computed over heterogeneous slope terrain units, probably because the number of units is significantly reduced. Besides, the high model predictive performances cannot guarantee a high plausibility and applicability of subsequent landslide susceptibility maps. The selection of mapping unit can produce greater differences on the generated susceptibility maps than that resulting from the selection of modeling methods. The study also provided a practical example for landslide susceptibility assessment along the power transmission network and its potential application in hazard early warning, prevention, and mitigation.
1. Introduction
As climate change intensified and energy demand expanded [1], the malfunctions of power network frequently occurred in recent years, such as the massive outage in Texas, in the United States, in 2021 [2,3], and the severe electricity shortage in northeast China since September 2021 [4]. As the main frame of power network, high-voltage transmission lines must span wide areas with different geographic and climatic features. Power transmission infrastructures are usually built on mountainous and hilly area in order to avoid the mutual interaction with human activity. However, such areas are also more prone to geohazard, especially landslide. According to statistics from China Electric Power Research Institute (CEPRI), in the most recent 5 years, a total of over 6000 transmission towers were under the potential threat of geohazards, and more than 25% were caused by landslides [5]. Therefore, the identification of landslide susceptible areas along the transmission network provides a basis for landslide early warning and integrated risk analysis, which significantly contribute to hazard prevention and the safety operation of power network.
Landslide susceptibility assessment aims to estimate the spatial probability of potential unstable slopes based on the information of past and present landslide events. The quality of landslide susceptibility map highly depends on the input data, especially the explanatory variables and landslides inventory [6,7,8,9]. Many approaches have been developed to quantitatively assess landslide susceptibility, which could be loosely grouped into three main groups, physically-driven models, knowledge-driven models, data-driven models, including statistically-based classification methods and recently well-developed machine learning (ML) methods [10,11,12,13]. Each of these approaches has shown its advantages and limitations. The quality of a heuristic model largely depends on the understanding of the real causes, and the conditioning factors of investigators in an area, currently, deliver a high prediction accuracy, however, inevitably introducing a lot of subjective experience [14,15]. Among them, only physically-driven method considers the physical interactions between landslide occurrence and its terrain condition. However, such models require high-quality geotechnical and hydrological input data on the specific site [16,17,18], thus only being applicable to small scales. Thus, in this article, we focus on the susceptibility assessment for landslide initiation along power transmission lines by using data-driven modeling methods in Geographic Information System (GIS) integrated environment.
Statistical methods are sustained on the basic assumption that landslides are recurrent events that occur independently, and future landslides are more likely to occur under the same geologic and morphologic conditions which led to a past landslide [19,20,21]. Besides, landslide conditioning factors are spatially linked and, therefore, can be used to predict future landslides [22,23]. The development of landslide is dominated by the geological and topographical conditions of the individual slopes, and also triggered by external factors, such as hydrological conditions, climatic conditions, human engineering activities, and earthquake [24]. More conditioning factors were identified for landslide susceptibility assessment in past literatures [12,25]. Consequently, the selection of landslide conditioning factors is a crucial step in landslide susceptibility mapping (LSM).
As a long-term research hotspot, basically all the issues about susceptibility mapping have been extensively studied, including the selection and optimization of explanatory variables, performance evaluation of various susceptibility models, and validation of the susceptibility assessment result [23,26]. Recently, comparisons between the performance of statistical and various novel machine learning models accounted for the majority of these landslide susceptibility studies [27,28,29,30]. Besides, uncertainty related with landslide inventories, predisposing factors, and analytical tools have been addressed in literature [31,32], but little attention has been given to the effects on landslide susceptibility maps resulting from the selection of the terrain mapping unit to represent predicting result [33,34]. The type and size of the terrain mapping unit may exert significant influence on the final results of the susceptibility assessment. The selection of the most adjusted terrain mapping unit for modeling depends on the scale and aim of the work, the quality and resolution of the available information, and the type and size of landslides [20,35,36,37]. Many authors stated that landslide susceptibility models performance increased when slope unit (SU) is used, probably owing to its clear topographic meaning and distinct ability to exploit heterogeneous information in a consistent way [33,36].
A number of landslide susceptibility related analyses were developed in the selected region due to the large amount of landslide and their potential threat to local habitations [38,39,40,41,42,43,44,45]. Most of them mainly focused on enhancing the performance of predictive model, by using hybrid machine learning models and hyper-parameter optimization methods, while neglecting the practical understanding and applications of landslide susceptibility result. Therefore, in this work, both SU and raster unit were employed to assess the landslide susceptibility along power transmission lines, aiming to obtain the most applicable LSM results.
Limited number of contributions are specifically oriented to the quantitative estimation of landslide spatial probability to some specific risk-bearing element, such as roads or power transmission lines, which has a long-linear distribution [46]. Jaiswal et al. presented a landslide hazard assessment study along a transportation line in southern India, combining the spatial, temporal and volume probability estimation. [47]. Peng et al. performed a regional landslide susceptibility mapping in the Three Gorges Area considering different exposed elements, including roads [38]. Das et al. developed and applied a quantitative methodology for landslide hazard assessment in a national highway corridor in the Himalayan region, using homogeneous susceptible units [48]. Ge et al. compared five different landslide susceptibility models using the case study in Longnan, City Gansu Province, with a 330-kV transmission line [49].
Besides, for tasks, such as LSM, there is some subjectivity when dealing with their performance evaluation. Both the performance of susceptibility models and the overall quality of the LSM result required a comprehensive evaluation. The set of tests included the degree of model fit, the robustness of the model, the uncertainty associated with the probabilistic estimate, and the model prediction skill [20,50,51,52,53]. Usually, the overall model performance determined by quantitative evaluation metrics is not enough to offer a full assessment of model reliability. A deeper sufficiency analysis of landslide susceptibility maps generated by the models is essential [13]. In such condition, Guzzetti et al. proposed a set of criteria, the Susceptibility Quality Level (SQL), to rank the quality of a landslide susceptibility assessment, which considers the type of tests performed to evaluate the quality of susceptibility assessments results [20].
This study was designed and performed with the purpose of producing a susceptibility map with the special attention to landslides along the power transmission networks. The high-voltage transmission lines in the Three Gorges Reservoir area (TGRA), China, was selected as a case study due to no landslide susceptibility map existing. The result provided a comparison case between LR and RF models employing two different mapping unit. Furthermore, a comprehensive validation of the generated LSM was presented.
2. Study Area
The study area is selected as the environs of the high-voltage transmission lines of 5 counties in the TGRA, China, namely Wanzhou, Yunyang, Wushan, Fengjie, and Badong, between longitudes 30°49′~31°41′ N and latitudes 107°55′~110°19′ E (Figure 1). Regarding the transmission lines as the center, the environs are created with a buffer distance of 2000 m. The distance is determined using the empirical equation of landslide runout distance proposed in Reference [54]. Landslides out of this range are considered to have no impact to the power transmission infrastructures.
The region is in the southwest of China, close to the middle reaches of the Yangtze River, with a maximum elevation of 2469 m. A complete power transmission network has been established in the area, which is mainly composed of 7 different high-voltage lines, such as Shenwan Line, Panlong Line, and Wanpan Line.
Influenced by the Himalayan orogeny, the study area is mainly moderate to low altitude mountains and river valleys sector of the TGRA. The current landscape was marked by Fengjie County as a topographic turning point, with low altitude mountains and hills in the west-side and higher altitude river valley and moderate mountains in the east [55]. Meanwhile, solid evidence of intensive tectonics is observed in the area, including large-scale structures, such as the Wanzhou synclinorium, Qiyueshan anticline, Wushan syncline, Guandukou syncline, and Xiannvshan fault [55].
The age of the bedrock varies from Cambrian to Quaternary, and the lithology transitioned from Jurassic and Triassic clastic rock (sandstone, mudstone, and sandstone interbedded with mudstone layers) to hard carbonaceous rocks (limestone, marlstone, and dolostone) from west to east, with a large number of stratified hard and soft interbedded rocks entrained. The so-called red strata are widespread in this area, mainly exposed in the west of Fengjie, which refer to sandstone, mudstone, and sandstone interbedded with mudstone layers, while the hard rocks form the steep gorges and valleys in the east of Fengjie.
3. Methods
In this study, we aim to assess the susceptibility for landslides along power transmission network with 2 data-driven methods and critically evaluate the generated LSM from the perspective of the practical application of the power transmission divisions.
The adopted procedure we implemented mainly consisted of four steps (Figure 2):
- (a)
- We construct a spatial database from various data sources and extract the landslide conditioning factors from the constructed database using two types of mapping units (raster and slope units).
- (b)
- We analyze the landslide conditioning factors through the optimize processes, which include multicollinearity diagnose and factor contribution analysis; then, the optimized factors are used to create the training and test datasets through resampling strategy.
- (c)
- We establish the susceptibility models using data-driven methods: logistic regression and random forest. The parameters of the involved machine learning methods are obtained by error and trial method. In addition, we assess and compare the models’ performance using some evaluation methods and an independent landslide dataset;
- (d)
- Lastly, we generate LSMs and comprehensively assess the overall performance of them. The main process is operated in ArcGIS.
3.1. Construction of a Spatial Database
3.1.1. Landslide Inventory
The study area has long been plagued by landslides, which are largely induced by intensive rainfall and reservoir water level fluctuation [55]. Since the study area has been cropped as a 4-km-wide belt-like area along the transmission line, a total of 264 landslides within this area were defined as potentially threats to power transmission lines. It should be noted that shallow landslides in colluvium are the most representative landslide in this area; however, rock falls and soil mass movements with small magnitude were excluded from this inventory due to the low degree of threat. Therefore, the remaining landslides in the record tend to have large volume. According to the existing information, the inventory contains 41 rock slides, with volume ranging from 3600 to 1.6 × 10⁷ m3, and 207 earth slides [56], with volume ranging from 500 to 7 × 10⁶ m3. However, landslides o medium (105 to 106 m3) to large-size (106 to 107 m3) account for 74% of the total landslides. A total of 50 landslides developed along the Yangtze River or its tributaries, which were considered to be seriously affected by groundwater level fluctuation. More than 90% percent of the recorded landslides were triggered or greatly affected by the intense rainfall which frequently occurred during rainy season. The main source of this landslide inventory is an old landslide inventory of the TGRA, supplemented with some recent reports of field investigations and landslide news.
Another new landslide database was obtained from the annual transmission line routine inspection implemented by the local power operation and maintenance department and collected by CEPRI. In total, 14 landslides were reported to have exerted varying degrees of influence on transmission towers in the study area from January 2016 to June 2020.
3.1.2. Landslide Conditioning Factors
Landslide conditioning factors need to represent the totality of possible influences that govern landslide triggering mechanisms. Their acquisition path and classification scheme are directly related to their different natures and environment characteristics [57]. Based on field investigation, work experience, past literature, and available data of the study area, various aspects of geo-spatial data were intentionally collected and used in this study; the information of data source is shown in Table 1.
A total of 15 conditioning factors are considered for the analysis, including: elevation, slope, aspect, profile curvature, plan curvature, topographic wetness index (TWI), Terrain roughness index (TRI), stream power index (SPI), lithology, distance from lineaments, distance from river, distance from road, bedding structure, Normalized difference vegetation index (NDVI), and land cover.
Slope, aspect, profile curvature, plan curvature, TRI, TWI, and SPI were obtained from digital elevation model (DEM) from ASTER GDEM with a 30 m resolution. Among them, slope, aspect, profile curvature, plan curvature, and TRI are conventional factors. TWI and SPI define the amount and power of water flow and accumulation, which can be used to quantify topographic influence on hydrological processes [24]. Lithology and faults were extracted by vectorizing geological maps at scales of 1:200,000. Bedding Structure indicates the intersection relationship between strata and slope, and it was subtracted by reclassifying the combination of stratum direction and slope direction based on topographic maps and geological maps [40]. NDVI was calculated using Landsat-8 OLI data. Distance from lineaments, rivers, and roads was derived after buffering the vectors of faults, rivers, and roads. The classification scheme for each conditioning factor was shown in Table 2.
3.1.3. Mapping Unit
Two types of assessment units, namely 30-m grid unit and SU, are adopted in this study. SU is defined as the region between ridges and valleys which is constrained by homogeneous slope aspect and degree of inclination [58]. It is widely used for its clear topographic condition.
SU could be delineated manually from topographic map or automatically partitioned by some auxiliary software with or without input parameters [58,59,60]. The main procedures are as follows: (i) filling the original and the reverse DEM; (ii) extracting the surface water flow direction and flow accumulation to establish the stream link; (iii) extracting the valley lines and ridge lines and establish watershed; and (iv) delineating the slope units based on the watershed; all of these can be found in many previous literature [33,61,62]. The whole procedure was integrated and automatically processed in an ArcGIS-based hydrologic analysis modules to avoid subjective uncertainty. Then, in order to rectify the unreasonable delineation due to the insufficient resolution of the applied DEM, the auto-generated SU map was manually modified using the digital terrain map. Table 3 shows the general characteristics of the mapping units.
3.1.4. Feature Selection Methods
Information gain ratio (IGR) is the most efficient and widely used feature selection method in susceptibility modeling [40,63,64], since they disregard the scales and units of the landslide conditioning factors and allow preliminary ranking [13].
IG is defined as a reduction in entropy E(Y) of a referent landslide inventory Y (with j classes), due to the informational interference of a conditioning factor F (with n classes). It measures the amount of information gained about a random variable from observing another random variable. The factor with a higher value of IGR indicates a higher contribution in the models. The Information Gain value for landslide conditioning factor Fi corresponding to the out-class Y (landslide and non-landslide) is measured as (Equation (1)):
where E(Y) is the entropy value of Fi and is calculated by using Equation (2); E(Y|Fi) is the entropy of Y after associating values of landslide conditioning factor Fi and is estimated using Equation (3)
where P(Yi) is the prior probability of the class Y and P(Yi|Fi) is the posterior probabilities of Y given the values of conditioning factor Fi.
Then, the IGR of the landslide conditioning factor Y is calculated as:
where IntI is the potential information generated by dividing the training data T into m subsets. The formula of IntI was shown as follows:
Multicollinearity occurs when the input variables have a high linear correlation between specific conditioning factors [65]. Variance Inflation Factors (VIF) provides an index of how much the variance of the estimated regression coefficient has increased due to collinearity. The degree of multicollinearity can be quantified by calculating the standard error variations of landslide conditioning factors. The formula of VIF is given as:
where R2 measured the extent of one specific factor that is correlated with another factor in linear regression. The lower the standard error and VIF value, the lower the multicollinearity risk.
3.2. Preparation of the Sample Datasets
Both of pixel-based unit and slope unit were used to cross tabulated with values of the landslide conditioning factors to obtain the corresponding attribute matrices for susceptibility assessment. It should be noted that all the individual SU is assumed to have a homogeneous terrain and lithologic condition; thus, the mode of the categorized factors values within the area of the SU is used to represent such discrete attribute.
The modeling dataset is comprised of the positive cases (with landslides) and the negative ones (with no landslide), with the target class value (landslide) set to ‘1’ and ‘0’ for non-landslide. In raster-based models, positive cells comprised 39,190 historical landslide cells, which were selected by the 264 landslide polygons. The same number of no landslide cells were extracted and randomly selected from the non-landslide areas, such as river networks or terrains with slope angle close to 0°. Finally, the whole model dataset was randomly separated into the training dataset (70%) and the test dataset (30%). In slope-based models, the same sampling strategy is used for model construction, including 231 landslide SU and 231 non-landslide SU. The modeling process is implemented in SPSS Modeler.
3.3. Landslide Susceptibility Models
3.3.1. Logistic Regression
Logistic regression (LR) [66] is a widely used multivariate statistical method for landslide susceptibility modeling which can reveal the empirical relationship between the target of landslide occurrence and various independent explanatory variables [67,68]. In the function of a usual linear LR model, the explanatory variables can be continuous, discrete interval, dichotomous, categorical, or any combination of them which do not need to be normally distributed [69]. The formula of LR is as follows:
where x1, x2, … xn are explanatory variables, and Y is a combination function that describe the linear relationship of these variables. For predicting the presence or absence of landslides, Y is used as a binary variable (0 or 1). The parameters b1, b2, … bn are the coefficients at normalized scale which allow for comparison of the relative importance of each independent variables on the response, and a is the intercept.
3.3.2. Random Forest
Random Forest is a supervised classification algorithm and is an ensemble method of a large set of independently trained decision trees [70]. With each tree voting for the class membership, the prediction of respective class assignment is determined according to the majority voting of all trees. Taking advantage of the variance among individual trees, such an ensemble method is considered to be robust, accurate, and less prone to overfitting, especially performing on complex dataset with undisclosed noisy variables [71]. RF is known to provide high accuracy rates with respect to outliers in predictors due to the use of random selection of the predictors (bagging) and the subsequently combination of model construction [72].
The main hyper-parameters in RF models include the number of trees, the maximum depth of trees, and the maximum number of features considered at each split. Parameters of the models was usually conducted by means of internal cross-validation, OOB (out of bag) method, which is used to estimate variable importance and the internal classification error.
3.4. LSMs Performance and Validation
It is necessary to evaluate both of the fitness of the applied landslide susceptibility models and the overall quality of the generated LSMs [20].
In this study, the confusion matrix, statistical indexes, and ROC curve were used to analyze the accuracy of susceptibility models [22,23]. In the confusion matrices, landslide samples are denoted as positive, while non-landslide samples are negative. The instance which correctly classified landslide samples is recorded as TP (true positive), and the instance which correctly classified non-landslide samples is TN (true negative); FP (false positive) are the non-landslide samples that are predicted as landslide; FN (false negative) are the landslide samples that are predicted to be non-landslide. A set of quantitative indexes, including accuracy (ACC), precision (PRE), TP rate, TN rate, and MCC, were estimated based on confusion matrices using the formulas shown as follows:
Among them, the overall accuracy (ACC) describes the number of correctly classified events of both landslide samples and non-landslide samples. Other confusion-matrix-based statistical index, such as precision, sensitivity, and specificity, were also used to evaluate the capabilities of the predictive models and generate Receiver operating characteristic (ROC), which is a type of curve consider ‘1-specificity’ and sensitivity as the horizontal and vertical axes, respectively [73]. The area under the ROC curves (AUC) can be implemented to evaluate the performance of the models, and the model with a larger AUC is considered to have a higher predictive capability. Besides, mean absolute error (MAE) and root mean squared error (RMSE) are useful indicators for predictive accuracy evaluation of continuous variables [74].
To test the quality of the generated LSM, the landslide distribution in different susceptibility levels was statistically analyzed. Meanwhile, area extent covered by each susceptibility class is validated against the landslide density distribution. The independent dataset, with landslides having occurred in the most recent 5 years (2016–2020), was also used in this procedure, and the overall performance of the LSMs were comprehensively discussed.
4. Results
4.1. Selection of Landslide Conditioning Factor
The selection of model parameters in landslide susceptibility makes a major determinant of model accuracy. Fifteen factors were prepared and considered as initial conditioning factors for landslide susceptibility assessment. VIF, which is used to detect and quantify multicollinearity between conditioning factors, and IGR, for factors contribution ranking, are implemented in this study for feature selection. The feature analysis shows that all the implemented landslide condition factors are linearly independent and effective to be used in the LSM for this study. As shown in Table 4, all factors are under the critical multicollinearity threshold (TOL < 0.2 or VIF > 5 [75]) and beyond the contribution threshold of IGR > 0. However, two factors (SPI and TWI) were removed in the SU form because of the unbalance in the sample size of various categories (namely, too much sample for a single category).
Furthermore, two conditioning factors (Altitude and Land cover) ranked among the top three in factor contribution in both raster and SU form. Distance from rivers and slope showed a high importance in SU form, while showing much less importance in raster form.
However, three conditioning factors, i.e., Aspect, Plan curvature, and Profile curvature, show relative less important to other topographic factors. It should be noted that geological factors (i.e., Lithology, distance from lineaments) are normally identified as critical factors in susceptibility models in the TGRA, owing to the complex geological condition. However, such factors seem to be less importance for landslides along power transmission network. Instead, environmental factors (i.e., Land cover, NDVI, Distance from river, Distance from roads) become the dominant factors.
4.2. Validation and Model Comparison
The machine learning models of RF and the multivariate statistical model of LR were applied to assess the susceptibility of landslide. To evaluate the performance of the applied models, several statistical index-based evaluation metrics were employed using both training and testing datasets (which are mentioned in Section 3.4).
In this case study, both the RF and the LR models show satisfactory performance, and the result of the testing dataset also shows the same trend as the training dataset (see Table 5). The RF model is able to outperform the LR models in raster-form concerning all the statistical index. When comparing the LR models with different mapping unit, the LR-SU model showed noticeable enhancement over the LR-Raster model.
The ROC curves in Figure 3 show the training and testing performance of the applied models. The RF model achieved excellent performance of AUC over 0.9, while LR also showed a good result, of AUC over 0.8. It is interesting to note that the LR-SU obviously outperformed the LR-Raster, despite the much smaller sample size.
4.3. Producing LSMs and Result Evaluation
Once the susceptibility models were successfully trained, they were used to determine the landslide susceptibility index for every pixel or SU, which are calculated as decimal float numbers range from 0 to 1. Then, the generated LSMs were reclassified into four levels by defining the limits of the cumulative distribution of the susceptibility values, namely low (40%), moderate (30%), high (20%), and very high (10%). This four-level classification system was mainly designed in order to correspond to the current criterion of hazard early-warning system of the CEPRI. Figure 4 shows the distribution of the landslide susceptibility classes and their defined susceptibility index (LSI) using three ensemble models, respectively. Comparing the distribution of LSI in each susceptibility level of the three generated LSMs, the model built with RF in raster unit has the highest threshold for very-high susceptibility area (LSI > 0.898), and the lowest LSI for low susceptibility area (<0.134). Such distribution of LSI indicates higher probability of landslide occurrence in area with very-high susceptibility, and lower likelihood of landslide occurrence in area with low susceptibility. This is followed by the LR model in SU, which has a threshold for very-high susceptibility level at LSI > 0.833, and LSI < 0.168 for low susceptibility level, respectively. This observation implies that, with more reasonable LSI distribution, the RF model in raster unit is less sensitive than the LR model in both raster unit and SU. This is probably because the RF model is more capable of dealing with redundant or scattered features and capturing the dominant factors.
The statistics of the susceptibility maps are shown in Table 6. All the generated LSM results fulfill the two basic spatial principals: (i) an increase in landslide density ratio from low susceptible classes to high susceptible classes; and (ii) high susceptibility classes covering small extents. For the LSM from RF model, 61.9% of the total landslides, covering 61.5% of the total landslide area, occurred in 7.75% of the study area which is categorized as very high susceptibility level. Only 9.43% of the landslides, covering less than 5% of the total landslide area, occurred in low to moderate susceptible area, which took up 72.85% of the total study area. As for the LR model in raster form, 49.8% of the total landslide, covering 48.73% of the total landslide area, occurred in 10% of the study area (which is classified as very high susceptibility level). However, 48 landslides (18.11%) occurred in low to moderate susceptible area, which took up 70.14% of the total study area. It is quite noticeable that the LR model showed a relatively weak predictive ability comparing to the machine learning RF model. Such an outcome provides another example in accord with the current trend which highlights the predictive power of advanced and evolving machine learning models.
When it comes to the LR models with different mapping unit, the results reveal that the proportion of landslides in each level of susceptibility region are quite close. In spite of the difference in size and total number of the mapping unit, LR-SU model has a better performance in landslide prediction compared to the LR-Raster model.
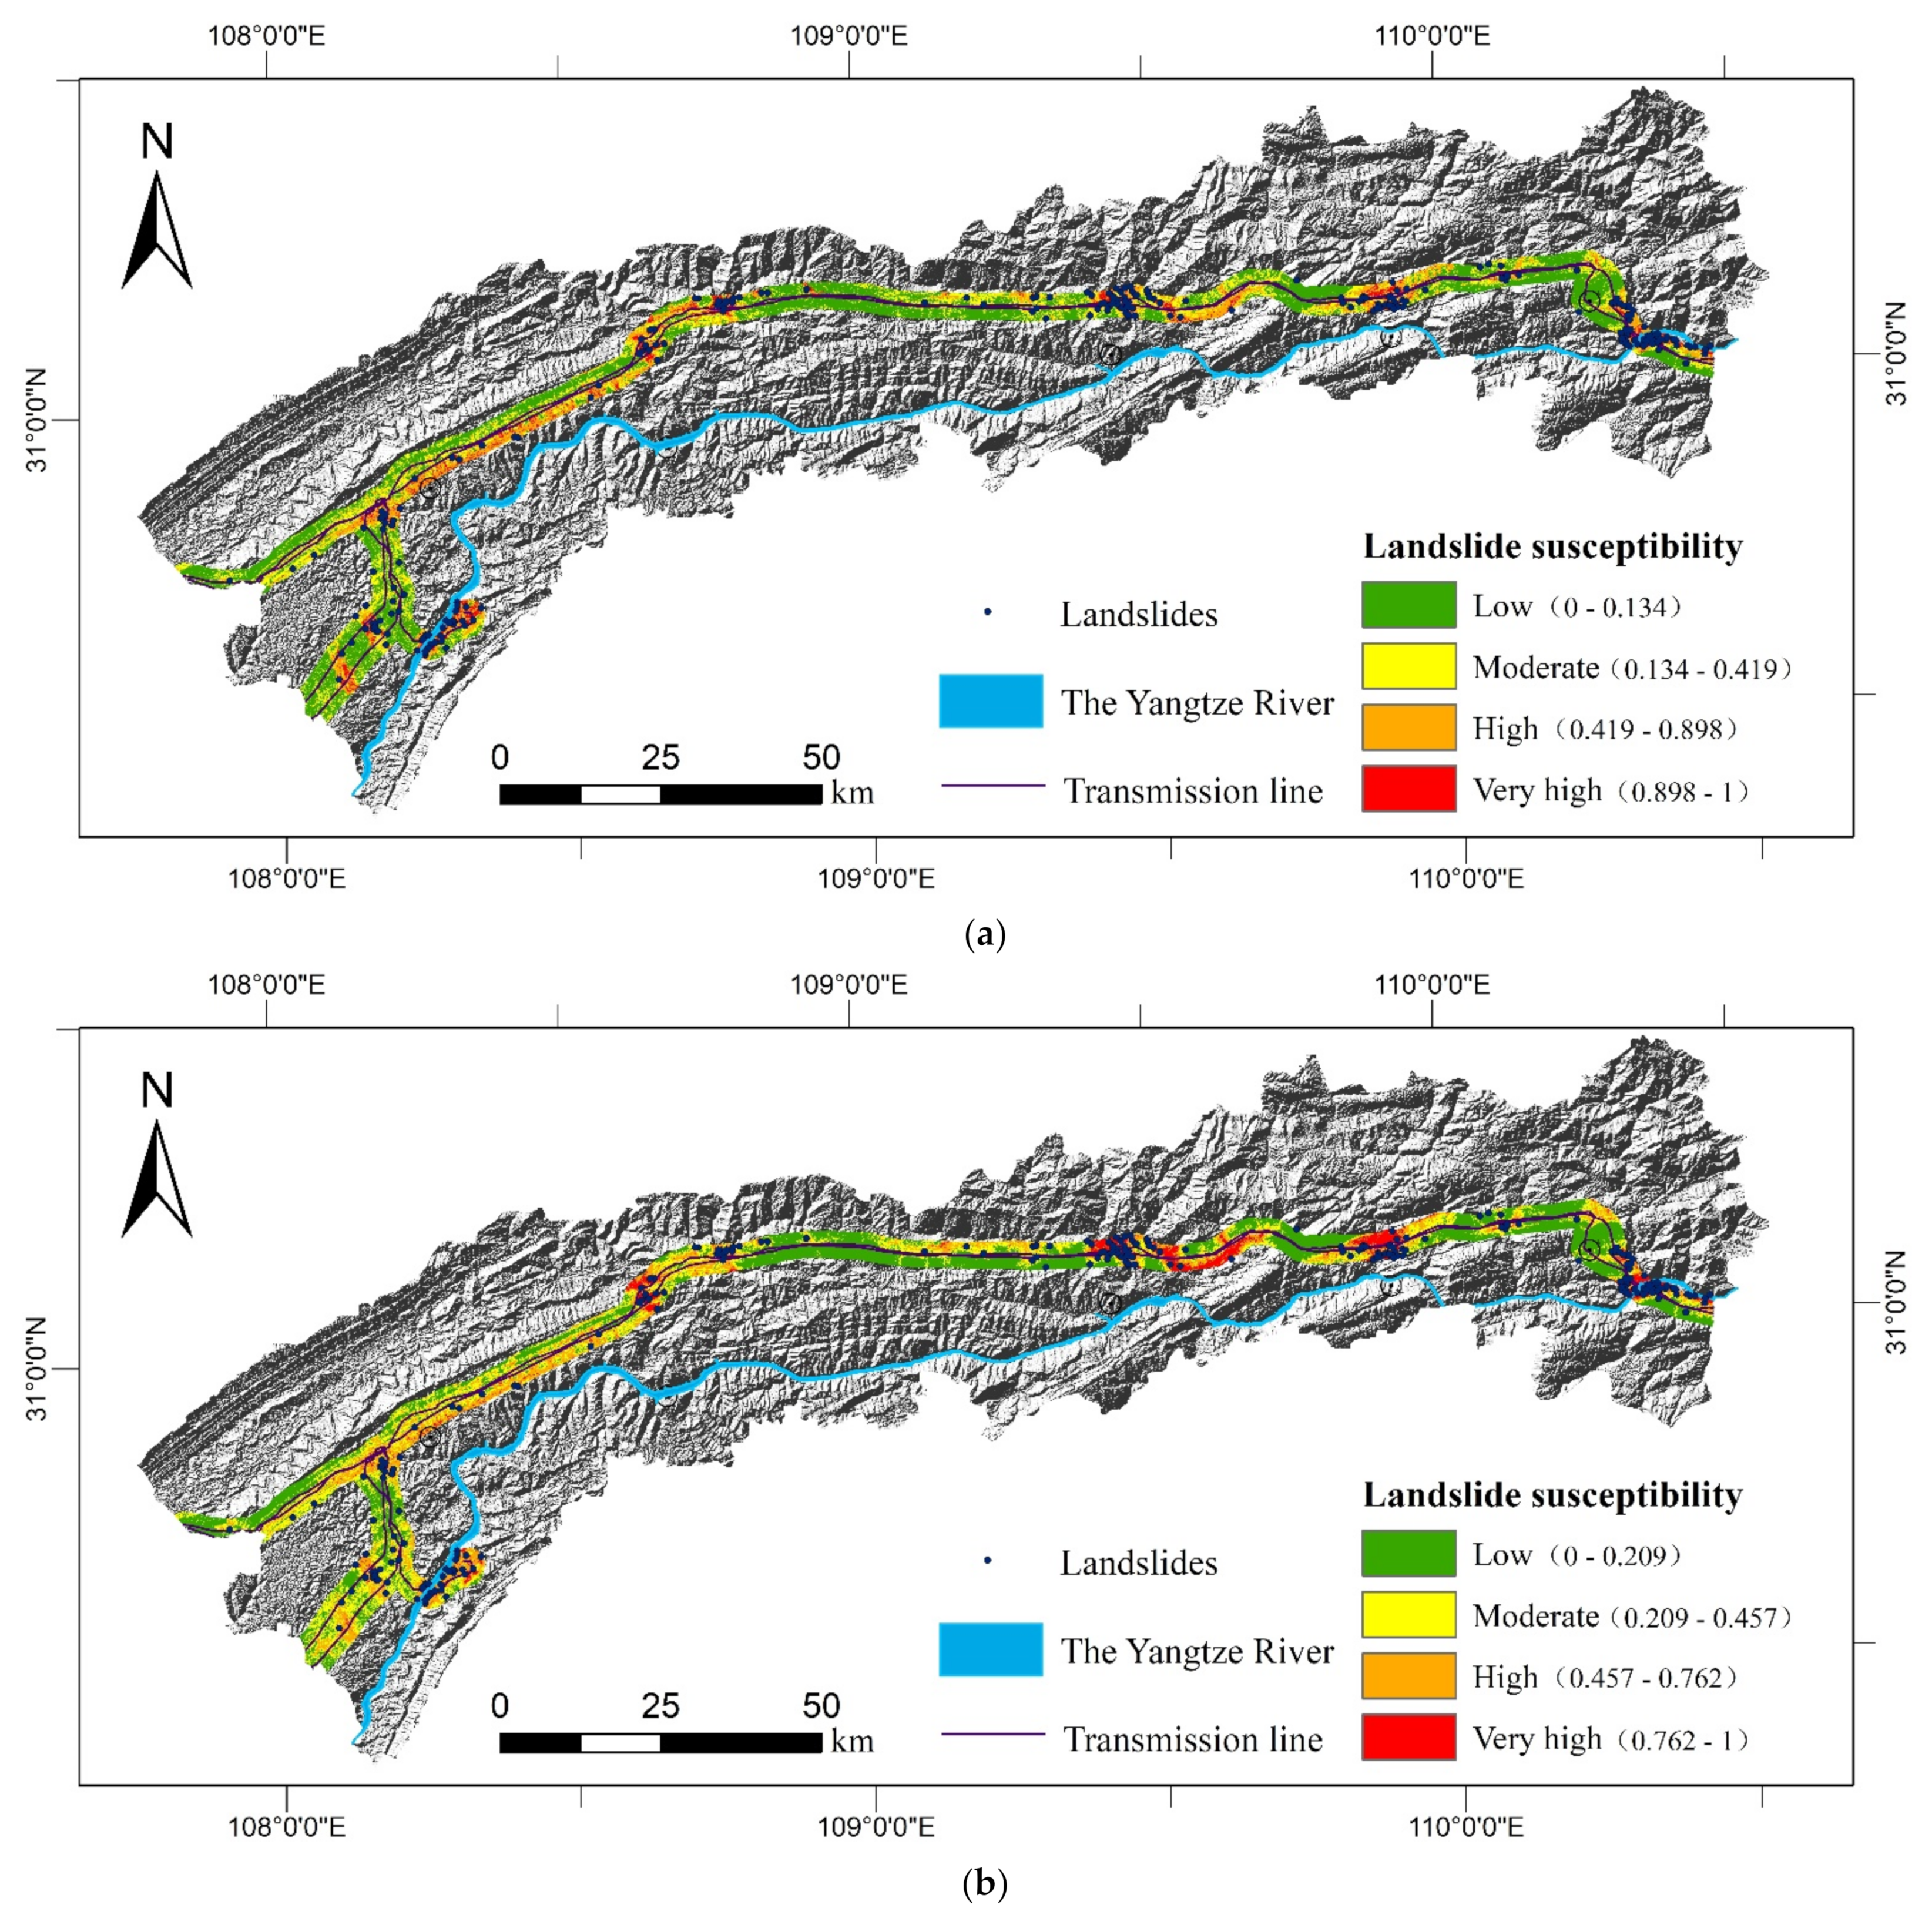
Furthermore, landslide data from 2016 to 2020 were applied for further validation. Fourteen towers were reported to have suffered varying degrees of damage from landslides during this period. By overlaying the 14 coordinated landslides on the LSMs generated by the LR-SU and RF models (Figure 5a,b), it can be discovered that most of the new landslides fell into the high- or very-high-susceptibility regions of LSMs generated by both LR-SU and RF models (Table 7), showing a certain prediction ability. Apart from this, 30 towers are predicted to be of very high susceptibility levels in all the LSM results, which need to be paid special attention in future line inspections.
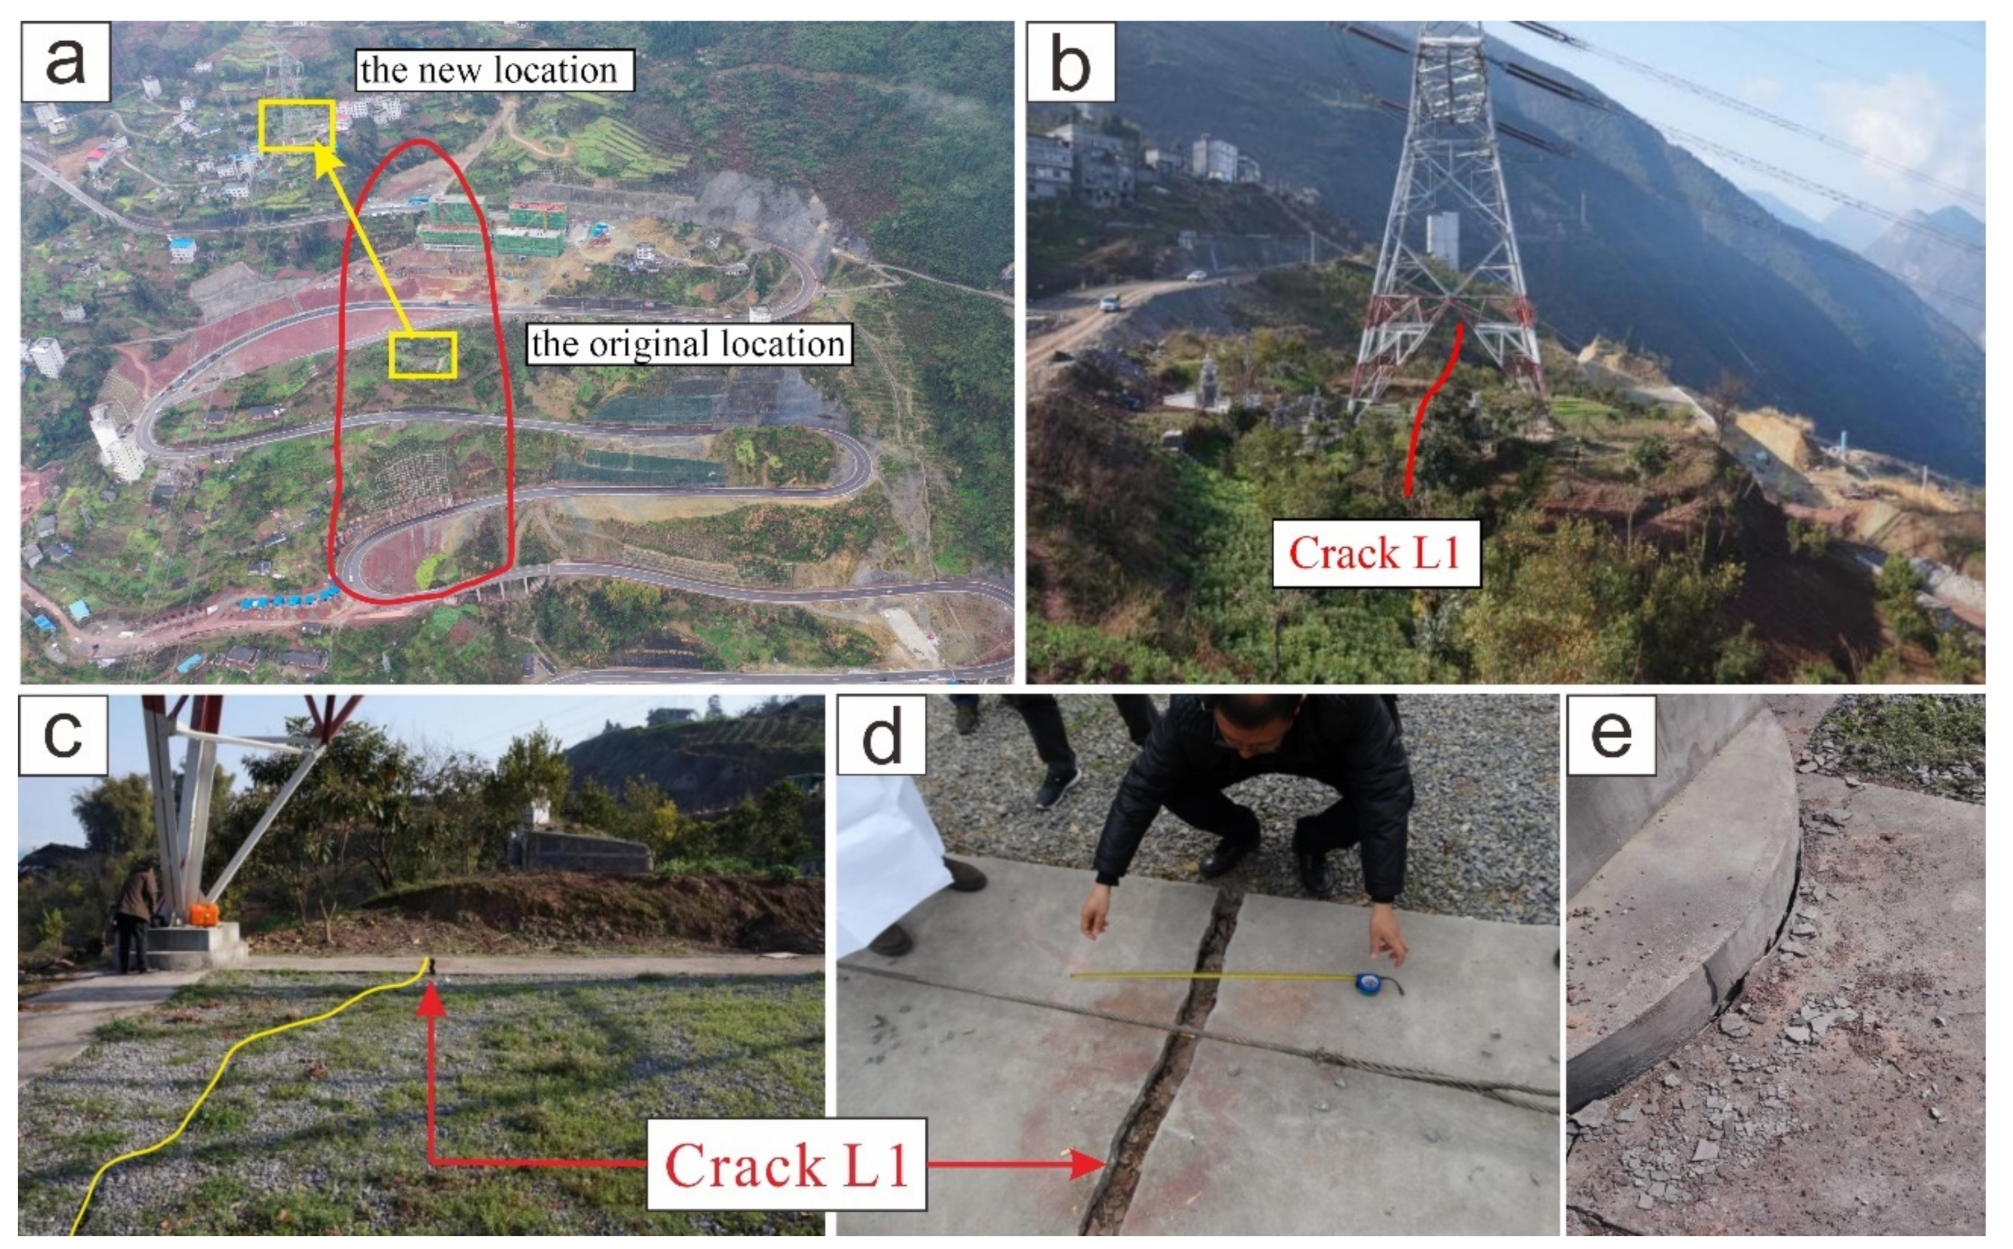
The No. 200 tower of the Panlong line, as a key transmission tower connecting the long-span line across the Yangtze River, was situated on the Yanzi ancient landslide. However, signs of landslide reactivation were found in February 2016 (Figure 6). The tower No. 200 was detected to have noticeable inclination and immediately relocated to the new site beyond the range of the landslide. Comparative analyses indicated that the Yanzi landslide was located in very-high-susceptibility regions of both LSM generated by the LR-SU model and the RF model. Field investigation indicated that the landslide revival was probably owing to the excavation for road construction and the related human engineering activities.
In July 2020, tower No. 152 of the Panlong line suffered severe threat from a small-size landslide occurred in Yunyang County (Figure 7). The field investigation revealed that the landslide was triggered by slope cutting for road construction (Figure 7) and short periods of intense rainfall. Comparative analyses indicated that the landslide was located in very-low-susceptibility regions of LSM by the LR-SU model, but it fell within a series of grids with moderate to high susceptibility levels in LSM generated by the RF model.
As a matter of fact, landslides do not happen on a single cell. For this reason, although the prediction ability of the RF model was significantly better than that of the LR model, sometimes, the LSM in SU form may perform better in result exhibition and practical application.
5. Discussion
5.1. Conditioning Factors
The contribution of landslide conditioning factors may largely vary in different models owing to the difference of models’ mechanism. Consequently, the methods which allow preliminary ranking of the factors’ contribution become popular for it may alleviate a lot of repetitive work from trial and error. The result of factors contribution analysis showed that terrain factors and environmental factors are taking the leading role, probably because the main type of geohazards in this study is colluvial landslide, which is different from the most prominent and focused reservoir landslides in the TGRA [40]. This result is generally in agreement with general rainfall triggered shallow landslide scenarios observed elsewhere. Besides, factors in different mapping unit may vary significantly in classification and spatial distribution, such as distance from rivers and slope, which showed a high importance in SU form, while much less importance in raster form. This is probably because the slope unit is assumed to have homogeneous attribute, and the sample sizes were much smaller comparing to that in raster form. Thus, the conversion from the original data source to other unit form also require specific rules and standard of classification.
5.2. Scale Effects and Problem of Suitable Mapping Unit
The scale effects of the employed mapping unit, particularly their type, size, and resolution, directly impact the precision and accuracy of LSMs [20,24]. The feature within a single unit is assumed to be homogenous, which evidently influences the form and categorization of landslide conditioning factors, further leading to the difference in factors contribution; see Table 4.
Despite their operational advantage and low computational burden over grid-cells, the slope terrain unit has clear physical meaning, and they can avoid the shortcomings of low geomorphological representativeness of grid-based susceptibility mapping which differentiate susceptibility conditions within the same slope [43]. It also allows for easy orientation to hazard exposed elements and comparison of their susceptibility levels (e.g., transmission towers), which is interesting for decision-makers, such as the local authorities or power managements, whereas the homogeneity inside the terrain units may lead to the overestimation of the susceptibility level, especially for some units with large size.
From previous studies, a pixel-based mapping unit is applicable to medium to large-scale area, while a slope-based mapping unit is more applicable to small-scale area. When it comes to larger scale, such as a province or nation, SU is rarely used for it brings more efforts in units delineation. In this case, in order to focus on landslides along the power transmission lines, the study region was customized as a long narrow belt, covering a wide range but medium area. Combining with the machine-learning techniques, pixel-based mapping unit provided LSMs with higher accuracy, while SU-based mapping unit gave clearer results with better display effect, which are a better fit for the future applications, such as risk assessment and early warning analysis. Consequently, considering the scale effect and finding the most suitable mapping unit and its best fit resolution for landslide susceptibility is another challenge in the future, especially when facing the different needs of different target audience.
5.3. Model Comparison and Performance Evaluation
Comparing to the evaluation of the predictive performances of the susceptibility models, the overall performance of LSM remains a more difficult task with higher uncertainty. From past literature, a broad set of metrics, which considered the specific advantages and limitations of different models, were employed in model evaluation [73], while the standard, such as Susceptibility Quality Level (SQL), used to comprehensively evaluate the quality of LSM, are not widely used.
In this study, the RF model in raster form showed better performance than the LR model in all the evaluation index. In addition, we also tried to construct RF models on the SU. However, the model failed to give a satisfactory result on testing sample, even if all the samples in the training set are almost correctly classified.
Based on our experience, the samples size in SU form were significantly reduced comparing to that in raster form. In addition, when solving such problem with small data volume, low data complexity, and nonlinearity, many complex machine learning models tend to occur overfitting phenomenon, while the LR model is relatively unlikely to cause such problem. This is probably the reason why complex machine learning models are rarely employed in studies of landslide susceptibility assessment based on SU, and most of the researchers have used simpler model, such as LR, to avoid such problems. Besides, in cases with massive data samples, using machine learning methods inevitably increases the computation burden and requires higher computing and storage capacity. Consequently, we reaffirm that the balance between model predictive ability and computation effort merit attention in different application scenarios.
Apart from this, we consider that the distribution of the model errors and uncertainties should be attached with special attention, even associated to the single mapping units. The landslide near tower No. 152 (Figure 7) provide a significant example showing such uncertainty. From the field investigation, we found that the landslide was mainly caused by the slope cutting during the road construction and triggered by a heavy rainfall in July. To some extent, the change in topography caused by the artificial slope cutting could be reflected by the distance from roads. However, the rainfall was sporadic incident which is not taken into the consideration of landslide susceptibility assessment. Besides, comparing to the raster unit, slope unit had an intrinsic difficulty in extracting the attributes of some conditioning factors, such as distance to roads and curvatures. Such difficulty is mainly due to the inherent homogeneity in slope-unit. It also brings uncertainties which are highly related to the evaluation scale and the size of individual SU, since the slope-unit with a large area tends to have more heterogeneous information inside. Moreover, much of the uncertainty are related to the landslide inventories. The information about the type, size and exact boundaries of landslides could greatly contribute to the LSM, and the representation of landslides (using points or polygons) could make a big difference in susceptibility modeling process, such as the sampling strategy, feature extraction method, and validation approach [33].
5.4. Challenge and Future Directions
Although LSMs provide indicative information on landslide occurrence, geographical landslide early warning systems (LEWS) have proven to be more effective tools for hazard prevention in practical use, especially for the giant, complex power transmission system which is operating under high load. However, LEWSs are complex systems which involve their design, implementation, operation, management, and verification [76], and current LEWSs usually combine landslide susceptibility assessment and analysis of rainfall thresholding and forecasting [77]. For a power transmission network, which is also seriously affected by geohazards, it is of great importance to attach more attention to the further application of LEWS.
Besides, extreme climate and weather events often cause great impacts on infrastructure, such as transport network, or power transmission system [78], such as the wide range of power failure in Texas, in the United States, in 2021, and the extreme rainstorm in Henan Province in July 2021. However, a general lack of studies of extreme events and its influence on geohazard has been noted in the previous literatures [79,80]. From the perspective of decision-maker, how to enhance the resistance of key facilities to such extreme events and the generated geohazards remains to be discovered. Three aspects of technologies, including the wide application of LEWS, rapid hazard identification, and fast safety protection technology for power transmission facilities, are highly recommended in application and required to be further developed in the future.
6. Conclusions
Using different data-driven methods and two different mapping units, we presented several landslide susceptibility assessment results in an area along power transmission lines. The LSM results were validated and compared, and it supported the following conclusions: In this study area, environmental factors, such as altitude, tend to have a higher contribution to landslide occurrence. In raster form, the RF model performs better than LR with a training and validation accuracy of 0.927 and 0.915, respectively. However, the RF model fails to give out a reasonable LSM output in SU form, probably owing to the insufficient training sample in model construction. However, the LR model in SU form also presented better performance over its raster form, with the AUC value of 0.882 and 0.879 for training and verifying samples, respectively. In general, LSMs generated by machine learning methods could be a valuable tool in hazard prevention along power transmission lines.
Author Contributions
S.L. organized the data and wrote the paper, W.L. and X.L. analyzed and processed the data, K.Y. and L.G. supervised and reviewed the work, C.Z. reviewed and edited the manuscript, B.Z. provided necessary analytical data. All authors have read and agreed to the published version of the manuscript.
Funding
This research was funded by the National Natural Science Foundation of China, grant numbers 41907253 and the National Key R&D Program of China, grant number No. 2018YFC0809400.
Acknowledgments
We thank the reviewers for their suggestions that improved the quality of this paper.
Conflicts of Interest
The authors declare no conflict of interest.
References
- Arias, P.; Bellouin, N.; Coppola, E.; Jones, R.; Krinner, G.; Marotzke, J.; Naik, V.; Palmer, M.; Plattner, G.K.; Rogelj, J.; et al. Climate Change 2021: The Physical Science Basis. Contribution of Working Group I to the Sixth Assessment Report of the Intergovernmental Panel on Climate Change; Masson-Delmotte, V.P., Zhai, A., Pirani, S.L., Connors, C., Péan, S., Berger, N., Caud, Y., Chen, L., Goldfarb, M.I., Gomis, M.I., et al., Eds.; MIPCC; Cambridge University Press: Cambridge, UK, 2021; In Press. [Google Scholar]
- Wu, D.; Zheng, X.; Xu, Y.; Olsen, D.; Xia, B.; Singh, C.; Xie, L. An open-source extendable model and corrective measure assessment of the 2021 Texas power outage. Adv. Appl. Energy 2021, 4, 100056. [Google Scholar] [CrossRef]
- Busby, J.W.; Baker, K.; Bazilian, M.D.; Gilbert, A.Q.; Grubert, E.; Rai, V.; Rhodes, J.D.; Shidore, S.; Smith, C.A.; Webber, M.E. Cascading risks: Understanding the 2021 winter blackout in Texas. Energy Res. Soc. Sci. 2021, 77, 102106. [Google Scholar] [CrossRef]
- Chang, J. What Happened behind the Nationwide Power Cuts? Available online: https://m.bjnews.com.cn/detail/163266456914638.html (accessed on 26 September 2021).
- State Grid Equipment Department and China Electric Power Research Institute. Investigation Report on Geological Hazards of Power Transmission Lines (Yearly Report), 2017–2021; State Grid Equipment Department and China Electric Power Research Institute: Beijing, China, 2021. [Google Scholar]
- Brabb, E.E. Innovative approaches to landslide hazard mapping. In Proceedings of the 4th International Landslide Symposium, Toronto, ON, Canada, 23–31 August 1985; pp. 307–324. [Google Scholar]
- Dai, F.; Lee, C.; Ngai, Y. Landslide risk assessment and management: An overview. Eng. Geol. 2002, 64, 65–87. [Google Scholar] [CrossRef]
- Guzzetti, F.; Mondini, A.C.; Cardinali, M.; Fiorucci, F.; Santangelo, M.; Chang, K.-T. Landslide inventory maps: New tools for an old problem. Earth-Sci. Rev. 2012, 112, 42–66. [Google Scholar] [CrossRef] [Green Version]
- Chalkias, C.; Polykretis, C.; Karymbalis, E.; Soldati, M.; Ghinoi, A.; Ferentinou, M. Exploring spatial non-stationarity in the relationships between landslide susceptibility and conditioning factors: A local modeling approach using geographically weighted regression. Bull. Int. Assoc. Eng. Geol. 2020, 79, 2799–2814. [Google Scholar] [CrossRef]
- Baeza, C.; Corominas, J. Assessment of shallow landslide susceptibility by means of multivariate statistical techniques. Earth Surf. Process. Landforms 2001, 26, 1251–1263. [Google Scholar] [CrossRef]
- Akgun, A. A comparison of landslide susceptibility maps produced by logistic regression, multi-criteria decision, and likelihood ratio methods: A case study at İzmir, Turkey. Landslides 2011, 9, 93–106. [Google Scholar] [CrossRef]
- Reichenbach, P.; Rossi, M.; Malamud, B.D.; Mihir, M.; Guzzetti, F. A review of statistically-based landslide susceptibility models. Earth-Sci. Rev. 2018, 180, 60–91. [Google Scholar] [CrossRef]
- Merghadi, A.; Yunus, A.P.; Dou, J.; Whiteley, J.; ThaiPham, B.; Bui, D.T.; Avtar, R.; Abderrahmane, B. Machine learning methods for landslide susceptibility studies: A comparative overview of algorithm performance. Earth-Sci. Rev. 2020, 207, 103225. [Google Scholar] [CrossRef]
- Gokceoglu, C.; Aksoy, H. Landslide susceptibility mapping of the slopes in the residual soils of the Mengen region (Turkey) by deterministic stability analyses and image processing techniques. Eng. Geol. 1996, 44, 147–161. [Google Scholar] [CrossRef]
- Iverson, R.M. Landslide triggering by rain infiltration. Water Resour. Res. 2000, 36, 1897–1910. [Google Scholar] [CrossRef] [Green Version]
- Baum, R.L.; Godt, J.W.; Savage, W.Z. Estimating the timing and location of shallow rainfall-induced landslides using a model for transient, unsaturated infiltration. J. Geophys. Res. Earth Surf. 2010, 118, 1999. [Google Scholar] [CrossRef]
- Goetz, J.N.; Guthrie, R.; Brenning, A. Integrating physical and empirical landslide susceptibility models using generalized additive models. Geomorphology 2011, 129, 376–386. [Google Scholar] [CrossRef]
- Tofani, V.; Bicocchi, G.; Rossi, G.; Segoni, S.; D’Ambrosio, M.; Casagli, N.; Catani, F. Soil characterization for shallow landslides modeling: A case study in the Northern Apennines (Central Italy). Landslides 2017, 14, 755–770. [Google Scholar] [CrossRef] [Green Version]
- Varnes, D. Landslide hazard zonation: A review of principles and practice. Nat. Hazards 1984, 3. Available online: https://trid.trb.org/view.aspx?id=281932 (accessed on 5 December 2021).
- Guzzetti, F.; Reichenbach, P.; Cardinali, M.; Galli, M.; Ardizzone, F. Probabilistic landslide hazard assessment at the basin scale. Geomorphology 2005, 72, 272–299. [Google Scholar] [CrossRef]
- Van Westen, C.J.; Castellanos, E.; Kuriakose, S.L. Spatial data for landslide susceptibility, hazard, and vulnerability assessment: An overview. Eng. Geol. 2008, 102, 112–131. [Google Scholar] [CrossRef]
- Fell, R.; Corominas, J.; Bonnard, C.; Cascini, L.; Leroi, E.; Savage, W.Z. Guidelines for landslide susceptibility, hazard and risk zoning for land use planning. Eng. Geol. 2008, 102, 85–98. [Google Scholar] [CrossRef] [Green Version]
- Corominas, J.; Van Westen, C.; Frattini, P.; Cascini, L.; Malet, J.-P.; Fotopoulou, S.; Catani, F.; Van Den Eeckhaut, M.; Mavrouli, O.; Agliardi, F.; et al. Recommendations for the quantitative analysis of landslide risk. Bull. Int. Assoc. Eng. Geol. Environ. 2013, 73, 209–263. [Google Scholar] [CrossRef]
- Moore, I.D.; Grayson, R.B.; Ladson, A.R. Digital terrain modelling: A review of hydrological, geomorphological, and biological applications. Hydrol. Process 1991, 5, 3–30. [Google Scholar] [CrossRef]
- Guzzetti, F.; Reichenbach, P.; Ardizzone, F.; Cardinali, M.; Galli, M. Estimating the quality of landslide susceptibility models. Geomorphology 2006, 81, 166–184. [Google Scholar] [CrossRef]
- Gokceoglu, C.; Sezer, E.A. A statistical assessment on international landslide literature (1945–2008). Landslides 2009, 6, 345–351. [Google Scholar] [CrossRef]
- Choi, J.; Oh, H.-J.; Lee, H.-J.; Lee, C.; Lee, S. Combining landslide susceptibility maps obtained from frequency ratio, logistic regression, and artificial neural network models using ASTER images and GIS. Eng. Geol. 2012, 124, 12–23. [Google Scholar] [CrossRef]
- Pham, B.T.; Prakash, I.; Bui, D.T. Spatial prediction of landslides using a hybrid machine learning approach based on Random Subspace and Classification and Regression Trees. Geomorphology 2018, 303, 256–270. [Google Scholar] [CrossRef]
- Peethambaran, B.; Anbalagan, R.; Kanungo, D.; Goswami, A.; Shihabudheen, K. A comparative evaluation of supervised machine learning algorithms for township level landslide susceptibility zonation in parts of Indian Himalayas. Catena 2020, 195, 104751. [Google Scholar] [CrossRef]
- Xiao, T.; Yin, K.; Yao, T.; Liu, S. Spatial prediction of landslide susceptibility using GIS-based statistical and machine learning models in Wanzhou County, Three Gorges Reservoir, China. Acta Geochim. 2019, 38, 654–669. [Google Scholar] [CrossRef]
- Du, J.; Glade, T.; Woldai, T.; Chai, B.; Zeng, B. Landslide susceptibility assessment based on an incomplete landslide inventory in the Jilong Valley, Tibet, Chinese Himalayas. Eng. Geol. 2020, 270, 105572. [Google Scholar] [CrossRef]
- Feizizadeh, B.; Blaschke, T. An uncertainty and sensitivity analysis approach for GIS-based multicriteria landslide susceptibility mapping. Int. J. Geogr. Inf. Sci. 2014, 28, 610–638. [Google Scholar] [CrossRef] [Green Version]
- Jacobs, L.; Kervyn, M.; Reichenbach, P.; Rossi, M.; Marchesini, I.; Alvioli, M.; Dewitte, O. Regional susceptibility assessments with heterogeneous landslide information: Slope unit- vs. pixel-based approach. Geomorphology 2020, 356, 107084. [Google Scholar] [CrossRef]
- Zêzere, J.; Pereira, S.; Melo, R.; Oliveira, S.; Garcia, R. Mapping landslide susceptibility using data-driven methods. Sci. Total Environ. 2017, 589, 250–267. [Google Scholar] [CrossRef]
- Eeckhaut, M.; Reichenbach, P.; Guzzetti, F.; Rossi, M.; Poesen, J. Combined landslide inventory and susceptibility assessment based on different mapping units: An example from the Flemish Ardennes, Belgium. Nat. Hazards Earth Syst. Sci. 2009, 9, 507–521. [Google Scholar] [CrossRef] [Green Version]
- Domènech, G.; Alvioli, M.; Corominas, J. Preparing first-time slope failures hazard maps: From pixel-based to slope unit-based. Landslides 2019, 17, 249–265. [Google Scholar] [CrossRef] [Green Version]
- Zhao, Y.; Wang, R.; Jiang, Y.; Liu, H.; Wei, Z. GIS-based logistic regression for rainfall-induced landslide susceptibility mapping under different grid sizes in Yueqing, Southeastern China. Eng. Geol. 2019, 259, 105147. [Google Scholar] [CrossRef]
- Peng, L.; Niu, R.; Huang, B.; Wu, X.; Zhao, Y.; Ye, R. Landslide susceptibility mapping based on rough set theory and support vector machines: A case of the Three Gorges area, China. Geomorphology 2014, 204, 287–301. [Google Scholar] [CrossRef]
- Zhu, A.-X.; Wang, R.; Qiao, J.; Qin, C.-Z.; Chen, Y.; Liu, J.; Du, F.; Lin, Y.; Zhu, T. An expert knowledge-based approach to landslide susceptibility mapping using GIS and fuzzy logic. Geomorphology 2014, 214, 128–138. [Google Scholar] [CrossRef]
- Zhou, C.; Yin, K.; Cao, Y.; Ahmed, B.; Li, Y.; Catani, F.; Pourghasemi, H.R. Landslide susceptibility modeling applying machine learning methods: A case study from Longju in the Three Gorges Reservoir area, China. Comput. Geosci. 2018, 112, 23–37. [Google Scholar] [CrossRef] [Green Version]
- Li, C.; Fu, Z.; Wang, Y.; Tang, H.; Yan, J.; Gong, W.; Yao, W.; Criss, R.E. Susceptibility of reservoir-induced landslides and strategies for increasing the slope stability in the Three Gorges Reservoir Area: Zigui Basin as an example. Eng. Geol. 2019, 261, 105279. [Google Scholar] [CrossRef]
- Xiao, T.; Segoni, S.; Chen, L.; Yin, K.; Casagli, N. A step beyond landslide susceptibility maps: A simple method to investigate and explain the different outcomes obtained by different approaches. Landslides 2020, 17, 627–640. [Google Scholar] [CrossRef] [Green Version]
- Sun, D.; Shi, S.; Wen, H.; Xu, J.; Zhou, X.; Wu, J. A hybrid optimization method of factor screening predicated on GeoDetector and Random Forest for Landslide Susceptibility Mapping. Geomorphology 2021, 379, 107623. [Google Scholar] [CrossRef]
- Sun, D.; Xu, J.; Wen, H.; Wang, D. Assessment of landslide susceptibility mapping based on Bayesian hyperparameter optimization: A comparison between logistic regression and random forest. Eng. Geol. 2021, 281, 105972. [Google Scholar] [CrossRef]
- Wang, Y.; Sun, D.; Wen, H.; Zhang, H.; Zhang, F. Comparison of Random Forest Model and Frequency Ratio Model for Landslide Susceptibility Mapping (LSM) in Yunyang County (Chongqing, China). Int. J. Environ. Res. Public Health 2020, 17, 4206. [Google Scholar] [CrossRef]
- Ferlisi, S.; Marchese, A.; Peduto, D. Quantitative analysis of the risk to road networks exposed to slow-moving landslides: A case study in the Campania region (southern Italy). Landslides 2021, 18, 303–319. [Google Scholar] [CrossRef]
- Jaiswal, P.; van Westen, C.J.; Jetten, V. Quantitative landslide hazard assessment along a transportation corridor in southern India. Eng. Geol. 2010, 116, 236–250. [Google Scholar] [CrossRef]
- Das, I.; Stein, A.; Kerle, N.; Dadhwal, V. Probabilistic landslide hazard assessment using homogeneous susceptible units (HSU) along a national highway corridor in the northern Himalayas, India. Landslides 2011, 8, 293–308. [Google Scholar] [CrossRef] [Green Version]
- Ge, Y.; Chen, H.; Zhao, B.; Tang, H.; Lin, Z.; Xie, Z.; Lv, L.; Zhong, P.; Zhao, B. A comparison of five methods in landslide susceptibility assessment: A case study from the 330-kV transmission line in Gansu Region, China. Environ. Earth Sci. 2018, 77, 662. [Google Scholar] [CrossRef]
- Chung, C.-J.F.; Fabbri, A.G. Validation of Spatial Prediction Models for Landslide Hazard Mapping. Nat. Hazards 2003, 30, 451–472. [Google Scholar] [CrossRef]
- Frattini, P.; Crosta, G.; Carrara, A. Techniques for evaluating the performance of landslide susceptibility models. Eng. Geol. 2010, 111, 62–72. [Google Scholar] [CrossRef]
- Petschko, H.; Brenning, A.; Bell, R.; Goetz, J.; Glade, T. Assessing the quality of landslide susceptibility maps—case study Lower Austria. Nat. Hazards Earth Syst. Sci. 2014, 14, 95–118. [Google Scholar] [CrossRef] [Green Version]
- Goetz, J.N.; Brenning, A.; Petschko, H.; Leopold, P. Evaluating machine learning and statistical prediction techniques for landslide susceptibility modeling. Comput. Geosci. 2015, 81, 1–11. [Google Scholar] [CrossRef]
- Corominas, J. The angle of reach as a mobility index for small and large landslides. Can. Geotech. J. 1996, 33, 260–271. [Google Scholar] [CrossRef]
- Yin, K.; Chen, L.; Ma, F.; Cheng, W. Practice and thinking of landslide risk management considering their secondary consequences in the Three-Gorges Reservoir, China. Landslides Eng. Slopes. Exp. Theory Pract. 2016, 3, 2097–2105. [Google Scholar] [CrossRef]
- Varnes, D.J. Slope movement types and processes. In Landslides, Analysis and Control, Special Report 176: Transportation Research Board; Schuster, R.L., Krizek, R.J., Eds.; National Academy of Sciences: Washington, DC, USA, 1978; pp. 11–33. [Google Scholar]
- Golovko, D.; Roessner, S.; Behling, R.; Wetzel, H.-U.; Kleinschmit, B. Evaluation of Remote-Sensing-Based Landslide Inventories for Hazard Assessment in Southern Kyrgyzstan. Remote Sens. 2017, 9, 943. [Google Scholar] [CrossRef] [Green Version]
- Alvioli, M.; Marchesini, I.; Reichenbach, P.; Rossi, M.; Ardizzone, F.; Fiorucci, F.; Guzzetti, F. Automatic delineation of geomorphological slope units with r.slopeunits v1.0 and their optimization for landslide susceptibility modeling. Geosci. Model. Dev. 2016, 9, 3975–3991. [Google Scholar] [CrossRef] [Green Version]
- Camilo, D.C.; Lombardo, L.; Mai, P.M.; Dou, J.; Huser, R. Handling high predictor dimensionality in slope-unit-based landslide susceptibility models through LASSO-penalized Generalized Linear Model. Environ. Model. Softw. 2017, 97, 145–156. [Google Scholar] [CrossRef] [Green Version]
- Alvioli, M.; Guzzetti, F.; Marchesini, I. Parameter-free delineation of slope units and terrain subdivision of Italy. Geomorphology 2020, 358, 107124. [Google Scholar] [CrossRef]
- Schlögel, R.; Marchesini, I.; Alvioli, M.; Reichenbach, P.; Rossi, M.; Malet, J.-P. Optimizing landslide susceptibility zonation: Effects of DEM spatial resolution and slope unit delineation on logistic regression models. Geomorphology 2018, 301, 10–20. [Google Scholar] [CrossRef]
- Chen, L.; Guo, Z.; Yin, K.; Shrestha, D.P.; Jin, S. The influence of land use and land cover change on landslide susceptibility: A case study in Zhushan Town, Xuan’en County (Hubei, China). Nat. Hazards Earth Syst. Sci. 2019, 19, 2207–2228. [Google Scholar] [CrossRef] [Green Version]
- Quinlan, J.R. Improved Use of Continuous Attributes in C4. J. Artif. Intell. Res. 1996, 4, 77–90. [Google Scholar] [CrossRef] [Green Version]
- Bui, D.T.; Tuan, T.A.; Klempe, H.; Pradhan, B.; Revhaug, I. Spatial prediction models for shallow landslide hazards: A comparative assessment of the efficacy of support vector machines, artificial neural networks, kernel logistic regression, and logistic model tree. Landslides 2016, 13, 361–378. [Google Scholar] [CrossRef]
- Dormann, C.F.; Elith, J.; Bacher, S.; Buchmann, C.; Carl, G.; Carré, G.; Marquéz, J.R.G.; Gruber, B.; Lafourcade, B.; Leitão, P.J.; et al. Collinearity: A review of methods to deal with it and a simulation study evaluating their performance. Ecography 2012, 36, 27–46. [Google Scholar] [CrossRef]
- Cox, D.R. The Regression Analysis of Binary Sequences. J. R. Stat. Soc. Ser. B (Stat. Methodol.) 1958, 20, 215–232. [Google Scholar] [CrossRef]
- Heckmann, T.; Gegg, K.; Gegg, A.; Becht, M. Sample size matters: Investigating the effect of sample size on a logistic regression susceptibility model for debris flows. Nat. Hazards Earth Syst. Sci. 2014, 14, 259–278. [Google Scholar] [CrossRef] [Green Version]
- Budimir, M.E.A.; Atkinson, P.M.; Lewis, H.G. A systematic review of landslide probability mapping using logistic regression. Landslides 2015, 12, 419–436. [Google Scholar] [CrossRef] [Green Version]
- Lombardo, L.; Mai, P.M. Presenting logistic regression-based landslide susceptibility results. Eng. Geol. 2018, 244, 14–24. [Google Scholar] [CrossRef]
- Breiman, L. Random Forests. Mach. Learn. 2001, 45, 5–32. [Google Scholar] [CrossRef] [Green Version]
- Catani, F.; Lagomarsino, D.; Segoni, S.; Tofani, V. Landslide susceptibility estimation by random forests technique: Sensitivity and scaling issues. Nat. Hazards Earth Syst. Sci. 2013, 13, 2815–2831. [Google Scholar] [CrossRef] [Green Version]
- Rossi, M.; Guzzetti, F.; Reichenbach, P.; Mondini, A.C.; Peruccacci, S. Optimal landslide susceptibility zonation based on multiple forecasts. Geomorphology 2010, 114, 129–142. [Google Scholar] [CrossRef]
- Dou, J.; Yunus, A.P.; Bui, D.T.; Merghadi, A.; Sahana, M.; Zhu, Z.; Chen, C.-W.; Han, Z.; Pham, B.T. Improved landslide assessment using support vector machine with bagging, boosting, and stacking ensemble machine learning framework in a mountainous watershed, Japan. Landslides 2020, 17, 641–658. [Google Scholar] [CrossRef]
- Gupta, R.; Kanungo, D.; Arora, M.; Sarkar, S. Approaches for comparative evaluation of raster GIS-based landslide susceptibility zonation maps. Int. J. Appl. Earth Obs. Geoinf. 2008, 10, 330–341. [Google Scholar] [CrossRef]
- O’Brien, R.M. A Caution Regarding Rules of Thumb for Variance Inflation Factors. Qual. Quant. 2007, 41, 673–690. [Google Scholar] [CrossRef]
- Guzzetti, F.; Gariano, S.L.; Peruccacci, S.; Brunetti, M.T.; Marchesini, I.; Rossi, M.; Melillo, M. Geographical landslide early warning systems. Earth-Sci. Rev. 2020, 200, 102973. [Google Scholar] [CrossRef]
- Segoni, S.; Tofani, V.; Rosi, A.; Catani, F.; Casagli, N. Combination of Rainfall Thresholds and Susceptibility Maps for Dynamic Landslide Hazard Assessment at Regional Scale. Front. Earth Sci. 2018, 6, 85. [Google Scholar] [CrossRef] [Green Version]
- Pregnolato, M.; Ford, A.; Glenis, V.; Wilkinson, S.; Dawson, R. Impact of Climate Change on Disruption to Urban Transport Networks from Pluvial Flooding. J. Infrastruct. Syst. 2017, 23, 04017015. [Google Scholar] [CrossRef] [Green Version]
- Lazzari, M.; Piccarreta, M. Landslide Disasters Triggered by Extreme Rainfall Events: The Case of Montescaglioso (Basilicata, Southern Italy). Geosciences 2018, 8, 377. [Google Scholar] [CrossRef] [Green Version]
- Tsuguti, H.; Seino, N.; Kawase, H.; Imada, Y.; Nakaegawa, T.; Takayabu, I. Meteorological overview and mesoscale characteristics of the Heavy Rain Event of July 2018 in Japan. Landslides 2018, 16, 363–371. [Google Scholar] [CrossRef]
Figure 1.
Geological map of the study area, with location and landslide distribution of the transmission line corridor. The main strata include: T1d, T1j, T2b, T3xj: Triassic Daye Formation, Jialingjiang Formation, Badong Formation, and Xujiahe Formation, respectively; J1: Jurassic Zhenzhuchong Formation and Ziliujing Formation; J2: Jurassic Shaximiao Formation and Xingtiangou formation; J3p, J3s: Jurassic Penglaizhen Formation, and Suining Formation.

Figure 2.
The flowchart of the landslide susceptibility assessment.

Figure 3.
The ROC curves of the RF and LR models in landslide susceptibility assessment: (a) training and (b) testing.
Figure 3.
The ROC curves of the RF and LR models in landslide susceptibility assessment: (a) training and (b) testing.

Figure 4.
Landslide Susceptibility Maps obtained with different models and mapping units. (a) RF model in Raster unit. (b) LR model in Raster unit. (c) LR model in SU.
Figure 4.
Landslide Susceptibility Maps obtained with different models and mapping units. (a) RF model in Raster unit. (b) LR model in Raster unit. (c) LR model in SU.


Figure 5.
Distribution of recent landslides from 2016–2021 in generated landslide susceptibility maps, with 2 representative landslides showing in detail view: (a) LSM by RF model in raster unit; (b) LSM by LR model in SU.
Figure 5.
Distribution of recent landslides from 2016–2021 in generated landslide susceptibility maps, with 2 representative landslides showing in detail view: (a) LSM by RF model in raster unit; (b) LSM by LR model in SU.


Figure 6.
The Yanzi ancient Landslides located at Badong County: (a) general view of the Yanzi landslide, the yellow rectangles indicating the position of the tower before and after relocation. (b–d) Crack L1 on the foundation platform of the transmission tower; (e) cracks in one leg of the transmission tower.

Figure 7.
Landslide that occurred at Yunyang County in July 2020: (a) general view of the landslide which posed threat to the tower No. 152. (b) The aerial image of the landslide, where the landslide boundary is marked with yellow line.
Figure 7.
Landslide that occurred at Yunyang County in July 2020: (a) general view of the landslide which posed threat to the tower No. 152. (b) The aerial image of the landslide, where the landslide boundary is marked with yellow line.


Table 1.
Data and data sources.
| Data Type | Data Source | Data Form | Data Scale |
|---|---|---|---|
| DEM | ASTER satellite | raster | 30 m |
| Land cover | Chongqing Municipal Bureau of Land and Resources | raster | 30 m |
| Geological map | National geological data museum | Vector | 1:200,000 |
| Satellite image | Landsat-8 OLI data | raster | 30 m |
| Administrative division | Geospatial Data Cloud platform | Vector | 1:100,000 |
| Water system | Geospatial Data Cloud platform | Vector | 1:100,000 |
| Road network | Geospatial Data Cloud platform | Vector | 1:100,000 |
| Power transmission towers | China Electric Power Research Institute | Vector (Coordinate) | / |
Table 2.
Classification of landslide conditioning factors.
| Factors | Class | Classification Standard |
|---|---|---|
| Altitude (m) | 5 | 1. <400; 2. 400–600; 3. 600–800; 4. 800–1000; 5. >1000 |
| Slope (°) | 5 | 1. <10°; 2. 10°~20°; 3. 20°~30°; 4. 30°~40°; 5. 40°~90°; |
| Aspect | 9 | 1. Flat; 2. North; 3. Northeast; 4. East; 5. Southeast; 6. South; 7. Southwest; 8. West; 9. Northwest |
| Profile curvature | 6 | 1. <−2; 2. −2~−1; 3. −1~0; 4. 0~1; 5. 1~2; 6. >2; |
| Plan curvature | 6 | 1. <−2; 2. −2~−1; 3. −1~0; 4. 0~1; 5. 1~2; 6. >2; |
| Lithology | 8 | 1.J3p/J3sn/J2x; 2. J2s/J2xs; 3. J2q/J1t; 4. J1-2z/J1zl; 5. T3-J1x/T3xj/T3j; 6. T2b; 7. T1d/T1-2j; 8.Q; |
| Bedding Structure | 7 | 1.Horizontal strata slope; 2. Over-dip slope; 3. Under-dip slope; 4. Dip-oblique slope; 5. Transverse slope; 6. Anticlinal oblique slope; 7. Anticlinal slope; |
| TRI | 6 | 1. 1.0~1.1; 2. 1.1~1.3; 3. 1.3~1.5; 4. 1.50~2.0; 6. >2; |
| SPI | 7 | 1. 0~1; 2. 1~2; 3. 2~3; 4. 3~4; 5. 4~5; 6. 5~6; 7. >6; |
| TWI | 5 | 1. 1.88~4.73; 2. 4.73~5.94; 3. 5.94~7.36; 4. 7.36~9.36; 5. 9.36~20.03; |
| NDVI | 7 | 1. <0.10; 2. 0.10–0.20; 3. 0.20–0.30; 4. 0.30–0.40; 5. 0.40–0.50; 6. 0.50–0.60; 7. >0.60 |
| Distance from rivers (m) | 6 | 1. <100; 2. 100~300; 3. 300~500; 4. 500~1000; 5. 1000~2000; 6. >2000; |
| Land cover | 9 | 1.cropland; 2. Forest; 3. Grassland; 4. Shrub-land; 5. Wetland; 6. Water; 7. Tundra; 8. Impervious surface; 9. Bare land |
| Distance from roads (m) | 6 | 1. <150; 2. 150~300; 3. 300~450; 4. 450~600; 5. 600~1000; 6. >1000; |
| Distance from lineaments (m) | 6 | 1. <1000; 2. 1000~2000; 3. 2000~3000; 4. 3000~4000; 5. 4000~5000; 6. >5000; |
Table 3.
General characteristics of the mapping units.
| Mapping Unit | Numbers | Average Size (m2) | Minimum Size (m2) | Maximum Size (m2) | Number of Landslide Units | Percentage of Landslide Units % |
|---|---|---|---|---|---|---|
| Slope Unit | 6735 | 215,764 | 5610 | 1,514,390 | 231 | 3.43 |
| Grid cell Unit | 1,426,231 | 900 | 900 | 900 | 39, 190 | 2.75 |
Table 4.
Multicollinearity analysis and factor contribution analysis result for each landslide conditioning factor in raster and SU form.
Table 4.
Multicollinearity analysis and factor contribution analysis result for each landslide conditioning factor in raster and SU form.
| Conditioning Factors | Raster Unit | Slope Unit | |||||
|---|---|---|---|---|---|---|---|
| VIF | Tolerance | IGR | VIF | Tolerance | IGR | ||
| 1 | Altitude | 1.334 | 0.750 | 0.023 | 1.254 | 0.798 | 0.025 |
| 2 | TRI | 2.732 | 0.366 | 0.019 | 3.057 | 0.327 | 0.019 |
| 3 | Land cover | 1.265 | 0.790 | 0.019 | 1.126 | 0.888 | 0.043 |
| 4 | NDVI | 1.233 | 0.818 | 0.015 | 1.164 | 0.859 | 0.018 |
| 5 | Distance from rivers | 1.052 | 0.950 | 0.014 | 1.061 | 0.942 | 0.038 |
| 6 | TWI | 1.180 | 0.847 | 0.012 | / | / | / |
| 7 | Distance from roads | 1.214 | 0.824 | 0.012 | 1.161 | 0.861 | 0.019 |
| 8 | Slope | 2.941 | 0.340 | 0.012 | 2.211 | 0.452 | 0.022 |
| 9 | Lithology | 1.172 | 0.853 | 0.011 | 1.231 | 0.812 | 0.015 |
| 10 | SPI | 1.261 | 0.793 | 0.011 | / | / | / |
| 11 | Distance from lineaments | 1.095 | 0.913 | 0.010 | 1.064 | 0.939 | 0.014 |
| 12 | Plan curvature | 1.627 | 0.615 | 0.010 | 1.025 | 0.975 | 0.014 |
| 13 | Bedding Structure | 1.120 | 0.893 | 0.010 | 1.044 | 0.958 | 0.016 |
| 14 | Profile curvature | 1.515 | 0.660 | 0.010 | 1.220 | 0.819 | 0.016 |
| 15 | Aspect | 1.059 | 0.945 | 0.009 | 1.058 | 0.945 | 0.013 |
Table 5.
Evaluation metrics on the performance of different models.
| Model Stage | AUC | ACC | Precision | TPR | TNR | MCC | RMSE | MAE | |
|---|---|---|---|---|---|---|---|---|---|
| Training | RF (Raster) | 0.927 | 0.867 | 0.826 | 0.929 | 0.805 | 0.740 | 0.359 | 0.133 |
| LR (Raster) | 0.846 | 0.771 | 0.762 | 0.787 | 0.756 | 0.543 | 0.478 | 0.229 | |
| LR (SU) | 0.882 | 0.793 | 0.786 | 0.797 | 0.779 | 0.577 | 0.457 | 0.207 | |
| Testing | RF (Raster) | 0.915 | 0.856 | 0.817 | 0.919 | 0.793 | 0.718 | 0.374 | 0.144 |
| LR (Raster) | 0.839 | 0.766 | 0.759 | 0.781 | 0.751 | 0.532 | 0.484 | 0.234 | |
| LR (SU) | 0.879 | 0.798 | 0.809 | 0.784 | 0.813 | 0.597 | 0.465 | 0.214 | |
Table 6.
Accuracy statistics of the generated LSMs.
| Susceptibility Level | Numbers of Landslides | Units in Landslide (A) | Units in Domain (B) | Proportion of Landslide in Total Landslide (C) | Proportion of Domain in Total Domain (D) | Proportion of Landslide in Domain (A/B) | |
|---|---|---|---|---|---|---|---|
| RF (Raster) | Low | 5 | 379 | 663,979 | 0.97% | 46.56% | 0.05% |
| Moderate | 20 | 1568 | 374,940 | 4.00% | 26.29% | 0.37% | |
| High | 76 | 13,140 | 276,480 | 33.53% | 19.39% | 4.24% | |
| Very high | 164 | 24,103 | 110,832 | 61.50% | 7.75% | 19.39% | |
| LR (Raster) | Low | 16 | 1627 | 584,948 | 4.15% | 41.01% | 0.28% |
| Moderate | 32 | 5412 | 415,503 | 13.81% | 29.13% | 1.30% | |
| High | 85 | 13,054 | 283,220 | 33.31% | 19.86% | 4.61% | |
| Very high | 132 | 19,097 | 142,560 | 48.73% | 10.00% | 13.40% | |
| LR (SU) | Low | 8 | 8 | 2670 | 3.46% | 39.64% | 0.30% |
| Moderate | 43 | 38 | 2036 | 16.45% | 30.23% | 1.87% | |
| High | 86 | 82 | 1357 | 35.50% | 20.15% | 6.04% | |
| Very high | 128 | 103 | 672 | 44.59% | 9.98% | 15.32% | |
Table 7.
Susceptibility level of the recent landslide from 2016 to 2020.
| Low | Moderate | High | Very High | |
|---|---|---|---|---|
| RF | 1 | 3 | 6 | 4 |
| LR (SU) | 1 | 3 | 4 | 6 |
Publisher’s Note: MDPI stays neutral with regard to jurisdictional claims in published maps and institutional affiliations. |
© 2021 by the authors. Licensee MDPI, Basel, Switzerland. This article is an open access article distributed under the terms and conditions of the Creative Commons Attribution (CC BY) license (https://creativecommons.org/licenses/by/4.0/).
Share and Cite
MDPI and ACS Style
Liu, S.; Yin, K.; Zhou, C.; Gui, L.; Liang, X.; Lin, W.; Zhao, B. Susceptibility Assessment for Landslide Initiated along Power Transmission Lines. Remote Sens. 2021, 13, 5068. https://0-doi-org.brum.beds.ac.uk/10.3390/rs13245068
AMA Style
Liu S, Yin K, Zhou C, Gui L, Liang X, Lin W, Zhao B. Susceptibility Assessment for Landslide Initiated along Power Transmission Lines. Remote Sensing. 2021; 13(24):5068. https://0-doi-org.brum.beds.ac.uk/10.3390/rs13245068
Chicago/Turabian StyleLiu, Shuhao, Kunlong Yin, Chao Zhou, Lei Gui, Xin Liang, Wei Lin, and Binbin Zhao. 2021. "Susceptibility Assessment for Landslide Initiated along Power Transmission Lines" Remote Sensing 13, no. 24: 5068. https://0-doi-org.brum.beds.ac.uk/10.3390/rs13245068
Note that from the first issue of 2016, this journal uses article numbers instead of page numbers. See further details here.